International Journal of Sciences and Techniques of Automatic control & computer engineering IJ-STA, Volume 5, N° 2, December 2011, pp. 1602−1613. This paper was recommended for publication in revised form by the editor Staff. Edition: CPU of Tunis, Tunisia, ISSN: 1737-7749 Bond Graph Diagnosis of Lead Acid Battery for Solar Energy System Applications Badoud Abd Essalam 1 and Khemliche Mabrouk 1 1 Automatic laboratory of Setif, Electrical engineering department University of Setif 1, Mabouda city, Algeria {badoudabde, mabroukkhemliche}@yahoo.fr Abstract. The work treated in this paper is the modeling, simulation, fault de- tection and isolation study of the physical accumulator operation integrated in a photovoltaic system. We propose the bond graph approach by taking account of the behavior modeling complexity of the storage system. The model devel- oped enabled us to characterize the batteries operation. It also made it possible to make contours of the buffer storage system energy management problems and to release from the results on the physical behavior storage system. In ad- dition, the interest of this modeling is to highlight the aspect of the optimal management various energy conversions from physic-chemical process. This paper describes the application of the FDI approach; we demonstrate the FDI effectiveness with real data collected from our automotive test. We introduce the problem analysis involved in the faults localization in this process. We pro- pose a method of fault detection applied to the diagnosis and to determine the gravity of a detected fault. Keywords. Bond Graph, Diagnosis, Lead Acid Battery, Photovoltaic System, Modeling 1. Introduction Since the generalization of the electricity utilization, the energizing consumption didn't stop increasing; it tripled of years 60 to our days. Currently, the main sources of energy come from the fossil fuels (coal, oil, natural gas) and since years 50 of the nuclear. Since the successive crises of the oil of years 70, the problem of the conver- sion and the storage of the energy drove to research and the development of new sources of provision. The use of renewable energy systems as an alternative way to produce electricity has been increasing during the past years. The need of a cleaner, more efficient and cheaper method for generating electric power is helping this growth.
Transcript
International Journal of Sciences and Techniques of Automatic control & computer engineering IJ-STA, Volume 5, N° 2, December 2011, pp. 1602−1613.
This paper was recommended for publication in revised form by the editor Staff. Edition: CPU of Tunis, Tunisia, ISSN: 1737-7749
Bond Graph Diagnosis of Lead Acid Battery for Solar Energy System
Applications
Badoud Abd Essalam1 and Khemliche Mabrouk1
1 Automatic laboratory of Setif, Electrical engineering department University of Setif 1, Mabouda city, Algeria
{badoudabde, mabroukkhemliche}@yahoo.fr
Abstract. The work treated in this paper is the modeling, simulation, fault de-tection and isolation study of the physical accumulator operation integrated in a photovoltaic system. We propose the bond graph approach by taking account of the behavior modeling complexity of the storage system. The model devel-oped enabled us to characterize the batteries operation. It also made it possible to make contours of the buffer storage system energy management problems and to release from the results on the physical behavior storage system. In ad-dition, the interest of this modeling is to highlight the aspect of the optimal management various energy conversions from physic-chemical process. This paper describes the application of the FDI approach; we demonstrate the FDI effectiveness with real data collected from our automotive test. We introduce the problem analysis involved in the faults localization in this process. We pro-pose a method of fault detection applied to the diagnosis and to determine the gravity of a detected fault.
Keywords. Bond Graph, Diagnosis, Lead Acid Battery, Photovoltaic System, Modeling
1. Introduction
Since the generalization of the electricity utilization, the energizing consumption didn't stop increasing; it tripled of years 60 to our days. Currently, the main sources of energy come from the fossil fuels (coal, oil, natural gas) and since years 50 of the nuclear. Since the successive crises of the oil of years 70, the problem of the conver-sion and the storage of the energy drove to research and the development of new sources of provision. The use of renewable energy systems as an alternative way to produce electricity has been increasing during the past years. The need of a cleaner, more efficient and cheaper method for generating electric power is helping this growth.
Bond Graph Diagnosis of Lead Acid Battery ... − B. ABD ESSALAM et al. 1603
As photovoltaic (PV) solar cells become more important in energy generation, much research and development is focused on extracting the maximum amount of power. The electrical power generated by PV is not uniform over the full operating range. There is an optimum operation point called the maximum power point (MPP) that yields maximum power generation [1]. PV electrical characteristics vary with tem-perature and light intensity, which changes the MPP. In the actuality a lot of research work has been conducted to improve the use of the sun’s energy. The generation of electricity using photovoltaic solar cells has been one of the most researched and studied. The downside to the use of photovoltaic systems for the production of electricity is that photovoltaic panels can only generate power at certain times of the day. A storage element is required in all solar energy systems that are not connected to the grid to bridge the mismatch between the available energy (during daylight hours) and the requirement for energy (during the night time hours) [2], [3]. The most common form of energy storage for stand-alone photovoltaic systems is battery technology. Current-ly the most commonly used storage technology for photovoltaic applications is the lead acid battery [4]. The advantages of the lead acid battery are its low cost and great availability.
2. Bond graph approach
The bond graph approach [5], [6], [7], [8] is a modeling technique to represent in a more completely way the phenomena appearing in a system, and is perfectly included as a model of knowledge, at the time of a simulation. It is essentially based on the characterization of the phenomena of power exchanges within the system, where this power is expressed by the product of two complementary generic variables: the effort (e) and flow (f), they are explicitly represented on a bond describing the interaction between the subsystems by indicating the supposed direction of the power exchange. This modeling approach generally proceeds by a downward step functionally consist-ing in breaking up the system into increasingly simple subsystems up to the most ele-mentary level constitute by generic basic components connected by junction structures which check the Kirchoff’s law [9]. These components present the phenomenological aspects in the system: supply, storage, dissipation and transfer or conversion energy. Some components gather the information circulated in the system and others are re-cently introduced in order to be able to represent the switching systems. Many electrical equivalent circuits of battery are found in literature [10], [11]. Batte-ries are presented with overview of some much utilized circuits to model the steady and transient behavior. The Thevenin’s circuit is one of the most basic circuits used to study the transient behavior of battery. The electrochemical accumulators also exploit a reaction of oxydo-reduction. Howev-er chemical energy does not come from a fuel taken on an external tank, but is stored with the center even of the component. There is thus a transformation of the internal matter to the accumulator and it is necessary to represent in the model these finished tanks of reagents by elements C whose levels of filling, functions of the loads cycles
1604 IJ-STA, Volume 5, N°2, December, 2011.
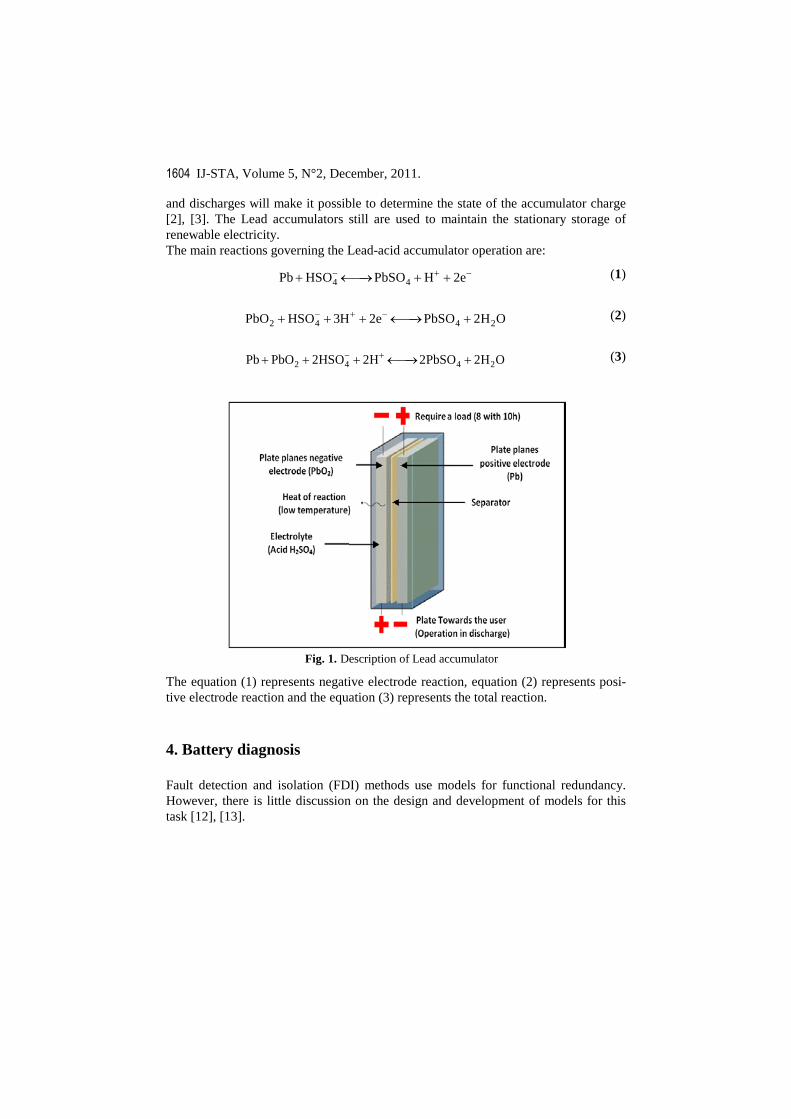
and discharges will make it possible to determine the state of the accumulator charge [2], [3]. The Lead accumulators still are used to maintain the stationary storage of renewable electricity. The main reactions governing the Lead-acid accumulator operation are:
4 4Pb HSO PbSO H 2e− + −+ ←→ + + (1)
2 4 4 2PbO HSO 3H 2e PbSO 2H O− + −+ + + ←→ + (2)
2 4 4 2Pb PbO 2HSO 2H 2PbSO 2H O− ++ + + ←→ + (3)
Fig. 1. Description of Lead accumulator
The equation (1) represents negative electrode reaction, equation (2) represents posi-tive electrode reaction and the equation (3) represents the total reaction.
4. Battery diagnosis
Fault detection and isolation (FDI) methods use models for functional redundancy. However, there is little discussion on the design and development of models for this task [12], [13].
Bond Graph Diagnosis of Lead Acid Battery ... − B. ABD ESSALAM et al. 1605
Fig. 2. Bond Graph model with optimal sensor placement
This paper discusses issues involved in designing models for qualitative FDI of physi-cal systems that span multiple (e.g., thermal, hydraulic, and mechanical) domains. Qualitative FDI methods do not require precise numerical models. They are less pre-cise than quantitative methods, but more robust to noise (including model deficien-cies) and they may provide computational advantages [14], [15]. The bond graph model with optimal sensor placement is given by figure (2).
5. Temperature sensitivity on the batteries state
The load mode (or discharge) is used to express the relationship between the rated capacity of a battery and the charging current (or discharge). Figures (3) and (4) represent the state of load according to the capacity, either in load and or in discharge. In the loading case, the temperature and the discharge state follow the same evolution. On the other hand in the case of the discharge, the temperature while decreasing is accompanied by a discharge state which increases. These states can lead within the framework of the batteries maintenance, with best followed by their state for the studied site and a better optimization.
1606 IJ-STA, Volume 5, N°2, December, 2011.
Fig. 3. Temperature sensitivity on the load batteries
Fig. 4. Temperature sensitivity on the batteries discharge
Bond Graph Diagnosis of Lead Acid Battery ... − B. ABD ESSALAM et al. 1607
6. Influence time:
To study the influence of time, one seeks to approach with a close management in real time, state of the battery load, which in its turn is determining for the effective exploi-tation of the storage system.
Fig. 5. Influence time on the state of the battery
In the loading case, plus the duration of time increases, the batteries load state is be-low 1. In the case of the discharge, plus the time duration is significant. It is noted that the state of discharge reaches its maximum value for a long duration discharge.
7. Faults signatures table
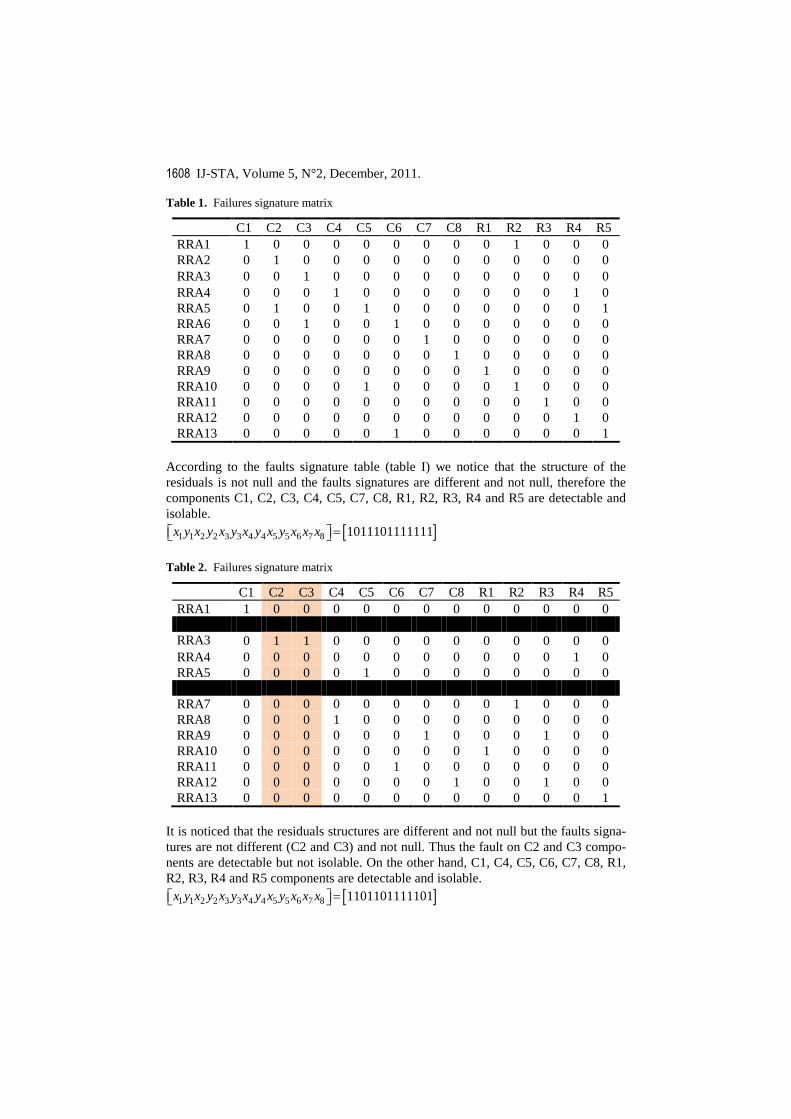
The failure signature is the whole of the redundancy relations such as the failure influ-ences these relations. Information of sensitivities and robustness desired for the resi-duals is indexed in a binary table, called the faults signatures table. This one is built in the following way: when the ith residual must be sensitive to the jth breakdown, then the binary value 1 is assigned to the line and the corresponding column [13].
[ ]1 1 2 2 3 3 4 4 5 5 6 7 8 1111111111111x y x y x y x y x y x x x =
According to the faults signature table (table I) we notice that the structure of the residuals is not null and the faults signatures are different and not null, therefore the components C1, C2, C3, C4, C5, C7, C8, R1, R2, R3, R4 and R5 are detectable and isolable.
[ ]1 1 2 2 3 3 4 4 5 5 6 7 8 1011101111111x y x y x y x y x y x x x =
It is noticed that the residuals structures are different and not null but the faults signa-tures are not different (C2 and C3) and not null. Thus the fault on C2 and C3 compo-nents are detectable but not isolable. On the other hand, C1, C4, C5, C6, C7, C8, R1, R2, R3, R4 and R5 components are detectable and isolable.
[ ]1 1 2 2 3 3 4 4 5 5 6 7 8 1101101111101x y x y x y x y x y x x x =
Bond Graph Diagnosis of Lead Acid Battery ... − B. ABD ESSALAM et al. 1609
According to the failures signature table (table III) we notice now that the residuals structures are different and the faults signatures are different and not null. Thus all C1, C2, C3, C4, C5, C6, C7, C8, R1, R2, R3, R4 and R5 components are detectable and isolable.
For the faults detection of our system we use the precedent Analytical Redundancy Relations (ARRs). We create the faults on monitoring components with this software fault here is considered in the total absence or the deviation of the nominal value giv-en out by the component to monitor.
1610 IJ-STA, Volume 5, N°2, December, 2011.
Fig. 6. Sensitivity of detector De1
The numeric values of components are not considered, only their presence or absences in the relation are taken in account with evaluation term the operators (+, -). It is the qualitative approach for Bond Graph monitoring. In the first time, we create a fault between the instant t= 4.6 s and t= 6 s. The failure on C1 is characterized by the presence of the detector Df1 in the analytical redundancy relation ARR5. We note that the residual ARR5 is sensitive to the failures which affect C1, but residuals ARR1, ARR2, ARR3, ARR4, ARR6, ARR7, ARR8, ARR9 and ARR10 are equals to zero.
Bond Graph Diagnosis of Lead Acid Battery ... − B. ABD ESSALAM et al. 1611
7.2. Sensitivity of detector Df1
Fig. 7. Sensitivity of detector Df1
By the same procedure we can monitored the component R4. The generated ARRs reaction is very fast see Fig. 12. The deviation of the relations ARR1, ARR3, ARR5, ARR6, ARR7, ARR8, ARR9 and ARR10 in this time is normal (constant value). We see that residuals ARR2 and ARR4 are sensitive.
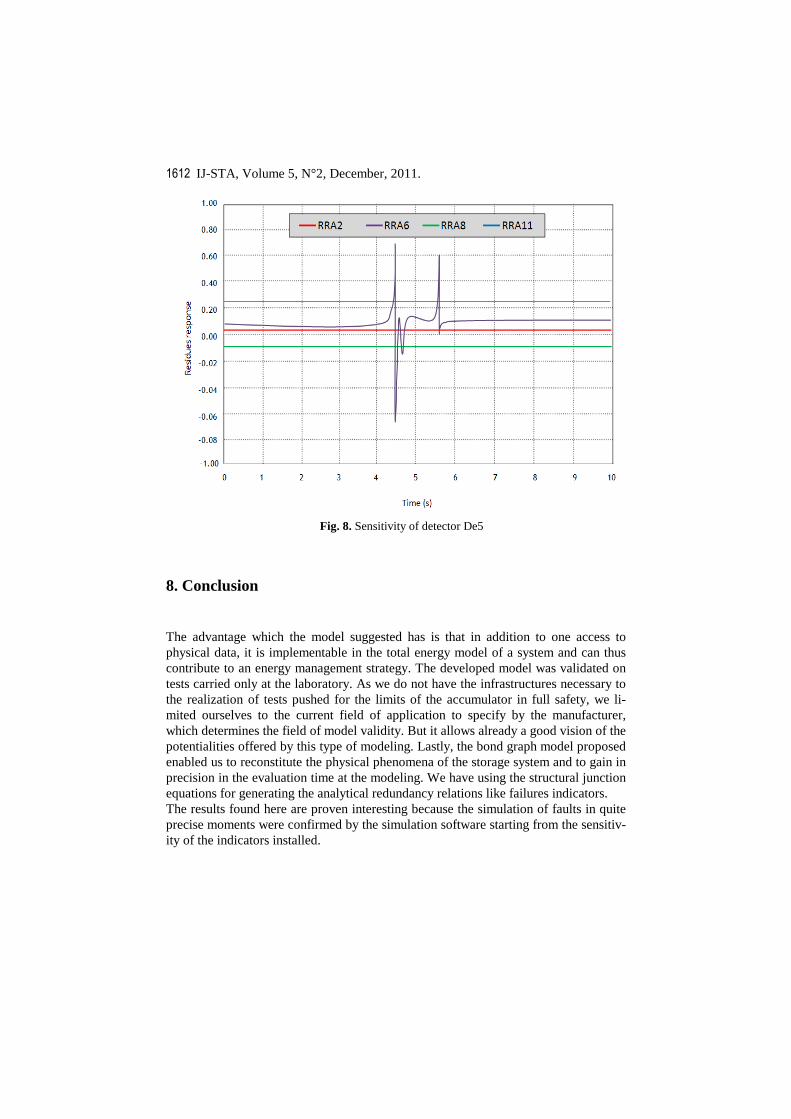
7.3. Sensitivity of detector De5
The figure (8) shows the response of the residues. It is noted that residue ARR6 present a short change compared to its initial state between the moments t1=4.5s and t2=5.5s but turns over in their initial state from t=5.5s and other residues ARR1, ARR2, ARR3, ARR4, ARR5, ARR7, ARR8, ARR9 and ARR10 remain invariant (constants). If we refers to the signature of the C5 component given to table III we notes that this result is in conformity with what is envisaged; i.e. that in the event of failure of the C5 component only the residue ARR6 will be sensitive.
1612 IJ-STA, Volume 5, N°2, December, 2011.
Fig. 8. Sensitivity of detector De5
8. Conclusion
The advantage which the model suggested has is that in addition to one access to physical data, it is implementable in the total energy model of a system and can thus contribute to an energy management strategy. The developed model was validated on tests carried only at the laboratory. As we do not have the infrastructures necessary to the realization of tests pushed for the limits of the accumulator in full safety, we li-mited ourselves to the current field of application to specify by the manufacturer, which determines the field of model validity. But it allows already a good vision of the potentialities offered by this type of modeling. Lastly, the bond graph model proposed enabled us to reconstitute the physical phenomena of the storage system and to gain in precision in the evaluation time at the modeling. We have using the structural junction equations for generating the analytical redundancy relations like failures indicators. The results found here are proven interesting because the simulation of faults in quite precise moments were confirmed by the simulation software starting from the sensitiv-ity of the indicators installed.
Bond Graph Diagnosis of Lead Acid Battery ... − B. ABD ESSALAM et al. 1613
References
1. S. R. Wenham, M. A. Green, M. E. Watt, and R. Corkish, Applied Photovoltaics. London: Earthscan, 2008.
2. M. Chen, G. A. Rincon-Mora, “Accurate electrical battery model capable of predicting Runtime and I-V performance, IEEE Trans. On energy conversion, vol. 21, no. 2, June 2006.
3. J.M. Fandos, Analysis of energy storage in integrated renewable energy systems, Final project university of Zaragoza (2004).
4. Stephan Buller, Marc Thele, Eckhard Karden, Rik W. De Doncker, "Impedance-based non-linear dynamic battery modeling for automotive applications", Journal of Power Sources, vol. 113, pp.422-430, 2003.
5. D. C. Karnopp and R. C. Rosenberg, introduction to physical system dynamics, McGraw-Hill, Londres, New York.1983.
6. D. C. Karnopp and R. C. Rosenberg., system dynamics. A unified approch, Wiley,New York,1990.
7. J. Zaytoon, systèmes dynamiques hybrides, Hermess, NJ: 2001, p. 378.
8. G. D-Tanguy, les bond graphs, Hermess, NJ: 2000, p. 377.
9. C. Bidard, “Diplaying Kirchoff’s invariants in simple junction structures”, Proceedings 13th IMACS World Congress, Bond Graphs for engineers, Vol. 3, pp 1064-1068,Dublin 1991
10. Z.M. Salameh; M.A. Casacca & W.A. Lynch (1992). A mathematical model for lead-acid batteries, IEEE Trans. Energy Convers., vol. 7, no. 1, pp. 93–98, Mar. 1992.
11. M. Chen; A. Gabriel; Rincon-Mora. (2006). Accurate Electrical Battery Model Capable of Predicting Runtime and I–V Performance. IEEE Trans. Energy Convers, Vol. 21, No.2, pp.504-511 June 2006.
12. Chang Boon Low Danwei Wang Arogeti, S. Ming Luo, Quantitative Hybrid Bond Graph-Based Fault Detection and Isolation, IEEE Transactions on Automation Science and Engi-neering, Vol. 7, n. 3, pp. 558– 569, 2010.
13. M. Khemliche, B. Ould Bouamama and H. Haffaf. Sensors placement for diagnosability on Bond Graph model, Sensors and actuators journal, vol. 4, March 2006, pp. 92-98.
14. Chang Boon Low; Danwei Wang; Arogeti, S.; Jing Bing Zhang; Causality Assignment and Model Approximation for Hybrid Bond Graph: Fault Diagnosis Perspectives, IEEE Trans-actions on Automation Science and Engineering, Vol. 7, n. 3, 2010, pp. 570 – 580.
15. Arun K. Samantaray, Belkacem Ould Bouamama, Model-based Process Supervision, A Bond Graph Approach, Spring, 2009.