212
Annual Report and Accounts 2007
beyond petroleum®
www.bp.com
Annual Reportand Accounts2007
BP A
nnual Report and A
ccounts 2007
C13862_BP_Report_Cover_Icon.indd BC2C13862_BP_Report_Cover_Icon.indd BC2 15/2/08 09:20:3015/2/08 09:20:30

Reports and publications
BP’s reports and publications are available to view online or download from www.bp.com/annualreview.
You can order a copy of BP’s printed publications or the CD, free of charge, from:
US and CanadaBP Shareholder ServicesToll-free: +1 800 638 5672Fax: +1 630 821 [email protected]
UK and Rest of WorldBP Distribution ServicesTel: +44 (0)870 241 3269Fax: +44 (0)870 240 [email protected]
Our key prioritiesSafetyPeoplePerformance
Annual Review 2007
Our key prioritiesSafetyPeoplePerformance
Sustainability Review 2007
Sustainability Report 2007
AcknowledgementsDesign VSA Partners, ChicagoTypesetting Bowne, LondonPrinting St Ives Westerham Press, UKPhotography Richard Davies, Simon Kreitem
Paper This Annual Report and Accounts is printed on Revive 100 Silk paper, which is manufactured from 100% de-inked post-consumer waste at a mill with ISO 14001 certifi cation.
© BP p.l.c. 2008
Annual Review highlightsListen to Highlights from BP Annual Review 2007 on CD or in MP3 format.www.bp.com/annualreview
Annual Review Read a summary of our financialand operating performance in BP Annual Review 2007 online or in print.www.bp.com/annualreview
Sustainability Report View details of our environmental and social performance in BP Sustainability Report 2007 online from May 2008. www.bp.com/sustainability
Sustainability ReviewRead the summary BP Sustainability Review 2007 in print from May 2008.www.bp.com/sustainability
Our key priorities SafetyPeoplePerformance
Highlights from Annual Review 2007
C13862_BP_Report_Cover_Icon.indd BC3C13862_BP_Report_Cover_Icon.indd BC3 15/2/08 16:47:1415/2/08 16:47:14

Filename: U54368_doc1.3d Time: 14:49:32 Date: 25/02/08
Checksum: -1686578214
Information about this report
This document constitutes the Annual Report and Accounts of BP p.l.c.
for the year ended 31 December 2007 in accordance with UK
requirements and is dated 22 February 2008. This document also
contains information that will be included in the company’s Annual
Report on Form 20-F in accordance with the requirements of the US
Securities and Exchange Commission (SEC). Such information will be
supplemented and may be updated at the time of filing that document
with the SEC, or later amended, if necessary.
On pages 2-6, references within BP Annual Report and Accounts 2007
to ‘profits’, ‘results’ and ‘return on average capital employed’ are to those
measures on a replacement cost basis unless otherwise indicated.
Reconciliation of profit for the year to replacement cost profit
For the year ended 31 December $ million--------------------------------------------------------------------------------------------------------------------------------------------------------------------------------------------------------------------------------------------------------------------------------------------------------
2007 2006 2005--------------------------------------------------------------------------------------------------------------------------------------------------------------------------------------------------------------------------------------------------------------------------------------------------------
Profit before interest and taxation from continuing operations 32,352 35,158 32,682
Finance costs and other finance income/expense (741) (516) (761)
Taxation (10,442) (12,331) (9,473)
Minority interest (324) (286) (291)--------------------------------------------------------------------------------------------------------------------------------------------------------------------------------------------------------------------------------------------------------------------------------------------------------
Profit for the year from continuing operations attributable to BP shareholders 20,845 22,025 22,157
Profit (loss) for the year from Innovene operations – (25) 184
Inventory holding (gains) losses (3,558) 253 (3,027)--------------------------------------------------------------------------------------------------------------------------------------------------------------------------------------------------------------------------------------------------------------------------------------------------------
Replacement cost profita 17,287 22,253 19,314
Replacement cost profit from continuing operations attributable to BP shareholders 17,287 22,278 19,513
Replacement cost profit (loss) from Innovene operations – (25) (199)--------------------------------------------------------------------------------------------------------------------------------------------------------------------------------------------------------------------------------------------------------------------------------------------------------
Replacement cost profit 17,287 22,253 19,314
Exploration and Production 26,927 29,647 25,485
Refining and Marketing 2,617 5,283 4,394
Gas, Power and Renewables 558 1,376 1,077
Other businesses and corporate (1,104) (947) (1,237)
Consolidation adjustmentsUnrealized profit in inventory (204) 52 (208)
Net profit on transactions between continuing operations and Innovene operations – – 5--------------------------------------------------------------------------------------------------------------------------------------------------------------------------------------------------------------------------------------------------------------------------------------------------------
Replacement cost profit before interest and taxation 28,794 35,411 30,038
Finance costs and other finance income/expense (741) (516) (761)
Taxation (10,442) (12,331) (9,473)
Minority interest (324) (286) (291)--------------------------------------------------------------------------------------------------------------------------------------------------------------------------------------------------------------------------------------------------------------------------------------------------------
Replacement cost profit from continuing operations attributable to BP shareholders 17,287 22,278 19,513
Per ordinary share – centsProfit for the year attributable to BP shareholders 108.76 109.84 105.74
Replacement cost profit 90.20 111.10 91.41--------------------------------------------------------------------------------------------------------------------------------------------------------------------------------------------------------------------------------------------------------------------------------------------------------
Dividends paid per ordinary share – cents 42.30 38.40 34.85
– pence 20.995 21.104 19.152--------------------------------------------------------------------------------------------------------------------------------------------------------------------------------------------------------------------------------------------------------------------------------------------------------
Dividends paid per American depositary share (ADS) – dollars 2.538 2.304 2.091
a Replacement cost profit reflects the current cost of supplies. The replacement cost profit for the year is determined by excluding from profit inventory holding gains andlosses. BP uses this measure to assist investors to assess BP’s performance from period to period.
The Annual Report and Accounts for the year ended 31 December 2007
contains the Directors’ Report, including the Business Review, on pages
4-62, 82-92 and 94 and 186. The Directors’ Remuneration Report is on
pages 63-73. The consolidated financial statements are on pages 93-171.
The report of the auditor is on page 95 for the group and page 187 for
the company.
BP p.l.c. is the parent company of the BP group of companies. Unless
otherwise stated, the text does not distinguish between the activities
and operations of the parent company and those of its subsidiaries.
The term ‘shareholder’ in the Annual Report and Accounts means,
unless the context otherwise requires, investors in the equity capital of
BP p.l.c., both direct and/or indirect.
BP Annual Report and Accounts 2007 and BP Annual Review 2007
may be downloaded from www.bp.com/annualreport. No material on the
BP website, other than the items identified as BP Annual Report and
Accounts 2007 and BP Annual Review 2007, forms any part of those
documents.
As BP shares, in the form of ADSs, are listed on the New York Stock
Exchange (NYSE), an Annual Report on Form 20-F will be filed with the
SEC in accordance with the US Securities Exchange Act of 1934. When
filed, copies may be obtained, free of charge (see page 90). BP discloses
on its website at www.bp.com/NYSEcorporategovernancerules
significant ways (if any) in which its corporate governance practices differ
from those mandated for US companies under NYSE listing standards.
Cautionary statement
BP Annual Report and Accounts 2007 contains certain forward-looking
statements within the meaning of the US Private Securities Litigation
Reform Act of 1995 with respect to the financial condition, results of
operations and businesses of BP and certain of the plans and objectives
of BP with respect to these items. For further details, please see
Forward-looking statements on page 11.
The registered office of BP p.l.c. is 1 St James’s Square, London
SW1Y 4PD, UK. Tel: +44 (0)20 7496 4000.
Registered in England and Wales No. 102498.
Stock exchange symbol ‘BP’.
27
BP ANNUAL REPORT AND ACCOUNTS 2007 1

Filename: U54368_doc1.3d Time: 14:49:32 Date: 25/02/08
Checksum: 1341058940
Miscellaneous terms
In this document, unless the context otherwise requires,
the following terms shall have the meaning set out below.
ADR American depositary receipt.
ADS American depositary share.
AGM Annual general meeting.
Amoco The former Amoco Corporation and its subsidiaries.
Atlantic Richfield Atlantic Richfield Company and its subsidiaries.
Associate An entity over which the group has significant influence and
that is neither a subsidiary nor joint venture. Significant influence is the
power to participate in the financial and operating policy decisions of an
entity without having control or joint control over those policies.
Baker Panel, or panel BP US Refineries Independent Safety Review
Panel
Barrel 42 US gallons.
b/d barrels per day.
boe barrels of oil equivalent.
BP, BP group or the group BP p.l.c. and its subsidiaries.
Burmah Castrol Burmah Castrol plc and its subsidiaries.
Cent or c One-hundredth of the US dollar.
The company BP p.l.c.
Dollar or $ The US dollar.
EU European Union.
Gas Natural gas.
Hydrocarbons Crude oil and natural gas.
IFRS International Financial Reporting Standards.
Joint venture A contractual arrangement between the group and other
venturers that undertake an economic activity that is subject to joint
control. Joint control exists only where the strategic financial and
operating decisions relating to the activity require the unanimous
consent of the venturers.
Jointly controlled asset A joint venture where the venturers have a
direct ownership interest in, and jointly control, the assets of the venture.
Jointly controlled entity A joint venture that involves the establishment
of a company, partnership or other entity to engage in economic activity
that the group jointly controls with fellow venturers.
Liquids Crude oil, condensate and natural gas liquids.
LNG Liquefied natural gas.
London Stock Exchange or LSE London Stock Exchange plc.
LPG Liquefied petroleum gas.
mb/d thousand barrels per day.
mboe/d thousand barrels of oil equivalent per day.
mmBtu million British thermal units.
mmboe million barrels of oil equivalent.
mmcf million cubic feet.
mmcf/d million cubic feet per day.
MTBE Methyl tertiary butyl ether.
MW Megawatt.
NGLs Natural gas liquids.
OPEC Organization of Petroleum Exporting Countries.
Ordinary shares Ordinary fully paid shares in BP p.l.c. of 25c each.
Pence or p One-hundredth of a pound sterling.
Pound, sterling or £ The pound sterling.
Preference shares Cumulative First Preference Shares and Cumulative
Second Preference Shares in BP p.l.c. of £1 each.
PSA Production-sharing agreement.
SEC The United States Securities and Exchange Commission.
Subsidiary An entity that is controlled by the BP group. Control is the
power to govern the financial and operating policies of an entity so as to
obtain the benefits from its activities.
Tonne 2,204.6 pounds.
UK United Kingdom of Great Britain and Northern Ireland.
US United States of America.
2

Filename: U54368_doc1.3d Time: 14:49:32 Date: 25/02/08
Checksum: 1230020738
Contents
4 Chairman’s letter
5 Group chief executive’s review
6 Measuring our progress
7 Performance review
59 Directors, senior management and employees
63 Directors’ remuneration report
74 BP board performance report
82 Additional information for shareholders
93 Financial statements
BP ANNUAL REPORT AND ACCOUNTS 2007 3
4
Chairman’s letter
Dear Shareholder 2007 was a year of change for BP, as the group responded to the powerful global forces shaping the world economy and took decisive action to rebuild the group’s reputation. For many years, we were recognized as a leader in our industry. The tragic events of Texas City, the incidents in Alaska and the conduct of a small number of our traders showed that we have failed in recent years to live up to our own high standards and comply with the law. We have acknowledged this in the settlements we have reached with the US Department of Justice on these issues. I am determined that we will recover our leadership position. John Browne stood down as group chief executive and as a director on 1 May 2007. The circumstances of John’s resignation do not reflect the huge contribution he made to the group during his 41-year career at BP. His vision helped to transform BP and give it the scope and scale it has today. We are indebted to him and I again wish to thank John on behalf of the board for his great achievements for the company. I am very pleased to welcome Tony Hayward as group chief executive. Tony was chosen unanimously by the board after a thorough internal and external search. He has already set about making his own mark on the group through his dynamic leadership and his desire to reduce complexity. His clear focus has been on safety, people and performance. The significant contribution to the group of other executive and non-executive directors is described on page 59 of this Annual Report and Accounts. We have also reviewed in depth the way we, as a board, work and this is described here on pages 74-80. While change was a feature of 2007, there is evidently work still to do. In particular, during much of the year our operational and financial performance has been below par, as a direct result of a number of our key assets both upstream and downstream not being available when they were needed and when they could have made a significant financial contribution. I am glad to say that our upstream projects are now coming onstream and our downstream assets are returning to service.
While we do now have a strong list of projects coming onstream, the challenge is to ensure that this progress is maintained and strengthened. In doing so, we will continue to work closely with governments and national oil companies to our mutual benefit. The new delineation of the business of the group between upstream, downstream and alternative energy brings a welcome emphasis on the key drivers of the business. I believe, too, that our alternative energy business will provide the focus that we need to have on technology, both for our existing business and for the supply of low-carbon energy in the future. Whatever the importance of short-term challenges, the rise in the oil price and trends in the world economy require the group to make big strategic choices for the medium and long term. This involves identifying the right opportunities in a challenging marketplace for the group to grow in both upstream and downstream. I regard this as a key part of the board’s work. We are maintaining our policy of returning cash to shareholders through dividends and buybacks although we are changing the relative proportion of each. Your board has confidence in greater cash flows from our strong asset base, which has allowed the company to increase both investment in its future growth and the dividend component of our distribution to shareholders. I am therefore pleased to confirm that we have increased the quarterly dividend, to be paid in March, to 13.525 cents per share, compared with 10.325 cents per share last year. For the year, the dividend showed an increase of 16%. In sterling terms, the quarterly dividend is 6.813 pence per share, compared with 5.258 pence per share a year ago; for the year, the increase was 7%. During the year, $7.5 billion of shares were repurchased for cancellation. I am grateful to and wish to thank the executive team, the board and indeed all our employees for everything they have done during an eventful year. On behalf of the board, I would also like to thank our shareholders for their support. We have all learned some tough lessons in recent years and I am confident that investors’ long-term faith in the company will be rewarded.
Peter SutherlandChairman22 February 2008
U54368_doc2.indd 4U54368_doc2.indd 4 25/2/08 14:47:4325/2/08 14:47:43
BP ANNUAL REVIEW 2007 5
Group chief executive’s review
Dear Shareholder It is a great privilege to give my first review as group chief executive of BP. 2007 was a year of major transition, both for the group and for the oil and gas industry as a whole. High and volatile prices are challenging assumptions across the industry. The dated Brent crude oil price set a nominal record of $96.02 per barrel (bbl) at year-end, driven by continued demand growth and OPEC production cuts. Given ample supply, spot natural gas prices in the US and Europe declined, with the Henry Hub First of Month Index averaging $6.86 per million British thermal units in 2007, compared with $7.24 the previous year. Refining margins reached a record quarterly high of $16.66/bbl in the second quarter due to low refinery availability in the US, but fell back to more seasonal levels in the second half.
Safety, people and performance When I took over as group chief executive, the immediate task was to restore the integrity and the efficiency of BP’s operations. I set out three priorities: safety, people and performance. There has been progress in all three areas but there is more to do. Running safe and reliable operations is our greatest responsibility. At the start of 2007, the panel, chaired by former US Secretary of State James A Baker, III, reported on the safety culture across our US refineries, following the tragic accident at Texas City in 2005. We agreed to implement all its recommendations and accepted the challenge to transform BP into a world leader in process safety. All parts of the group are actively working to implement the panel’s recommendations relevant to their business. A new operating management system, designed to bring greater consistency to our operations, is being introduced. We continue to implement cross-group programmes designed to enhance operations leadership competence at all levels of BP. We are redoubling our efforts to make sure we have the right people in the right places. Whether it be in our refineries, exploring in the ultra deepwater of the Gulf of Mexico, pioneering enhanced oil recovery techniques in Alaska or commencing operations at the largest wind facility in the US, we know it is our people who make the difference. When it comes to my third priority, our financial performance is not good enough. Replacement cost profit in 2007 fell 22% to $17,287 million. Dividends payable in respect of 2007 increased by 16% to 45.50 cents per share. In sterling terms the increase was 7%.
Restoring revenues and reducing complexity The unsatisfactory financial performance was primarily a result of two things: missing revenues, principally from delayed projects and poor reliability in some of our US refineries; and excessive complexity in the way we manage the business, which has added to costs. We are resolutely tackling both these issues. The fourth quarter saw the build-up of operational momentum, with the start-up of six new exploration and production projects, including Atlantis and King Subsea Pump in the Gulf of Mexico, Greater Plutonio in Angola, and Mango and Cashima in Trinidad & Tobago.
By the end of 2007, the Whiting refinery had recommenced sour crude processing and available distillation capacity exceeded 300,000 barrels per day (b/d). At Texas City, we successfully recommissioned the three desulphurization and upgrading units necessary to allow restart of the remaining crude distillation capacity. The final sour crude unit is mechanically complete and, by mid-2008, we expect most of the economic capability to have been restored. The Thunder Horse platform in the Gulf of Mexico is on track to start production by the end of 2008. With output now ramping up from these fields and refineries, we anticipate that operational momentum will become financial momentum in the second half of this year and into 2009.
BP’s forward agenda Last October, I outlined a forward agenda, designed to make BP a simpler and more efficient organization, with a focus to improve behaviours throughout the business by embedding a high-performance culture. The group’s long-term future is also being secured. We made significant discoveries in Azerbaijan and Egypt and secured access to major new sources of oil and gas in Oman and Libya and an attractive joint venture to access Canadian oil sands. In 2007, we again replaced more than 100% of our reported reserves. In Russia, our joint venture TNK-BP continued to perform strongly. Through our alternative energy business, we are investing in the low-carbon energy sources of the future. Step by step, we are rebuilding the group’s momentum and strengthening our capability. I have great confidence in the strength of our portfolio and our people; I would like to thank them all for the way they have responded to the challenge. We are all committed both to enhancing world energy security and to meeting the challenge of climate change. Our task now is to put BP back where it belongs – at the forefront of the industry.
Tony HaywardGroup Chief Executive22 February 2008
U54368_doc2.indd 5U54368_doc2.indd 5 25/2/08 14:47:4525/2/08 14:47:45
6
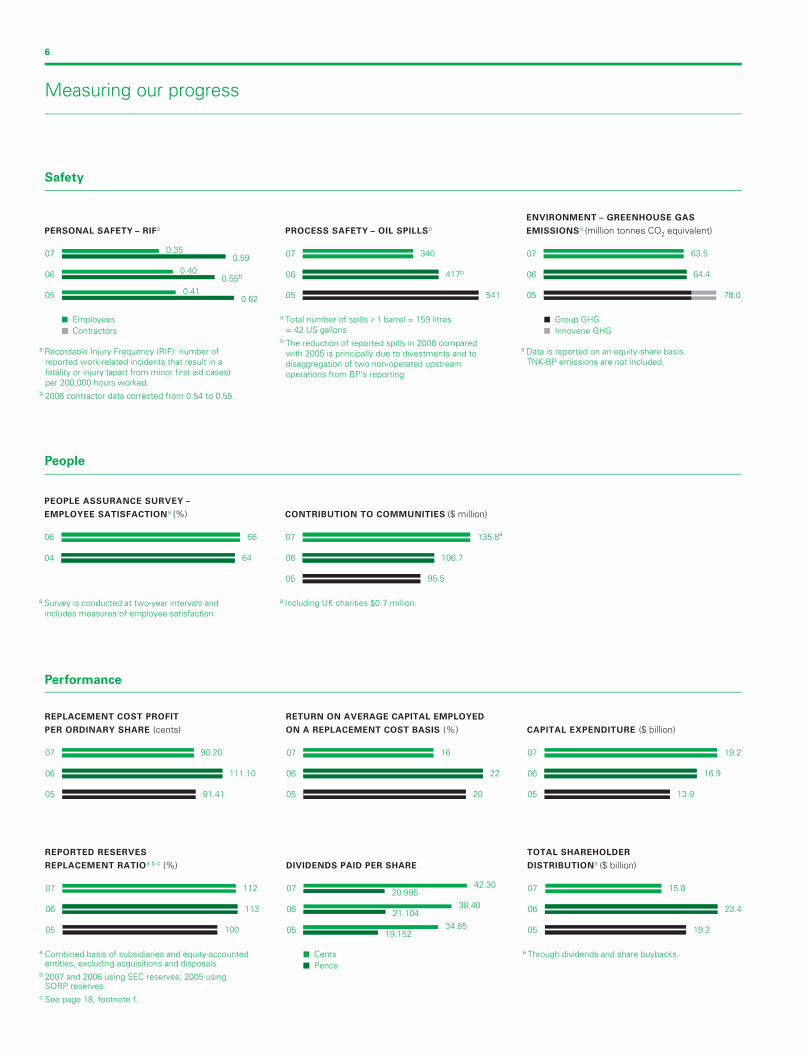
Measuring our progress
Safety
PERSONAL SAFETY – RIFa
07
06
0.350.59
0.400.55b
0.410.6205
Employees
a Recordable Injury Frequency (RIF): number of reported work-related incidents that result in a fatality or injury (apart from minor first aid cases) per 200,000 hours worked.b 2006 contractor data corrected from 0.54 to 0.55.
Contractors
PROCESS SAFETY – OIL SPILLSa
07
06
340
417b
05 541
a Total number of spills >_ 1 barrel = 159 litres = 42 US gallons b The reduction of reported spills in 2006 compared with 2005 is principally due to divestments and to disaggregation of two non-operated upstream operations from BP’s reporting.
ENVIRONMENT – GREENHOUSE GAS
EMISSIONSa (million tonnes CO2 equivalent)
07
06
63.5
64.4
05 78.0
Group GHG
a Data is reported on an equity-share basis. TNK-BP emissions are not included.
Innovene GHG
People
06 66
04 64
PEOPLE ASSURANCE SURVEY –
EMPLOYEE SATISFACTIONa (%)
a Survey is conducted at two-year intervals and includes measures of employee satisfaction.
CONTRIBUTION TO COMMUNITIES ($ million)
07
06
135.8a
106.7
05 95.5
a Including UK charities $0.7 million.
Performance
REPLACEMENT COST PROFIT
PER ORDINARY SHARE (cents)
07
06
90.20
111.10
05 91.41
RETURN ON AVERAGE CAPITAL EMPLOYED
ON A REPLACEMENT COST BASIS (%)
07
06
16
22
05 20
CAPITAL EXPENDITURE ($ billion)
07
06
19.2
16.9
05 13.9
REPORTED RESERVES
REPLACEMENT RATIOa b c (%)
07
06
112
113
05 100
a Combined basis of subsidiaries and equity-accountedentities, excluding acquisitions and disposals.
b 2007 and 2006 using SEC reserves; 2005 using SORP reserves.
c See page 18, footnote f.
DIVIDENDS PAID PER SHARE
07
06
42.3020.995
38.4021.104
34.8519.15205
Cents Pence
TOTAL SHAREHOLDER
DISTRIBUTIONa ($ billion)
07
06
15.8
23.4
05 19.2
a Through dividends and share buybacks.
U54368_doc2.indd 6U54368_doc2.indd 6 25/2/08 14:47:4625/2/08 14:47:46
Filename: U54368_doc3.3d Time: 14:49:34 Date: 25/02/08
Checksum: -515689947
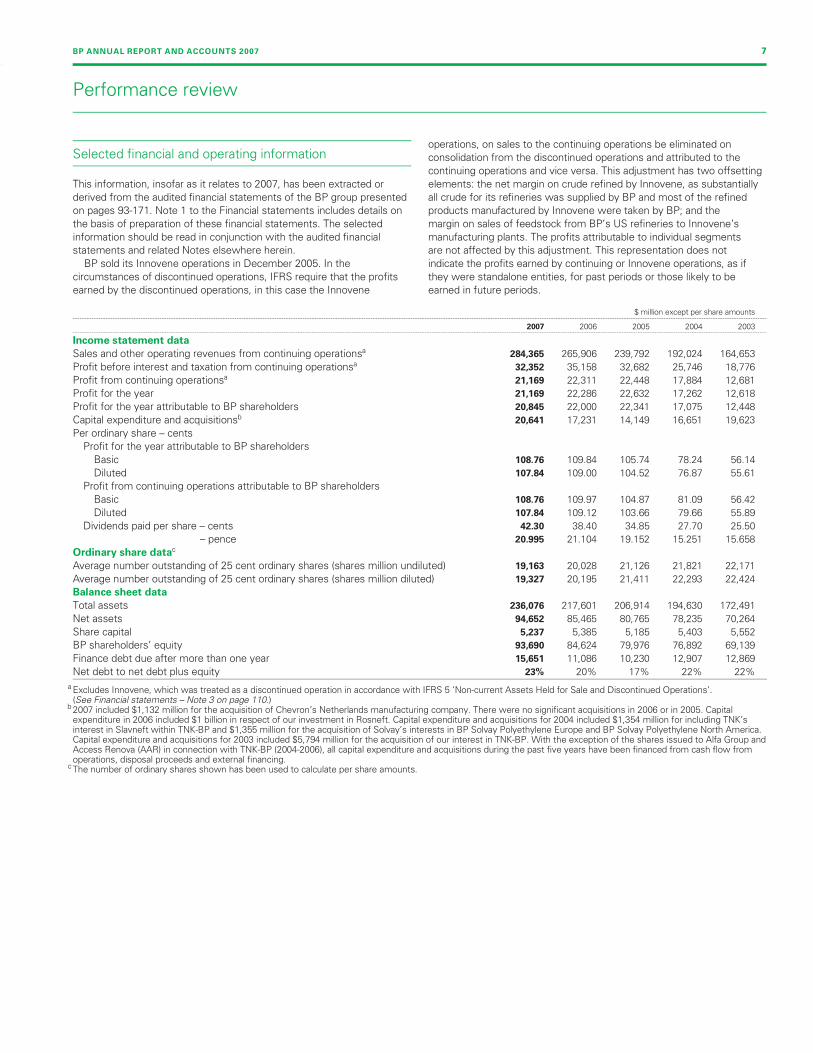
Performance review
Selected financial and operating information
This information, insofar as it relates to 2007, has been extracted or
derived from the audited financial statements of the BP group presented
on pages 93-171. Note 1 to the Financial statements includes details on
the basis of preparation of these financial statements. The selected
information should be read in conjunction with the audited financial
statements and related Notes elsewhere herein.
BP sold its Innovene operations in December 2005. In the
circumstances of discontinued operations, IFRS require that the profits
earned by the discontinued operations, in this case the Innovene
operations, on sales to the continuing operations be eliminated on
consolidation from the discontinued operations and attributed to the
continuing operations and vice versa. This adjustment has two offsetting
elements: the net margin on crude refined by Innovene, as substantially
all crude for its refineries was supplied by BP and most of the refined
products manufactured by Innovene were taken by BP; and the
margin on sales of feedstock from BP’s US refineries to Innovene’s
manufacturing plants. The profits attributable to individual segments
are not affected by this adjustment. This representation does not
indicate the profits earned by continuing or Innovene operations, as if
they were standalone entities, for past periods or those likely to be
earned in future periods.
$ million except per share amounts--------------------------------------------------------------------------------------------------------------------------------------------------------------------------------------------------------------------------------------------------------------------------------------------------------
2007 2006 2005 2004 2003--------------------------------------------------------------------------------------------------------------------------------------------------------------------------------------------------------------------------------------------------------------------------------------------------------
Income statement data
Sales and other operating revenues from continuing operationsa 284,365 265,906 239,792 192,024 164,653
Profit before interest and taxation from continuing operationsa 32,352 35,158 32,682 25,746 18,776
Profit from continuing operationsa 21,169 22,311 22,448 17,884 12,681
Profit for the year 21,169 22,286 22,632 17,262 12,618
Profit for the year attributable to BP shareholders 20,845 22,000 22,341 17,075 12,448
Capital expenditure and acquisitionsb 20,641 17,231 14,149 16,651 19,623
Per ordinary share – cents
Profit for the year attributable to BP shareholders
Basic 108.76 109.84 105.74 78.24 56.14
Diluted 107.84 109.00 104.52 76.87 55.61
Profit from continuing operations attributable to BP shareholders
Basic 108.76 109.97 104.87 81.09 56.42
Diluted 107.84 109.12 103.66 79.66 55.89
Dividends paid per share – cents 42.30 38.40 34.85 27.70 25.50
– pence 20.995 21.104 19.152 15.251 15.658
Ordinary share datac
Average number outstanding of 25 cent ordinary shares (shares million undiluted) 19,163 20,028 21,126 21,821 22,171
Average number outstanding of 25 cent ordinary shares (shares million diluted) 19,327 20,195 21,411 22,293 22,424
Balance sheet data
Total assets 236,076 217,601 206,914 194,630 172,491
Net assets 94,652 85,465 80,765 78,235 70,264
Share capital 5,237 5,385 5,185 5,403 5,552
BP shareholders’ equity 93,690 84,624 79,976 76,892 69,139
Finance debt due after more than one year 15,651 11,086 10,230 12,907 12,869
Net debt to net debt plus equity 23% 20% 17% 22% 22%
a Excludes Innovene, which was treated as a discontinued operation in accordance with IFRS 5 ‘Non-current Assets Held for Sale and Discontinued Operations’.(See Financial statements – Note 3 on page 110.)
b 2007 included $1,132 million for the acquisition of Chevron’s Netherlands manufacturing company. There were no significant acquisitions in 2006 or in 2005. Capitalexpenditure in 2006 included $1 billion in respect of our investment in Rosneft. Capital expenditure and acquisitions for 2004 included $1,354 million for including TNK’sinterest in Slavneft within TNK-BP and $1,355 million for the acquisition of Solvay’s interests in BP Solvay Polyethylene Europe and BP Solvay Polyethylene North America.Capital expenditure and acquisitions for 2003 included $5,794 million for the acquisition of our interest in TNK-BP. With the exception of the shares issued to Alfa Group andAccess Renova (AAR) in connection with TNK-BP (2004-2006), all capital expenditure and acquisitions during the past five years have been financed from cash flow fromoperations, disposal proceeds and external financing.
c The number of ordinary shares shown has been used to calculate per share amounts.
BP ANNUAL REPORT AND ACCOUNTS 2007 7

Filename: U54368_doc3.3d Time: 14:49:34 Date: 25/02/08
Checksum: -1971094754
Production and net proved oil and natural gas reserves
The following table shows our production for the past five years and the estimated net proved oil and natural gas reserves at the end of each of
those years.
Production and net proved reservesa--------------------------------------------------------------------------------------------------------------------------------------------------------------------------------------------------------------------------------------------------------------------------------------------------------
2007 2006 2005 2004 2003--------------------------------------------------------------------------------------------------------------------------------------------------------------------------------------------------------------------------------------------------------------------------------------------------------
Crude oil production for subsidiaries (thousand barrels per day) 1,304 1,351 1,423 1,480 1,615
Crude oil production for equity-accounted entities (thousand barrels per day) 1,110 1,124 1,139 1,051 506
Natural gas production for subsidiaries (million cubic feet per day) 7,222 7,412 7,512 7,624 8,092
Natural gas production for equity-accounted entities (million cubic feet per day) 921 1,005 912 879 521
Estimated net proved crude oil reserves for subsidiaries (million barrels)b 5,492 5,893 6,360 6,755 7,214
Estimated net proved crude oil reserves for equity-accounted entities (million barrels)c 4,581 3,888 3,205 3,179 2,867
Estimated net proved natural gas reserves for subsidiaries (billion cubic feet)d 41,130 42,168 44,448 45,650 45,155
Estimated net proved natural gas reserves for equity-accounted entities (billion cubic feet)e 3,770 3,763 3,856 2,857 2,869
a Crude oil includes natural gas liquids (NGLs) and condensate. Production and proved reserves exclude royalties due to others, whether payable in cash or in kind, wherethe royalty owner has a direct interest in the underlying production and the option to make lifting and sales arrangements independently, and include minority interests inconsolidated operations.
b Includes 20 million barrels (23 million barrels at 31 December 2006 and 29 million barrels at 31 December 2005) in respect of the 30% minority interest in BP Trinidad andTobago LLC.
c Includes 210 million barrels (179 million barrels at 31 December 2006 and 95 million barrels at 31 December 2005) in respect of the 6.51% minority interest in TNK-BP(6.29% at 31 December 2006 and 4.47% at 31 December 2005).
d Includes 3,211 billion cubic feet of natural gas (3,537 billion cubic feet at 31 December 2006 and 3,812 billion cubic feet at 31 December 2005) in respect of the 30%minority interest in BP Trinidad and Tobago LLC.
e Includes 68 billion cubic feet (99 billion cubic feet at 31 December 2006 and 57 billion cubic feet at 31 December 2005) in respect of the 5.88% minority interest in TNK-BP(7.77% at 31 December 2006 and 4.47% at 31 December 2005).
During 2007, 414 million barrels of oil and natural gas, on an oil equivalent* basis (mmboe), were added to BP’s proved reserves for subsidiaries
(excluding purchases and sales). After allowing for production, which amounted to 937mmboe, BP’s proved reserves for subsidiaries were
12,583mmboe at 31 December 2007. These proved reserves are mainly located in the US (46%), Rest of Americas (19%), Asia Pacific (10%),
Africa (8%) and the UK (8%).
For equity-accounted entities, 1,168mmboe were added to proved reserves (excluding purchases and sales), production was 470mmboe and
proved reserves were 5,231mmboe at 31 December 2007.
* Natural gas is converted to oil equivalent at 5.8 billion cubic feet (bcf) = 1 million barrels.
8
Filename: U54368_doc3.3d Time: 14:49:34 Date: 25/02/08
Checksum: -1997588587
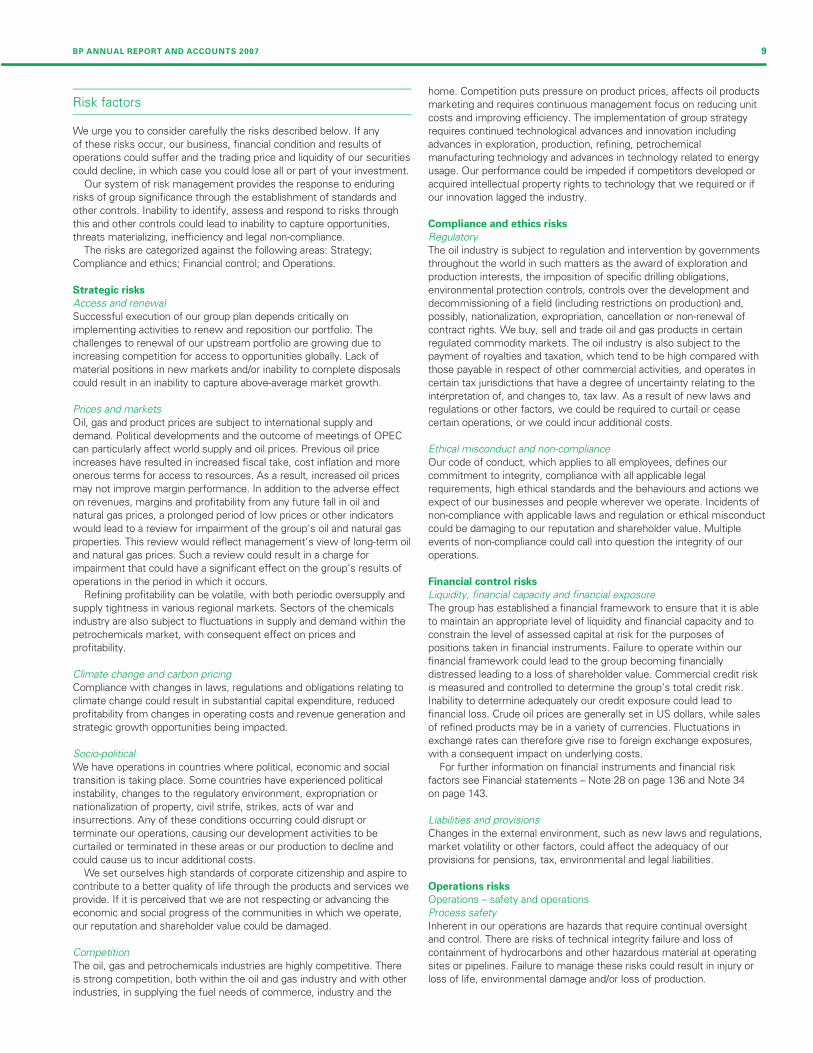
Risk factors
We urge you to consider carefully the risks described below. If any
of these risks occur, our business, financial condition and results of
operations could suffer and the trading price and liquidity of our securities
could decline, in which case you could lose all or part of your investment.
Our system of risk management provides the response to enduring
risks of group significance through the establishment of standards and
other controls. Inability to identify, assess and respond to risks through
this and other controls could lead to inability to capture opportunities,
threats materializing, inefficiency and legal non-compliance.
The risks are categorized against the following areas: Strategy;
Compliance and ethics; Financial control; and Operations.
Strategic risks
Access and renewal
Successful execution of our group plan depends critically on
implementing activities to renew and reposition our portfolio. The
challenges to renewal of our upstream portfolio are growing due to
increasing competition for access to opportunities globally. Lack of
material positions in new markets and/or inability to complete disposals
could result in an inability to capture above-average market growth.
Prices and markets
Oil, gas and product prices are subject to international supply and
demand. Political developments and the outcome of meetings of OPEC
can particularly affect world supply and oil prices. Previous oil price
increases have resulted in increased fiscal take, cost inflation and more
onerous terms for access to resources. As a result, increased oil prices
may not improve margin performance. In addition to the adverse effect
on revenues, margins and profitability from any future fall in oil and
natural gas prices, a prolonged period of low prices or other indicators
would lead to a review for impairment of the group’s oil and natural gas
properties. This review would reflect management’s view of long-term oil
and natural gas prices. Such a review could result in a charge for
impairment that could have a significant effect on the group’s results of
operations in the period in which it occurs.
Refining profitability can be volatile, with both periodic oversupply and
supply tightness in various regional markets. Sectors of the chemicals
industry are also subject to fluctuations in supply and demand within the
petrochemicals market, with consequent effect on prices and
profitability.
Climate change and carbon pricing
Compliance with changes in laws, regulations and obligations relating to
climate change could result in substantial capital expenditure, reduced
profitability from changes in operating costs and revenue generation and
strategic growth opportunities being impacted.
Socio-political
We have operations in countries where political, economic and social
transition is taking place. Some countries have experienced political
instability, changes to the regulatory environment, expropriation or
nationalization of property, civil strife, strikes, acts of war and
insurrections. Any of these conditions occurring could disrupt or
terminate our operations, causing our development activities to be
curtailed or terminated in these areas or our production to decline and
could cause us to incur additional costs.
We set ourselves high standards of corporate citizenship and aspire to
contribute to a better quality of life through the products and services we
provide. If it is perceived that we are not respecting or advancing the
economic and social progress of the communities in which we operate,
our reputation and shareholder value could be damaged.
Competition
The oil, gas and petrochemicals industries are highly competitive. There
is strong competition, both within the oil and gas industry and with other
industries, in supplying the fuel needs of commerce, industry and the
home. Competition puts pressure on product prices, affects oil products
marketing and requires continuous management focus on reducing unit
costs and improving efficiency. The implementation of group strategy
requires continued technological advances and innovation including
advances in exploration, production, refining, petrochemical
manufacturing technology and advances in technology related to energy
usage. Our performance could be impeded if competitors developed or
acquired intellectual property rights to technology that we required or if
our innovation lagged the industry.
Compliance and ethics risks
Regulatory
The oil industry is subject to regulation and intervention by governments
throughout the world in such matters as the award of exploration and
production interests, the imposition of specific drilling obligations,
environmental protection controls, controls over the development and
decommissioning of a field (including restrictions on production) and,
possibly, nationalization, expropriation, cancellation or non-renewal of
contract rights. We buy, sell and trade oil and gas products in certain
regulated commodity markets. The oil industry is also subject to the
payment of royalties and taxation, which tend to be high compared with
those payable in respect of other commercial activities, and operates in
certain tax jurisdictions that have a degree of uncertainty relating to the
interpretation of, and changes to, tax law. As a result of new laws and
regulations or other factors, we could be required to curtail or cease
certain operations, or we could incur additional costs.
Ethical misconduct and non-compliance
Our code of conduct, which applies to all employees, defines our
commitment to integrity, compliance with all applicable legal
requirements, high ethical standards and the behaviours and actions we
expect of our businesses and people wherever we operate. Incidents of
non-compliance with applicable laws and regulation or ethical misconduct
could be damaging to our reputation and shareholder value. Multiple
events of non-compliance could call into question the integrity of our
operations.
Financial control risks
Liquidity, financial capacity and financial exposure
The group has established a financial framework to ensure that it is able
to maintain an appropriate level of liquidity and financial capacity and to
constrain the level of assessed capital at risk for the purposes of
positions taken in financial instruments. Failure to operate within our
financial framework could lead to the group becoming financially
distressed leading to a loss of shareholder value. Commercial credit risk
is measured and controlled to determine the group’s total credit risk.
Inability to determine adequately our credit exposure could lead to
financial loss. Crude oil prices are generally set in US dollars, while sales
of refined products may be in a variety of currencies. Fluctuations in
exchange rates can therefore give rise to foreign exchange exposures,
with a consequent impact on underlying costs.
For further information on financial instruments and financial risk
factors see Financial statements – Note 28 on page 136 and Note 34
on page 143.
Liabilities and provisions
Changes in the external environment, such as new laws and regulations,
market volatility or other factors, could affect the adequacy of our
provisions for pensions, tax, environmental and legal liabilities.
Operations risks
Operations – safety and operations
Process safety
Inherent in our operations are hazards that require continual oversight
and control. There are risks of technical integrity failure and loss of
containment of hydrocarbons and other hazardous material at operating
sites or pipelines. Failure to manage these risks could result in injury or
loss of life, environmental damage and/or loss of production.
BP ANNUAL REPORT AND ACCOUNTS 2007 9
Filename: U54368_doc3.3d Time: 14:49:34 Date: 25/02/08
Checksum: 1546924156
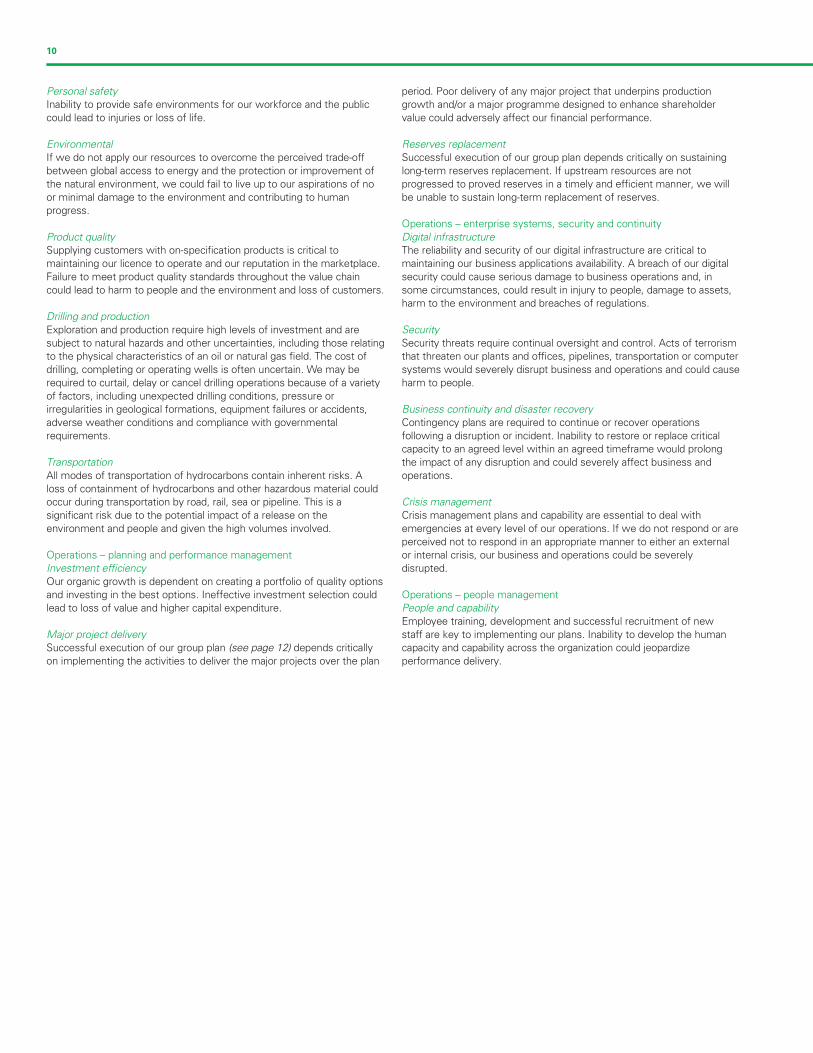
Personal safety
Inability to provide safe environments for our workforce and the public
could lead to injuries or loss of life.
Environmental
If we do not apply our resources to overcome the perceived trade-off
between global access to energy and the protection or improvement of
the natural environment, we could fail to live up to our aspirations of no
or minimal damage to the environment and contributing to human
progress.
Product quality
Supplying customers with on-specification products is critical to
maintaining our licence to operate and our reputation in the marketplace.
Failure to meet product quality standards throughout the value chain
could lead to harm to people and the environment and loss of customers.
Drilling and production
Exploration and production require high levels of investment and are
subject to natural hazards and other uncertainties, including those relating
to the physical characteristics of an oil or natural gas field. The cost of
drilling, completing or operating wells is often uncertain. We may be
required to curtail, delay or cancel drilling operations because of a variety
of factors, including unexpected drilling conditions, pressure or
irregularities in geological formations, equipment failures or accidents,
adverse weather conditions and compliance with governmental
requirements.
Transportation
All modes of transportation of hydrocarbons contain inherent risks. A
loss of containment of hydrocarbons and other hazardous material could
occur during transportation by road, rail, sea or pipeline. This is a
significant risk due to the potential impact of a release on the
environment and people and given the high volumes involved.
Operations – planning and performance management
Investment efficiency
Our organic growth is dependent on creating a portfolio of quality options
and investing in the best options. Ineffective investment selection could
lead to loss of value and higher capital expenditure.
Major project delivery
Successful execution of our group plan (see page 12) depends critically
on implementing the activities to deliver the major projects over the plan
period. Poor delivery of any major project that underpins production
growth and/or a major programme designed to enhance shareholder
value could adversely affect our financial performance.
Reserves replacement
Successful execution of our group plan depends critically on sustaining
long-term reserves replacement. If upstream resources are not
progressed to proved reserves in a timely and efficient manner, we will
be unable to sustain long-term replacement of reserves.
Operations – enterprise systems, security and continuity
Digital infrastructure
The reliability and security of our digital infrastructure are critical to
maintaining our business applications availability. A breach of our digital
security could cause serious damage to business operations and, in
some circumstances, could result in injury to people, damage to assets,
harm to the environment and breaches of regulations.
Security
Security threats require continual oversight and control. Acts of terrorism
that threaten our plants and offices, pipelines, transportation or computer
systems would severely disrupt business and operations and could cause
harm to people.
Business continuity and disaster recovery
Contingency plans are required to continue or recover operations
following a disruption or incident. Inability to restore or replace critical
capacity to an agreed level within an agreed timeframe would prolong
the impact of any disruption and could severely affect business and
operations.
Crisis management
Crisis management plans and capability are essential to deal with
emergencies at every level of our operations. If we do not respond or are
perceived not to respond in an appropriate manner to either an external
or internal crisis, our business and operations could be severely
disrupted.
Operations – people management
People and capability
Employee training, development and successful recruitment of new
staff are key to implementing our plans. Inability to develop the human
capacity and capability across the organization could jeopardize
performance delivery.
10
Filename: U54368_doc3.3d Time: 14:49:34 Date: 25/02/08
Checksum: 1167440507
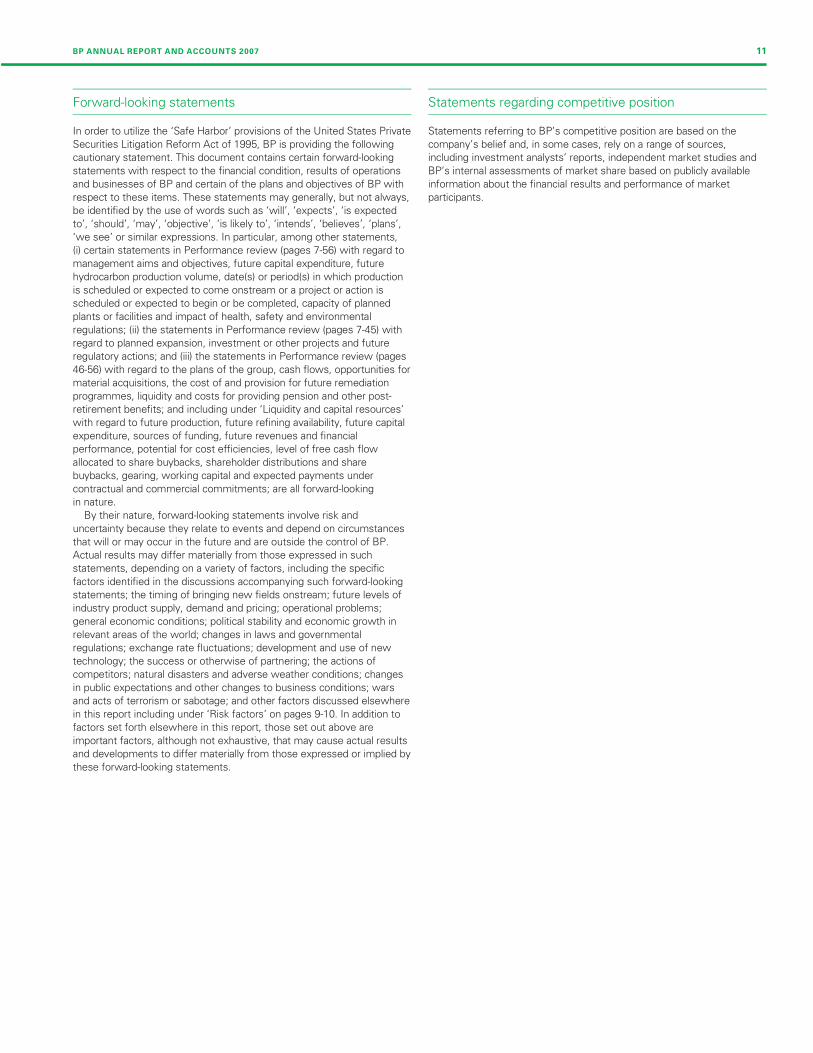
Forward-looking statements
In order to utilize the ‘Safe Harbor’ provisions of the United States Private
Securities Litigation Reform Act of 1995, BP is providing the following
cautionary statement. This document contains certain forward-looking
statements with respect to the financial condition, results of operations
and businesses of BP and certain of the plans and objectives of BP with
respect to these items. These statements may generally, but not always,
be identified by the use of words such as ‘will’, ‘expects’, ‘is expected
to’, ‘should’, ‘may’, ‘objective’, ‘is likely to’, ‘intends’, ‘believes’, ‘plans’,
‘we see’ or similar expressions. In particular, among other statements,
(i) certain statements in Performance review (pages 7-56) with regard to
management aims and objectives, future capital expenditure, future
hydrocarbon production volume, date(s) or period(s) in which production
is scheduled or expected to come onstream or a project or action is
scheduled or expected to begin or be completed, capacity of planned
plants or facilities and impact of health, safety and environmental
regulations; (ii) the statements in Performance review (pages 7-45) with
regard to planned expansion, investment or other projects and future
regulatory actions; and (iii) the statements in Performance review (pages
46-56) with regard to the plans of the group, cash flows, opportunities for
material acquisitions, the cost of and provision for future remediation
programmes, liquidity and costs for providing pension and other post-
retirement benefits; and including under ‘Liquidity and capital resources’
with regard to future production, future refining availability, future capital
expenditure, sources of funding, future revenues and financial
performance, potential for cost efficiencies, level of free cash flow
allocated to share buybacks, shareholder distributions and share
buybacks, gearing, working capital and expected payments under
contractual and commercial commitments; are all forward-looking
in nature.
By their nature, forward-looking statements involve risk and
uncertainty because they relate to events and depend on circumstances
that will or may occur in the future and are outside the control of BP.
Actual results may differ materially from those expressed in such
statements, depending on a variety of factors, including the specific
factors identified in the discussions accompanying such forward-looking
statements; the timing of bringing new fields onstream; future levels of
industry product supply, demand and pricing; operational problems;
general economic conditions; political stability and economic growth in
relevant areas of the world; changes in laws and governmental
regulations; exchange rate fluctuations; development and use of new
technology; the success or otherwise of partnering; the actions of
competitors; natural disasters and adverse weather conditions; changes
in public expectations and other changes to business conditions; wars
and acts of terrorism or sabotage; and other factors discussed elsewhere
in this report including under ‘Risk factors’ on pages 9-10. In addition to
factors set forth elsewhere in this report, those set out above are
important factors, although not exhaustive, that may cause actual results
and developments to differ materially from those expressed or implied by
these forward-looking statements.
Statements regarding competitive position
Statements referring to BP’s competitive position are based on the
company’s belief and, in some cases, rely on a range of sources,
including investment analysts’ reports, independent market studies and
BP’s internal assessments of market share based on publicly available
information about the financial results and performance of market
participants.
BP ANNUAL REPORT AND ACCOUNTS 2007 11
Filename: U54368_doc3.3d Time: 14:49:34 Date: 25/02/08
Checksum: -633916657
Information on the company
General
Unless otherwise indicated, information in this document reflects 100%
of the assets and operations of the company and its subsidiaries that
were consolidated at the date or for the periods indicated, including
minority interests. Also, unless otherwise indicated, figures for business
sales and other operating revenues include sales between BP
businesses.
The company, incorporated in 1909 in England and Wales, became
known as BP Amoco p.l.c. following the merger with Amoco Corporation
(incorporated in Indiana, US, in 1889). The company subsequently
changed its name to BP p.l.c.
BP is one of the world’s leading oil companies on the basis of market
capitalization and proved reserves. Our worldwide headquarters is
located at 1 St James’s Square, London SW1Y 4PD, UK, tel
+44 (0)20 7496 4000. Our agent in the US is BP America Inc., 4101
Winfield Road, Warrenville, Illinois 60555, tel +1 630 821 2222.
Overview of the group
BP is a global group, with interests and activities held or operated
through subsidiaries, jointly controlled entities or associates established
in, and subject to the laws and regulations of, many different
jurisdictions. These interests and activities covered three business
segments in 2007, supported by a number of organizational elements
comprising group functions and regions.
In 2007, the three business segments were Exploration and
Production, Refining and Marketing and Gas, Power and Renewables.
With effect from 1 January 2008, the Gas, Power and Renewables
segment ceased to report separately (see Resegmentation in 2008 on
page 13). Exploration and Production’s activities include oil and natural
gas exploration, development and production (upstream activities),
together with related pipeline, transportation and processing activities
(midstream activities). The activities of Refining and Marketing include
the supply and trading, refining, marketing and transportation of crude
oil, petroleum and chemicals products. Gas, Power and Renewables
activities included marketing and trading of gas and power, marketing of
liquefied natural gas (LNG), natural gas liquids (NGLs), and low-carbon
power generation through our Alternative Energy business. The group
provides high-quality technological support for all its businesses through
its research and engineering activities.
Group functions serve the business segments, aiming to achieve
coherence across the group, manage risks effectively and achieve
economies of scale. Each head of region ensures regional consistency of
the activities of business segments and group functions and represents
BP to external parties.
The group’s system of internal control is described in the BP
management framework. It is designed to meet the expectations of
internal control of the Turnbull Guidance on the Combined Code in the
UK and of COSO (committee of the sponsoring organization for the
Treadway Commission in the US). The system of internal control is the
complete set of management systems, organizational structures,
processes, standards and behaviours that are employed to conduct the
business of BP and deliver returns to shareholders. The design of the
system of internal control addresses risks and how to respond to them.
Each component of the system is in itself a device to respond to a
particular type or collection of risks.
The group strategy describes the group’s strategic objectives and the
presumptions made by BP about the future. It describes strategic risks
that arise from making such presumptions and the actions to be taken
to manage or mitigate the risks. The board delegates to the group chief
executive responsibility for developing BP’s strategy and its
implementation through the group plan that determine the setting of
priorities and allocation of resources. The group chief executive is obliged
to discuss with the board, on the basis of the strategy and group plan, all
material matters currently or prospectively affecting BP’s performance.
As the group’s business segments are managed on a global, not
regional, basis, geographical information for the group and segments is
given to provide additional information for investors but does not reflect
the way BP manages its activities.
We have well-established operations in Europe, the US, Canada,
Russia, South America, Australasia, Asia and parts of Africa. Currently,
around 65% of the group’s capital is invested in Organisation for
Economic Co-operation and Development (OECD) countries, with just
under 40% of our fixed assets located in the US and around 25% located
in Europe.
We believe that BP has a strong portfolio of assets:
– In Exploration and Production, we have upstream interests in 29
countries. Exploration and Production activities are managed through
operating units that are accountable for the day-to-day management of
the segment’s activities. An operating unit is accountable for one or
more fields. Profit centres comprise one or more operating units.
Profit centres are, or are expected to become, areas that provide
significant production and income for the segment. Our current areas
of major development include the deepwater Gulf of Mexico,
Azerbaijan, Algeria, Angola, Egypt and Asia Pacific where we believe
we have competitive advantage and that we believe provide the
foundation for volume growth and improved margins in the future.
We also have significant midstream activities to support our upstream
interests.
– In Refining and Marketing, we have a strong presence in the US and
Europe. In the US, we market under the Amoco and BP brands in the
Midwest, east and southeast and under the ARCO brand on the west
coast, and under the BP and Aral brands in Europe. We have a long-
established supply and trading activity responsible for delivering value
across the crude and oil products supply chain. Our Aromatics &
Acetyls business maintains a manufacturing position globally, with
emphasis on growth in Asia. We also have, or are growing,
businesses elsewhere in the world under the BP and Castrol brands,
including a strong global lubricants portfolio and other business-to-
business marketing businesses (aviation and marine) covering the
mobility sectors. We continue to seek opportunities to broaden our
activities in growth markets such as China and India.
– In our Gas, Power and Renewables businesses, marketing and trading
is undertaken primarily in the US, Canada, the UK and the rest of
Europe. Our marketing and trading activities include natural gas,
power and NGLs. Our LNG activities identify and capture worldwide
opportunities for our upstream natural gas resources and are focused
on growing natural gas markets, including the US, the UK, Spain and
key consuming countries of the Asia Pacific region. We have a
significant NGLs processing and marketing business in North America.
BP Alternative Energy, launched in November 2005, combines all of
BP’s interests in businesses that provide low-carbon energy solutions
for power generation: solar, wind, gas-fired power generation and
hydrogen power with carbon capture and storage. Alternative Energy
has solar production facilities in the US, Spain, China, India and
Australia; and wind farms in the Netherlands, India and the US.
We are advancing development of hydrogen power plants and are
involved in gas-fired power projects in the US, the UK, Spain, Vietnam,
Trinidad & Tobago and South Korea.
Through non-US subsidiaries or other non-US entities, during the
period covered by this report, BP conducted limited marketing, licensing
and trading activities in, or with persons from, certain countries identified
by the US Department of State as State Sponsors of Terrorism. BP
believes that these activities are immaterial to the group.
BP has interests in, and is the operator of, two fields and a pipeline
located outside of Iran in which the National Iranian Oil Company (NIOC)
and an affiliated entity have interests. In Iran, BP buys small quantities of
crude oil. This is primarily for sale to third parties in Europe and a small
portion is used by BP in its own refineries in South Africa and Europe. In
addition, BP sells small quantities of crude oil into Iran and blends and
markets small quantities of lubricants for sale to domestic consumers
through a joint venture there, which has a blending facility. However, BP
does not seek to obtain from the government of Iran licences or
agreements for oil and gas projects in Iran, is not conducting any
technical studies in Iran and does not own or operate any refineries or
chemicals plants in Iran.
12
Filename: U54368_doc3.3d Time: 14:49:34 Date: 25/02/08
Checksum: 2038944370
BP sells small quantities of lubricants in Cuba through a 50/50 joint
venture there. In Syria, small quantities of lubricants are sold through a
distributor and BP obtains small volumes of crude oil supplies for sale to
third parties in Europe. These sales and purchases are insignificant and
BP does not provide other goods, technologies or services in these
countries.
Acquisitions and disposals
In 2007, BP acquired Chevron’s Netherlands manufacturing company,
Texaco Raffiniderij Pernis B.V. The acquisition included Chevron’s 31%
minority shareholding in Nerefco, its 31% shareholding in the 22.5 MW
wind farm co-located at the refinery as well as a 22.8% shareholding in
the TEAM joint venture terminal and shareholdings in two local pipelines
linking the TEAM terminal to the refinery. Disposal proceeds were
$4,267 million, which included $1,903 million from the sale of the
Coryton refinery and $605 million from the sale of our exploration and
production gas infrastructure business in the Netherlands.
In 2006, there were no significant acquisitions. BP purchased 9.6% of
the shares issued under Rosneft’s IPO for a consideration of $1 billion
(included in capital expenditure). This represented an interest of around
1.4% in Rosneft. Disposal proceeds were $6,254 million, which included
$2.1 billion on the sale of our interest in the Shenzi discovery and around
$1.3 billion from the sale of our producing properties on the Outer
Continental Shelf of the Gulf of Mexico to Apache Corporation.
In 2005, there were no significant acquisitions. Disposal proceeds
were $11,200 million, which included net cash proceeds from the sale of
Innovene to INEOS of $8,304 million after selling costs, closing
adjustments and liabilities. Innovene represented the majority of the
Olefins and Derivatives business. Additionally, disposal proceeds
included proceeds from the sale of the group’s interest in the Ormen
Lange field in Norway.
Resegmentation in 2008
On 11 October 2007, we announced our intention to simplify the
organizational structure of BP. From 1 January 2008, there are only two
business segments: Exploration and Production and Refining and
Marketing. A separate business, Alternative Energy, handles BP’s low-
carbon businesses and future growth options outside oil and gas.
As a result, and with effect from 1 January 2008:
– The Gas, Power and Renewables segment ceased to report
separately.
– The NGLs, LNG and gas and power marketing and trading businesses
were transferred from the Gas, Power and Renewables segment to
the Exploration and Production segment.
– The Alternative Energy business was transferred from the Gas, Power
and Renewables segment to Other businesses and corporate.
– The Emerging Consumers Marketing Unit was transferred from
Refining and Marketing to Alternative Energy (which is reported in
Other businesses and corporate).
– The Biofuels business was transferred from Refining and Marketing to
Alternative Energy (which is reported in Other businesses and
corporate).
– The Shipping business was transferred from Refining and Marketing
to Other businesses and corporate.
BP ANNUAL REPORT AND ACCOUNTS 2007 13

Filename: U54368_doc3.3d Time: 14:49:35 Date: 25/02/08
Checksum: 154290018
Exploration and Production
Our Exploration and Production segment includes upstream and
midstream activities in 29 countries, including the US, the UK, Angola,
Azerbaijan, Canada, Egypt, Russia, Trinidad & Tobago (Trinidad) and
locations within Asia Pacific, Latin America, North Africa and the Middle
East. Upstream activities involve oil and natural gas exploration and field
development and production. Our exploration programme is currently
focused around the deepwater Gulf of Mexico, Algeria, Angola,
Azerbaijan, Egypt and Russia. Major development areas include the
deepwater Gulf of Mexico, Azerbaijan, Algeria, Angola, Egypt and Asia
Pacific. During 2007, production came from 22 countries. The principal
areas of production are Russia, the US, Trinidad, the UK, Latin America,
the Middle East, Asia Pacific, Azerbaijan, Angola and Egypt.
Midstream activities involve the ownership and management of crude
oil and natural gas pipelines, processing and export terminals and LNG
processing facilities and transportation. Our most significant midstream
pipeline interests include the Trans Alaska Pipeline System, the Forties
Pipeline System and the Central Area Transmission System pipeline,
both in the UK sector of the North Sea, and the Baku-Tbilisi-Ceyhan
pipeline, running through Azerbaijan, Georgia and Turkey. Major LNG
activities are located in Trinidad, Indonesia and Australia. Further LNG
businesses with BP involvement are being built up in Egypt and Angola.
Our oil and gas production assets are located onshore or offshore and
include wells, gathering centres, in-field flow lines, processing facilities,
storage facilities, offshore platforms, export systems (e.g. transit lines),
pipelines and LNG plant facilities.
Key statistics $ million------------------------------------------------------------------------------------------------------------------------------- -----------------
2007 2006 2005------------------------------------------------------------------------------------------------------------------------------- -----------------
Sales and other operating revenues
from continuing operations 54,550 52,600 47,210
Profit before interest and tax from
continuing operationsa 26,938 29,629 25,502
Total assets 108,874 99,310 93,447
Capital expenditure and acquisitions 13,906 13,118 10,237
million barrels of oil equivalent------------------------------------------------------------------------------------------------------------------------------- -----------------
Net proved reserves – group 12,583 13,163 14,023
Net proved reserves – equity-
accounted entities 5,231 4,537 3,870
thousand barrels per day------------------------------------------------------------------------------------------------------------------------------- -----------------
Liquids production – group 1,304 1,351 1,423
Liquids production – equity-
accounted entities 1,110 1,124 1,139
million cubic feet per day------------------------------------------------------------------------------------------------------------------------------- -----------------
Natural gas production – group 7,222 7,412 7,512
Natural gas production – equity-
accounted entities 921 1,005 912
$ per barrel------------------------------------------------------------------------------------------------------------------------------- -----------------
Average BP crude oil realizationsb 69.98 61.91 50.27
Average BP NGL realizationsb 46.20 37.17 33.23
Average BP liquids realizationsb c 67.45 59.23 48.51
Average West Texas Intermediate
oil price 72.20 66.02 56.58
Average Brent oil price 72.39 65.14 54.48
$ per thousand cubic feet------------------------------------------------------------------------------------------------------------------------------- -----------------
Average BP natural gas realizationsb 4.53 4.72 4.90
Average BP US natural gas
realizationsb 5.43 5.74 6.78
$ per million British thermal units------------------------------------------------------------------------------------------------------------------------------- -----------------
Average Henry Hub gas priced 6.86 7.24 8.65
pence per therm------------------------------------------------------------------------------------------------------------------------------- -----------------
Average UK National Balancing Point
gas price 29.95 42.19 40.71
a Profit before interest and tax from continuing operations includes profit afterinterest and tax of equity-accounted entities.
b The Exploration and Production segment does not undertake any hedging activity.Consequently, realizations reflect the market price achieved. Realizations are basedon sales of consolidated subsidiaries only, which excludes equity-accountedentities.
c Crude oil and natural gas liquids.d Henry Hub First of Month Index.
Upstream operations in Argentina, Bolivia, Abu Dhabi, Kazakhstan and
the TNK-BP and some of the Sakhalin operations in Russia, as well as
some of our operations in Indonesia and Venezuela, are conducted
through equity-accounted entities.
The Exploration and Production strategy is to build production by:
– Focusing on finding the largest fields in the world’s most prolific
hydrocarbon basins.
– Building leadership positions in these areas.
– Managing the decline of existing producing assets and divesting
assets when they no longer compete in our portfolio.
Through the application of advanced technology and significant
investment, we have gained a strong position in many of our operating
areas.
Total capital expenditure and acquisitions in 2007 was $13.9 billion
(2006 $13.1 billion and 2005 $10.2 billion). There were no significant
acquisitions in the period from 2005 to 2007. Capital expenditure in 2006
included our investment in Rosneft’s IPO of $1 billion. Capital
expenditure in 2008 is planned to be around $15 billion including
approximately $0.5 billion in respect of the gas and power businesses
that are now reported through Exploration and Production, as described
below, and excluding the impact of our transaction with Husky Energy
Inc., which is further described on page 22. This reflects our project
programme, managed within the context of our disciplined approach to
capital investment and taking into account sector-specific inflation.
Development expenditure incurred in 2007, excluding midstream
activities, was $10,153 million, compared with $9,109 million in 2006 and
$7,678 million in 2005.
Resegmentation in 2008
With effect from 1 January 2008, the NGLs, LNG and the gas and power
marketing and trading businesses were transferred from the Gas, Power
and Renewables segment to the Exploration and Production segment.
Upstream activities
Exploration
The group explores for oil and natural gas under a wide range of
licensing, joint venture and other contractual agreements. We may do
this alone or, more frequently, with partners. BP acts as operator for
many of these ventures.
Our exploration and appraisal costs in 2007 were $1,892 million,
compared with $1,765 million in 2006 and $1,266 million in 2005. These
costs include exploration and appraisal drilling expenditures, which are
capitalized within intangible fixed assets, and geological and geophysical
exploration costs, which are charged to income as incurred.
Approximately 47% of 2007 exploration and appraisal costs were
directed towards appraisal activity. In 2007, we participated in 86 gross
(37 net) exploration and appraisal wells in 12 countries. The principal
areas of activity were the deepwater Gulf of Mexico, Angola, Egypt,
North Sea, Canada and Pakistan.
Total exploration expense in 2007 of $756 million (2006 $1,045 million
and 2005 $684 million) included the write-off of expenses related to
14
Filename: U54368_doc3.3d Time: 14:49:35 Date: 25/02/08
Checksum: 182551524
unsuccessful drilling activities in Russia ($86 million excluding TNK-BP),
Egypt ($49 million), Colombia ($49 million), the deepwater Gulf of Mexico
($36 million), onshore North America ($36 million), Angola ($27 million)
and others ($11 million).
In 2007, we obtained upstream rights in several new tracts, which
include the following:
– In the Gulf of Mexico, we have been awarded 171 blocks (BP average
equity 100%) through the Outer Continental Shelf Lease Sales 204
and 205.
– In Oman, we signed a production-sharing agreement (PSA) to appraise
and develop the Khazzan/Makarem gas fields.
– In Colombia, BP was awarded operatorship in two blocks, RC4 (BP
35%) and RC5 (BP 100%), which cover approximately 6,200 square
kilometres in the Caribbean Sea, offshore northern Colombia.
– In Libya, BP signed a major exploration and production agreement
with Libya’s National Oil Company, covering over 53,000 square
kilometres both onshore and offshore.
In 2007, we were involved in a number of discoveries. In most cases,
reserves bookings from these fields will depend on the results of
ongoing technical and commercial evaluations, including appraisal drilling.
Our most significant discoveries in 2007 included the following:
– In Angola, we made further discoveries in the ultra deepwater (greater
than 1,500 metres) Block 31 (BP 26.7% and operator) with the
Miranda, Cordelia and Portia wells, bringing the total number of
discoveries in Block 31 to 15.
– In Azerbaijan, we made a further discovery in a new reservoir in Shah
Deniz (BP 25.5% and operator) with the SDX-04 well.
– In Egypt, we made three discoveries with the Giza North-1 (BP 60%
and operator), Taurus Deep (BP 60% and operator) and Satis (BP 50%
and operator) wells.
– In the deepwater Gulf of Mexico, we made a discovery with the
Isabela well (BP 67% and operator).
Reserves and production
Compliance
IFRS does not provide specific guidance on reserves disclosures. BP
estimates proved reserves in accordance with SEC Rule 4-10 (a) and
relevant guidance notes and letters issued by the SEC staff.
By their nature, there is always some risk involved in the ultimate
development and production of reserves, including, but not limited to,
final regulatory approval, the installation of new or additional
infrastructure as well as changes in oil and gas prices and the continued
availability of additional development capital.
All the group’s oil and gas reserves held in consolidated companies
have been estimated by the group’s petroleum engineers. Of the equity-
accounted volumes in 2007, 16% were based on estimates prepared by
group petroleum engineers and 84% were based on estimates prepared
by independent engineering consultants, although all of the group’s oil
and gas reserves held in equity-accounted entities are reviewed by the
group’s petroleum engineers before making the assessment of volumes
to be booked by BP.
Our proved reserves are associated with both concessions (tax and
royalty arrangements) and agreements where the group is exposed to
the upstream risks and rewards of ownership, but where title to the
hydrocarbons is not conferred, such as PSAs. In a concession, the
consortium of which we are a part is entitled to the reserves that can be
produced over the licence period, which may be the life of the field. In a
PSA, we are entitled to recover volumes that equate to costs incurred to
develop and produce the reserves and an agreed share of the remaining
volumes or the economic equivalent. As part of our entitlement is driven
by the monetary amount of costs to be recovered, price fluctuations will
have an impact on both production volumes and reserves. Thirteen per
cent of our proved reserves are associated with PSAs. The main
countries in which we operate under PSAs are Algeria, Angola,
Azerbaijan, Egypt, Indonesia and Vietnam.
We separately disclose our share of reserves held in equity-accounted
entities (jointly controlled entities and associates), although we do not
control these entities or the assets held by such entities.
Resource progression
BP manages its hydrocarbon resources in three major categories:
prospect inventory, non-proved resources and proved reserves. When a
discovery is made, volumes usually transfer from the prospect inventory
to the non-proved resource category. The resources move through
various non-proved resource sub-categories as their technical and
commercial maturity increases through appraisal activity.
Resources in a field will only be categorized as proved reserves when
all the criteria for attribution of proved status have been met, including an
internally imposed requirement for project sanction or for sanction
expected within six months and, for additional reserves in existing fields,
the requirement that the reserves be included in the business plan and
scheduled for development, typically within three years. Where, on
occasion, the group decides to book reserves where development is
scheduled to commence beyond three years, these reserves will be
booked only where they satisfy the SEC’s criteria for attribution of proved
status. Internal approval and final investment decision are what we refer
to as project sanction.
At the point of sanction, all booked reserves will be categorized as
proved undeveloped (PUD). Volumes will subsequently be recategorized
from PUD to proved developed (PD) as a consequence of development
activity. When part of a well’s reserves depends on a later phase of
activity, only that portion of reserves associated with existing, available
facilities and infrastructure moves to PD. The first PD bookings will occur
at the point of first oil or gas production. Major development projects
typically take one to four years from the time of initial booking of PUD
reserves to the start of production. Changes to reserves bookings may
be made due to analysis of new or existing data concerning production,
reservoir performance, commercial factors, acquisition and divestment
activity and additional reservoir development activity.
Governance
BP’s centrally controlled process for proved reserves estimation approval
forms part of a holistic and integrated system of internal control. It
consists of the following elements:
– Accountabilities of certain officers of the group to ensure that there is
review and approval of proved reserves bookings independent of the
operating business and that there are effective controls in the approval
process and verification that the proved reserves estimates and the
related financial impacts are reported in a timely manner.
– Capital allocation processes, whereby delegated authority is exercised
to commit to capital projects that are consistent with the delivery of
the group’s business plan. A formal review process exists to ensure
that both technical and commercial criteria are met prior to the
commitment of capital to projects.
– Internal Audit, whose role includes systematically examining the
effectiveness of the group’s financial controls designed to assure the
reliability of reporting and safeguarding of assets and examining the
group’s compliance with laws, regulations and internal standards.
– Approval hierarchy whereby proved reserves changes above certain
threshold volumes require central authorization and periodic reviews.
The frequency of review is determined according to field size and
ensures that more than 80% of the BP reserves base undergoes
central review every two years and more than 90% is reviewed every
four years.
For the executive directors and senior management, no specific
portion of compensation bonuses is directly related to oil and gas
reserves targets. Additions to proved reserves is one of several
indicators by which the performance of the Exploration and Production
segment is assessed by the remuneration committee for the purposes of
determining compensation bonuses for the executive directors and
senior management. Other indicators include a number of financial and
operational measures.
BP’s variable pay programme for the other senior managers in the
Exploration and Production segment is based on individual performance
contracts. Individual performance contracts are based on agreed items
from the business performance plan, one of which, if they choose, could
relate to oil and gas reserves.
BP ANNUAL REPORT AND ACCOUNTS 2007 15

Filename: U54368_doc3.3d Time: 14:49:35 Date: 25/02/08
Checksum: 308686455
Reserve replacement
Total hydrocarbon proved reserves, on an oil equivalent basis and
excluding equity-accounted entities, comprised 12,583mmboe at
31 December 2007, a decrease of 4.4% compared with 31 December
2006. Natural gas represents about 56% of these reserves. The
reduction includes net sales of 58mmboe, largely comprising a number
of assets in the Netherlands, Pakistan, Canada and the US.
Total hydrocarbon proved reserves, on an oil equivalent basis for
equity-accounted entities alone, comprised 5,231mmboe at 31 December
2007, an increase of 15.3% compared with 31 December 2006. Natural
gas represents about 12% of these proved reserves. The increase
includes net sales of 3mmboe, largely comprising a number of assets in
Russia.
The proved reserves replacement ratio (also known as the production
replacement ratio) is the extent to which production is replaced by
proved reserves additions. This ratio is expressed in oil equivalent terms
and includes changes resulting from revisions to previous estimates,
improved recovery and extensions and discoveries, and may be
expressed as a replacement ratio excluding acquisitions and divestments
or as a total replacement ratio including acquisitions and divestments.
%------------------------------------------------------------------------------------------------------------------------------- -----------------
2007 2006 2005------------------------------------------------------------------------------------------------------------------------------- -----------------
Proved reserves replacement ratio,
excluding equity-accounted
entities 44 34 68
Proved reserves replacement ratio,
excluding equity-accounted
entities, including sales and
purchases of reserves-in-place 38 11 40
Proved reserves replacement ratio,
for equity-accounted entities 248 272 151
Proved reserves replacement ratio,
for equity-accounted entities,
including sales and purchases of
reserves-in-place 248 239 141
million barrels of oil equivalent------------------------------------------------------------------------------------------------------------------------------- -----------------
Additions to proved developed
reserves, excluding equity-
accounted entities, including
sales and purchases of reserves-
in-placea 929 675 632
Additions to proved developed
reserves, for equity-accounted
entities, including sales and
purchases of reserves-in-placea 473 936 474
%------------------------------------------------------------------------------------------------------------------------------- -----------------
Proved developed reserves
replacement ratio, excluding
equity-accounted entities,
including sales and purchases of
reserves-in-place 99 70 63
Proved developed reserves
replacement ratio, for equity-
accounted entities, including
sales and purchases of reserves-
in-place 101 195 99
a This includes some reserves that were previously classified as provedundeveloped.
In 2007, net additions to the group’s proved reserves (excluding sales
and purchases of reserves-in-place and equity-accounted entities)
amounted to 414mmboe, principally through improved recovery from,
and extensions to, existing fields and discoveries of new fields. Of the
reserves additions through improved recovery from, and extensions to,
existing fields and discoveries of new fields, 64% are associated with
new projects and are proved undeveloped reserves additions. The
remainder are in existing developments where they represent a mixture
of proved developed and proved undeveloped reserves. The principal
reserves additions were in the Norway (Skarv), the US (Liberty, Prudhoe
Bay, Great White, Nakika, Thunder Horse), Trinidad (Immortelle,
Manakin), Angola (Pazflor) and Canada (Noel).
Production
Our total hydrocarbon production during 2007 averaged 2,549 thousand
barrels of oil equivalent per day (mboe/d) for subsidiaries and
1,269mboe/d for equity-accounted entities, a decrease of 3% and 2%
respectively compared with 2006. For subsidiaries, 35% of our
production was in the US and 13% in the UK. For equity-accounted
entities, 72% of production was from TNK-BP.
Total production for 2008 is expected to be higher than in 2007. This is
based on the group’s asset portfolio at 1 January 2008, expected start-
ups in 2008 and Brent at $60/bbl, before any 2008 disposal effects and
before any effects of prices above $60/bbl on volumes in PSAs.
16
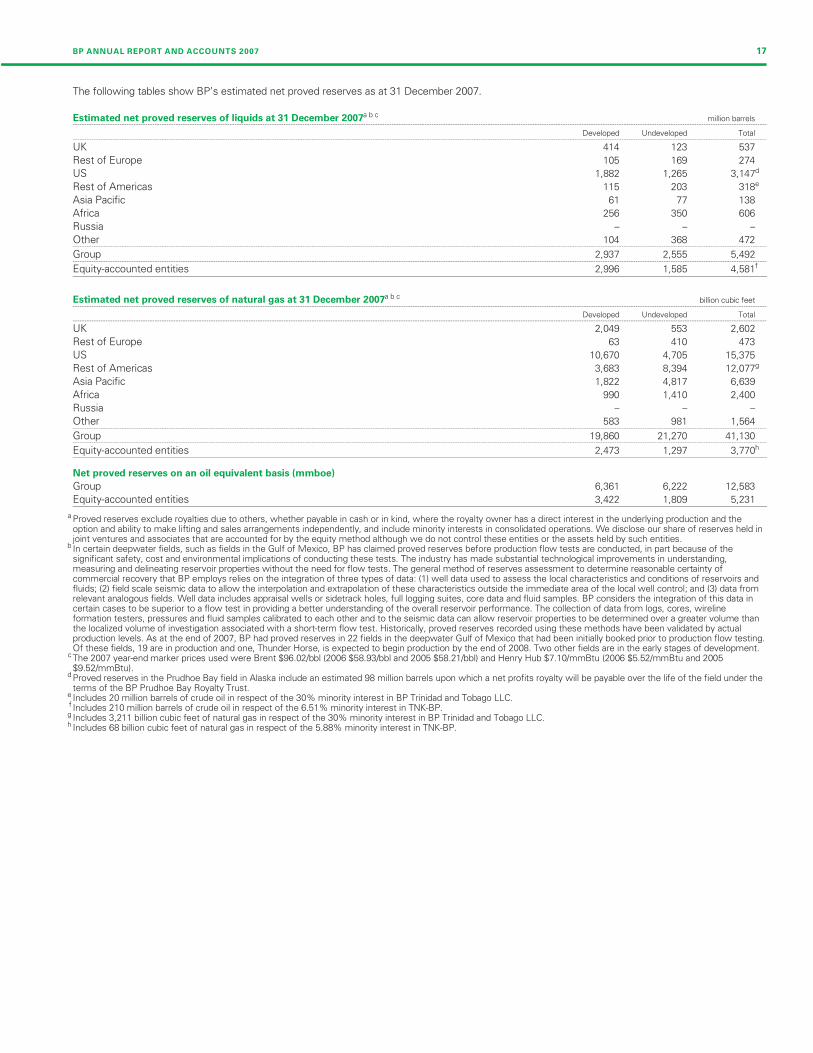
Filename: U54368_doc3.3d Time: 14:49:35 Date: 25/02/08
Checksum: -515655080
The following tables show BP’s estimated net proved reserves as at 31 December 2007.
Estimated net proved reserves of liquids at 31 December 2007a b cmillion barrels
--------------------------------------------------------------------------------------------------------------------------------------------------------------------------------------------------------------------------------------------------------------------------------------------------------
Developed Undeveloped Total--------------------------------------------------------------------------------------------------------------------------------------------------------------------------------------------------------------------------------------------------------------------------------------------------------
UK 414 123 537
Rest of Europe 105 169 274
US 1,882 1,265 3,147d
Rest of Americas 115 203 318e
Asia Pacific 61 77 138
Africa 256 350 606
Russia – –
Other 104 368 472--------------------------------------------------------------------------------------------------------------------------------------------------------------------------------------------------------------------------------------------------------------------------------------------------------
Group 2,937 2,555 5,492--------------------------------------------------------------------------------------------------------------------------------------------------------------------------------------------------------------------------------------------------------------------------------------------------------
Equity-accounted entities 2,996 1,585 4,581f
Estimated net proved reserves of natural gas at 31 December 2007a b cbillion cubic feet
--------------------------------------------------------------------------------------------------------------------------------------------------------------------------------------------------------------------------------------------------------------------------------------------------------
Developed Undeveloped Total--------------------------------------------------------------------------------------------------------------------------------------------------------------------------------------------------------------------------------------------------------------------------------------------------------
UK 2,049 553 2,602
Rest of Europe 63 410 473
US 10,670 4,705 15,375
Rest of Americas 3,683 8,394 12,077g
Asia Pacific 1,822 4,817 6,639
Africa 990 1,410 2,400
Russia – –
Other 583 981 1,564--------------------------------------------------------------------------------------------------------------------------------------------------------------------------------------------------------------------------------------------------------------------------------------------------------
Group 19,860 21,270 41,130--------------------------------------------------------------------------------------------------------------------------------------------------------------------------------------------------------------------------------------------------------------------------------------------------------
Equity-accounted entities 2,473 1,297 3,770h
Net proved reserves on an oil equivalent basis (mmboe)
Group 6,361 6,222 12,583
Equity-accounted entities 3,422 1,809 5,231
a Proved reserves exclude royalties due to others, whether payable in cash or in kind, where the royalty owner has a direct interest in the underlying production and theoption and ability to make lifting and sales arrangements independently, and include minority interests in consolidated operations. We disclose our share of reserves held injoint ventures and associates that are accounted for by the equity method although we do not control these entities or the assets held by such entities.
b In certain deepwater fields, such as fields in the Gulf of Mexico, BP has claimed proved reserves before production flow tests are conducted, in part because of thesignificant safety, cost and environmental implications of conducting these tests. The industry has made substantial technological improvements in understanding,measuring and delineating reservoir properties without the need for flow tests. The general method of reserves assessment to determine reasonable certainty ofcommercial recovery that BP employs relies on the integration of three types of data: (1) well data used to assess the local characteristics and conditions of reservoirs andfluids; (2) field scale seismic data to allow the interpolation and extrapolation of these characteristics outside the immediate area of the local well control; and (3) data fromrelevant analogous fields. Well data includes appraisal wells or sidetrack holes, full logging suites, core data and fluid samples. BP considers the integration of this data incertain cases to be superior to a flow test in providing a better understanding of the overall reservoir performance. The collection of data from logs, cores, wirelineformation testers, pressures and fluid samples calibrated to each other and to the seismic data can allow reservoir properties to be determined over a greater volume thanthe localized volume of investigation associated with a short-term flow test. Historically, proved reserves recorded using these methods have been validated by actualproduction levels. As at the end of 2007, BP had proved reserves in 22 fields in the deepwater Gulf of Mexico that had been initially booked prior to production flow testing.Of these fields, 19 are in production and one, Thunder Horse, is expected to begin production by the end of 2008. Two other fields are in the early stages of development.
c The 2007 year-end marker prices used were Brent $96.02/bbl (2006 $58.93/bbl and 2005 $58.21/bbl) and Henry Hub $7.10/mmBtu (2006 $5.52/mmBtu and 2005$9.52/mmBtu).
d Proved reserves in the Prudhoe Bay field in Alaska include an estimated 98 million barrels upon which a net profits royalty will be payable over the life of the field under theterms of the BP Prudhoe Bay Royalty Trust.
e Includes 20 million barrels of crude oil in respect of the 30% minority interest in BP Trinidad and Tobago LLC.f Includes 210 million barrels of crude oil in respect of the 6.51% minority interest in TNK-BP.g Includes 3,211 billion cubic feet of natural gas in respect of the 30% minority interest in BP Trinidad and Tobago LLC.h Includes 68 billion cubic feet of natural gas in respect of the 5.88% minority interest in TNK-BP.
–
–
BP ANNUAL REPORT AND ACCOUNTS 2007 17

Filename: U54368_doc3.3d Time: 14:49:35 Date: 25/02/08Checksum: 2020516132
18
The following tables show BP’s production by major field for 2007, 2006 and 2005.
Liquids % thousand barrels per day--------------------------------------------------------------------------------------------------------------------------------------------------------------------------------------------------------------------------------------------------------------------------------------------------------
aBP net share of production
--------------------------------------------------------------------------------------------------------------------------------------------------------------------------------------------------------------------------------------------------------------------------------------------------------
Field or Area Interest 2007 2006 2005--------------------------------------------------------------------------------------------------------------------------------------------------------------------------------------------------------------------------------------------------------------------------------------------------------
Alaska Prudhoe Bayb 26.4 74 71 89Kuparuk 39.2 52 57 62Northstarb 98.6 28 38 46Milne Pointb 99.4 28 31 37Other Various 27 27 34
--------------------------------------------------------------------------------------------------------------------------------------------------------------------------------------------------------------------------------------------------------------------------------------------------------
Total Alaska 209 224 268--------------------------------------------------------------------------------------------------------------------------------------------------------------------------------------------------------------------------------------------------------------------------------------------------------
Lower 48 onshorec Various Various 108 125 130--------------------------------------------------------------------------------------------------------------------------------------------------------------------------------------------------------------------------------------------------------------------------------------------------------
Gulf of Mexico deepwaterc Na Kikab 50.0 32 41 44Horn Mountainb 100.0 18 23 26Kingb 100.0 22 28 24Mars 28.5 30 19 21Mad Dogb 61.0 25 17 13Holsteinb 50.0 17 15 22Other Various 52 52 48
Gulf of Mexico Shelfc Other Various – 3 16--------------------------------------------------------------------------------------------------------------------------------------------------------------------------------------------------------------------------------------------------------------------------------------------------------
Total Gulf of Mexico 196 198 214--------------------------------------------------------------------------------------------------------------------------------------------------------------------------------------------------------------------------------------------------------------------------------------------------------
Total US 513 547 612
UK offshorec ETAPd Various 32 49 49Foinavenb Various 37 37 39Magnusb 85.0 16 30 30Schiehallion/Loyalb Various 20 26 28Hardingb 70.0 14 17 22Andrewb 62.8 8 7 12Other Various 59 69 75
--------------------------------------------------------------------------------------------------------------------------------------------------------------------------------------------------------------------------------------------------------------------------------------------------------
Total UK offshore 186 235 255--------------------------------------------------------------------------------------------------------------------------------------------------------------------------------------------------------------------------------------------------------------------------------------------------------
Onshore Wytch Farmb 67.8 15 18 22--------------------------------------------------------------------------------------------------------------------------------------------------------------------------------------------------------------------------------------------------------------------------------------------------------
Total UK 201 253 277
Netherlandsc Various Various – 1 1Norway Valhallb 28.1 17 21 25
Draugen 18.4 14 15 20Ulab 80.0 12 14 17Other Various 8 10 12
--------------------------------------------------------------------------------------------------------------------------------------------------------------------------------------------------------------------------------------------------------------------------------------------------------
Total Rest of Europe 51 61 75
Angola Dalia 16.7 31 – –Girassol 16.7 14 17 34Greater Plutoniob 50.0 12 – –Kizomba A 26.7 36 54 56Kizomba B 26.7 35 58 28Other Various 11 4 10
Australia Various 15.8 34 34 36Azerbaijan Azeri-Chirag-Gunashlib 34.1 200 145 76
Shah Denizb 25.5 5 – –Canadac Variousb Various 8 8 10Colombia Variousb Various 28 34 41Egypt Various Various 43 42 47Trinidad & Tobagoc Variousb 100.0 30 40 40Venezuelac Various Various 16 26 55Otherc Various Various 36 28 26--------------------------------------------------------------------------------------------------------------------------------------------------------------------------------------------------------------------------------------------------------------------------------------------------------
Total Rest of World 539 490 459
Total groupe 1,304 1,351 1,423
Equity-accounted entities (BP share)Abu Dhabif Various Various 192 163 148Argentina – Pan American Energy Various Various 69 69 67Russia – TNK-BPc Various Various 832 876 911Otherc Various Various 17 16 13--------------------------------------------------------------------------------------------------------------------------------------------------------------------------------------------------------------------------------------------------------------------------------------------------------
Total equity-accounted entities 1,110 1,124 1,139
----
----
----
----
----
---
----
----
----
----
---
----
----
----
----
---
----
----
----
----
---
----
----
----
----
---
----
----
----
----
---
----
----
----
----
---
----
----
----
----
--
----
----
----
----
---
----
----
---
----
----
----
----
----
----
---
----
----
----
----
---
----
----
----
----
---
----
----
----
----
---
----
----
----
----
---
----
----
----
----
---
---
a Production excludes royalties due to others whether payable in cash or in kind where the royalty owner has a direct interest in the underlying production and the option andability to make lifting and sales arrangements independently.
b BP-operated.c In 2007, BP divested its producing properties in the Netherlands and some producing properties in the US Lower 48 and Canada. TNK-BP disposed of its interests inseveral non-core properties. In 2006, BP divested its producing properties on the Outer Continental Shelf of the Gulf of Mexico and its interest in the Statfjord oil and gasfield in the UK. Our interests in the Boqueron, Desarollo Zulia Occidental (DZO) and Jusepin projects in Venezuela were reduced following a decision by the Venezuelangovernment. TNK-BP disposed of its non-core interests in the Udmurtneft assets. In 2005, BP divested the Teak, Samaan and Poui assets in Trinidad and sold interests incertain properties in the Gulf of Mexico. In addition, BP exchanged the Gulf of Mexico deepwater Blind Faith prospect for Kerr McGee’s interest in the Arkoma Red Oakand Williburton fields, and TNK-BP disposed of non-core producing assets in the Saratov region.
d Volumes relate to six BP-operated fields within ETAP. BP has no interests in the remaining three ETAP fields, which are operated by Shell.e Includes 54 net mboe/d of NGLs from processing plants in which BP has an interest (2006 55mboe/d and 2005 58mboe/d).f The BP group holds interests, through associates, in onshore and offshore concessions in Abu Dhabi, expiring in 2014 and 2018 respectively. During the second quarter of2007, we updated our reporting policy in Abu Dhabi to be consistent with general industry practice and as a result have started reporting production and reserves theregross of production taxes. This change resulted in an increase in our reserves of 153 million barrels and in our production of 33 thousand barrels per day (mb/d).
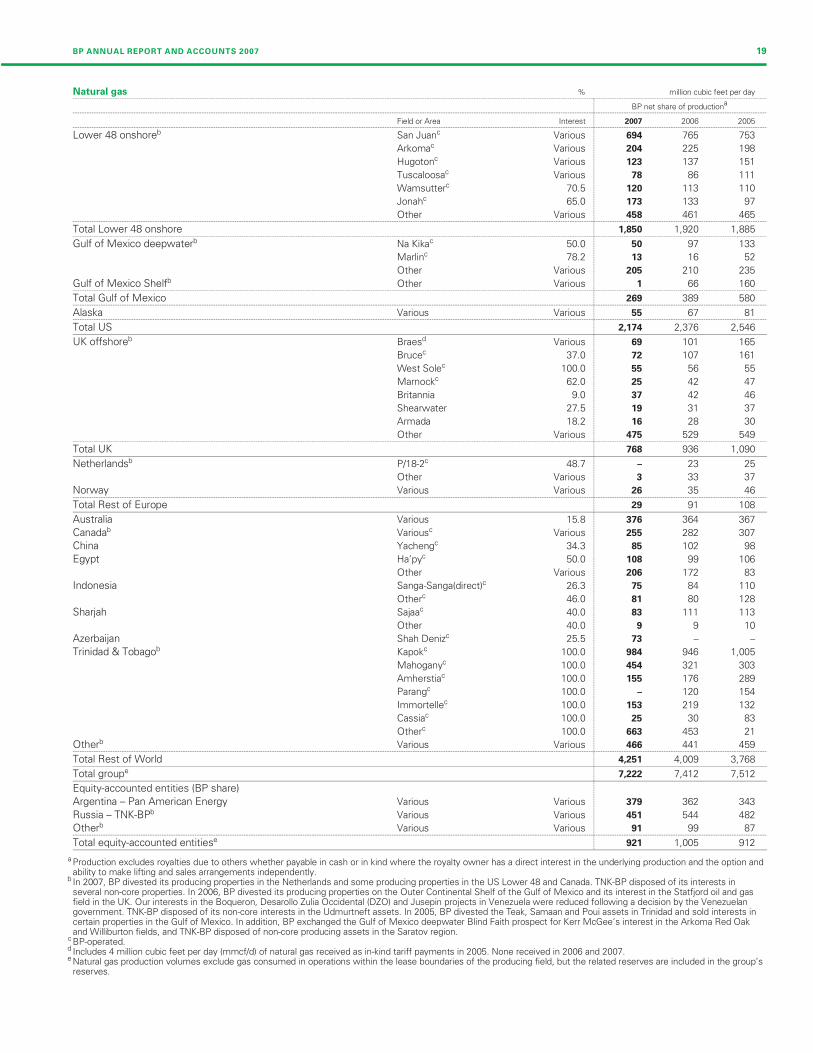
Filename: U54368_doc3.3d Time: 14:49:36 Date: 25/02/08Checksum: 2004513207
BP ANNUAL REPORT AND ACCOUNTS 2007 19
Natural gas % million cubic feet per day--------------------------------------------------------------------------------------------------------------------------------------------------------------------------------------------------------------------------------------------------------------------------------------------------------
aBP net share of production
--------------------------------------------------------------------------------------------------------------------------------------------------------------------------------------------------------------------------------------------------------------------------------------------------------
Field or Area Interest 2007 2006 2005--------------------------------------------------------------------------------------------------------------------------------------------------------------------------------------------------------------------------------------------------------------------------------------------------------
Lower 48 onshoreb San Juanc Various 694 765 753
Arkomac Various 204 225 198
Hugotonc Various 123 137 151
Tuscaloosac Various 78 86 111
Wamsutterc 70.5 120 113 110
Jonahc 65.0 173 133 97
Other Various 458 461 465--------------------------------------------------------------------------------------------------------------------------------------------------------------------------------------------------------------------------------------------------------------------------------------------------------
Total Lower 48 onshore 1,850 1,920 1,885--------------------------------------------------------------------------------------------------------------------------------------------------------------------------------------------------------------------------------------------------------------------------------------------------------
Gulf of Mexico deepwaterb Na Kikac 50.0 50 97 133
Marlinc 78.2 13 16 52
Other Various 205 210 235
Gulf of Mexico Shelfb Other Various 1 66 160--------------------------------------------------------------------------------------------------------------------------------------------------------------------------------------------------------------------------------------------------------------------------------------------------------
Total Gulf of Mexico 269 389 580--------------------------------------------------------------------------------------------------------------------------------------------------------------------------------------------------------------------------------------------------------------------------------------------------------
Alaska Various Various 55 67 81--------------------------------------------------------------------------------------------------------------------------------------------------------------------------------------------------------------------------------------------------------------------------------------------------------
Total US 2,174 2,376 2,546
UK offshoreb Braesd Various 69 101 165
Brucec 37.0 72 107 161
West Solec 100.0 55 56 55
Marnockc 62.0 25 42 47
Britannia 9.0 37 42 46
Shearwater 27.5 19 31 37
Armada 18.2 16 28 30
Other Various 475 529 549--------------------------------------------------------------------------------------------------------------------------------------------------------------------------------------------------------------------------------------------------------------------------------------------------------
Total UK 768 936 1,090
Netherlandsb P/18-2c 48.7 – 23 25
Other Various 3 33 37
Norway Various Various 26 35 46--------------------------------------------------------------------------------------------------------------------------------------------------------------------------------------------------------------------------------------------------------------------------------------------------------
Total Rest of Europe 29 91 108
Australia Various 15.8 376 364 367
Canadab Variousc Various 255 282 307
China Yachengc 34.3 85 102 98
Egypt Ha’pyc 50.0 108 99 106
Other Various 206 172 83
Indonesia Sanga-Sanga(direct)c 26.3 75 84 110
Otherc 46.0 81 80 128
Sharjah Sajaac 40.0 83 111 113
Other 40.0 9 9
Azerbaijan Shah Denizc 25.5 73 –
Trinidad & Tobagob Kapokc 100.0 984 946 1,005
Mahoganyc 100.0 454 321 303
Amherstiac 100.0 155 176 289
Parangc 100.0 – 120 154
Immortellec 100.0 153 219 132
Cassiac 100.0 25 30 83
Otherc 100.0 663 453 21
Otherb Various Various 466 441 459--------------------------------------------------------------------------------------------------------------------------------------------------------------------------------------------------------------------------------------------------------------------------------------------------------
Total Rest of World 4,251 4,009 3,768
Total groupe 7,222 7,412 7,512
Equity-accounted entities (BP share)
Argentina – Pan American Energy Various Various 379 362 343
Russia – TNK-BPb Various Various 451 544 482
Otherb Various Various 91 99 87--------------------------------------------------------------------------------------------------------------------------------------------------------------------------------------------------------------------------------------------------------------------------------------------------------
Total equity-accounted entitiese 921 1,005 912
----
----
----
----
---
----
----
----
----
----
----
---
----
----
----
----
----
----
----
----
----
----
----
----
----
----
---
----
----
----
----
----
----
---
----
----
----
----
----
----
----
---
----
----
----
---
----
----
----
----
---
----
---
----
----
----
----
----
----
----
---
----
----
----
----
----
----
----
----
----
----
----
----
----
---
----
----
----
----
----
----
----
---
-
a Production excludes royalties due to others whether payable in cash or in kind where the royalty owner has a direct interest in the underlying production and the option andability to make lifting and sales arrangements independently.
b In 2007, BP divested its producing properties in the Netherlands and some producing properties in the US Lower 48 and Canada. TNK-BP disposed of its interests inseveral non-core properties. In 2006, BP divested its producing properties on the Outer Continental Shelf of the Gulf of Mexico and its interest in the Statfjord oil and gasfield in the UK. Our interests in the Boqueron, Desarollo Zulia Occidental (DZO) and Jusepin projects in Venezuela were reduced following a decision by the Venezuelangovernment. TNK-BP disposed of its non-core interests in the Udmurtneft assets. In 2005, BP divested the Teak, Samaan and Poui assets in Trinidad and sold interests incertain properties in the Gulf of Mexico. In addition, BP exchanged the Gulf of Mexico deepwater Blind Faith prospect for Kerr McGee’s interest in the Arkoma Red Oakand Williburton fields, and TNK-BP disposed of non-core producing assets in the Saratov region.
c BP-operated.d Includes 4 million cubic feet per day (mmcf/d) of natural gas received as in-kind tariff payments in 2005. None received in 2006 and 2007.e Natural gas production volumes exclude gas consumed in operations within the lease boundaries of the producing field, but the related reserves are included in the group’s
reserves.
10
–

Filename: U54368_doc3.3d Time: 14:49:36 Date: 25/02/08
Checksum: -565023690
United States
2007 liquids production at 513mb/d decreased 6% from 2006,
while natural gas production at 2,174mmcf/d decreased 8% compared
with 2006.
Crude oil production showed a moderate decline of 18mb/d from
2006, with production from new projects (Gulf of Mexico) being offset by
divestments and natural reservoir decline. The NGLs component of
liquids production decreased by 15mb/d, driven mainly by commercial
changes in NGL processing contracts, natural reservoir decline and
divestments. Gas production was lower (201mmcf/d) because of
divestments and natural reservoir decline.
Development expenditure in the US (excluding midstream) during
2007 was $3,861 million, compared with $3,579 million in 2006 and
$2,965 million in 2005. The annual increase is the result of various
development projects in progress.
Our activities within the US take place in three main areas. Significant
events during 2007 within each of these are indicated below.
Deepwater Gulf of Mexico
Deepwater Gulf of Mexico is our largest area of growth in the US. In
2007, our deepwater Gulf of Mexico liquids production was 196mb/d and
gas production was 268mmcf/d.
Significant events were:
– The Atlantis platform (BP 56% and operator) was successfully
commissioned and started producing oil and gas during the fourth
quarter of 2007. Atlantis employs the deepest moored platform of its
kind in the world and a separate semi-submersible drilling and
construction rig. The versatile modular design of the platform provides
potential to add wells to increase recovery.
– At Thunder Horse (BP 75% and operator), as a result of a metallurgical
failure during pre-commissioning checks in 2006, the decision was
taken to repair all at-risk subsea components. All relevant components
have been removed from the sea floor and progress made in
reinstalling the repaired equipment. In 2007, the platform’s drilling rig
was commissioned and its first well successfully drilled and
completed. Thunder Horse is expected to start production by the end
of 2008. Designed to process 250,000 barrels of oil per day and 200
million cubic feet per day of natural gas, Thunder Horse is expected to
be the largest field in the Gulf of Mexico. The field will be supported
by a network of 25 subsea wells.
– In November, BP started production from two multi-phase subsea
pump stations in the King field (BP 100% and operator). At a depth of
1,700 metres and 15 miles away from the Marlin platform, this sets a
double world record for both depth and distance. The two pumps are
expected to enhance production from the King field by an average of
20% and to extend the production life of the field by five years
through improved recovery.
– BP was awarded 88 blocks in the western Gulf of Mexico lease sale
and 83 blocks in the central Gulf of Mexico lease sale
– On 6 June 2007, a discovery was made with the Isabela well (BP 67%
and operator), located on Mississippi Canyon Block 562 in
approximately 2,000 metres of water about 150 miles south-east of
New Orleans.
– During the second quarter, we increased our ownership in Horn
Mountain to 100% as part of an asset exchange agreement with
Occidental Petroleum Corporation (Occidental).
– In April 2007, BP disposed of its 80% interest in the Entrada field to
Callon Petroleum Company for a total price of $190 million.
Lower 48 states
In the Lower 48 states (onshore), our 2007 natural gas production was
1,850mmcf/d, which was down 4% compared with 2006. Liquids
production was 108mb/d, down 14% compared with 2006. The year-on-
year decrease in production is mainly attributed to normal field decline
and divestment activity. In 2007, we drilled approximately 400 wells as
operator and continued to maintain a stable programme of drilling activity
throughout the year.
Production is derived primarily from two main areas:
– In the western basins (Colorado, New Mexico and Wyoming) our
assets produced 222mboe/d in 2007.
– In the Gulf Coast and mid-continental basins (Kansas, Louisiana,
Oklahoma and Texas) our assets produced 203mboe/d in 2007.
The development of recovery technology continues to be a
fundamental strategy in accessing our North America tight gas
resources. Through the use of horizontal drilling and advanced hydraulic
fracturing techniques, we are achieving well rates up to 10 times higher
than more conventional techniques and per-well recoveries some five
times higher.
Significant events were:
– In January 2007, we announced our investment of up to $2.4 billion
expected over 13 years in the coalbed methane field development
project in the San Juan basin in Colorado. The project includes the
drilling of more than 700 wells, nearly all from existing well sites, and
the installation of associated field facilities.
– Drilling continued during 2007 on the Wamsutter natural gas
expansion project. The multi-year drilling programme is expected to
increase production significantly by the end of 2010. We are currently
testing horizontal fracturing technology and carrying out wireless
seismic studies on the reservoir.
– Significant progress has been made on decommissioning the Gulf of
Mexico Shelf hurricane-damaged platforms, which is on track for
completion in 2010. This work has been carried out almost exclusively
using a diverless ‘access’ approach, significantly reducing exposure to
safety issues associated with diving. Late in 2007, we signed an
agreement with Wild Well Control, an affiliate of Superior Energy
Services, to sell seven damaged platforms and 59 associated wells
and consequentially to transfer the decommissioning liability to them.
They will assume responsibility for plugging and abandonment of all
wells, salvage and removal or reefing of the damaged platforms and
related facilities, and restoration of all sites.
– In 2007, BP divested its non-core Permian assets as part of the asset
exchange agreement with Occidental. In consideration, BP received
the remaining one-third interest in the Horn Mountain field in the Gulf
of Mexico and approximately $100 million cash.
– In the third quarter of 2007, we ceased operations at the Whitney
Canyon gas plant located near Evanston, Wyoming. By doing this we
expect to extend the economic life of the field by re-routing the
natural gas processed at the Whitney Canyon gas plant to Chevron’s
Carter Creek gas plant. BP intends to continue to operate the 28 wells
in the Whitney Canyon field and the inlet facility, as well as the nearby
Painter Complex gas plant.
Alaska
In Alaska, BP net oil production in 2007 was 209mboe/d, a decrease of
7% from 2006, due to normal decline in the large mature fields, partially
offset by lower downtime.
BP operates 13 North Slope oil fields (including Prudhoe Bay, Northstar
and Milne Point) and four North Slope pipelines and owns a significant
interest in six other producing fields. BP’s 26.4% interest in Prudhoe Bay
also includes a large undeveloped natural gas resource. Developing
viscous oil production and unlocking large undeveloped heavy oil
resources through the application of advanced technology are important
parts of the Alaska business strategy.
Significant events in 2007 were:
– On 20 June 2007, the Prudhoe Bay field and the Trans Alaska Pipeline
System (TAPS) celebrated the 30th anniversary of first production
from the North Slope of Alaska. The original expectations for Prudhoe
Bay were to drill 500 wells, produce for 20 years and recover 9 billion
boe of hydrocarbon resources. After 30 years, more than 2,500 wells
have been drilled, more than 11.5 billion boe have been recovered to
date, and the field is expected to continue to produce for another 50
years or more. Prudhoe Bay production averaged 400mboe/d (gross)
in 2007, with BP’s net share being 102mboe/d. Overall, downtime
during the year was consistent with plans for normal maintenance
activity and there were no large unplanned production disruptions.
20
Filename: U54368_doc3.3d Time: 14:49:36 Date: 25/02/08
Checksum: -261122979
– In 2007, we spent more than $250 million (BP net) in Alaska on a
programme to upgrade or replace pipelines, increase inspection and
corrosion monitoring, carry out preventative maintenance and repairs,
expand capacity, and improve the efficiency of major facilities in all
BP-operated fields.
– We have also made progress on the replacement of sections of oil
transit lines in the Prudhoe Bay field, which for these transit lines has
included adding pipeline pigging facilities to clean and inspect
pipelines, direct corrosion inhibitor injection, new leak detection and
corrosion monitoring systems. We aim to complete this activity in
2008.
– On 16 February 2007, BP temporarily shut down its Northstar
production facility for 18 days to repair welds in the low pressure gas
piping system. The facility was restarted on 6 March. The full-year
impact of the production disruption resulting from this shutdown was
more than offset by the beneficial impacts of an earlier-than-planned
restart of the Milne Point K Pad pipeline replacement and strong
reservoir performance throughout 2007 at Prudhoe Bay and Kuparuk.
– On 25 October 2007, BP Exploration Alaska (BPXA) entered into a plea
agreement with the US Department of Justice (DOJ), which ended
both federal and state government criminal investigations of BPXA on
matters related to the March and August 2006 oil transit line spills in
Alaska. On 29 November 2007, in accordance with the agreement,
BPXA pleaded guilty to a misdemeanour violation of the US Federal
Water Pollution Control Act. BPXA paid a $12 million (gross) fine and
is subject to one-to-three years probation. BPXA also paid restitution
of $4 million (gross) to the State of Alaska and paid another $4 million
(gross) to the National Fish and Wildlife Foundation for Arctic
environmental research. The DOJ and the State of Alaska have agreed
not to bring any further criminal charges against BPXA in connection
with the March and August 2006 spills.
– On 2 June 2007, the Alaska Gasline Inducement Act (AGIA) was
passed into law. AGIA sets out the terms and conditions for
application for the exclusive right to build a natural gas pipeline to
transport North Slope gas to market. BP stated publicly that it cannot
submit a conforming bid under AGIA because of, in its view,
unresolved risks and uncertainties related to project costs, fiscal terms
and pipeline tariffs. BP continues to develop and assess options for
commercializing the major undeveloped gas resources on Alaska’s
North Slope.
– On 16 November 2007, the Alaska State Legislature passed a new
petroleum production tax law, which replaced the Petroleum
Production Tax legislation enacted in 2006. The new legislation
increases production taxes and is effective retrospectively from 1 July
2007. The key terms of the new production tax law include a base oil
tax rate of 25% on net profits, with progressive increases expected in
the oil tax rate as the net margin increases above $30/bbl. The new
production tax law will be governed by regulations to be defined and
promulgated in 2008 by the Alaska State Department of Revenue.
– On 26 December 2007, the Alaska Superior Court issued a ruling
reversing the 2006 decision by the Department of Natural Resources
(DNR) to terminate the Point Thomson Unit and remanded the matter
to the DNR to provide the leaseholders their constitutional due
process rights, including the right to a hearing. Although the judge’s
decision found that the DNR’s rejection of the latest plan of
development (POD) was supported by substantial evidence, the ruling
reinstated the leaseholders’ interests in the Point Thomson leases and
unit, and instructed the DNR to consider ‘good and diligent oil and
gas . . . production practices’ in shaping an appropriate remedy for the
rejected POD. The DNR is expected to call a hearing during the first
quarter of 2008.
– On 3 October 2007, the Endicott field achieved its 20th year of
production. Since start-up in 1987, Endicott has produced 500mmboe.
During 2007, Endicott commenced a technology trial programme that
is expected to progress BP’s LoSal2 Enhanced Oil Recovery process
from technology development to technology deployment. LoSal2 is a
patented technology that utililizes geochemically specific waters to
attack the larger remaining residual oils present after conventional
waterflooding. To gain partner approval for a full-field deployment, an
interwell programme has been started at Endicott. Results from this
programme are expected in the second half of 2008 and are expected
to lead to a full-field project commitment in 2009. The LoSal2
technology has implications for many fields beyond BP’s Alaska
portfolio and the work at Endicott and in Alaska will be extrapolated to
BP’s global portfolio.
– On 3 January 2008, the US Minerals Management Service approved
BP’s development and production plan for the Liberty field. During
2007, $25 million was spent on pre-project planning for Liberty,
including engineering, environmental studies and permit applications.
Development plans for Liberty, which lies offshore to the east of the
Endicott field, include ultra-extended reach wells to be drilled from
pads at Endicott and processing Liberty oil production through existing
Endicott facilities.
United Kingdom
We are the largest producer of oil, second largest producer of gas and
the largest overall producer of hydrocarbons in the UK. In 2007, total
liquids production was 201mb/d, a 20% decrease on 2006, and gas
production was 768mmcf/d, an 18% decrease on 2006. This decrease in
production was driven by natural decline and the unplanned shutdown of
the Central Area Transmission System (CATS) pipeline. Our activities in
the North Sea are focused on safe operations, efficient delivery of
production and midstream operations, in-field drilling and selected new
field developments. Our development expenditure (excluding midstream)
in the UK was $804 million in 2007, compared with $794 million in 2006
and $790 million in 2005.
Significant events in 2007 were:
– During the second quarter, we announced the decision not to proceed
with the decarbonized fuel DF1 project in Scotland. This project was
being led by BP, in partnership with Scottish and Southern Energy,
and would have produced hydrogen as a ‘decarbonized’ fuel for use in
power generation, with the carbon dioxide (CO2) gases being exported
to the Miller oil reservoir in the North Sea for increased oil recovery
and ultimate storage. Significant investment had been made in front-
end engineering and design activity. Development of the project was
originally planned to begin at the end of 2006 and required UK
government support. In May, the UK government announced that it
would not decide which carbon capture storage project to support
until 2008 at the earliest. The timing of this decision did not fit with
the DF1 project timeline, which was constrained by the maturity of
the Miller oil field, and therefore the decision was taken not to
proceed. The Miller field, which began production in 1992, has now
ceased production and decommissioning activity is in the planning
stage.
– We sanctioned the Dimlington Onshore Compression and Terminals
Integration project, a $250-million investment in new gas compression
facilities at the BP-operated Dimlington Terminal, which receives gas
from fields in the southern North Sea. This new equipment is
expected to reduce pipeline pressure between the offshore fields and
the terminal, allowing the gas fields to increase production. BP
expects remaining recoverable reserves in the West Sole and
Amethyst fields to increase by around 30% as a result of this project.
– In October, we announced changes to the structure of the North Sea
operations that are intended to simplify the organization and improve
the efficiency of work processes in response to the challenges of the
increasingly mature North Sea, where declining production and rapidly-
rising costs have created business conditions that are not sustainable
in the long term. The new structure will mean fewer organizational
units and reduced management layers. This will allow consolidation of
onshore non-technical support activities, leading to economies of scale
and reduced complexity.
Rest of Europe
Development expenditure (excluding midstream) in the Rest of Europe
was $443 million, compared with $214 million in 2006 and $188 million
in 2005.
BP ANNUAL REPORT AND ACCOUNTS 2007 21
Filename: U54368_doc3.3d Time: 14:49:36 Date: 25/02/08
Checksum: -1921506806
Norway
In 2007, our total production in Norway was 56mboe/d, a 15% decrease
on 2006. This decrease in production was driven by natural decline.
Significant activities were:
– Progress on the Valhall (BP 28.1% and operator) redevelopment
project continued during 2007. A new platform is scheduled to
become operational in 2010, with expected oil production capacity of
150mb/d and gas handling capacity of 175mmcf/d.
– In June, we announced the sanction of the combined Skarv and Idun
development. This development is located in the Norwegian Sea
approximately 200 kilometres west of Sandnessjøen. The fields will be
developed using a Floating Production Storage and Offloading vessel
(FPSO), subsea wells and an 80-kilometre gas export pipeline
connecting to the Asgard Transport System.
Netherlands
On 1 February 2007, we completed the sale of our exploration and
production and gas infrastructure business in the Netherlands to the Abu
Dhabi National Energy Company, TAQA. This included onshore and
offshore production assets and the onshore gas storage facility, Piek Gas
Installatie, at Alkmaar.
Rest of World
Development expenditure in Rest of World (excluding midstream) was
$5,045 million in 2007, compared with $4,522 million in 2006 and
$3,735 million in 2005.
Rest of Americas
Canada
– In Canada, our natural gas and liquids production was 52mboe/d in
2007, a decrease of 9% compared with 2006. The year-on-year
decrease in production is mainly due to natural field decline.
– In January 2008, we sanctioned the Noel Cadomin sweet gas project.
A total of 130 wells are planned to be drilled with first production
expected in 2009.
– The Mist Mountain coalbed gas project is in the appraisal stage, which
is expected to last for a number of years. The purpose of this stage is
to assess the viability of coalbed gas production in British Columbia’s
Crowsnest coalfield by proving technologies and practices that will
allow for the design of an environmentally sustainable commercial
project. We are seeking British Columbia government approval to
access public land for this project.
– On 5 December 2007, BP announced it had signed a memorandum of
understanding with Husky Energy Inc. to form an integrated North
American oil sands business. The transaction is expected to be
completed by the end of March 2008.
Trinidad
– In Trinidad, natural gas production volumes increased by 7.5% to
2,434mmcf/d in 2007. The increase was delivered as a result of
improved operating efficiency leading to increased throughput for
Atlantic LNG Train 4, increased demand from the domestic market,
full ramp up of the Cannonball field and the start-up of two new fields
in 2007. Liquids production declined by 10mb/d (25%) to 30mb/d in
2007 from 40mb/d in 2006 as a result of the natural decline from high
condensate fields.
– The Mango and Cashima fields reached first gas on 17 November
2007 and 15 December 2007 respectively. Mango and Cashima were
designed and built in Trinidad using a standardized design with 85% of
fabrication hours and 65% of project management hours contributed
by local Trinidad workers.
Venezuela
– In Venezuela, due to the transition to the incorporated joint venture
(IJV) entities in accordance with Venezuelan regulations that came into
force in 2006, 2007 was the first full year of reduced interest. As a
result of the aforementioned, and the OPEC quotas, our 2007 liquids
production decreased by 10mb/d compared with 2006.
– On 26 June 2007, BP agreed to the migration of the Cerro Negro
operations to an IJV without diluting its interest and signed a binding
memorandum of understanding reflecting agreement to the significant
terms and conditions for migration to, and operation of, the IJV.
Signature of the final conversion contract, and finalization of the rest
of the required procedures, is expected to take place in the first
quarter of 2008.
Colombia
– In Colombia, BP’s net production averaged 46mboe/d. The reduction
of 4mboe/d compared with 2006 is mainly due to natural field decline,
partially compensated by additional gas sales. The main part of the
production comes from the Cusiana, Cupiagua and Cupiagua South
fields, with increasing new production from the Cupiagua extension
into the Recetor Association Contract and the Florena and Pauto fields
in the Piedemonte Association Contract.
– In September, BP was awarded two offshore blocks in the Caribbean
that cover approximately 6,200 square kilometres. One block, RC4 (BP
35% and operator), will be a joint venture with state-owned Ecopetrol
and Petrobras, while BP will have sole rights to develop the other,
RC5 (BP 100% and operator).
– In December 2006, the Colombian Congress passed new legislation to
reduce corporate income taxes from 35% to 34% in 2007 and 33%
in 2008.
– After months of negotiations with Ecopetrol, agreement around
extension of the current association contracts was not reached.
However, new commercial agreements are in the final stages of
negotiation to allow partners to access new investment opportunities.
Argentina and Bolivia
– In Argentina and Bolivia, activity is conducted through Pan American
Energy (PAE), in which BP holds a 60% interest, and which is
accounted for by the equity method since it is jointly controlled. In
2007, total PAE gross production of 264mboe/d represented an
increase of 1% over 2006. This increase came from the continued
focus on drilling in Golfo San Jorge in Argentina. The field is now
producing at its highest level since inception in 1958 and further
expansion programmes are planned. PAE also has interests in gas
pipelines, electricity generation plants and other midstream
infrastructure assets.
– On 27 April, PAE entered into an agreement with the Argentine
province of Chubut, which provides for the concession term extension
and includes certain investment commitments related to exploration
and production on the Cerro Dragon block, located in Golfo San Jorge
basin. On 25 June, PAE signed a similar agreement with Santa Cruz
province. These are the first agreements entered into to extend the
term of concessions in Argentina, and were formalized under the
framework established by a law recently passed by the Argentine
Congress that will allow PAE to undertake long-term projects.
– On 13 July, PAE signed a loan agreement with the International
Finance Corporation (IFC) for the amount of $550 million. This loan will
be used to finance a programme of capital investment in the Cerro
Dragon block in Argentina. The last tranche will mature in April 2018.
– On 2 May, following notarization, the new agreements entered into by
PAE and other oil and gas companies with Yacimientos Petroliferos
Fiscales Bolivianos (YPFB) in Bolivia in November 2006 became
effective. These agreements are intended to run until 31 December
2026 and establish the commitment assumed by each of the
companies to supply the Bolivian domestic gas market. YPFB will be
responsible for marketing all hydrocarbons produced in Bolivia and for
determining the terms of relevant gas sales contracts. Along with
these changes, the volumes that Chaco (an exploration and production
company operated in Bolivia owned 50% by PAE and 50% by YPFB,
30% BP net) is allowed to export have been significantly increased
resulting in higher overall gas sales realizations for Chaco.
– In a continuation of changes made to the export tax since its inception
in 2002, the Argentine government issued a resolution in November
2007 increasing the export tax rate on oil when the international crude
oil price is US$60.9/bbl or higher.
22
Filename: U54368_doc3.3d Time: 14:49:36 Date: 25/02/08
Checksum: -1518432450
Africa
Algeria
– BP, through its joint operatorships of the In Salah Gas (33.15%) and In
Amenas (12.50%) projects, supplied 83bcf (BP net) of gas to markets
in Algeria and southern Europe during 2007, an increase of 33% from
2006 due to the ramp up of In Amenas during 2007. The CO2 capture
system, part of the In Salah project, is one of the world’s largest CO2
capture projects.
Angola
– In Angola, BP net production in 2007 was 139mboe/d, an increase of
5% from 2006 due to the start up of the Greater Plutonio, Marimba
and Rosa fields, and the ramp up of Dalia, more than offsetting PSA
changes in the Kizomba A, Kizomba B and Girassol fields.
– The first lifting from the Dalia field (BP 16.67%) was achieved during
the first quarter of 2007, with gross field production ramping up to
245mb/d by the end of 2007. The Dalia field was discovered in 1997.
It entered project execution phase in the first half of 2003 and
production began on 13 December 2006.
– During the second quarter, the Rosa project (BP 16.67%) achieved
first production. Discovered in January 1998, some 135 kilometres off
the coast of Angola in water depths of approximately 1,350 metres,
the Rosa field is located 15 kilometres away from the Girassol FPSO
to which it is tied back. It is the first deepwater field of this size to be
tied back to such a remote installation and in such water depths. Rosa
is expected to maintain the FPSO’s production capacity above
250mb/d until early in the next decade.
– Oil production at the Greater Plutonio offshore development area in
Block 18 began in October 2007. The five fields making up the Greater
Plutonio development were discovered between 1999 and 2001 in
water depths of up to 1,450 metres and it is the first BP-operated
asset in Angola (BP 50% and operator). The development utilizes an
FPSO connected to the wells by a large subsea system. The subsea
system is expected to ultimately encompass 43 wells and the longest
single-riser tower system of its kind in the world. Many components
of the project were constructed in Angola including the world’s largest
Caternary Anchor Leg Mooring (CALM) buoy.
– In October, production commenced from the Marimba North project
(BP 26.67%), in Block 15. The field is in approximately 1,300 metres
of water more than 145 kilometres off the coast of Angola. The
Marimba North project is a tie-back to the Kizomba A development.
The Marimba North production and control facilities have been
integrated with the existing Kizomba A development to effectively and
cost efficiently utilize the existing field facilities. Start-up of the field
was achieved safely without any production impact to the Kizomba A
operations.
– In the ultra deepwater Block 31 there were three exploration
successes, Miranda, Cordelia and Portia, bringing the total for Block
31 to 15. The Miranda well is located in a water depth of
approximately 2,436 metres, some 375 kilometres northwest of
Luanda. The Cordelia well is located in a water depth of approximately
2,308 metres, some 371 kilometres northwest of Luanda. The Portia
well is located in a water depth of approximately 2,012 metres, some
386 kilometres northwest of Luanda.
– In August, the Pazflor Project in Angola Block 17 (BP 16.67%) was
sanctioned. Pazflor will be a standalone FPSO development, the third
major production hub in Block 17, and is expected to deliver first oil in
2011. The development will be based on a new-build FPSO with
subsea wells, rigid flowlines and subsea processing.
– In January 2008, production began at the Mondo field (BP 26.67%) in
Block 15. Located in water depths of approximately 800 metres, the
field utilizes an FPSO and has a total of 36 subsea wells.
Egypt
– In Egypt, BP net production was 97mboe/d, an increase of 10% from
88mboe/d in 2006. This increase was mainly due to an increase in the
number of producing wells and the benefit of full-year production from
producing wells drilled in 2006.
– In Egypt, the Gulf of Suez Petroleum Company (GUPCO) (BP 50%), a
joint venture operating company between BP and the Egyptian
General Petroleum Corporation (EGPC), carries out our operated oil
and gas production operations. GUPCO operates eight PSAs in the
Gulf of Suez and Western Desert and one PSA in the Mediterranean
Sea, encompassing a total of more than 40 fields.
– Progress continued on the Saqqara field (BP 100%) development
project, with first production expected in 2008.
– Progress continued on the Egypt Gas Phase 1 (Taurt) (BP 50%)
development project, with first production expected in 2008.
– In January 2007, BP drilled a successful well, Giza North-1, in the
North Alexandria concession (BP 60% and operator) held by BP, RWE
DEA and EGPC/The Egyptian Natural Gas Holding Company (EGAS).
The Giza North-1 was drilled in 668 metres of water, some 56
kilometres offshore in the Pliocene formation where BP has made
three previous discoveries.
– In May 2007, BP drilled a successful well, Taurus Deep, in the North
Alexandria A Concession (BP 60% and operator) held by BP, RWE
DEA and EGPC. The Taurus Deep well was drilled in approximately
400 metres of water, some 70 kilometres offshore, and is in the
Middle Miocene formation.
– In January 2008, BP finished drilling a successful well, Satis-1, in the
North El Burg offshore concession (BP 50% and operator) held by BP,
IEOC and EGAS. The Satis-1 well was drilled in approximately 90
metres of water, some 50 kilometres offshore, and is in the Oligocene
formation.
– In December 2007, BP had first production from the Denise field
where it holds a 50% interest.
Libya
– In May, BP and its partner, the Libyan Investment Corporation (LIC)
signed a major exploration and production agreement with Libya’s
National Oil Company. The initial exploration commitment is set at a
minimum of $900 million with significant appraisal and development
expenditures dependent on exploration success. BP and the LIC will
explore over 53,000 square kilometres of the onshore Ghadames and
offshore frontier Sirt basins. Successful exploration could lead to the
drilling of around 20 appraisal wells. The agreement was ratified by
the Libyan General People’s Council on 23 December.
Asia Pacific
Indonesia
– BP produces crude oil and supplies natural gas to the island of Java
through its holding in the Offshore Northwest Java PSA (BP 46%). In
2007, BP net production was 39mboe/d, a decrease of 8.8% from
43mboe/d in 2006 as a result of a higher-than-forecasted base decline,
unplanned losses and the impact of higher realizations on the PSA.
– During 2007, development continued on the Tangguh LNG project (BP
37.2% and operator). The project development includes offshore
platforms, pipelines and an LNG plant with two production trains. First
commercial delivery is expected in early 2009.
Vietnam
– BP participates in one of the country’s largest projects with foreign
investment, the Nam Con Son gas project. This is an integrated
resource and infrastructure project, including offshore gas production,
a pipeline transportation system and power plant. In 2007, BP net
natural gas production was 82mmcf/d gross, a decrease of 15% over
2006. This decrease was mainly due to higher supply from another
gas field brought onstream in late 2006. Gas sales from Block 6.1 (BP
35% and operator) are made under a long-term agreement for
electricity generation in Vietnam, including the Phu My Phase 3 power
plant (BP 33.3%).
China
– In 2007, natural gas production was 85mmcf/d BP net, a decrease of
17% over 2006. This decrease was mainly due to the closure of a
Rate Acceleration Agreement with a key customer at the end of 2006.
BP ANNUAL REPORT AND ACCOUNTS 2007 23
Filename: U54368_doc3.3d Time: 14:49:36 Date: 25/02/08
Checksum: -1811883697
– The Yacheng offshore gas field (BP 34.3%) supplies, under a long-
term contract, 100% of the natural gas requirement of Castle Peak
Power Company, which provides around 50% of Hong Kong’s
electricity. Some natural gas is also piped to Hainan Island, where it is
sold to the Fuel and Chemical Company of Hainan, also under a long-
term contract.
– In March, the National People’s Congress reduced the rate of
corporation tax from 33% to 25% with effect from 1 January 2008.
Australia
– In Australia, BP net gas production in 2007 was 376mmcf/d, an
increase of 3.3% from 2006 due to increased domestic gas demand in
Western Australia. BP net liquids production at 34mb/d remained
unchanged from 2006.
– BP is one of seven partners in the North West Shelf (NWS) venture.
Six partners (including BP) hold an equal 16.7% interest in the
infrastructure and oil reserves and an equal 15.8% interest in the gas
and condensate reserves with a seventh partner owning the
remaining 5.32% of gas and condensate reserves. The operation
covers offshore production platforms, an FPSO, trunklines and
onshore gas processing plants. The NWS venture is currently the
principal supplier to the domestic market in Western Australia. During
2007, progress continued on the construction of a fifth LNG train
(4.7 million tonnes per year design capacity), with first throughput
expected in the second half of 2008.
Russia
TNK-BP
– TNK-BP, a joint venture between BP (50%) and Alfa Group and
Access-Renova (AAR) (50%), is an integrated oil company operating in
Russia and the Ukraine. The TNK-BP group’s major assets are held in
OAO TNK-BP Holding. Other assets include the BP-branded retail
sites in Moscow and the Moscow region and interests in OAO Rusia
Petroleum and the OAO Slavneft group. The workforce comprises
more than 60,000 people.
– BP’s investment in TNK-BP is held by the Exploration and Production
segment and the results of TNK-BP are accounted for under the
equity method in this segment.
– TNK-BP has proved reserves of 6.9 billion barrels of oil equivalent
(including its 49.9% equity share of Slavneft), of which 4.5 billion are
developed. In 2007, TNK-BP’s average liquids production was
1.7mmboe/d, a decrease of just over 5% compared with 2006,
reflecting the disposal of the Udmurt asset in 2006. The production
base is largely centred in West Siberia (Samotlor, Nyagan and
Megion), which contributes about 1.2mmboe/d, together with Volga
Urals (Orenburg) contributing some 0.4mmboe/d. About 44% of total
oil production is currently exported as crude oil and 19% as refined
product.
– Downstream, TNK-BP has interests in six refineries in Russia and the
Ukraine (including Ryazan and Lisichansk and Slavneft’s Yaroslavl
refinery), with throughput of approximately 35 million tonnes per year.
During December 2007, TNK-BP agreed to purchase additional retail
and other downstream assets in Russia and the Ukraine from a
number of small companies with completion due in 2008. TNK-BP
supplies approximately 1,600 branded filling stations in Russia and the
Ukraine and, with the additional sites, is expected to have more than
20% market share of the Moscow retail market.
– In January 2007, TNK-BP announced the purchase of Occidental’s
50% interest in the West Siberian joint venture, Vanyoganneft, for
$485 million. The transaction closed during the first quarter of 2007
and TNK-BP now owns 100% of the Vanyoganneft asset.
– On 22 June, BP and TNK-BP signed heads of terms to create strategic
business alliances with OAO Gazprom. Under the terms of this
agreement, TNK-BP agreed to sell to Gazprom its 62.89% stake in
OAO Rusia Petroleum, the company that owns the licence for the
Kovykta gas condensate field in East Siberia and its 50% interest in
East Siberia Gas Company (ESGCo). BP and TNK-BP have an option to
repurchase on market terms up to 25% + 1 share in OAO Rusia
Petroleum and up to 25% of ESGCo in the event that a strategic
business alliance is subsequently established with OAO Gazprom.
– In November 2006, following a review of the results of an inspection
by the licensing authorities that had resulted in a request for the
revocation of the two licences held by TNK-BP subsidiary Rospan
International, an agreed rectification plan was put in place. All the
Rospan licence compliance issues arising from the inspection by the
licensing authorities in 2006 are now substantially resolved.
Sakhalin
– BP participates in the KV licence area in offshore Sakhalin where it
conducts exploration activities through Elvaryneftegas (BP 49%), an
equity-accounted joint venture with Rosneft. Two discoveries have
been made to date in the KV licence area. BP also participates in joint
operations in two licence areas with Rosneft in East and West Shmidt
(BP 49%).
– Exploratory drilling continued in 2007 with the drilling of two wells in
the West Shmidt licence area. Both wells were found to be dry and,
as a result, BP wrote off all expenditures related to the West Shmidt
licence area.
– The 2008 work programme for the Sakhalin licence includes seismic
re-processing in the East Shmidt licence area and a 2D seismic
acquisition programme in the KV licence area. No drilling is planned
for 2008.
Other
Azerbaijan
– In Azerbaijan, BP net production in 2007 was 218mboe/d, an increase
of 50% from 2006 due to the ramping up of three Azeri oil producing
platforms and the Shah Deniz condensate gas platform commencing
production in 2007.
– BP, as operator of the Azerbaijan International Operating Company
(AIOC), manages and has a 34.1% interest in the Azeri-Chirag-
Gunashli (ACG) oil fields in the Caspian Sea, offshore Azerbaijan.
Phase 3 of the project, which will develop the deepwater Gunashli
area of ACG, remains on schedule to begin production in 2008 with
platform topsides having been completed in September 2007.
– BP is the operator of Shah Deniz (BP 25.5%), which is in the
Azerbaijan sector of the Caspian Sea and will deliver gas to markets in
Azerbaijan, Georgia and Turkey. First gas to Turkey was achieved in
July 2007. Production from the field is expected to continue to ramp
up as further wells are brought onstream. Plateau production from
Stage 1 is expected to be 6.9 billion cubic metres of gas per annum
and approximately 30,000 barrels of condensate per day.
– In November, we announced a further major new gas-condensate
discovery in the Shah Deniz field in the Caspian Sea. The SDX-04
exploration and appraisal well, some 70 kilometres south-east of Baku,
discovered a new deeper structure below the currently producing
reservoir. Drilled to a Caspian-record depth of more than 7,300 metres
in the south-western part of Shah Deniz, the well encountered gas
condensate in the main target horizons extending the field to the
south. The well also discovered a new high pressure reservoir in a
deeper structure.
Middle East and south Asia
– Production in the Middle East consists principally of the production
entitlement of associates in Abu Dhabi, where we have equity
interests of 9.5% and 14.7% in onshore and offshore concessions
respectively. In 2007, BP’s share of production in Abu Dhabi was
192mb/d, down 3% from 2006 as a result of a major planned
maintenance shutdown in the offshore concession in the fourth
quarter of 2007.
– In Pakistan, BP doubled its equity in the onshore Badin asset (BP
84%) as part of an international asset exchange with Occidental. As a
result of this transaction, BP net oil production in 2007 was
6.3mboe/d, an increase of 24% from 2006, and BP net gas production
was 122mmcf/d, an increase of 39.4% from 2006.
– In the third quarter of 2007, BP signed a farm-in agreement with
Petroleum Exploration (Private) Limited to obtain a 33% participating
24
Filename: U54368_doc3.3d Time: 14:49:37 Date: 25/02/08
Checksum: -847546308
interest in Blocks P, J and O in the deepwater Indus basin offshore
Pakistan.
– In January 2007, BP signed a major PSA with the Sultanate of Oman
to appraise sour ‘tight gas’ reservoirs in Block 61. Major contracts
were awarded in November with 3D seismic planned to commence in
the first quarter of 2008 and drilling in the fourth quarter of 2008. The
full appraisal programme is expected to take up to six years.
– In September, BP signed a memorandum of understanding with Oil
and Natural Gas Corporation Ltd of India regarding co-operation in
coalbed methane and deepwater offshore exploration.
Midstream activities
Oil and natural gas transportation
The group has direct or indirect interests in certain crude oil
transportation systems, the principal ones being the Trans Alaska
Pipeline System (TAPS) in the US and the Forties Pipelines System (FPS)
in the UK sector of the North Sea. We also operate the Central Area
Transmission System (CATS) for natural gas in the UK sector of the
North Sea.
BP, as operator, manages and holds a 30.1% interest in the Baku-
Tbilisi-Ceyhan (BTC) oil pipeline. BP, as operator of AIOC, also operates
the Western Export Route Pipeline between Azerbaijan and the Black
Sea coast of Georgia and the Azeri leg of the Northern Export Route
Pipeline between Azerbaijan and Russia. Revenue is earned on pipelines
through charging tariffs.
BP’s onshore US crude oil and product pipelines and related
transportation assets are included under Refining and Marketing (see
page 27).
Assets and activity during 2007 included:
Alaska
– BP owns a 46.9% interest in TAPS, with the balance owned by four
other companies. Production transported by TAPS from Alaska North
Slope fields averaged 738mb/d during 2007.
– Work on the strategic reconfiguration project to upgrade and automate
four pump stations continued to progress during 2007. This project
will install electrically-driven pumps at four critical pump stations,
combined with increased automation and upgraded control systems.
Two of the reconfigured pump stations came online during 2007, one
in the first quarter and another in the fourth quarter. The remaining
two reconfigured pump stations are expected to come online
sequentially in 2009 and 2010.
– There are a number of unresolved challenges lodged by instate
refiners, Tesoro and Flint Hills, against BP and the other TAPS carriers,
regarding intrastate tariffs charged for shipping oil through TAPS.
These challenges were filed between 1986 and 2003 with the
Regulatory Commission of Alaska (RCA). In 2002, the RCA
determined that TAPS transportation rates charged since the
beginning of 1997 have been excessive and that refunds should be
paid. Proceedings relating to transportation charges covering the
period between 1986 and mid-2003, including an appeal by BP and the
other TAPS carriers of the RCA’s 2002 determination, are progressing
through the Alaska judicial system. No significant refunds have been
paid pending the resolution of these matters in the courts. In the
interim, the RCA has imposed intrastate rates effective from 1 July
2003 that are consistent with its 2002 order. Intrastate transport
makes up roughly 7% of total TAPS throughput.
– Tariffs for interstate and intrastate transportation on TAPS are
calculated using the RCA and Federal Energy Regulatory Commission
(FERC)-accepted TAPS Settlement Methodology (TSM) entered into
with the State of Alaska in 1985. The State of Alaska, Anadarko and
Tesoro have challenged BP’s and the other TAPS carriers’ 2005, 2006
and 2007 interstate tariffs with the FERC, and the State of Alaska and
Anadarko have challenged BP’s and the other TAPS carriers’ 2008
tariffs with the FERC. The challengers assert that the interstate
transportation rates charged by BP (in accordance with the TSM) and
the other TAPS carriers, are excessive and discriminatory and in
violation of the Interstate Commerce Act, and that costs related to the
TAPS Strategic Reconfiguration project were imprudently incurred.
That portion of the challenges filed by the State, Anadarko and Tesoro
relating to the TAPS Strategic Reconfiguration project costs, together
with all aspects of the 2007 challenges, are being held in abeyance by
the FERC until its decision on 2005 and 2006 rates is issued. There
have been no proceedings in the recently filed challenges to BP’s
2008 FERC tariff. The FERC’s hearings on the consolidated
proceedings commenced in October 2006 and concluded in January
2007. On 17 May 2007, a FERC Administrative Law Judge issued an
Initial Decision as to 2005 and 2006 rates. This Initial Decision, which
was adverse to BP and the other TAPS carriers, is now under
consideration by the FERC Commissioners, who will issue the
decision of the FERC. Pending the decision of the FERC
Commissioners, BP is continuing to collect its TSM-based interstate
tariffs; however, our tariffs are subject to refund depending on the
decision of the FERC. Interstate transport makes up roughly 93% of
total TAPS throughput.
North Sea
– FPS (BP 100%) is an integrated oil and NGLs transportation and
processing system that handles production from more than 50 fields
in the Central North Sea. The system has a capacity of more than 1
million barrels per day, with average throughput in 2007 at 653mb/d.
The tie-in of the Buzzard field was completed, with first Buzzard
production flowing through the system in January 2007. The Greater
Kittiwake Area also joined the system in late 2007.
– BP operates and has a 29.5% interest in CATS, a 400-kilometre
natural gas pipeline system in the central UK sector of the North Sea.
The pipeline has a transportation capacity of 1,700mmcf/d to a natural
gas terminal at Teesside in north-east England. CATS offers natural
gas transportation and processing services. In 2007, throughput was
778mmcf/d (gross), 230mmcf/d (net). During September, the CATS
pipeline resumed operation after divers installed a metal sleeve at the
location where a large vessel had dragged its anchor causing damage
to the pipeline. The pipeline was shutdown for 10 weeks resulting in a
loss of production of 11mboe/d for the year.
– BP operates the Dimlington/Easington gas processing terminal (BP
100%) on Humberside and the Sullom Voe oil and gas terminal in
Shetland.
Asia (including the former Soviet Union)
– BP, as operator, manages and holds a 30.1% interest in the BTC oil
pipeline. The 1,768-kilometre pipeline has a capacity of 1mmboe/d
from the BP-operated ACG oil field in the Caspian Sea to the eastern
Mediterranean port of Ceyhan. In the first quarter of 2007, the BTC
pipeline celebrated the loading of its 100-millionth barrel at the Ceyhan
terminal and loaded its 250th tanker in October 2007.
– Transportation of first gas to Turkey from Shah Deniz in Azerbaijan via
the South Caucasus Pipeline was achieved in July 2007. BP is
technical operator and holds a 25.5% interest.
– Through the LukArco joint venture, BP holds a 5.75% interest (with a
25% funding obligation) in the Caspian Pipeline Consortium (CPC)
pipeline. CPC is a 1,510-kilometre pipeline from Kazakhstan to the
Russian port of Novorossiysk and carries crude oil from the Tengiz
field (BP 2.3%). In addition to our interest in LukArco, we hold a
separate 0.87% interest (3.5% funding obligation) in CPC through a
49% holding in Kazakhstan Pipeline Ventures. In 2007, CPC total
throughput reached 33.03 million tonnes. During 2007, shareholders
agreed to restore the profitability of CPC by increasing the CPC tariff
and cutting interest rates on shareholder loans. Negotiations
continued between the CPC shareholders on an expansion plan and a
plan for financial restructuring. The expansion would require the
construction of 10 additional pump stations, additional storage
facilities and a third offshore mooring point.
Liquefied natural gas
Within BP, Exploration and Production is responsible for the supply of
LNG. BP’s Exploration and Production segment has interests in four
major LNG plants: the Atlantic LNG plant in Trinidad (BP 34% in Train 1,
42.5% in each of Trains 2 and 3 and 37.8% in Train 4); in Indonesia,
BP ANNUAL REPORT AND ACCOUNTS 2007 25
Filename: U54368_doc3.3d Time: 14:49:37 Date: 25/02/08
Checksum: 770489094
through our interests in the Sanga-Sanga PSA (BP 38%), which supplies
natural gas to the Bontang LNG plant, and Tangguh PSA (BP 37.2%),
which is under construction; and in Australia through our share of LNG
from the NWS natural gas development (BP 16.7% infrastructure and oil
reserves and 15.8% gas and condensate reserves).
Assets and activity during 2007 included:
– In Trinidad, the Atlantic LNG Train 4 (BP 37.8%) is the largest
producing LNG train in the world and is designed to produce 5.2
million tonnes (253,000mmcf) per year of LNG. BP expects to
continue to supply at least two-thirds of the gas to the train. The
Atlantic LNG Trains 2, 3, and 4 facilities are operated under a tolling
arrangement, with the equity owners retaining ownership of their
respective gas. The LNG is sold in the US, Dominican Republic and
other destinations. BP’s net share of the capacity of Atlantic LNG
Trains 1, 2, 3 and 4 is 6.5 million tonnes (310,000mmcf) of LNG per
year.
– In Indonesia, BP is involved in two of the three LNG centres in the
country. BP participates in Indonesia’s LNG exports through its
holdings in the Sanga-Sanga PSA (BP 38%). Sanga-Sanga currently
delivers around 14% of the total gas feed to Bontang, one of the
world’s largest LNG plants. The Bontang plant produced 18.4 million
tonnes (831,000mmcf) of LNG in 2007, compared with 19.5 million
tonnes in 2006.
– Also in Indonesia, BP has interests in the Tangguh LNG joint venture
(BP 37.2% and operator) and in each of the Wiriagar (BP 38% and
operator), Berau (BP 48% and operator) and Muturi (BP 1%) PSAs in
north-west Papua that are expected to supply feed gas to the
Tangguh LNG plant. During 2007, construction continued on two
trains, with commercial delivery planned in early 2009. Tangguh will
be the third LNG centre in Indonesia, with an initial capacity of 7.6
million tonnes (388,000mmcf) per year. Tangguh has signed sales
contracts for delivery to China, Korea and North America’s west coast.
– In Australia, we are one of seven partners in the NWS venture. Six
partners (including BP) hold an equal 16.7% interest in the
infrastructure and oil reserves and an equal 15.78% interest in the gas
and condensate reserves, with a seventh partner owning the
remaining 5.32% of gas and condensate reserves. The joint venture
operation covers offshore production platforms, an FPSO, trunklines,
onshore gas and LNG processing plants and LNG carriers.
Construction continued during 2007 on a fifth LNG train that is
expected to process 4.7 million tonnes of LNG per year and is
expected to increase the plant’s capacity to 16.6 million tonnes per
year. The train is expected to be commissioned during the second half
of 2008. NWS produced 1.96 million tonnes (102,000mmcf) of LNG,
equal to 2006 production.
– We have a 10% equity shareholding in the Abu Dhabi Gas
Liquefaction Company, which in 2007 supplied 5.6 million tonnes
(272,710mmcf) of LNG, up 4.2% on 2006.
– BP has a 13.6% share in the Angola LNG project, which is expected
to receive approximately one billion cubic feet of associated gas per
day from offshore producing blocks and produce 5.2 million tonnes
per year of LNG, as well as related gas liquids products, with first LNG
expected in 2012. With the completion of the necessary agreements
and the approval of the Angolan government, the project investors
have authorized Angola LNG Limited to proceed with the construction
and implementation of the project.
26

Filename: U54368_doc3.3d Time: 14:49:37 Date: 25/02/08
Checksum: 1149751297
BP ANNUAL REPORT AND ACCOUNTS 2007 27
Refining and Marketing
Our Refining and Marketing business is responsible for the supply and
trading, refining, manufacturing, marketing and transportation of crude
oil, petroleum and chemicals products to wholesale and retail customers.
BP markets its products in more than 100 countries. We operate
primarily in Europe and North America but also manufacture and market
our products across Australasia and in parts of Asia, Africa and Central
and South America.
Key statistics $ million------------------------------------------------------------------------------------------------------------------------------- -----------------
2007 2006 2005------------------------------------------------------------------------------------------------------------------------------- -----------------
Sales and other operating revenues
for continuing operations 250,866 232,855 213,326
Profit before interest and tax from
continuing operationsa 6,072 5,041 6,926
Total assets 95,691 80,964 77,485
Capital expenditure and acquisitions 5,586 3,144 2,860
$ per barrel------------------------------------------------------------------------------------------------------------------------------- -----------------
Global Indicator Refining Marginb 9.94 8.39 8.60
a Profit before interest and tax from continuing operations includes profit afterinterest and tax of equity-accounted entities.
b The Global Indicator Refining Margin (GIM) is the average of regional industryindicator margins, which we weight for BP’s crude refining capacity in each region.Each regional indicator margin is based on a single representative crude withproduct yields characteristic of the typical level of upgrading complexity. Therefining margins are industry-specific rather than BP-specific measures, which webelieve are useful to investors in analyzing trends in the industry and their impacton our results. The margins are calculated by BP based on published crude oil andproduct prices and take account of fuel utilization and catalyst costs. No account istaken of BP’s other cash and non-cash costs of refining, such as wages and salariesand plant depreciation. The indicator margin may not be representative of themargins achieved by BP in any period because of BP’s particular refiningconfigurations and crude and product slate.
The key components of sales and other operating revenues are explained
in more detail below.
$ million------------------------------------------------------------------------------------------------------------------------------- -----------------
2007 2006 2005------------------------------------------------------------------------------------------------------------------------------- -----------------
Sale of crude oil through spot and
term contracts 43,004 38,577 36,992
Marketing, spot and term sales of
refined products 194,979 177,995 155,098
Other sales including non-oil and to
other segments 12,883 16,283 21,236------------------------------------------------------------------------------------------------------------------------------- -----------------
250,866 232,855 213,326
thousand barrels per day------------------------------------------------------------------------------------------------------------------------------- -----------------
Sale of crude oil through spot and
term contracts 1,885 2,110 2,464
Marketing, spot and term sales of
refined products 5,624 5,801 5,888
The Refining and Marketing segment includes Refining, Fuels Marketing,
Lubricants and Aromatics & Acetyls. Our strategy is to continue our
focused investment in key assets and market positions with an increased
focus on process safety, integrity and reliability following the operational
issues at the Texas City and Whiting refineries. We aim to improve the
quality and capability of our manufacturing portfolio. During the past five
years, this has been taking place through upgrades of existing conversion
units at several of our facilities and investment in new clean fuels units at
most of our refineries. In 2007, we completed a major upgrade to the
olefin cracker at the Gelsenkirchen refinery in Germany and an upgrade
of an existing diesel hydrotreater at the Rotterdam refinery in the
Netherlands. During the next five years, we expect to upgrade further
our refining portfolio through the construction of a new coker at the
Castellon refinery, a planned and announced investment in the Whiting
refinery to increase its ability to process Canadian heavy crude, upgrades
to diesel and gasoline desulphurization capability at the Rotterdam
refinery in the Netherlands, the installation of modern naphtha reforming
technology at several refineries globally, the site reconfiguration and
installation of a new hydrocracker at the Bayernoil refinery in Germany
and the full recommissioning of the Texas City refinery in the US.
Our marketing businesses generate customer value by providing
quality products and offers. Our retail network provides differentiated fuel
and convenience offers to some of the most attractive markets. Our
lubricants brands offer customers benefits through technology and
relationships and we focus on increasing brand and product loyalty in
Castrol lubricants. We continue to build deep customer relationships and
strategic partnerships in the business-to-business sector. Marketing also
includes the Aromatics & Acetyls business, which maintains world-class
manufacturing positions globally, with an emphasis on the Asian market,
particularly in China. At the end of 2007, the business increased its
capacity in China by successfully commencing the commissioning of a
new 900 thousand tonnes per annum (ktepa) worldscale purified
terephthalic acid (PTA) plant at Zhuhai.
The segment manages a portfolio of assets that we believe are
competitively advantaged across the chain of downstream activities.
Such advantage may derive from several factors, including location (such
as the proximity of manufacturing assets to markets), operating cost and
physical asset quality.
We are one of the major refiners of gasoline and hydrocarbon products
in the US, Europe and Australia. We have significant retail and business-
to-business market positions in the US, UK, Germany and the rest of
Europe, Australasia, Africa and Asia. We are enhancing our presence in
China and exploring opportunities in India.
During 2007, significant events were:
– BP continued recommissioning the Texas City refinery in the US. By
the end of 2007, we had successfully recommissioned the three
desulphurization and upgrading units necessary to allow restart of the
remaining crude distillation capacity. The final sour crude unit is
mechanically complete and is expected to be fully operational during
the first quarter of 2008. By mid-2008, we expect most of the
economic capability at the Texas City refinery to have been restored.
– On 23 March 2007, a fire at the Whiting refinery in the US caused
damage to the hydrogen compressors and limited the site’s
throughput and ability to make low-sulphur gasoline or diesel fuel from
sour crude oil. By the end of 2007, the Whiting refinery had
recommenced sour crude processing and available distillation capacity
exceeded 300,000b/d.
– On 1 February 2007, BP announced it had selected the University of
California Berkeley, and its partners the University of Illinois at Urbana-
Champaign and the Lawrence Berkeley National Laboratory, to join in
the previously announced $500-million research programme to explore
how bioscience can be used to increase energy production and reduce
the impact of energy consumption on the environment.
– On 31 March 2007, BP completed its acquisition of Chevron’s
Netherlands manufacturing company, Texaco Raffinaderij Pernis B.V.,
for $1.1 billion. The acquisition included Chevron’s 31% interest in the
Rotterdam (Nerefco) refinery.
– On 31 May 2007, BP completed the sale of its Coryton refinery in the
UK to Petroplus Holdings AG for consideration of $1.4 billion, plus
working capital.
– On 26 June 2007, BP, Associated British Foods and DuPont
announced an investment of $400 million in the construction of a
world-scale bioethanol plant with expected annual production capacity
of some 420 million litres from wheat feedstock, expected to be
commissioned in late 2009.
– On 29 June 2007, BP announced a joint venture with D1 Oils plc, a
UK-based global producer of biodiesel, for the development of
jatropha as a new energy crop.
– On 15 November 2007, BP announced that it would sell all of its
company-owned and company-operated convenience sites in the US.
The majority of sites will be sold to franchisees with the remaining
sites sold to dealers and large distributors (jobbers). The sale of the
sites is expected to be completed by the end of 2009. The sites will
continue to market BP-branded fuels in the eastern US and ARCO-
branded fuels in the western US. The franchise agreement is for 20
Filename: U54368_doc3.3d Time: 14:49:37 Date: 25/02/08
Checksum: 1399493954
28
years and requires sites to be supplied with BP or ARCO-branded
fuels for the term of the contract.
– In December 2007, the second PTA plant at the BP Zhuhai Chemical
Company Limited site in Guangdong province, China, successfully
commenced commissioning.
– On 5 December 2007, BP announced it had agreed to create an
integrated North American oil sands business with Husky Energy Inc.,
by means of two separate joint ventures. In one, BP will take a 50%
interest in Husky Energy’s Sunrise field in Alberta, Canada, while in
the other, Husky will take a 50% interest in BP’s Toledo refinery,
between them forming an integrated North American oil sands
business. As part of this agreement, and subject to negotiation of final
agreements and obtaining the necessary approvals and permits, the
Toledo refinery is intended to be expanded to process approximately
170mb/d of heavy oil and bitumen by 2015.
– BP continued to progress the planning for the previously mentioned
investment in Canadian heavy crude oil processing capability at its
Whiting refinery. This project is expected to reposition Whiting
competitively as a top-tier refinery by increasing its Canadian heavy
crude processing capability by 260mb/d and modernizing it with
equipment of significant size and scale.
– In mid-January 2008, BP and Sinopec signed a memorandum of
understanding to add a new 650ktepa acetic acid plant at their
YARACO joint venture in Chongqing, upstream Yangtze River, south-
west China. This world-scale acetic acid plant, using BP’s leading
Cativa2 technology, is expected to come onstream in 2011.
Resegmentation in 2008
With effect from 1 January 2008:
– The Emerging Consumers Marketing Unit was transferred from
Refining and Marketing to Alternative Energy (which is reported in
Other businesses and corporate).
– The Biofuels business was transferred from Refining and Marketing to
Alternative Energy (which is reported in Other businesses and
corporate).
– The Shipping business was transferred from Refining and Marketing
to Other businesses and corporate.
Texas City refinery
On 23 March 2005, an explosion and fire at the Texas City refinery
occurred in the isomerization unit as the unit was starting up after routine
planned maintenance. The incident claimed the lives of 15 workers and
injured many others.
Throughout 2007, BP continued to implement the process safety
enhancement programme it initiated in response to the March 2005
incident, which included policies, practices and activities to address a
number of the factors that contributed to the incident, including the siting
of occupied portable buildings and the removal of blow-down stacks
handling heavier-than-air light hydrocarbons. BP also implemented,
across its US refining system and at other facilities worldwide, a number
of additional actions relating to safety and operations, atmospheric relief
valves, operating procedures and training, control of work systems, and
process safety culture and leadership. In the US, BP has committed to
increase spending to an average of $1.7 billion per year through 2010 to
improve the integrity and reliability of its refining assets and has created
an operations advisory board to assist BP America Inc.’s management in
monitoring and assessing BP’s US operations.
Governmental investigations
In 2007, BP continued its co-operation with the governmental entities
investigating the Texas City incident, including the US Department of
Justice (DOJ), the US Environmental Protection Agency (EPA), the US
Occupational Safety and Health Administration (OSHA), the US Chemical
Safety and Hazard Investigation Board (CSB) and the Texas Commission
on Environmental Quality (TCEQ). On 25 October 2007, the DOJ
announced that it had entered into a criminal plea agreement with BP
Products North America Inc. (BP Products) related to the March 2005
explosion and fire. On 4 February 2008, BP Products pleaded guilty in
federal court, pursuant to the plea agreement, to one felony violation of
the risk management planning regulations promulgated under the US
federal Clean Air Act. At the plea hearing, the court advised that it would
take the matter under review and decide whether to accept or reject the
plea. If the court accepts the agreement, BP Products will pay a
$50 million criminal fine and serve three years’ probation. Separately, BP
Products reached a civil settlement in principle with the EPA and the
DOJ related to issues identified in EPA inspections that followed the
March 2005 incident. BP expects the settlement to be finalized in 2008.
The CSB issued its final report on the Texas City incident in March
2007. Although BP disagreed with some of the findings and conclusions
in the report, BP gave full and careful consideration to the CSB’s
recommendations and committed to implement actions in alignment
with each of the CSB’s recommendations. BP has many activities under
way, including activities around reporting health and safety and
operational incidents, and incident investigation, in response to the
recommendations of the BP US Refineries Independent Safety Review
Panel (the panel) (see below) to improve process safety, both at Texas
City (as recommended by the CSB) and across the group. BP and the
CSB continue to discuss BP’s responses with the objective of the CSB
agreeing to close out its recommendations.
Civil tort actions
A large number of civil claims have arisen from the Texas City incident,
for which BP has set aside $2,125 million in aggregate. Thus far, BP has
reached more than 2,000 settlements in respect of all the fatalities and
many of the personal injury claims arising from the incident. A number of
claims remain to be resolved.
See Legal proceedings on page 84 for further information.
Report of the BP US Refineries Independent Safety Review Panel
The panel was established by BP in 2005 at the recommendation of the
CSB to assess the effectiveness of safety management systems at BP’s
five US refineries and the corporate safety culture. The panel, which was
chaired by the former US Secretary of State, James A Baker, III, issued
its report in January 2007. Although the panel did not specifically
investigate the Texas City incident or seek to determine its causes, the
report contained observations applicable to all of BP’s US refineries,
including Texas City. The panel’s report acknowledged the measures
taken by BP since the Texas City incident, including dedicating significant
resources and personnel in an effort to improve the process safety
performance of BP’s US refineries. The panel’s report can be found at
www.bp.com/bakerpanelreport. BP accepted the 10 recommendations
of the panel and began (or, in some cases, continued) improvement
activities addressing a number of the recommendations, including
consistent implementation of risk identification tools, improvements in
incident reporting and investigation systems, and enhancements to the
group’s reporting and monitoring programmes. At the panel’s
recommendation, in May 2007, the BP board also appointed an
independent expert to monitor progress in implementing the panel’s
recommendations to improve safety performance at BP’s US refineries.
The independent expert, L. Duane Wilson, who was a member of the
panel, reports directly to the BP board’s safety, ethics and environment
assurance committee.
In addition to these direct responses to the panel’s recommendations,
BP has also taken a number of additional steps that are in line with the
spirit of the panel’s report. BP has developed a comprehensive
programme to implement the panel’s recommendations within its US
refining system and to share learnings from the panel throughout the
refining system. This programme makes use of the newly developed
group-wide operating management system (OMS). Each refinery is
creating an implementation plan to reduce process safety risk on a
continuous improvement basis and to provide for the future
implementation of OMS. In 2007, BP also reached an agreement in
principle with the United Steel Workers Union to work jointly on a
10-point plan to improve process safety across the four represented
US refineries.
Filename: U54368_doc3.3d Time: 14:49:37 Date: 25/02/08
Checksum: 966206354
BP ANNUAL REPORT AND ACCOUNTS 2007 29
Other regulatory actions
OSHA
In January 2007, OSHA began a new inspection at the Texas City refinery
focusing on relief valves, flare capacity and other process safety issues at
one of the catalytic cracking units. OSHA issued citations in July 2007
with a total penalty of $92,000. Separately, OSHA has questioned
whether the process safety management expert (AcuTech), appointed in
connection with the September 2005 settlement agreement with OSHA,
adequately reviewed equipment pressure relief valve issues. BP has
entered into negotiations to resolve the cracking unit citations and, in the
interim, has agreed to the assignment of this case to a settlement judge.
On 16 January 2008, BP addressed OSHA’s concerns regarding the
September 2005 settlement agreement by agreeing to retain an expert
relief system consultant to audit individual hydrocarbon relief devices and
flare systems on two units and to share the consultant’s findings with
OSHA.
In September 2007, BP and OSHA entered into a settlement
agreement related to citations stemming from OSHA’s inspection of the
Toledo refinery in 2005. OSHA granted final approval of the settlement in
November 2007.
BP is attempting to negotiate a settlement relating to citations, with a
total penalty of $384,000, stemming from Indiana OSHA’s inspection of
the Whiting refinery in 2006, but the case is still pending. In August
2007, Indiana OSHA initiated a separate inspection relating to an April
2007 incident that resulted in a crude unit shutdown and the release of
40,000 pounds of hydrocarbons. On 30 January 2008, OSHA issued a
safety order that alleges two violations, for a total penalty of $10,000.
OSHA conducted an inspection related to the death of a contract diver
at the Cherry Point refinery in August 2007. OSHA concluded its
investigation in October 2007 and informed BP that no citations would be
issued to it.
In January 2008, an employee died at Texas City refinery. This incident
is currently being investigated by BP, OSHA and the CSB.
EPA
The EPA has asked the DOJ to file a civil lawsuit based on inspections it
conducted at the Whiting, Toledo, Cherry Point and Carson refineries
following the March 2005 Texas City incident. BP Products and the EPA/
DOJ have begun settlement negotiations in an effort to avoid litigation of
the matter.
Refining
The group’s global refining strategy is to own and operate strategically
advantaged refineries that benefit from vertical integration with our
marketing and trading operations, as well as horizontal integration with
other parts of the group’s business. Refining’s focus is to maintain and
improve its competitive position through sustainable, safe, reliable and
efficient operations of the refining system and disciplined investment for
growth.
For BP, the strategic advantage of a refinery relates to its location,
scale and configuration to produce fuels from lower-cost feedstocks in
line with the demand of the region. Strategic investments in our
refineries are focused on securing the safety and reliability of our assets
while improving our competitive position. In addition, we continue to
invest to develop the capability to produce the cleaner fuels that meet
the requirements of our customers and their communities.
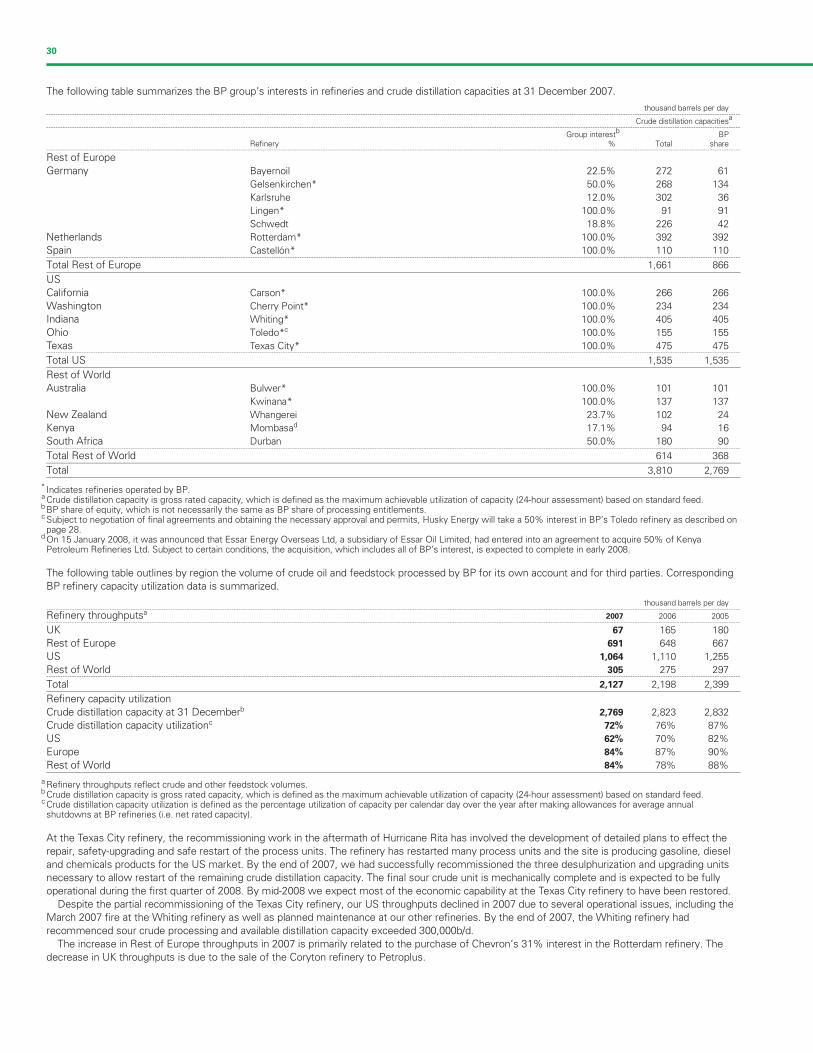
Filename: U54368_doc3.3d Time: 14:49:38 Date: 25/02/08
Checksum: 992002411
30
The following table summarizes the BP group’s interests in refineries and crude distillation capacities at 31 December 2007.
thousand barrels per day--------------------------------------------------------------------------------------------------------------------------------------------------------------------------------------------------------------------------------------------------------------------------------------------------------
aCrude distillation capacities--------------------------------------------------------------------------------------------------------------------------------------------------------------------------------------------------------------------------------------------------------------------------------------------------------
bGroup interest BP
Refinery % Total share--------------------------------------------------------------------------------------------------------------------------------------------------------------------------------------------------------------------------------------------------------------------------------------------------------
Rest of Europe
Germany Bayernoil 22.5% 272 61
Gelsenkirchen* 50.0% 268 134
Karlsruhe 12.0% 302 36
Lingen* 100.0% 91 91
Schwedt 18.8% 226 42
Netherlands Rotterdam* 100.0% 392 392
Spain Castellon* 100.0% 110 110--------------------------------------------------------------------------------------------------------------------------------------------------------------------------------------------------------------------------------------------------------------------------------------------------------
Total Rest of Europe 1,661 866
US
California Carson* 100.0% 266 266
Washington Cherry Point* 100.0% 234 234
Indiana Whiting* 100.0% 405 405
Ohio Toledo*c 100.0% 155 155
Texas Texas City* 100.0% 475 475--------------------------------------------------------------------------------------------------------------------------------------------------------------------------------------------------------------------------------------------------------------------------------------------------------
Total US 1,535 1,535
Rest of World
Australia Bulwer* 100.0% 101 101
Kwinana* 100.0% 137 137
New Zealand Whangerei 23.7% 102 24
Kenya Mombasad 17.1% 94 16
South Africa Durban 50.0% 180 90--------------------------------------------------------------------------------------------------------------------------------------------------------------------------------------------------------------------------------------------------------------------------------------------------------
Total Rest of World 614 368
Total 3,810 2,769
* Indicates refineries operated by BP.a Crude distillation capacity is gross rated capacity, which is defined as the maximum achievable utilization of capacity (24-hour assessment) based on standard feed.b BP share of equity, which is not necessarily the same as BP share of processing entitlements.c Subject to negotiation of final agreements and obtaining the necessary approval and permits, Husky Energy will take a 50% interest in BP’s Toledo refinery as described onpage 28.
d On 15 January 2008, it was announced that Essar Energy Overseas Ltd, a subsidiary of Essar Oil Limited, had entered into an agreement to acquire 50% of KenyaPetroleum Refineries Ltd. Subject to certain conditions, the acquisition, which includes all of BP’s interest, is expected to complete in early 2008.
The following table outlines by region the volume of crude oil and feedstock processed by BP for its own account and for third parties. Corresponding
BP refinery capacity utilization data is summarized.
thousand barrels per day--------------------------------------------------------------------------------------------------------------------------------------------------------------------------------------------------------------------------------------------------------------------------------------------------------
Refinery throughputsa2007 2006 2005
--------------------------------------------------------------------------------------------------------------------------------------------------------------------------------------------------------------------------------------------------------------------------------------------------------
UK 67 165 180
Rest of Europe 691 648 667
US 1,064 1,110 1,255
Rest of World 305 275 297--------------------------------------------------------------------------------------------------------------------------------------------------------------------------------------------------------------------------------------------------------------------------------------------------------
Total 2,127 2,198 2,399
Refinery capacity utilization
Crude distillation capacity at 31 Decemberb 2,769 2,823 2,832
Crude distillation capacity utilizationc 72% 76% 87%
US 62% 70% 82%
Europe 84% 87% 90%
Rest of World 84% 78% 88%
a Refinery throughputs reflect crude and other feedstock volumes.b Crude distillation capacity is gross rated capacity, which is defined as the maximum achievable utilization of capacity (24-hour assessment) based on standard feed.c Crude distillation capacity utilization is defined as the percentage utilization of capacity per calendar day over the year after making allowances for average annualshutdowns at BP refineries (i.e. net rated capacity).
At the Texas City refinery, the recommissioning work in the aftermath of Hurricane Rita has involved the development of detailed plans to effect the
repair, safety-upgrading and safe restart of the process units. The refinery has restarted many process units and the site is producing gasoline, diesel
and chemicals products for the US market. By the end of 2007, we had successfully recommissioned the three desulphurization and upgrading units
necessary to allow restart of the remaining crude distillation capacity. The final sour crude unit is mechanically complete and is expected to be fully
operational during the first quarter of 2008. By mid-2008 we expect most of the economic capability at the Texas City refinery to have been restored.
Despite the partial recommissioning of the Texas City refinery, our US throughputs declined in 2007 due to several operational issues, including the
March 2007 fire at the Whiting refinery as well as planned maintenance at our other refineries. By the end of 2007, the Whiting refinery had
recommenced sour crude processing and available distillation capacity exceeded 300,000b/d.
The increase in Rest of Europe throughputs in 2007 is primarily related to the purchase of Chevron’s 31% interest in the Rotterdam refinery. The
decrease in UK throughputs is due to the sale of the Coryton refinery to Petroplus.
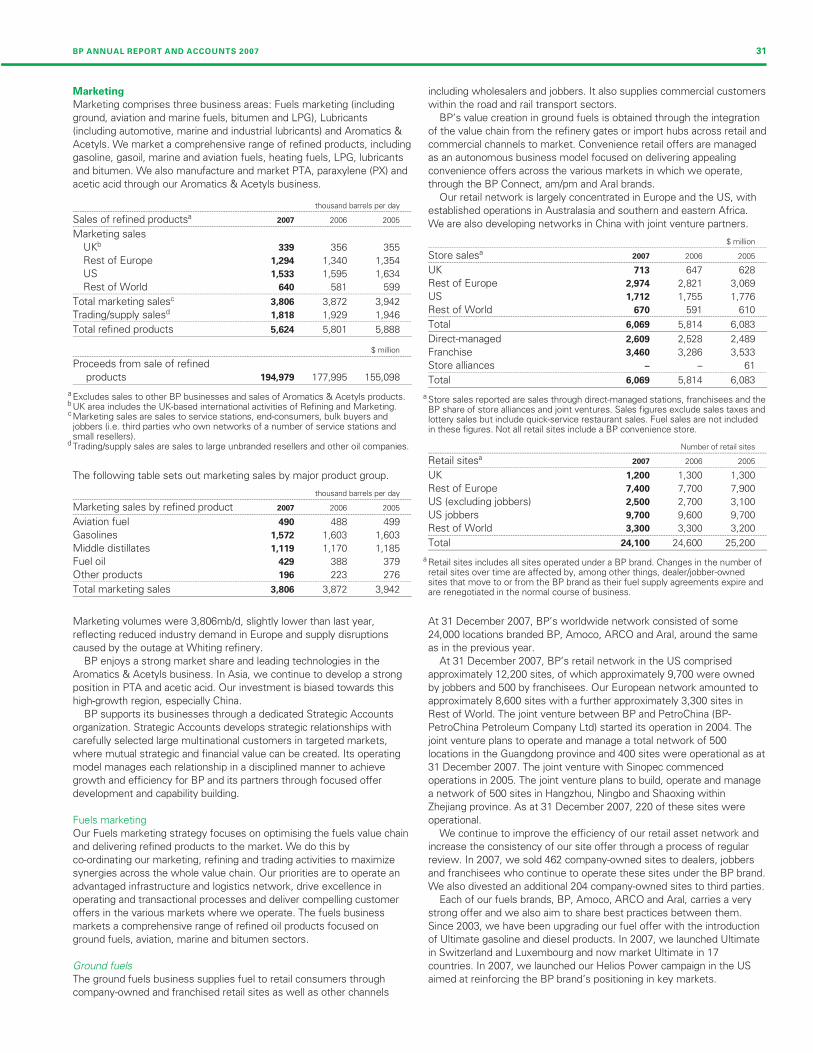
Filename: U54368_doc3.3d Time: 14:49:38 Date: 25/02/08
Checksum: 1004150042
BP ANNUAL REPORT AND ACCOUNTS 2007 31
Marketing
Marketing comprises three business areas: Fuels marketing (including
ground, aviation and marine fuels, bitumen and LPG), Lubricants
(including automotive, marine and industrial lubricants) and Aromatics &
Acetyls. We market a comprehensive range of refined products, including
gasoline, gasoil, marine and aviation fuels, heating fuels, LPG, lubricants
and bitumen. We also manufacture and market PTA, paraxylene (PX) and
acetic acid through our Aromatics & Acetyls business.
thousand barrels per day------------------------------------------------------------------------------------------------------------------------------- -----------------
Sales of refined productsa2007 2006 2005
------------------------------------------------------------------------------------------------------------------------------- -----------------
Marketing sales
UKb 339 356 355
Rest of Europe 1,294 1,340 1,354
US 1,533 1,595 1,634
Rest of World 640 581 599------------------------------------------------------------------------------------------------------------------------------- -----------------
Total marketing salesc 3,806 3,872 3,942
Trading/supply salesd 1,818 1,929 1,946------------------------------------------------------------------------------------------------------------------------------- -----------------
Total refined products 5,624 5,801 5,888
$ million------------------------------------------------------------------------------------------------------------------------------- -----------------
Proceeds from sale of refined
products 194,979 177,995 155,098
a Excludes sales to other BP businesses and sales of Aromatics & Acetyls products.b UK area includes the UK-based international activities of Refining and Marketing.c Marketing sales are sales to service stations, end-consumers, bulk buyers andjobbers (i.e. third parties who own networks of a number of service stations andsmall resellers).
d Trading/supply sales are sales to large unbranded resellers and other oil companies.
The following table sets out marketing sales by major product group.
thousand barrels per day------------------------------------------------------------------------------------------------------------------------------- -----------------
Marketing sales by refined product 2007 2006 2005------------------------------------------------------------------------------------------------------------------------------- -----------------
Aviation fuel 490 488 499
Gasolines 1,572 1,603 1,603
Middle distillates 1,119 1,170 1,185
Fuel oil 429 388 379
Other products 196 223 276------------------------------------------------------------------------------------------------------------------------------- -----------------
Total marketing sales 3,806 3,872 3,942
Marketing volumes were 3,806mb/d, slightly lower than last year,
reflecting reduced industry demand in Europe and supply disruptions
caused by the outage at Whiting refinery.
BP enjoys a strong market share and leading technologies in the
Aromatics & Acetyls business. In Asia, we continue to develop a strong
position in PTA and acetic acid. Our investment is biased towards this
high-growth region, especially China.
BP supports its businesses through a dedicated Strategic Accounts
organization. Strategic Accounts develops strategic relationships with
carefully selected large multinational customers in targeted markets,
where mutual strategic and financial value can be created. Its operating
model manages each relationship in a disciplined manner to achieve
growth and efficiency for BP and its partners through focused offer
development and capability building.
Fuels marketing
Our Fuels marketing strategy focuses on optimising the fuels value chain
and delivering refined products to the market. We do this by
co-ordinating our marketing, refining and trading activities to maximize
synergies across the whole value chain. Our priorities are to operate an
advantaged infrastructure and logistics network, drive excellence in
operating and transactional processes and deliver compelling customer
offers in the various markets where we operate. The fuels business
markets a comprehensive range of refined oil products focused on
ground fuels, aviation, marine and bitumen sectors.
Ground fuels
The ground fuels business supplies fuel to retail consumers through
company-owned and franchised retail sites as well as other channels
including wholesalers and jobbers. It also supplies commercial customers
within the road and rail transport sectors.
BP’s value creation in ground fuels is obtained through the integration
of the value chain from the refinery gates or import hubs across retail and
commercial channels to market. Convenience retail offers are managed
as an autonomous business model focused on delivering appealing
convenience offers across the various markets in which we operate,
through the BP Connect, am/pm and Aral brands.
Our retail network is largely concentrated in Europe and the US, with
established operations in Australasia and southern and eastern Africa.
We are also developing networks in China with joint venture partners.
$ million------------------------------------------------------------------------------------------------------------------------------- -----------------
Store salesa2007 2006 2005
------------------------------------------------------------------------------------------------------------------------------- -----------------
UK 713 647 628
Rest of Europe 2,974 2,821 3,069
US 1,712 1,755 1,776
Rest of World 670 591 610------------------------------------------------------------------------------------------------------------------------------- -----------------
Total 6,069 5,814 6,083
Direct-managed 2,609 2,528 2,489
Franchise 3,460 3,286 3,533
Store alliances – –------------------------------------------------------------------------------------------------------------------------------- -----------------
Total 6,069 5,814 6,083
a Store sales reported are sales through direct-managed stations, franchisees and theBP share of store alliances and joint ventures. Sales figures exclude sales taxes andlottery sales but include quick-service restaurant sales. Fuel sales are not includedin these figures. Not all retail sites include a BP convenience store.
Number of retail sites------------------------------------------------------------------------------------------------------------------------------- -----------------
Retail sitesa2007 2006 2005
------------------------------------------------------------------------------------------------------------------------------- -----------------
UK 1,200 1,300 1,300
Rest of Europe 7,400 7,700 7,900
US (excluding jobbers) 2,500 2,700 3,100
US jobbers 9,700 9,600 9,700
Rest of World 3,300 3,300 3,200------------------------------------------------------------------------------------------------------------------------------- -----------------
Total 24,100 24,600 25,200
a Retail sites includes all sites operated under a BP brand. Changes in the number ofretail sites over time are affected by, among other things, dealer/jobber-ownedsites that move to or from the BP brand as their fuel supply agreements expire andare renegotiated in the normal course of business.
At 31 December 2007, BP’s worldwide network consisted of some
24,000 locations branded BP, Amoco, ARCO and Aral, around the same
as in the previous year.
At 31 December 2007, BP’s retail network in the US comprised
approximately 12,200 sites, of which approximately 9,700 were owned
by jobbers and 500 by franchisees. Our European network amounted to
approximately 8,600 sites with a further approximately 3,300 sites in
Rest of World. The joint venture between BP and PetroChina (BP-
PetroChina Petroleum Company Ltd) started its operation in 2004. The
joint venture plans to operate and manage a total network of 500
locations in the Guangdong province and 400 sites were operational as at
31 December 2007. The joint venture with Sinopec commenced
operations in 2005. The joint venture plans to build, operate and manage
a network of 500 sites in Hangzhou, Ningbo and Shaoxing within
Zhejiang province. As at 31 December 2007, 220 of these sites were
operational.
We continue to improve the efficiency of our retail asset network and
increase the consistency of our site offer through a process of regular
review. In 2007, we sold 462 company-owned sites to dealers, jobbers
and franchisees who continue to operate these sites under the BP brand.
We also divested an additional 204 company-owned sites to third parties.
Each of our fuels brands, BP, Amoco, ARCO and Aral, carries a very
strong offer and we also aim to share best practices between them.
Since 2003, we have been upgrading our fuel offer with the introduction
of Ultimate gasoline and diesel products. In 2007, we launched Ultimate
in Switzerland and Luxembourg and now market Ultimate in 17
countries. In 2007, we launched our Helios Power campaign in the US
aimed at reinforcing the BP brand’s positioning in key markets.
61
Filename: U54368_doc3.3d Time: 14:49:38 Date: 25/02/08
Checksum: 522153156
32
Our convenience retail strategy continues to focus on BP’s advantaged
positions in major cities and growth markets and upgrading our retail
offers, while driving operational efficiencies through portfolio optimization
including, where appropriate, a transition to franchising. The convenience
offer comprises sales of convenience items to customers from
advantaged locations in metropolitan areas, while our fuels offer is
deployed at locations in all our markets, in many cases without the
convenience offer. We execute our convenience offer through a quality
branded store format in each of our key markets. Examples include the
BP Connect offer in Europe, the UK partnership with Marks & Spencer
Simply Food at selected locations, the am/pm offer in the US and the
Aral offer in Germany. At 31 December 2007, our convenience store
network consisted of more than 960 BP Connect stores worldwide, and
around 1,000 am/pm stores in the US and 1,500 Aral stores in Germany.
In line with BP’s intent to simplify the group’s operations and improve
performance, as well as to position the business for future growth by
directly accessing the franchisees’ entrepreneurial experience and local
knowledge, BP has announced that it will sell all of its company-owned
and company-operated convenience sites in the US. The majority of sites
will be sold to franchisees, with the remaining sites to dealers and large
distributors (jobbers). The sale of the sites is expected to be completed
by the end of 2009. The sites will continue to market BP-branded fuels in
the eastern US and ARCO-branded fuels in the western US. The
franchise agreement has a term of 20 years and requires sites to be
supplied with BP- or ARCO-branded fuels for the term of the contract.
Aviation fuels
Air BP is one of the world’s largest aviation businesses, supplying
aviation fuel to the airline, military and general aviation sectors. It supplies
customers in approximately 80 countries, has annual marketing sales of
27.4 billion litres (more than 470mb/d) and has relationships with many of
the major commercial airlines. Air BP’s strategic aim is to strengthen its
position in its main existing markets (Europe/US/Middle East), while
creating opportunities in emerging economies such as China, where it is
the largest foreign investor in the industry.
Marine fuels
The marine fuels business focuses on the distribution and resale of
refined fuels to the shipping industry across the world. The business has
a strong presence in the marine fuels sector. It has offices in 12
countries and operates in more than 150 ports.
Bitumen
The bitumen business focuses on the distribution and sale of bitumen
products for road construction and maintenance. It has a strong presence
in the US and in Europe and is exploring opportunities in developing
economies, where new infrastructure is being built. It markets bitumen
products in seven countries and product sales in 2007 were
approximately 45mb/d.
LPG
The LPG business sells bulk, bottled, automotive and wholesale LPG
products to a wide range of customers in 14 countries. During the past
few years, our LPG business has consolidated its position in established
markets and pursued opportunities in new and emerging markets. BP is
one of the leading importers of LPG into the Chinese market, where we
continued to grow our retail LPG business. LPG product sales in 2007
were approximately 72mb/d.
Lubricants
We manufacture and market lubricants products and also supply related
products and services to business customers and end-consumers in
more than 60 countries directly and to the rest of the world through local
distributors. Our business is concentrated on the higher-margin sectors
of automotive lubricants, especially in the consumer sector, and also has
a strong presence in the marine and industrial business markets.
Customer focus, distinctive brands and superior technology remain the
cornerstones of our long-term strategy. BP markets primarily through its
major brands, Castrol and BP, as well as Aral in specific markets. The
Castrol brand is recognized worldwide and we believe it provides us with
a significant competitive advantage. In the automotive lubricants
segment, we supply lubricants, other products and related business
services to intermediate customers such as retailers and workshops,
who in turn serve end-consumers such as car, motorcycle and leisure-
craft owners in the mature markets of western Europe and North
America and also in the fast growing markets of the developing world
such as Russia, China, India, the Middle East, South America and Africa.
BP’s marine lubricants business, operating under the BP and Castrol
brands, is a market leader with capability to supply in about 1,200 ports.
BP also supplies lubricants to the power generation, offshore oil and
aviation industries. BP’s industrial lubricants business supplies lubricants
and value-adding services to the transportation, automotive and metal
sectors.
Aromatics & Acetyls
The Aromatics & Acetyls business manufactures and markets three main
products lines: PTA, PX and acetic acid. PTA is a raw material for the
manufacture of polyesters used in textiles, plastic bottles, fibres and
films. PX is feedstock for the production of PTA. Acetic acid is a versatile
intermediate chemical used in a variety of products such as paints,
adhesives and solvents. It is also used in the production of PTA. In
addition to these three main products, we are involved in a number of
other petrochemicals products, namely Dimethyl 2, 6 Naphthalene
dicarboxylate (NDC), which is used for optical film and specialized
packaging, and acetic anhydride, ethyl acetate and vinyl acetate
monomer (VAM), which are used in cellulose acetate, paints, adhesives
and solvents. Our Aromatics & Acetyls strategy is to invest to maintain
and grow our advantaged manufacturing positions globally, with an
emphasis on growth in Asia, particularly in China. We are also investing in
maintaining and developing our technology leadership position to deliver
both operating and capital cost advantages.
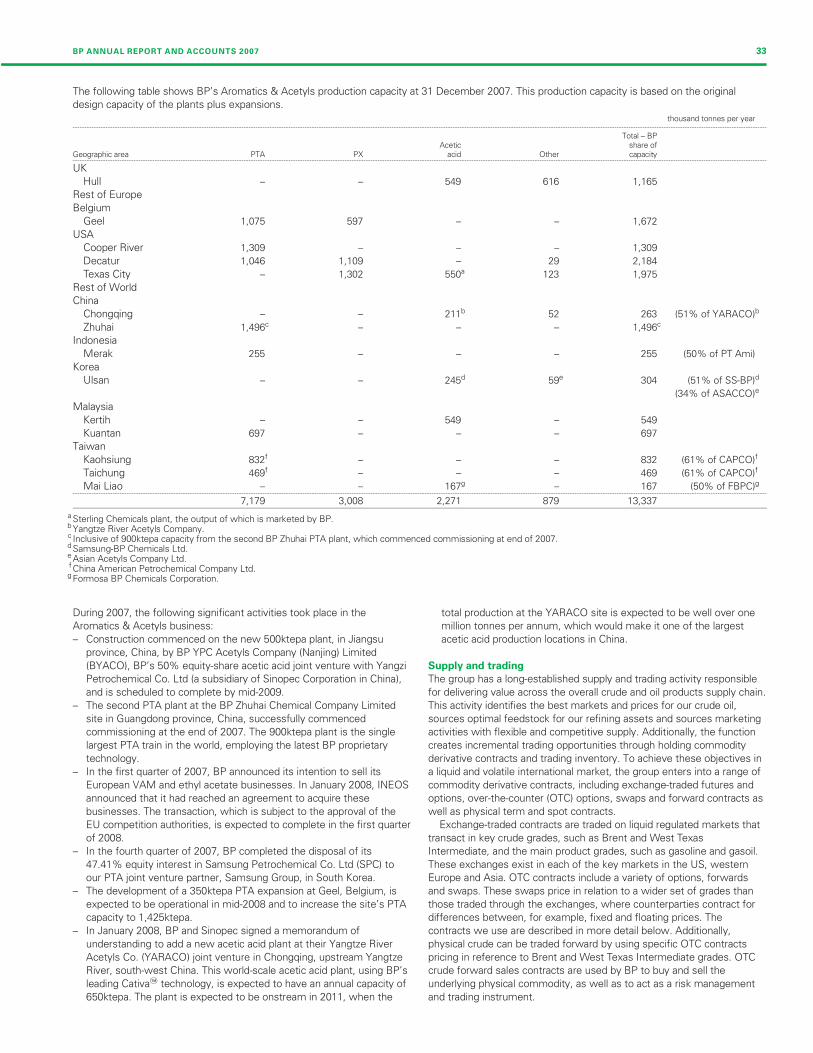
Filename: U54368_doc3.3d Time: 14:49:38 Date: 25/02/08
Checksum: -1558763255
BP ANNUAL REPORT AND ACCOUNTS 2007 33
The following table shows BP’s Aromatics & Acetyls production capacity at 31 December 2007. This production capacity is based on the original
design capacity of the plants plus expansions.
thousand tonnes per year--------------------------------------------------------------------------------------------------------------------------------------------------------------------------------------------------------------------------------------------------------------------------------------------------------
Total – BPAcetic share of
Geographic area PTA PX acid Other capacity--------------------------------------------------------------------------------------------------------------------------------------------------------------------------------------------------------------------------------------------------------------------------------------------------------
UK
Hull – – 549 616 1,165
Rest of Europe
Belgium
Geel 1,075 597 – – 1,672
USA
Cooper River 1,309 – – – 1,309
Decatur 1,046 1,109 – 29 2,184
Texas City – 1,302 550a 123 1,975
Rest of World
China
Chongqing – – 211b 52 263 (51% of YARACO)b
Zhuhai 1,496c – – – 1,496c
Indonesia
Merak 255 – – – 255 (50% of PT Ami)
Korea
Ulsan – – 245d 59e 304 (51% of SS-BP)d
(34% of ASACCO)e
Malaysia
Kertih – – 549 – 549
Kuantan 697 – – – 697
Taiwan
Kaohsiung 832f – – – 832 (61% of CAPCO)f
Taichung 469f – – – 469 (61% of CAPCO)f
Mai Liao – – 167g – 167 (50% of FBPC)g--------------------------------------------------------------------------------------------------------------------------------------------------------------------------------------------------------------------------------------------------------------------------------------------------------
7,179 3,008 2,271 879 13,337
a Sterling Chemicals plant, the output of which is marketed by BP.b Yangtze River Acetyls Company.c Inclusive of 900ktepa capacity from the second BP Zhuhai PTA plant, which commenced commissioning at end of 2007.d Samsung-BP Chemicals Ltd.e Asian Acetyls Company Ltd.f China American Petrochemical Company Ltd.g Formosa BP Chemicals Corporation.
During 2007, the following significant activities took place in the
Aromatics & Acetyls business:
– Construction commenced on the new 500ktepa plant, in Jiangsu
province, China, by BP YPC Acetyls Company (Nanjing) Limited
(BYACO), BP’s 50% equity-share acetic acid joint venture with Yangzi
Petrochemical Co. Ltd (a subsidiary of Sinopec Corporation in China),
and is scheduled to complete by mid-2009.
– The second PTA plant at the BP Zhuhai Chemical Company Limited
site in Guangdong province, China, successfully commenced
commissioning at the end of 2007. The 900ktepa plant is the single
largest PTA train in the world, employing the latest BP proprietary
technology.
– In the first quarter of 2007, BP announced its intention to sell its
European VAM and ethyl acetate businesses. In January 2008, INEOS
announced that it had reached an agreement to acquire these
businesses. The transaction, which is subject to the approval of the
EU competition authorities, is expected to complete in the first quarter
of 2008.
– In the fourth quarter of 2007, BP completed the disposal of its
47.41% equity interest in Samsung Petrochemical Co. Ltd (SPC) to
our PTA joint venture partner, Samsung Group, in South Korea.
– The development of a 350ktepa PTA expansion at Geel, Belgium, is
expected to be operational in mid-2008 and to increase the site’s PTA
capacity to 1,425ktepa.
– In January 2008, BP and Sinopec signed a memorandum of
understanding to add a new acetic acid plant at their Yangtze River
Acetyls Co. (YARACO) joint venture in Chongqing, upstream Yangtze
River, south-west China. This world-scale acetic acid plant, using BP’s
leading Cativa2 technology, is expected to have an annual capacity of
650ktepa. The plant is expected to be onstream in 2011, when the
total production at the YARACO site is expected to be well over one
million tonnes per annum, which would make it one of the largest
acetic acid production locations in China.
Supply and trading
The group has a long-established supply and trading activity responsible
for delivering value across the overall crude and oil products supply chain.
This activity identifies the best markets and prices for our crude oil,
sources optimal feedstock for our refining assets and sources marketing
activities with flexible and competitive supply. Additionally, the function
creates incremental trading opportunities through holding commodity
derivative contracts and trading inventory. To achieve these objectives in
a liquid and volatile international market, the group enters into a range of
commodity derivative contracts, including exchange-traded futures and
options, over-the-counter (OTC) options, swaps and forward contracts as
well as physical term and spot contracts.
Exchange-traded contracts are traded on liquid regulated markets that
transact in key crude grades, such as Brent and West Texas
Intermediate, and the main product grades, such as gasoline and gasoil.
These exchanges exist in each of the key markets in the US, western
Europe and Asia. OTC contracts include a variety of options, forwards
and swaps. These swaps price in relation to a wider set of grades than
those traded through the exchanges, where counterparties contract for
differences between, for example, fixed and floating prices. The
contracts we use are described in more detail below. Additionally,
physical crude can be traded forward by using specific OTC contracts
pricing in reference to Brent and West Texas Intermediate grades. OTC
crude forward sales contracts are used by BP to buy and sell the
underlying physical commodity, as well as to act as a risk management
and trading instrument.
Filename: U54368_doc3.3d Time: 14:49:38 Date: 25/02/08
Checksum: 856366454
34
Risk management is undertaken when the group is exposed to market
risk, primarily due to the timing of sales and purchases, which may occur
for both commercial and operational reasons. For example, if the group
has delayed a purchase and has a lower-than-normal inventory level, the
associated price exposure may be limited by taking an offsetting position
in the most suitable commodity derivative contract described above.
Where trading is undertaken, the group actively combines a range of
derivative contracts and physical positions to create incremental trading
gains by arbitraging prices, typically between locations and time periods.
This range of contract types includes futures, swaps, options and
forward sale and purchase contracts, which are described further below.
Through these transactions, the group sells crude production into the
market, allowing more suitable higher-margin crude to be supplied to our
refineries. The group may also actively buy and sell crude on a spot and
term basis to further improve selections of crude for refineries. In
addition, where refinery production is surplus to marketing requirements
or can be sourced more competitively, it is sold into the market. This
latter activity also encompasses opportunities to maximize the value of
the whole supply chain through the optimization of storage and pipeline
assets, including the purchase of product components that are blended
into finished products. The group also owns and contracts for storage
and transport capacity to facilitate this activity.
The range of transactions that the group enters into is described below
in more detail:
– Exchange-traded commodity derivatives
These contracts are typically in the form of futures and options traded
on a recognized exchange, such as Nymex, Simex, ICE and Chicago
Board of Trade. Such contracts are traded in standard specifications
for the main marker crude oils, such as Brent and West Texas
Intermediate, and the main product grades, such as gasoline and
gasoil. Though potentially settled physically, these contracts are
typically settled financially. Gains and losses, otherwise referred to as
variation margins, are settled on a daily basis with the relevant
exchange. These contracts are used for the trading and risk
management of both crude and products. Realized and unrealized
gains and losses on exchange-traded commodity derivatives are
included in sales and other operating revenues for accounting
purposes.
– OTC contracts
These contracts are typically in the form of forwards, swaps and
options. OTC contracts are negotiated between two parties and are
not traded on an exchange. These contracts can be used both as part
of trading and risk management activities. Realized and unrealized
gains and losses on OTC contracts are included in sales and other
operating revenues for accounting purposes.
The main grades of crude oil bought and sold forward using
standard contracts are West Texas Intermediate and a standard North
Sea crude blend (Brent, Forties and Osberg or BFO). Although the
contracts specify physical delivery terms for each crude blend, a
significant volume are not settled physically. The contracts contain
standard delivery, pricing and settlement terms. Additionally, the BFO
contract specifies a standard volume and tolerance given that the
physically settled transactions are delivered by cargo.
Swaps are contractual obligations to exchange cash flows between
two parties: one usually references a floating price and the other a
fixed price with the net difference of the cash flows being settled.
Options give the holder the right, but not the obligation, to buy or sell
crude or oil products at a specified price on or before a specific future
date. Amounts under these derivative financial instruments are settled
at expiry, typically through netting agreements, to limit credit exposure
and support liquidity.
– Spot and term contracts
Spot contracts are contracts to purchase or sell crude and oil products
at the market price prevailing on and around the delivery date when
title to the inventory is taken. Term contracts are contracts to
purchase or sell a commodity at regular intervals over an agreed term.
Though spot and term contracts may have a standard form, there is
no offsetting mechanism in place. These transactions result in
physical delivery with operational and price risk. Spot and term
contracts relate typically to purchases of crude for a refinery, sales of
the group’s oil production and sales of the group’s oil products. For
accounting purposes, spot and term sales are included in sales and
other operating revenues, when title passes. Similarly, spot and term
purchases are included in purchases for accounting purposes.
Trading investigations
See Legal proceedings on page 84 for details regarding investigations
into various aspects of BP’s trading activities.
During 2007, the group has taken a series of measures in relation to its
trading compliance processes, systems and controls. These measures
include increasing its compliance resources in the US and elsewhere,
continuing to implement an enhanced compliance framework and
programme that includes compliance monitoring of trading operations,
and the ongoing development and implementation of operating standards
and processes. In the US, the deferred prosecution agreement (DPA)
between BP America Inc. (BP America) and the US Department of
Justice has resulted in the appointment of an independent monitor to
oversee compliance with the DPA. The independent monitor has
authority to investigate and report alleged violations of the US
Commodity Exchange Act or US Commodity Futures Trading
Commission regulations and to recommend corrective action.
Transportation
Our Refining and Marketing segment owns, operates or has an interest
in extensive transportation facilities for crude oil, refined products and
petrochemicals feedstock. We transport crude oil to our refineries
principally by ship and through pipelines from our import terminals. We
have interests in crude oil pipelines in Europe and the US. Bulk products
are transported between refineries and storage terminals by pipeline,
ship, barge and rail. Onward delivery to customers is primarily by road.
We have interests in major product pipelines in the UK, Rest of Europe
and the US.
Shipping
We transport our products across oceans, around coastlines and along
waterways, using a combination of BP-operated, time-chartered and
spot-chartered vessels. All vessels conducting BP activities are subject to
our health, safety, security and environmental requirements.
International fleet
In 2006, we managed an international fleet of 57 vessels (42 medium-
size crude and product carriers, four very large crude carriers, one North
Sea shuttle tanker, seven LNG carriers and three new LPG carriers). At
the end of 2007, we had 53 international vessels (39 medium-size crude
and product carriers, four very large crude carriers, one North Sea shuttle
tanker, five LNG carriers and four LPG carriers). All these ships are
double-hulled. Of the five LNG carriers, BP manages one on behalf of a
joint venture in which it is a participant and operates four LNG carriers.
Three further LNG carriers are on order for delivery in 2008.
Regional and specialist vessels
In Alaska, we redelivered one of our time-chartered vessels back to the
owner, leaving a fleet of five double-hulled vessels. In the Lower 48, two
of the four heritage Amoco barges remain in service, both of which are
due to be phased out of BP’s service in 2008. Outside the US, the
specialist fleet has been reduced from 16 ships in 2006 to 14 in 2007
(two double-hulled lubricants oil barges and 12 offshore support vessels).
Time-charter vessels
BP has 111 hydrocarbon-carrying vessels above 600 deadweight tonnes
on time-charter, of which 97 are double-hulled and two are double-
bottomed. All these vessels participate in BP’s Time Charter Assurance
Programme.
Spot-charter vessels
To transport the remainder of the group’s products, BP spot-charters
vessels, typically for single voyages. These vessels are always vetted for
safety assurance prior to use.
Filename: U54368_doc3.3d Time: 14:49:38 Date: 25/02/08
Checksum: 1392874220
BP ANNUAL REPORT AND ACCOUNTS 2007 35
Other vessels
BP uses various craft such as tugs, crew boats and seismic vessels in
support of the group’s business. We also use sub-600 deadweight tonne
barges to carry hydrocarbons on inland waterways.
Gas, Power and Renewables
In 2007, the Gas, Power and Renewables segment included four main
activities: marketing and trading of gas and power; marketing and trading
of liquefied natural gas (LNG); production, marketing and trading of
natural gas liquids (NGLs); and low-carbon power generation through our
Alternative Energy business.
Resegmentation in 2008
With effect from 1 January 2008:
– The Gas, Power and Renewables segment ceased to report
separately.
– The NGLs, LNG and the gas and power marketing and trading
businesses were transferred from the Gas, Power and Renewables
segment to the Exploration and Production segment.
– The Alternative Energy business was transferred from the Gas, Power
and Renewables segment to Other businesses and corporate.
Key statistics $ million------------------------------------------------------------------------------------------------------------------------------- -----------------
2007 2006 2005------------------------------------------------------------------------------------------------------------------------------- -----------------
Sales and other operating revenues
from continuing operations 21,369 23,708 25,696
Profit before interest and tax from
continuing operationsa 674 1,321 1,172
Total assets 19,889 27,398 28,952
Capital expenditure and acquisitions 874 688 235
a Profit before interest and tax from continuing operations includes profit after tax ofequity-accounted entities.
The changes in sales and other operating revenues are explained in more
detail below:
$ million------------------------------------------------------------------------------------------------------------------------------- -----------------
2007 2006 2005------------------------------------------------------------------------------------------------------------------------------- -----------------
Gas marketing sales 8,639 11,428 15,222
Other sales (including NGL
marketing) 12,730 12,280 10,474------------------------------------------------------------------------------------------------------------------------------- -----------------
21,369 23,708 25,696
million cubic feet per day------------------------------------------------------------------------------------------------------------------------------- -----------------
Gas marketing sales volumes 3,382 3,685 5,096
Natural gas sales by Exploration and
Production 4,414 5,152 4,747
BP seeks to maximize the value of its gas by targeting high-value
customer segments in selected markets and to optimize supply around
our physical and contractual rights to assets. Marketing and trading
activities are focused on the relatively open and deregulated natural gas
and power markets of North America, the UK and the most liquid trading
locations in Rest of Europe. Some long-term natural gas contracting
activity is included within the Exploration and Production segment
because of the nature of the gas markets when the long-term sales
contracts were agreed.
Our LNG business develops opportunities to capture sales for our
upstream natural gas resources, working in close collaboration with the
Exploration and Production segment. For sales into non-liquid markets
such as Japan and Korea, we aim to secure contracts with high-value
customers. For the majority of sales into liquid wholesale markets such
as the US and the UK, we are building integrated supply chains covering
production, liquefaction, shipping, re-gasification and access to the
wholesale transmission grid. Our strategy is to capture a growing share
of the internationally-traded gas market. We are focusing on markets that
offer significant prospects for growth. Our LNG activities involve the
marketing of third-party LNG as well as BP equity volumes, where this
allows us to optimize our existing asset and contractual positions.
Our NGLs business is engaged in the processing, fractionation and
marketing of ethane, propane, butanes and pentanes extracted from
natural gas. We have a significant NGLs processing and marketing
Filename: U54368_doc3.3d Time: 14:49:38 Date: 25/02/08
Checksum: 811010729
36
business in North America. Our NGLs activity is underpinned by our
upstream resources and serves third-party markets for chemicals and
clean fuels as well as supplying BP’s refining activities.
Globally, the power sector is the largest source of greenhouse gas
(GHG) emissions, responsible for around twice the emissions of
transport, so creating low-carbon power is critical in the effort to stabilize
global GHG levels. BP is focused on power generation activities with low-
carbon emissions through its Alternative Energy business, extending
significantly our capabilities in solar, wind power, hydrogen power and
gas-fired power generation.
Capital expenditure and acquisitions in 2007 was $874 million,
compared with $688 million in 2006 and $235 million in 2005. In 2007,
we acquired Wasatch Energy L.L.C. in the US and in 2006 our
acquisitions included Orion Energy, LLC and Greenlight Energy, Inc. In
2005 there were no acquisitions.
Marketing and trading activities
Gas and power marketing and trading activity is undertaken primarily in
the US, Canada, the UK and Europe to market BP’s gas and power
production and manage market price risk as well as to create incremental
trading opportunities through the use of commodity derivative contracts.
Additionally, this activity generates fee income and enhanced margins
from sources such as the management of price risk on behalf of third-
party customers. These markets are large, liquid and volatile and the
group enters into these transactions on a large scale to meet these
objectives.
The group also has an NGLs trading activity in the US for delivering
value across the overall NGLs supply chain, sourcing optimal feedstock
for our processing assets and securing access to markets with flexible
and competitive supply.
In connection with the above activities, the group uses a range of
commodity derivative contracts and storage and transport contracts.
These include commodity derivatives such as futures, swaps and options
to manage price risk and forward contracts used to buy and sell gas and
power in the marketplace. Using these contracts, in combination with
rights to access storage and transportation capacity, allows the group to
access advantageous pricing differences between locations, time periods
and arbitrage between markets. Gas futures and options are traded
through exchanges, while over-the-counter (OTC) options and swaps are
used for both gas and power transactions through bilateral arrangements.
Futures and options are primarily used to trade the key index prices such
as Henry Hub, while swaps can be tailored to price with reference to
specific delivery locations where gas and power can be bought and sold.
OTC forward contracts have evolved in both the US and UK markets,
enabling gas and power to be sold forward in a variety of locations and
future periods. These contracts are used both to sell production into the
wholesale markets and as trading instruments to buy and sell gas and
power in future periods. Capacity contracts allow the group to store,
transport gas and transmit power between these locations. Additionally,
activity is undertaken to risk-manage power generation margins related
to the Texas City co-generation plant using a range of gas and power
commodity derivatives.
The range of contracts that the group enters into is described below in
more detail:
– Exchange-traded commodity derivatives
Exchange-traded commodity derivatives include gas and power
futures contracts. Though potentially settled physically, these
contracts are typically settled financially. Gains and losses, otherwise
referred to as variation margins, are settled on a daily basis with the
relevant exchange. Realized and unrealized gains and losses on
exchange-traded commodity derivatives are included in sales and
other operating revenues for accounting purposes.
– OTC contracts
These contracts are typically in the form of forwards, swaps and
options. OTC contracts are negotiated between two parties and are
not traded on an exchange. These contracts can be used both as part
of trading and risk management activities. Realized and unrealized
gains and losses on OTC contracts are included in sales and other
operating revenues for accounting purposes. Highly-developed
markets exist in North America and the UK where gas and power can
be bought and sold for delivery in future periods. These contracts are
negotiated between two parties to purchase and sell gas and power
at a specified price, with delivery and settlement at a future date.
Although these contracts specify delivery terms for the underlying
commodity, in practice a significant volume of these transactions are
not settled physically. This can be achieved by transacting offsetting
sale or purchase contracts for the same location and delivery period
that are offset during the scheduling of delivery or dispatch. The
contracts contain standard terms such as delivery point, pricing
mechanism, settlement terms and specification of the commodity.
Typically, volume and price are the main variable terms.
Swaps are contractual obligations to exchange cash flows between
two parties. One usually references a floating price and the other a
fixed price, with the net difference of the cash flows being settled.
Options give the holder the right, but not the obligation, to buy or sell
natural gas products or power at a specified price on or before a
specific future date. Amounts under these derivative financial
instruments are settled at expiry, typically through netting agreements
to limit credit exposure and support liquidity.
– Spot and term contracts
Spot contracts are contracts to purchase or sell a commodity at the
market price prevailing on the delivery date when title to the inventory
passes. Term contracts are contracts to purchase or sell a commodity
at regular intervals over an agreed term. Though spot and term
contracts may have a standard form, there is no offsetting mechanism
in place. These transactions result in physical delivery with operational
and price risk. Spot and term contracts relate typically to purchases of
third-party gas and sales of the group’s gas production to third parties.
Spot and term sales are included in sales and other operating
revenues, when title passes. Similarly, spot and term purchases are
included in purchases for accounting purposes.
See Financial and operating performance – Gas, Power and
Renewables on page 50.
Trading investigations
See Legal proceedings on page 84 for details regarding investigations
into various aspects of BP’s trading activities.
During 2007, the group has taken a series of measures in relation to its
trading compliance processes, systems and controls. These measures
include increasing its compliance resources in the US and elsewhere,
continuing to implement an enhanced compliance framework and
programme that includes compliance monitoring of trading operations,
and the ongoing development and implementation of operating standards
and processes. In the US, the deferred prosecution agreement (DPA)
between BP America Inc. (BP America) and the US Department of
Justice has resulted in the appointment of an independent monitor to
oversee compliance with the DPA. The independent monitor has
authority to investigate and report alleged violations of the US
Commodity Exchange Act or US Commodity Futures Trading
Commission regulations and to recommend corrective action.
North America
BP has a significant wholesale gas and power marketing and trading
business in North America. Our business has been built on the
foundation of our position as one of the continent’s leading producers of
gas based on volumes. Our gas activity in the US and Canada has grown
during the past few years as the group increased its scale through both
organic growth of operations and the acquisition of smaller marketing
and trading companies, increasing reach into additional markets. At the
same time, the overall volumes in these markets have also increased.
The group also trades power, in addition to selling and risk managing
production from the Texas City co-generation facility in the US.
Our North American natural gas marketing and trading strategy seeks
to provide unconstrained market access for BP’s equity gas. Our
marketing strategy targets high-value customer segments through fully
utilizing our rights to store and transport gas. These assets include those
Filename: U54368_doc3.3d Time: 14:49:39 Date: 25/02/08
Checksum: 579212814
BP ANNUAL REPORT AND ACCOUNTS 2007 37
owned by BP and those contractually accessed through agreements with
third parties such as pipelines and terminals.
Europe
The natural gas market in the UK is significant in size and is one of the
most progressive in terms of deregulation when compared with other
European markets. BP is one of the largest producers of natural gas in
the UK, based on volumes, with the majority of BP’s volumes being sold
to power generation companies and to other gas wholesalers via long-
term supply deals.
In addition to the marketing of BP gas, commodity derivative contracts
are used in combination with access to storage, transport flow and
assets to generate trading opportunities. This may include storing
physical gas to sell in future periods or moving gas between markets to
access higher prices. Commodity contracts such as OTC forward
contracts can be used to achieve this, while other commodity contracts
such as futures and options can be used to manage the market risk
relating to changes in prices.
In Europe, we maintain a marketing presence in Spain, but are
increasingly focused on wholesale transactions at the existing and new
gas trading hubs and exchanges in Belgium, The Netherlands, Germany
and France.
Liquefied natural gas
Our LNG and new market development activities are focused on
establishing international market positions to create maximum value from
our upstream natural gas resources and on capturing third-party LNG
supply to complement our equity flows.
BP Exploration and Production has interests in a number of major
existing LNG supply projects: Atlantic LNG in Trinidad & Tobago, Bontang
in Indonesia and the North West Shelf (NWS) project in Australia.
Additional LNG supplies are being pursued through an expansion of the
existing LNG facilities at the NWS project in Australia and green-field
developments in Indonesia (Tangguh) and Angola.
We continue to access major growth markets for the group’s equity
gas in the Pacific region. During 2007, development continued on the
Tangguh LNG project (BP 37.2% and operator) from which the first
commercial delivery is expected in early 2009. Tangguh will be the third
LNG centre in Indonesia and has signed sales contracts for delivery to
customers in China, South Korea and the west coast of Mexico. During
2007, further progress was made in securing contracts for LNG to be
derived from the remaining uncontracted reserves at the NWS project.
Agreements for the supply of LNG to Japan have been signed with
Chugoku Electric, Kyushu Electric, Tohuku Electric and Toho Gas and for
the supply of LNG to South Korea with the Korean Gas Corporation
(KOGAS). The Guangdong LNG re-gasification and pipeline project in
south-east China, in which BP is the only foreign partner, completed
installation of its third storage tank in the third quarter of 2007, increasing
its throughput to 7 million tonnes per annum. In addition to LNG supplied
under a long-term contract with the NWS project, the terminal took
delivery of an additional seven spot cargoes during the year, to meet
rapidly growing local demand for gas.
In the Atlantic and Mediterranean regions, BP is creating opportunities
to supply LNG to North American and European gas markets. The fourth
LNG train at Atlantic LNG in Trinidad, with a capacity of 5.2 million tonnes
per annum (253,000mmcf), began operations in late 2005. These BP-
marketed volumes supplement a 2005 long-term agreement with EGAS
of Egypt to purchase 1.45 billion cubic metres per year of LNG from the
Spanish Egyptian Gas Company (SEGAS) plant at Damietta, and a short-
term contract to purchase LNG from Oman and periodic spot purchases
of LNG. BP is marketing its LNG entitlement directly, utilizing BP-
controlled LNG shipping and contractual rights to access import terminal
capacity in the liquid markets of the US (via Cove Point and Elba Island)
and the UK (via the Isle of Grain). In Spain, environmental permits have
been issued to allow an expansion of the Bilbao re-gasification terminal in
which BP has a 25% equity stake.
In Nigeria, discussions are ongoing following the 2006 signing of a
memorandum of understanding for the purchase of LNG from Brass
River LNG. A final investment decision is expected in 2008 and could
lead to first LNG in 2012.
BP continues to seek approvals for a new terminal development in the
US. The proposed 1.2 billion cubic feet per day (bcf/d) Crown Landing
terminal is to be located on the Delaware River in New Jersey. The
Federal Energy Regulatory Commission (FERC) granted its approval for
the siting, construction and operation of this project during 2006. BP
continues to work with state agencies in New Jersey to complete state
permitting requirements and with the relevant federal, state and local
authorities to put in place security plans for the facility and associated
shipping activities. BP is also monitoring the progress of a proceeding
filed by the State of New Jersey against the State of Delaware in the US
Supreme Court concerning New Jersey’s jurisdiction over developments
on its shores, including the project’s loading jetty that extends into the
Delaware River. The US Supreme Court heard the New Jersey versus
Delaware case on 27 November 2007 and a decision from the court is
expected in 2008.
Natural gas liquids
Based on sales volumes, we are one of the largest producers and
marketers of NGLs in North America and hold interests for NGL volumes
in the UK and Egypt.
NGLs produced in North America from gas chiefly sourced out of
Alberta, Canada and the US onshore and Gulf Coast, are used as a
heating fuel and as a feedstock for refineries and chemicals plants. In
addition, a significant amount of NGLs are marketed on a wholesale basis
under annual supply contracts that provide for price re-determination
based on prevailing market prices.
In North America, BP operates or has interests in NGL extraction
plants with a processing capacity of 6.4bcf/d. These facilities are located
in major production areas across North America, including Alberta,
Canada, the US Rockies, the San Juan basin and the Gulf of Mexico. We
also own or have an interest in fractionation plants (that separate the
NGL into its component products) in Canada and the US, and own or
lease storage capacity in Alberta, eastern Canada, and the US Gulf Coast,
as well as the US west coast and mid-continent regions. Our North
American NGLs processing capacity utilization in 2007 was 72%. In
2006, we entered into a long-term supply contract with Aux Sable Liquid
Products to secure additional NGLs to supply our customers in the US
Midwest. A major three-year programme to inspect, assess and repair or
replace equipment is under way in BP’s North American NGLs business.
On 20 March 2007, we completed the sale of BP’s 50% equity and
operating interest in the Cochin pipeline system to Kinder Morgan Energy
Partners.
BP operates one NGLs plant (Central Area Transmission System, 30%
owner and operator with a capacity of 1.2bcf/d) in the UK and we are a
partner (33.33%) in a gas processing plant in Egypt with 1.1bcf/d of gas
processing capacity. We have also secured access to the Abibes LPG
terminal in Cremona, northern Italy.
Alternative energy
BP Alternative Energy, launched in November 2005, combines all of BP’s
interests in businesses that provide low-carbon energy solutions for
power generation: solar, wind, gas-fired power generation and hydrogen
power with carbon capture and storage (CCS).
Solar
BP Solar’s main production facilities are located in Maryland (US), Madrid
(Spain), Sydney (Australia), Xi’an (China) and Bangalore (India). During
2007, expansion of cell capacity continued at our Madrid and Bangalore
facilities, alongside a $100-million project to expand casting capacity at
Maryland, increasing our annual manufacturing capacity to 228MW.
BP Solar achieved sales of 115MW in 2007 (93MW in 2006 and
105MW in 2005).
In 2007, BP Solar and Banco Santander installed 14 Megawatts peak
(MWp) of the planned 20MWp installations in Spain, while in the US,
BP Solar won a bid to develop 4.3MW of solar energy systems for seven
Wal-Mart Stores in California, with the first three installations completed
by the end of December.
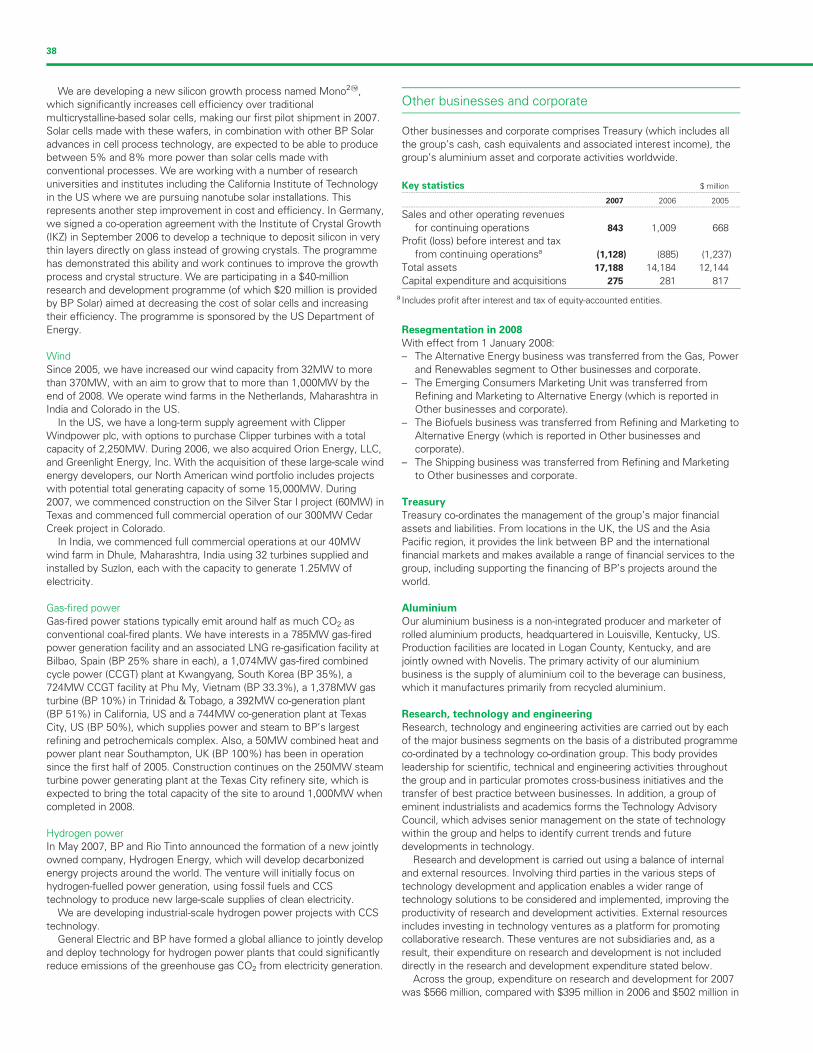
Filename: U54368_doc3.3d Time: 14:49:39 Date: 25/02/08
Checksum: -1137947186
38
We are developing a new silicon growth process named Mono22,
which significantly increases cell efficiency over traditional
multicrystalline-based solar cells, making our first pilot shipment in 2007.
Solar cells made with these wafers, in combination with other BP Solar
advances in cell process technology, are expected to be able to produce
between 5% and 8% more power than solar cells made with
conventional processes. We are working with a number of research
universities and institutes including the California Institute of Technology
in the US where we are pursuing nanotube solar installations. This
represents another step improvement in cost and efficiency. In Germany,
we signed a co-operation agreement with the Institute of Crystal Growth
(IKZ) in September 2006 to develop a technique to deposit silicon in very
thin layers directly on glass instead of growing crystals. The programme
has demonstrated this ability and work continues to improve the growth
process and crystal structure. We are participating in a $40-million
research and development programme (of which $20 million is provided
by BP Solar) aimed at decreasing the cost of solar cells and increasing
their efficiency. The programme is sponsored by the US Department of
Energy.
Wind
Since 2005, we have increased our wind capacity from 32MW to more
than 370MW, with an aim to grow that to more than 1,000MW by the
end of 2008. We operate wind farms in the Netherlands, Maharashtra in
India and Colorado in the US.
In the US, we have a long-term supply agreement with Clipper
Windpower plc, with options to purchase Clipper turbines with a total
capacity of 2,250MW. During 2006, we also acquired Orion Energy, LLC,
and Greenlight Energy, Inc. With the acquisition of these large-scale wind
energy developers, our North American wind portfolio includes projects
with potential total generating capacity of some 15,000MW. During
2007, we commenced construction on the Silver Star I project (60MW) in
Texas and commenced full commercial operation of our 300MW Cedar
Creek project in Colorado.
In India, we commenced full commercial operations at our 40MW
wind farm in Dhule, Maharashtra, India using 32 turbines supplied and
installed by Suzlon, each with the capacity to generate 1.25MW of
electricity.
Gas-fired power
Gas-fired power stations typically emit around half as much CO2 as
conventional coal-fired plants. We have interests in a 785MW gas-fired
power generation facility and an associated LNG re-gasification facility at
Bilbao, Spain (BP 25% share in each), a 1,074MW gas-fired combined
cycle power (CCGT) plant at Kwangyang, South Korea (BP 35%), a
724MW CCGT facility at Phu My, Vietnam (BP 33.3%), a 1,378MW gas
turbine (BP 10%) in Trinidad & Tobago, a 392MW co-generation plant
(BP 51%) in California, US and a 744MW co-generation plant at Texas
City, US (BP 50%), which supplies power and steam to BP’s largest
refining and petrochemicals complex. Also, a 50MW combined heat and
power plant near Southampton, UK (BP 100%) has been in operation
since the first half of 2005. Construction continues on the 250MW steam
turbine power generating plant at the Texas City refinery site, which is
expected to bring the total capacity of the site to around 1,000MW when
completed in 2008.
Hydrogen power
In May 2007, BP and Rio Tinto announced the formation of a new jointly
owned company, Hydrogen Energy, which will develop decarbonized
energy projects around the world. The venture will initially focus on
hydrogen-fuelled power generation, using fossil fuels and CCS
technology to produce new large-scale supplies of clean electricity.
We are developing industrial-scale hydrogen power projects with CCS
technology.
General Electric and BP have formed a global alliance to jointly develop
and deploy technology for hydrogen power plants that could significantly
reduce emissions of the greenhouse gas CO2 from electricity generation.
Other businesses and corporate
Other businesses and corporate comprises Treasury (which includes all
the group’s cash, cash equivalents and associated interest income), the
group’s aluminium asset and corporate activities worldwide.
Key statistics $ million------------------------------------------------------------------------------------------------------------------------------- -----------------
2007 2006 2005------------------------------------------------------------------------------------------------------------------------------- -----------------
Sales and other operating revenues
for continuing operations 843 1,009 668
Profit (loss) before interest and tax
from continuing operationsa (1,128) (885) (1,237)
Total assets 17,188 14,184 12,144
Capital expenditure and acquisitions 275 281 817
a Includes profit after interest and tax of equity-accounted entities.
Resegmentation in 2008
With effect from 1 January 2008:
– The Alternative Energy business was transferred from the Gas, Power
and Renewables segment to Other businesses and corporate.
– The Emerging Consumers Marketing Unit was transferred from
Refining and Marketing to Alternative Energy (which is reported in
Other businesses and corporate).
– The Biofuels business was transferred from Refining and Marketing to
Alternative Energy (which is reported in Other businesses and
corporate).
– The Shipping business was transferred from Refining and Marketing
to Other businesses and corporate.
Treasury
Treasury co-ordinates the management of the group’s major financial
assets and liabilities. From locations in the UK, the US and the Asia
Pacific region, it provides the link between BP and the international
financial markets and makes available a range of financial services to the
group, including supporting the financing of BP’s projects around the
world.
Aluminium
Our aluminium business is a non-integrated producer and marketer of
rolled aluminium products, headquartered in Louisville, Kentucky, US.
Production facilities are located in Logan County, Kentucky, and are
jointly owned with Novelis. The primary activity of our aluminium
business is the supply of aluminium coil to the beverage can business,
which it manufactures primarily from recycled aluminium.
Research, technology and engineering
Research, technology and engineering activities are carried out by each
of the major business segments on the basis of a distributed programme
co-ordinated by a technology co-ordination group. This body provides
leadership for scientific, technical and engineering activities throughout
the group and in particular promotes cross-business initiatives and the
transfer of best practice between businesses. In addition, a group of
eminent industrialists and academics forms the Technology Advisory
Council, which advises senior management on the state of technology
within the group and helps to identify current trends and future
developments in technology.
Research and development is carried out using a balance of internal
and external resources. Involving third parties in the various steps of
technology development and application enables a wider range of
technology solutions to be considered and implemented, improving the
productivity of research and development activities. External resources
includes investing in technology ventures as a platform for promoting
collaborative research. These ventures are not subsidiaries and, as a
result, their expenditure on research and development is not included
directly in the research and development expenditure stated below.
Across the group, expenditure on research and development for 2007
was $566 million, compared with $395 million in 2006 and $502 million in
Filename: U54368_doc3.3d Time: 14:49:39 Date: 25/02/08
Checksum: -459275774
BP ANNUAL REPORT AND ACCOUNTS 2007 39
2005 (2005 includes $374 million in respect of continuing operations).
See Financial statements note 14 on page 125. The 43% increase in
2007 compared with 2006 reflects increased investment in enhanced oil
recovery, heavy oil, advanced refining, conversion, biosciences and
renewables technology.
Insurance
The group generally restricts its purchase of insurance to situations
where this is required for legal or contractual reasons. This is because
external insurance is not considered an economic means of financing
losses for the group. Losses will therefore be borne as they arise, rather
than being spread over time through insurance premiums with attendant
transaction costs. This position is reviewed periodically.
Technology
The realization of technological advancements is pivotal to our strategic
progress and business performance. It is also the key to finding and
developing solutions that meet the energy and climate challenges of the
21st century.
Our three-year technology plan provides sustained investment in our
core technologies and increasing investment in long-term technologies.
As we have deepened our current areas of leadership, extended their
application in the field and broadened our long-term technology portfolio,
our technology investment has grown at an average of 15% per annum
during the period 2003-2007. In 2007, total technology investment was
around $1.1 billion.
The sheer range and complexity of technologies that can impact our
businesses, and the wide variety of sources for these technologies
proprietary, energy service sector, universities and research institutions
and other industries means that no single approach can meet all our
needs.
The following guiding principles underpin our approach to technology:
– Deliver technology leadership in a select few areas.
– Develop sustainable technology-based solutions for corporate
renewal.
– Drive rapid take-up of proprietary and commercially available
technologies.
– Innovate and test technology at material scale.
– Develop and access world-class skills; collaborate internally and
externally.
These principles are reflected in how we define technology
investment. Whereas research and development is an externally reported
number, internally we use a broader but very specific definition for
technology investment. This consists of four elements: technology
development for incremental improvement of our base businesses;
technology leadership areas to create and sustain material, advantaged
business positions; long-term technology investments to secure our
future; and application and propagation of technology through formalized
technology networks and knowledge management processes.
During 2007, we continued to advance and employ new technologies
in drilling and well construction, unconventional gas development,
enhanced oil recovery and seismic imaging. These technologies and
know-how have enabled a new agreement with the Sultanate of Oman
to develop gas resources, discoveries in Azerbaijan, Angola, Egypt and
the Gulf of Mexico, increased production from tight gas fields in the
continental US and increased recoveries from our fields in maturing
basins such as Alaska and the North Sea.
Technology advancements are also broadening our refining capability
to understand and process feedstocks of varying quality and optimize our
assets in real time, enhancing the flexibility and reliability of our refineries
and, in turn, improving the margins of our existing asset base. Our
proprietary technologies in PTA have continued to reduce manufacturing
costs and environmental impact: the new Zhuhai 2 unit in China, which
started in 2007, has a lower energy consumption and environmental
footprint than any other PTA unit in the world.
We also continue to progress our strategic longer-term technologies.
In the field of bioscience, we selected the University of California
Berkeley and its partners the University of Illinois, Urbana-Champaign and
the Lawrence Berkeley National Laboratory to join us in the previously-
announced $500-million research programme to explore how bioscience
can be used to increase energy production and reduce the impact of
energy consumption on the environment. This energy research laboratory
is now operational. We also entered into research agreements with two
biotechnology companies in the US to focus on next generation energy
crops for biofuels and to research microbial processes in subsurface
hydrocarbons. We have formed a research partnership with the
Massachusetts Institute of Technology to complement our internal
technology capabilities in converting low-value carbon feedstocks such as
petcoke and coal to high-value products such as electricity, liquid fuels
and chemicals while minimizing CO2 emissions.
Carbon capture and storage (CCS) technologies are a key enabler to
the success of low-carbon power generation and product manufacturing.
Having integrated the learning from our CO2 storage project in Algeria
with our extensive Exploration and Production capabilities, our CCS
technologies are ready for deployment at scale.
Regulation of the group’s business
BP’s exploration and production activities are conducted in many
different countries and are therefore subject to a broad range of
legislation and regulations. These cover virtually all aspects of exploration
and production activities, including matters such as licence acquisition,
production rates, royalties, pricing, environmental protection, export,
taxes and foreign exchange. The terms and conditions of the leases,
licences and contracts under which these oil and gas interests are held
vary from country to country. These leases, licences and contracts are
generally granted by or entered into with a government entity or state
company and are sometimes entered into with private property owners.
These arrangements with governmental or state entities usually take the
form of licences or production-sharing agreements. Arrangements with
private property owners are usually in the form of leases.
Licences (or concessions) give the holder the right to explore for and
exploit a commercial discovery. Under a licence, the holder bears the risk
of exploration, development and production activities and provides the
financing for these operations. In principle, the licence holder is entitled
to all production, minus any royalties that are payable in kind. A licence
holder is generally required to pay production taxes or royalties, which
may be in cash or in kind. Less typically, BP may explore for and exploit
hydrocarbons under a service agreement with the host entity in
exchange for reimbursement of costs and/or a fee paid in cash rather
than production.
Production-sharing agreements entered into with a government entity
or state company generally require BP to provide all the financing and
bear the risk of exploration and production activities in exchange for a
share of the production remaining after royalties, if any.
In certain countries, separate licences are required for exploration and
production activities and, in certain cases, production licences are limited
to a portion of the area covered by the exploration licence. Both
exploration and production licences are generally for a specified period of
time (except for licences in the US, which typically remain in effect until
production ceases). The term of BP’s licences and the extent to which
these licences may be renewed vary by area.
Frequently, BP conducts its exploration and production activities in
joint venture with other international oil companies, state companies or
private companies.
In general, BP is required to pay income tax on income generated from
production activities (whether under a licence or production-sharing
agreement). In addition, depending on the area, BP’s production activities
may be subject to a range of other taxes, levies and assessments,
including special petroleum taxes and revenue taxes. The taxes imposed
on oil and gas production profits and activities may be substantially
higher than those imposed on other activities, particularly in Angola,
Norway, the UK, Russia, South America and Trinidad & Tobago.
Filename: U54368_doc3.3d Time: 14:49:39 Date: 25/02/08
Checksum: -461901534
40
BP’s other activities, including its interests in pipelines and its
commodities and trading activities, are also subject to a broad range of
legislation and regulations in various countries in which it operates.
Health, safety and environmental regulations are discussed in more
detail in Environment on page 41.
For certain information regarding environmental proceedings, see
Environment – US regional review on page 43.
Safety
This section reviews BP’s 2007 performance with respect to safety and
the environment. An overview of our non-financial performance will
appear in BP Sustainability Report 2007, expected to be published in
May 2008.
In total, there were seven workforce fatalities relating to BP operations
in 2007, compared with the same number in 2006. Two were the result
of shootings relating to our retail operations in South Africa, two occurred
in operations at our US refineries in Cherry Point and Texas City, one was
on board a BP marine vessel, one was road-related and one an accident
involving a defective fire extinguisher in Indonesia. We deeply regret the
loss of any lives. These incidents re-emphasize the need for constant
vigilance in seeking to secure the safety of all members of our
workforce.
Our employee and contractor reported recordable injury frequency in
2007 was 0.48 per 200,000 hours worked, the same as that for 2006
(2006 data was corrected from 0.47 to 0.48), and below the industry
average for 2006.
Implementing Baker Panel recommendations
Throughout 2007, BP continued to progress the process safety
enhancement programme initiated in response to the March 2005 incident
at the Texas City refinery. We worked to implement the recommendations
of the BP US Refineries Independent Safety Review Panel (the panel),
which issued its report on the incident in January 2007 (see
www.bp.com/bakerpanelreport).
We have made material progress throughout the group across all of
the panel’s 10 recommendations. Action can be grouped under the
following headings:
Leadership
Our executive team carried out site visits, which included BP’s five US
refineries. Board members also undertook site visits, including one to the
Texas City refinery. We have consistently communicated that safe and
reliable operations are our highest priority. Our safety and operations
audit group was strengthened and completed 28 audits in 2007.
Management systems
Implementation of our operating management system (OMS) began at a
first group of sites that included all five US refineries (see page 41). We
continued implementing the group’s ‘six-point plan’, which focuses on
key priorities for investment and action associated with safe operations
(see below).
Knowledge and expertise
We established an executive-level training programme, ran process
safety workshops and launched an operations academy for site-based
staff to enhance process safety capability. Specialists have been
deployed at our US refineries to accelerate priority improvement
programmes.
Culture
To reinforce the need for a stronger safety culture, our in-house team
undertook assessments of BP’s safety culture, supported by
communication from leadership.
Indicators
Progress has been made in developing leading and lagging indicators,
building on metrics already reported to executive management. These
include measures on the competency of employees in roles critical to
safety and on the development of appropriate operating procedures. We
are working with the industry to develop indicators and this already
includes progress to agree a metric covering loss of primary
containment.
Progress at Texas City and our other US refineries
Across the US refining system, we have worked to address factors that
contributed to the Texas City refinery incident of 2005, including facility
siting, atmospheric relief systems, operating procedures and operator
training, as well as control of work systems and process safety culture
and leadership.
The refineries have engaged with employees on how to improve
process safety. Each refinery is creating a strategic implementation plan
to reduce process safety risk on a continuous improvement basis and to
implement the OMS. With the United Steel Workers Union, we have
reached agreement in principle to work jointly to improve safety across
four represented refineries. At Texas City, face-to-face communication
with staff has been supplemented by The Future is Now, a monthly
magazine widely circulated across the group.
Approximately 640 new staff were hired across our US refineries,
strengthening our support of engineering, inspection and process safety.
Further information on Texas City and other refineries can be found in
the Refining and Marketing section on page 28.
Implementing the six-point plan
We set out our immediate priorities for improving process safety
management and reducing risk at our operations worldwide through a
six-point plan. This plan, launched in 2006, pre-dated the panel’s
recommendations and creates a foundation for our approach.
Progress on the plan’s elements is reviewed each quarter by the
executive-level group operations risk committee (GORC).
We have taken the following actions in relation to the six-point plan:
– In 2007, we implemented a group practice on occupied portable
buildings and removed all temporary buildings out of high-risk zones in
refineries and major onshore plants. We continue to apply the practice
and report progress on identification and removal of relevant buildings
to the GORC. A total of 17 blow-down stacks – all of those on heavier-
than-air light hydrocarbon streams in refineries – have been removed
from service. The one remaining blow-down stack, at a chemical plant
in Malaysia, is scheduled to be removed from service during 2008.
– We have completed 50 major accident risk assessments (MARs). The
assessments identify high-level risks that, if they occur, would have a
major effect on people or the environment. Many of these risks, such
as a loss of containment from our operations, are common across the
industry. Mitigation plans to manage and respond to identified risks
form part of the MAR analysis.
– We are implementing group standards for integrity management and
control of work on a locally risk-assessed and prioritized basis.
Progress on implementing the standards is tracked quarterly. We have
spent $6 billion on integrity management in the course of 2007,
principally related to operating costs for maintenance and capital costs
for plant improvement.
– We have continued to improve the way in which we seek to ensure
our operations maintain compliance with health and safety laws and
regulations. A project to establish a consistent compliance
management framework has been under way in the US during the
past two years and is expected to be completed globally by the end of
2008.
– Reviews have been undertaken resulting in many actions being closed
out from past audits. Other actions requiring closure have been
identified.
– Senior HSE advisors have carried out a preliminary assessment of the
operational experience of BP management teams responsible for
major production or manufacturing plant and any significant
assessment findings have been addressed.
Filename: U54368_doc3.3d Time: 14:49:39 Date: 25/02/08
Checksum: 568244358
BP ANNUAL REPORT AND ACCOUNTS 2007 41
Operational integrity
As part of monitoring operational integrity, we track the number of major
incidents during the year: oil spills of more than 100 barrels, significant
property damage or fatal accidents related to integrity management
failures. We also investigate any near-misses that could have resulted in
a major incident. Overall in 2007, the total number of ‘high potentials’
went down; however, more integrity management-related ‘high
potentials’ were reported in 2007 than in previous years as a result of
improved knowledge-sharing.
The number of oil spills of one barrel or more in 2007 decreased to
340 from 417 in 2006. The volume of oil spilled was 1.05 million litres, of
which 0.33 million litres were unrecovered.
Continuing to focus on personal health and safety
In combination with our efforts to improve process safety, we have
continued to strive for excellence in occupational health and safety. This
is in line with our aspiration of no accidents, no harm to people and no
damage to the environment.
Continued focus on driving risks has resulted in a significant reduction
in major driving incidents, (those that cause a fatality or result in a vehicle
rollover) since 2005.
Health is an integral part of the OMS. In 2007, work continued on
developing practices in health management, covering industrial hygiene,
asbestos, fitness to work, health impact assessment, medical
emergency management, health promotion and wellness. These
practices set minimum standards of health performance in BP (see
below).
We recognize that the health and safety of our workforce and
communities is affected by our operations and that meeting our
aspiration of no harm to people requires continuous effort, every day.
Implementation of the OMS
We began implementation of the OMS at 12 representative pilot sites.
Learnings from these pilots will be used to assess and improve the OMS
before widening its introduction. We intend for the whole of BP to have
commmenced use of the OMS by the end of 2010.
The OMS incorporates BP’s principles for operating and provides a
framework to help deliver competence, then excellence, in operations
and safety. Standards for control of work and integrity management and
detailed ‘practices’ in matters such as risk assessment provide further
underpinning. Training and development programmes have been
strengthened to develop the right capability and culture across the
organization.
As described by BP’s group chief executive, the OMS ‘‘is the
foundation for a safe, effective, and high-performing BP. It has two
purposes: to further reduce HSE risks in our operations and to
continuously improve the quality of those operations’’. The system’s
‘elements of operating’ describe eight dimensions of how people,
processes, plant and performance operate within BP. A continuous
improvement process drives and sustains improvement of these
elements at a local level.
Capability development
We have initiated development programmes designed to ensure that BP
has the capability among its people to achieve operational excellence and
identify and manage risks.
The programmes support implementation of the OMS by developing
technical knowledge and skills. They seek to improve management,
behavioural, cultural and leadership skills to drive and sustain multi-year
change in operations across multiple geographies.
For instance, the operating essentials programme is tailored to staff in
maintenance, operations and safety who have responsibility for
managing front-line employees and contractors. We completed operating
essentials pilots in Anadarko (North America gas), Angola and Kwinana
and started the first phase of the implementation at 11 other sites.
The Operations Academy, provided in partnership with the
Massachusetts Institute of Technology, is directed towards senior
operations and safety leaders of sites or large units.
The executive operations programme targets group vice presidents
and senior business leaders with accountability for multiple operations or
sites. Its purpose is to deepen insight into manufacturing and operations
activities and the consequences of leadership decisions.
In 2007, we began the development of programmes for the wider
workforce such as technicians and operators, graduate new hires and
managers in roles between supervisory and senior leadership levels.
Environment
Health, safety and environmental regulation
The group is subject to numerous international, national and local
environmental laws and regulations concerning its products, operations
and activities. Current and proposed fuel and product specifications and
climate change programmes under a number of environmental laws will
have a significant effect on the production, sale and profitability of many
of our products. Environmental laws and regulations also require the
group to remediate or otherwise redress the effects on the environment
of prior disposal or release of chemicals or petroleum substances by the
group or other parties. Such contingencies may exist for various sites,
including refineries, chemicals plants, natural gas processing plants, oil
and natural gas fields, service stations, terminals and waste disposal
sites. In addition, the group may have obligations relating to prior asset
sales or closed facilities. Provisions for environmental restoration and
remediation are made when a clean-up is probable and the amount is
reasonably determinable. Generally, their timing coincides with the
commitment to a formal plan of action or, if earlier, on divestment or on
closure of inactive sites. The provisions made are considered by
management to be sufficient for known requirements.
The extent and cost of future environmental restoration, remediation
and abatement programmes are often inherently difficult to estimate.
They depend on the magnitude of any possible contamination, the timing
and extent of the corrective actions required, technological feasibility and
BP’s share of liability relative to that of other solvent responsible parties.
Though the costs of future restoration and remediation could be
significant and may be material to the results of operations in the period
in which they are recognized, it is not expected that such costs will be
material to the group’s overall results of operations or financial position.
See Financial statements – Note 37 on page 151 for the amounts
provided in respect of environmental remediation and decommissioning.
The group’s operations are also subject to environmental and common
law claims for personal injury and property damage caused by the release
of chemicals, hazardous materials or petroleum substances by the group
or others. Fifteen proceedings involving governmental authorities are
pending or known to be contemplated against BP and certain of its
subsidiaries under federal, state or local environmental laws, each of
which could result in monetary sanctions of $100,000 or more. No
individual proceeding is, nor are the proceedings in aggregate, expected
to be material to the group’s results of operations or financial position.
For information regarding Texas City and other refineries see Texas
City refinery on page 28, Other regulatory actions on page 29 and Legal
proceedings on page 84.
For further information regarding spills in Alaska in 2006 see Legal
proceedings on page 84.
Management cannot predict future developments, such as
increasingly strict requirements of environmental laws and resulting
enforcement policies that might affect the group’s operations or affect
the exploration for new reserves or the products sold by the group. A risk
of increased environmental costs and impacts is inherent in particular
operations and products of the group and there can be no assurance that
material liabilities and costs will not be incurred in the future. In general,
the group does not expect that it will be affected differently from other
companies with comparable assets engaged in similar businesses.
Management believes that the group’s activities are in compliance in all
material respects with applicable environmental laws and regulations.
For a discussion of the group’s environmental expenditure see page 53.
BP operates in more than 100 countries worldwide. In all regions of
the world, BP has, or is developing, processes designed to ensure
Filename: U54368_doc3.3d Time: 14:49:39 Date: 25/02/08
Checksum: -1038421029
42
compliance with applicable regulations. In addition, each individual in the
group is required to comply with BP health, safety and environmental
policies as embedded in the BP code of conduct. Our partners, suppliers
and contractors are also encouraged to adopt them.
This Environment section focuses primarily on the US and the EU,
where around 65% of our fixed assets are located, and on issues of a
global nature such as our operations and the environment, climate
change programmes and maritime oil spills regulations.
Our operations and the environment
During 2007, we continued to use environmental management systems
to seek improvements on a wide range of environmental issues. All our
major sites, except one, are certified to the ISO 14001 international
environmental management system standard. The Texas City refinery,
after completing planned work to strengthen its environmental
management systems, is planning to seek recertification in early 2009.
Following its approval in November 2006, we began the
implementation of the group practice called the Environmental
Requirements for New Projects (ERNP). This practice is a full life-cycle
environmental assessment process. It requires all new projects to
undertake screening to determine the potential environmental
sensitivities associated with the proposed projects. The highest level of
environmental sensitivity in a new project requires more rigorous specific
environmental management activities. By the end of 2007, more than
100 projects had begun implementation of ERNP including those in our
alternative energy, upstream and downstream businesses.
Since 2001, we have been focusing on measuring and improving the
carbon intensity of our operations. After six years, we estimate that our
operations have delivered some 7 million tones (Mte) of GHG reductions.
Our 2007 operational GHG emissions were 63.5Mte of CO2 equivalent
on a direct equity basis, nearly 1Mte lower than the reported figure of
64.4Mte in 2006.
Many of our EU assets have been subject to the EU Emissions Trading
Scheme (ETS) since its launch in January 2005. The number of
installations actively participating in the scheme increased at the end of
2007 when a temporary exclusion of exploration and production assets
expired. After inclusion of these assets, around one-fifth of our reported
2007 global GHG emissions are now covered by the scheme.
In 2007, no new decisions were taken by BP to explore or develop in
World Conservation Union (IUCN) category I-IV areas. We constantly try
to limit the environmental impact of our operations by seeking to use
natural resources responsibly and reducing waste and emissions.
Climate change programmes
In response to rising concerns about climate change, governments
continue to identify fiscal and regulatory measures at local, national and
international levels.
In December 1997, at the Third Conference of the Parties to the
United Nations Framework Convention on Climate Change (UNFCCC) in
Kyoto, Japan, the participants agreed on a system of differentiated
international legally-binding targets for the first commitment period of
2008-2012. In 2005, the Kyoto protocol came into force, committing the
176 participating countries to emissions targets. However, Kyoto was
only designed as a first step and policymakers continue to discuss what
new agreement might follow it after 2012, most recently at the UNFCCC
conference in Bali in December 2007.
In the EU, the first phase of the EU ETS was completed at the end of
2007, with EU ETS phase II running from 2008-2012. The European
Commission has approved all member-state Phase-II national allocation
plans. The European Commission also announced an intention to
propose a legislative framework by mid-2008, to achieve the EU
objective of 120 grams per kilometre CO2 for passenger cars and light
commercial vehicles.
The US congress continues to develop and review proposed climate
change legislation and regulation. President Bush signed an Energy bill
into law in December 2007, which included stricter corporate average
fuel emissions standards for automobiles sold in the US and biofuel
mandates. A number of other bills currently under consideration propose
stricter emissions limits on large GHG sources and/or the introduction of
a cap-and-trade programme on CO2 and other GHG emissions.
In an April 2007 decision, the US Supreme Court overruled a lower
court that had upheld a decision by the US Environmental Protection
Agency (EPA) not to regulate GHGs from motor vehicles under the Clean
Air Act for climate change purposes. The Supreme Court’s ruling will
require the EPA to reconsider its prior decision on motor vehicle CO2
regulation and render a new decision in keeping with the Supreme
Court’s holding. The court opinion is expected to make it difficult for the
EPA not to regulate motor vehicle GHG emissions in the future. It is also
expected to increase pressure on the EPA to regulate stationary sources
of GHGs (e.g. refineries and chemical plants) under other provisions of
the Clean Air Act.
In September 2006, California governor Arnold Schwarzenegger
signed the California Global Warming Solutions Act of 2006 (AB 32) into
law. In 2007, the California Air Resources Board (CARB) began the
development of regulations that will ultimately reduce California’s GHG
emissions to 1990 levels by 2020 (an approximately 25% reduction from
current levels). CARB has initiated work on the Scoping Plan, which will
identify reduction programme mechanisms and timelines for achieving
the 2020 target. In advance of the Scoping Plan, CARB has taken early
actions with the development of mandatory GHG reporting and a Low
Carbon Fuel Standard (LCFS). The LCFS will require all refiners,
producers, blenders and importers to reduce the carbon intensity of
transport fuel sold in California by 10% by 2020.
Since 1997, BP has been actively involved in policy debate. We also
ran a global programme that reduced our operational GHG emissions by
10% between 1998 and 2001. We continue to look at two principal kinds
of emissions: operational emissions, which are generated from our
operations such as refineries, chemicals plants and production facilities;
and product emissions, generated by our customers when they use the
fuels and products that we sell. Since 2001, we have been focusing on
measuring and improving the carbon intensity of our operations as well
as developing sustainable low-carbon technologies and businesses for
the future.
In 2007, as part of our engagement with technology development,
two major BP-backed research institutes came into full operation:
the Energy Biosciences Institute (EBI) in the US, and the Energy
Technologies Institute (ETI) in the UK. The EBI is a strategic partnership
between BP, the University of California, Berkeley, the Lawrence
Berkeley National Laboratory and the University of Illinois, that will
perform research into the production of new and cleaner energy, initially
focusing on advanced biofuels for road transport. The EBI will also
pursue bioscience-based research in three other key areas: the
conversion of heavy hydrocarbons to clean fuels, improved recovery from
existing oil and gas reservoirs and carbon sequestration. In the UK, the
ETI has been established as a 50:50 public private partnership, funded
equally by member companies, including BP, and the government. The
ETI aims to accelerate the development, demonstration and eventual
commercial deployment of a focused portfolio of energy technologies,
which will increase energy efficiency, reduce GHG emissions and help
achieve energy security and climate change goals. The ETI has issued its
first Invitation for expressions of interest to participate in programmes to
develop new technologies for offshore wind and for marine, tidal and
wave energy.
Maritime oil spill regulations
Within the US, the Oil Pollution Act of 1990 (OPA 90) imposes oil spill
prevention requirements, spill response planning obligations and spill
liability for tankers and barges transporting oil and for offshore facilities
such as platforms and onshore terminals. To ensure adequate funding for
response to oil spills and compensation for damages, when not fully
covered by a responsible party, OPA 90 created a $1-billion fund that is
financed by a tax on imported and domestic oil. This has recently been
amended by the Coast Guard and Maritime Transportation Act 2006 to
increase the size of the fund from $1 billion to $2.7 billion, through the
previously-mentioned tax, together with an increase in the liability of
double-hulled tankers from $1,200 per gross ton to $1,900 per gross ton.
In addition to OPA 90, which imposes liability for oil spills on the owners
Filename: U54368_doc3.3d Time: 14:49:39 Date: 25/02/08
Checksum: -1443620767
BP ANNUAL REPORT AND ACCOUNTS 2007 43
and operators of the carrying vessel, some states implemented statutes
also imposing liability on the shippers or owners of oil spilled from such
vessels. Alaska, Washington, Oregon and California are among these
states. The exposure of BP to such liability is mitigated by the vessels’
marine liability insurance, which has a maximum limit of $1 billion for
each accident or occurrence. OPA 90 also provides that all new tank
vessels operating in US waters must have double hulls and existing tank
vessels without double hulls must be phased out by 2015. BP contracted
with National Steel and Ship Building Company (NASSCO) for the
construction of four double-hulled tankers in San Diego, California. The
first of these new vessels began service in 2004, demise-chartered to
and operated by Alaska Tanker Company (ATC), which transports BP
Alaskan crude oil from Valdez. NASSCO delivered two more in 2005 and
the fourth was delivered in 2006. At the end of 2007, the ATC fleet
consisted of five tankers, all double-hulled.
Outside the US, the BP-operated fleet of tankers is subject to
international spill response and preparedness regulations that are
typically promulgated through the International Maritime Organization
(IMO) and implemented by the relevant flag state authorities. The
International Convention for the Prevention of Pollution from Ships
(Marpol 73/78) requires vessels to have detailed ship-board emergency
and spill prevention plans. The International Convention on Oil Pollution,
Preparedness, Response and Co-operation requires vessels to have
adequate spill response plans and resources for response anywhere the
vessel travels. These conventions and separate Marine Environmental
Protection Circulars also stipulate the relevant state authorities around
the globe that require engagement in the event of a spill. All these
requirements together are addressed by the vessel owners in Shipboard
Oil Pollution Emergency Plans. BP Shipping’s liabilities for oil pollution
damage under the OPA 90 and outside the US under the 1969/1992
International Convention on Civil Liability for Oil Pollution Damage (CLC)
are covered by marine liability insurance, having a maximum limit of
$1 billion for each accident or occurrence. This insurance cover is
provided by three mutual insurance associations (P&I Clubs): The United
Kingdom Steam Ship Assurance Association (Bermuda) Limited; The
Britannia Steam Ship Insurance Association Limited; and The Standard
Steamship Owners’ Protection and Indemnity Association (Bermuda)
Limited. With effect from 20 February 2006, two new complementary
voluntary oil pollution compensation schemes were introduced by tanker
owners, supported by their P&I Clubs, with the agreement of the
International Oil Pollution Compensation Fund at the IMO. Pursuant to
both these schemes, tanker owners will voluntarily assume a greater
liability for oil pollution compensation in the event of a spill of persistent
oil than is provided for in CLC. The first scheme, the Small Tanker
Owners’ Pollution Indemnification Agreement (STOPIA), provides
for a minimum liability of 20 million Special Drawing Rights (around
$30 million) for a ship at or below 29,548 gross tons, while the second
scheme, the Tanker Owners’ Pollution Indemnification Agreement
(TOPIA), provides for the tanker owner to take a 50% stake in the 2003
Supplementary Fund, that is, an additional liability of up to 273.5 million
Special Drawing Rights (around $430 million). Both STOPIA and TOPIA
will only apply to tankers whose owners are party to these agreements
and who have entered their ships with P&I Clubs in the International
Group of P&I Clubs, so benefiting from those clubs’ pooling and
reinsurance arrangements. All BP Shipping’s managed and time-
chartered vessels participate in STOPIA and TOPIA.
At the end of 2007, we had 53 international vessels (39 medium-size
crude and product carriers, four very large crude carriers, one North Sea
shuttle tanker, five LNG carriers and four LPG carriers). All these ships
are double-hulled. Of the five LNG carriers, BP manages one on behalf of
a joint venture in which it is a participant and operates four LNG carriers.
Three further LNG carriers are on order for delivery in 2008. In addition to
its own fleet, BP will continue to charter quality ships; all vessels will
continue to be vetted prior to each use in accordance with the BP group
ship vetting policy.
US regional review
The following is a summary of significant US environmental issues and
legislation or regulations affecting the group.
The Clean Air Act and its regulations require, among other things,
stringent air emission limits and operating permits for chemicals plants,
refineries, marine and distribution terminals; stricter fuel specifications
and sulphur reductions; enhanced monitoring of major sources of
specified pollutants; and risk management plans for storage of hazardous
substances. This law affects BP facilities producing, storing, refining,
manufacturing and distributing oil and products as well as the fuels
themselves. Federal and state controls on ozone, particulate matter,
carbon monoxide, benzene, sulphur, MTBE, nitrogen dioxide, oxygenates
and Reid Vapor Pressure affect BP’s activities and products in the US. BP
is continually adapting its business to these rules, which are subject to
recent change. Beginning January 2006, all gasoline produced by BP was
subject to the EPA’s stringent low-sulphur standards. Furthermore, by
June 2006, at least 80% of the highway diesel fuel produced each year
by BP was required to meet a sulphur cap of 15 parts per million (ppm)
and 100% with effect from January 2010. By June 2007, all non-road
diesel fuel production had to meet a sulphur cap of 500ppm and 15ppm
by June 2012. With effect from January 2011, EPA’s Mobile Source Air
Toxics regulations will require a refinery annual average benzene level of
0.62 volume percentage on all gasoline.
The Energy Policy Act of 2005 also required several changes to the US
fuels market with the following fuel provisions: elimination of the Federal
Reformulated Gasoline (RFG) oxygen requirement in May 2006;
establishment of a renewable fuels mandate (4 billion gallons in 2006,
increasing to 7.5 billion in 2012); consolidation of the summertime RFG
Volatile organic compound (VOC) standards for Regions 1 and 2;
provision to allow the Ozone Transport Commission states on the east
coast to opt any area into RFG; and a provision to allow states to repeal
the 1psi Reid Vapor Pressure waiver for 10% ethanol blends.
In 2001, BP entered into a consent decree with the EPA and several
states that settled alleged violations of various Clean Air Act
requirements related largely to emissions of sulphur dioxide and nitrogen
oxides at BP’s refineries. Implementation of the decree’s requirements
continues.
The Clean Water Act is designed to protect and enhance the quality of
US surface waters by regulating the discharge of wastewater and other
discharges from both onshore and offshore operations. Facilities are
required to obtain permits for most surface water discharges, install
control equipment and implement operational controls and preventative
measures, including spill prevention and control plans. Requirements
under the Clean Water Act have become more stringent in recent years,
including coverage of storm and surface water discharges at many more
facilities and increased control of toxic discharges. New regulations are
expected during the next several years that could require, for example,
additional wastewater treatment systems at some facilities.
The Resource Conservation and Recovery Act (RCRA) regulates the
storage, handling, treatment, transportation and disposal of hazardous
and non-hazardous wastes. It also requires the investigation and
remediation of locations at a facility where such wastes have been
handled, released or disposed of. BP facilities generate and handle a
number of wastes regulated by RCRA and have units that have been
used for the storage, handling or disposal of RCRA wastes that are
subject to investigation and corrective action.
Under the Comprehensive Environmental Response, Compensation
and Liability Act (CERCLA or Superfund), waste generators, site owners,
facility operators and certain other parties are strictly liable for part or all
of the cost of addressing sites contaminated by spills or waste disposal
regardless of fault or the amount of waste sent to a site. Additionally,
each state has separate laws similar to CERCLA.
BP has been identified as a Potentially Responsible Party (PRP) under
CERCLA or otherwise named under similar state statutes at
approximately 805 sites. A PRP or named party can incur joint and
several liability for site remediation costs under some of these statutes
and so BP may be required to assume, among other costs, the share
attributed to insolvent, unidentified or other parties. BP has the most
significant exposure for remediation costs at 52 of these sites. For the
remaining sites, the number of parties can range up to 200 or more. BP
expects its share of remediation costs at these sites to be small in
comparison with the major sites. BP has estimated its potential exposure
Filename: U54368_doc3.3d Time: 14:49:39 Date: 25/02/08
Checksum: 397940206
44
at all sites where it has been identified as a PRP or is otherwise named
and has established provisions accordingly. BP does not anticipate that
its ultimate exposure at these sites individually, or in aggregate, will be
significant, except as reported for Atlantic Richfield Company in the
matters below.
The US and the State of Montana seek to hold Atlantic Richfield
Company liable for environmental remediation, related costs and natural
resource damages arising out of mining-related activities by Atlantic
Richfield’s predecessors in the upper Clark Fork River Basin (basin).
Federal and state trustees also seek to recover damages for alleged
injuries to natural resources in the basin. Past settlements resolved
Atlantic Richfield’s alleged liability for portions of these claims. In 2007,
the parties reached an agreement in principle in which Atlantic Richfield
agreed to pay approximately $169 million, plus interest, to settle all
remaining claims for natural resource damages in the basin, and federal
and state claims for environmental remediation and related costs in the
Clark Fork River operable unit and in portions of the Anaconda operable
unit owned by the State of Montana. Under the agreement, the State of
Montana agreed to use most of the settlement funds to remediate and
restore the identified areas. The settlement must be lodged in federal
court and is contingent on government review of public comments on
the settlement, and court approval of the settlement. It includes limited
reservations of rights against Atlantic Richfield. Other portions of the
basin, principally in Anaconda and Butte, still require remediation. The
estimated future cost of completing remedies that the EPA has selected
or proposed in the other remaining operable units in the basin is
approximately $290 million. Past settlements between Atlantic Richfield,
the US and the State of Montana, including consent decree settlements
in other portions of the basin, may provide a framework for future
settlement of the remaining claims.
The group is also subject to other claims for natural resource damages
(NRD) under CERCLA, OPA 90 and other federal and state laws. NRD
claims have been asserted by government trustees against a number of
group operations. This is a developing area of the law that could affect
the cost of addressing environmental conditions at some sites in the
future.
In the US, many environmental clean-ups are the result of strict
groundwater protection standards at both the state and federal level.
Contamination or the threat of contamination of current or potential
drinking water resources can result in stringent clean-up requirements
even if the water is not being used for drinking water. Some states have
even addressed contamination of non-potable water resources using
similarly strict standards. BP has encouraged risk-based approaches to
these issues and seeks to tailor remedies at its facilities to match the
level of risk presented by the contamination.
Other significant legislation includes the Toxic Substances Control Act,
which regulates the development, testing, import, export and
introduction of new chemical products into commerce; the Occupational
Safety and Health Act, which imposes workplace safety and health,
training and process safety requirements to reduce the risks of physical
and chemical hazards and injury to employees; and the Emergency
Planning and Community Right-to-Know Act, which requires emergency
planning and spill notification as well as public disclosure of chemical
usage and emissions. In addition, the US Department of Transport (DOT),
through the Pipeline and Hazardous Materials Safety Administration,
comprehensively regulates the transportation of the group’s petroleum
products such as crude oil, gasoline and chemicals to protect the health
and safety of the public.
BP is subject to the Marine Transportation Security Act (MTSA) and
the DOT Hazardous Materials (HAZMAT) security compliance regulations
in the US. These regulations require many of our US businesses to
conduct security vulnerability assessments and prepare security
mitigation plans that require the implementation of upgrades to security
measures, the appointment and training of designated security personnel
and the submission of plans for approval and inspection by government
agencies.
The US government, in an effort to further mitigate the threat of
terrorism to critical US infrastructure, is additionally mandating two new
security legislation initiatives, which began in the fourth quarter of 2007
and will continue through 2008:
– Chemical Facility Anti-Terrorism Standard (CFATS) rollout starting in
2007/2008.
– Transportation Workers Identification Credential (TWIC) rollout starting
in 2007/2008.
CFATS is new legislation that began implementation in the fourth
quarter of 2007 and will continue through 2008. It is intended to provide
an enhanced security posture for US facilities that manufacture or store
fuels. Additionally, it will cover facilities that have national economic
impact to the US, should these facilities be a target for terrorism. A
number of BP facilities will be impacted by this legislation. Compliance
will require them to complete a screening review, and if not found to be
exempt, they will be required to conduct a detailed security vulnerability
assessment and a detailed security plan for each facility impacted.
TWIC is a new government employee background screening
programme that is linked to the MTSA facilities. The programme requires
all designated personnel with unescorted access to restricted areas of
the MTSA designated facilities to submit to a detailed background
screening programme and to be issued a bio-metric identification card.
All of BP’s MTSA-regulated facilities will be impacted and will be required
to comply by the end of 2008 in a phased in approach.
BP has a national spill response team, the BP Americas Response
Team (BART), consisting of approximately 250 trained emergency
responders at group locations throughout North America. In addition to
the BART, there are five Regional Response Incident Management
Teams, a number of HAZMAT Teams and emergency response teams at
our major facilities. Collectively, these teams are ready to assist in a
response to a major incident.
See also Legal proceedings on page 84.
European Union regional review
Within the EU, European Community legislation is proposed by the
European Commission (EC) and usually adopted jointly by the European
Parliament and the Council of Ministers. It must then be implemented by
each EU member state. When implementing EU legislation, member
states must ensure that penalties for non-compliance are effective,
proportionate and dissuasive, and must usually designate a ‘competent
authority’ (regulatory body) for implementation. Where the EC believes
that a member state has failed fully and correctly to transpose and
implement EU legislation, it can take the member state to the European
Court of Justice, which can order the member state to comply and in
certain cases can impose monetary penalties on the member state. A
few non-EU states may also agree to apply EU environmental legislation,
in particular under the framework of the European Economic Area
agreement.
An EC directive for a system of integrated pollution prevention and
control (IPPC) was adopted in 1996. This system requires certain listed
industrial installations, including most activities and processes
undertaken by the oil and petrochemicals industry within the EU, to
obtain an IPPC permit, which is designed to address an installation’s
environmental impacts, air emissions, water discharges and waste in a
comprehensive fashion. The permit requires, among other things, the
application of Best Available Techniques (BAT), taking into account the
costs and benefits, unless an applicable environmental quality standard
requires more stringent restrictions, and an assessment of existing
environmental impacts and future site closure obligations. All such plants
had to obtain such a permit by 30 October 2007 and permits may include
an environmental improvement programme. The EC is currently
reviewing the IPPC directive with the primary aim of merging several
separate directives related to industrial emissions into a single directive.
Initial indications suggest there is a strong desire by the EC to propose a
more prescriptive piece of legislation with a greater emphasis on
mandating emission limits contained in guidance documents. In
particular, the review is likely to propose more stringent regulations of
combustion plant (with scope increased to include plants down to 20MW
thermal input), extend IPPC to cover organic chemical manufacture by
biological treatment (biofuels) and may open the way for NOx and SOx
trading by member states.
Filename: U54368_doc3.3d Time: 14:49:39 Date: 25/02/08
Checksum: -371984629
BP ANNUAL REPORT AND ACCOUNTS 2007 45
In 2005, the EC published its Thematic Strategy on Air Pollution, which
outlines EU-wide targets for health and environmental benefits from
improved air quality to be achieved through further controls on emissions
of fine particulates (PM 2.5 – particulate matter less than 2.5 microns
diameter), sulphur dioxide, oxides of nitrogen, volatile organic
compounds and ammonia. Associated with this are two important
directives.
The first is the Ambient Air Quality and Cleaner Air for Europe
Directive (AAQD). This consolidates existing ambient air quality legislation
(which prescribes ambient air quality limit values for sulphur dioxide,
oxides of nitrogen, particulate matter, lead, carbon monoxide, ozone,
cadmium, arsenic, nickel, mercury and polyaromatic hydrocarbons) and
introduces new controls on the concentration of fine particles in ambient
air. If the concentration of a pollutant exceeds air quality limit values plus
a margin of tolerance, or there is a risk of exceeding the limit, a member
state is required to take action to reduce emissions. This may affect any
BP operations whose emissions contribute to such exceedances.
The second is a revision to the National Emissions Ceiling Directive
(NECD). This will introduce new emissions ceilings for each member
state for fine particles and will tighten existing ceilings for sulphur
dioxide, oxides of nitrogen, volatile organic compounds and ammonia, in
order to achieve the health and environmental benefits set in the
Thematic Strategy referenced above. The ceilings set for a member state
will trigger a range of abatement measures across industrial sectors that
are assessed as being a cost effective means of achieving the ceiling.
Recent climate change targets announced by the European Council in
March 2007, together with developments in the atmospheric modeling
that underpins the Thematic Strategy and NECD, mean that the proposal
for the revision has been delayed until early summer 2008 and may be
more stringent and therefore more costly for industry than anticipated.
In early 2007, the EC published its proposal to amend the current EU
Fuel Quality Directive. This directive seeks to set environment limits on
gasoline and diesel road transport fuels, and as such is linked historically
to the EU legislation on vehicle (passenger car and heavy duty) regulated
emissions (the ‘Euro standards’) and has previously set the legislative
timetable for the introduction of ultra-low sulphur (50ppm) and sulphur-
free (510ppm) fuels. However, a major theme of the EC’s new proposal
concerns biofuel policy, both directly in terms of a proposal to set life
cycle GHG emission reductions and indirectly in terms of attempting
facilitating the introduction of biofuels into gasoline and diesel.
Specifically the key elements of the EC’s current proposal are:
– Confirmation of the 1 January 2009 sulphur-free (510ppm) deadline
date for road diesel (alignment with the gasoline deadline).
– The reduction of non-road gasoil sulphur and inland waterway gasoil
sulphur to 10ppm by 31 December 2009 and 31 December 2011
respectively.
– The reduction of the Poly-cyclic Aromatic Hydrocarbon (PAH)
specification in diesel from 11% by weight to 8% by weight.
– The creation of a separate grade of gasoline allowing the blending to
up to 10% by volume ethanol or its equivalent.
– The provision of a summer-time gasoline vapour pressure waiver for
blends containing ethanol.
– Article 7a, requiring fuel suppliers to reduce the life-cycle GHG
emissions from road transport fuels by 10% by 2020.
The key items of impact to BP are the attempt to create an additional
gasoline grade, and Article 7a and its potential impact on conventional
gasoline and diesel.
Registration, Evaluation and Authorization of Chemicals (REACH)
legislation became effective 1 June 2007 across all member states of the
EU. All chemical substances manufactured in, or imported into, the EU in
quantities above 1 tonne per annum must be registered by each
manufacturer/importer with the new European Chemical Agency (ECHA)
based in Helsinki, Finland. Registration will occur during the period 2008-
2018, with the exact timing being determined by the volumes of
chemicals manufactured/imported, and by the hazard the chemical may
pose to human health and the environment. Time limited authorizations
may be granted for substances of ‘high concern’. Crude oil and natural
gas are exempt, while fuels will be exempted from authorization but not
registration. In BP, REACH will affect our refining, petrochemicals and
other chemical manufacturing operations, with many other businesses,
such as lubricants, also being impacted in their roles as an importer or
downstream user of chemicals. BP’s updated broad estimate (there are
still many unknowns) indicates that the cost impacts of REACH for BP,
covering hundreds of registrations, are expected to be in the region of
$60 million over the period 2008-2018, with about two-thirds in the
period 2008-2010. Additional costs, for example submissions for
authorization for relevant substances and the modification of safety data
sheets, will have to be assessed further as the regulation is
implemented.
The EC adopted a Directive on Environmental Liability on 21 April
2004. From 30 April 2007, member states must usually require the
operators of activities that cause significant damage to water, ecological
resources or land after that date to undertake restoration of that damage.
Provision is also made for reporting and tackling imminent threats of
such damage.
During the past two years, BP has contributed actively to the High
Level Group on Competitiveness, Energy and the Environment chaired by
the EC and involving a range of stakeholders from EU member states,
industry, regulators, NGOs and trade unions. This group worked
successfully on a consensus basis, to offer a range of recommendations
to the EC intended to support energy and environmental policy objectives
while advancing the competitiveness of the European economy.
In early 2008, the EC is expected to release a directive on the
geological storage of CO2 and an accompanying communication
regarding incentives for carbon capture and storage (CCS). The intention
of the regulation is in part to identify regulatory barriers that may restrict
CCS technologies, so that those barriers can be appropriately addressed,
and to identify common methodologies to be implemented across EU
member states.
In 2005, the EC published a proposed EC Marine Strategy Directive,
which would adopt an approach similar to that in the Water Framework
Directive by requiring achievement of ‘good environmental status’ for
marine waters by 2021 through the implementation of programmes of
measures. The legislation may have some impact on BP’s upstream
operations in the North Sea.
Another environment-related regulation that may have an impact on
BP’s operations is the Major Hazards Directive, which, for the sites to
which it applies, requires emergency planning, public disclosure of
emergency plans and ensuring that hazards are assessed and effective
emergency management systems are in place.
Property, plants and equipment
BP has freehold and leasehold interests in real estate in numerous
countries, but no individual property is significant to the group as a
whole. See Exploration and Production on page 14 for a description of
the group’s significant reserves and sources of crude oil and natural gas.
Significant plans to construct, expand or improve specific facilities are
described under each of the business headings within this section.
Organizational structure
The significant subsidiaries of the group at 31 December 2007 and to the
group percentage of ordinary share capital (to the nearest whole number)
are set out in Financial statements – Note 46 on page 167. See Financial
statements – Notes 26 and 27 on pages 134 and 135 respectively for
information on significant jointly controlled entities and associates of the
group.

Filename: U54368_doc3.3d Time: 14:49:40 Date: 25/02/08
Checksum: 1265243167
46
Financial and operating performance
Group operating results
The following summarizes the group’s operating results.
$ million except per share amounts--------------------------------------------------------------------------------------------------------------------------------------------------------------------------------------------------------------------------------------------------------------------------------------------------------
2007 2006 2005--------------------------------------------------------------------------------------------------------------------------------------------------------------------------------------------------------------------------------------------------------------------------------------------------------
Sales and other operating revenues from continuing operationsa 284,365 265,906 239,792
Profit from continuing operationsa 21,169 22,311 22,448
Profit for the year 21,169 22,286 22,632
Profit for the year attributable to BP shareholders 20,845 22,000 22,341
Profit attributable to BP shareholders per ordinary share – cents 108.76 109.84 105.74
Dividends paid per ordinary share – cents 42.30 38.40 34.85
a Excludes Innovene, which was treated as a discontinued operation in accordance with IFRS 5 ‘Non-current Assets Held for Sale and Discontinued Operations’. See Financialstatements – Note 3 on page 110.
Business environment
Crude oil prices reached new record highs in 2007 in nominal terms. The
average dated Brent price rose to $72.39 per barrel, an increase of 11%
over the $65.14 per barrel average seen in 2006. Daily prices began the
year at $58.62 per barrel and rose to $96.02 per barrel at year-end due to
OPEC production cuts in early 2007, sustained consumption growth and
the resulting drop in commercial inventories after the summer.
Natural gas prices in the US and the UK declined in 2007. The Henry
Hub First of Month Index averaged $6.86 per mmBtu, 5% lower than the
2006 average of $7.24 per mmBtu. Prices were pressured by record LNG
imports in summer, continued domestic production growth and
inventories that set a new record at the end of the storage injection
season. Average UK gas prices fell to 29.95 pence per therm at the
National Balancing Point in 2007, 29% below the 2006 average of
42.19 pence per therm.
Refining margins reached a new record high in 2007, with the BP
Global Indicator Margin (GIM) averaging $9.94 per barrel. The premium
for light products above fuel oils remained exceptionally high, reflecting a
continuing shortage of upgrading capacity and favouring fully upgraded
refineries over less complex sites.
The retail environment continued to be extremely competitive in 2007
with market volatility, high absolute prices, as well as a rising crude
market.
The business environment in 2006 was mixed compared with 2005,
but still robust in comparison with historical averages. Crude oil and UK
natural gas prices increased, while US natural gas prices and global
refining margins fell.
The dated Brent price averaged $65.14 per barrel, an increase of more
than $10 per barrel over the $54.48 per barrel average seen in 2005, and
varied between $78.69 and $55.89 per barrel. Prices peaked in early
August before retreating in the face of a mild hurricane season and rising
inventories. OPEC action late in the year helped support prices.
Natural gas prices in the US declined in 2006 compared with 2005, but
remained well above historical averages. The Henry Hub First of Month
Index averaged $7.24 per mmBtu, $1.41 per mmBtu below the 2005
average of $8.65 per mmBtu. Rising production and weak consumption
resulted in above average inventories, depressing gas prices relative to
crude oil. UK gas prices rose slightly in 2006, averaging 42.19 pence per
therm at the National Balancing Point, compared with a 2005 average of
40.71 pence per therm.
Refining margins were only slightly lower in 2006, with the BP GIM
averaging $8.39 per barrel. This reflected further oil demand growth,
lingering effects on US refinery production from the 2005 hurricanes and
gasoline formulation changes in several US states. The premium for light
products over fuel oils remained exceptionally high, favouring upgraded
refineries over less complex sites.
Retail margins improved slightly in 2006, benefiting from a decline in
the cost of product during the second half of the year, despite intense
competition.
Hydrocarbon production
Our total hydrocarbon production during 2007 averaged 2,549mboe/d for
subsidiaries and 1,269mboe/d for equity-accounted entities, a decrease
of 3% (3.5% for liquids and 2.6% for gas) and 2% (1.3% for liquids and
8.4% for gas) respectively compared with 2006. In aggregate, the
decrease primarily reflected the effect of disposals and net entitlement
reductions in our PSAs. Compared with 2005, 2006 hydrocarbon
production for subsidiaries decreased by 3.3% in 2006 reflecting a
decrease of 5.1% for liquids and a decrease of 1.3% for natural gas.
Increases in production in our new profit centres were offset by
anticipated decline in our existing profit centres and the effect of
disposals. Hydrocarbon production for equity-accounted entities
increased by 0.1%, reflecting a decrease of 1.3% for liquids and an
increase of 10.2% for natural gas.
Profit attributable to BP shareholders
Profit attributable to BP shareholders for the year ended 31 December
2007 was $20,845 million, including inventory holding gains of $3,558
million. Inventory holding gains or losses are described in footnote a
below. Profit attributable to BP shareholders for the year ended
31 December 2006 was $22,000 million, after inventory holding losses of
$253 million. Profit attributable to BP shareholders for the year ended
31 December 2005 was $22,341 million, including inventory holding
gains of $3,027 million. The profit attributable to BP shareholders for the
year ended 31 December 2006 included a loss from Innovene operations
of $25 million, compared with a profit of $184 million in the year ended
31 December 2005. The loss/profit from Innovene for the years 2006 and
2005 included losses on remeasurement to fair value of $184 million and
$591 million respectively. Financial statements – Note 3 on page 110
provides further financial information for Innovene.
Profit attributable to BP shareholders for the year ended 31 December
2007 included net gains of $2,132 million on the disposal of assets; and
was after net impairment charges of $1,324 million, a further charge of
$500 million in respect of the March 2005 Texas City refinery incident, a
charge of $338 million associated with restructuring (with a further
charge of $1 billion expected in 2008), a charge of $185 million in relation
to new, and revisions to existing, environmental and other provisions, a
charge of $91 million in respect of a donation to the BP Foundation, a net
fair value loss of $7 million on embedded derivatives (these embedded
derivatives are fair valued at each period end with the resulting gains or
losses taken to the income statement) and a charge of $410 million in
respect of the reassessment of certain provisions.
Profit attributable to BP shareholders for the year ended 31 December
2006 included net gains of $3,286 million on the disposal of assets, net
fair value gains of $608 million on embedded derivatives and a credit of
$44 million in relation to new, and revisions to existing, environmental
and other provisions; and was after a charge of $925 million in respect of
the March 2005 Texas City refinery incident, a charge of $535 million
relating to the reassessment of certain provisions, a charge of
$155 million in respect of a donation to the BP Foundation and a net
impairment charge of $121 million.
Filename: U54368_doc3.3d Time: 14:49:40 Date: 25/02/08
Checksum: 687306093
BP ANNUAL REPORT AND ACCOUNTS 2007 47
Profit attributable to BP shareholders for the year ended 31 December
2005 included net gains of $1,429 million on the disposal of assets; and
was after net fair value losses of $2,047 million on embedded
derivatives, a charge of $700 million in respect of the March 2005 Texas
City refinery incident, a charge of $412 million in respect of new, and
revisions to existing, environmental and other provisions, an impairment
charge of $359 million and a charge of $134 million relating to the
separation of the Olefins and Derivatives business.
(See Environmental expenditure on page 53 for more information on
environmental charges.)
The primary additional factors reflected in profit for 2007, compared
with 2006, were higher liquids realizations, stronger refining and
marketing margins and improved NGLs performance; however, these
were more than offset by lower gas realizations, lower reported
production volumes, higher production taxes in Alaska, higher costs
(primarily reflecting the impact of sector-specific inflation and higher
integrity spend), the impact of outages and recommissioning costs at the
Texas City and Whiting refineries, reduced supply optimization benefits
and a lower contribution from the marketing and trading business in the
Gas, Power and Renewables segment.
The primary additional factors reflected in profit attributable to BP
shareholders for the year ended 31 December 2006 compared with 2005
were higher oil realizations, higher refining margins (including the benefit
of supply optimization), higher retail margins (although this was partially
offset by a deterioration in other marketing margins) and higher
contributions from the operating businesses in the Gas, Power and
Renewables segment; these were offset by the ongoing impact
following the Texas City refinery shutdown, lower gas realizations, lower
production volumes and higher costs.
Profits and margins for the group and for individual business segments
can vary significantly from period to period as a result of changes in such
factors as oil prices, natural gas prices and refining margins. Accordingly,
the results for the current and prior periods do not necessarily reflect
trends, nor do they provide indicators of results for future periods.
Employee numbers were approximately 97,600 at 31 December 2007,
97,000 at 31 December 2006 and 96,200 at 31 December 2005.
a Inventory holding gains and losses represent the difference between the cost ofsales calculated using the average cost of supplies incurred during the year and thecost of sales calculated on the first-in first-out (FIFO) method. Under the FIFOmethod, which we use for IFRS reporting, the cost of inventory charged to theincome statement is based on the historic cost of acquisition or manufacture ratherthan the current replacement cost. In volatile energy markets, this can have asignificant distorting effect on reported income. The amounts disclosed representthe difference between the charge to the income statement on a FIFO basis andthe charge that would arise using average cost of supplies incurred during theperiod. For this purpose average cost of supplies incurred during the period iscalculated by dividing the total cost of inventory purchased in the period by thenumber of barrels acquired. The amounts disclosed are not separately reflected inthe financial statements as a gain or loss.
BP’s management believes this information is useful to illustrate to investors thefact that crude oil and product prices can vary significantly from period to period andthat the impact on our reported result under IFRS can be significant. Inventoryholding gains and losses vary from period to period due principally to changes in oilprices as well as changes to underlying inventory levels. In order for investors tounderstand the operating performance of the group excluding the impact of oil pricechanges on the replacement of inventories, and to make comparisons of operatingperformance between reporting periods, BP’s management believes it is helpful todisclose this information.
Capital expenditure and acquisitions
$ million------------------------------------------------------------------------------------------------------------------------------- -----------------
2007 2006 2005------------------------------------------------------------------------------------------------------------------------------- -----------------
Exploration and Production 13,661 13,075 10,149
Refining and Marketing 4,447 3,122 2,757
Gas, Power and Renewables 811 432 235
Other businesses and corporate 275 281 797------------------------------------------------------------------------------------------------------------------------------- -----------------
Capital expenditure 19,194 16,910 13,938
Acquisitions and asset exchanges 1,447 321 211------------------------------------------------------------------------------------------------------------------------------- -----------------
20,641 17,231 14,149
Disposals (4,267) (6,254) (11,200)------------------------------------------------------------------------------------------------------------------------------- -----------------
Net investment 16,374 10,977 2,949
Capital expenditure and acquisitions in 2007, 2006 and 2005 amounted to
$20,641 million, $17,231 million and $14,149 million respectively.
Acquisitions in 2007 included the remaining 31% of the Rotterdam
(Nerefco) refinery from Chevron’s Netherlands manufacturing company.
There were no significant acquisitions in 2006 or 2005.
Excluding acquisitions and asset exchanges, capital expenditure for
2007 was $19,194 million compared with $16,910 million in 2006 and
$13,938 million in 2005. In 2006, this included $1 billion in respect of our
investment in Rosneft.
Finance costs and other finance income/expense
Finance costs comprises group interest less amounts capitalized. Finance
costs for continuing operations in 2007 were $1,110 million compared
with $718 million in 2006 and $616 million in 2005. The charge in 2007
reflected a higher average gross debt balance than in prior years, and
lower capitalized interest than in 2006 as capital construction projects
concluded. The increase for 2006 compared with 2005 reflected higher
interest rates, partially offset by increased capitalized interest. Finance
costs in 2005 included a charge of $57 million arising from early
redemption of finance leases.
Other finance income/expense included net pension finance costs, the
interest accretion on provisions and, for 2005 and 2006, the interest
accretion on the deferred consideration for the acquisition of our
investment in TNK-BP. Other finance income for continuing operations in
2007 was $369 million compared with $202 million in 2006 and a net
expense of $145 million in 2005. The increase in income year on year
largely reflects the higher return on pension assets as the pension asset
base applicable to each year increased, reflecting rising asset market
valuations.
Taxation
The charge for corporate taxes for continuing operations in 2007
was $10,442 million, compared with $12,331 million in 2006 and
$9,473 million in 2005. The effective rate was 33% in 2007, 36% in 2006
and 30% in 2005. The reduction in the effective rate in 2007 compared
with 2006 primarily reflects the reduction in the UK tax rate and a
higher proportion of income arising in countries bearing a lower tax
rate and other factors. The increase in the effective rate in 2006
compared with 2005 reflected the impact of the increase in the North
Sea tax rate enacted by the UK government in July 2006 and the
absence of non-recurring benefits that were present in 2005.
Business results
Profit before interest and taxation from continuing operations, which is
before finance costs, other finance expense, taxation and minority
interests, was $32,352 million in 2007, $35,158 million in 2006 and
$32,682 million in 2005.

Filename: U54368_doc3.3d Time: 14:49:41 Date: 25/02/08
Checksum: -11271603
48
Exploration and Production
$ million--------------------------------------------------------------------------------------------------------------------------------------------------------------------------------------------------------------------------------------------------------------------------------------------------------
2007 2006 2005--------------------------------------------------------------------------------------------------------------------------------------------------------------------------------------------------------------------------------------------------------------------------------------------------------
Sales and other operating revenues from continuing operations 54,550 52,600 47,210Profit before interest and tax from continuing operationsa 26,938 29,629 25,502Results include:
Exploration expense 756 1,045 684Of which: Exploration expenditure written off 347 624 305
$ per barrel--------------------------------------------------------------------------------------------------------------------------------------------------------------------------------------------------------------------------------------------------------------------------------------------------------
Key statisticsAverage BP crude oil realizationsb
UK 70.36 62.45 51.22US 68.51 62.03 50.98Rest of World 70.86 61.11 48.32BP average 69.98 61.91 50.27
Average BP NGL realizationsb
UK 52.71 47.21 37.95US 44.59 36.13 31.94Rest of World 48.14 36.03 35.11BP average 46.20 37.17 33.23
Average BP liquids realizationsb c
UK 69.17 61.67 50.45US 64.18 57.25 47.83Rest of World 69.56 59.54 47.56BP average 67.45 59.23 48.51
$ per thousand cubic feet--------------------------------------------------------------------------------------------------------------------------------------------------------------------------------------------------------------------------------------------------------------------------------------------------------
Average BP US natural gas realizationsb
UK 6.40 6.33 5.53US 5.43 5.74 6.78Rest of World 3.71 3.70 3.46BP average 4.53 4.72 4.90
$ per barrel--------------------------------------------------------------------------------------------------------------------------------------------------------------------------------------------------------------------------------------------------------------------------------------------------------
Average West Texas Intermediate oil price 72.20 66.02 56.58Alaska North Slope US West Coast 71.68 63.57 53.55Average Brent oil price 72.39 65.14 54.48
$ per million British thermal units--------------------------------------------------------------------------------------------------------------------------------------------------------------------------------------------------------------------------------------------------------------------------------------------------------
Average Henry Hub gas priced 6.86 7.24 8.65
pence per therm--------------------------------------------------------------------------------------------------------------------------------------------------------------------------------------------------------------------------------------------------------------------------------------------------------
Average UK National Balancing Point gas price 29.95 42.19 40.71
thousand barrels per day--------------------------------------------------------------------------------------------------------------------------------------------------------------------------------------------------------------------------------------------------------------------------------------------------------
Total liquids production for subsidiariesc e 1,304 1,351 1,423Total liquids production for equity-accounted entitiesc e 1,110 1,124 1,139
million cubic feet per day--------------------------------------------------------------------------------------------------------------------------------------------------------------------------------------------------------------------------------------------------------------------------------------------------------
Natural gas production for subsidiariese 7,222 7,412 7,512Natural gas production for equity-accounted entitiese 921 1,005 912
thousand barrels of oil equivalent per day--------------------------------------------------------------------------------------------------------------------------------------------------------------------------------------------------------------------------------------------------------------------------------------------------------
Total production for subsidiariese f 2,549 2,629 2,718Total production for equity-accounted entitiese f 1,269 1,297 1,296
a Includes profit after interest and tax of equity-accounted entities.b The Exploration and Production segment does not undertake any hedging activity. Consequently, realizations reflect the market price achieved.c Crude oil and natural gas liquids.d Henry Hub First of Month Index.e Net of royalties.f Expressed in thousands of barrels of oil equivalent per day (mboe/d). Natural gas is converted to oil equivalent at 5.8 billion cubic feet = 1 million barrels.
Sales and other operating revenues for 2007 were $55 billion, compared holding gains of $11 million; and was after a net impairment charge of
with $53 billion in 2006 and $47 billion in 2005. The increase in 2007 $55 million, restructuring costs of $166 million, a charge of $168 million
primarily reflected an increase of around $3.5 billion related to higher in respect of the reassessment of certain provisions and a charge of
realizations, partially offset by a decrease of around $1.5 billion due to $12 million in respect of new, and revisions to existing, environmental
lower volumes of subsidiaries. The increase in 2006 primarily reflected an and other provisions.
increase of around $6 billion related to higher liquids and gas realizations, Profit before interest and tax for the year ended 31 December 2006
partially offset by a decrease of around $1 billion due to lower volumes was $29,629 million, including net gains of $2,114 million on the sales of
of subsidiaries. assets (primarily gains from the sales of our interest in the Shenzi
Profit before interest and tax for the year ended 31 December 2007 discovery in the Gulf of Mexico in the US and interests in the North Sea
was $26,938 million, including net gains of $907 million on the sales of offset by a loss on the sale of properties in the Gulf of Mexico Shelf), net
assets (primarily gains from the disposal of our production and gas fair value gains of $515 million on embedded derivatives and a net
infrastructure in the Netherlands, our interests in non-core Permian impairment credit of $203 million (comprising a $340 million credit for
assets in the US and our interests in the Entrada field in the Gulf of reversals of previously booked impairments partially offset by a charge of
Mexico), net fair value gains of $47 million on embedded derivatives $109 million against intangible assets relating to properties in Alaska, and
(these embedded derivatives are fair valued at each period end with the other individually insignificant impairments), and was after inventory
resulting gains or losses taken to the income statement) and inventory
Filename: U54368_doc3.3d Time: 14:49:41 Date: 25/02/08
Checksum: -1011826887
BP ANNUAL REPORT AND ACCOUNTS 2007 49
holding losses of $18 million and charges for legal provisions of around $1,000 million due to the absence of disposal gains in 2006 in
$335 million. equity-accounted entities.
Profit before interest and tax for the year ended 31 December 2005 The primary additional factors reflected in profit before interest and
was $25,502 million, including inventory holding gains of $17 million and tax for the year ended 31 December 2006 compared with the year ended
net gains of $1,159 million on the sales of assets, primarily from our 31 December 2005 were higher overall realizations contributing around
interest in the Ormen Lange field in Norway, and was after net fair value $5,050 million (liquids realizations were higher and gas realizations were
losses of $1,688 million on embedded derivatives, an impairment charge lower), partially offset by decreases of around $1,825 million due to
of $226 million in respect of fields in the Gulf of Mexico, a charge for lower reported volumes, $350 million due to higher production taxes
impairment of $40 million relating to fields in the UK North Sea and a and $1,950 million due to higher costs, reflecting the impacts of
charge of $265 million on the cancellation of an intra-group gas supply sector-specific inflation, increased integrity spend and revenue
contract. investments. Additionally, BP’s share of the TNK-BP result was higher
The primary additional factors reflected in profit before interest and by around $500 million, primarily reflecting higher disposal gains.
tax for the year ended 31 December 2007 compared with the year ended Total production for 2007 was 2,549mboe/d for subsidiaries and
31 December 2006 were higher overall realizations contributing around 1,269mboe/d for equity-accounted entities, compared with 2,629mboe/d
$3,000 million (liquids realizations were higher and gas realizations were and 1,297mboe/d respectively in 2006. In aggregate, the decrease
lower) and a favourable effect from lagged tax reference prices in primarily reflected the effect of disposals and net entitlement reductions
TNK-BP contributing around $500 million; however, these factors were in our PSAs.
more than offset by decreases of around $1,000 million due to lower Total production for 2006 was 2,629mboe/d for subsidiaries and
reported volumes, around $200 million due to higher production taxes in 1,297mboe/d for equity-accounted entities, compared with 2,718mboe/d
Alaska and around $2,800 million due to higher costs, reflecting the and 1,296mboe/d respectively in 2005. For subsidiaries, increases in
impacts of sector-specific inflation, increased integrity spend and higher production in our new profit centres were offset by anticipated decline in
depreciation charges. Additionally, the full-year result was lower by our existing profit centres and the effect of disposals.
Refining and Marketing
$ million--------------------------------------------------------------------------------------------------------------------------------------------------------------------------------------------------------------------------------------------------------------------------------------------------------
2007 2006 2005--------------------------------------------------------------------------------------------------------------------------------------------------------------------------------------------------------------------------------------------------------------------------------------------------------
Sales and other operating revenues from continuing operations 250,866 232,855 213,326
Profit before interest and tax from continuing operationsa 6,072 5,041 6,926
$ per barrel--------------------------------------------------------------------------------------------------------------------------------------------------------------------------------------------------------------------------------------------------------------------------------------------------------
Global Indicator Refining Margin (GIM)b
Northwest Europe 4.99 3.92 5.47
US Gulf Coast 13.48 12.00 11.40
Midwest 12.81 9.14 8.19
US West Coast 15.05 14.84 13.49
Singapore 5.29 4.22 5.56
BP average 9.94 8.39 8.60
%--------------------------------------------------------------------------------------------------------------------------------------------------------------------------------------------------------------------------------------------------------------------------------------------------------
Refining availabilityc 82.9 82.5 92.9
thousand barrels per day--------------------------------------------------------------------------------------------------------------------------------------------------------------------------------------------------------------------------------------------------------------------------------------------------------
Refinery throughputs 2,127 2,198 2,399
a Includes profit after interest and tax of equity-accounted entities.b The GIM is the average of regional industry indicator margins that we weight for BP’s crude refining capacity in each region. Each regional indicator margin is based on a
single representative crude with product yields characteristic of the typical level of upgrading complexity. The refining margins are industry-specific rather than BP-specificmeasures, which we believe are useful to investors in analyzing trends in the industry and their impact on our results. The margins are calculated by BP based on publishedcrude oil and product prices and take account of fuel utilization and catalyst costs. No account is taken of BP’s other cash and non-cash costs of refining, such as wagesand salaries and plant depreciation. The indicator margin may not be representative of the margins achieved by BP in any period because of BP’s particular refiningconfigurations and crude and product slate.
c Refining availability is defined as the ratio of units that are available for processing, regardless of whether they are actually being used, to total capacity. Where there isplanned maintenance, such capacity is not regarded as being available. During 2006 and 2007, there was planned maintenance of a substantial part of the TexasCity refinery.
The changes in sales and other operating revenues are explained in more detail below.
$ million--------------------------------------------------------------------------------------------------------------------------------------------------------------------------------------------------------------------------------------------------------------------------------------------------------
2007 2006 2005--------------------------------------------------------------------------------------------------------------------------------------------------------------------------------------------------------------------------------------------------------------------------------------------------------
Sale of crude oil through spot and term contracts 43,004 38,577 36,992
Marketing, spot and term sales of refined products 194,979 177,995 155,098
Other sales including non-oil and to other segments 12,883 16,283 21,236--------------------------------------------------------------------------------------------------------------------------------------------------------------------------------------------------------------------------------------------------------------------------------------------------------
250,866 232,855 213,326
thousand barrels per day--------------------------------------------------------------------------------------------------------------------------------------------------------------------------------------------------------------------------------------------------------------------------------------------------------
Sale of crude oil through spot and term contracts 1,885 2,110 2,464
Marketing, spot and term sales of refined products 5,624 5,801 5,888
Sales and other operating revenues for 2007 was $251 billion, compared impact due to a weaker dollar of $6 billion, partially offset by lower
with $233 billion in 2006 and $213 billion in 2005. The increase in 2007 volumes of $2 billion. Additionally, sales of crude oil, spot and term
compared with 2006 was principally due to an increase of around contracts increased by $4 billion, primarily reflecting higher prices, and
$17 billion in marketing, spot and term sales of refined products. This other sales decreased by $3 billion, due to lower volumes of $4 billion
was due to higher prices of $13 billion and a positive foreign exchange partially offset by a positive foreign exchange impact of $1 billion.
Filename: U54368_doc3.3d Time: 14:49:41 Date: 25/02/08
Checksum: -260647249
50
Sales and other operating revenues for 2006 was $233 billion, and net gains of $177 million principally on the divestment of a number
compared with $213 billion in 2005 and $171 billion in 2004. The increase of regional retail networks in the US, and is after a charge of $700 million
in 2006 compared with 2005 was principally due to an increase of around related to the March 2005 incident at the Texas City refinery, a charge of
$23 billion in marketing, spot and term sales of refined products. This $140 million relating to new, and revisions to existing, environmental and
was due to higher prices of $25 billion, partially offset by lower volumes other provisions, an impairment charge of $93 million and a charge of
of $2 billion. Additionally, sales of crude oil, spot and term contracts $33 million for the impairment of an equity-accounted entity.
increased by $2 billion, reflecting higher prices of $6 billion and lower During 2007, the segment continued to focus on the restoration of
volumes of $4 billion, and other sales decreased by $5 billion, primarily operations at the Texas City refinery and on investments in integrity
due to lower volumes. management throughout our refining portfolio. We have also focused on
Profit before interest and tax for the year ended 31 December 2007 the repair and recommissioning of the Whiting refinery following the
was $6,072 million, including net disposal gains of $1,151 million operational issues in March 2007. In many parts of the refining portfolio
(primarily related to the sale of BP’s Coryton refinery in the UK, its and the other market-facing businesses, we delivered high reliability and
interest in the West Texas pipeline system in the US and its interest in improved results compared with 2006. However, for the full year,
the Samsung Petrochemical Company in South Korea) and inventory compared with 2006, the impact of the outages and recommissioning
holding gains of $3,455 million; and was after impairment charges of costs at the Texas City and Whiting refineries, as well as investments in
$1,186 million (primarily related to the sale of the majority of our US integrity management and scheduled turnarounds throughout our refining
Convenience Retail business, a write-down of certain assets at our portfolio, reduced the result by around $1,600 million, cost inflation
Hull site and a write-down of our Mexico retail assets), a charge of reduced the result by around $100 million and lower results from supply
$500 million related to the March 2005 Texas City refinery incident, a optimization decreased the result by around $1,500 million. These factors
charge of $138 million relating to new, and revisions to existing, more than offset increased margins in both refining and marketing that
environmental and other provisions, a restructuring charge of $118 contributed around $1,150 million.
million, a charge of $91 million in respect of a donation to the BP In comparison with the year ended 31 December 2005, profit before
Foundation and a charge of $70 million related to the reassessment of interest and tax for the year ended 31 December 2006 reflected higher
certain provisions. refining margins (including the benefit of supply optimization), which
Profit before interest and tax for the year ended 31 December 2006 contributed around $900 million, higher retail margins by around
was $5,041 million, including net disposal gains of $884 million (related $600 million (although this was partially offset by a deterioration of
primarily to the sale of BP’s Czech Republic retail business, the disposal around $150 million in other marketing margins) and lower costs
of BP’s shareholding in Zhenhai Refining and Chemicals Company, the associated with rationalization programmes of around $320 million.
sale of BP’s shareholding in Eiffage, the French-based construction There was a reduction of around $1.1 billion due to the impact of the
company, and pipelines assets), and was after inventory holding losses progressive recommissioning of Texas City during the year. Efficiency
of $242 million, a charge of $925 million related to the March 2005 programmes delivered lower operating costs although the savings were
incident at the Texas City refinery, an impairment charge of $155 million, offset by higher turnaround and integrity management spend.
a charge of $155 million in respect of a donation to the BP Foundation The average refining Global Indicator Margin (GIM) in 2007 was higher
and a charge of $33 million relating to new, and revisions to existing, than in 2006.
environmental and other provisions. Refining throughputs in 2007 were 2,127mb/d, 71mb/d lower than in
Profit before interest and tax for the year ended 31 December 2005 2006. Refining availability was 82.9%, broadly consistent with 2006.
was $6,926 million, including inventory holding gains of $2,532 million Marketing volumes at 3,806mb/d were around 2% lower than in 2006.
Gas, Power and Renewables
$ million--------------------------------------------------------------------------------------------------------------------------------------------------------------------------------------------------------------------------------------------------------------------------------------------------------
2007 2006 2005--------------------------------------------------------------------------------------------------------------------------------------------------------------------------------------------------------------------------------------------------------------------------------------------------------
Sales and other operating revenues from continuing operations 21,369 23,708 25,696
Profit before interest and tax from continuing operationsa 674 1,321 1,172
a Includes profit after interest and tax of equity-accounted entities.
The changes in sales and other operating revenues are explained in more detail below.
$ million--------------------------------------------------------------------------------------------------------------------------------------------------------------------------------------------------------------------------------------------------------------------------------------------------------
2007 2006 2005--------------------------------------------------------------------------------------------------------------------------------------------------------------------------------------------------------------------------------------------------------------------------------------------------------
Gas marketing sales 8,639 11,428 15,222
Other sales (including NGL marketing) 12,730 12,280 10,474--------------------------------------------------------------------------------------------------------------------------------------------------------------------------------------------------------------------------------------------------------------------------------------------------------
21,369 23,708 25,696
million cubic feet per day--------------------------------------------------------------------------------------------------------------------------------------------------------------------------------------------------------------------------------------------------------------------------------------------------------
2007 2006 2005--------------------------------------------------------------------------------------------------------------------------------------------------------------------------------------------------------------------------------------------------------------------------------------------------------
Gas marketing sales volumes 3,382 3,685 5,096
Natural gas sales by Exploration and Production 4,414 5,152 4,747
Sales and other operating revenues for 2007 was $21 billion, compared $4.2 billion related to lower volumes, partially offset by an increase of
with $24 billion in 2006. Gas marketing sales decreased by $2.8 billion $0.4 billion related to higher prices. Other sales (including NGLs
reflecting a decrease of $0.9 billion related to lower volumes and a marketing) increased by $1.8 billion due to higher prices. Gas marketing
decrease of $1.9 billion related to lower prices. Other sales (including sales volumes declined in 2007 and 2006 primarily due to customer
NGLs marketing) increased by $0.5 billion, reflecting an increase of portfolio changes.
$0.8 billion related to higher prices, partially offset by a decrease ofProfit before interest and tax for the year ended 31 December 2007
$0.3 billion related to lower volumes. Sales and other operating revenueswas $674 million, including inventory holding gains of $116 million and
were $24 billion in 2006, compared with $26 billion in 2005. Gasnet disposal gains of $12 million; and was after a net fair value charge of
marketing sales declined by $3.8 billion, reflecting a decrease of
Filename: U54368_doc3.3d Time: 14:49:41 Date: 25/02/08
Checksum: -207671402
BP ANNUAL REPORT AND ACCOUNTS 2007 51
$47 million on embedded derivatives, impairment charges of $40 million in the UK, and was after net fair value losses of $346 million on
and restructuring charges of $22 million. embedded derivatives and a credit of $6 million related to new, and
Profit before interest and tax for the year ended 31 December 2006 revisions to existing, environmental and other provisions.
was $1,321 million, including net gains of $193 million, primarily on the The primary additional factors reflected in profit before interest and tax
disposal of our interest in Enagas, and net fair value gains of $88 million for the year ended 31 December 2007, compared with the equivalent
on embedded derivatives, and was after inventory holding losses of period in 2006, were lower contributions from the marketing and trading
$55 million and a charge $100 million for the impairment of a North businesses of around $700 million partially offset by improved NGL’s
American NGLs asset. performance contributing around $250 million.
Profit before interest and tax for the year ended 31 December 2005 The primary additional factors reflected in profit before interest and tax
was $1,172 million, including inventory holding gains of $95 million, for the year ended 31 December 2006, compared with the equivalent
compensation of $265 million received on the cancellation of an intra- period in 2005, were higher contributions from the operating businesses
group gas supply contract and net gains of $55 million primarily on the of around $100 million.
disposal of BP’s interest in the Interconnector pipeline and a power plant
Other businesses and corporate
$ million--------------------------------------------------------------------------------------------------------------------------------------------------------------------------------------------------------------------------------------------------------------------------------------------------------
2007 2006 2005--------------------------------------------------------------------------------------------------------------------------------------------------------------------------------------------------------------------------------------------------------------------------------------------------------
Sales and other operating revenues from continuing operations 843 1,009 668
Profit (loss) before interest and tax from continuing operationsa (1,128) (885) (1,237)
a Includes profit after interest and tax of equity-accounted entities.
Other businesses and corporate comprises treasury (which includes all of $94 million in relation to new, and revisions to existing, environmental
the group’s cash, cash equivalents and finance debt balances and and other provisions, a net gain on disposal of $95 million and a net fair
associated interest income and finance costs), the group’s aluminium value gain of $5 million on embedded derivatives; and was after a charge
asset, and corporate activities worldwide. of $200 million relating to the reassessment of certain provisions and an
The loss before interest and tax for the year ended 31 December 2007 impairment charge of $69 million.
was $1,128 million, including a net gain on disposal of $62 million; and The loss before interest and tax for the year ended 31 December 2005
was after inventory holding losses of $24 million, a charge of $35 million was $1,237 million, including a net gain on disposal of $38 million; and
in relation to new, and revisions to existing, environmental and other was after a net charge of $278 million relating to new, and revisions to
provisions, a charge of $32 million in respect of restructuring costs, an existing, environmental and other provisions and the reversal of
impairment charge of $43 million, a net fair value loss of $7 million on environmental provisions no longer required, a charge of $134 million in
embedded derivatives and a charge of $172 million relating to the respect of the separation of the Olefins and Derivatives business and net
reassessment of certain provisions. fair value losses of $13 million on embedded derivatives.
The loss before interest and tax for the year ended 31 December 2006
was $885 million, including inventory holding gains of $62 million, a credit

Filename: U54368_doc3.3d Time: 14:49:42 Date: 25/02/08
Checksum: -317436846
52
Non-GAAP information on fair value accounting effects forward prices consistent with the contract maturity. Depending on
BP uses derivative instruments to manage the economic exposure market conditions, these forward prices can be either higher or lower
relating to inventories above normal operating requirements of crude oil, than spot prices resulting in measurement differences.
natural gas and petroleum products as well as certain contracts to supply The Gas, Power and Renewables business enters into contracts for
physical volumes at future dates. Under IFRS, these inventories and pipelines and storage capacity that, under IFRS, are recorded on an
contracts are recorded at historic cost and on an accruals basis accruals basis. These contracts are risk managed using a variety of
respectively. The related derivative instruments, however, are required to derivative instruments that are fair valued under IFRS. This results in
be recorded at fair value with gains and losses recognized in income measurement differences in relation to recognition of gains and losses.
because hedge accounting is either not permitted or not followed, The way that BP manages the economic exposures described above,
principally due to the impracticality of effectiveness testing requirements. and measures performance internally, differs from the way these
Therefore, measurement differences in relation to recognition of gains activities are measured under IFRS. BP calculates this difference by
and losses occur. Gains and losses on these inventories and contracts comparing the IFRS result with management’s internal measure of
are not recognized until the commodity is sold in a subsequent performance, under which the inventory and the supply and capacity
accounting period. Gains and losses on the related derivative commodity contracts in question are valued based on fair value using relevant
contracts are recognized in the income statement from the time the forward prices prevailing at the end of the period. We believe that
derivative commodity contract is entered into on a fair value basis using disclosing management’s estimate of this difference provides useful
forward prices consistent with the contract maturity. information for investors because it enables investors to see the
IFRS requires that inventory held for trading be recorded at its fair economic effect of these activities as a whole. The impacts of
value using period end spot prices whereas any related derivative fair value accounting effects, relative to management’s internal measure
commodity instruments are required to be recorded at values based on of performance, are shown in the table below.
$ million--------------------------------------------------------------------------------------------------------------------------------------------------------------------------------------------------------------------------------------------------------------------------------------------------------
2007 2006 2005--------------------------------------------------------------------------------------------------------------------------------------------------------------------------------------------------------------------------------------------------------------------------------------------------------
Refining and Marketing
Unrecognized gains (losses) brought forward from previous period 72 283 (61)Unrecognized (gains) losses carried forward (429) (72) (283)--------------------------------------------------------------------------------------------------------------------------------------------------------------------------------------------------------------------------------------------------------------------------------------------------------
Favourable (unfavourable) impact relative to management’s measure of performance (357) 211 (344)
Gas, Power and Renewables
Unrecognized gains (losses) brought forward from previous period 155 123 147Unrecognized (gains) losses carried forward (107) (155) (123)--------------------------------------------------------------------------------------------------------------------------------------------------------------------------------------------------------------------------------------------------------------------------------------------------------
Favourable (unfavourable) impact relative to management’s measure of performance 48 (32) 24
(309) 179 (320)Taxation 105 (96) 103--------------------------------------------------------------------------------------------------------------------------------------------------------------------------------------------------------------------------------------------------------------------------------------------------------
(204) 83 (217)
By region
Refining and Marketing
UK (52) 109 (80)Rest of Europe (110) 101 (45)US (165) 13 (220)Rest of World (30) (12) 1--------------------------------------------------------------------------------------------------------------------------------------------------------------------------------------------------------------------------------------------------------------------------------------------------------
(357) 211 (344)
Gas, Power and Renewables
UK 1 63 39Rest of Europe – – (9)US (77) (59) (32)Rest of World 124 (36) 26--------------------------------------------------------------------------------------------------------------------------------------------------------------------------------------------------------------------------------------------------------------------------------------------------------
48 (32) 24
Reconciliation of non-GAAP information
Refining and Marketing
Profit before interest and tax adjusted for fair value accounting effects 6,429 4,830 7,270Impact of fair value accounting effects (357) 211 (344)--------------------------------------------------------------------------------------------------------------------------------------------------------------------------------------------------------------------------------------------------------------------------------------------------------
Profit before interest and tax 6,072 5,041 6,926
Gas, Power and Renewables
Profit before interest and tax adjusted for fair value accounting effects 626 1,238 1,389Impact of fair value accounting effects 48 83 (217)--------------------------------------------------------------------------------------------------------------------------------------------------------------------------------------------------------------------------------------------------------------------------------------------------------
Profit before interest and tax 674 1,321 1,172
Filename: U54368_doc3.3d Time: 14:49:42 Date: 25/02/08
Checksum: 1694408817
BP ANNUAL REPORT AND ACCOUNTS 2007 53
Environmental expenditure
$ million------------------------------------------------------------------------------------------------------------------------------- -----------------
2007 2006 2005------------------------------------------------------------------------------------------------------------------------------- -----------------
Operating expenditure 662 596 494
Clean-ups 62 59 43
Capital expenditure 1,033 806 789
Additions to environmental
remediation provision 373 423 565
Additions to decommissioning
provision 1,163 2,142 1,023
Operating and capital expenditure on the prevention, control, abatement
or elimination of air, water and solid waste pollution is often not incurred
as a separately identifiable transaction. Instead, it forms part of a larger
transaction that includes, for example, normal maintenance expenditure.
The figures for environmental operating and capital expenditure in the
table are therefore estimates, based on the definitions and guidelines of
the American Petroleum Institute.
The increase in environmental operating expenditure in 2007
compared with 2006 is primarily due to increased integrity management
activity and activity associated with the implementation of the Baker
Panel recommendations. The increase in environmental operating
expenditure in 2006 compared with 2005 is largely related to expenditure
incurred on reducing air emissions at US refineries. Similar levels of
operating and capital expenditures are expected in the foreseeable
future. In addition to operating and capital expenditures, we also create
provisions for future environmental remediation. Expenditure against
such provisions is normally in subsequent periods and is not included in
environmental operating expenditure reported for such periods. The
charge for environmental remediation provisions in 2007 includes
$339 million resulting from a reassessment of existing site obligations
and $34 million in respect of provisions for new sites.
Provisions for environmental remediation are made when a clean-up is
probable and the amount reasonably determinable. Generally, their timing
coincides with commitment to a formal plan of action or, if earlier, on
divestment or on closure of inactive sites.
The extent and cost of future remediation programmes are inherently
difficult to estimate. They depend on the scale of any possible
contamination, the timing and extent of corrective actions and also the
group’s share of liability. Although the cost of any future remediation
could be significant and may be material to the result of operations in the
period in which it is recognized, we do not expect that such costs will
have a material effect on the group’s financial position or liquidity. We
believe our provisions are sufficient for known requirements; we do not
believe that our costs will differ significantly from those of other
companies engaged in similar industries, or that our competitive position
will be adversely affected as a result.
In addition, we make provisions on installation of our oil- and gas-
producing assets and related pipelines to meet the cost of eventual
decommissioning. On installation of an oil or natural gas production
facility a provision is established that represents the discounted value of
the expected future cost of decommissioning the asset. Additionally, we
undertake periodic reviews of existing provisions. These reviews take
account of revised cost assumptions, changes in decommissioning
requirements and any technological developments. The level of increase
in the decommissioning provision varies with the number of new fields
coming onstream in a particular year and the outcome of the periodic
reviews.
Provisions for environmental remediation and decommissioning are
usually set up on a discounted basis, as required by IAS 37 ‘Provisions,
Contingent Liabilities and Contingent Assets’.
Further details of decommissioning and environmental provisions
appear in Financial statements – Note 37 on page 151. See also
Environment on page 41.
Suppliers and contractors
Our processes are designed to enable us to choose suppliers carefully
on merit, avoiding conflicts of interest and inappropriate gifts and
entertainment. We expect suppliers to comply with legal requirements
and we seek to do business with suppliers who act in line with BP’s
commitments to compliance and ethics, as outlined in the code of
conduct. We engage with suppliers in a variety of ways, including
performance review meetings to identify mutually advantageous
ways to improve performance.
Creditor payment policy and practice
Statutory regulations issued under the UK Companies Act 1985 require
companies to make a statement of their policy and practice in respect of
the payment of trade creditors. In view of the international nature of the
group’s operations there is no specific group-wide policy in respect of
payments to suppliers. Relationships with suppliers are, however,
governed by the group’s policy commitment to long-term relationships
founded on trust and mutual advantage. Within this overall policy,
individual operating companies are responsible for agreeing terms and
conditions for their business transactions and ensuring that suppliers are
aware of the terms of payment.
Contributing to communities
We make direct contributions to communities through community
programmes. Our total contribution in 2007 was $135.8 million. This
includes $0.7 million contributed by BP to UK charities. The growing
focus of this is on education, the development of local enterprise and
providing access to energy in remote locations.
In 2007, we spent $77.7 million promoting education, with investment
in three broad areas: energy and the environment; business leadership
skills; and basic education in developing countries where we operate
large projects.
Filename: U54368_doc3.3d Time: 14:49:42 Date: 25/02/08
Checksum: -1519647081
54
Liquidity and capital resources
Cash flow
The following table summarizes the group’s cash flows.
$ million--------------------------------------------------------------------------------------------------------------------------------------------------------------------------------------------------------------------------------------------------------------------------------------------------------
2007 2006 2005--------------------------------------------------------------------------------------------------------------------------------------------------------------------------------------------------------------------------------------------------------------------------------------------------------
Net cash provided by operating activities of continuing operations 24,709 28,172 25,751
Ne---------------
t cas----------h prov
----------ided
----------by op
----------erat
----------ing ac
----------tivities
----------of
----------Innove
----------ne
----------operat
----------ions – – 970
---------------------------------------------------------------------------------------------------------------------------------------------------------------------------
Net cash provided by operating activities 24,709 28,172 26,721
Net cash used in investing activities (14,837) (9,518) (1,729)
Net cash used in financing activities (9,035) (19,071) (23,303)
-----Cu
----------rrency
----------tran
----------slatio
----------n diff
----------eren
----------ces relating to cash and cash equivalents 135 47 (88)
---------------------------------------------------------------------------------------------------------------------------------------------------------------------------------------------------------------------------------------
Increase (decrease) in cash and cash equivalents 972 (370) 1,601
Ca---------------
sh an----------d cash
----------equi
----------vale
----------nts at begi
--------------------nning 2,590 2,960 1,359
----------of ye
----------ar
---------------------------------------------------------------------------------------------------------------------------------------------------------------------------------------------------------
Cash and cash equivalents at end of year 3,562 2,590 2,960
Net cash provided by operating activities for the year ended 31 December Net cash used in financing activities was $9,035 million in 2007
2007 was $24,709 million, compared with $28,172 million for the compared with $19,071 million in 2006 and $23,303 million in 2005. The
equivalent period of 2006 reflecting an increase in working capital reduction in 2007 compared with 2006 reflects a reduction in net
requirements of $6,282 million, a decrease in profit before taxation from repurchases of shares of $8,038 million and an increase in proceeds from
continuing operations of $3,031 million, a decrease in dividends from long-term financing of $4,278 million; these were partially offset by a net
jointly controlled entities and associates of $2,022 million; these were decrease in short-term debt of $2,379 million. The lower outflow in 2006
partially offset by a decrease in income taxes paid of $4,661 million, a compared with 2005 reflects a net increase in short-term debt of
lower net credit for impairment and gain/loss on sale of businesses and $5,330 million, a decrease in repayments of long-term financing of
fixed assets of $2,357 million and higher depreciation, depletion and $1,165 million and higher proceeds from long-term financing of
amortization of $1,451 million. $1,356 million, partially offset by an increase in the net repurchase of
Net cash provided by operating activities for the year ended shares of $3,836 million.
31 December 2006 was $28,172 million, compared with $26,721 million The group has had significant levels of capital investment for many
for the equivalent period of 2005, reflecting a decrease in working capital years. Cashflow in respect of capital investment, excluding acquisitions,
requirements of $4,817 million, an increase in profit before taxation from was $18.4 billion in 2007, $15.7 billion in 2006 and $13.1 billion in 2005.
continuing operations of $2,721 million and an increase in dividends from Sources of funding are completely fungible, but the majority of the
jointly controlled entities and associates of $1,662 million; these were group’s funding requirements for new investment come from cash
partially offset by an increase in income taxes paid of $4,705 million and generated by existing operations. The group’s level of net debt, that is
a higher net credit for impairment and gain/loss on sale of businesses debt less cash and cash equivalents, was $27.5 billion at the end of
and fixed assets of $2,095 million. 2007, $21.4 billion at the end of 2006 and was $16.2 billion at the end of
Net cash used in investing activities was $14,837 million in 2007, 2005. The lower level of debt at the end of 2005 reflects the receipt of
compared with $9,518 million and $1,729 million in 2006 and 2005. The the Innovene disposal proceeds in December 2005.
increase in 2007 reflected a reduction in disposal proceeds of During the period 2005 to 2007 our cash inflows and outflows were
$1,987 million and an increase in capital expenditure of $2,713 million. balanced, with sources and uses both totalling $107 billion. During that
The increase in 2006 compared with 2005 reflected a reduction in period, the price of Brent has averaged $64.00/bbl. The following table
disposal proceeds of $4,946 million and an increase in capital expenditure summarizes the three-year sources and uses of cash.
of $2,844 million.
$ billion------------------------------------------------------------------------------------------------------------------------------- -----------------
Sources------------------------------------------------------------------------------------------------------------------------------- -----------------
Net cash provided by operating activities 79
Divestments 22
Movement in net debt 6------------------------------------------------------------------------------------------------------------------------------- -----------------
107
$ billion------------------------------------------------------------------------------------------------------------------------------- -----------------
Uses------------------------------------------------------------------------------------------------------------------------------- -----------------
Capital expenditure 47
Acquisitions 2
Net repurchase of shares 34
Dividends to BP shareholders 23
Dividends to minority interest 1------------------------------------------------------------------------------------------------------------------------------- -----------------
107
Trend information
Total production for 2008 is expected to be higher than in 2007. This is
based on the group’s asset portfolio at 1 January 2008, expected start-
ups in 2008 and Brent at $60/bbl, before any 2008 disposal effects and
before any effects of prices above $60/bbl on volumes in PSAs.
We expect capital expenditure, excluding acquisitions and asset
exchanges and excluding the accounting related to our entry into the
Canadian oil sands via two joint ventures with Husky Energy Inc., to be
between $21 billion and $22 billion in 2008. This amount includes other
investments in equity-accounted entities. The exact level will depend on
a number of things including: the actual level of sector inflation that we
will experience in the year; time-critical and material one-off investment
opportunities that further our strategy; and any acquisition opportunities
that may arise.
We expect to restore revenues by ramping up production following our
recent start-ups in the Gulf of Mexico, Angola and Trinidad and to bring
refinery production at the Texas City and Whiting refineries back online.Acquisitions made for cash were more than offset by divestments. Net
investment during the same period has averaged $9.0 billion per year. Dividends and other distributions to shareholders and gearingDividends to BP shareholders, which grew on average by 15.4% per year The total dividend paid in 2007 was $8,106 million, compared within dollar terms, used $23 billion. Net repurchase of shares was $34 billion, $7,686 million for 2006. The dividend paid per share was 42.30 cents, anwhich includes $35 billion in respect of our share buyback programme increase of 10% compared with 2006. In sterling terms, the dividendless proceeds from share issues. Finally, cash was used to strengthen remained flat due to the weakness of the dollar. We determine thethe financial condition of certain of our pension funds. In the past three dividend in US dollars, the economic currency of BP.years, $2.3 billion has been contributed to funded pension plans.
Filename: U54368_doc3.3d Time: 14:49:42 Date: 25/02/08
Checksum: -2109456254
BP ANNUAL REPORT AND ACCOUNTS 2007 55
During 2007, the company repurchased 663 million of its own shares Forward-looking statements on page 11 and Risk factors on pages 9-10,
for cancellation at a cost of $7.5 billion. The repurchased shares had a which describe the risks and uncertainties that may cause actual results
nominal value of $166 million and represented 3.4% of ordinary shares and developments to differ materially from those expressed or implied by
in issue, net of treasury shares, at the end of 2006. Since the inception these forward-looking statements. The company provides no
of the share repurchase programme in 2000, we have repurchased commitment to update the forward-looking statements or to publish
4,659 million shares at a cost of $48.2 billion. financial projections for forward-looking statements in the future.
Our dividend policy has been to grow the dividend per share
progressively, guided by several considerations including the prevailing Financing the group’s activities
circumstances of the group, the future investment patterns and The group’s principal commodity, oil, is priced internationally in US
sustainability of the group and the trading environment. We have also dollars. Group policy has been to minimize economic exposure to
been committed to returning all free cash flows in excess of dividend currency movements by financing operations with US dollar debt
needs to our shareholders. These broad principles remain, but changes in wherever possible, otherwise by using currency swaps when funds
our business and the trading environment have given us greater have been raised in currencies other than US dollars.
confidence in our future cash flows and have led us to rebalance the The group’s finance debt is almost entirely in US dollars and at
uses of this cash. 31 December 2007 amounted to $31,045 million (2006 $24,010 million)
We now hold a more positive view of the pricing environment, of which $15,394 million (2006 $12,924 million) was short term.
especially for oil, and we expect our financial performance will be Net debt was $27,483 million at the end of 2007, an increase of
boosted by growing revenues, increased production and improved $6,063 million compared with 2006. The ratio of net debt to net debt
refining availability. We also see significant potential for cost efficiencies plus equity was 23% at the end of 2007 and 20% at the end of 2006.
and improved performance across all our businesses. Our reduced equity The maturity profile and fixed/floating rate characteristics of the
base, resulting from our share buyback programme, has made per-share group’s debt are described in Financial statements – Note 28 on page 136
dividend increases more affordable. In light of these factors, we have and Note 35 on page 148.
decided to increase organic capital expenditure (that is capital We have in place a European Debt Issuance Programme (DIP) under
expenditure excluding acquisitions and assets exchanges) to support which the group may raise $15 billion of debt for maturities of one month
growth, and to rebalance our distributions between dividends and share or longer. At 31 December 2007, the amount drawn down against the
buybacks. We continue to believe that a gearing band of 20-30% DIP was $10,438 million.
provides an efficient capital structure and the appropriate level of financial In addition, the group has in place a US Shelf Registration under which
flexibility. Taken together, these factors led us to increase the dividend it may raise $10 billion of debt with maturities of one month or longer. At
by 25% for the fourth quarter, compared with the third quarter. As a 31 December 2007 the amount raised under the US Shelf Registration
result, the level of free cash flow allocated to share buybacks is likely to was $2,500 million.
be lower. We will, however, continue to use share buybacks as a Commercial paper markets in the US and Europe are a primary source
mechanism to return excess cash to shareholders when appropriate and of liquidity for the group. At 31 December 2007, the outstanding
subject to renewed authority at the April 2008 annual general meeting. commercial paper amounted to $5,881 million.
At 31 December 2007, gearing was 23%, towards the bottom of the The group also has access to significant sources of liquidity in the
targeted band. form of committed facilities and other funding through the capital
BP intends to continue the operation of the Dividend Reinvestment markets. At 31 December 2007, the group had available undrawn
Plan (DRIP) for shareholders who wish to receive their dividend in the committed borrowing facilities of $4,950 million ($4,700 million at
form of shares rather than cash. The BP Direct Access Plan for US and 31 December 2006).
Canadian shareholders also includes a dividend reinvestment feature. BP believes that, taking into account the substantial amounts of
The discussion above and following contains forward-looking undrawn borrowing facilities available, the group has sufficient working
statements with regard to future production, future refining availability, capital for foreseeable requirements.
future capital expenditure, sources of funding, future revenues and
financial performance, potential for cost efficiencies, level of free cash Off-balance sheet arrangements
flow allocated to share buybacks, shareholder distributions and share In addition to reported debt, BP uses conventional off-balance sheet
buybacks, gearing, working capital and expected payments under arrangements such as operating leases and borrowings in jointly
contractual and commercial commitments. These forward-looking controlled entities and associates. At 31 December 2007, the group’s
statements are based on assumptions that management believes to be share of third-party finance debt of jointly controlled entities and
reasonable in the light of the group’s operational and financial experience. associates was $5,894 million (2006 $4,942 million) and $870 million
However, no assurance can be given that the forward-looking statements (2006 $1,143 million) respectively. These amounts are not reflected in
will be realized. You are urged to read the cautionary statement under the group’s debt on the balance sheet.
The group has issued third-party guarantees under which amounts outstanding at 31 December 2007 are summarized below. Some guarantees
outstanding are in respect of borrowings of jointly controlled entities and associates noted above. The analysis by time period indicates the ultimate
expiry of the guarantees.
$ million--------------------------------------------------------------------------------------------------------------------------------------------------------------------------------------------------------------------------------------------------------------------------------------------------------
Guarantees expiring by period--------------------------------------------------------------------------------------------------------------------------------------------------------------------------------------------------------------------------------------------------------------------------------------------------------
2013 andTotal 2008 2009 2010 2011 2012 thereafter
--------------------------------------------------------------------------------------------------------------------------------------------------------------------------------------------------------------------------------------------------------------------------------------------------------
Guarantees issued in respect ofa
Liabilities and borrowings of jointly controlled entities and associates 443 180 19 6 3 56 179
Liabilities and borrowings of other third parties 601 83 27 10 7 7 467
a Of the amounts shown in the table, $284 million of the jointly controlled entities and associates guarantees relate to guarantees of borrowings and for other third partiesguarantees $574 million relates to guarantees of borrowings.
Filename: U54368_doc3.3d Time: 14:49:43 Date: 25/02/08
Checksum: -358313800
56
Contractual commitments
The following table summarizes the group’s principal contractual obligations at 31 December 2007. Further information on borrowings and finance
leases is given in Financial statements – Note 35 on page 148 and further information on operating leases is given in Financial statements – Note 15
on page 126.
$ million--------------------------------------------------------------------------------------------------------------------------------------------------------------------------------------------------------------------------------------------------------------------------------------------------------
Payments due by period--------------------------------------------------------------------------------------------------------------------------------------------------------------------------------------------------------------------------------------------------------------------------------------------------------
Expected payments by period under contractual2013 and
obligations and commercial commitments Total 2008 2009 2010 2011 2012 thereafter--------------------------------------------------------------------------------------------------------------------------------------------------------------------------------------------------------------------------------------------------------------------------------------------------------
Borrowingsa 33,142 16,293 7,910 3,410 1,339 2,273 1,917
Finance lease future minimum lease payments 1,291 268 101 105 108 79 630
Operating leasesb 16,938 3,780 3,016 1,975 1,445 1,224 5,498
Decommissioning liabilities 13,416 455 342 438 195 244 11,742
Environmental liabilities 2,260 448 424 326 245 202 615
Pensions and other post-retirement benefitsc 23,743 1,134 1,127 883 717 718 19,164
Purchase obligationsd 164,943 105,922 16,739 9,446 5,986 4,711 22,139
a Expected payments include interest payments on borrowings totalling $2,990 million ($1,145 million in 2008, $767 million in 2009, $401 million in 2010, $247 million in2011, $191 million in 2012 and $239 million thereafter).
b The future minimum lease payments are before deducting related rental income from operating sub-leases. Where an operating lease is entered into solely by the group asthe operator of a jointly controlled asset, the total cost is included irrespective of any amounts that will be reimbursed by joint venture partners. Where operating leasecosts are incurred in relation to the hire of equipment used in connection with a capital project, some or all of the cost may be capitalized as part of the capital cost of theproject.
c Represents the expected future contributions to funded pension plans and payments by the group for unfunded pension plans and the expected future payments for otherpost-retirement benefits.
d Represents any agreement to purchase goods or services that is enforceable and legally binding and that specifies all significant terms. The amounts shown includearrangements to secure long-term access to supplies of crude oil, natural gas, feedstocks and pipeline systems. In addition, the amounts shown for 2008 include purchasecommitments existing at 31 December 2007 entered into principally to meet the group’s short-term manufacturing and marketing requirements. The price risk associatedwith these crude oil, natural gas and power contracts is discussed in Financial statements – Note 28 on page 136.
The following table summarizes the nature of the group’s unconditional purchase obligations.
$ million--------------------------------------------------------------------------------------------------------------------------------------------------------------------------------------------------------------------------------------------------------------------------------------------------------
Payments due by period--------------------------------------------------------------------------------------------------------------------------------------------------------------------------------------------------------------------------------------------------------------------------------------------------------
2013 andPurchase obligations Total 2008 2009 2010 2011 2012 thereafter--------------------------------------------------------------------------------------------------------------------------------------------------------------------------------------------------------------------------------------------------------------------------------------------------------
Crude oil and oil products 82,830 66,391 4,333 3,156 2,012 1,477 5,461
Natural gas 41,064 21,314 5,757 2,893 1,926 1,520 7,654
Chemicals and other refinery feedstocks 13,564 4,694 2,078 1,490 900 643 3,759
Power 14,662 10,929 3,079 648 1 5 –
Utilities 1,545 182 135 119 118 116 875
Transportation 3,921 1,116 615 452 330 266 1,142
Use of facilities and services 7,357 1,296 742 688 699 684 3,248--------------------------------------------------------------------------------------------------------------------------------------------------------------------------------------------------------------------------------------------------------------------------------------------------------
Total 164,943 105,922 16,739 9,446 5,986 4,711 22,139
The group expects its total capital expenditure, excluding acquisitions and asset exchanges and excluding the accounting related to our entry into the
Canadian oil sands via two joint ventures with Husky Energy Inc., to be around $21-22 billion in 2008. This amount includes other investments in
equity-accounted entities. The following table summarizes the group’s capital expenditure commitments for property, plant and equipment at
31 December 2007 and the proportion of that expenditure for which contracts have been placed. Capital expenditure is considered to be committed
when the project has received the appropriate level of internal management approval. For jointly controlled assets, the net BP share is included in the
amounts shown. Where operating lease costs are incurred in connection with a capital project, some or all of the cost may be capitalized as part of the
capital cost of the project. Such costs are included in the amounts shown.
$ million--------------------------------------------------------------------------------------------------------------------------------------------------------------------------------------------------------------------------------------------------------------------------------------------------------
2013 andCapital expenditure commitments Total 2008 2009 2010 2011 2012 thereafter--------------------------------------------------------------------------------------------------------------------------------------------------------------------------------------------------------------------------------------------------------------------------------------------------------
Committed on major projects 24,013 5,329 3,799 1,646 742 1,403 11,094
Amounts for which contracts have been placed 8,263 5,200 1,999 747 187 57 73
In addition, at 31 December 2007, the group had committed to capital expenditure relating to investments in equity-accounted entities amounting to
$4.5 billion. Contracts were in place for $1.1 billion of this total. The transaction with Husky Energy Inc., whereby BP will contribute $2.5 billion in
return for an interest in an equity-accounted joint venture, is included in the committed capital expenditure. For further information, see Financial
statements – Note 3 on page 110.
Filename: U54368_doc3.3d Time: 14:49:43 Date: 25/02/08
Checksum: -32275296
BP ANNUAL REPORT AND ACCOUNTS 2007 57
Critical accounting policies
The significant accounting policies of the group are summarized in
Financial statements – Note 1 on page 100.
Inherent in the application of many of the accounting policies used in
preparing the financial statements is the need for BP management to
make estimates and assumptions that affect the reported amounts of
assets and liabilities at the date of the financial statements and the
reported amounts of revenues and expenses during the reporting period.
Actual outcomes could differ from the estimates and assumptions used.
The following summary provides further information about the critical
accounting policies that could have a significant impact on the results of
the group and should be read in conjunction with the Notes on financial
statements.
The accounting policies and areas that require the most significant
judgements and estimates used in the preparation of the consolidated
financial statements are in relation to oil and natural gas accounting,
including the estimation of reserves, the recoverability of asset carrying
values, deferred taxation, provisions and contingencies, and pensions and
other post-retirement benefits.
Oil and natural gas accounting
The group follows the successful efforts method of accounting for its oil
and natural gas exploration and production activities.
The acquisition of geological and geophysical seismic information, prior
to the discovery of proved reserves, is expensed as incurred.
Licence and property acquisition costs are initially capitalized within
intangible assets. These costs are amortized on a straight-line basis until
such time that a determination is made on whether exploratory drilling
activity is successful. Where a determination is made that the exploratory
drilling is unsuccessful all costs are written off. Each property is reviewed
on an annual basis to confirm that drilling activity is planned and that it is
not impaired. If no future activity is planned, the remaining balance of the
licence and property acquisition costs is written off.
For exploration wells and exploratory-type stratigraphic test wells,
costs directly associated with the drilling of wells are temporarily
capitalized within non-current intangible assets, pending determination of
whether potentially economic oil and gas reserves have been discovered
by the drilling effort. These costs include employee remuneration,
materials and fuel used, rig costs, delay rentals and payments made to
contractors. The determination is usually made within one year after well
completion, but can take longer, depending on the complexity of the
geological structure. If the well did not encounter potentially economic oil
and gas quantities, the well costs are expensed as a dry hole and are
reported in exploration expense. Exploration wells that discover
potentially economic quantities of oil and gas and are in areas where
major capital expenditure (e.g. offshore platform or a pipeline) would be
required before production could begin, and where the economic viability
of that major capital expenditure depends on the successful completion
of further exploration work in the area, remain capitalized on the balance
sheet as long as additional exploration appraisal work is under way or
firmly planned.
It is not unusual to have exploration wells and exploratory-type
stratigraphic test wells remaining suspended on the balance sheet for
several years while additional appraisal drilling and seismic work on the
potential oil and gas field is performed or while the optimum
development plans and timing are established.
All such carried costs are subject to regular technical, commercial and
management review on at least an annual basis to confirm the continued
intent to develop, or otherwise extract value from, the discovery. Where
this is no longer the case, the costs are immediately expensed.
Once a project is sanctioned for development, the carrying values of
licence and property acquisition costs and exploration and appraisal costs
are transferred to production assets within property, plant and
equipment. Field development costs subject to depreciation are
expenditures incurred to date, together with approved future
development expenditure required to develop reserves.
The capitalized exploration and development costs for proved oil and
gas properties (which include the costs of drilling unsuccessful wells) are
amortized on the basis of oil-equivalent barrels that are produced in a
period as a percentage of the estimated proved reserves.
The estimated proved reserves used in these unit-of-production
calculations vary with the nature of the capitalized expenditure. The
reserves used in the calculation of the unit-of-production amortization are
as follows:
– Producing wells – proved developed reserves.
– Licence and property acquisition, field development and future
decommissioning costs – total proved reserves.
The impact of changes in estimated proved reserves is dealt with
prospectively by amortizing the remaining carrying value of the asset
over the expected future production. If proved reserves estimates are
revised downwards, earnings could be affected by higher depreciation
expense or an immediate write-down of the property’s carrying value
(see discussion of recoverability of asset carrying values below).
Given the large number of producing fields in the group’s portfolio, it is
unlikely that any changes in reserves estimates for individual fields, either
individually or in aggregate, year on year, will have a significant effect on
the group’s prospective charges for depreciation.
At the end of 2006, BP adopted the SEC rules for estimating reserves
instead of the UK accounting rules contained in the UK Statement of
Recommended Practice. These changes are explained in Financial
statements – Note 9 on page 120.
The estimation of oil and natural gas reserves and BP’s process to
manage reserves bookings is described in Exploration and Production –
Reserves and production on page 15. As discussed below, oil and natural
gas reserves have a direct impact on the assessment of the
recoverability of asset carrying values reported in the financial
statements.
The 2007 movements in proved reserves are reflected in the tables
showing movements in oil and gas reserves by region in Financial
statements – Supplementary information on oil and natural gas on pages
177 to 185.
Recoverability of asset carrying values
BP assesses its fixed assets, including goodwill, for possible impairment
if there are events or changes in circumstances that indicate that carrying
values of the assets may not be recoverable and, as a result, charges for
impairment are recognized in the group’s results from time to time. Such
indicators include changes in the group’s business plans, changes in
commodity prices leading to unprofitable performance, low plant
utilization and, for oil and gas properties, significant downward revisions
of estimated volumes or increases in estimated future development
expenditure. If there are low oil prices, natural gas prices, refining
margins or marketing margins during an extended period, the group may
need to recognize significant impairment charges.
The assessment for impairment entails comparing the carrying value
of the cash-generating unit and associated goodwill with the recoverable
amount of the asset, that is, the higher of fair value less costs to sell and
value in use. Value in use is usually determined on the basis of
discounted estimated future net cash flows.
Determination as to whether and how much an asset is impaired
involves management estimates on highly uncertain matters such as
future commodity prices, the effects of inflation on operating expenses,
discount rates, production profiles and the outlook for global or regional
market supply-and-demand conditions for crude oil, natural gas and
refined products.
For oil and natural gas properties, the expected future cash flows are
estimated based on the group’s plans to continue to develop and
produce proved reserves and associated risk-adjusted probable and
possible volumes. Expected future cash flows from the sale or
production of these volumes are calculated based on the group’s best
estimate of future oil and gas prices. Prices for oil and natural gas used
for future cash flow calculations are based on market prices for the first
five years and the group’s long-term planning assumptions thereafter. As
at 31 December 2007, the group’s long-term planning assumptions were
$60 per barrel for Brent and $7.50 per mmBtu for Henry Hub (2006 $40
Filename: U54368_doc3.3d Time: 14:49:43 Date: 25/02/08
Checksum: -1071625969
58
per barrel and $5.50 per mmBtu). These long-term planning assumptions
are subject to periodic review and modification. The estimated future
level of production is based on assumptions about future commodity
prices, lifting and development costs, field decline rates, market demand
and supply, economic regulatory climates and other factors.
The future cash flows are adjusted for risks specific to the asset
where appropriate and are discounted using a pre-tax discount rate of
11% (2006 10%). This discount rate is derived from the group’s post-tax
weighted average cost of capital and is adjusted where applicable to take
into account country-specific risk.
Irrespective of whether there is any indication of impairment, BP is
required to test annually for impairment of goodwill acquired in a
business combination. The group carries goodwill of approximately
$11.0 billion on its balance sheet, principally relating to the Atlantic
Richfield and Burmah Castrol acquisitions. In testing goodwill for
impairment, the group uses a similar approach to that described above.
The cash-generating units for impairment testing in this case are one
level below business segments. As noted above, if there are low oil
prices or natural gas prices or refining margins or marketing margins for
an extended period, the group may need to recognize significant goodwill
impairment charges.
Deferred taxation
The group has carry-forward tax losses in certain taxing jurisdictions that
are available to offset against future taxable income. However, deferred
tax assets are recognized only to the extent that it is considered more
likely than not that suitable taxable income will arise. Management
judgement is exercised in assessing whether this is the case. For further
information see Financial statements – Note 20 on page 128 and Note 44
on page 165.
Provisions and contingencies
The group holds provisions for the future decommissioning of oil and
natural gas production facilities and pipelines at the end of their economic
lives. The largest asset removal obligations facing BP relate to the
removal and disposal of oil and natural gas platforms and pipelines
around the world. The estimated discounted costs of dismantling and
removing these facilities are accrued on the installation of those facilities,
reflecting our legal obligations at that time. A corresponding asset of an
amount equivalent to the provision is also created within property, plant
and equipment. This asset is depreciated over the expected life of the
production facility or pipeline. Most of these removal events are many
years in the future and the precise requirements that will have to be met
when the removal event actually occurs are uncertain. Asset removal
technologies and costs are constantly changing, as well as political,
environmental, safety and public expectations. Consequently, the timing
and amounts of future cash flows are subject to significant uncertainty.
Changes in the expected future costs are reflected in both the provision
and the asset.
Decommissioning provisions associated with downstream and
petrochemicals facilities are generally not provided for, as such potential
obligations cannot be measured, given their indeterminate settlement
dates. The group performs periodic reviews of its downstream and
petrochemicals long-lived assets for any changes in facts and
circumstances that might require the recognition of a decommissioning
provision.
The timing and amount of future expenditures are reviewed annually,
together with the interest rate used in discounting the cash flows. The
interest rate used to determine the balance sheet obligation at the end of
2007 was 2%, unchanged from the end of 2006. The interest rate
represents the real rate (i.e. adjusted for inflation) on long-dated
government bonds.
Other provisions and liabilities are recognized in the period when it
becomes probable that there will be a future outflow of funds resulting
from past operations or events and the amount of cash outflow can be
reliably estimated. The timing of recognition requires the application of
judgement to existing facts and circumstances, which can be subject to
change. Since the actual cash outflows can take place many years in the
future, the carrying amounts of provisions and liabilities are reviewed
regularly and adjusted to take account of changing facts and
circumstances.
A change in estimate of a recognized provision or liability would result
in a charge or credit to net income in the period in which the change
occurs (with the exception of decommissioning costs as described
above).
Provisions for environmental clean-up and remediation costs are based
on current legal and constructive requirements, technology, price levels
and expected plans for remediation. Actual costs and cash outflows can
differ from estimates because of changes in laws and regulations, public
expectations, prices, discovery and analysis of site conditions and
changes in clean-up technology.
The provision for environmental liabilities is reviewed at least annually.
The interest rate used to determine the balance sheet obligation at
31 December 2007 was 2%, the same rate as at the previous balance
sheet date.
As further described in Financial statements – Note 44 on page 165,
the group is subject to claims and actions. The facts and circumstances
relating to particular cases are evaluated regularly in determining whether
it is ‘probable’ that there will be a future outflow of funds and, once
established, whether a provision relating to a specific litigation should be
adjusted. Accordingly, significant management judgement relating to
contingent liabilities is required, since the outcome of litigation is difficult
to predict.
Pensions and other post-retirement benefits
Accounting for pensions and other post-retirement benefits involves
judgement about uncertain events, including estimated retirement dates,
salary levels at retirement, mortality rates, rates of return on plan assets,
determination of discount rates for measuring plan obligations, healthcare
cost trend rates and rates of utilization of healthcare services by retirees.
These assumptions are based on the environment in each country.
Determination of the projected benefit obligations for the group’s defined
benefit pension and post-retirement plans is important to the recorded
amounts for such obligations on the balance sheet and to the amount of
benefit expense in the income statement. The assumptions used may
vary from year to year, which will affect future results of operations. Any
differences between these assumptions and the actual outcome also
affect future results of operations.
Pension and other post-retirement benefit assumptions are reviewed
by management in December each year. These assumptions are used to
determine the projected benefit obligation at the year end and hence the
surpluses and deficits recorded on the group’s balance sheet, and
pension and post-retirement benefit expense for the following year.
The pension and other post-retirement benefit assumptions at
31 December 2007, 2006 and 2005 are provided in Financial statements
– Note 38 on page 152.
The assumed rate of investment return, discount rate and the US
healthcare cost trend rate have a significant effect on the amounts
reported. A sensitivity analysis of the impact of changes in these
assumptions on the benefit expense and obligation is provided in
Financial statements – Note 38 on page 152.
In addition to the financial assumptions, we regularly review the
demographic and mortality assumptions. Mortality assumptions reflect
best practice in the countries in which we provide pensions and have
been chosen with regard to the latest available published tables adjusted
where appropriate to reflect the experience of the group and an
extrapolation of past longevity improvements into the future. BP’s most
substantial pension liabilities are in the UK, US and Germany and the
mortality assumptions for these countries are detailed in Financial
statements – Note 38 on page 152.
Filename: U54368_doc3.3d Time: 14:49:43 Date: 25/02/08
Checksum: 504863804
BP ANNUAL REPORT AND ACCOUNTS 2007 59
Directors, senior management and employees
The following lists the company’s directors and senior management as at 19 February 2008.
--------------------------------------------------------------------------------------------------------------------------------------------------------------------------------------------------------------------------------------------------------------------------------------------------------
Name Initially elected or appointed--------------------------------------------------------------------------------------------------------------------------------------------------------------------------------------------------------------------------------------------------------------------------------------------------------
P D Sutherland Chairman Chairman since May 1997
Director since July 1995
Sir Ian Prosser Non-Executive Deputy Chairman Deputy chairman since February 1999
Director since May 1997
A Burgmans Non-Executive Director February 2004
C B Carroll Non-Executive Director June 2007
Sir William Castell Non-Executive Director July 2006
G David Non-Executive Director February 2008
E B Davis, Jr Non-Executive Director December 1998
D J Flint Non-Executive Director January 2005
Dr D S Julius Non-Executive Director November 2001
Sir Tom McKillop Non-Executive Director July 2004
Dr W E Massey Non-Executive Director December 1998
Dr A B Hayward Executive Director (Group Chief Executive) Group Chief Executive since May 2007
Director since February 2003
Dr D C Allen Executive Director, Special Adviser (formerly Group Chief of Staff) February 2003
I C Conn Executive Director (Chief Executive, Refining and Marketing) July 2004
Dr B E Grote Executive Director (Chief Financial Officer) August 2000
A G Inglis Executive Director (Chief Executive, Exploration and Production) February 2007
P B P Bevan Group General Counsel September 1992
S Bott Executive Vice President, Human Resources March 2005
V Cox Executive Vice President, Alternative Energy July 2004
R A Malone Executive Vice President (Chairman and President of BP America Inc.) July 2006
J Mogford Executive Vice President, Safety and Operations October 2007
S Westwell Executive Vice President (Group Chief of Staff) January 2008
At the company’s 2007 annual general meeting (AGM), the following directors retired, offered themselves for re-election and were duly re-elected:
Dr D C Allen, The Lord Browne of Madingley, Mr A Burgmans, Mr I C Conn, Mr E B Davis, Jr, Mr D J Flint, Dr B E Grote, Dr A B Hayward,
Dr D S Julius, Sir Tom McKillop, Mr J A Manzoni, Dr W E Massey, Sir Ian Prosser and Mr P D Sutherland.
David Jackson (55) was appointed company secretary in 2003. A solicitor, he is a director of BP Pension Trustees Limited and a member of the
Listing Authorities Advisory Committee.
Directors
Changes to the board
Set out below is a statement by the chairman describing various changes to the composition of the board that occurred during 2007.
In addition to John Browne’s resignation and Tony Hayward’s appointment as group chief executive, on which I have already commented in my
letter to shareholders, there have been some important changes to the board.
John Manzoni agreed with the board that he would step down as a director on 31 August 2007. He has taken up a senior position in the
industry in Canada. John has shown the most immense commitment and dedication to BP through a period of long and loyal service.
David Allen will retire as a director on 31 March 2008. David has served on the board since 2003 and was group chief of staff until 1 January
2008. He has made a significant contribution to the group in many key areas, most particularly in shaping and applying corporate strategy.
I would like to thank John Browne, John Manzoni and David Allen for their contributions.
Walter Massey will stand down at the forthcoming AGM. Walter joined the BP board at the time of the Amoco merger in 1998 and has made
a significant contribution in his tireless work as chairman of the safety, ethics and environment assurance committee. His strong scientific
background, coupled with his broad experience of the US gained through his academic work and his role on a number of high-profile boards, has
resulted in a very broad and significant contribution to the work of the board and its committees. He will be sorely missed and, on behalf of the
board, I would like to thank him for all he has done.
I am very pleased to welcome Cynthia Carroll and George David as new non-executive directors. Cynthia, who joined the board in June 2007,
is the chief executive of Anglo American plc and has broad experience of the global extractive industries, having previously worked at Alcan and
Amoco. Cynthia is a member of the chairman’s committee and will join the safety, ethics and environment assurance committee in due course.
George was appointed in February 2008. He is the chairman and chief executive of United Technologies Corporation and so has substantial
experience of global industry. George is a member of the chairman’s committee.
I would also like to welcome Andy Inglis to the board. He was appointed as a director on 1 February 2007 as chief executive of the Exploration
and Production segment. On 1 June 2007, Iain Conn became chief executive of the Refining and Marketing segment.
During the year, we have kept under review the mix of skills on the board, particularly in light of the strategic and operational challenges that
face the group both now and in the coming years. We have reviewed and refreshed our succession policy for non-executive directors and expect
to make further appointments to the board shortly.
Peter Sutherland
Chairman
Filename: U54368_doc3.3d Time: 14:49:43 Date: 25/02/08
Checksum: -583611703
60
P D Sutherland, SC, KCMG
Peter Sutherland (61) rejoined BP’s board in 1995, having been a non-
executive director from 1990 to 1993, and was appointed chairman in
1997. He is non-executive chairman of Goldman Sachs International and
a non-executive director of The Royal Bank of Scotland Group.
Chairman of the chairman’s and the nomination committees
Sir Ian Prosser
Sir Ian (64) joined BP’s board in 1997 and was appointed non-executive
deputy chairman in 1999. He is the senior non-executive director. He
retired as chairman of InterContinental Hotels Group PLC, a spin-off from
Bass PLC where he was chief executive, in 2003. He is the senior
independent non-executive director of GlaxoSmithKline plc and a non-
executive director of the Sara Lee Corporation. He was previously on
the boards of The Boots Company PLC and Lloyds TSB PLC.
Member of the chairman’s, the nomination and the remuneration
committees and chairman of the audit committee
A Burgmans
Antony Burgmans (61) joined BP’s board in 2004. He was appointed to
the board of Unilever in 1991. In 1999, he became chairman of Unilever
NV and vice chairman of Unilever PLC. In 2005, he became non-
executive chairman of Unilever PLC and Unilever NV, retiring from these
appointments in May 2007. He is also a member of the supervisory
boards of Akzo Nobel NV and Aegon NV.
Member of the chairman’s and the safety, ethics and environment
assurance committees
C B Carroll
Cynthia Carroll (51) joined BP’s board on 6 June 2007. She started her
career at Amoco and in 1989 she joined Alcan, where in 2002 she was
appointed president and chief executive officer of Alcan’s primary metals
group and an officer of Alcan, Inc. She was appointed as chief executive
of Anglo American plc, the global mining group, in March 2007. She is
also a director of De Beers s.a. and Anglo Platinum Ltd.
Member of the chairman’s committee
Sir William Castell, LVO
Sir William (60) joined BP’s board in July 2006. From 1990 to 2004, he
was chief executive of Amersham plc and subsequently president and
chief executive officer of GE Healthcare. He was appointed as a vice
chairman of the board of GE in 2004, stepping down from this post in
2006 when he became chairman of the Wellcome Trust. He remains a
non-executive director of GE.
Member of the chairman’s, the audit and the safety, ethics and
environment assurance committees
G David
George David (65) joined BP’s board on 11 February 2008. He has spent
his career with United Technologies Corporation (UTC), becoming its
chief executive officer in 1994 and chairman in 1997. He joined UTC’s
Otis elevator subsidiary in 1975. He is also a director of Citigroup Inc.
Member of the chairman’s committee
E B Davis, Jr
Erroll B Davis, Jr (63) joined BP’s board in 1998, having previously been a
director of Amoco. He was chairman and chief executive officer of Alliant
Energy, relinquishing this dual appointment in 2005. He continued as
chairman of Alliant Energy until February 2006, leaving to become
chancellor of the University System of Georgia. He is a member of the
board of General Motors Corporation, Union Pacific Corporation and the
US Olympic Committee.
Member of the chairman’s, the audit and the remuneration committees
D J Flint, CBE
Douglas Flint (52) joined BP’s board in 2005. He trained as a chartered
accountant and became a partner at KPMG in 1988. In 1995, he was
appointed group finance director of HSBC Holdings plc. He was chairman
of the Financial Reporting Council’s review of the Turnbull Guidance on
Internal Control. Between 2001 and 2004, he served on the Accounting
Standards Board and the Standards Advisory Council of the International
Accounting Standards Board.
Member of the chairman’s and the audit committees
Dr D S Julius, CBE
DeAnne Julius (58) joined BP’s board in 2001. She began her career as a
project economist with the World Bank in Washington. From 1986 until
1997, she held a succession of posts, including chief economist at British
Airways and Royal Dutch Shell Group. From 1997 to 2001, she was a full
time member of the Monetary Policy Committee of the Bank of England.
She is chairman of the Royal Institute of International Affairs and a non-
executive director of Roche Holdings SA.
Member of the chairman’s and the nomination committees and chairman
of the remuneration committee
Sir Tom McKillop
Sir Tom (64) joined BP’s board in 2004. Sir Tom was chief executive of
AstraZeneca PLC from the merger of Astra AB and Zeneca Group PLC
in 1999 until December 2005. He was a non-executive director of Lloyds
TSB Group PLC until 2004 and is chairman of The Royal Bank of Scotland
Group.
Member of the chairman’s, the remuneration and the safety, ethics and
environment assurance committees
Dr W E Massey
Walter Massey (69) joined BP’s board in 1998, having previously been
a director of Amoco. He is a non-executive director of Bank of America,
McDonald’s Corporation and Delta Airlines and a member of President
Bush’s Council of Advisors on Science and Technology. He was
president of Morehouse College from 1995 until his retirement in June
2007.
Member of the chairman’s and the nomination committees and chairman
of the safety, ethics and environment assurance committee
Dr A B Hayward
Tony Hayward (50) joined BP in 1982. He held a series of roles in
exploration and production, becoming a director of exploration and
production in 1997. In 2000, he was made group treasurer, and an
executive vice president in 2002. He was chief executive officer of
exploration and production between 2002 and February 2007. He
became an executive director of BP in 2003 and was appointed as
group chief executive on 1 May 2007. Dr Hayward is a non-executive
director of Corus Group plc.
Dr D C Allen
David Allen (53) joined BP in 1978 and subsequently undertook a number
of corporate and exploration and production roles in London and New
York. He moved to BP’s corporate planning function in 1986, becoming
group vice president in 1999. He was appointed executive vice president
and group chief of staff in 2000 and an executive director of BP in 2003.
Dr Allen relinquished the role of group chief of staff on 1 January 2008,
becoming a special adviser to the group chief executive. He will retire
from the board on 31 March 2008. He is a director of BP Pension
Trustees Limited.
I C Conn
IainConn (45) joinedBP in1986.Followingavarietyof roles inoil trading,
commercial refining, retail andcommercial marketing operations,and
explorationandproduction, in2000hebecame groupvicepresident ofBP’s
refiningand marketingbusiness.From2002 to2004,hewaschiefexecutive
ofpetrochemicals. Hewasappointed group executiveofficerwitha rangeof
regionaland functional responsibilitiesandanexecutivedirector in2004.He
wasappointed chief executiveof refining andmarketing inJune2007. He is
anon-executivedirector ofRolls-RoyceGroup plc.
Dr B E Grote
Byron Grote (59) joined BP in 1987 following the acquisition of The
Standard Oil Company of Ohio, where he had worked since 1979. He

Filename: U54368_doc3.3d Time: 14:49:44 Date: 25/02/08
Checksum: -1688751277
BP ANNUAL REPORT AND ACCOUNTS 2007 61
became group treasurer in 1992 and in 1994 regional chief executive in
Latin America. In 1999, he was appointed an executive vice president of
exploration and production, and chief executive of chemicals in 2000. He
was appointed an executive director of BP in 2000 and chief financial
officer in 2002. He is a non-executive director of Unilever NV and
Unilever PLC.
A G Inglis
Andy Inglis (48) joined BP in 1980, working on various North Sea
projects. Following a series of commercial roles in exploration, in 1996 he
became chief of staff, exploration and production. From 1997 until 1999,
he was responsible for leading BP’s activities in the deepwater Gulf of
Mexico. In 1999, he was appointed vice president of BP’s US western
gas business unit. In 2004, he became executive vice president and
deputy chief executive of exploration and production. He was appointed
chief executive of BP’s exploration and production business and an
executive director on 1 February 2007.
Senior management
P B P Bevan
Peter Bevan (63) joined BP in 1970 after qualifying as a solicitor with a
City of London firm. He worked initially in the law department of BP’s
chemicals business. He became group general counsel in 1992 following
roles as manager of the legal function of BP Exploration, assistant
company secretary and deputy group legal adviser. He was appointed an
executive vice president of BP in 1998.
S Bott
Sally Bott (58) joined BP in 2005 as an executive vice president
responsible for global human resources management. She joined
Citibank in 1970 and, following a variety of roles, was appointed a vice
president in human resources in 1979 and subsequently held a series of
positions as a human resources director to sectors of Citibank. In 1994,
she joined BZW, an investment bank, as head of human resources and in
1996 became group human resources director of Barclays Group. From
2000 to early 2005, she was managing director and head of global human
resources at insurance brokers Marsh Inc.
V Cox
Vivienne Cox (48) joined BP in 1981. Following a series of commercial
roles, she was appointed chief executive of Air BP in 1998. From 1999
until 2001, she was group vice president of BP Oil, responsible for
business-to-business marketing and oil supply and trading. From 2001 to
2004, she was group vice president for integrated supply and trading. In
2004, she was appointed an executive vice president, responsible for
gas, power and renewables in addition to the supply and trading
businesses and, in late 2005, also became responsible for alternative
energy. She is a non-executive director of Rio Tinto plc.
R A Malone
Bob Malone (55) was appointed chairman and president of BP America
Inc. and an executive vice president in mid-2006. He started his career in
1974 at Kennecott Copper Corporation, holding various roles in
environmental engineering, operations and safety. From 1981 until 1988,
he was director of health, safety and environment for Kennecott and later
held various other roles for BP in America. In 1993, he became president
of BP Pipelines Alaska and, in 1996, president and chief operating officer
of Alyeska Pipeline Service Company. In 2000, he became western
regional president for BP America and from 2002 until 2006 he was chief
executive of BP Shipping Limited.
J Mogford
John Mogford (54) joined BP in 1977, spending the early part of his
career in a variety of drilling and production roles. In 1999, he became
group vice president for health, safety and the environment before being
appointed as group vice president for gas, power and renewables in
2002. In 2004, he returned to exploration and production as group vice
president (technology and functions). In 2005, he was appointed as
senior group vice president of safety and operations before becoming
executive vice president, safety and operations in October 2007. He will
become chief operating officer of refining from 1 March 2008.
S Westwell
Steve Westwell (49) joined BP in the manufacturing and supply division
of BP Southern Africa in 1988. Following various retail positions in the UK
and the US he was appointed head of retail and a member of the board
of BP Southern Africa Pty. In 2003, he became president and chief
executive officer of BP solar, and in 2004, group vice president of natural
gas liquids, power, solar and renewables. In 2005, he was appointed
group vice president of alternative energy. He was appointed executive
vice president and group chief of staff on 1 January 2008.
Employees
--------------------------------------------------------------------------------------------------------------------------------------------------------------------------------------------------------------------------------------------------------------------------------------------------------
Rest of Rest ofNumber of employees at 31 December UK Europe USA World Total--------------------------------------------------------------------------------------------------------------------------------------------------------------------------------------------------------------------------------------------------------------------------------------------------------
2007Exploration and Production 3,700 700 6,600 8,800 19,800
Refining and Marketing 10,700 18,400 22,700 17,200 69,000
Gas, Power and Renewables 300 800 1,900 1,500 4,500
Other businesses and corporate 2,300 – 1,800 200 4,300--------------------------------------------------------------------------------------------------------------------------------------------------------------------------------------------------------------------------------------------------------------------------------------------------------
17,000 19,900 33,000 27,700 97,600--------------------------------------------------------------------------------------------------------------------------------------------------------------------------------------------------------------------------------------------------------------------------------------------------------
2006Exploration and Production 3,500 700 6,200 8,600 19,000
Refining and Marketing 11,300 18,600 23,900 15,700 69,500
Gas, Power and Renewables 300 700 1,800 1,700 4,500
Other businesses and corporate 1,800 200 1,800 200 4,000--------------------------------------------------------------------------------------------------------------------------------------------------------------------------------------------------------------------------------------------------------------------------------------------------------
16,900 20,200 33,700 26,200 97,000--------------------------------------------------------------------------------------------------------------------------------------------------------------------------------------------------------------------------------------------------------------------------------------------------------
2005Exploration and Production 3,100 700 5,600 7,600 17,000
Refining and Marketing 11,300 19,700 25,200 14,600 70,800
Gas, Power and Renewables 200 700 1,500 1,700 4,100
Other businesses and corporate 1,900 200 2,100 100 4,300--------------------------------------------------------------------------------------------------------------------------------------------------------------------------------------------------------------------------------------------------------------------------------------------------------
16,500 21,300 34,400 24,000 96,200
Filename: U54368_doc3.3d Time: 14:49:44 Date: 25/02/08
Checksum: -482258608
62
People
We had approximately 97,600 employees as at 31 December 2007,
compared with approximately 97,000 at 31 December 2006.
In managing our people, we seek to attract, develop and retain highly
talented individuals in order to maintain BP’s capability to deliver our
strategy and plans.
During 2007, the group people committee was formed, consisting of
the group chief executive and the executive team. This committee takes
overall responsibility for policy decisions relating to employees. In 2007,
these ranged from a new performance and reward approach through to a
new leadership model for the organization.
The energy industry faces a shortage of professionals such as
petroleum engineers as the number of experienced workers retiring is
expected to exceed that of new graduate entrants. To help address this
issue in 2007, we took new steps to attract talented graduates, including
a new marketing campaign, a new selection process and stronger
relationships with a series of selected universities worldwide.
Our policy is to ensure equal opportunity in recruitment, career
development, promotion, training and reward for all employees, including
those with disabilities. Where existing employees become disabled, our
policy is to provide continuing employment and training wherever
practicable.
We run programmes designed to increase the number of local leaders
and employees in our operations so that they reflect the communities in
which we operate. For example, in Azerbaijan, we achieved our 2007
target of 75% of professional positions to be filled by national specialists.
At the end of 2007, 16% of our top 624 leaders were female and 19%
came from countries other than the UK and the US. When we started
tracking the composition of our group leadership in 2000, these
percentages were 9% and 14% respectively. We have a number of
programmes in place to help raise our senior level leaders’ awareness of
diversity and inclusion (D&I), such as our Managing Inclusion programme
in the US. D&I principles are also being incorporated into the Managing
Essentials programme (see below).
We aim to develop our leaders internally, although we recruit outside
the group when we do not have specialist skills in-house or when
exceptional people are available. In 2007, we appointed 72 people to
positions in the 624-strong group leadership. Of these, 49 were internal
candidates.
We provide development opportunities for our employees, including
training courses, international assignments, mentoring, team
development days, workshops, seminars and online learning. We
encourage everyone to take five training days per year.
During 2007, we launched a top priority programme for BP managers
called Managing Essentials, designed to enhance our leadership
development and drive continuous improvement in performance. In
2007, we launched the programme’s first module on effective
performance conversations, which helps managers to have clear and
constructive discussions with staff about their performance. By the end
of the year, 36 programmes had been run, with more than 700 managers
attending. In 2008, we expect to run around 200 programmes for around
4,000 managers.
Through our award-winning ShareMatch plan, run in more than 70
countries, we match BP shares purchased by employees.
Communications with employees include magazines, intranet sites,
DVDs, targeted e-mails and face-to-face communication. Team meetings
are the core of our employee consultation, complemented by formal
processes through works councils in parts of Europe. These
communications, along with training programmes, are designed to
contribute to employee development and motivation by raising
awareness of financial, economic, social and environmental factors
affecting our performance.
The group seeks to maintain constructive relationships with labour
unions.
The code of conduct
We have a code of conduct, launched in 2005, designed to ensure that all
employees comply with legal requirements and our own standards. The
code defines what BP expects of its people in key areas such as safety,
workplace behaviour, bribery and corruption and financial integrity. Our
employee concerns programme, OpenTalk, enables employees to seek
guidance on the code of conduct as well as to report suspected breaches
of compliance or other concerns. The number of cases raised through
OpenTalk in 2007 was 975, compared with 1,064 in 2006. In the US,
former US district court judge Stanley Sporkin acts as an ombudsperson
whom employees and contractors can contact confidentially to report any
suspected breach of compliance, ethics or the code of conduct, including
safety concerns.
We take steps to identify and correct areas of non-compliance and
take disciplinary action where appropriate. In 2007, 944 dismissals were
reported by BP’s businesses for non-compliance or unethical behaviour.
This number excludes some dismissals from the retail business, mainly
at service station sites, for incidents such as thefts of small amounts of
money.
BP continues to apply a policy that the group will not participate
directly in party political activity or make any political contributions,
whether in cash or in kind. BP specifically made no donations to UK or
other EU political parties or organizations in 2007.

Filename: U54368_doc4.3d Time: 14:49:45 Date: 25/02/08
Checksum: 1167334204
Directors’ remuneration report
This is the board’s report to shareholders on directors’ remuneration. It
covers both executive directors and non-executive directors. The first and
second parts were prepared by the remuneration committee. The third
part was prepared by the company secretary on behalf of the board. The
report has been approved by the board and signed on its behalf by the
company secretary. The report is subject to the approval of shareholders
at the annual general meeting (AGM).
Contents
Part 1 Summary 64
Letter to shareholders
Summary 2007 remuneration
Pensions
Historical TSR performance
Part 2 Executive directors’ remuneration 66
2007 remuneration
Salary increases
Annual bonus result
2005-2007 share element result
Remuneration policy
Salary
Annual bonus
Long-term incentives
Pensions
Other benefits
Pensions table
Share element of EDIP table
Share options table
Service contracts
Executive directors – external appointments
Remuneration committee
Part 3 Non-executive directors’ remuneration 72
BP ANNUAL REPORT AND ACCOUNTS 2007 63
Filename: U54368_doc4.3d Time: 14:49:45 Date: 25/02/08
Checksum: -696668108
Part 1: Summary
Dear Shareholder
This year has been a period of transition for the group and so the
long-standing principles that guide the remuneration committee have
been particularly in evidence. These centre on a demanding performance
link, for the majority of executive directors’ remuneration, to support
the creation of long-term shareholder value; and the application of
informed judgement by the committee, using both quantitative and
qualitative assessments, to ensure a fair and appropriate reward
for the executive directors.
Executive changes
Key among the transitions was the appointment of Dr Hayward as
group chief executive. Mr Inglis was appointed chief executive of our
exploration and production business and Mr Conn assumed the role of
chief executive of our refining and marketing business. They, along with
Dr Grote in his continuing role as chief financial officer, make up the new
top team for the company. The committee considered both the scale and
importance of their roles as well as the operating style of the new team
in reviewing their remuneration during the year. Dr Hayward’s salary
was increased to £950,000 per annum and the salary of both Mr Inglis
and Mr Conn was set at £650,000 per annum. Dr Grote’s salary was
increased to $1,300,000 per annum. All will have a target bonus
opportunity of 120% of salary and long-term performance share awards
of 5.5 times salary. These performance shares only vest to the extent
that demanding performance conditions are met. In addition to these
ongoing plans, Mr Inglis and Mr Conn were each recently granted
one-off retention awards in the form of restricted shares to a value of
£1,500,000. These will vest in equal tranches after three and five years,
subject to their continued service and satisfactory performance.
Both Lord Browne and Mr Manzoni left the company during the year.
Lord Browne remained eligible for a lump sum ex gratia superannuation
payment equal to one year’s salary but, in light of his resignation,
received no other compensation on his retirement. Mr Manzoni received
one year’s salary in line with his contractual entitlement. Both were
eligible for a pro-rata bonus for 2007, reflecting the results achieved as
well as their time employed during the year. Both retain full participation
in the 2005-2007 and 2006-2008 share element but forfeit any
participation in the 2007-2009 plan. They both retain outstanding share
options granted in earlier years.
2007 performance
Overall performance for the year was constrained by the continuing
impact of past operating challenges. Bonuses awarded reflect the
balance of somewhat disappointing financial results coupled with
good progress on non-financial measures, including health, safety
and environment (HSE), and very committed efforts by the executive
directors to resolve past issues, advance the forward agenda and deliver
results. These are set out in the summary table opposite, along with
all remuneration paid to executive directors in 2007.
The impact of past operating problems affected the Executive
Directors’ Incentive Plan (EDIP) share element. Shares vest in this
element based principally on the total shareholder return (TSR) relative
to the oil majors over the three-year performance period. Performance
failed to meet satisfactory levels and consequently no shares will vest
in the 2005-2007 plan. Although Lord Browne similarly did not receive
shares under the main 2005-2007 plan, around 15% of the shares of
the separate leadership portion vested.
Review of policy
With a new top team in place and having come through a testing time
in terms of company performance, the committee decided to review
remuneration policy during the year. The key area of review was the
performance conditions applied to the EDIP share element. In particular,
the committee considered whether additional performance measures or
non-financial measures, such as health and safety indicators, should be
included. The review included consultation with major shareholders and
a comparison with other companies’ remuneration policies. The review
reinforced our confidence in the current plan, approved by shareholders
in 2005, in particular in the flexibility it gives us to exercise our judgement
with regard to underlying performance and non-financial indicators
without being formulaic. No changes to the policy are planned.
For 2008, therefore, our policy is as follows:
– Salary Salaries are reviewed annually, based on independent advice,
with regard to comparator companies and market conditions.
– Annual bonus ‘On-target’ bonus is set at 120% of salary. The normal
maximum bonus, also unchanged, is 150% of salary but, as in past
years, the committee may in exceptional circumstances award bonus
above that level if deemed justified by performance. Bonus for 2008
will reflect the business priorities of safety, people and performance
as articulated by Dr Hayward. Of the 120% ‘on-target’ bonus, 50 will
be measured on financial results, principally earnings before interest,
taxes, depreciation and amortization (EBITDA), return on average
capital employed and cash flow; 25 will be based on safety as
assessed by the safety, ethics and environment assurance committee
(SEEAC); 25 on people, behaviour and values; and 20 on individual
performance, which will primarily reflect relevant operating results
and leadership.
– EDIP The share element will provide the primary long-term
remuneration vehicle. Shares will be awarded to a level of 5.5 times
salary for each executive director. These will vest after three years to
the extent that performance relative to the other oil majors merits it.
Performance is measured principally on TSR versus ExxonMobil, Shell,
Total and Chevron. 100% of shares vest if first, 70% if second, 35%
if third and nothing if fourth or fifth. The committee will also apply
informed judgement, looking at overall performance in determining
the final vesting level. Shares that vest must be retained for a further
three years before being released to the executive director. In
addition, each executive director is expected to build a significant
personal shareholding in BP.
– Pensions Executive directors are eligible to participate in the
appropriate pension schemes applying to their home countries.
With this policy, the majority of executive directors’ target
remuneration is performance-based. Recognizing that unforeseen
developments mean no remuneration structure is perfect, the committee
will continue to apply its judgement in the implementation of the policy
so as to reflect shareholders’ interests and also engage and retain our
talented team of executives.
Dr D S Julius
Chairman, Remuneration Committee
22 February 2008
64
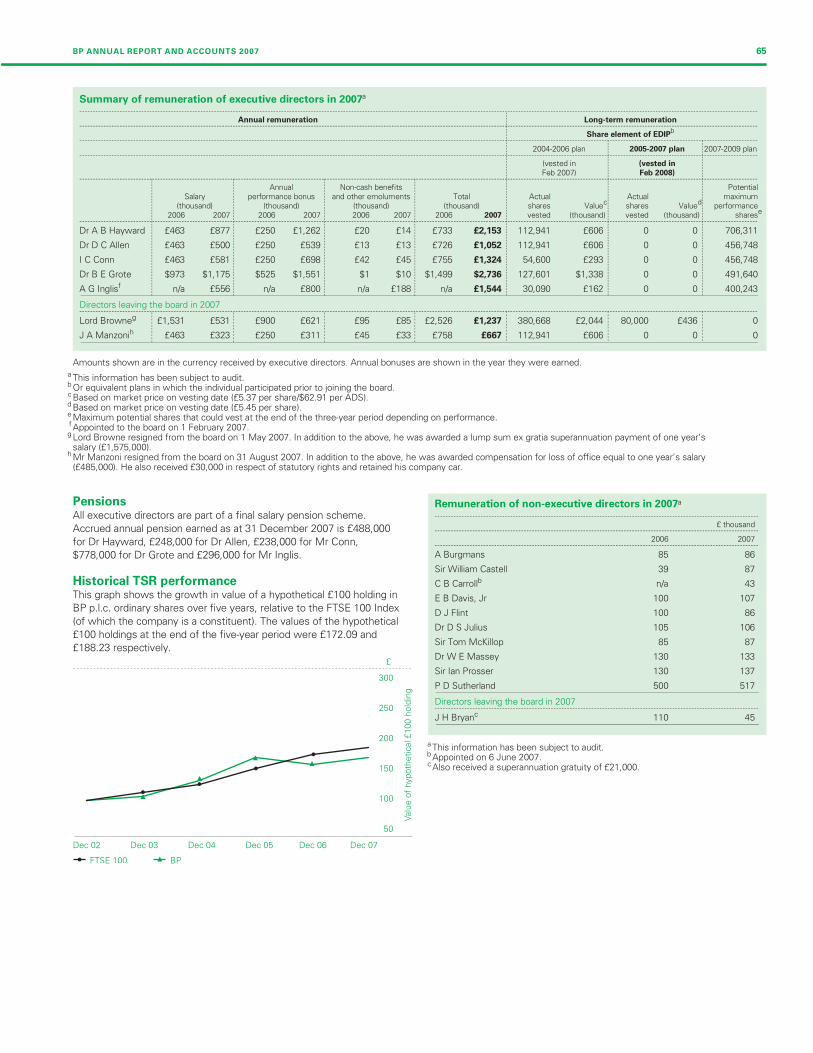
Filename: U54368_doc4.3d Time: 14:49:45 Date: 25/02/08Checksum: 1963984710
Summary of remuneration of executive directors in 2007a
------------------------------------------------------------------------------------------------------------------------------------------------------------------------------------------------------------------------------------------------------------
Annual remuneration Long-term remuneration------------------------------------------------------------------------------------------------------------------------------------------------------------------------------------------------------------------------------------------------------------
bShare element of EDIP
------------------------------------------------------------------------------------------------------------------------------------------------------------------------------------------------------------------------------------------------------------
2004-2006 plan 2005-2007 plan 2007-2009 plan------------------------------------------------------------------------------------------------------------------------------------------------------------------------------------------------------------------------------------------------------------
(vested in (vested in
Feb 2007) Feb 2008)------------------------------------------------------------------------------------------------------------------------------------------------------------------------------------------------------------------------------------------------------------
Annual Non-cash benefits PotentialSalary performance bonus and other emoluments Total Actual Actual maximum
c d(thousand) (thousand) (thousand) (thousand) shares Value shares Value performancee2006 2007 2006 2007 2006 2007 2006 2007 vested (thousand) vested (thousand) shares
------------------------------------------------------------------------------------------------------------------------------------------------------------------------------------------------------------------------------------------------------------
Dr A B Hayward £463 £877 £250 £1,262 £20 £14 £733 £2,153 112,941 £606 0 0 706,311
Dr D C Allen £463 £500 £250 £539 £13 £13 £726 £1,052 112,941 £606 0 0 456,748
I C Conn £463 £581 £250 £698 £42 £45 £755 £1,324 54,600 £293 0 0 456,748
Dr B E Grote $973 $1,175 $525 $1,551 $1 $10 $1,499 $2,736 127,601 $1,338 0 0 491,640fA G Inglis n/a £556 n/a £800 n/a £188 n/a £1,544 30,090 £162 0 0 400,243
Directors leaving the board in 2007------------------------------------------------------------------------------------------------------------------------------------------------------------------------------------------------------------------------------------------------------------
gLord Browne £1,531 £531 £900 £621 £95 £85 £2,526 £1,237 380,668 £2,044 80,000 £436 0hJ A Manzoni £463 £323 £250 £311 £45 £33 £758 £667 112,941 £606 0 0 0
-----
-----
-----
--
--
--
--
-----
---
---
--
--
-----
---
---
---
---
---
---
---
---
--
--
---
---
---
---
-----
---
---
----
----
----
----
----
--
--
- ---
---
----
----
----
----
-----
--
--
--
--
----
----
----
----
----- --
--
--
--
------
------
------
------
---
---
-----
--
--
---
---
----
----
----
----
-----
--
--
---
---
---
---
---
---
----
----
----
----
-----
--
--
---
---
----
----
----
----
-----
---
---
--
--
---
---
---
---
---
--
--
----
----
----
----
-----
-----
----
- -----
------
------
------ -
-----
-----
-----
Amounts shown are in the currency received by executive directors. Annual bonuses are shown in the year they were earned.a This information has been subject to audit.b Or equivalent plans in which the individual participated prior to joining the board.c Based on market price on vesting date (£5.37 per share/$62.91 per ADS).d Based on market price on vesting date (£5.45 per share).e Maximum potential shares that could vest at the end of the three-year period depending on performance.f Appointed to the board on 1 February 2007.g Lord Browne resigned from the board on 1 May 2007. In addition to the above, he was awarded a lump sum ex gratia superannuation payment of one year’s
salary (£1,575,000).h Mr Manzoni resigned from the board on 31 August 2007. In addition to the above, he was awarded compensation for loss of office equal to one year’s salary
(£485,000). He also received £30,000 in respect of statutory rights and retained his company car.
Remuneration of non-executive directors in 2007a
------------------------------------------------------------------------------------------------------------------------
£ thousand------------------------------------------------------------------------------------------------------------------------
2006 2007------------------------------------------------------------------------------------------------------------------------
A Burgmans 85 86
Sir William Castell 39 87bC B Carroll n/a 43
E B Davis, Jr 100 107
D J Flint 100 86
Dr D S Julius 105 106
Sir Tom McKillop 85 87
Dr W E Massey 130 133
Sir Ian Prosser 130 137
P D Sutherland 500 517
Directors leaving the board in 2007------------------------------------------------------------------------------------------------------------------------
cJ H Bryan 110 45
a This information has been subject to audit.b Appointed on 6 June 2007.c Also received a superannuation gratuity of £21,000.
PensionsAll executive directors are part of a final salary pension scheme.
Accrued annual pension earned as at 31 December 2007 is £488,000
for Dr Hayward, £248,000 for Dr Allen, £238,000 for Mr Conn,
$778,000 for Dr Grote and £296,000 for Mr Inglis.
Historical TSR performanceThis graph shows the growth in value of a hypothetical £100 holding in
BP p.l.c. ordinary shares over five years, relative to the FTSE 100 Index
(of which the company is a constituent). The values of the hypothetical
£100 holdings at the end of the five-year period were £172.09 and
£188.23 respectively.
300
250
200
150
100
50
ypot
hetic
al £
100
hold
ing
Valu
e of
h
Dec 02 Dec 03 Dec 04 Dec 05 Dec 06 Dec 07
BP ANNUAL REPORT AND ACCOUNTS 2007 65

Filename: U54368_doc4.3d Time: 14:49:45 Date: 25/02/08
Checksum: -190225672
Part 2: Executive directors’ remuneration
2007 remuneration
Salary increases
During the year, salary increases were awarded reflecting promotions
and changed job responsibilities as well as regular market movement.
The remuneration committee seeks to position salaries competitively
relative to appropriate comparators in Europe and the US oil and gas
sectors, as well as to reflect the operating style of the ‘team at the
top’. At the end of 2007, annual salaries were as follows: Dr Hayward
£950,000, Dr Allen £510,000, Mr Conn £650,000, Dr Grote $1,300,000
and Mr Inglis £650,000.
Annual bonus result
Performance measures and targets were set at the beginning of the year
and formed the main basis for determining the 2007 bonus. Financial
measures accounted for 50% weighting and focused on EBITDA, cash
costs and capital expenditure. Non-financial measures carried 30%
weight and centred on HSE performance, growth and reputation.
Individual performance, including segment deliverables and living the
values of the group, made up the final 20%.
Financially, underlying EBITDA results reflected a favourable price
environment but also some performance shortfall, related largely to
reduced refining availability at Whiting and Texas City, as well as delays
in start-up of some major exploration and production projects. Overall it
was below expectation. Cash costs were marginally above plan, largely
due to higher expenditures in refining, especially Texas City. Capital
expenditure was near plan, despite higher than expected sector inflation.
On the non-financial side, safety was maintained as the highest priority
of the executive top team. Significant progress was made on many
aspects of process safety, ranging from development and testing of a
process safety index, addressing specific recommendations of the Baker
Panel, implementing a holistic operating management system (OMS) and
ensuring clear accountability. Personal safety metrics and greenhouse
gas emissions were also good.
Growth was led by upstream, which had the strongest year of
resource access since the early 1990s and reserves replacement in
excess of 100%. Refinery throughput was below target, due to reduced
availability at Texas City and Whiting. BP Alternative Energy met plan
targets, achieving some 40% growth compared with 2006.
External assessments indicate that significant progress has been
made to rebuild the company’s reputation.
In terms of individual performance during a transition year, the
committee recognized very high levels of personal and team effort
to produce results, resolve past issues and position the company
for future success.
The strong individual performances, combined with above-target
non-financial and near-target financial performance, led the committee to
award bonuses generally around or just above target, as set out in the
summary table on page 65.
2005-2007 share element result
Performance for the 2005-2007 share element was assessed relative
to the TSR of the company compared with the other oil majors –
ExxonMobil, Shell, Total and Chevron. BP’s TSR result, reflecting past
operating problems, was last relative to the other majors. The committee
also reviewed the underlying business performance relative to
competitors, including financial (ROACE, EPS, cash flow etc.) and non-
financial (HSE etc.) indicators. While this showed some areas of strong
performance, the committee’s overall assessment, considering both the
TSR result and the underlying performance, was that performance failed
to meet satisfactory levels and consequently no shares will vest in the
Plan for 2005-2007.
Lord Browne also held an award under the 2005-2007 share element
related to long-term leadership measures. These focused on sustaining
BP’s financial, strategic and organizational health. Performance relative
to the award was assessed by the chairman’s committee and, based
on this assessment, 80,000 shares vested, representing about 15%
of the award.
Remuneration policyOur remuneration policy for executive directors aims to ensure there
is a clear link between the company’s purpose, its business plans and
executive reward, with pay varying with performance. In order to achieve
this, the policy is based on these key principles:
– The majority of executive remuneration will be linked to the
achievement of demanding performance targets, independently
set to support the creation of long-term shareholder value.
– The structure will reflect a fair system of reward for all the
participants.
– The remuneration committee will determine the overall amount of
each component of remuneration, taking into account the success
of BP and the competitive environment.
– There will be a quantitative and qualitative assessment of
performance, with the remuneration committee making an informed
judgement within a framework approved by shareholders.
– Remuneration policy and practice will be as transparent as possible.
– Executives will develop a significant personal shareholding in order
to align their interests with those of shareholders.
– Pay and employment conditions elsewhere in the group will be taken
into account, especially in setting annual salary increases.
– The remuneration policy for executive directors will be reviewed
regularly, independently of executive management, and will set
the tone for the remuneration of other senior executives.
– The remuneration committee will actively seek to understand
shareholder preferences.
Executive directors’ total remuneration consists of salary, annual
bonus, long-term incentives, pensions and other benefits. The
remuneration committee reviews this structure regularly to ensure
it is achieving its aims and did so in 2007.
The main part of the review centred on the share element of the EDIP.
The committee investigated alternative and additional measures to TSR,
in particular those representing underlying operational performance, and
also considered the inclusion of non-financial measures, most notably
those relating to HSE.
In the process of the review, input was sought from key institutional
investors and their representative bodies.
After thorough review, the committee concluded that, for the long-
term metrics, there was no ‘perfect’ measure and, on balance, no strong
reason for change. TSR remains an appropriate measure to reflect
long-term shareholder value. The detailed rationale behind the current
scoring system, as set out in the notes to the resolution in 2005 that
was approved by shareholders, still remained relevant and valid. The
committee felt that this system gives an optimal balance of quantitative
assessment relative to oil major performance as well as the ability of
the committee to make qualitative evaluation of underlying business
performance, including non-financial factors (such as HSE). Finally,
the committee felt that, in BP’s current circumstances, there is merit
in maintaining the stability of the plan.
Salary
The remuneration committee reviews salaries annually, taking into
account other large Europe-based global companies and companies in
the US oil and gas sector. These groups are each defined and analysed
by the committee’s independent remuneration advisers. The committee
makes a judgement on salary levels based on its assessment of market
conditions and the external advice.
Annual bonus
All executive directors are eligible to take part in an annual performance-
based bonus scheme. The remuneration committee sets bonus targets
and levels of eligibility each year.
The target level for 2008 is 120% of base salary. In normal
circumstances, the maximum payment for substantially exceeding
performance targets will continue to be 150% of base salary.
66
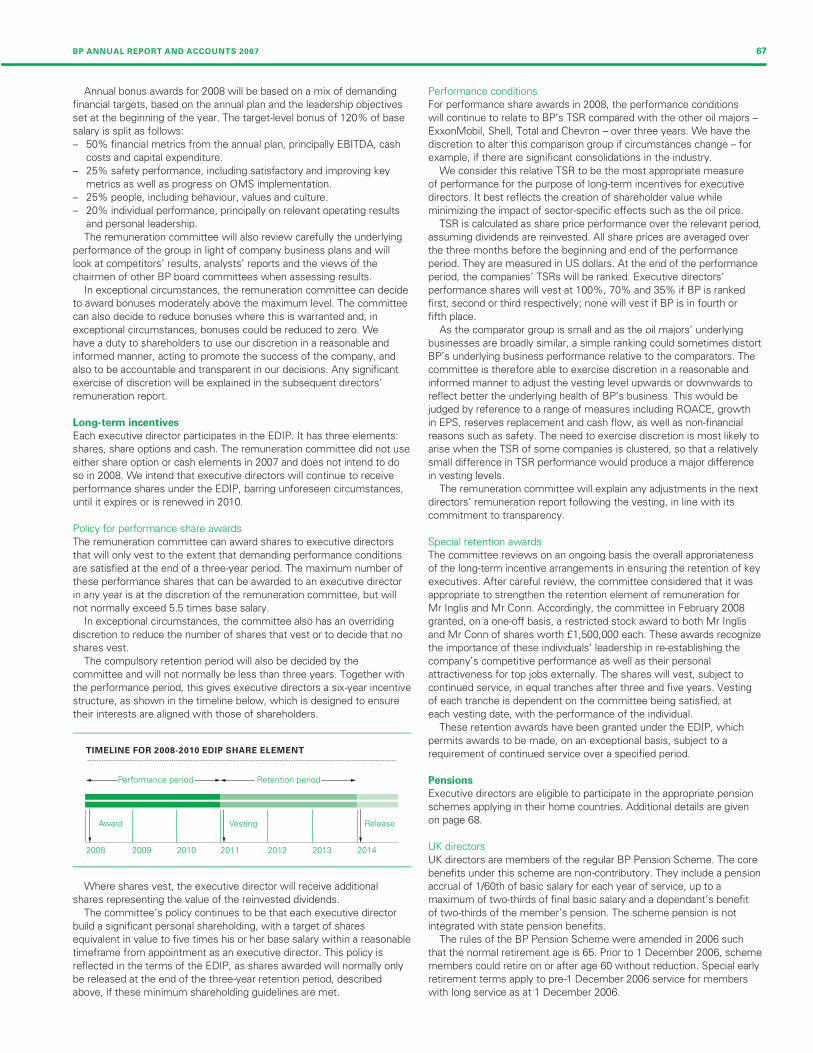
Filename: U54368_doc4.3d Time: 14:49:45 Date: 25/02/08
Checksum: -801865243
Annual bonus awards for 2008 will be based on a mix of demanding
financial targets, based on the annual plan and the leadership objectives
set at the beginning of the year. The target-level bonus of 120% of base
salary is split as follows:
– 50% financial metrics from the annual plan, principally EBITDA, cash
costs and capital expenditure.
– 25% safety performance, including satisfactory and improving key
metrics as well as progress on OMS implementation.
– 25% people, including behaviour, values and culture.
– 20% individual performance, principally on relevant operating results
and personal leadership.
The remuneration committee will also review carefully the underlying
performance of the group in light of company business plans and will
look at competitors’ results, analysts’ reports and the views of the
chairmen of other BP board committees when assessing results.
In exceptional circumstances, the remuneration committee can decide
to award bonuses moderately above the maximum level. The committee
can also decide to reduce bonuses where this is warranted and, in
exceptional circumstances, bonuses could be reduced to zero. We
have a duty to shareholders to use our discretion in a reasonable and
informed manner, acting to promote the success of the company, and
also to be accountable and transparent in our decisions. Any significant
exercise of discretion will be explained in the subsequent directors’
remuneration report.
Long-term incentives
Each executive director participates in the EDIP. It has three elements:
shares, share options and cash. The remuneration committee did not use
either share option or cash elements in 2007 and does not intend to do
so in 2008. We intend that executive directors will continue to receive
performance shares under the EDIP, barring unforeseen circumstances,
until it expires or is renewed in 2010.
Policy for performance share awards
The remuneration committee can award shares to executive directors
that will only vest to the extent that demanding performance conditions
are satisfied at the end of a three-year period. The maximum number of
these performance shares that can be awarded to an executive director
in any year is at the discretion of the remuneration committee, but will
not normally exceed 5.5 times base salary.
In exceptional circumstances, the committee also has an overriding
discretion to reduce the number of shares that vest or to decide that no
shares vest.
The compulsory retention period will also be decided by the
committee and will not normally be less than three years. Together with
the performance period, this gives executive directors a six-year incentive
structure, as shown in the timeline below, which is designed to ensure
their interests are aligned with those of shareholders.
TIMELINE FOR 2008-2010 EDIP SHARE ELEMENT------------------------------------------------------------------------------------------------------------------------------------
2008 2009 2010 2011 2012 2013 2014
Performance period Retention period
ReleaseVestingAward
Where shares vest, the executive director will receive additional
shares representing the value of the reinvested dividends.
The committee’s policy continues to be that each executive director
build a significant personal shareholding, with a target of shares
equivalent in value to five times his or her base salary within a reasonable
timeframe from appointment as an executive director. This policy is
reflected in the terms of the EDIP, as shares awarded will normally only
be released at the end of the three-year retention period, described
above, if these minimum shareholding guidelines are met.
Performance conditions
For performance share awards in 2008, the performance conditions
will continue to relate to BP’s TSR compared with the other oil majors –
ExxonMobil, Shell, Total and Chevron – over three years. We have the
discretion to alter this comparison group if circumstances change – for
example, if there are significant consolidations in the industry.
We consider this relative TSR to be the most appropriate measure
of performance for the purpose of long-term incentives for executive
directors. It best reflects the creation of shareholder value while
minimizing the impact of sector-specific effects such as the oil price.
TSR is calculated as share price performance over the relevant period,
assuming dividends are reinvested. All share prices are averaged over
the three months before the beginning and end of the performance
period. They are measured in US dollars. At the end of the performance
period, the companies’ TSRs will be ranked. Executive directors’
performance shares will vest at 100%, 70% and 35% if BP is ranked
first, second or third respectively; none will vest if BP is in fourth or
fifth place.
As the comparator group is small and as the oil majors’ underlying
businesses are broadly similar, a simple ranking could sometimes distort
BP’s underlying business performance relative to the comparators. The
committee is therefore able to exercise discretion in a reasonable and
informed manner to adjust the vesting level upwards or downwards to
reflect better the underlying health of BP’s business. This would be
judged by reference to a range of measures including ROACE, growth
in EPS, reserves replacement and cash flow, as well as non-financial
reasons such as safety. The need to exercise discretion is most likely to
arise when the TSR of some companies is clustered, so that a relatively
small difference in TSR performance would produce a major difference
in vesting levels.
The remuneration committee will explain any adjustments in the next
directors’ remuneration report following the vesting, in line with its
commitment to transparency.
Special retention awards
The committee reviews on an ongoing basis the overall approriateness
of the long-term incentive arrangements in ensuring the retention of key
executives. After careful review, the committee considered that it was
appropriate to strengthen the retention element of remuneration for
Mr Inglis and Mr Conn. Accordingly, the committee in February 2008
granted, on a one-off basis, a restricted stock award to both Mr Inglis
and Mr Conn of shares worth £1,500,000 each. These awards recognize
the importance of these individuals’ leadership in re-establishing the
company’s competitive performance as well as their personal
attractiveness for top jobs externally. The shares will vest, subject to
continued service, in equal tranches after three and five years. Vesting
of each tranche is dependent on the committee being satisfied, at
each vesting date, with the performance of the individual.
These retention awards have been granted under the EDIP, which
permits awards to be made, on an exceptional basis, subject to a
requirement of continued service over a specified period.
Pensions
Executive directors are eligible to participate in the appropriate pension
schemes applying in their home countries. Additional details are given
on page 68.
UK directors
UK directors are members of the regular BP Pension Scheme. The core
benefits under this scheme are non-contributory. They include a pension
accrual of 1/60th of basic salary for each year of service, up to a
maximum of two-thirds of final basic salary and a dependant’s benefit
of two-thirds of the member’s pension. The scheme pension is not
integrated with state pension benefits.
The rules of the BP Pension Scheme were amended in 2006 such
that the normal retirement age is 65. Prior to 1 December 2006, scheme
members could retire on or after age 60 without reduction. Special early
retirement terms apply to pre-1 December 2006 service for members
with long service as at 1 December 2006.
BP ANNUAL REPORT AND ACCOUNTS 2007 67
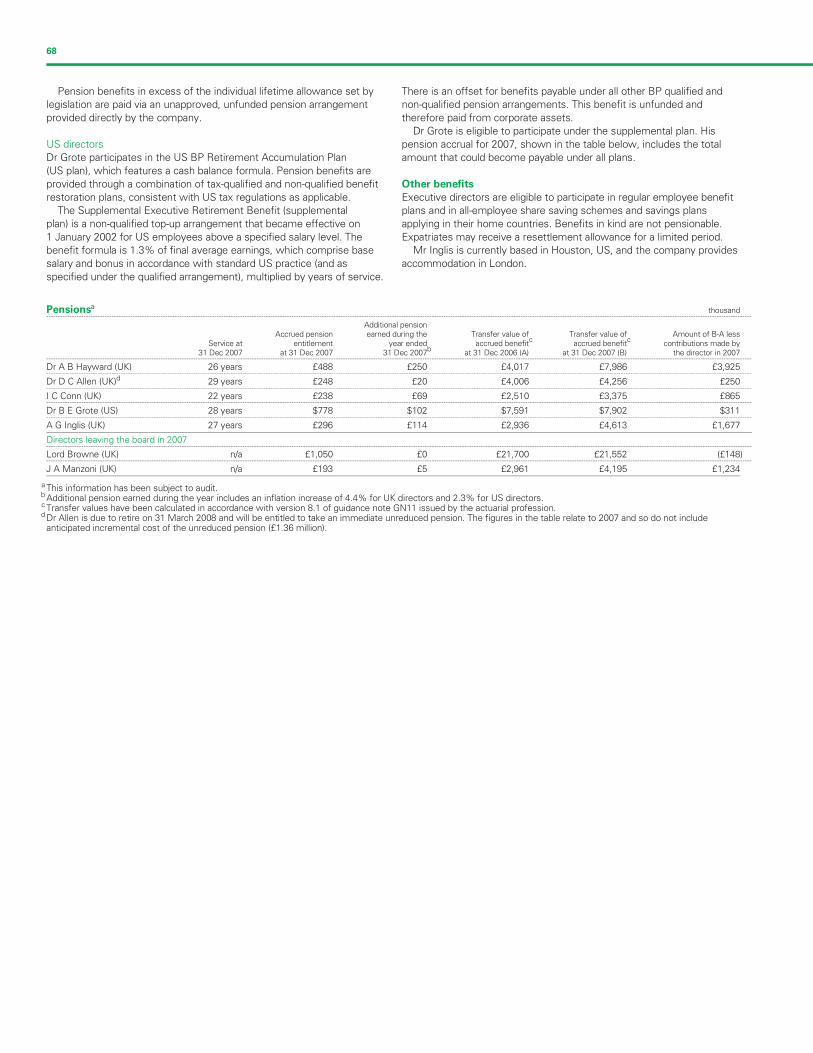
Filename: U54368_doc4.3d Time: 14:49:46 Date: 25/02/08
Checksum: 515185773
Pension benefits in excess of the individual lifetime allowance set by
legislation are paid via an unapproved, unfunded pension arrangement
provided directly by the company.
US directors
Dr Grote participates in the US BP Retirement Accumulation Plan
(US plan), which features a cash balance formula. Pension benefits are
provided through a combination of tax-qualified and non-qualified benefit
restoration plans, consistent with US tax regulations as applicable.
The Supplemental Executive Retirement Benefit (supplemental
plan) is a non-qualified top-up arrangement that became effective on
1 January 2002 for US employees above a specified salary level. The
benefit formula is 1.3% of final average earnings, which comprise base
salary and bonus in accordance with standard US practice (and as
specified under the qualified arrangement), multiplied by years of service.
There is an offset for benefits payable under all other BP qualified and
non-qualified pension arrangements. This benefit is unfunded and
therefore paid from corporate assets.
Dr Grote is eligible to participate under the supplemental plan. His
pension accrual for 2007, shown in the table below, includes the total
amount that could become payable under all plans.
Other benefits
Executive directors are eligible to participate in regular employee benefit
plans and in all-employee share saving schemes and savings plans
applying in their home countries. Benefits in kind are not pensionable.
Expatriates may receive a resettlement allowance for a limited period.
Mr Inglis is currently based in Houston, US, and the company provides
accommodation in London.
Pensionsathousand
------------------------------------------------------------------------------------------------------------------------------------------------------- -------------------------------------------------------------------------------------------------------------------------------------------------------
Additional pensionAccrued pension earned during the Transfer value of Transfer value of Amount of B-A less
c cService at entitlement year ended accrued benefit accrued benefit contributions made by
b31 Dec 2007 at 31 Dec 2007 31 Dec 2007 at 31 Dec 2006 (A) at 31 Dec 2007 (B) the director in 2007
------------------------------------------------------------------------------------------------------------------------------------------------------- -------------------------------------------------------------------------------------------------------------------------------------------------------
Dr A B Hayward (UK) 26 years £488 £250 £4,017 £7,986 £3,925------------------------------------------------------------------------------------------------------------------------------------------------------- -------------------------------------------------------------------------------------------------------------------------------------------------------
dDr D C Allen (UK) 29 years £248 £20 £4,006 £4,256 £250------------------------------------------------------------------------------------------------------------------------------------------------------- -------------------------------------------------------------------------------------------------------------------------------------------------------
I C Conn (UK) 22 years £238 £69 £2,510 £3,375 £865------------------------------------------------------------------------------------------------------------------------------------------------------- -------------------------------------------------------------------------------------------------------------------------------------------------------
Dr B E Grote (US) 28 years $778 $102 $7,591 $7,902 $311------------------------------------------------------------------------------------------------------------------------------------------------------- -------------------------------------------------------------------------------------------------------------------------------------------------------
A G Inglis (UK) 27 years £296 £114 £2,936 £4,613 £1,677
Directors leaving the board in 2007------------------------------------------------------------------------------------------------------------------------------------------------------- -------------------------------------------------------------------------------------------------------------------------------------------------------
Lord Browne (UK) n/a £1,050 £0 £21,700 £21,552 (£148)------------------------------------------------------------------------------------------------------------------------------------------------------- -------------------------------------------------------------------------------------------------------------------------------------------------------
J A Manzoni (UK) n/a £193 £5 £2,961 £4,195 £1,234
a This information has been subject to audit.b Additional pension earned during the year includes an inflation increase of 4.4% for UK directors and 2.3% for US directors.c Transfer values have been calculated in accordance with version 8.1 of guidance note GN11 issued by the actuarial profession.d Dr Allen is due to retire on 31 March 2008 and will be entitled to take an immediate unreduced pension. The figures in the table relate to 2007 and so do not include
anticipated incremental cost of the unreduced pension (£1.36 million).
68
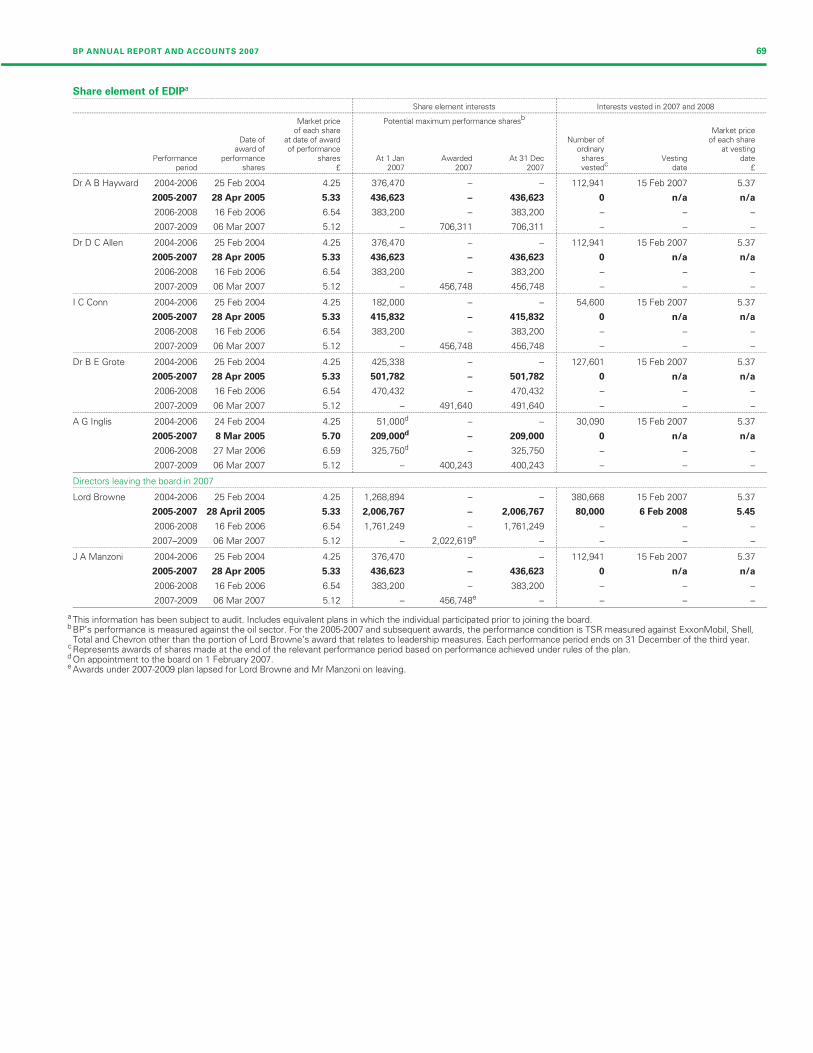
Filename: U54368_doc4.3d Time: 14:49:46 Date: 25/02/08Checksum: -1593958249
Share element of EDIPa
--------------------------------------------------------------------------------------------------------------------------------------------------------------------------------------------------------------------------------------------------------------------------------------------------------
Share element interests Interests vested in 2007 and 2008--------------------------------------------------------------------------------------------------------------------------------------------------------------------------------------------------------------------------------------------------------------------------------------------------------
bMarket price Potential maximum performance sharesof each share Market price
Date of at date of award Number of of each shareaward of of performance ordinary at vesting
Performance performance shares At 1 Jan Awarded At 31 Dec shares Vesting datecperiod shares £ 2007 2007 2007 vested date £
--------------------------------------------------------------------------------------------------------------------------------------------------------------------------------------------------------------------------------------------------------------------------------------------------------
Dr A B Hayward 2004-2006 25 Feb 2004 4.25 376,470 – – 112,941 15 Feb 2007 5.37
2005-2007 28 Apr 2005 5.33 436,623 – 436,623 0 n/a n/a
2006-2008 16 Feb 2006 6.54 383,200 – 383,200 – – –
2007-2009 06 Mar 2007 5.12 – 706,311 706,311 – – –--------------------------------------------------------------------------------------------------------------------------------------------------------------------------------------------------------------------------------------------------------------------------------------------------------
Dr D C Allen 2004-2006 25 Feb 2004 4.25 376,470 – – 112,941 15 Feb 2007 5.37
2005-2007 28 Apr 2005 5.33 436,623 – 436,623 0 n/a n/a
2006-2008 16 Feb 2006 6.54 383,200 – 383,200 – – –
2007-2009 06 Mar 2007 5.12 – 456,748 456,748 – – –--------------------------------------------------------------------------------------------------------------------------------------------------------------------------------------------------------------------------------------------------------------------------------------------------------
I C Conn 2004-2006 25 Feb 2004 4.25 182,000 – – 54,600 15 Feb 2007 5.37
2005-2007 28 Apr 2005 5.33 415,832 – 415,832 0 n/a n/a
2006-2008 16 Feb 2006 6.54 383,200 – 383,200 – – –
2007-2009 06 Mar 2007 5.12 – 456,748 456,748 – – –--------------------------------------------------------------------------------------------------------------------------------------------------------------------------------------------------------------------------------------------------------------------------------------------------------
Dr B E Grote 2004-2006 25 Feb 2004 4.25 425,338 – – 127,601 15 Feb 2007 5.37
2005-2007 28 Apr 2005 5.33 501,782 – 501,782 0 n/a n/a
2006-2008 16 Feb 2006 6.54 470,432 – 470,432 – – –
2007-2009 06 Mar 2007 5.12 – 491,640 491,640 – – –--------------------------------------------------------------------------------------------------------------------------------------------------------------------------------------------------------------------------------------------------------------------------------------------------------
dA G Inglis 2004-2006 24 Feb 2004 4.25 51,000 – – 30,090 15 Feb 2007 5.37
2005-2007 8 Mar 2005 5.70 209,000d – 209,000 0 n/a n/ad2006-2008 27 Mar 2006 6.59 325,750 – 325,750 – – –
2007-2009 06 Mar 2007 5.12 – 400,243 400,243 – – –
Directors leaving the board in 2007--------------------------------------------------------------------------------------------------------------------------------------------------------------------------------------------------------------------------------------------------------------------------------------------------------
Lord Browne 2004-2006 25 Feb 2004 4.25 1,268,894 – – 380,668 15 Feb 2007 5.37
2005-2007 28 April 2005 5.33 2,006,767 – 2,006,767 80,000 6 Feb 2008 5.45
2006-2008 16 Feb 2006 6.54 1,761,249 – 1,761,249 – – –e2007–2009 06 Mar 2007 5.12 – 2,022,619 – – –
--------------------------------------------------------------------------------------------------------------------------------------------------------------------------------------------------------------------------------------------------------------------------------------------------------
J A Manzoni 2004-2006 25 Feb 2004 4.25 376,470 – – 112,941 15 Feb 2007 5.37
2005-2007 28 Apr 2005 5.33 436,623 – 436,623 0 n/a n/a
2006-2008 16 Feb 2006 6.54 383,200 – 383,200 – – –e2007-2009 06 Mar 2007 5.12 – 456,748 – – –
------
------
-----
-----
---------------
---------------
--------------------
--------------------
--------------------
--------------------
---
---
----------------
----------------
--------------------
--------------------
--------------------
--------------------
-------------
-------------
----
----
---
---
---
---
---
---
---
---
---
---
---
---
--
--
---
---
---
---
---
---
---
---
---
---
----
----
- -
a This information has been subject to audit. Includes equivalent plans in which the individual participated prior to joining the board.b BP’s performance is measured against the oil sector. For the 2005-2007 and subsequent awards, the performance condition is TSR measured against ExxonMobil, Shell,
Total and Chevron other than the portion of Lord Browne’s award that relates to leadership measures. Each performance period ends on 31 December of the third year.c Represents awards of shares made at the end of the relevant performance period based on performance achieved under rules of the plan.d On appointment to the board on 1 February 2007.e Awards under 2007-2009 plan lapsed for Lord Browne and Mr Manzoni on leaving.
–
–
BP ANNUAL REPORT AND ACCOUNTS 2007 69
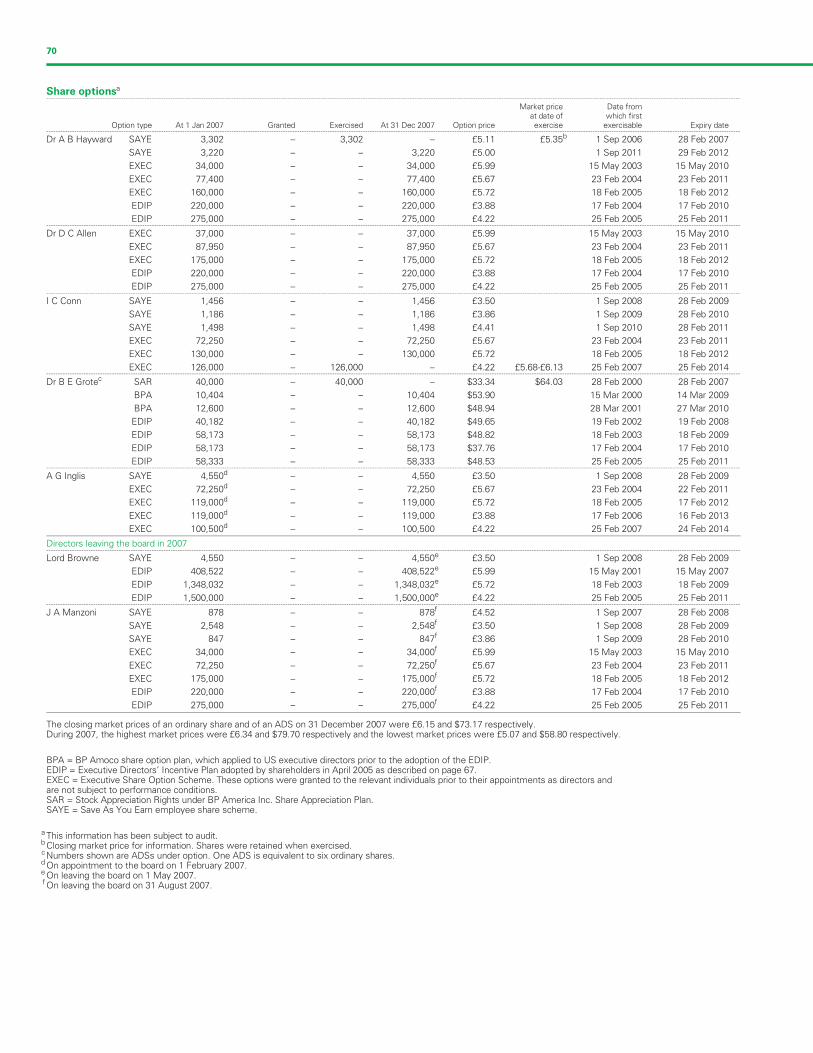
Filename: U54368_doc4.3d Time: 14:49:47 Date: 25/02/08
Checksum: -2005084522
Share optionsa
--------------------------------------------------------------------------------------------------------------------------------------------------------------------------------------------------------------------------------------------------------------------------------------------------------
Market price Date fromat date of which first
Option type At 1 Jan 2007 Granted Exercised At 31 Dec 2007 Option price exercise exercisable Expiry date--------------------------------------------------------------------------------------------------------------------------------------------------------------------------------------------------------------------------------------------------------------------------------------------------------
bDr A B Hayward SAYE 3,302 – 3,302 – £5.11 £5.35 1 Sep 2006 28 Feb 2007
SAYE 3,220 – – 3,220 £5.00 1 Sep 2011 29 Feb 2012
EXEC 34,000 – – 34,000 £5.99 15 May 2003 15 May 2010
EXEC 77,400 – – 77,400 £5.67 23 Feb 2004 23 Feb 2011
EXEC 160,000 – – 160,000 £5.72 18 Feb 2005 18 Feb 2012
EDIP 220,000 – – 220,000 £3.88 17 Feb 2004 17 Feb 2010
EDIP 275,000 – – 275,000 £4.22 25 Feb 2005 25 Feb 2011--------------------------------------------------------------------------------------------------------------------------------------------------------------------------------------------------------------------------------------------------------------------------------------------------------
Dr D C Allen EXEC 37,000 – – 37,000 £5.99 15 May 2003 15 May 2010
EXEC 87,950 – – 87,950 £5.67 23 Feb 2004 23 Feb 2011
EXEC 175,000 – – 175,000 £5.72 18 Feb 2005 18 Feb 2012
EDIP 220,000 – – 220,000 £3.88 17 Feb 2004 17 Feb 2010
EDIP 275,000 – – 275,000 £4.22 25 Feb 2005 25 Feb 2011--------------------------------------------------------------------------------------------------------------------------------------------------------------------------------------------------------------------------------------------------------------------------------------------------------
I C Conn SAYE 1,456 – – 1,456 £3.50 1 Sep 2008 28 Feb 2009
SAYE 1,186 – – 1,186 £3.86 1 Sep 2009 28 Feb 2010
SAYE 1,498 – – 1,498 £4.41 1 Sep 2010 28 Feb 2011
EXEC 72,250 – – 72,250 £5.67 23 Feb 2004 23 Feb 2011
EXEC 130,000 – – 130,000 £5.72 18 Feb 2005 18 Feb 2012
EXEC 126,000 – 126,000 – £4.22 £5.68-£6.13 25 Feb 2007 25 Feb 2014--------------------------------------------------------------------------------------------------------------------------------------------------------------------------------------------------------------------------------------------------------------------------------------------------------
cDr B E Grote SAR 40,000 – 40,000 – $33.34 $64.03 28 Feb 2000 28 Feb 2007
BPA 10,404 – – 10,404 $53.90 15 Mar 2000 14 Mar 2009
BPA 12,600 – – 12,600 $48.94 28 Mar 2001 27 Mar 2010
EDIP 40,182 – – 40,182 $49.65 19 Feb 2002 19 Feb 2008
EDIP 58,173 – – 58,173 $48.82 18 Feb 2003 18 Feb 2009
EDIP 58,173 – – 58,173 $37.76 17 Feb 2004 17 Feb 2010
EDIP 58,333 – – 58,333 $48.53 25 Feb 2005 25 Feb 2011--------------------------------------------------------------------------------------------------------------------------------------------------------------------------------------------------------------------------------------------------------------------------------------------------------
dA G Inglis SAYE 4,550 – – 4,550 £3.50 1 Sep 2008 28 Feb 2009dEXEC 72,250 – – 72,250 £5.67 23 Feb 2004 22 Feb 2011dEXEC 119,000 – – 119,000 £5.72 18 Feb 2005 17 Feb 2012dEXEC 119,000 – – 119,000 £3.88 17 Feb 2006 16 Feb 2013dEXEC 100,500 – – 100,500 £4.22 25 Feb 2007 24 Feb 2014
Directors leaving the board in 2007--------------------------------------------------------------------------------------------------------------------------------------------------------------------------------------------------------------------------------------------------------------------------------------------------------
eLord Browne SAYE 4,550 – – 4,550 £3.50 1 Sep 2008 28 Feb 2009eEDIP 408,522 – – 408,522 £5.99 15 May 2001 15 May 2007eEDIP 1,348,032 – – 1,348,032 £5.72 18 Feb 2003 18 Feb 2009eEDIP 1,500,000 – – 1,500,000 £4.22 25 Feb 2005 25 Feb 2011
--------------------------------------------------------------------------------------------------------------------------------------------------------------------------------------------------------------------------------------------------------------------------------------------------------fJ A Manzoni SAYE 878 – – 878 £4.52 1 Sep 2007 28 Feb 2008fSAYE 2,548 – – 2,548 £3.50 1 Sep 2008 28 Feb 2009fSAYE 847 – – 847 £3.86 1 Sep 2009 28 Feb 2010fEXEC 34,000 – – 34,000 £5.99 15 May 2003 15 May 2010fEXEC 72,250 – – 72,250 £5.67 23 Feb 2004 23 Feb 2011fEXEC 175,000 – – 175,000 £5.72 18 Feb 2005 18 Feb 2012fEDIP 220,000 – – 220,000 £3.88 17 Feb 2004 17 Feb 2010fEDIP 275,000 – – 275,000 £4.22 25 Feb 2005 25 Feb 2011
The closing market prices of an ordinary share and of an ADS on 31 December 2007 were £6.15 and $73.17 respectively.During 2007, the highest market prices were £6.34 and $79.70 respectively and the lowest market prices were £5.07 and $58.80 respectively.
BPA = BP Amoco share option plan, which applied to US executive directors prior to the adoption of the EDIP.EDIP = Executive Directors’ Incentive Plan adopted by shareholders in April 2005 as described on page 67.EXEC = Executive Share Option Scheme. These options were granted to the relevant individuals prior to their appointments as directors andare not subject to performance conditions.SAR = Stock Appreciation Rights under BP America Inc. Share Appreciation Plan.SAYE = Save As You Earn employee share scheme.
a This information has been subject to audit.b Closing market price for information. Shares were retained when exercised.c Numbers shown are ADSs under option. One ADS is equivalent to six ordinary shares.d On appointment to the board on 1 February 2007.e On leaving the board on 1 May 2007.f On leaving the board on 31 August 2007.
70
Filename: U54368_doc4.3d Time: 14:49:47 Date: 25/02/08
Checksum: 1046714454
Service contracts
------------------------------------------------------------------------------------------------------------------------------- -----------------
Director Contract date Salary as at 31 Dec 2007------------------------------------------------------------------------------------------------------------------------------- -----------------
Dr A B Hayward 29 Jan 2003 £950,000
Dr D C Allen 29 Jan 2003 £510,000
I C Conn 22 Jul 2004 £650,000
Dr B E Grote 7 Aug 2000 $1,300,000
A G Inglis 1 Feb 2007 £650,000
Service contracts are expressed to expire at a normal retirement age of
60 (subject to age discrimination). The contracts have a notice period of
one year.
The service contracts of UK directors may be terminated by the
company at any time with immediate effect on payment in lieu of notice
equivalent to one year’s salary or the amount of salary that would have
been paid if the contract had terminated on the expiry of the remainder
of the notice period.
Dr Grote’s contract is with BP Exploration (Alaska) Inc. He is seconded
to BP p.l.c. under a secondment agreement of 7 August 2000, which
expires on 31 March 2010. The secondment can be terminated by one
month’s notice by either party and terminates automatically on the
termination of Dr Grote’s service contract.
There are no other provisions for compensation payable on early
termination of the above contracts. In the event of the early termination
of any of the contracts by the company, other than for cause (or under
a specific termination payment provision), the relevant director’s then-
current salary and benefits would be taken into account in calculating
any liability of the company.
Since January 2003, new service contracts include a provision to allow
for severance payments to be phased, when appropriate. The committee
will also consider mitigation to reduce compensation to a departing
director, when appropriate to do so.
Directors leaving the board
2007
Both Lord Browne and Mr Manzoni, who were employed by the
company under service contracts dated 11 November 1993 and
29 January 2003 respectively, left the company during the year. Lord
Browne, who left on 1 May 2007, was eligible for an ex gratia lump
sum superannuation payment equal to one year’s salary (£1,575,000)
but, in light of his resignation, did not receive the compensation for
loss of office previously notified to shareholders. Mr Manzoni, who
left on 31 August 2007, was entitled to one year’s salary (£485,000)
as compensation on termination in accordance with his contractual
entitlement. Both individuals were eligible for a pro-rata bonus for 2007,
reflecting achievement of bonus targets and their period of employment
during the year. As regards long-term incentives, both individuals retain
their performance awards under the EDIP in respect of 2005-2007 and
2006-2008 share element and these will vest at the normal time to the
extent the performance targets are met. Both individuals forfeited their
participation in the 2007-2009 share element. Further details of these
awards are set out in the table on page 69. Both individuals retained their
outstanding share options, as set out in the table on page 70.
In connection with the shareholder derivative actions brought in the US
against the directors of the company, the company has agreed with the
plaintiffs in the Alaska action, with the consent of Lord Browne and
Mr Manzoni, to defer the release of certain amounts and preserved share
awards to those individuals (other than Lord Browne’s ex gratia
superannuation payment) pending resolution of the action. The company
has agreed to pay the individuals simple interest at the rate of 6.5% in
respect of the period of deferral.
2008
As has been announced, Dr Allen will leave the company at the end
of March 2008. He will be entitled to one year’s salary (£510,000) as
compensation in accordance with his contractual entitlement, as well
as a pro-rata bonus for 2008 and continued full participation in the
2006-2008 and 2007-2009 share elements, according to the normal
rules of the plan.
Executive directors – external appointmentsThe board encourages executive directors to broaden their knowledge
and experience by taking up appointments outside the company. Each
executive director is permitted to accept one non-executive appointment,
from which they may retain any fee. External appointments are subject
to agreement by the chairman and must not conflict with a director’s
duties and commitments to BP.
During the year, the fees received by executive directors for external
appointments were as follows:
------------------------------------------------------------------------------------------------------------------------------- -----------------
Executive director Appointee company Total fees------------------------------------------------------------------------------------------------------------------------------- -----------------
Dr A B Hayward Corus £62,250
Tata Steel £177------------------------------------------------------------------------------------------------------------------------------- -----------------
I C Conn Rolls Royce £57,166------------------------------------------------------------------------------------------------------------------------------- -----------------
Dr B E Grote Unilever Unilever PLC £31,000
Unilever NV E45,000------------------------------------------------------------------------------------------------------------------------------- -----------------
A G Inglis BAE Systems £39,661
Remuneration committeeAll the members of the committee are independent non-executive
directors. Throughout the year, Dr Julius (chairman), Mr Davis,
Sir Tom McKillop and Sir Ian Prosser were members. Mr Bryan retired
as a member in April 2007. The group chief executive at the time was
consulted on matters relating to the other executive directors who report
to him and on matters relating to the performance of the company;
he was not present when matters affecting his own remuneration
were discussed.
Tasks
The remuneration committee’s tasks are:
– To determine, on behalf of the board, the terms of engagement and
remuneration of the group chief executive and the executive directors
and to report on these to the shareholders.
– To determine, on behalf of the board, matters of policy over which
the company has authority regarding the establishment or operation
of the company’s pension scheme of which the executive directors
are members.
– To nominate, on behalf of the board, any trustees (or directors of
corporate trustees) of the scheme.
– To review the policies being applied by the group chief executive in
remunerating senior executives other than executive directors to
ensure alignment and proportionality.
Constitution and operation
Each member of the remuneration committee is subject to annual re-
election as a director of the company. The board considers all committee
members to be independent (see page 75).
They have no personal financial interest, other than as shareholders,
in the committee’s decisions.
The committee met six times in the period under review. There was a
full attendance record. Mr Sutherland, as chairman of the board, attended
all the committee meetings.
The committee is accountable to shareholders through its annual
report on executive directors’ remuneration. It will consider the outcome
of the vote at the AGM on the directors’ remuneration report and
take into account the views of shareholders in its future decisions.
The committee values its dialogue with major shareholders on
remuneration matters.
BP ANNUAL REPORT AND ACCOUNTS 2007 71
Filename: U54368_doc4.3d Time: 14:49:47 Date: 25/02/08
Checksum: -2051153009
Advice
Advice is provided to the committee by the company secretary’s office,
which is independent of executive management and reports to the
chairman of the board. Mr Aronson, an independent consultant, is the
committee’s secretary and special adviser. Advice was also received
from Mr Jackson, the company secretary.
The committee also appoints external advisers to provide specialist
advice and services on particular remuneration matters. The
independence of the advice is subject to annual review.
In 2007, the committee continued to engage Towers Perrin as its
principal external adviser. Towers Perrin also provided limited ad-hoc
remuneration and benefits advice to parts of the group, principally
changes in employee share plans and some market information on
pay structures.
Freshfields Bruckhaus Deringer provided legal advice on specific
matters to the committee, as well as providing some legal advice to
the group.
Ernst & Young reviewed the calculations on the financial-based
targets that form the basis of the performance-related pay for executive
directors, that is, the annual bonus and share element awards described
on page 66, to ensure they met an independent, objective standard. They
also provided audit, audit-related and taxation services for the group.
Part 3: Non-executive directors’ remuneration
Policy
The board sets the level of remuneration for all non-executive directors
within a limit approved from time to time by shareholders. In accordance
with BP’s board governance principles, the remuneration of the chairman
is set by the board rather than by the remuneration committee, as the
performance of the chairman is seen as a matter for the board as a
whole rather than any one committee.
Key elements of BP’s non-executive director remuneration policy
include:
– Remuneration should be sufficient to attract and retain world-class
non-executive talent.
– Remuneration of non-executive directors is set by the board and
should be proportional to their contribution towards the interests
of the company.
– Remuneration practice should be consistent with recognized best
practice standards for non-executive directors’ remuneration.
– Remuneration should be in the form of cash fees, payable monthly.
– Non-executive directors should not receive share options from the
company.
– Non-executive directors are encouraged to establish a holding in BP
shares of the equivalent value of one year’s base fee.
Remuneration review
In 2007, an ad-hoc board committee was formed to review the structure
and quantum of BP non-executive directors’ remuneration (having
previously been reviewed in 2004).
The committee considered the existing BP policy on non-executive
directors’ remuneration and concluded that it should remain unchanged.
The committee evaluated non-executive director remuneration levels and
trends in both the UK and internationally, using a number of external data
sources. Outside the UK, particular focus was given to the remuneration
practices for non-executive directors in the US. The committee also
examined how the time commitment and workload for the board and its
committees had changed in the three years since the previous review.
Following the review, the committee proposed a revised structure
and level of remuneration for BP non-executive directors. Key changes
included:
– Increases to the fees for the chairman and deputy chairman/senior
independent director to reflect the market rates paid for those
positions in companies of comparable size to BP.
– The introduction of a flat fee for membership of the audit, the safety,
ethics and environment assurance, the remuneration and the
nomination committees (but not the chairman’s committee) to reflect
the increased time commitment for board committees over the past
three years.
– An increase in the fee for the chairmen of the audit committee and
SEEAC to reflect the increase in time commitment and market rates
for those committees.
Consideration was also given to abolishing the transatlantic attendance
allowance, but the committee concluded that this would be to the
detriment of non-executives based outside Europe, who would not
otherwise be compensated for the additional travel time required for
UK meetings.
Changes to the structure and an increase to the level of non-executive
directors’ fees were approved by the board and became effective
1 November 2007.
72
Filename: U54368_doc4.3d Time: 14:49:47 Date: 25/02/08
Checksum: 1662787820
Fee structure
The table below shows the revised fee structure for non-executive
directors.
£ thousand------------------------------------------------------------------------------------------------------------------------------
Fee level from
Fee level 2005-07 1 Nov 2007------------------------------------------------------------------------------------------------------------------------------
aChairman 500 600bDeputy chairman 100 120
Board member 75 75cCommittee chairmanship flat fee 20 –
Audit committee and SEEAC chairmanship fees – 30
Remuneration committee chairmanship fee – 20
Transatlantic attendance allowance 5 5
Committee membership fee – 5
a The chairman remains ineligible for committee chairmanship and membership feesor transatlantic attendance allowance.
b The role of deputy chairman is combined with that of senior independent director.The deputy chairman is still eligible for committee chairmanship fee andtransatlantic attendance allowance plus any committee membership fees.
c Committee chairmen will not receive an additional membership fee for thecommittee they chair.
Remuneration of non-executive directors in 2007a
------------------------------------------------------------------------------------------------------------------------
£ thousand------------------------------------------------------------------------------------------------------------------------
2006 2007------------------------------------------------------------------------------------------------------------------------
A Burgmans 85 86
Sir William Castell 39 87bC B Carroll n/a 43
E B Davis, Jr 100 107
D J Flint 100 86
Dr D S Julius 105 106
Sir Tom McKillop 85 87
Dr W E Massey 130 133
Sir Ian Prosser 130 137
P D Sutherland 500 517
Directors leaving the board in 2007------------------------------------------------------------------------------------------------------------------------
cJ H Bryan 110 45
a This information has been subject to audit.b Appointed on 6 June 2007.c Also received a superannuation gratuity of £21,000.
No share or share option awards were made to any non-executive
director in respect of service on the board during 2007.
Non-executive directors have letters of appointment, which
recognize that, subject to the Articles of Association, their service
is at the discretion of shareholders. All directors stand for re-election
at each AGM.
Superannuation gratuities
Until 2002, BP maintained a long-standing practice whereby non-
executive directors who retired from the board after at least six years’
service were eligible for consideration for a superannuation gratuity.
The board was, and continues to be, authorized to make such payments
under the company’s Articles of Association and the amount of the
payment is determined at the board’s discretion, having regard to the
director’s period of service as a director and other relevant factors.
In 2002, the board revised its policy with respect to superannuation
gratuities so that:
– Non-executive directors appointed to the board after 1 July 2002
would not be eligible for consideration for such a payment.
– While non-executive directors in service at 1 July 2002 would remain
eligible for consideration for a payment, service after that date
would not be taken into account by the board in considering the
amount of any such payment.
The board made a superannuation gratuity of £21,000 during the year
to Mr John Bryan, who retired in April 2007. This payment was in line
with the policy arrangements agreed in 2002 and outlined above.
Non-executive directors of Amoco Corporation
Non-executive directors who were formerly non-executive directors of
Amoco Corporation have residual entitlements under the Amoco Non-
Employee Directors’ Restricted Stock Plan. Directors were allocated
restricted stock in remuneration for their service on the board of Amoco
Corporation prior to its merger with BP in 1998. On merger, interests in
Amoco shares in the plan were converted into interests in BP ADSs. The
restricted stock will vest on the retirement of the non-executive director
at the age of 70 (or earlier at the discretion of the board). Since the
merger, no further entitlements have accrued to any director under the
plan. The residual interests, as interests in a long-term incentive scheme,
are set out in the table below, in accordance with the Directors’
Remuneration Report Regulations 2002.
------------------------------------------------------------------------------------------------------------------------------- -----------------
Interest in BP ADSs Date onat 1 Jan 2007 and which director
a b31 Dec 2007 reaches age 70------------------------------------------------------------------------------------------------------------------------------- -----------------
E B Davis, Jr 4,490 5 August 2014
Dr W E Massey 3,346 5 April 2008
Directors leaving the board in 2007------------------------------------------------------------------------------------------------------------------------------- -----------------
cJ H Bryan 5,546 5 October 2006
a No awards were granted and no awards lapsed during the year. The awards weregranted over Amoco stock prior to the merger but their notional weighted averagemarket value at the date of grant (applying the subsequent merger ratio of 0.66167of a BP ADS for every Amoco share) was $27.87 per BP ADS.
b For the purposes of the regulations, the date on which the director retires from theboard at or after the age of 70 is the end of the qualifying period. If the directorretires prior to this date, the board may waive the restrictions.
c Mr Bryan retired from the board on 12 April 2007. He had received awards ofAmoco shares under the plan between 25 April 1989 and 28 April 1998 prior tothe merger. These interests had been converted into BP ADSs at the time of themerger. In accordance with the terms of the plan, the board exercised its discretionover this award on 12 April 2007 and the shares vested on that date (when the BPADS market price was $66.79) without payment by him.
Past directors
Mr Miles (who was a non-executive director of BP until April 2006) was
appointed as a director and non-executive chairman of BP Pension
Trustees Limited in October 2006 for a term of three years. During 2007,
he received £150,000 for this role.
This directors’ remuneration report was approved by the board and
signed on its behalf by David J Jackson, Company Secretary, on
22 February 2008.
BP ANNUAL REPORT AND ACCOUNTS 2007 73

Filename: U54368_doc5.3d Time: 14:49:48 Date: 25/02/08
Checksum: -1749443193
BP board performance report
Letter from the chairman
Dear Shareholder
During the past year, the board has carefully considered the role it plays
and its method of working. Central to this is the board’s review of its
system of governance. This has been timely – BP adopted its prior
governance framework for the board more than 10 years ago. This
approach has stood the board in good stead and has been robust when
judged against the standards of governance that have developed over
time. This framework will continue to underpin our approach.
It has, however, been important for the board to consider the position
of the company in the markets in which it operates and to ensure that
the manner in which the board works will meet the challenges that BP
will face in the future. As part of the review, each board member
discussed their evaluation of the existing policies and proposed their
views on the role and challenges for the BP board going forward. The
review process also involved benchmarking, identifying examples of
governance best practice and a legal review of US and UK board policies.
The board clearly needs to focus on its unique tasks and these are
described in the company’s ‘board governance principles’, which were
approved in November and can now be found on our website.
The board will keep its work and performance under regular review
and will revisit the governance principles annually. Set out below is a
description of the board and its committees and an account of the work
that they have done during the year.
Peter Sutherland
Chairman
22 February 2008
Board governance principles
The board governance principles describe the board’s relationship with
shareholders and executive management, the conduct of board affairs
and the tasks and requirements for board committees. They outline
the board’s focus on activities that enable it to promote shareholders’
interests, specifically the active consideration of strategy, the
monitoring of executive action and ongoing board and executive
management succession.
The board believes that the governance of BP is best achieved by the
delegation of its authority for executive management to the group chief
executive, subject to monitoring by the board and the limitations defined
in the board governance principles. These ‘executive limitations’ require
that any executive action taken in the course of business takes specific
issues into consideration, including health, safety and the environment,
risk and internal controls and financing.
BP’s board governance principles can be viewed on the ‘governance’
section of bp.com at www.bp.com/corporategovernance.
Operating the principles
The group chief executive describes to the board in the annual business
plan how the strategy is to be delivered, together with an assessment
of the group’s risks. During the year, the board monitors progress and
keeps the strategy under regular review.
The group chief executive is obliged to review and discuss with the
board all strategic projects or developments and all material matters
currently or prospectively affecting the company and its performance.
The board governance principles further set out how the group chief
executive’s performance will be monitored during the year.
The board’s engagement with shareholders
The board is accountable to shareholders for the performance and
activities of the BP group. The board takes steps to engage with
shareholders and to evaluate the relevant financial, social, environmental
and ethical matters that may influence or affect the business. The board
recognizes that, in conducting its business, BP should be responsive to
other relevant constituencies.
During the year, the chairman met with institutional shareholders to
discuss issues relating to the board, governance and high-level strategy
and the remuneration committee consulted with larger shareholders on
elements of the executive remuneration plan.
The group chief executive, other executive directors and senior
management, company secretary’s office, investor relations and other
teams within BP also engage with a broad range of shareholders on
wider issues relating to the group, including in particular its safety,
operations and financial performance. Presentations given by the
company to the investment community are available to download from
the ‘investors’ section of www.bp.com, as are speeches on topics of
broad interest to shareholders made by the group chief executive and
other senior members of the management team.
BP’s AGM
Shareholders are encouraged to attend the AGM and use the
opportunity to ask questions and hear the resulting discussion about
BP’s performance. However, given the size and geographical diversity
of the company’s shareholder base, attendance may not always be
practical and shareholders are encouraged to use proxy voting on the
resolutions put forward. Every vote cast, whether in person or by proxy
at shareholder meetings, is counted, because votes on all matters
except procedural issues are taken by a poll.
Copies of speeches and presentations given at the AGM are available
to download from the BP website after the event, together with the
outcome of voting on the resolutions.
Both the chairman and board committee chairmen were present
during the 2007 AGM. Board members met shareholders on an informal
basis after the main business of the meeting. In 2007, voting levels at
the AGM showed a slight decrease to 61%, compared with 64% in
2006. It is proposed that the AGM in 2008 will also be webcast.
Director elections
All directors stand for re-election by shareholders each year, with new
directors being subject to election at the first opportunity following
their appointment. All the names submitted to shareholders for
election are accompanied by a biography and a description of the
skills and experience that the company feels are relevant in
proposing each director for election.
Voting levels at the 2007 AGM demonstrated continued support
for all BP directors.
Board composition, skills and renewal
The board governance principles require the majority of the board to be
composed of independent non-executive directors and the size of the
board not normally to exceed 16 directors. The board is composed of
the chairman, 10 non-executive and five executive directors; in total,
four nationalities are represented.
Lord Browne resigned as group chief executive on 1 May 2007 and
was succeeded by Dr Anthony Hayward, who had been appointed group
74

Filename: U54368_doc5.3d Time: 14:49:48 Date: 25/02/08
Checksum: -1317280750
chief executive designate on 1 February 2007. Andy Inglis joined the
board on 1 February 2007 as chief executive of the exploration and
production segment succeeding Dr Hayward. John Manzoni resigned as
an executive director and chief executive of refining and marketing and
left the company on 31 August 2007. Dr David Allen will retire from the
board and the company at the end of March 2008.
From the non-executive directors, Mr John Bryan retired in April 2007
and, at the 2008 AGM, Dr Walter Massey will retire from the board.
In June 2007, Mrs Cynthia Carroll and, in February 2008, Mr George
David were appointed as a non-executive directors. External recruitment
consultants were used to identify Mrs Carroll and Mr David as candidates
and the board believes that their skills and experience will complement
those of existing board members and enhance the efficiency and
effectiveness of the board as a whole, particularly from the aspect of
BP’s US operations.
The board remains actively engaged in orderly succession planning
for both executive and non-executive roles and manages this with the
assistance of the nomination committee. The committee assesses the
balance of executive and non-executive directors and the composition of
the board in terms of the skills and diversity required to ensure it remains
relevant and effective. Following an assessment by the nomination
committee, the board will continue its policy of regularly refreshing
board membership.
The board has also begun the process for the identification and
selection of the board’s chairman, as Peter Sutherland will step down at
the 2009 AGM. This is being led by Sir Ian Prosser, deputy chairman and
the board’s senior independent director. The board is using an external
adviser to evaluate the board’s mix of skills and experience and to assist
in defining the criteria to be used in identifying potential candidates.
The adviser has also been engaged to assist with the selection process.
Board independence
Part of the qualification for board membership of BP is the requirement
that non-executive directors be free from any relationship with the
company’s executive management that could materially interfere
with the exercise of their independent judgement. In the board’s view,
BP’s non-executive directors fulfil this requirement and the board has
determined that those who served during 2007 were independent. BP is
involved in a long-term business of global scale and scope. Membership
of the board needs to reflect that not only in terms of skills but also in
terms of tenure where artificial restrictions on the duration of tenure may
not be best for the company. It is for this reason that all non-executive
directors have been subject to annual re-election since 2004.
Sir Ian Prosser joined the board in 1997. It is the view of the board that
he remains independent. His experience and long-term perspective on
BP’s business have provided and continue to provide a valuable
contribution to the board and to the audit committee, which he chairs. As
deputy chairman and senior independent director, Sir Ian is leading the
board’s search for the successor to the current chairman. He has been
asked by the board to remain in post until April 2010 at the latest in order
that he may conclude both the chairman’s succession process and the
identification and appointment by the new chairman of a senior
independent director.
BP completed the merger with Amoco in December 1998. Dr Walter
Massey and Erroll Davis, Jr are the two remaining former Amoco
directors. Dr Massey will retire as a director at the 2008 AGM. Both
directors have continued to be determined by the board to be
independent during the past year, with Dr Massey chairing the safety,
ethics and environment assurance committee (SEEAC). Mr Davis will
remain on the board until such time as he steps down as part of the
implementation of the board’s succession policy. The board believes
Mr Davis continues to demonstrate his independence as a director
through his ongoing contribution and challenge at board and
committee discussions.
The board has satisfied itself that there is no compromise to the
independence of those directors who serve together as directors on the
boards of outside entities (or who have other appointments in outside
entities). Where necessary, the board ensures appropriate processes are
in place to manage any possible conflict of interest.
The board: terms of appointment
The chairman and non-executive directors of BP serve on the basis of
letters of appointment. Executive directors of BP have service contracts
with the company. Details of all payments to directors are described in
the directors’ remuneration report.
The service contracts of executive directors are expressed to expire
at a normal retirement age of 60 (subject to age discrimination), while
non-executive directors ordinarily retire at the AGM following their
70th birthday.
In accordance with the company’s Articles of Association, directors are
granted an indemnity from the company in respect of liabilities incurred
as a result of their office, to the extent permitted by law. In respect of
those liabilities for which directors may not be indemnified, the company
maintained a directors’ and officers’ liability insurance policy throughout
2007. During the year, a review of the terms and nature of the policy
was undertaken and has been renewed for 2008. Although their defence
costs may be met, neither the company’s indemnity nor insurance
provides cover in the event that the director is proved to have acted
fraudulently or dishonestly.
BP ANNUAL REPORT AND ACCOUNTS 2007 75

Filename: U54368_doc5.3d Time: 14:49:48 Date: 25/02/08
Checksum: 372906196
In addition to the AGM (which 17 directors attended), the board metBoard and committees: meetings and attendance 12 times during 2007 for meetings of varying length: nine times in the
UK, twice in the US and once in Brussels. Two of these meetings
The board requires all members to devote sufficient time to the work of focused solely on strategy, one of them of two-days’ duration. A number
the board to discharge the office of director and to use their best of board committee meetings were held during the year; for details of
endeavours to attend meetings. these and their attendance by board members please see the table
below.
--------------------------------------------------------------------------------------------------------------------------------------------------------------------------------------------------------------------------------------------------------------------------------------------------------
Board Audit Chairman’s Remuneration Nominationmeetings committee SEEAC committee committee committee
--------------------------------------------------------------------------------------------------------------------------------------------------------------------------------------------------------------------------------------------------------------------------------------------------------
P D Sutherland 12/12 – – 5/5 6/6 5/5
J H Bryan 6/6 7/7 – 2/2 2/2 –
A Burgmans 12/12 – 8/8 5/5 – –
C B Carroll 3/4 – – 2/2 – –
Sir William Castell 11/12 14/14 7/8 5/5 – –
E B Davis, Jr 11/12 13/14 – 5/5 6/6 –
D J Flint 11/12 12/14 – 5/5 – –
Dr D S Julius 12/12 – – 5/5 6/6 5/5
Sir Tom McKillop 10/12 – 7/8 5/5 6/6 –
Dr W E Massey 12/12 – 8/8 5/5 – 5/5
Sir Ian Prosser 12/12 14/14 – 5/5 6/6 5/5
Lord Browne 6/6 – – – –
Dr D C Allen 12/12 – – – –
I C Conn 12/12 – – – –
Dr B E Grote 11/12 – – – –
Dr A B Hayward 12/12 – – – –
A G Inglis 9/9 – – – –
J A Manzoni 8/9 – – – –
–
–
–
–
–
–
–
of the chairman (which is then reported to the BP board). The board isServing as a director satisfied that these appointments do not conflict with their duties and
commitments to BP. Executive directors retain any fees received in
Induction respect of such external appointments and this is reported in the
Following their appointment to the board, new directors undertake an directors’ remuneration report.
induction programme, which includes matters such as the operation and
activities of the group (for example, key financial, business, social and Non-executive directors may serve on a number of outside boards,
environmental risks to the group’s activities), the board governance provided they continue to demonstrate the requisite commitment to
principles and the duties of directors. The operational and business discharge their duties to BP effectively. The nomination committee
element of the induction programme is tailored to the requirements of keeps under review the nature of directors’ other interests to ensure
the new director and is targeted for completion within the first six to nine that the efficacy of the board is not compromised and may make
months of taking office. recommendations to the board if it concludes that a director’s other
The chairman is accountable for the induction of new board members commitments are inconsistent with those required by BP.
and is assisted by the company secretary’s office in this task.
Evaluation
Training and site visits The board continued its ongoing evaluation processes to assess its
Directors are kept briefed on BP’s business, the environment in which performance and identify areas in which its effectiveness, policies and
it operates and other matters throughout their period in office. Non- processes might be enhanced. The board evaluated its performance
executive directors also receive training specific to the tasks of the during the year through the use of a board skills evaluation completed by
particular board committees on which they serve in order to complement an external facilitator and also individual director interviews held by the
their skills and knowledge and enhance their effectiveness during their company secretary. The process aimed at building on the outcome of the
tenure. On appointment, directors are advised of the legal and other previous year’s evaluation and assessing the way in which the board had
duties and obligations they have as directors of a listed company. The responded to issues that occurred during 2007. A report from the
board regularly considers the implications of these duties under the board external facilitator was considered by the board and recommendations
governance principles. adopted. The outcome from the evaluation has led the board to focus
During 2007, board members undertook visits to Thunder Horse in the on certain areas for 2008, including a greater use of site visits and
Gulf of Mexico, the refineries at Texas City and Gelsenkirchen, BP’s UK restructuring of forward board agendas.
trading operations in Canary Wharf and BP’s offices in Houston. All non- Separate evaluations of the audit and remuneration committees and of
executive directors are now required to participate in at least one site SEEAC took place during the year and are outlined in the reports for
visit per year. those committees below (and in the directors’ remuneration report in the
case of the remuneration committee).
Outside appointments
As part of their ongoing development, executive directors are permitted
to take up one external board appointment, subject to the agreement
76
Filename: U54368_doc5.3d Time: 14:49:48 Date: 25/02/08
Checksum: -481477419
The chairman and senior independent director
BP’s board governance principles require that neither the chairman nor
the deputy chairman is employed as an executive of the group. During
2007, the posts were held by Mr Sutherland and Sir Ian Prosser
respectively. Sir Ian also acts as BP’s senior independent director and is
available to shareholders who have concerns that cannot be addressed
through normal channels.
The chairman is responsible for leading the board and facilitating its
work. He ensures that the governance principles and processes of the
board are maintained and encourages debate and discussion. The
chairman also leads board performance appraisals. He represents the
views of the board to shareholders on key issues, not least in succession
planning for both executive and non-executive appointments.
Shareholders’ views are fed back to the board by the chairman.
The company secretary reports to the chairman and has no executive
functions. His remuneration is determined by the remuneration
committee.
Between board meetings, the chairman has responsibility for ensuring
the integrity and effectiveness of the relationship with executive
management. This requires his interaction with the group chief executive
between board meetings, as well as his contact with other board
members and shareholders.
The chairman and all the non-executive directors meet periodically as
the chairman’s committee. The performance of the chairman is evaluated
each year, with the evaluation discussion taking place when the chairman
is not present. The BP board governance principles require that the board
develop and maintain a plan for the succession of both the chairman and
the deputy chairman.
Board committees
The board governance principles allocate the tasks of monitoring
executive actions and assessing performance to certain board
committees. These tasks prescribe the authority and role of the board
committees.
Reports for each of the main board committees follow. In common
with the board, each committee has access to independent advice and
counsel as required and each is supported by the company secretary’s
office, which is independent of the executive management of the group.
Audit committee report
Membership
The audit committee consists solely of independent non-executive
directors who have been selected to provide a wide range of financial,
international and commercial expertise appropriate to fulfil the
committee’s duties.
Members of the audit committee throughout the year were Sir Ian
Prosser (chairman), Douglas Flint, Erroll Davis, Jr and Sir William Castell.
John Bryan was a member until his retirement in April 2007. Support is
provided by the committee secretary, David Pearl (deputy company
secretary).
The board has determined that Douglas Flint possesses the financial
and audit committee experience, as defined by the Combined Code
guidance and the SEC, and has nominated him as the audit committee’s
financial expert.
Meetings and attendance
The audit committee met 14 times during 2007.
At the request of the audit committee chairman, each meeting is
attended by the lead partner of the external auditors (Ernst & Young).
From BP, the group chief financial officer, the general auditor (head of
internal audit), the chief accounting officer and the deputy chief financial
officer also attend each meeting by invitation. Private sessions without
executive management present are held regularly.
Role and authority of the audit committee
The audit committee monitors the observance of the executive
limitations relating to financial matters and does this on behalf of
the board.
BP’s board governance principles set out the main tasks and
requirements for each of the board committees. Key tasks for the audit
committee include gaining assurance on the integrity of the group’s
reports, accounts and financial processes and reviewing the
management of financial risks and the internal controls designed to
address them. The audit committee believes that the tasks outlined
in the board governance principles meet each of the tasks and
activities outlined by the Combined Code as falling within the remit
of an audit committee.
Agendas
The audit committee uses a forward agenda at the start of each
year to establish an initial work programme. This is compiled using a
combination of regular items (including those required by regulation) and
items that reflect a current review of the group’s risks. The forward
agenda also includes regular meetings during the year with both the
external and internal auditors in private sessions where members of
executive management are not present.
During the year, the committee chairman reviews any issues that
may arise with the group chief financial officer, the external auditors and
the BP general auditor and will add items to the next meeting
agenda where appropriate.
Information
Information on audit committee agenda items are received from both
internal and external sources, including Ernst & Young, the general
auditor and the chief financial officer. The committee receives
presentations from a wide cross-section of BP’s business and financial
control management, with the attendance of additional Ernst & Young
partners, if appropriate, to a particular business or functional review.
The audit committee is able to access independent advice and counsel
when needed, on an unrestricted basis. Further support is provided to
the committee by the company secretary’s office and during 2007
external specialist legal and regulatory advice was provided by Sullivan &
Cromwell LLP.
The board is kept informed of the activities of the committee and any
issues that have arisen through the regular report given by the audit
committee chairman after each meeting. Minutes of the committee are
circulated to all board members.
Training
A programme has been developed with the committee to enable
committee members to update their skills and knowledge with regard to
the financial issues that may impact BP, for example on developments in
financial reporting and changes to financial standards.
Committee activities in 2007
Financial reports
During the year, the committee reviewed all financial reports before
recommending their publication to the board.
Internal controls and risk management
In 2007, the audit committee reviewed reports on risks, controls and
assurance for the BP business segments (Exploration and Production and
Refining and Marketing), together with gas, shipping, BP Alternative
Energy and BP’s trading function. A monitoring review was also carried
out on the performance of major BP projects against their original
sanctioned investment.
A joint meeting with SEEAC was held in early 2007 to review
the general auditor’s report on internal controls and risk management;
a further joint meeting took place in early 2008 on the same theme.
The committee discussed key regulatory issues during the year as
part of its standing agenda items, including a quarterly review of the
company’s evaluation of its internal controls systems as part of the
requirement of Section 404 of the Sarbanes-Oxley Act. The effectiveness
BP ANNUAL REPORT AND ACCOUNTS 2007 77
Filename: U54368_doc5.3d Time: 14:49:49 Date: 25/02/08
Checksum: 2003033505
of BP’s enterprise level controls was examined through the annual
assessment undertaken by the internal audit function.
In addition to the standing items on the agenda, the committee
considered a range of other topics including an update on TNK-BP,
a review of the group’s decommissioning provisions and the legal
settlements reached in the US. The committee also received an
independent report on the group’s US trading operations and visited
the trading operations in the UK.
External auditors
The lead audit partner from Ernst & Young attends all meetings of the
audit committee at the request of the committee chairman. Other audit
partners are invited to attend meetings where they can utilize their areas
of expertise, for example, during business segment or function reviews.
The committee held two private meetings during the year with the
external auditors without the presence of BP management, in order
to discuss any issues or concerns from either the committee or
the auditors.
Performance of the external auditors is evaluated by the audit
committee each year, with particular scrutiny of their independence,
objectivity and viability. Independence is assisted through the limiting of
non-audit services to tax and audit-related work that fall within defined
categories. This work is pre-approved by the audit committee and all
non-audit services are monitored quarterly.
Fees paid to the external auditors for the year (see Financial
statements – Note 17 on page 126) were $75 million, of which 16%
was for non-audit work. Non-audit services provided by Ernst & Young
have remained constant from 2006, and audit fees ($63 million in 2007
compared with $61 million in 2006) are also little changed as the impact
of inflation and exchange rate movements have been offset by
efficiency gains.
A new lead audit partner is appointed every five years and other senior
audit partners and staff are rotated every seven years. No partners or
senior staff from Ernst & Young who are currently connected with the
BP audit may transfer to the group. During the year, the committee
approved the appointment of a new lead partner from Ernst & Young to
replace the current partner who reaches five years’ service in early 2008.
The audit committee has considered both the proposed fee structure
and the audit engagement terms for 2008 and has recommended to the
board that the reappointment of the external auditors be proposed to
shareholders at the 2008 AGM.
Internal audit
BP’s internal audit function advises the committee on the company’s
identification and control of risk. The general auditor attends each
committee meeting at the invitation of the committee chairman and
presents a quarterly internal audit and controls report.
During the year, the audit committee evaluated the performance of the
internal audit function and agreed to the proposed forward programme of
work. The committee was also involved with finding a successor to the
general auditor who is due to retire in 2008. An external consultant was
engaged to undertake the search and the committee approved the
appointment of an external candidate with deep audit experience.
In 2007, the committee met once with the general auditor in a private
session without the presence of executive management.
Fraud reporting and employee concerns on financial matters
The audit committee received a quarterly report from internal audit
on instances of actual or potential fraud, and concerns relating to the
financial accounting of the company. The committee also received
reports on a quarterly basis from the group compliance and ethics
function, which captured issues relating to financial matters raised
through the employee concerns programme, OpenTalk, together
with topics highlighted by the company’s annual certification process.
Performance evaluation
The committee conducts a yearly evaluation of its performance. For
2007, the review methodology included a survey of committee members
and those individuals who regularly attend committee meetings. The
survey results were analysed by the company secretary’s office and
discussed at the November audit committee meeting. Areas for future
focus were identified following the evaluation, including training
opportunities for committee members. These have been incorporated
into the committee’s agenda for 2008.
The audit committee plans to meet 12 times during 2008.
Safety, ethics and environment assurance committee report
Membership
The committee’s members consist solely of independent non-executive
directors who have been selected to provide a wide range of operational
and international expertise appropriate to fulfil the committee’s duties.
Members of SEEAC during 2007 were Dr Walter Massey (chairman),
Antony Burgmans, Sir William Castell and Sir Tom McKillop. Support
was provided by the committee secretary, David Pearl (deputy
company secretary).
The committee chairman, Dr Massey, will retire as a director at the
2008 AGM. The appointment of his successor will be announced at
the 2008 AGM. Mrs Cynthia Carroll will be joining the committee in
due course.
Meetings and attendance
SEEAC met eight times during 2007.
At the request of the committee chairman, each SEEAC meeting is
attended by the lead partner of the external auditors (Ernst & Young) and
the BP general auditor (head of internal audit).
Reports and presentations to SEEAC are led by a member of
executive management. Following a change in executive responsibilities
during the year, the executive liaison with SEEAC changed from
Iain Conn to Dr Anthony Hayward, who attended three meetings
of the committee in the second half of 2007. Private sessions
without executive management in attendance are held at the end
of each meeting.
Role and authority of the committee
On behalf of the board, SEEAC monitors observance of the executive
limitations policy relating to the environmental, health and safety, security
and ethical performance of the company and compliance to its code
of conduct.
In common with the other BP board committees, the board
governance principles set out the main tasks and requirements for
SEEAC. These include monitoring and obtaining assurance that the
management or mitigation of material non-financial risks is appropriately
addressed by the group chief executive.
Agendas
The committee’s tasks are broad as they cover all non-financial risk, and
in constructing the forward agenda, the committee considers the risks
identified in BP’s business and annual plans and also the review of risks
conducted by the general auditor.
The forward agenda includes standing items that enable the
committee to monitor and assess how the executive limitations policy
is being observed (for example, health, safety and environment reports)
and to review the non-financial risks identified in the business plan (for
example, regional risk reviews). The committee also holds a joint session
with the audit committee to review the general auditor’s report on
internal controls and risk management.
During the year, the forward agenda is supplemented with any
emerging issues or developments that may arise.
Information
The committee receives information on agenda items from both internal
and external sources, including internal audit, the safety and operations
function, the group compliance and ethics function and Ernst & Young.
Like other board committees, SEEAC can access independent advice and
counsel if it requires, on an unrestricted basis.
The activities of the committee and any issues that have arisen are
reported back to the main board by the committee chairman following
each meeting.
78

Filename: U54368_doc5.3d Time: 14:49:49 Date: 25/02/08
Checksum: -1773894250
Committee activities in 2007
Baker Panel Report and appointment of independent expert
In January 2007, the Baker Panel published its report on BP’s corporate
safety culture and the oversight of safety management systems at
BP’s five US refineries. The company agreed to adopt all the panel’s
recommendations, which were aimed at improving process safety
performance at the five US plants, including the appointment of an
independent expert for a period of at least five years to monitor and
report annually on the progress of such implementation to the BP board.
In May, the board announced that L Duane Wilson, a member of the
Baker Panel, was appointed as the independent expert to provide an
objective assessment to the board of the company’s progress towards
implementation of the panel’s recommendations. Mr Wilson reports to
the chairman of SEEAC, has attended three of the committee’s meetings
since his appointment and has also accompanied the committee to its
site visit of the Texas City refinery.
SEEAC received a presentation on Mr Wilson’s detailed work plan in
early 2008 and he will now periodically report to SEEAC on his progress.
On behalf of the board, SEEAC will receive an annual report by mid-2008
in which Mr Wilson will address progress against the 10 Baker Panel
recommendations.
Group operations risk committee
The group operations risk committee (GORC) was formed at the end of
2006 by executive management. The GORC is chaired by the group chief
executive and reports regularly to SEEAC. GORC reports presented to
SEEAC during the year included reviews of the progress of the six-point
plan and the development of leading and lagging indicators of safety and
operational performance.
Site visits
The committee visited BP’s Gelsenkirchen refinery in Germany in March
2007 and the Texas City refinery in September. The annual committee
evaluation process concluded that such site visits were valuable to the
committee’s work and, as a result, other site visits are planned for
inclusion on the forward agenda for 2008.
Compliance and ethics
The committee is tasked with reviewing reports on the group’s
compliance with its code of conduct and on the employee concerns
programme (OpenTalk) as it relates to non-financial issues. During the
year, the committee received quarterly compliance and ethics reports,
reviewed the 2006 certification process and the nature and resolution
of cases raised through OpenTalk.
Other topics
Other topics reviewed during the year by SEEAC included a risk
review of the Latin America and Caribbean region; health, safety
and environmental progress in TNK-BP; and the BTC pipeline.
Performance evaluation
The committee conducts an annual review of its process and
performance. The 2007 committee review involved a facilitated
discussion at its November meeting. The review concluded that overall
the committee was functioning as intended but that going forward more
emphasis would be given to operational risk. In terms of committee
processes, the review concluded that greater focus should be given to
the effective use of the committee’s time, as the committee’s workload
had increased with the frequency and duration of meetings lengthening.
SEEAC plans to meet seven times during 2008.
Remuneration committee report
Membership
The committee’s members consist solely of non-executive directors
who are considered by the board to be independent.
Members of the remuneration committee during the year were
Dr DeAnne Julius (chairman), Erroll Davis, Jr, Sir Tom McKillop and
Sir Ian Prosser. John Bryan retired from the committee in April 2007.
The chairman of the board also attends meetings of the committee.
Meetings and attendance
The remuneration committee met six times during 2007 and is
independently advised.
Role and authority of the committee
The committee’s main task is to determine on behalf of the board the
terms of engagement and remuneration of the group chief executive and
the executive directors and to report on those to shareholders.
Further details on the committee’s role, authority and activities during
the year are set out in the directors’ remuneration report, which is the
subject of a vote by shareholders at the 2008 AGM.
Chairman’s committee report
The chairman’s committee completed the task that it commenced
in 2006, formally concluding the process for the identification and
appointment of a group chief executive to replace Lord Browne. This
process involved establishing a clear definition of the role description and
benchmarking internal candidates against an external population. The
committee held detailed interviews with each of the candidates and
undertook an evaluation of the candidates’ strengths and weaknesses.
During the year, the committee reviewed with Dr Hayward the short-
and long-term challenges facing the group and, in particular, Dr Hayward’s
proposals for the ‘forward agenda’.
The committee also considered a number of management changes
initiated by Dr Hayward and discussed his proposals for executive
succession. The committee reviewed Lord Browne’s performance
at the start of the year and that of Mr Sutherland at the end.
Nomination committee report
During the year, the nomination committee, through an external
facilitator, carried out a detailed review of the board’s skills aimed at
identifying any perceived deficiencies such that a comprehensive
succession plan could be prepared. The committee, under the
chairmanship of Sir Ian Prosser, has acted as the working group for
the identification of a successor to Mr Sutherland as chairman.
BP ANNUAL REPORT AND ACCOUNTS 2007 79
Filename: U54368_doc5.3d Time: 14:49:49 Date: 25/02/08
Checksum: -1172931014
Combined Code compliance
BP complied throughout 2007 with the provisions of the Combined Code
Principles of Good Governance and Code of Best Practice, except in the
following aspects:
A.4.4 Letters of appointment do not set out fixed time commitments
since the schedule of board and committee meetings is subject
to change according to the exigencies of the business. All directors
are expected to demonstrate their commitment to the work of the
board on an ongoing basis. This is reviewed by the nomination
committee in recommending candidates for annual re-election.
B.2.2 The remuneration of the chairman is fixed by the board as a whole
(rather than the remuneration committee) within the limits set by
shareholders, since the chairman’s performance is a matter for the
whole board.
Internal control review
The board, through its governance principles, has established a process
by which the effectiveness of the system of internal control can be
regularly reviewed as required by provision C.2.1 of the Combined Code.
The process enables the board and its committees to assess the
system of internal controls being operated for managing significant risks,
including social, environmental, safety and ethical risks, throughout the
year. The process did not extend to joint ventures or associates.
As part of this process, the board and the audit and the safety, ethics
and environment assurance committees requested, received and
reviewed reports from executive management, including management
of the business segments, at their regular meetings.
In considering the system, the board noted that such a system is
designed to manage, rather than eliminate, the risk of failure to achieve
business objectives and can only provide reasonable, and not absolute,
assurance against material misstatement or loss.
A joint meeting of the committees in January 2008 reviewed reports
from BP’s general auditor to support the board in its annual assessment
of internal control. The reports described the significant enduring and
inherent risks identified across the group, the effectiveness of executive
controls that respond to such risks and the continuing development of
the systems in place to identify and manage risks. The reports also
highlighted future risks of potential significance. These had been
reviewed by the board as part of the company’s planning process.
The committees engage with executive management during the year
on a regular basis to monitor the management of risks. Significant
incidents that occurred and management’s response to them were
considered by the committees during the year.
The board is satisfied that, where significant failings or weaknesses
in internal controls were identified during the year, appropriate remedial
actions were taken or are being taken.
In the board’s view, the information it received was sufficient to
enable it to review the effectiveness of the company’s system of internal
control in accordance with the Internal Control Revised Guidance for
Directors in the Combined Code (Turnbull).
80
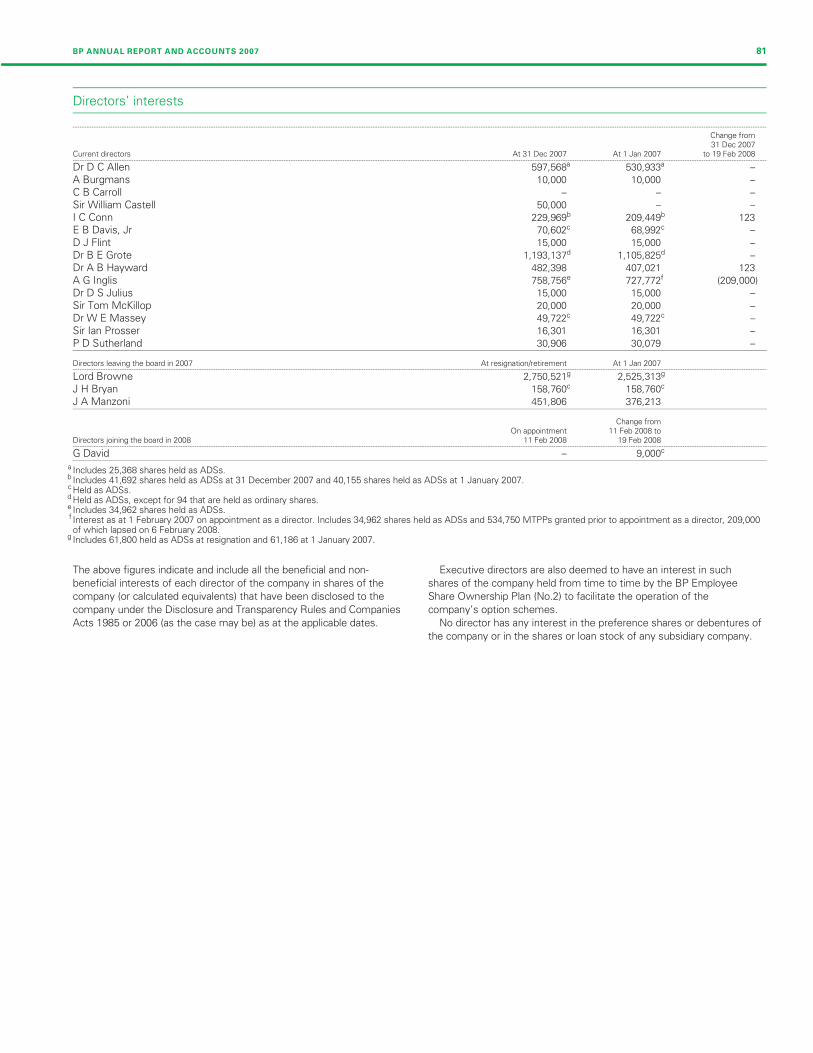
Filename: U54368_doc6.3d Time: 14:49:50 Date: 25/02/08
Checksum: -893624422
Directors’ interests
--------------------------------------------------------------------------------------------------------------------------------------------------------------------------------------------------------------------------------------------------------------------------------------------------------
Change from31 Dec 2007
Current directors At 31 Dec 2007 At 1 Jan 2007 to 19 Feb 2008--------------------------------------------------------------------------------------------------------------------------------------------------------------------------------------------------------------------------------------------------------------------------------------------------------
Dr D C Allen 597,568a 530,933a –
A Burgmans 10,000 10,000 –
C B Carroll – –
Sir William Castell 50,000 – –
I C Conn 229,969b 209,449b 123
E B Davis, Jr 70,602c 68,992c –
D J Flint 15,000 15,000 –
Dr B E Grote 1,193,137d 1,105,825d –
Dr A B Hayward 482,398 407,021 123
A G Inglis 758,756e 727,772f (209,000)
Dr D S Julius 15,000 15,000 –
Sir Tom McKillop 20,000 20,000 –
Dr W E Massey 49,722c 49,722c –
Sir Ian Prosser 16,301 16,301 –
P D Sutherland 30,906 30,079 –
Directors leaving the board in 2007 At resignation/retirement At 1 Jan 2007--------------------------------------------------------------------------------------------------------------------------------------------------------------------------------------------------------------------------------------------------------------------------------------------------------
Lord Browne 2,750,521g 2,525,313g
J H Bryan 158,760c 158,760c
J A Manzoni 451,806 376,213
Change fromOn appointment 11 Feb 2008 to
Directors joining the board in 2008 11 Feb 2008 19 Feb 2008--------------------------------------------------------------------------------------------------------------------------------------------------------------------------------------------------------------------------------------------------------------------------------------------------------
G David – 9,000c
a Includes 25,368 shares held as ADSs.b Includes 41,692 shares held as ADSs at 31 December 2007 and 40,155 shares held as ADSs at 1 January 2007.c Held as ADSs.d Held as ADSs, except for 94 that are held as ordinary shares.e Includes 34,962 shares held as ADSs.f Interest as at 1 February 2007 on appointment as a director. Includes 34,962 shares held as ADSs and 534,750 MTPPs granted prior to appointment as a director, 209,000of which lapsed on 6 February 2008.
g Includes 61,800 held as ADSs at resignation and 61,186 at 1 January 2007.
The above figures indicate and include all the beneficial and non- Executive directors are also deemed to have an interest in such
beneficial interests of each director of the company in shares of the shares of the company held from time to time by the BP Employee
company (or calculated equivalents) that have been disclosed to the Share Ownership Plan (No.2) to facilitate the operation of the
company under the Disclosure and Transparency Rules and Companies company’s option schemes.
Acts 1985 or 2006 (as the case may be) as at the applicable dates. No director has any interest in the preference shares or debentures of
the company or in the shares or loan stock of any subsidiary company.
–
BP ANNUAL REPORT AND ACCOUNTS 2007 81

Filename: U54368_doc6.3d Time: 14:49:50 Date: 25/02/08
Checksum: -1969491843
Additional information for shareholders
Share ownership
Directors and senior management
As at 19 February 2008, the following directors of BP p.l.c. held interests in BP ordinary shares of 25 cents each or their calculated equivalent as set
out below:
--------------------------------------------------------------------------------------------------------------------------------------------------------------------------------------------------------------------------------------------------------------------------------------------------------
Dr D C Allen 597,568 839,948a –
I C Conn 230,092 1,418,324a 266,904b
Dr B E Grote 1,193,137 1,543,820a –
Dr A B Hayward 482,521 1,934,830a –
A G Inglis 549,756 978,619a 266,904b
A Burgmans 10,000 – –
C B Carroll – –
Sir William Castell 50,000 – –
G David 9,000 – –
E B Davis, Jr 70,602 – –
D J Flint 15,000 – –
Dr D S Julius 15,000 – –
Sir Tom McKillop 20,000 – –
Dr W E Massey 49,722 – –
Sir Ian Prosser 16,301 – –
P D Sutherland 30,906 – –
As at 19 February 2008, the following directors of BP p.l.c. held options under the BP group share option schemes for ordinary shares or their
calculated equivalent as set out below:
--------------------------------------------------------------------------------------------------------------------------------------------------------------------------------------------------------------------------------------------------------------------------------------------------------
Dr D C Allen 794,950
I C Conn 206,390
Dr B E Grote 1,186,098
Dr A B Hayward 769,620
A G Inglis 415,300
a Performance shares awarded under the BP Executive Directors Incentive Plan. These represent the maximum possible vesting levels. The actual number of shares/ADSsthat vest will depend on the extent to which performance conditions have been satisfied over a three-year period.
b Restricted share award under the BP Executive Directors Incentive Plan. These will vest in equal tranches after three and five years, subject to their continued service andsatisfactory performance.
There are no directors or members of senior management who own more than 1% of the ordinary shares outstanding. At 19 February 2008, all
directors and senior management as a group held interests in 14,132,552 ordinary shares or their calculated equivalent and 4,323,092 options for
ordinary shares or their calculated equivalent under the BP group share options schemes.
Additional details regarding the options granted, including exercise price and expiry dates, are found in the directors’ remuneration report on page 70.
Employee share plans
The following table shows employee share options granted.
options thousands--------------------------------------------------------------------------------------------------------------------------------------------------------------------------------------------------------------------------------------------------------------------------------------------------------
2007 2006 2005--------------------------------------------------------------------------------------------------------------------------------------------------------------------------------------------------------------------------------------------------------------------------------------------------------
Employee share options granted during the yeara 6,004 53,977 54,482
a For the options outstanding at 31 December 2007, the exercise price ranges and weighted average remaining contractual lives are shown in Financial statements – Note 41on page 160.
BP offers most of its employees the opportunity to acquire a Savings and matching plans
shareholding in the company through savings-related and/or matching BP ShareSave Plan
share plan arrangements. BP also uses long-term performance plans (see This is a savings-related share option plan, under which employees save
Financial statements – Note 41 on page 160) and the granting of share on a monthly basis over a three- or five-year period towards the purchase
options as elements of remuneration for executive directors and senior of shares at a fixed price determined when the option is granted. This
employees. price is usually set at a 20% discount to the market price at the time of
Shares acquired through the company’s employee share plans rank grant. The option must be exercised within six months of maturity of the
pari passu with shares in issue and have no special rights, save as savings contract otherwise it lapses. The plan is run in the UK and
described below. For legal and practical reasons, the rules of these plans options are granted annually, usually in June. Participants leaving for a
set out the consequences of a change of control of the company, and qualifying reason will have six months in which to use their savings to
generally provide for options and conditional awards to vest on an exercise their options on a pro-rated basis.
accelerated basis.
–
82
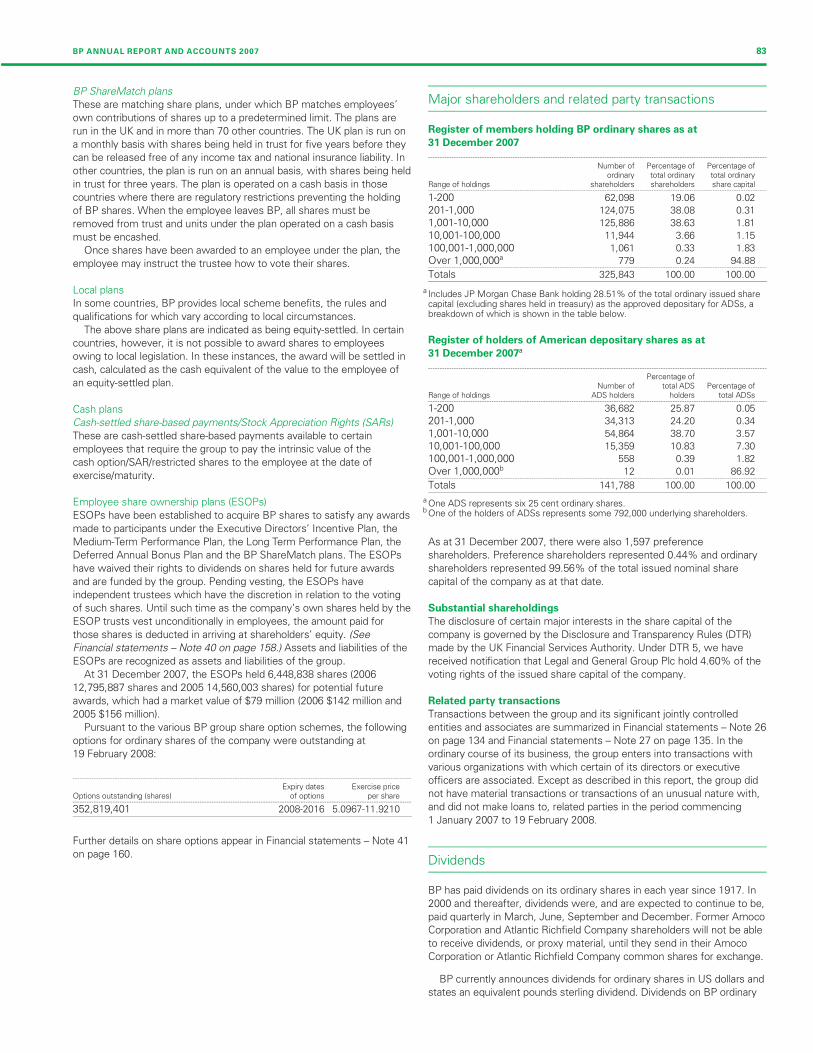
Filename: U54368_doc6.3d Time: 14:49:50 Date: 25/02/08
Checksum: 1644163124
BP ShareMatch plans
These are matching share plans, under which BP matches employees’
own contributions of shares up to a predetermined limit. The plans are
run in the UK and in more than 70 other countries. The UK plan is run on
a monthly basis with shares being held in trust for five years before they
can be released free of any income tax and national insurance liability. In
other countries, the plan is run on an annual basis, with shares being held
in trust for three years. The plan is operated on a cash basis in those
countries where there are regulatory restrictions preventing the holding
of BP shares. When the employee leaves BP, all shares must be
removed from trust and units under the plan operated on a cash basis
must be encashed.
Once shares have been awarded to an employee under the plan, the
employee may instruct the trustee how to vote their shares.
Local plans
In some countries, BP provides local scheme benefits, the rules and
qualifications for which vary according to local circumstances.
The above share plans are indicated as being equity-settled. In certain
countries, however, it is not possible to award shares to employees
owing to local legislation. In these instances, the award will be settled in
cash, calculated as the cash equivalent of the value to the employee of
an equity-settled plan.
Cash plans
Cash-settled share-based payments/Stock Appreciation Rights (SARs)
These are cash-settled share-based payments available to certain
employees that require the group to pay the intrinsic value of the
cash option/SAR/restricted shares to the employee at the date of
exercise/maturity.
Employee share ownership plans (ESOPs)
ESOPs have been established to acquire BP shares to satisfy any awards
made to participants under the Executive Directors’ Incentive Plan, the
Medium-Term Performance Plan, the Long Term Performance Plan, the
Deferred Annual Bonus Plan and the BP ShareMatch plans. The ESOPs
have waived their rights to dividends on shares held for future awards
and are funded by the group. Pending vesting, the ESOPs have
independent trustees which have the discretion in relation to the voting
of such shares. Until such time as the company’s own shares held by the
ESOP trusts vest unconditionally in employees, the amount paid for
those shares is deducted in arriving at shareholders’ equity. (See
Financial statements – Note 40 on page 158.) Assets and liabilities of the
ESOPs are recognized as assets and liabilities of the group.
At 31 December 2007, the ESOPs held 6,448,838 shares (2006
12,795,887 shares and 2005 14,560,003 shares) for potential future
awards, which had a market value of $79 million (2006 $142 million and
2005 $156 million).
Pursuant to the various BP group share option schemes, the following
options for ordinary shares of the company were outstanding at
19 February 2008:
------------------------------------------------------------------------------------------------------------------------------- -----------------
Expiry dates Exercise priceOptions outstanding (shares) of options per share------------------------------------------------------------------------------------------------------------------------------- -----------------
352,819,401 2008-2016 5.0967-11.9210
Further details on share options appear in Financial statements – Note 41
on page 160.
Major shareholders and related party transactions
Register of members holding BP ordinary shares as at
31 December 2007
------------------------------------------------------------------------------------------------------------------------------- -----------------
Number of Percentage of Percentage ofordinary total ordinary total ordinary
Range of holdings shareholders shareholders share capital------------------------------------------------------------------------------------------------------------------------------- -----------------
1-200 62,098 19.06 0.02
201-1,000 124,075 38.08 0.31
1,001-10,000 125,886 38.63 1.81
10,001-100,000 11,944 3.66 1.15
100,001-1,000,000 1,061 0.33 1.83
Over 1,000,000a 779 0.24 94.88------------------------------------------------------------------------------------------------------------------------------- -----------------
Totals 325,843 100.00 100.00
a Includes JP Morgan Chase Bank holding 28.51% of the total ordinary issued sharecapital (excluding shares held in treasury) as the approved depositary for ADSs, abreakdown of which is shown in the table below.
Register of holders of American depositary shares as at
31 December 2007a
------------------------------------------------------------------------------------------------------------------------------- -----------------
Percentage ofNumber of total ADS Percentage of
Range of holdings ADS holders holders total ADSs------------------------------------------------------------------------------------------------------------------------------- -----------------
1-200 36,682 25.87 0.05
201-1,000 34,313 24.20 0.34
1,001-10,000 54,864 38.70 3.57
10,001-100,000 15,359 10.83 7.30
100,001-1,000,000 558 0.39 1.82
Over 1,000,000b 12 0.01 86.92------------------------------------------------------------------------------------------------------------------------------- -----------------
Totals 141,788 100.00 100.00
a One ADS represents six 25 cent ordinary shares.b One of the holders of ADSs represents some 792,000 underlying shareholders.
As at 31 December 2007, there were also 1,597 preference
shareholders. Preference shareholders represented 0.44% and ordinary
shareholders represented 99.56% of the total issued nominal share
capital of the company as at that date.
Substantial shareholdings
The disclosure of certain major interests in the share capital of the
company is governed by the Disclosure and Transparency Rules (DTR)
made by the UK Financial Services Authority. Under DTR 5, we have
received notification that Legal and General Group Plc hold 4.60% of the
voting rights of the issued share capital of the company.
Related party transactions
Transactions between the group and its significant jointly controlled
entities and associates are summarized in Financial statements – Note 26
on page 134 and Financial statements – Note 27 on page 135. In the
ordinary course of its business, the group enters into transactions with
various organizations with which certain of its directors or executive
officers are associated. Except as described in this report, the group did
not have material transactions or transactions of an unusual nature with,
and did not make loans to, related parties in the period commencing
1 January 2007 to 19 February 2008.
Dividends
BP has paid dividends on its ordinary shares in each year since 1917. In
2000 and thereafter, dividends were, and are expected to continue to be,
paid quarterly in March, June, September and December. Former Amoco
Corporation and Atlantic Richfield Company shareholders will not be able
to receive dividends, or proxy material, until they send in their Amoco
Corporation or Atlantic Richfield Company common shares for exchange.
BP currently announces dividends for ordinary shares in US dollars and
states an equivalent pounds sterling dividend. Dividends on BP ordinary
BP ANNUAL REPORT AND ACCOUNTS 2007 83
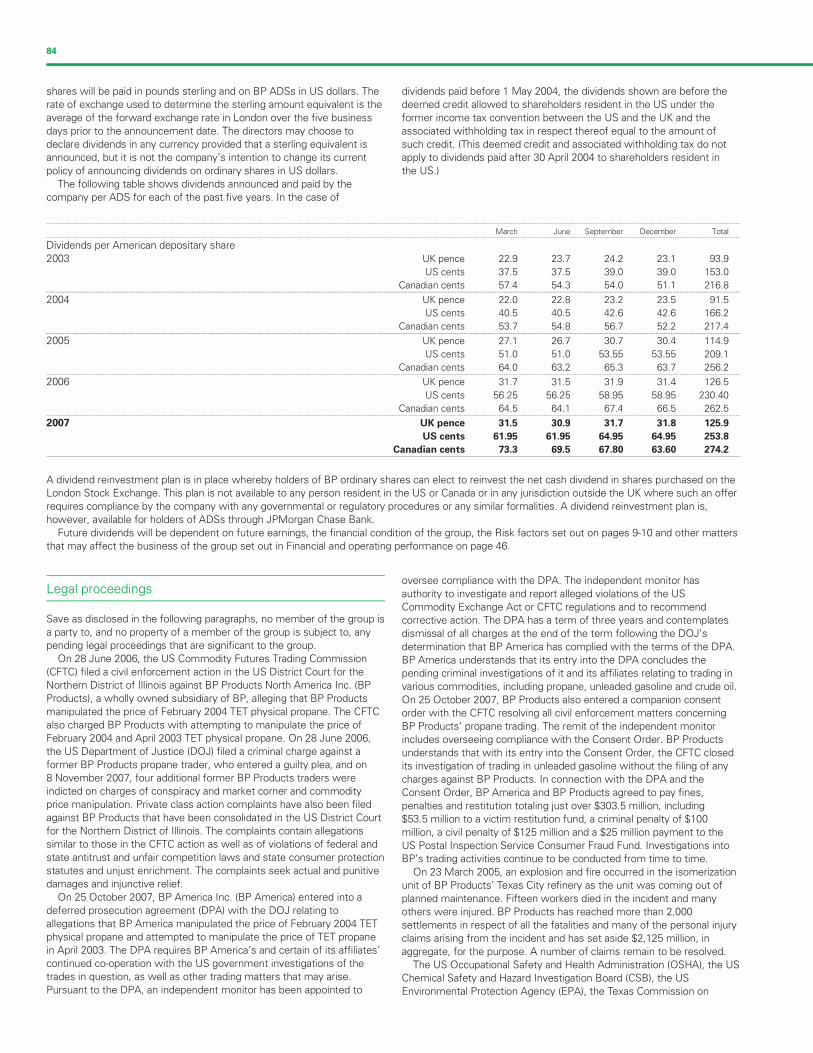
Filename: U54368_doc6.3d Time: 14:49:50 Date: 25/02/08
Checksum: -664321254
shares will be paid in pounds sterling and on BP ADSs in US dollars. The
rate of exchange used to determine the sterling amount equivalent is the
average of the forward exchange rate in London over the five business
days prior to the announcement date. The directors may choose to
declare dividends in any currency provided that a sterling equivalent is
announced, but it is not the company’s intention to change its current
policy of announcing dividends on ordinary shares in US dollars.
The following table shows dividends announced and paid by the
company per ADS for each of the past five years. In the case of
dividends paid before 1 May 2004, the dividends shown are before the
deemed credit allowed to shareholders resident in the US under the
former income tax convention between the US and the UK and the
associated withholding tax in respect thereof equal to the amount of
such credit. (This deemed credit and associated withholding tax do not
apply to dividends paid after 30 April 2004 to shareholders resident in
the US.)
--------------------------------------------------------------------------------------------------------------------------------------------------------------------------------------------------------------------------------------------------------------------------------------------------------
March June September December Total--------------------------------------------------------------------------------------------------------------------------------------------------------------------------------------------------------------------------------------------------------------------------------------------------------
Dividends per American depositary share
2003 UK pence 22.9 23.7 24.2 23.1 93.9
US cents 37.5 37.5 39.0 39.0 153.0
Canadian cents 57.4 54.3 54.0 51.1 216.8--------------------------------------------------------------------------------------------------------------------------------------------------------------------------------------------------------------------------------------------------------------------------------------------------------
2004 UK pence 22.0 22.8 23.2 23.5 91.5
US cents 40.5 40.5 42.6 42.6 166.2
Canadian cents 53.7 54.8 56.7 52.2 217.4--------------------------------------------------------------------------------------------------------------------------------------------------------------------------------------------------------------------------------------------------------------------------------------------------------
2005 UK pence 27.1 26.7 30.7 30.4 114.9
US cents 51.0 51.0 53.55 53.55 209.1
Canadian cents 64.0 63.2 65.3 63.7 256.2--------------------------------------------------------------------------------------------------------------------------------------------------------------------------------------------------------------------------------------------------------------------------------------------------------
2006 UK pence 31.7 31.5 31.9 31.4 126.5
US cents 56.25 56.25 58.95 58.95 230.40
Canadian cents 64.5 64.1 67.4 66.5 262.5--------------------------------------------------------------------------------------------------------------------------------------------------------------------------------------------------------------------------------------------------------------------------------------------------------
2007 UK pence 31.5 30.9 31.7 31.8 125.9
US cents 61.95 61.95 64.95 64.95 253.8
Canadian cents 73.3 69.5 67.80 63.60 274.2
A dividend reinvestment plan is in place whereby holders of BP ordinary shares can elect to reinvest the net cash dividend in shares purchased on the
London Stock Exchange. This plan is not available to any person resident in the US or Canada or in any jurisdiction outside the UK where such an offer
requires compliance by the company with any governmental or regulatory procedures or any similar formalities. A dividend reinvestment plan is,
however, available for holders of ADSs through JPMorgan Chase Bank.
Future dividends will be dependent on future earnings, the financial condition of the group, the Risk factors set out on pages 9-10 and other matters
that may affect the business of the group set out in Financial and operating performance on page 46.
Legal proceedings
Save as disclosed in the following paragraphs, no member of the group is
a party to, and no property of a member of the group is subject to, any
pending legal proceedings that are significant to the group.
On 28 June 2006, the US Commodity Futures Trading Commission
(CFTC) filed a civil enforcement action in the US District Court for the
Northern District of Illinois against BP Products North America Inc. (BP
Products), a wholly owned subsidiary of BP, alleging that BP Products
manipulated the price of February 2004 TET physical propane. The CFTC
also charged BP Products with attempting to manipulate the price of
February 2004 and April 2003 TET physical propane. On 28 June 2006,
the US Department of Justice (DOJ) filed a criminal charge against a
former BP Products propane trader, who entered a guilty plea, and on
8 November 2007, four additional former BP Products traders were
indicted on charges of conspiracy and market corner and commodity
price manipulation. Private class action complaints have also been filed
against BP Products that have been consolidated in the US District Court
for the Northern District of Illinois. The complaints contain allegations
similar to those in the CFTC action as well as of violations of federal and
state antitrust and unfair competition laws and state consumer protection
statutes and unjust enrichment. The complaints seek actual and punitive
damages and injunctive relief.
On 25 October 2007, BP America Inc. (BP America) entered into a
deferred prosecution agreement (DPA) with the DOJ relating to
allegations that BP America manipulated the price of February 2004 TET
physical propane and attempted to manipulate the price of TET propane
in April 2003. The DPA requires BP America’s and certain of its affiliates’
continued co-operation with the US government investigations of the
trades in question, as well as other trading matters that may arise.
Pursuant to the DPA, an independent monitor has been appointed to
oversee compliance with the DPA. The independent monitor has
authority to investigate and report alleged violations of the US
Commodity Exchange Act or CFTC regulations and to recommend
corrective action. The DPA has a term of three years and contemplates
dismissal of all charges at the end of the term following the DOJ’s
determination that BP America has complied with the terms of the DPA.
BP America understands that its entry into the DPA concludes the
pending criminal investigations of it and its affiliates relating to trading in
various commodities, including propane, unleaded gasoline and crude oil.
On 25 October 2007, BP Products also entered a companion consent
order with the CFTC resolving all civil enforcement matters concerning
BP Products’ propane trading. The remit of the independent monitor
includes overseeing compliance with the Consent Order. BP Products
understands that with its entry into the Consent Order, the CFTC closed
its investigation of trading in unleaded gasoline without the filing of any
charges against BP Products. In connection with the DPA and the
Consent Order, BP America and BP Products agreed to pay fines,
penalties and restitution totaling just over $303.5 million, including
$53.5 million to a victim restitution fund, a criminal penalty of $100
million, a civil penalty of $125 million and a $25 million payment to the
US Postal Inspection Service Consumer Fraud Fund. Investigations into
BP’s trading activities continue to be conducted from time to time.
On 23 March 2005, an explosion and fire occurred in the isomerization
unit of BP Products’ Texas City refinery as the unit was coming out of
planned maintenance. Fifteen workers died in the incident and many
others were injured. BP Products has reached more than 2,000
settlements in respect of all the fatalities and many of the personal injury
claims arising from the incident and has set aside $2,125 million, in
aggregate, for the purpose. A number of claims remain to be resolved.
The US Occupational Safety and Health Administration (OSHA), the US
Chemical Safety and Hazard Investigation Board (CSB), the US
Environmental Protection Agency (EPA), the Texas Commission on
84

Filename: U54368_doc6.3d Time: 14:49:50 Date: 25/02/08
Checksum: -2080903258
Environmental Quality (TCEQ) and the DOJ, among other agencies, have
conducted or are conducting investigations. At the conclusion of their
investigation, OSHA issued citations that BP Products agreed not to
contest. BP Products settled that matter with OSHA on 22 September
2005, paying a $21.4 million penalty and undertaking a number of
corrective actions designed to make the refinery safer.
In June 2006, BP Products and the TCEQ entered into an agreed order
resolving a number of alleged violations and, among other things,
authorizing the refinery to construct certain new flares needed to replace
blowdown stacks. In addition, BP Products agreed to pay a $336,556 civil
penalty.
At the recommendation of the CSB, BP appointed an independent
safety panel, the BP US Refineries Independent Safety Review Panel,
under the chairmanship of former US Secretary of State James A Baker,
III. See Report of the BP US Refineries Safety Review Panel on page 28
for a discussion of the panel’s report, which was published on 16 January
2007.
In March 2007, the CSB issued its final report, which contained
recommendations to the Texas City refinery and to the board of the
company. In May 2007, BP responded to the CSB’s recommendations.
BP and the CSB continue to discuss BP’s responses with the objective
of the CSB agreeing to close-out its recommendations.
On 25 October 2007, the DOJ announced that it had entered into a
criminal plea agreement with BP Products related to the March 2005
explosion and fire. On 4 February 2008, BP Products pleaded guilty in
federal court, pursuant to the plea agreement, to one felony violation of
the risk management planning regulations promulgated under the US
federal Clean Air Act. At the plea hearing the court advised that it would
take the matter under review and decide whether to accept or reject
the plea. If the court accepts the agreement, BP Products will pay a
$50 million criminal fine and serve three years’ probation. Compliance
with the 2005 OSHA settlement agreement and the 2006 TCEQ Agreed
Order are conditions of probation.
On 2 March 2006, a crude oil leak of approximately 4,800 barrels
occurred on a low-pressure transit line on the Alaskan North Slope in
the Western Operating Area of the Prudhoe Bay field operated by BP
Exploration (Alaska) Inc. (BPXA). The March 2006 leak was determined to
be the result of internal corrosion. On 6 August 2006, BPXA ordered a
phased shutdown of the Prudhoe Bay oil field following the discovery of
unexpectedly severe internal corrosion and a leak of 199 barrels of crude
oil from the oil transit line in the Eastern Operating Area of Prudhoe Bay.
Shortly after the March 2006 leak, the DOJ initiated an investigation of
the spill through a federal grand jury in Alaska. During the course of the
following 17 months, BPXA co-operated with the US government’s
investigation, including among other things, by producing millions of
pages of documents, encouraging its employees to co-operate with the
investigation and provide testimony to the grand jury, and by providing
the government’s investigators with samples from and sections of the
segment of the failed transit line.
On 25 October 2007, BPXA entered into an agreement with the DOJ
in which it agreed to plead guilty to one US Federal Water Pollution
Control Act misdemeanour violation relating to the March 2006 crude oil
leak. The plea agreement resolved all of the federal and State of Alaska
criminal culpability of BPXA associated with the March and August leaks
at Prudhoe Bay. On 29 November 2007, the US District Court for the
District of Alaska accepted the plea agreement, entered a misdemeanour
guilty plea against BPXA and sentenced BPXA to pay a combined
$20 million in criminal fines, restitution and community service payments
and serve three years’ of probation. BPXA has the right to petition the
court for termination of the probation term after one year if it meets
certain benchmarks relating to replacement of the transit lines, upgrades
to its leak detection system and improvements to its integrity
management programme. All criminal fines and other payments required
by the plea agreement and sentence were made by BPXA on the date of
sentencing following entry of the plea.
BPXA continues to co-operate with a parallel State of Alaska civil
investigation into the March and August 2006 spills, including three
separate subpoenas issued to BPXA by the Alaska Department of
Environmental Conservation. BPXA is also engaged in discussions with
the DOJ, the EPA and the US Department of Transport concerning civil
regulatory claims relating to the 2006 Prudhoe Bay oil transit line
incidents.
Shareholder derivative lawsuits have been filed in US federal and state
courts against the directors of the company and others, nominally the
company and certain US subsidiaries following the events relating to,
inter alia, Prudhoe Bay, Texas City and the trading cases, alleging breach
of fiduciary duty. These derivative lawsuits have been settled, subject to
court approval.
Approximately 200 lawsuits were filed in state and federal courts in
Alaska seeking compensatory and punitive damages arising out of the
Exxon Valdez oil spill in Prince William Sound in March 1989. Most of
those suits named Exxon (now ExxonMobil), Alyeska Pipeline Service
Company (Alyeska), which operates the oil terminal at Valdez, and the
other oil companies that own Alyeska. Alyeska initially responded to the
spill until the response was taken over by Exxon. BP owns a 47%
interest (reduced during 2001 from 50% by a sale of 3% to Phillips) in
Alyeska through a subsidiary of BP America Inc. and briefly indirectly
owned a further 20% interest in Alyeska following BP’s combination with
Atlantic Richfield. Alyeska and its owners have settled all the claims
against them under these lawsuits. Exxon has indicated that it may file
a claim for contribution against Alyeska for a portion of the costs and
damages that it has incurred. If any claims are asserted by Exxon that
affect Alyeska and its owners, BP will defend the claims vigorously.
Since 1987, Atlantic Richfield, a subsidiary of BP, has been named as
a co-defendant in numerous lawsuits brought in the US alleging injury to
persons and property caused by lead pigment in paint. The majority of
the lawsuits have been abandoned or dismissed against Atlantic
Richfield. Atlantic Richfield is named in these lawsuits as alleged
successor to International Smelting and Refining, which, along with a
predecessor company, manufactured lead pigment during the period
1920-1946. Plaintiffs include individuals and governmental entities.
Several of the lawsuits purport to be class actions. The lawsuits seek
various remedies including compensation to lead-poisoned children, cost
to find and remove lead paint from buildings, medical monitoring and
screening programmes, public warning and education of lead hazards,
reimbursement of government healthcare costs and special education for
lead-poisoned citizens and punitive damages. No lawsuit against Atlantic
Richfield has been settled nor has Atlantic Richfield been subject to a
final adverse judgment in any proceeding. The amounts claimed and, if
such suits were successful, the costs of implementing the remedies
sought in the various cases could be substantial. While it is not possible
to predict the outcome of these legal actions, Atlantic Richfield believes
that it has valid defences and it intends to defend such actions vigorously
and that the incurrence of liability is remote. Consequently, BP believes
that the impact of these lawsuits on the group’s results of operations,
financial position or liquidity will not be material.
For certain information regarding environmental proceedings, see
Environmental protection – US regional review on page 43.
The offer and listing
Markets and market prices
The primary market for BP’s ordinary shares is the London Stock
Exchange (LSE). BP’s ordinary shares are a constituent element of the
Financial Times Stock Exchange 100 Index. BP’s ordinary shares are also
traded on stock exchanges in France, Germany, Japan and Switzerland.
Trading of BP’s shares on the LSE is primarily through the use of the
Stock Exchange Electronic Trading Service (SETS), introduced in 1997 for
the largest companies in terms of market capitalization whose primary
listing is the LSE. Under SETS, buy and sell orders at specific prices may
be sent to the exchange electronically by any firm that is a member of
the LSE, on behalf of a client or on behalf of itself acting as a principal.
The orders are then anonymously displayed in the order book. When
there is a match on a buy and a sell order, the trade is executed and
automatically reported to the LSE. Trading is continuous from 8.00 a.m.
to 4.30 p.m. UK time but, in the event of a 20% movement in the share
price either way, the LSE may impose a temporary halt in the trading of
BP ANNUAL REPORT AND ACCOUNTS 2007 85
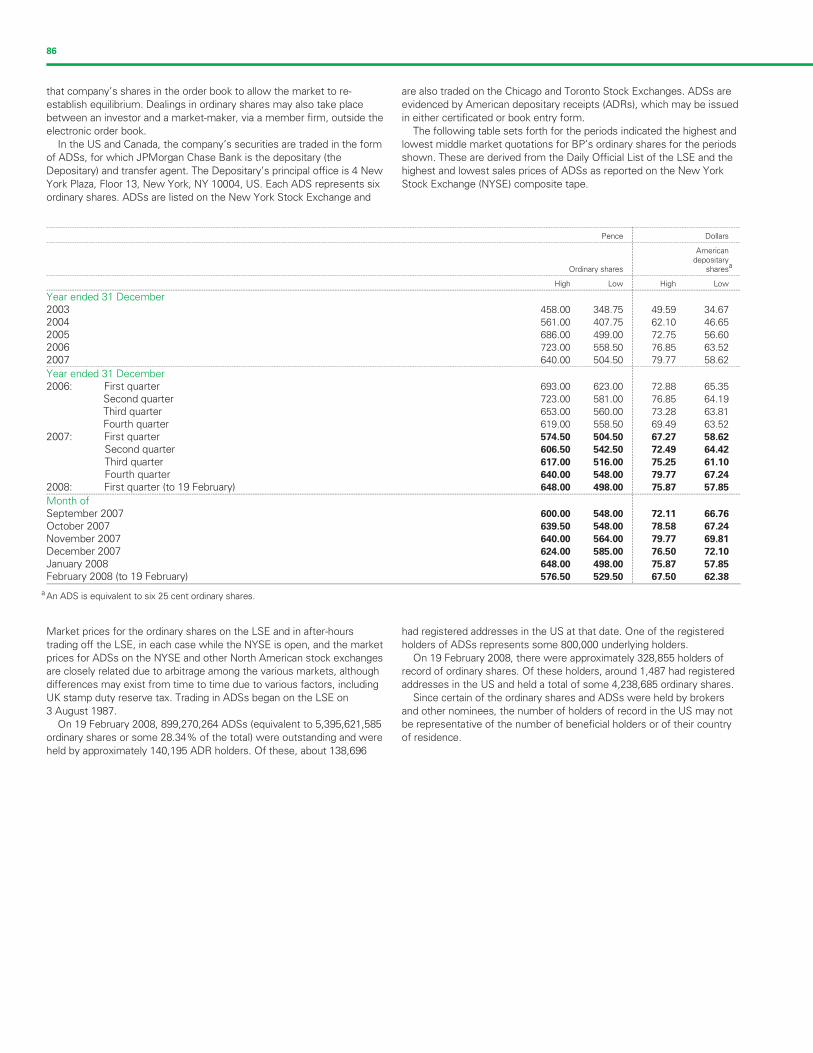
Filename: U54368_doc6.3d Time: 14:49:51 Date: 25/02/08Checksum: -1665555049
that company’s shares in the order book to allow the market to re- are also traded on the Chicago and Toronto Stock Exchanges. ADSs are
establish equilibrium. Dealings in ordinary shares may also take place evidenced by American depositary receipts (ADRs), which may be issued
between an investor and a market-maker, via a member firm, outside the in either certificated or book entry form.
electronic order book. The following table sets forth for the periods indicated the highest and
In the US and Canada, the company’s securities are traded in the form lowest middle market quotations for BP’s ordinary shares for the periods
of ADSs, for which JPMorgan Chase Bank is the depositary (the shown. These are derived from the Daily Official List of the LSE and the
Depositary) and transfer agent. The Depositary’s principal office is 4 New highest and lowest sales prices of ADSs as reported on the New York
York Plaza, Floor 13, New York, NY 10004, US. Each ADS represents six Stock Exchange (NYSE) composite tape.
ordinary shares. ADSs are listed on the New York Stock Exchange and
--------------------------------------------------------------------------------------------------------------------------------------------------------------------------------------------------------------------------------------------------------------------------------------------------------
Pence Dollars--------------------------------------------------------------------------------------------------------------------------------------------------------------------------------------------------------------------------------------------------------------------------------------------------------
Americandepositary
aOrdinary shares shares
--------------------------------------------------------------------------------------------------------------------------------------------------------------------------------------------------------------------------------------------------------------------------------------------------------
High Low High Low--------------------------------------------------------------------------------------------------------------------------------------------------------------------------------------------------------------------------------------------------------------------------------------------------------
Year ended 31 December2003 458.00 348.75 49.59 34.67
2004 561.00 407.75 62.10 46.65
2005 686.00 499.00 72.75 56.60
2006 723.00 558.50 76.85 63.52
2007 640.00 504.50 79.77 58.62--------------------------------------------------------------------------------------------------------------------------------------------------------------------------------------------------------------------------------------------------------------------------------------------------------
Year ended 31 December2006: First quarter 693.00 623.00 72.88 65.35
Second quarter 723.00 581.00 76.85 64.19
Third quarter 653.00 560.00 73.28 63.81
Fourth quarter 619.00 558.50 69.49 63.52
2007: First quarter 574.50 504.50 67.27 58.62
Second quarter 606.50 542.50 72.49 64.42
Third quarter 617.00 516.00 75.25 61.10
Fourth quarter 640.00 548.00 79.77 67.24
2008: First quarter (to 19 February) 648.00 498.00 75.87 57.85--------------------------------------------------------------------------------------------------------------------------------------------------------------------------------------------------------------------------------------------------------------------------------------------------------
Month ofSeptember 2007 600.00 548.00 72.11 66.76
October 2007 639.50 548.00 78.58 67.24
November 2007 640.00 564.00 79.77 69.81
December 2007 624.00 585.00 76.50 72.10
January 2008 648.00 498.00 75.87 57.85
February 2008 (to 19 February) 576.50 529.50 67.50 62.38
------------------------------------------------------------------------------------------------------------------------------------
a An ADS is equivalent to six 25 cent ordinary shares.
Market prices for the ordinary shares on the LSE and in after-hours had registered addresses in the US at that date. One of the registered
trading off the LSE, in each case while the NYSE is open, and the market holders of ADSs represents some 800,000 underlying holders.
prices for ADSs on the NYSE and other North American stock exchanges On 19 February 2008, there were approximately 328,855 holders of
are closely related due to arbitrage among the various markets, although record of ordinary shares. Of these holders, around 1,487 had registered
differences may exist from time to time due to various factors, including addresses in the US and held a total of some 4,238,685 ordinary shares.
UK stamp duty reserve tax. Trading in ADSs began on the LSE on Since certain of the ordinary shares and ADSs were held by brokers
3 August 1987. and other nominees, the number of holders of record in the US may not
On 19 February 2008, 899,270,264 ADSs (equivalent to 5,395,621,585 be representative of the number of beneficial holders or of their country
ordinary shares or some 28.34% of the total) were outstanding and were of residence.
held by approximately 140,195 ADR holders. Of these, about 138,696
86

Filename: U54368_doc6.3d Time: 14:49:51 Date: 25/02/08
Checksum: 1999336172
Memorandum and Articles of Association
The following summarizes certain provisions of the company’s
Memorandum and Articles of Association and applicable English law.
This summary is qualified in its entirety by reference to the UK
Companies Act and the company’s Memorandum and Articles of
Association. Information on where investors can obtain copies of the
Memorandum and Articles of Association is described under the heading
‘Documents on display’ on page 90.
On 24 April 2003, the shareholders of BP voted at the AGM to adopt
new Articles of Association to consolidate amendments that had been
necessary to implement legislative changes since the previous Articles of
Association were adopted in 1983.
At the AGM held on 15 April 2004, shareholders approved an
amendment to the Articles of Association such that, at each AGM held
after 31 December 2004, all directors shall retire from office and may
offer themselves for re-election. There have been no further
amendments to the Articles of Association.
At the upcoming annual general meeting of the company, it will be
proposed that the company adopts new articles of association, largely to
take account of changes in UK company law brought about by the
Companies Act 2006.
Objects and purposes
BP is incorporated under the name BP p.l.c. and is registered in
England and Wales with registered number 102498. Clause 4 of
BP’s Memorandum of Association provides that its objects include the
acquisition of petroleum-bearing lands; the carrying on of refining and
dealing businesses in the petroleum, manufacturing, metallurgical or
chemicals businesses; the purchase and operation of ships and all
other vehicles and other conveyances; and the carrying on of any other
businesses calculated to benefit BP. The memorandum grants BP a
range of corporate capabilities to effect these objects.
Directors
The business and affairs of BP shall be managed by the directors.
The Articles of Association place a general prohibition on a director
voting in respect of any contract or arrangement in which he has a
material interest other than by virtue of his interest in shares in the
company. However, in the absence of some other material interest not
indicated below, a director is entitled to vote and to be counted in a
quorum for the purpose of any vote relating to a resolution concerning
the following matters:
– The giving of security or indemnity with respect to any money lent or
obligation taken by the director at the request or benefit of the
company.
– Any proposal in which he is interested concerning the underwriting of
company securities or debentures.
– Any proposal concerning any other company in which he is interested,
directly or indirectly (whether as an officer or shareholder or
otherwise) provided that he and persons connected with him are not
the holder or holders of 1% or more of the voting interest in the
shares of such company.
– Proposals concerning the modification of certain retirement benefits
schemes under which he may benefit and that have been approved by
either the UK Board of Inland Revenue or by the shareholders.
– Any proposal concerning the purchase or maintenance of any
insurance policy under which he may benefit.
The UK Companies Act requires a director of a company who is in any
way interested in a contract or proposed contract with the company to
declare the nature of his interest at a meeting of the directors of the
company. The definition of ‘interest’ now includes the interests of
spouses, children, companies and trusts. The directors may exercise all
the powers of the company to borrow money, except that the amount
remaining undischarged of all moneys borrowed by the company shall
not, without approval of the shareholders, exceed the amount paid up on
the share capital plus the aggregate of the amount of the capital and
revenue reserves of the company. Variation of the borrowing power of
the board may only be effected by amending the Articles of Association.
Remuneration of non-executive directors shall be determined in the
aggregate by resolution of the shareholders. Remuneration of executive
directors is determined by the remuneration committee. This committee
is made up of non-executive directors only. Any director attaining the age
of 70 shall retire at the next AGM. There is no requirement of share
ownership for a director’s qualification.
Dividend rights; other rights to share in company profits;
capital calls
If recommended by the directors of BP, BP shareholders may, by
resolution, declare dividends but no such dividend may be declared in
excess of the amount recommended by the directors. The directors may
also pay interim dividends without obtaining shareholder approval. No
dividend may be paid other than out of profits available for distribution, as
determined under IFRS and the UK Companies Act. Dividends on
ordinary shares are payable only after payment of dividends on BP
preference shares. Any dividend unclaimed after a period of 12 years
from the date of declaration of such dividend shall be forfeited and
reverts to BP.
The directors have the power to declare and pay dividends in any
currency provided that a sterling equivalent is announced. It is not the
company’s intention to change its current policy of paying dividends in
US dollars.
Apart from shareholders’ rights to share in BP’s profits by dividend (if
any is declared), the Articles of Association provide that the directors
may set aside:
– A special reserve fund out of the balance of profits each year to make
up any deficit of cumulative dividend on the BP preference shares.
– A general reserve out of the balance of profits each year, which shall
be applicable for any purpose to which the profits of the company
may properly be applied. This may include capitalization of such sum,
pursuant to an ordinary shareholders’ resolution, and distribution to
shareholders as if it were distributed by way of a dividend on the
ordinary shares or in paying up in full unissued ordinary shares for
allotment and distribution as bonus shares.
Any such sums so deposited may be distributed in accordance with the
manner of distribution of dividends as described above.
Holders of shares are not subject to calls on capital by the company,
provided that the amounts required to be paid on issue have been paid
off. All shares are fully paid.
Voting rights
The Articles of Association of the company provide that voting on
resolutions at a shareholders’ meeting will be decided on a poll other
than resolutions of a procedural nature, which may be decided on a show
of hands. If voting is on a poll, every shareholder who is present in
person or by proxy has one vote for every ordinary share held and two
votes for every £5 in nominal amount of BP preference shares held. If
voting is on a show of hands, each shareholder who is present at the
meeting in person or whose duly appointed proxy is present in person
will have one vote, regardless of the number of shares held, unless a poll
is requested. Shareholders do not have cumulative voting rights.
Holders of record of ordinary shares may appoint a proxy, including a
beneficial owner of those shares, to attend, speak and vote on their
behalf at any shareholders’ meeting.
Record holders of BP ADSs are also entitled to attend, speak and vote
at any shareholders’ meeting of BP by the appointment by the approved
depositary, JPMorgan Chase Bank, of them as proxies in respect of the
ordinary shares represented by their ADSs. Each such proxy may also
appoint a proxy. Alternatively, holders of BP ADSs are entitled to vote by
supplying their voting instructions to the depositary, who will vote the
ordinary shares represented by their ADSs in accordance with their
instructions.
Proxies may be delivered electronically.
Matters are transacted at shareholders’ meetings by the proposing
and passing of resolutions, of which there are three types: ordinary,
special or extraordinary.
BP ANNUAL REPORT AND ACCOUNTS 2007 87
Filename: U54368_doc6.3d Time: 14:49:51 Date: 25/02/08
Checksum: -946405120
An ordinary resolution requires the affirmative vote of a majority of the
votes of those persons voting at a meeting at which there is a quorum.
Special and extraordinary resolutions require the affirmative vote of not
less than three-fourths of the persons voting at a meeting at which there
is a quorum. Any AGM at which it is proposed to put a special or ordinary
resolution requires 21 days’ notice. An extraordinary resolution put to the
AGM requires no notice period. Any extraordinary general meeting at
which it is proposed to put a special resolution requires 21 days’ notice;
otherwise, the notice period for an extraordinary general meeting is
14 days.
Liquidation rights; redemption provisions
In the event of a liquidation of BP, after payment of all liabilities and
applicable deductions under UK laws and subject to the payment of
secured creditors, the holders of BP preference shares would be entitled
to the sum of (i) the capital paid up on such shares plus, (ii) accrued and
unpaid dividends and (iii) a premium equal to the higher of (a) 10% of the
capital paid up on the BP preference shares and (b) the excess of the
average market price over par value of such shares on the LSE during the
previous six months. The remaining assets (if any) would be divided pro
rata among the holders of ordinary shares.
Without prejudice to any special rights previously conferred on the
holders of any class of shares, BP may issue any share with such
preferred, deferred or other special rights, or subject to such restrictions
as the shareholders by resolution determine (or, in the absence of any
such resolutions, by determination of the directors), and may issue
shares that are to be or may be redeemed.
Variation of rights
The rights attached to any class of shares may be varied with the
consent in writing of holders of 75% of the shares of that class or on the
adoption of an extraordinary resolution passed at a separate meeting of
the holders of the shares of that class. At every such separate meeting,
all of the provisions of the Articles of Association relating to proceedings
at a general meeting apply, except that the quorum with respect to a
meeting to change the rights attached to the preference shares is 10%
or more of the shares of that class, and the quorum to change the rights
attached to the ordinary shares is one third or more of the shares of that
class.
Shareholders’ meetings and notices
Shareholders must provide BP with a postal or electronic address in the
UK in order to be entitled to receive notice of shareholders’ meetings. In
certain circumstances, BP may give notices to shareholders by
advertisement in UK newspapers. Holders of BP ADSs are entitled to
receive notices under the terms of the deposit agreement relating to BP
ADSs. The substance and timing of notices is described above under the
heading Voting Rights.
Under the Articles of Association, the AGM of shareholders will be
held within 15 months after the preceding AGM. All other general
meetings of shareholders shall be called extraordinary general meetings
and all general meetings shall be held at a time and place determined by
the directors within the UK. If any shareholders’ meeting is adjourned for
lack of quorum, notice of the time and place of the meeting may be
given in any lawful manner, including electronically. Powers exist for
action to be taken either before or at the meeting by authorized officers
to ensure its orderly conduct and safety of those attending.
Limitations on voting and shareholding
There are no limitations imposed by English law or the company’s
Memorandum or Articles of Association on the right of non-residents or
foreign persons to hold or vote the company’s ordinary shares or ADSs,
other than limitations that would generally apply to all of the
shareholders.
Disclosure of interests in shares
The UK Companies Act permits a public company, on written notice, to
require any person whom the company believes to be or, at any time
during the previous three years prior to the issue of the notice, to have
been interested in its voting shares, to disclose certain information with
respect to those interests. Failure to supply the information required may
lead to disenfranchisement of the relevant shares and a prohibition on
their transfer and receipt of dividends and other payments in respect of
those shares. In this context the term ‘interest’ is widely defined and will
generally include an interest of any kind whatsoever in voting shares,
including any interest of a holder of BP ADSs.
Exchange controls
There are currently no UK foreign exchange controls or restrictions on
remittances of dividends on the ordinary shares or on the conduct of the
company’s operations.
There are no limitations, either under the laws of the UK or under the
company’s Articles of Association, restricting the right of non-resident or
foreign owners to hold or vote BP ordinary or preference shares in the
company.
Taxation
This section describes the material US federal income tax and UK
taxation consequences of owning ordinary shares or ADSs to a US holder
who holds the ordinary shares or ADSs as capital assets for tax
purposes. It does not apply, however, to members of special classes of
holders subject to special rules and holders that, directly or indirectly,
hold 10% or more of the company’s voting stock.
A US holder is any beneficial owner of ordinary shares or ADSs that is
for US federal income tax purposes (i) a citizen or resident of the US, (ii) a
US domestic corporation, (iii) an estate whose income is subject to US
federal income taxation regardless of its source, or (iv) a trust if a US
court can exercise primary supervision over the trust’s administration and
one or more US persons are authorized to control all substantial
decisions of the trust.
This section is based on the Internal Revenue Code of 1986, as
amended, its legislative history, existing and proposed regulations
thereunder, published rulings and court decisions, and the taxation laws
of the UK, all as currently in effect, as well as the income tax convention
between the US and the UK that entered into force on 31 March 2003
(the Treaty). These laws are subject to change, possibly on a retroactive
basis. This section is further based in part on the representations of the
Depositary and assumes that each obligation in the Deposit Agreement
and any related agreement will be performed in accordance with its
terms.
For purposes of the Treaty and the estate and gift tax Convention (the
‘Estate Tax Convention’), and for US federal income tax and UK taxation
purposes, a holder of ADRs evidencing ADSs will be treated as the
owner of the company’s ordinary shares represented by those ADRs.
Exchanges of ordinary shares for ADRs and ADRs for ordinary shares
generally will not be subject to US federal income tax or to UK taxation
other than stamp duty or stamp duty reserve tax, as described below.
Investors should consult their own tax adviser regarding the US
federal, state and local, the UK and other tax consequences of owning
and disposing of ordinary shares and ADSs in their particular
circumstances, and in particular whether they are eligible for the benefits
of the Treaty.
Taxation of dividends
UK taxation
Under current UK taxation law, no withholding tax will be deducted from
dividends paid by the company, including dividends paid to US holders. A
shareholder that is a company resident for tax purposes in the UK
generally will not be taxable on a dividend it receives from the company.
A shareholder who is an individual resident for tax purposes in the UK is
entitled to a tax credit on cash dividends paid on ordinary shares or ADSs
of the company equal to one-ninth of the cash dividend.
88
Filename: U54368_doc6.3d Time: 14:49:51 Date: 25/02/08
Checksum: 4194838
US federal income taxation
A US holder is subject to US federal income taxation on the gross
amount of any dividend paid by the company out of its current or
accumulated earnings and profits (as determined for US federal income
tax purposes). Dividends paid to a non-corporate US holder in taxable
years beginning before 1 January 2011 that constitute qualified dividend
income will be taxable to the holder at a maximum tax rate of 15%,
provided that the holder has a holding period in the ordinary shares or
ADSs of more than 60 days during the 121-day period beginning 60 days
before the ex-dividend date and meets other holding period
requirements. Dividends paid by the company with respect to the shares
or ADSs will generally be qualified dividend income.
As noted above in UK taxation, a US holder will not be subject to UK
withholding tax. A US holder will include in gross income for US federal
income tax purposes the amount of the dividend actually received from
the company and the receipt of a dividend will not entitle the US holder
to a foreign tax credit.
For US federal income tax purposes, a dividend must be included in
income when the US holder, in the case of ordinary shares, or the
Depositary, in the case of ADSs, actually or constructively receives the
dividend, and will not be eligible for the dividends-received deduction
generally allowed to US corporations in respect of dividends received
from other US corporations. Dividends will be income from sources
outside the US, and generally will be ‘passive category income’ or, in the
case of certain US holders, ‘general category income,’ each of which is
treated separately for purposes of computing the allowable foreign tax
credit.
The amount of the dividend distribution on the ordinary shares or
ADSs that is paid in pounds sterling will be the US dollar value of the
pounds sterling payments made, determined at the spot pounds sterling/
US dollar rate on the date the dividend distribution is includible in income,
regardless of whether the payment is in fact converted into US dollars.
Generally, any gain or loss resulting from currency exchange fluctuations
during the period from the date the pounds sterling dividend payment is
includible in income to the date the payment is converted into US dollars
will be treated as ordinary income or loss and will not be eligible for the
15% tax rate on qualified dividend income. The gain or loss generally will
be income or loss from sources within the US for foreign tax credit
limitation purposes.
Distributions in excess of the company’s earnings and profits, as
determined for US federal income tax purposes, will be treated as a
return of capital to the extent of the US holder’s basis in the ordinary
shares or ADSs and thereafter as capital gain, subject to taxation as
described in Taxation of capital gains – US federal income taxation.
Taxation of capital gains
UK taxation
A US holder may be liable for both UK and US tax in respect of a gain on
the disposal of ordinary shares or ADSs if the US holder is (i) a citizen of
the US resident or ordinarily resident in the UK, (ii) a US domestic
corporation resident in the UK by reason of its business being managed
or controlled in the UK or (iii) a citizen of the US or a corporation that
carries on a trade or profession or vocation in the UK through a branch or
agency or, in respect of corporations for accounting periods beginning on
or after 1 January 2003, through a permanent establishment, and that
have used, held, or acquired the ordinary shares or ADSs for the
purposes of such trade, profession or vocation of such branch, agency or
permanent establishment. However, such persons may be entitled to a
tax credit against their US federal income tax liability for the amount of
UK capital gains tax or UK corporation tax on chargeable gains (as the
case may be) that is paid in respect of such gain.
Under the Treaty, capital gains on dispositions of ordinary shares or
ADSs generally will be subject to tax only in the jurisdiction of residence
of the relevant holder as determined under both the laws of the UK and
the US and as required by the terms of the Treaty.
Under the Treaty, individuals who are residents of either the UK or the
US and who have been residents of the other jurisdiction (the US or the
UK, as the case may be) at any time during the six years immediately
preceding the relevant disposal of ordinary shares or ADSs may be
subject to tax with respect to capital gains arising from a disposition of
ordinary shares or ADSs of the company not only in the jurisdiction of
which the holder is resident at the time of the disposition but also in the
other jurisdiction.
US federal income taxation
A US holder that sells or otherwise disposes of ordinary shares or ADSs
will recognize a capital gain or loss for US federal income tax purposes
equal to the difference between the US dollar value of the amount
realized and the holder’s tax basis, determined in US dollars, in the
ordinary shares or ADSs. Capital gain of a non-corporate US holder that is
recognized in taxable years beginning before 1 January 2011 is generally
taxed at a maximum rate of 15% if the holder’s holding period for such
ordinary shares or ADSs exceeds one year. The gain or loss will generally
be income or loss from sources within the US for foreign tax credit
limitation purposes. The deductibility of capital losses is subject to
limitations.
We do not believe that ordinary shares or ADSs will be treated as
stock of a passive foreign investment company, or PFIC, for US federal
income tax purposes, but this conclusion is a factual determination that is
made annually and thus is subject to change. If we are treated as a PFIC,
unless a US holder elects to be taxed annually on a mark-to-mark basis
with respect to ordinary shares or ADSs, gain realized on the sale or
other disposition of ordinary shares or ADSs would in general not be
treated as capital gain. Instead a US holder would be treated as if he or
she had realized such gain and certain ‘excess distribution’ ratably over
the holding period for ordinary shares or ADSs and would be taxed at the
highest tax rate in effect for each such year to which the gain was
allocated, in addition to which an interest charge in respect of the tax
attributable to each such year would apply.
Additional tax considerations
UK inheritance tax
The Estate Tax Convention applies to inheritance tax. ADSs held by an
individual who is domiciled for the purposes of the Estate Tax
Convention in the US and is not for the purposes of the Estate Tax
Convention a national of the UK will not be subject to UK inheritance tax
on the individual’s death or on transfer during the individual’s lifetime
unless, among other things, the ADSs are part of the business property
of a permanent establishment situated in the UK used for the
performance of independent personal services. In the exceptional case
where ADSs are subject both to inheritance tax and to US federal gift or
estate tax, the Estate Tax Convention generally provides for tax payable
in the US to be credited against tax payable in the UK or for tax paid in
the UK to be credited against tax payable in the US, based on priority
rules set forth in the Estate Tax Convention.
UK stamp duty and stamp duty reserve tax
The statements below relate to what is understood to be the current
practice of the UK Inland Revenue under existing law.
Provided that the instrument of transfer is not executed in the UK and
remains at all times outside the UK and the transfer does not relate to
any matter or thing done or to be done in the UK, no UK stamp duty is
payable on the acquisition or transfer of ADSs. Neither will an agreement
to transfer ADSs in the form of ADRs give rise to a liability to stamp duty
reserve tax.
Purchases of ordinary shares, as opposed to ADSs, through the
CREST system of paperless share transfers will be subject to stamp duty
reserve tax at 0.5%. The charge will arise as soon as there is an
agreement for the transfer of the shares (or, in the case of a conditional
agreement, when the condition is fulfilled). The stamp duty reserve tax
will apply to agreements to transfer ordinary shares even if the
agreement is made outside the UK between two non-residents.
Purchases of ordinary shares outside the CREST system are subject
either to stamp duty at a rate of 50 pence per £100 (or part), or stamp
duty reserve tax at 0.5%. Stamp duty and stamp duty reserve tax are
generally the liability of the purchaser. A subsequent transfer of ordinary
shares to the Depositary’s nominee will give rise to further stamp duty at
BP ANNUAL REPORT AND ACCOUNTS 2007 89
Filename: U54368_doc6.3d Time: 14:49:51 Date: 25/02/08
Checksum: -704674121
the rate of £1.50 per £100 (or part) or stamp duty reserve tax at the rate
of 1.5% of the value of the ordinary shares at the time of the transfer.
A transfer of the underlying ordinary shares to an ADR holder on
cancellation of the ADSs without transfer of beneficial ownership will
give rise to UK stamp duty at the rate of £5 per transfer.
An ADR holder electing to receive ADSs instead of a cash dividend will
be responsible for the stamp duty reserve tax due on issue of shares to
the Depositary’s nominee and calculated at the rate of 1.5% on the issue
price of the shares. Current UK Inland Revenue practice is to calculate
the issue price by reference to the total cash receipt to which a US
holder would have been entitled had the election to receive ADSs instead
of a cash dividend not been made. ADR holders electing to receive ADSs
instead of the cash dividend authorize the Depositary to sell sufficient
shares to cover this liability.
Documents on display
BP’s Annual Report and Accounts is also available online at
www.bp.com. Shareholders may obtain a hard copy of BP’s complete
audited financial statements, free of charge, by contacting BP
Distribution Services at +44 (0)870 241 3269 or through an e-mail
request addressed to [email protected], or BP’s US
Shareholder Services office in Warrenville, Illinois at +1 800 638 5672 or
through an e-mail request addressed to [email protected].
The company is subject to the information requirements of the US
Securities Exchange Act of 1934 applicable to foreign private issuers. In
accordance with these requirements, the company files its Annual
Report on Form 20-F and other related documents with the SEC. It is
possible to read and copy documents that have been filed with the SEC
at the SEC’s public reference room located at 100 F Street NE,
Washington, DC 20549, US. You may also call the SEC at
+1 800-SEC-0330 or log on to www.sec.gov. In addition, BP’s SEC filings
are available to the public at the SEC’s web site at www.sec.gov. BP
discloses on its website at www.bp.com/NYSEcorporategovernancerules
significant ways (if any) in which its corporate governance practices differ
from those mandated for US companies under NYSE listing standards.
Details of some of BP’s other publications are listed on the inside back
cover.
90
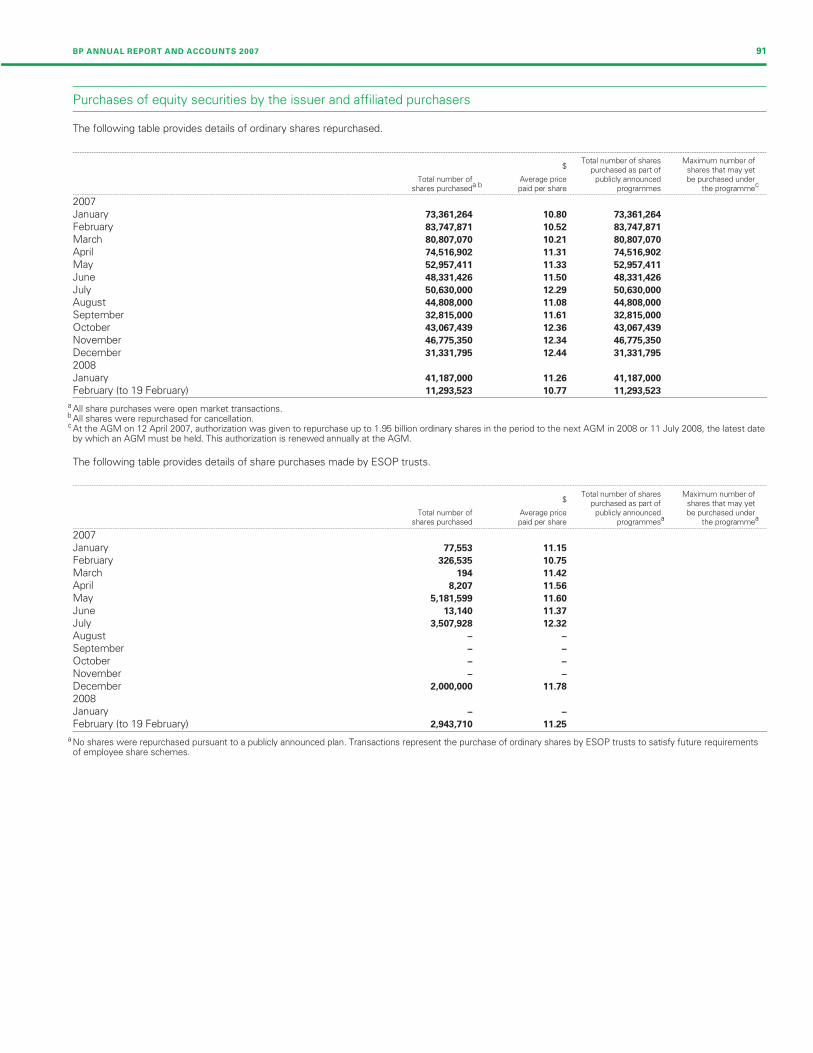
Filename: U54368_doc6.3d Time: 14:49:51 Date: 25/02/08
Checksum: 357092327
Purchases of equity securities by the issuer and affiliated purchasers
The following table provides details of ordinary shares repurchased.
--------------------------------------------------------------------------------------------------------------------------------------------------------------------------------------------------------------------------------------------------------------------------------------------------------
Total number of shares Maximum number of$ purchased as part of shares that may yet
Total number of Average price publicly announced be purchased undera b cshares purchased paid per share programmes the programme
--------------------------------------------------------------------------------------------------------------------------------------------------------------------------------------------------------------------------------------------------------------------------------------------------------
2007January 73,361,264 10.80 73,361,264
February 83,747,871 10.52 83,747,871
March 80,807,070 10.21 80,807,070
April 74,516,902 11.31 74,516,902
May 52,957,411 11.33 52,957,411
June 48,331,426 11.50 48,331,426
July 50,630,000 12.29 50,630,000
August 44,808,000 11.08 44,808,000
September 32,815,000 11.61 32,815,000
October 43,067,439 12.36 43,067,439
November 46,775,350 12.34 46,775,350
December 31,331,795 12.44 31,331,795
2008January 41,187,000 11.26 41,187,000
February (to 19 February) 11,293,523 10.77 11,293,523
a All share purchases were open market transactions.b All shares were repurchased for cancellation.c At the AGM on 12 April 2007, authorization was given to repurchase up to 1.95 billion ordinary shares in the period to the next AGM in 2008 or 11 July 2008, the latest dateby which an AGM must be held. This authorization is renewed annually at the AGM.
The following table provides details of share purchases made by ESOP trusts.
--------------------------------------------------------------------------------------------------------------------------------------------------------------------------------------------------------------------------------------------------------------------------------------------------------
Total number of shares Maximum number of$ purchased as part of shares that may yet
Total number of Average price publicly announced be purchased undera ashares purchased paid per share programmes the programme
--------------------------------------------------------------------------------------------------------------------------------------------------------------------------------------------------------------------------------------------------------------------------------------------------------
2007January 77,553 11.15
February 326,535 10.75
March 194 11.42
April 8,207 11.56
May 5,181,599 11.60
June 13,140 11.37
July 3,507,928 12.32
August – –
September – –
October – –
November – –
December 2,000,000 11.78
2008January – –
February (to 19 February) 2,943,710 11.25
a No shares were repurchased pursuant to a publicly announced plan. Transactions represent the purchase of ordinary shares by ESOP trusts to satisfy future requirementsof employee share schemes.
BP ANNUAL REPORT AND ACCOUNTS 2007 91

Filename: U54368_doc6.3d Time: 14:49:51 Date: 25/02/08
Checksum: -617812715
Called up share capital
Details of the allotted, called up and fully paid share capital at
31 December 2007 are set out in Financial statements – Note 39 on
page 157.
At the AGM on 12 April 2007, authorization was given to the directors
to allot shares up to an aggregate nominal amount equal to $1,626 million.
Authority was also given to the directors to allot shares for cash and to
dispose of treasury shares, other than by way of rights issue, up to a
maximum of $244 million, without having to offer such shares to existing
shareholders. These authorities are given for the period until the next
AGM in 2008 or 11 July 2008, whichever is the earlier. These authorities
are renewed annually at the AGM.
Annual general meeting
The 2008 AGM will be held on Thursday 17 April 2008 at 11.30 a.m. at
ExCeL London, One Western Gateway, Royal Victoria Dock, London
E16 1XL. A separate notice convening the meeting is distributed to
shareholders, which includes an explanation of the items of business
to be considered at the meeting.
All resolutions of which notice has been given will be decided on a
poll.
Ernst & Young LLP have expressed their willingness to continue in
office as auditors and a resolution for their reappointment is included in
Notice of BP Annual General Meeting 2008.
By order of the board
David J Jackson
Secretary
22 February 2008
Administration
If you have any queries about the administration of shareholdings, such
as change of address, change of ownership, dividend payments, the
dividend reinvestment plan or the ADS direct access plan, or to change
the way you receive your company documents (such as the Annual
Report and Accounts, Annual Review and Notice of Meeting) please
contact the BP Registrar or ADS Depositary.
UK – Registrar’s Office
The BP Registrar, Equiniti
Aspect House, Spencer Road, Lancing, West Sussex BN99 6DA
Tel: +44 (0)121 415 7005; Freephone in UK: 0800 701107
Textphone: 0871 384 2255; Fax: +44 (0)871 384 2100
Please note that any numbers quoted with the prefix 0871 will be
charged at 8p per minute from a BT landline. Other network providers’
costs may vary.
US – ADS Depositary
JPMorgan Chase Bank
PO Box 358408, Pittsburgh, PA 15252-8408
Tel: +1 201 680 6630
Toll-free in US and Canada: +1 877 638 5672
92

Filename: U54368_doc7.3d Time: 14:49:52 Date: 25/02/08
Checksum: -1094649349
Financial statements contents
Consolidated financial statements of the BP group
Statement of directors’ responsibilities in respect
of the consolidated financial statements 94
Independent auditor’s report to the members of BP p.l.c. 95
Group income statement 96
Group balance sheet 97
Group cash flow statement 98
Group statement of recognized income and expense 99
Notes on financial statements
1 Significant accounting policies 100
2 Acquisitions 109
3 Non-current assets held for sale and discontinued operations 110
4 Disposals 111
5 Segmental analysis 113
6 Interest and other revenues 119
7 Gains on sale of businesses and fixed assets 119
8 Production and similar taxes 120
9 Depreciation, depletion and amortization 120
10 Impairment and losses on sale of businesses and fixed assets 121
11 Impairment of goodwill 122
12 Distribution and administration expenses 125
13 Currency exchange gains and losses 125
14 Research and development 125
15 Operating leases 126
16 Exploration for and evaluation of oil and natural gas resources 127
17 Auditors’ remuneration 127
18 Finance costs 128
19 Other finance income and expense 128
20 Taxation 128
21 Dividends 130
22 Earnings per ordinary share 131
23 Property, plant and equipment 132
24 Goodwill 133
25 Intangible assets 133
26 Investments in jointly controlled entities 134
27 Investments in associates 135
28 Financial instruments and financial risk factors 136
29 Other investments 141
30 Inventories 141
31 Trade and other receivables 141
32 Cash and cash equivalents 142
33 Trade and other payables 142
34 Derivative financial instruments 143
35 Finance debt 148
36 Capital disclosures and analysis of changes in net debt 150
37 Provisions 151
38 Pensions and other post-retirement benefits 152
39 Called up share capital 157
40 Capital and reserves 158
41 Share-based payments 160
42 Employee costs and numbers 164
43 Remuneration of directors and senior management 164
44 Contingent liabilities 165
45 Capital commitments 166
46 Subsidiaries, jointly controlled entities and associates 167
47 Oil and natural gas exploration and production activities 169
Additional information for US reporting
48 Suspended exploration well costs 172
49 Auditor’s remuneration for US reporting 175
50 Valuation and qualifying accounts 175
51 Computation of ratio of earnings to fixed charges 176
Supplementary information on oil and natural gas 177
Parent company financial statements of BP p.l.c.
Statement of directors’ responsibilities in respect
of the parent company financial statements 186
Independent auditor’s report to the members of BP p.l.c. 187
Company balance sheet 188
Company cash flow statement 189
Statement of total recognized gains and losses 189
Notes on financial statements
1 Accounting policies 190
2 Taxation 191
3 Fixed assets – investments 192
4 Debtors 192
5 Creditors 193
6 Pensions 193
7 Called up share capital 195
8 Capital and reserves 196
9 Cash flow 197
10 Contingent liabilities 197
11 Share-based payments 197
12 Auditors’ remuneration 201
13 Directors’ remuneration 201
BP ANNUAL REPORT AND ACCOUNTS 2007 93
Filename: U54368_doc7.3d Time: 14:49:52 Date: 25/02/08
Checksum: -1127451003
Statement of directors’ responsibilities in respectof the consolidated financial statements
The directors are responsible for preparing the Annual Report and the consolidated financial statements in accordance with applicable United Kingdom
law and International Financial Reporting Standards (IFRS) as adopted by the European Union.
The directors are required to prepare financial statements for each financial year that present fairly the financial position of the group and the
financial performance and cash flows of the group for that period. In preparing those financial statements, the directors are required to:
– Select suitable accounting policies and then apply them consistently.
– Present information, including accounting policies, in a manner that provides relevant, reliable, comparable and understandable information.
– Provide additional disclosure when compliance with the specific requirements of IFRS is insufficient to enable users to understand the impact of
particular transactions, other events and conditions on the group’s financial position and financial performance.
– State that the company has complied with IFRS, subject to any material departures disclosed and explained in the financial statements.
The directors are responsible for keeping proper accounting records that disclose with reasonable accuracy at any time the financial position of the
group and enable them to ensure that the financial statements comply with the Companies Act 1985 and Article 4 of the IAS Regulation. They are also
responsible for safeguarding the assets of the group and hence for taking reasonable steps for the prevention and detection of fraud and other
irregularities.
The directors confirm that they have complied with these requirements and, having a reasonable expectation that the group has adequate resources
to continue in operational existence for the foreseeable future, continue to adopt the going concern basis in preparing the financial statements.
Having made the requisite enquiries, so far as the directors are aware, there is no relevant audit information (as defined by Section 234ZA of the
Companies Act 1985) of which the group’s auditors are unaware, and the directors have taken all the steps they ought to have taken to make
themselves aware of any relevant audit information and to establish that the group’s auditors are aware of that information.
94
Independent auditor’s report to the members of BP p.l.c.
We have audited the consolidated financial statements of BP p.l.c. for the year ended 31 December 2007 which comprise the group income
statement, the group balance sheet, the group cash flow statement, the group statement of recognized income and expense and the related notes 1
to 47. These consolidated financial statements have been prepared under the accounting policies set out therein.
We have reported separately on the parent company financial statements of BP p.l.c. for the year ended 31 December 2007 and on the information
in the Directors’ Remuneration Report that is described as having been audited.
This report is made solely to the company’s members, as a body, in accordance with Section 235 of the Companies Act 1985. Our audit work has
been undertaken so that we might state to the company’s members those matters we are required to state to them in an auditors’ report and for no
other purpose. To the fullest extent permitted by law, we do not accept or assume responsibility to anyone other than the company and the
company’s members as a body, for our audit work, for this report, or for the opinions we have formed.
Respective responsibilities of directors and auditors
The directors are responsible for preparing the Annual Report and the consolidated financial statements in accordance with applicable United Kingdom
law and International Financial Reporting Standards (IFRS) as adopted by the European Union as set out in the Statement of directors’ responsibilities
in respect of the consolidated financial statements.
Our responsibility is to audit the consolidated financial statements in accordance with relevant legal and regulatory requirements and International
Standards on Auditing (UK and Ireland).
We report to you our opinion as to whether the consolidated financial statements give a true and fair view and whether the consolidated financial
statements have been properly prepared in accordance with the Companies Act 1985 and Article 4 of the IAS Regulation. We also report to you
whether in our opinion the information given in the directors’ report, including the business review, is consistent with the financial statements.
In addition we report to you if, in our opinion, we have not received all the information and explanations we require for our audit, or if information
specified by law regarding directors’ remuneration and other transactions is not disclosed.
We review whether the BP board performance report reflects the company’s compliance with the nine provisions of the 2006 Combined Code
Principles of Good Governance and Code of Best Practice specified for our review by the Listing Rules of the Financial Services Authority, and we
report if it does not. We are not required to consider whether the board’s statements on internal control cover all risks and controls, or form an opinion
on the effectiveness of the group’s corporate governance procedures or its risk and control procedures.
We read other information contained in the Annual Report and consider whether it is consistent with the audited consolidated financial statements.
The other information comprises the Additional information for US reporting, the Supplementary information on oil and natural gas and the BP board
performance report. We consider the implications for our report if we become aware of any apparent misstatements or material inconsistencies with
the consolidated financial statements. Our responsibilities do not extend to any other information.
Basis of audit opinion
We conducted our audit in accordance with International Standards on Auditing (UK and Ireland) issued by the Auditing Practices Board. An audit
includes examination, on a test basis, of evidence relevant to the amounts and disclosures in the consolidated financial statements. It also includes an
assessment of the significant estimates and judgements made by the directors in the preparation of the consolidated financial statements, and of
whether the accounting policies are appropriate to the group’s circumstances, consistently applied and adequately disclosed.
We planned and performed our audit so as to obtain all the information and explanations which we considered necessary in order to provide us with
sufficient evidence to give reasonable assurance that the consolidated financial statements are free from material misstatement, whether caused by
fraud or other irregularity or error. In forming our opinion we also evaluated the overall adequacy of the presentation of information in the consolidated
financial statements.
Opinion
In our opinion:
– The consolidated financial statements give a true and fair view, in accordance with IFRS as adopted by the European Union, of the state of the
group’s affairs as at 31 December 2007 and of its profit for the year then ended.
– The group financial statements have been properly prepared in accordance with the Companies Act 1985 and Article 4 of the IAS Regulation.
– The information given in the directors’ report is consistent with the consolidated financial statements.
Separate opinion in relation to IFRS as issued by the International Accounting Standards Board
As explained in Note 1 to the consolidated financial statements, the group, in addition to complying with its legal obligation to comply with IFRS as
adopted by the European Union, has also complied with IFRS as issued by the International Accounting Standards Board.
In our opinion the consolidated financial statements give a true and fair view, in accordance with IFRS as issued by the International Accounting
Standards Board, of the state of the group’s affairs as at 31 December 2007 and of its profit for the year then ended.
Ernst & Young LLP
Registered auditor
London
22 February 2008
The maintenance and integrity of the BP p.l.c. website are the responsibility of the directors; the work carried out by the auditors does not involve
consideration of these matters and, accordingly, the auditors accept no responsibility for any changes that may have occurred to the financial
statements since they were initially presented on the website or any other website they are presented on.
Legislation in the United Kingdom governing the preparation and dissemination of financial statements may differ from legislation in other
jurisdictions.
BP ANNUAL REPORT AND ACCOUNTS 2007 95
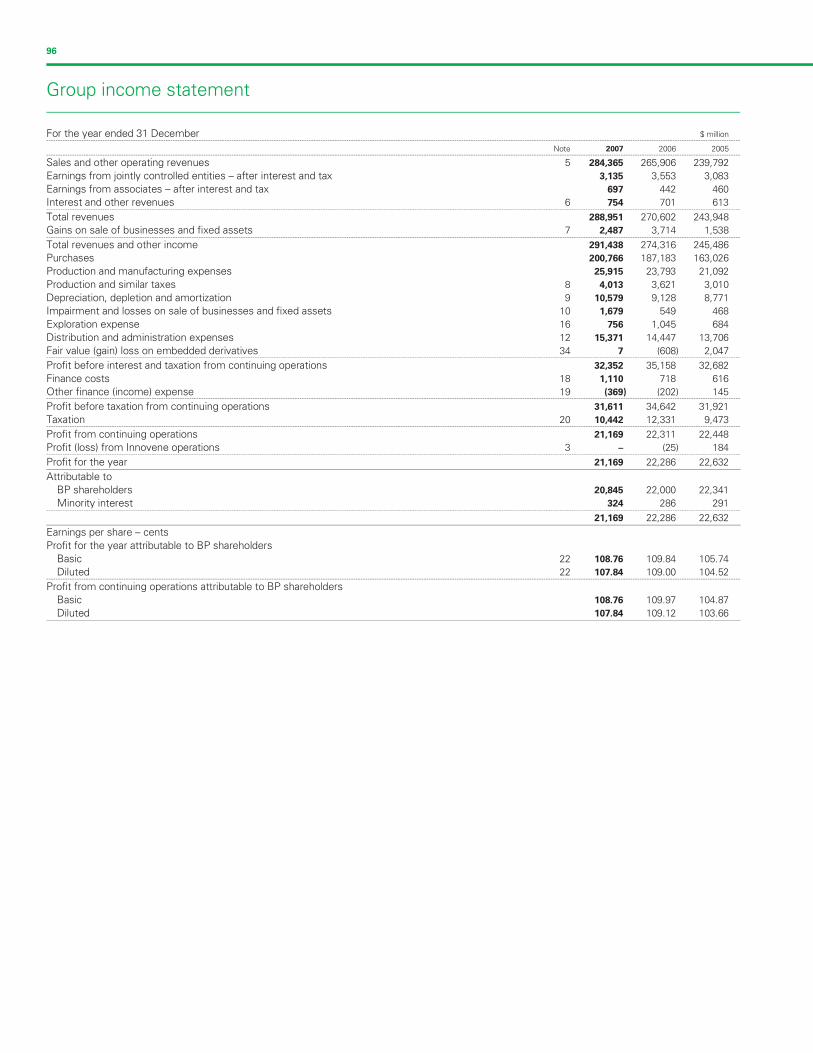
Filename: U54368_doc7.3d Time: 14:49:53 Date: 25/02/08
Checksum: -667930461
Group income statement
For the year ended 31 December $ million--------------------------------------------------------------------------------------------------------------------------------------------------------------------------------------------------------------------------------------------------------------------------------------------------------
Note 2007 2006 2005--------------------------------------------------------------------------------------------------------------------------------------------------------------------------------------------------------------------------------------------------------------------------------------------------------
Sales and other operating revenues 5 284,365 265,906 239,792
Earnings from jointly controlled entities – after interest and tax 3,135 3,553 3,083
Earnings from associates – after interest and tax 697 442 460
Interest and other revenues 6 754 701 613--------------------------------------------------------------------------------------------------------------------------------------------------------------------------------------------------------------------------------------------------------------------------------------------------------
Total revenues 288,951 270,602 243,948
Gains on sale of businesses and fixed assets 7 2,487 3,714 1,538--------------------------------------------------------------------------------------------------------------------------------------------------------------------------------------------------------------------------------------------------------------------------------------------------------
Total revenues and other income 291,438 274,316 245,486
Purchases 200,766 187,183 163,026
Production and manufacturing expenses 25,915 23,793 21,092
Production and similar taxes 8 4,013 3,621 3,010
Depreciation, depletion and amortization 9 10,579 9,128 8,771
Impairment and losses on sale of businesses and fixed assets 10 1,679 549 468
Exploration expense 16 756 1,045 684
Distribution and administration expenses 12 15,371 14,447 13,706
Fair value (gain) loss on embedded derivatives 34 7 (608) 2,047--------------------------------------------------------------------------------------------------------------------------------------------------------------------------------------------------------------------------------------------------------------------------------------------------------
Profit before interest and taxation from continuing operations 32,352 35,158 32,682
Finance costs 18 1,110 718 616
Other finance (income) expense 19 (369) (202) 145--------------------------------------------------------------------------------------------------------------------------------------------------------------------------------------------------------------------------------------------------------------------------------------------------------
Profit before taxation from continuing operations 31,611 34,642 31,921
Taxation 20 10,442 12,331 9,473--------------------------------------------------------------------------------------------------------------------------------------------------------------------------------------------------------------------------------------------------------------------------------------------------------
Profit from continuing operations 21,169 22,311 22,448
Profit (loss) from Innovene operations 3 – (25) 184--------------------------------------------------------------------------------------------------------------------------------------------------------------------------------------------------------------------------------------------------------------------------------------------------------
Profit for the year 21,169 22,286 22,632
Attributable to
BP shareholders 20,845 22,000 22,341
Minority interest 324 286 291--------------------------------------------------------------------------------------------------------------------------------------------------------------------------------------------------------------------------------------------------------------------------------------------------------
21,169 22,286 22,632
Earnings per share – cents
Profit for the year attributable to BP shareholders
Basic 22 108.76 109.84 105.74
Diluted 22 107.84 109.00 104.52--------------------------------------------------------------------------------------------------------------------------------------------------------------------------------------------------------------------------------------------------------------------------------------------------------
Profit from continuing operations attributable to BP shareholders
Basic 108.76 109.97 104.87
Diluted 107.84 109.12 103.66
96
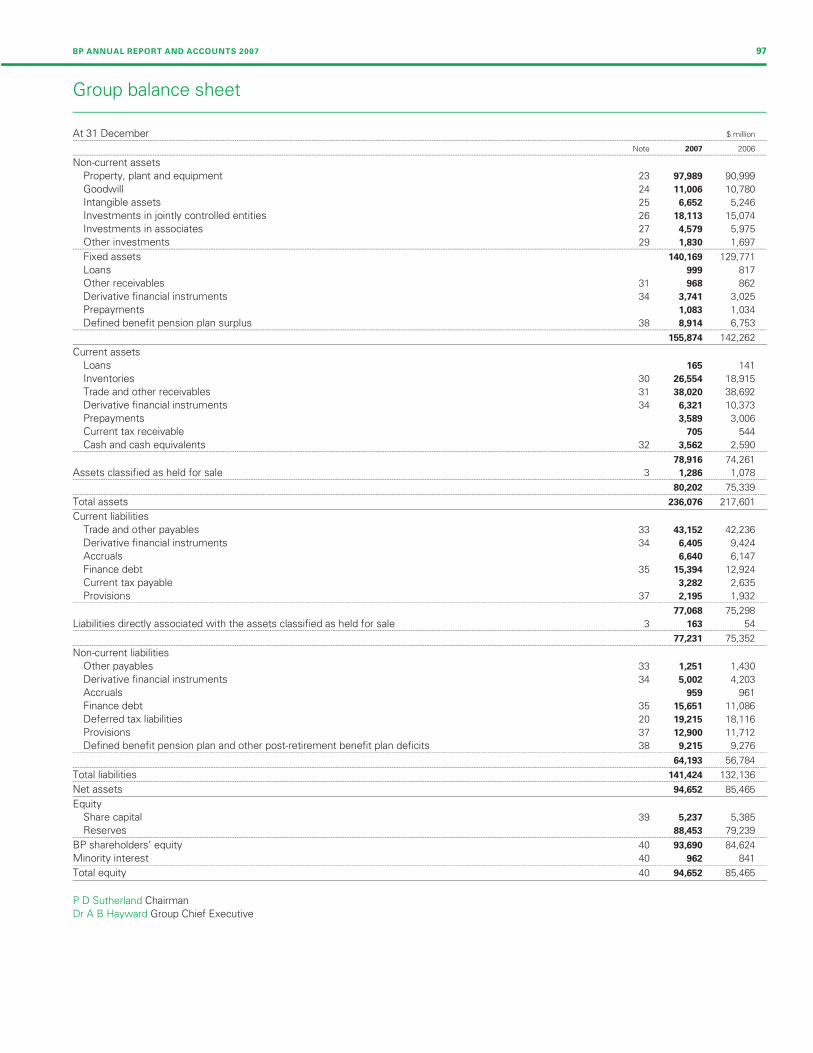
Filename: U54368_doc7.3d Time: 14:49:53 Date: 25/02/08
Checksum: 1790340423
Group balance sheet
At 31 December $ million--------------------------------------------------------------------------------------------------------------------------------------------------------------------------------------------------------------------------------------------------------------------------------------------------------
Note 2007 2006--------------------------------------------------------------------------------------------------------------------------------------------------------------------------------------------------------------------------------------------------------------------------------------------------------
Non-current assets
Property, plant and equipment 23 97,989 90,999
Goodwill 24 11,006 10,780
Intangible assets 25 6,652 5,246
Investments in jointly controlled entities 26 18,113 15,074
Investments in associates 27 4,579 5,975
Other investments 29 1,830 1,697--------------------------------------------------------------------------------------------------------------------------------------------------------------------------------------------------------------------------------------------------------------------------------------------------------
Fixed assets 140,169 129,771
Loans 999 817
Other receivables 31 968 862
Derivative financial instruments 34 3,741 3,025
Prepayments 1,083 1,034
Defined benefit pension plan surplus 38 8,914 6,753--------------------------------------------------------------------------------------------------------------------------------------------------------------------------------------------------------------------------------------------------------------------------------------------------------
155,874 142,262
Current assets
Loans 165 141
Inventories 30 26,554 18,915
Trade and other receivables 31 38,020 38,692
Derivative financial instruments 34 6,321 10,373
Prepayments 3,589 3,006
Current tax receivable 705 544
Cash and cash equivalents 32 3,562 2,590--------------------------------------------------------------------------------------------------------------------------------------------------------------------------------------------------------------------------------------------------------------------------------------------------------
78,916 74,261
Assets classified as held for sale 3 1,286 1,078--------------------------------------------------------------------------------------------------------------------------------------------------------------------------------------------------------------------------------------------------------------------------------------------------------
80,202 75,339--------------------------------------------------------------------------------------------------------------------------------------------------------------------------------------------------------------------------------------------------------------------------------------------------------
Total assets 236,076 217,601
Current liabilities
Trade and other payables 33 43,152 42,236
Derivative financial instruments 34 6,405 9,424
Accruals 6,640 6,147
Finance debt 35 15,394 12,924
Current tax payable 3,282 2,635
Provisions 37 2,195 1,932--------------------------------------------------------------------------------------------------------------------------------------------------------------------------------------------------------------------------------------------------------------------------------------------------------
77,068 75,298
Liabilities directly associated with the assets classified as held for sale 3 163 54--------------------------------------------------------------------------------------------------------------------------------------------------------------------------------------------------------------------------------------------------------------------------------------------------------
77,231 75,352--------------------------------------------------------------------------------------------------------------------------------------------------------------------------------------------------------------------------------------------------------------------------------------------------------
Non-current liabilities
Other payables 33 1,251 1,430
Derivative financial instruments 34 5,002 4,203
Accruals 959 961
Finance debt 35 15,651 11,086
Deferred tax liabilities 20 19,215 18,116
Provisions 37 12,900 11,712
Defined benefit pension plan and other post-retirement benefit plan deficits 38 9,215 9,276--------------------------------------------------------------------------------------------------------------------------------------------------------------------------------------------------------------------------------------------------------------------------------------------------------
64,193 56,784--------------------------------------------------------------------------------------------------------------------------------------------------------------------------------------------------------------------------------------------------------------------------------------------------------
Total liabilities 141,424 132,136--------------------------------------------------------------------------------------------------------------------------------------------------------------------------------------------------------------------------------------------------------------------------------------------------------
Net assets 94,652 85,465
Equity
Share capital 39 5,237 5,385
Reserves 88,453 79,239--------------------------------------------------------------------------------------------------------------------------------------------------------------------------------------------------------------------------------------------------------------------------------------------------------
BP shareholders’ equity 40 93,690 84,624
Minority interest 40 962 841--------------------------------------------------------------------------------------------------------------------------------------------------------------------------------------------------------------------------------------------------------------------------------------------------------
Total equity 40 94,652 85,465
P D Sutherland Chairman
Dr A B Hayward Group Chief Executive
BP ANNUAL REPORT AND ACCOUNTS 2007 97
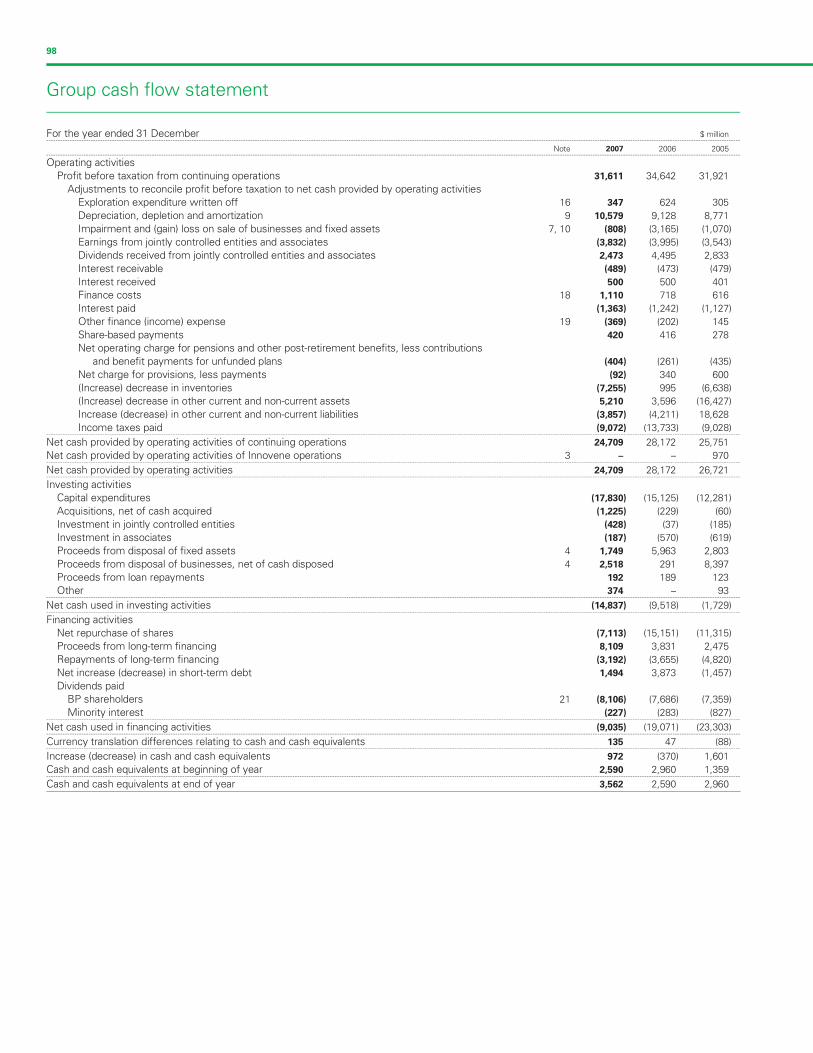
Filename: U54368_doc7.3d Time: 14:49:53 Date: 25/02/08
Checksum: -469878337
Group cash flow statement
For the year ended 31 December $ million--------------------------------------------------------------------------------------------------------------------------------------------------------------------------------------------------------------------------------------------------------------------------------------------------------
Note 2007 2006 2005--------------------------------------------------------------------------------------------------------------------------------------------------------------------------------------------------------------------------------------------------------------------------------------------------------
Operating activities
Profit before taxation from continuing operations 31,611 34,642 31,921
Adjustments to reconcile profit before taxation to net cash provided by operating activities
Exploration expenditure written off 16 347 624 305
Depreciation, depletion and amortization 9 10,579 9,128 8,771
Impairment and (gain) loss on sale of businesses and fixed assets 7, 10 (808) (3,165) (1,070)
Earnings from jointly controlled entities and associates (3,832) (3,995) (3,543)
Dividends received from jointly controlled entities and associates 2,473 4,495 2,833
Interest receivable (489) (473) (479)
Interest received 500 500 401
Finance costs 18 1,110 718 616
Interest paid (1,363) (1,242) (1,127)
Other finance (income) expense 19 (369) (202) 145
Share-based payments 420 416 278
Net operating charge for pensions and other post-retirement benefits, less contributions
and benefit payments for unfunded plans (404) (261) (435)
Net charge for provisions, less payments (92) 340 600
(Increase) decrease in inventories (7,255) 995 (6,638)
(Increase) decrease in other current and non-current assets 5,210 3,596 (16,427)
Increase (decrease) in other current and non-current liabilities (3,857) (4,211) 18,628
Income taxes paid (9,072) (13,733) (9,028)--------------------------------------------------------------------------------------------------------------------------------------------------------------------------------------------------------------------------------------------------------------------------------------------------------
Net cash provided by operating activities of continuing operations 24,709 28,172 25,751
Net cash provided by operating activities of Innovene operations 3 – – 970--------------------------------------------------------------------------------------------------------------------------------------------------------------------------------------------------------------------------------------------------------------------------------------------------------
Net cash provided by operating activities 24,709 28,172 26,721--------------------------------------------------------------------------------------------------------------------------------------------------------------------------------------------------------------------------------------------------------------------------------------------------------
Investing activities
Capital expenditures (17,830) (15,125) (12,281)
Acquisitions, net of cash acquired (1,225) (229) (60)
Investment in jointly controlled entities (428) (37) (185)
Investment in associates (187) (570) (619)
Proceeds from disposal of fixed assets 4 1,749 5,963 2,803
Proceeds from disposal of businesses, net of cash disposed 4 2,518 291 8,397
Proceeds from loan repayments 192 189 123
Other 374 – 93--------------------------------------------------------------------------------------------------------------------------------------------------------------------------------------------------------------------------------------------------------------------------------------------------------
Net cash used in investing activities (14,837) (9,518) (1,729)--------------------------------------------------------------------------------------------------------------------------------------------------------------------------------------------------------------------------------------------------------------------------------------------------------
Financing activities
Net repurchase of shares (7,113) (15,151) (11,315)
Proceeds from long-term financing 8,109 3,831 2,475
Repayments of long-term financing (3,192) (3,655) (4,820)
Net increase (decrease) in short-term debt 1,494 3,873 (1,457)
Dividends paid
BP shareholders 21 (8,106) (7,686) (7,359)
Minority interest (227) (283) (827)--------------------------------------------------------------------------------------------------------------------------------------------------------------------------------------------------------------------------------------------------------------------------------------------------------
Net cash used in financing activities (9,035) (19,071) (23,303)--------------------------------------------------------------------------------------------------------------------------------------------------------------------------------------------------------------------------------------------------------------------------------------------------------
Currency translation differences relating to cash and cash equivalents 135 47 (88)--------------------------------------------------------------------------------------------------------------------------------------------------------------------------------------------------------------------------------------------------------------------------------------------------------
Increase (decrease) in cash and cash equivalents 972 (370) 1,601
Cash and cash equivalents at beginning of year 2,590 2,960 1,359--------------------------------------------------------------------------------------------------------------------------------------------------------------------------------------------------------------------------------------------------------------------------------------------------------
Cash and cash equivalents at end of year 3,562 2,590 2,960
98

Filename: U54368_doc7.3d Time: 14:49:54 Date: 25/02/08
Checksum: 1871686235
Group statement of recognized income and expense
For the year ended 31 December $ million--------------------------------------------------------------------------------------------------------------------------------------------------------------------------------------------------------------------------------------------------------------------------------------------------------
Note 2007 2006 2005--------------------------------------------------------------------------------------------------------------------------------------------------------------------------------------------------------------------------------------------------------------------------------------------------------
Currency translation differences 1,887 2,025 (2,502)
Exchange gain on translation of foreign operations transferred to gain or loss on sale of
businesses and fixed assets (147) – (315)
Actuarial gain relating to pensions and other post-retirement benefits 1,717 2,615 975
Available-for-sale investments marked to market 200 561 322
Available-for-sale investments – recycled to the income statement (91) (695) (60)
Cash flow hedges marked to market 155 413 (212)
Cash flow hedges – recycled to the income statement (74) (93) 36
Cash flow hedges – recycled to the balance sheet (40) (6) –
Tax on currency translation differences 139 (201) 11
Tax on exchange gain on translation of foreign operations transferred to gain or loss on sale of
businesses and fixed assets – –
Tax on actuarial gain relating to pensions and other post-retirement benefits (427) (820) (356)
Tax on available-for-sale investments (14) 108 (72)
Tax on cash flow hedges 26 (47) 63
Tax on share-based payments 213 26 –--------------------------------------------------------------------------------------------------------------------------------------------------------------------------------------------------------------------------------------------------------------------------------------------------------
Net income (expense) recognized directly in equity 3,544 3,886 (2,015)
Profit for the year 21,169 22,286 22,632--------------------------------------------------------------------------------------------------------------------------------------------------------------------------------------------------------------------------------------------------------------------------------------------------------
Total recognized income and expense for the year 24,713 26,172 20,617
Attributable to
BP shareholders 24,365 25,837 20,326
Minority interest 348 335 291--------------------------------------------------------------------------------------------------------------------------------------------------------------------------------------------------------------------------------------------------------------------------------------------------------
24,713 26,172 20,617
Effect of change in accounting policy – adoption of IAS 32 and IAS 39 on 1 January 2005
BP shareholders 1 – – (243)
Minority interest – –--------------------------------------------------------------------------------------------------------------------------------------------------------------------------------------------------------------------------------------------------------------------------------------------------------
– – (243)
95
–
BP ANNUAL REPORT AND ACCOUNTS 2007 99

Filename: U54368_doc8.3d Time: 14:49:56 Date: 25/02/08
Checksum: 452155879
100
Notes on financial statements
1 Significant accounting policies
Authorization of financial statements and statement of compliance with International Financial Reporting Standards
The consolidated financial statements of the BP group for the year ended 31 December 2007 were authorized for issue by the board of directors on
22 February 2008 and the balance sheet was signed on the board’s behalf by P D Sutherland and Dr A B Hayward. BP p.l.c. is a public limited
company incorporated and domiciled in England and Wales. The company’s ordinary shares are traded on the London Stock Exchange. The
consolidated financial statements have been prepared in accordance with International Financial Reporting Standards (IFRS) as issued by the
International Accounting Standards Board (IASB), IFRS as adopted by the European Union (EU) and in accordance with the provisions of the
Companies Act 1985. IFRS as adopted by the EU differs in certain respects from IFRS as issued by the IASB, however, the differences have no
impact on the group’s consolidated financial statements for the years presented. The significant accounting policies of the group are set out below.
Basis of preparation
The consolidated financial statements have been prepared in accordance with IFRS and International Financial Reporting Interpretations Committee
(IFRIC) interpretations issued and effective for the year ended 31 December 2007, or issued and early adopted.
In preparing the consolidated financial statements for the current year, the group has adopted the following new IFRS, amendment to IFRS and
IFRIC interpretations:
– IFRS 7 ‘Financial Instruments: Disclosures’.
– Amendment to IAS 1 ‘Presentation of Financial Statements’ – Capital Disclosures.
– IFRIC 10 ‘Interim Financial Reporting and Impairment’.
– IFRIC 11 ‘IFRS 2 – Group and Treasury Share Transactions’.
Further information regarding the impact of adoption is given below.
The accounting policies that follow have been consistently applied to all years presented with the exception of those relating to financial instruments
under IAS 32 ‘Financial Instruments: Presentation’ (IAS 32) and IAS 39 ‘Financial Instruments: Recognition and Measurement’ (IAS 39) which have
been applied with effect from 1 January 2005. The standards in force at the time of BP’s first time adoption of IFRS in 2005 were applied
retrospectively to 1 January 2003, BP’s date of transition to IFRS. However, BP elected to take advantage of the exemption allowing comparative
information on financial instruments to be prepared in accordance with the group’s previous accounting policies under UK generally accepted
accounting practice (UK GAAP). The effect on shareholders’ equity of this change on 1 January 2005 is shown in the group statement of recognized
income and expense and related mainly to all derivative financial instruments being brought on to the group balance sheet at fair value and available-
for-sale investments being measured at fair value rather than at cost.
The consolidated financial statements are presented in US dollars and all values are rounded to the nearest million dollars ($ million), except where
otherwise indicated.
For further information regarding the key judgements and estimates made by management in applying the group’s accounting policies, refer to
Critical accounting policies on pages 57 to 58, which forms part of these financial statements.
Basis of consolidation
The group financial statements consolidate the financial statements of BP p.l.c. and the entities it controls (its subsidiaries) drawn up to 31 December
each year. Control comprises the power to govern the financial and operating policies of the investee so as to obtain benefit from its activities and is
achieved through direct and indirect ownership of voting rights; currently exercisable or convertible potential voting rights; or by way of contractual
agreement. Subsidiaries are consolidated from the date of their acquisition, being the date on which the group obtains control, and continue to be
consolidated until the date that such control ceases. The financial statements of subsidiaries are prepared for the same reporting year as the parent
company, using consistent accounting policies. All intercompany balances and transactions, including unrealized profits arising from intragroup
transactions, have been eliminated in full. Unrealized losses are eliminated unless the transaction provides evidence of an impairment of the asset
transferred. Minority interests represent the portion of profit or loss and net assets in subsidiaries that is not held by the group.
Interests in joint ventures
A joint venture is a contractual arrangement whereby two or more parties (venturers) undertake an economic activity that is subject to joint control.
Joint control exists only when the strategic financial and operating decisions relating to the activity require the unanimous consent of the venturers.
A jointly controlled entity is a joint venture that involves the establishment of a company, partnership or other entity to engage in economic activity that
the group jointly controls with its fellow venturers.
The results, assets and liabilities of a jointly controlled entity are incorporated in these financial statements using the equity method of accounting.
Under the equity method, the investment in a jointly controlled entity is carried in the balance sheet at cost, plus post-acquisition changes in the
group’s share of net assets of the jointly controlled entity, less distributions received and less any impairment in value of the investment. Loans
advanced to jointly controlled entities are also included in the investment on the group balance sheet. The group income statement reflects the
group’s share of the results after tax of the jointly controlled entity. The group statement of recognized income and expense reflects the group’s share
of any income and expense recognized by the jointly controlled entity outside profit and loss.
Financial statements of jointly controlled entities are prepared for the same reporting year as the group. Where necessary, adjustments are made to
those financial statements to bring the accounting policies used into line with those of the group.
Unrealized gains on transactions between the group and its jointly controlled entities are eliminated to the extent of the group’s interest in the jointly
controlled entities. Unrealized losses are also eliminated unless the transaction provides evidence of an impairment of the asset transferred.
The group assesses investments in jointly controlled entities for impairment whenever events or changes in circumstances indicate that the carrying
value may not be recoverable. If any such indication of impairment exists, the carrying amount of the investment is compared with its recoverable
amount, being the higher of its fair value less costs to sell and value in use. Where the carrying amount exceeds the recoverable amount, the
investment is written down to its recoverable amount.
Filename: U54368_doc8.3d Time: 14:49:56 Date: 25/02/08
Checksum: 891737969
BP ANNUAL REPORT AND ACCOUNTS 2007 101
1 Significant accounting policies continued
The group ceases to use the equity method of accounting on the date from which it no longer has joint control over, or significant influence in the
joint venture, or when the interest becomes held for sale.
Certain of the group’s activities, particularly in the Exploration and Production segment, are conducted through joint ventures where the venturers
have a direct ownership interest in and jointly control the assets of the venture. The income, expenses, assets and liabilities of these jointly controlled
assets are included in the consolidated financial statements in proportion to the group’s interest.
Interests in associates
An associate is an entity over which the group is in a position to exercise significant influence through participation in the financial and operating policy
decisions of the investee, but that is not a subsidiary or a jointly controlled entity.
The results, assets and liabilities of an associate are incorporated in these financial statements using the equity method of accounting as described
above for jointly controlled entities.
Foreign currency translation
Functional currency is the currency of the primary economic environment in which an entity operates and is normally the currency in which the entity
primarily generates and expends cash.
In individual companies, transactions in foreign currencies are initially recorded in the functional currency by applying the rate of exchange ruling at
the date of the transaction. Monetary assets and liabilities denominated in foreign currencies are retranslated into the functional currency at the rate of
exchange ruling at the balance sheet date. Any resulting exchange differences are included in the income statement. Non-monetary assets and
liabilities that are measured at historical cost and denominated in a foreign currency are translated into the functional currency using the rates of
exchange as at the dates of the initial transactions. Non-monetary assets and liabilities measured at fair value in a foreign currency are translated into
the functional currency using the rate of exchange at the date the fair value was determined.
In the consolidated financial statements, the assets and liabilities of non-US dollar functional currency subsidiaries, jointly controlled entities and
associates, including related goodwill, are translated into US dollars at the rate of exchange ruling at the balance sheet date. The results and cash
flows of non-US dollar functional currency subsidiaries, jointly controlled entities and associates are translated into US dollars using average rates of
exchange. Exchange adjustments arising when the opening net assets and the profits for the year retained by non-US dollar functional currency
subsidiaries, jointly controlled entities and associates are translated into US dollars are taken to a separate component of equity and reported in the
statement of recognized income and expense. Exchange gains and losses arising on long-term intragroup foreign currency borrowings used to
finance the group’s non-US dollar investments are also taken to equity. On disposal of a non-US dollar functional currency subsidiary, jointly controlled
entity or associate, the deferred cumulative amount recognized in equity relating to that particular non-US dollar operation is recognized in the
income statement.
Business combinations and goodwill
Business combinations are accounted for using the purchase method of accounting. The cost of an acquisition is measured as the cash paid and the
fair value of other assets given, equity instruments issued and liabilities incurred or assumed at the date of exchange, plus costs directly attributable to
the acquisition. The acquired identifiable assets, liabilities and contingent liabilities are measured at their fair values at the date of acquisition. Any
excess of the cost of acquisition over the net fair value of the identifiable assets, liabilities and contingent liabilities acquired is recognized as goodwill.
Any deficiency of the cost of acquisition below the fair values of the identifiable net assets acquired (i.e. discount on acquisition) is credited to the
income statement in the period of acquisition. Where the group does not acquire 100% ownership of the acquired company, the interest of minority
shareholders is stated at the minority’s proportion of the fair values of the assets and liabilities recognized. Subsequently, any losses applicable to the
minority shareholders in excess of the minority interest on the group balance sheet are allocated against the interests of the parent.
At the acquisition date, any goodwill acquired is allocated to each of the cash-generating units expected to benefit from the combination’s
synergies. For this purpose, cash-generating units are set at one level below a business segment.
Following initial recognition, goodwill is measured at cost less any accumulated impairment losses. Goodwill is reviewed for impairment annually or
more frequently if events or changes in circumstances indicate that the carrying value may be impaired.
Impairment is determined by assessing the recoverable amount of the cash-generating unit to which the goodwill relates. Where the recoverable
amount of the cash-generating unit is less than the carrying amount, an impairment loss is recognized.
Goodwill arising on business combinations prior to 1 January 2003 is stated at the previous carrying amount under UK generally accepted
accounting practice.
Goodwill may also arise upon investments in jointly controlled entities and associates, being the surplus of the cost of investment over the group’s
share of the net fair value of the identifiable assets. Such goodwill is recorded within investments in jointly controlled entities and associates, and any
impairment of the goodwill is included within the earnings from jointly controlled entities and associates.
Non-current assets held for sale
Non-current assets and disposal groups classified as held for sale are measured at the lower of carrying amount and fair value less costs to sell.
Non-current assets and disposal groups are classified as held for sale if their carrying amounts will be recovered through a sale transaction rather
than through continuing use. This condition is regarded as met only when the sale is highly probable and the asset or disposal group is available for
immediate sale in its present condition. Management must be committed to the sale, which should be expected to qualify for recognition as a
completed sale within one year from the date of classification.
Property, plant and equipment and intangible assets once classified as held for sale are not depreciated.
Intangible assets
Intangible assets are stated at the amount initially recognized, less accumulated amortization and accumulated impairment losses. Intangible assets
include expenditure on the exploration for and evaluation of oil and natural gas resources, computer software, patents, licences and trademarks.
Intangible assets acquired separately from a business are carried initially at cost. The initial cost is the aggregate amount paid and the fair value of
any other consideration given to acquire the asset. An intangible asset acquired as part of a business combination is measured at fair value at the date
of acquisition and is recognized separately from goodwill if the asset is separable or arises from contractual or other legal rights and its fair value can
be measured reliably.
Filename: U54368_doc8.3d Time: 14:49:56 Date: 25/02/08
Checksum: 1493843855
102
1 Significant accounting policies continued
Intangible assets with a finite life are amortized on a straight-line basis over their expected useful lives. For patents, licences and trademarks,
expected useful life is the shorter of the duration of the legal agreement and economic useful life, which can range from three to 15 years. Computer
software costs have a useful life of three to five years.
The expected useful lives of assets are reviewed on an annual basis and, if necessary, changes in useful lives are accounted for prospectively.
The carrying value of intangible assets is reviewed for impairment whenever events or changes in circumstances indicate the carrying value may
not be recoverable.
Oil and natural gas exploration and development expenditure
Oil and natural gas exploration and development expenditure is accounted for using the successful efforts method of accounting.
Licence and property acquisition costs
Exploration licence and leasehold property acquisition costs are capitalized within intangible fixed assets and amortized on a straight-line basis over the
estimated period of exploration. Each property is reviewed on an annual basis to confirm that drilling activity is planned and it is not impaired. If no
future activity is planned, the remaining balance of the licence and property acquisition costs is written off. Upon determination of economically
recoverable reserves (‘proved reserves’ or ‘commercial reserves’), amortization ceases and the remaining costs are aggregated with exploration
expenditure and held on a field-by-field basis as proved properties awaiting approval within other intangible assets. When development is approved
internally, the relevant expenditure is transferred to property, plant and equipment.
Exploration expenditure
Geological and geophysical exploration costs are charged against income as incurred. Costs directly associated with an exploration well are capitalized
as an intangible asset until the drilling of the well is complete and the results have been evaluated. These costs include employee remuneration,
materials and fuel used, rig costs, delay rentals and payments made to contractors. If hydrocarbons are not found, the exploration expenditure is
written off as a dry hole. If hydrocarbons are found and, subject to further appraisal activity, which may include the drilling of further wells (exploration
or exploratory-type stratigraphic test wells), are likely to be capable of commercial development, the costs continue to be carried as an asset. All such
carried costs are subject to technical, commercial and management review at least once a year to confirm the continued intent to develop or
otherwise extract value from the discovery. When this is no longer the case, the costs are written off. When proved reserves of oil and natural gas are
determined and development is sanctioned, the relevant expenditure is transferred to property, plant and equipment.
Development expenditure
Expenditure on the construction, installation or completion of infrastructure facilities such as platforms, pipelines and the drilling of development wells,
including unsuccessful development or delineation wells, is capitalized within property, plant and equipment and is depreciated from the
commencement of production as described below in the accounting policy for Property, plant and equipment.
Property, plant and equipment
Property, plant and equipment is stated at cost, less accumulated depreciation and accumulated impairment losses.
The initial cost of an asset comprises its purchase price or construction cost, any costs directly attributable to bringing the asset into operation, the
initial estimate of any decommissioning obligation, if any, and, for qualifying assets, borrowing costs. The purchase price or construction cost is the
aggregate amount paid and the fair value of any other consideration given to acquire the asset. The capitalized value of a finance lease is also included
within property, plant and equipment.
Exchanges of assets are measured at fair value unless the exchange transaction lacks commercial substance or the fair value of neither the asset
received nor the asset given up is reliably measurable. The cost of the acquired asset is measured at the fair value of the asset given up, unless the
fair value of the asset received is more clearly evident. Where fair value is not used, the cost of the acquired asset is measured at the carrying amount
of the amount given up. The gain or loss on derecognition of the asset given up is recognized in profit or loss.
Expenditure on major maintenance refits or repairs comprises the cost of replacement assets or parts of assets, inspection costs and overhaul
costs. Where an asset or part of an asset that was separately depreciated is replaced and it is probable that future economic benefits associated with
the item will flow to the group, the expenditure is capitalized and the carrying amount of the replaced asset is derecognized. Inspection costs
associated with major maintenance programmes are capitalized and amortized over the period to the next inspection. Overhaul costs for major
maintenance programmes are expensed as incurred. All other maintenance costs are expensed as incurred.
Oil and natural gas properties, including related pipelines, are depreciated using a unit-of-production method. The cost of producing wells is
amortized over proved developed reserves. Licence acquisition, field development and future decommissioning costs are amortized over total proved
reserves. The unit-of-production rate for the amortization of field development costs takes into account expenditures incurred to date, together with
approved future development expenditure required to develop reserves.
Other property, plant and equipment is depreciated on a straight-line basis over its expected useful life.
The useful lives of the group’s other property, plant and equipment are as follows:
---------------------------------------------------------------------------------------------------------------------------------------------------- ----------------------------------------------------------------------------------------------------------------------------------------------------
Land improvements 15 to 25 years
Buildings 20 to 50 years
Refineries 20 to 30 years
Petrochemicals plants 20 to 30 years
Pipelines 10 to 50 years
Service stations 15 years
Office equipment 3 to 7 years
Fixtures and fittings 5 to 15 years
Filename: U54368_doc8.3d Time: 14:49:56 Date: 25/02/08
Checksum: -464133837
BP ANNUAL REPORT AND ACCOUNTS 2007 103
1 Significant accounting policies continued
The expected useful lives of property, plant and equipment are reviewed on an annual basis and, if necessary, changes in useful lives are accounted
for prospectively.
The carrying value of property, plant and equipment is reviewed for impairment whenever events or changes in circumstances indicate the carrying
value may not be recoverable.
An item of property, plant and equipment is derecognized upon disposal or when no future economic benefits are expected to arise from the
continued use of the asset. Any gain or loss arising on derecognition of the asset (calculated as the difference between the net disposal proceeds and
the carrying amount of the item) is included in the income statement in the period the item is derecognized.
Impairment of intangible assets and property, plant and equipment
The group assesses assets or groups of assets for impairment whenever events or changes in circumstances indicate that the carrying value of an
asset may not be recoverable. If any such indication of impairment exists, the group makes an estimate of its recoverable amount. Individual assets
are grouped for impairment assessment purposes at the lowest level at which there are identifiable cash flows that are largely independent of the
cash flows of other groups of assets. An asset group’s recoverable amount is the higher of its fair value less costs to sell and its value in use. Where
the carrying amount of an asset group exceeds its recoverable amount, the asset group is considered impaired and is written down to its recoverable
amount. In assessing value in use, the estimated future cash flows are adjusted for the risks specific to the asset group and are discounted to their
present value using a pre-tax discount rate that reflects current market assessments of the time value of money.
An assessment is made at each reporting date as to whether there is any indication that previously recognized impairment losses may no longer
exist or may have decreased. If such indication exists, the recoverable amount is estimated. A previously recognized impairment loss is reversed only
if there has been a change in the estimates used to determine the asset’s recoverable amount since the last impairment loss was recognized. If that
is the case, the carrying amount of the asset is increased to its recoverable amount. That increased amount cannot exceed the carrying amount that
would have been determined, net of depreciation, had no impairment loss been recognized for the asset in prior years. Such reversal is recognized in
profit or loss. After such a reversal, the depreciation charge is adjusted in future periods to allocate the asset’s revised carrying amount, less any
residual value, on a systematic basis over its remaining useful life.
Financial assets
Financial assets are classified as loans and receivables; available-for-sale financial assets; financial assets at fair value through profit or loss; or as
derivatives designated as hedging instruments in an effective hedge, as appropriate. Financial assets include cash and cash equivalents, trade
receivables, other receivables, loans, other investments, and derivative financial instruments. The group determines the classification of its financial
assets at initial recognition. Financial assets are recognized initially at fair value, normally being the transaction price plus, in the case of financial assets
not at fair value through profit or loss, directly attributable transaction costs.
The subsequent measurement of financial assets depends on their classification, as follows:
Loans and receivables
Loans and receivables are non-derivative financial assets with fixed or determinable payments that are not quoted in an active market. Such assets are
carried at amortized cost using the effective interest method if the time value of money is significant. Gains and losses are recognized in income when
the loans and receivables are derecognized or impaired, as well as through the amortization process. This category of financial assets includes trade
and other receivables.
Available-for-sale financial assets
Available-for-sale financial assets are those non-derivative financial assets that are not classified as loans and receivables. After initial recognition,
available-for-sale financial assets are measured at fair value, with gains or losses recognized as a separate component of equity until the investment is
derecognized or until the investment is determined to be impaired, at which time the cumulative gain or loss previously reported in equity is included
in the income statement.
The fair value of quoted investments is determined by reference to bid prices at the close of business on the balance sheet date. Where there is no
active market, fair value is determined using valuation techniques. Where fair value cannot be reliably estimated, assets are carried at cost.
Financial assets at fair value through profit or loss
Derivatives, other than those designated as effective hedging instruments, are classified as held for trading and are included in this category. These
assets are carried on the balance sheet at fair value with gains or losses recognized in the income statement.
Derivatives designated as hedging instruments in an effective hedge
Such derivatives are carried on the balance sheet at fair value, the treatment of gains and losses arising from revaluation are described below in the
accounting policy for Derivative financial instruments and hedging activities.
Impairment of financial assets
The group assesses at each balance sheet date whether a financial asset or group of financial assets is impaired.
Loans and receivables
If there is objective evidence that an impairment loss on loans and receivables carried at amortized cost has been incurred, the amount of the loss is
measured as the difference between the asset’s carrying amount and the present value of estimated future cash flows discounted at the financial
asset’s original effective interest rate. The carrying amount of the asset is reduced, with the amount of the loss recognized in profit or loss.
Available-for-sale financial assets
If an available-for-sale financial asset is impaired, an amount comprising the difference between its cost (net of any principal payment and amortization)
and its fair value is transferred from equity to the income statement.
Filename: U54368_doc8.3d Time: 14:49:56 Date: 25/02/08
Checksum: -483019500
104
1 Significant accounting policies continued
If there is objective evidence that an impairment loss on an unquoted equity instrument that is not carried at fair value because its fair value cannot
be reliably measured has been incurred, the amount of the loss is measured as the difference between the asset’s carrying amount and the present
value of estimated future cash flows discounted at the current market rate of return for a similar financial asset.
Financial assets are derecognized on sale or settlement.
Inventories
Inventories, other than inventory held for trading purposes, are stated at the lower of cost and net realizable value. Cost is determined by the first-in
first-out method and comprises direct purchase costs, cost of production, transportation and manufacturing expenses.
Inventories held for trading purposes are stated at fair value less costs to sell and any changes in net realizable value are recognized in the income
statement.
Supplies are valued at cost to the group mainly using the average method or net realizable value, whichever is the lower.
Financial liabilities
Financial liabilities are classified as financial liabilities at fair value through profit or loss; derivatives designated as hedging instruments in an effective
hedge; or as financial liabilities measured at amortized cost, as appropriate. Financial liabilities include trade and other payables, accruals, finance debt
and derivative financial instruments. The group determines the classification of its financial liabilities at initial recognition. The measurement of financial
liabilities depends on their classification, as follows:
Financial liabilities at fair value through profit or loss
Derivatives, other than those designated as effective hedging instruments, are classified as held for trading and are included in this category. These
liabilities are carried on the balance sheet at fair value with gains or losses recognized in the income statement.
Derivatives designated as hedging instruments in an effective hedge
Such derivatives are carried on the balance sheet at fair value, the treatment of gains and losses arising from revaluation are described below in the
accounting policy for Derivative financial instruments and hedging activities.
Financial liabilities measured at amortized cost
All other financial liabilities are initially recognized at fair value. For interest-bearing loans and borrowings this is the fair value of the proceeds received
net of issue costs associated with the borrowing.
After initial recognition, other financial liabilities are subsequently measured at amortized cost using the effective interest method. Amortized cost is
calculated by taking into account any issue costs, and any discount or premium on settlement. Gains and losses arising on the repurchase, settlement
or cancellation of liabilities are recognized respectively in interest and other revenues and finance costs.
This category of financial liabilities includes trade and other payables and finance debt.
Leases
Finance leases, which transfer to the group substantially all the risks and benefits incidental to ownership of the leased item, are capitalized at the
commencement of the lease term at the fair value of the leased property or, if lower, at the present value of the minimum lease payments. Finance
charges are allocated to each period so as to achieve a constant rate of interest on the remaining balance of the liability and are charged directly
against income.
Capitalized leased assets are depreciated over the shorter of the estimated useful life of the asset or the lease term.
Operating lease payments are recognized as an expense in the income statement on a straight-line basis over the lease term.
Derivative financial instruments and hedging activities
The group uses derivative financial instruments to manage certain exposures to fluctuations in foreign currency exchange rates, interest rates and
commodity prices as well as for trading purposes. Such derivative financial instruments are initially recognized at fair value on the date on which a
derivative contract is entered into and are subsequently remeasured at fair value. Derivatives are carried as assets when the fair value is positive and
as liabilities when the fair value is negative.
Contracts to buy or sell a non-financial item that can be settled net in cash or another financial instrument, or by exchanging financial instruments,
as if the contracts were financial instruments, with the exception of contracts that were entered into and continue to be held for the purpose of the
receipt or delivery of a non-financial item in accordance with the group’s expected purchase, sale or usage requirements, are accounted for as
financial instruments.
Gains or losses arising from changes in the fair value of derivatives that are not designated as effective hedging instruments are recognized in the
income statement.
For the purpose of hedge accounting, hedges are classified as:
– Fair value hedges when hedging the exposure to changes in the fair value of a recognized asset or liability.
– Cash flow hedges when hedging exposure to variability in cash flows that is either attributable to a particular risk associated with a recognized
asset or liability or a highly probable forecast transaction.
– Hedges of a net investment in a foreign operation.
Filename: U54368_doc8.3d Time: 14:49:56 Date: 25/02/08
Checksum: -1502084661
BP ANNUAL REPORT AND ACCOUNTS 2007 105
1 Significant accounting policies continued
At the inception of a hedge relationship the group formally designates and documents the hedge relationship for which the group wishes to claim
hedge accounting, together with the risk management objective and strategy for undertaking the hedge. The documentation includes identification of
the hedging instrument, the hedged item or transaction, the nature of the risk being hedged, and how the entity will assess the hedging instrument
effectiveness in offsetting the exposure to changes in the hedged item’s fair value or cash flows attributable to the hedged item. Such hedges are
expected at inception to be highly effective in achieving offsetting changes in fair value or cash flows.
Hedges meeting the criteria for hedge accounting are accounted for as follows:
Fair value hedges
The change in fair value of a hedging derivative is recognized in profit or loss. The change in the fair value of the hedged item attributable to the risk
being hedged is recorded as part of the carrying value of the hedged item and is also recognized in profit or loss.
The group applies fair value hedge accounting for hedging fixed interest rate risk on borrowings. The gain or loss relating to the effective portion
of the interest rate swap is recognized in the income statement within finance costs, offsetting the amortization of the interest on the underlying
borrowings.
If the criteria for hedge accounting are no longer met, or if the group revokes the designation, the adjustment to the carrying amount of a hedged
item for which the effective interest rate method is used is amortized to profit or loss over the period to maturity.
Cash flow hedges
For cash flow hedges, the effective portion of the gain or loss on the hedging instrument is recognized directly in equity, while the ineffective portion
is recognized in profit or loss. Amounts taken to equity are transferred to the income statement when the hedged transaction affects profit or loss.
The gain or loss relating to the effective portion of interest rate swaps hedging variable rate borrowings is recognized in the income statement within
finance costs.
Where the hedged item is the cost of a non-financial asset or liability, such as a forecast transaction for the purchase of property, plant and
equipment, the amounts taken to equity are transferred to the initial carrying amount of the non-financial asset or liability.
If the hedging instrument expires or is sold, terminated or exercised without replacement or rollover, or if its designation as a hedge is revoked,
amounts previously recognized in equity remain in equity until the forecast transaction occurs and are transferred to the income statement or to the
initial carrying amount of a non-financial asset or liability as above. If a forecast transaction is no longer expected to occur, amounts previously
recognized in equity are transferred to profit or loss.
Hedges of a net investment in a foreign operation
For hedges of a net investment in a foreign operation, the effective portion of the gain or loss on the hedging instrument is recognized directly in
equity, while the ineffective portion is recognized in profit or loss. Amounts taken to equity are transferred to the income statement when the foreign
operation is sold or partially disposed.
Embedded derivatives
Derivatives embedded in other financial instruments or other host contracts are treated as separate derivatives when their risks and characteristics
are not closely related to those of the host contract. Contracts are assessed for embedded derivatives when the group becomes a party to them,
including at the date of a business combination. Embedded derivatives are measured at fair value at each balance sheet date. Any gains or losses
arising from changes in fair value are taken directly to profit or loss.
Provisions and contingencies
Provisions are recognized when the group has a present obligation (legal or constructive) as a result of a past event, it is probable that an outflow of
resources embodying economic benefits will be required to settle the obligation and a reliable estimate can be made of the amount of the obligation.
Where appropriate, the future cash flow estimates are adjusted to reflect risks specific to the liability. Where the group expects some or all of a
provision to be reimbursed, for example, under an insurance contract, the reimbursement is recognized as a separate asset, but only when the
reimbursement is virtually certain. The expense relating to any provision is presented in the income statement net of any reimbursement.
If the effect of the time value of money is material, provisions are determined by discounting the expected future cash flows at a pre-tax rate that
reflects current market assessments of the time value of money. Where discounting is used, the increase in the provision due to the passage of time
is recognized as other finance expense.
A contingent liability is disclosed where the existence of an obligation will only be confirmed by future events or where the amount of the obligation
cannot be measured with reasonable reliability. Contingent assets are not recognized, but are disclosed where an inflow of economic benefits is
probable.
Environmental expenditures and liabilities
Environmental expenditures that relate to current or future revenues are expensed or capitalized as appropriate. Expenditures that relate to an existing
condition caused by past operations and do not contribute to current or future earnings are expensed.
Liabilities for environmental costs are recognized when environmental assessments or clean-ups are probable and the associated costs can be
reliably estimated. Generally, the timing of recognition of these provisions coincides with the commitment to a formal plan of action or, if earlier, on
divestment or on closure of inactive sites.
The amount recognized is the best estimate of the expenditure required. Where the liability will not be settled for a number of years, the amount
recognized is the present value of the estimated future expenditure.
Decommissioning
Liabilities for decommissioning costs are recognized when the group has an obligation to dismantle and remove a facility or an item of plant and to
restore the site on which it is located, and when a reliable estimate of that liability can be made. Where an obligation exists for a new facility, such as
oil and natural gas production or transportation facilities, this will be on construction or installation. An obligation for decommissioning may also
crystallize during the period of operation of a facility through a change in legislation or through a decision to terminate operations. The amount
recognized is the present value of the estimated future expenditure determined in accordance with local conditions and requirements.
Filename: U54368_doc8.3d Time: 14:49:56 Date: 25/02/08
Checksum: -1136049603
106
1 Significant accounting policies continued
A corresponding item of property, plant and equipment of an amount equivalent to the provision is also created. This is subsequently depreciated as
part of the asset.
Other than the unwinding discount on the provision, any change in the present value of the estimated expenditure is reflected as an adjustment to
the provision and the corresponding item of property, plant and equipment.
Employee benefits
Wages, salaries, bonuses, social security contributions, paid annual leave and sick leave are accrued in the period in which the associated services are
rendered by employees of the group. Deferred bonus arrangements that have a vesting date more than 12 months after the period end are valued on
an actuarial basis using the projected unit credit method and amortized on a straight-line basis over the service period until the award vests. The
accounting policy for pensions and other post-retirement benefits is described below.
Share-based payments
Equity-settled transactions
The cost of equity-settled transactions with employees is measured by reference to the fair value at the date at which equity instruments are granted
and is recognized as an expense over the vesting period, which ends on the date on which the relevant employees become fully entitled to the award.
Fair value is determined by using an appropriate valuation model. In valuing equity-settled transactions, no account is taken of any vesting conditions,
other than conditions linked to the price of the shares of the company (market conditions).
No expense is recognized for awards that do not ultimately vest, except for awards where vesting is conditional upon a market condition, which are
treated as vesting irrespective of whether or not the market condition is satisfied, provided that all other performance conditions are satisfied.
At each balance sheet date before vesting, the cumulative expense is calculated, representing the extent to which the vesting period has expired
and management’s best estimate of the achievement or otherwise of non-market conditions and the number of equity instruments that will ultimately
vest or, in the case of an instrument subject to a market condition, be treated as vesting as described above. The movement in cumulative expense
since the previous balance sheet date is recognized in the income statement, with a corresponding entry in equity.
Where the terms of an equity-settled award are modified or a new award is designated as replacing a cancelled or settled award, the cost based on
the original award terms continues to be recognized over the original vesting period. In addition, an expense is recognized over the remainder of the
new vesting period for the incremental fair value of any modification, based on the difference between the fair value of the original award and the fair
value of the modified award, both as measured on the date of the modification. No reduction is recognized if this difference is negative.
Where an equity-settled award is cancelled, it is treated as if it had vested on the date of cancellation and any cost not yet recognized in the income
statement for the award is expensed immediately. Any compensation paid up to the fair value of the award at the cancellation or settlement date is
deducted from equity, with any excess over fair value being treated as an expense in the income statement.
Cash-settled transactions
The cost of cash-settled transactions is measured at fair value using an appropriate option valuation model. Fair value is established initially at the grant
date and at each balance sheet date thereafter until the awards are settled. During the vesting period, a liability is recognized representing the product
of the fair value of the award and the portion of the vesting period expired as at the balance sheet date. From the end of the vesting period until
settlement, the liability represents the full fair value of the award as at the balance sheet date. Changes in the carrying amount of the liability are
recognized in profit or loss for the period.
Pensions and other post-retirement benefits
The cost of providing benefits under the defined benefit plans is determined separately for each plan using the projected unit credit method, which
attributes entitlement to benefits to the current period (to determine current service cost) and to the current and prior periods (to determine the
present value of defined benefit obligation). Past service costs are recognized immediately when the company becomes committed to a change in
pension plan design. When a settlement (eliminating all obligations for benefits already accrued) or a curtailment (reducing future obligations as a result
of a material reduction in the scheme membership or a reduction in future entitlement) occurs, the obligation and related plan assets are remeasured
using current actuarial assumptions and the resultant gain or loss is recognized in the income statement during the period in which the settlement or
curtailment occurs.
The interest element of the defined benefit cost represents the change in present value of scheme obligations resulting from the passage of time,
and is determined by applying the discount rate to the opening present value of the benefit obligation, taking into account material changes in the
obligation during the year. The expected return on plan assets is based on an assessment made at the beginning of the year of long-term market
returns on scheme assets, adjusted for the effect on the fair value of plan assets of contributions received and benefits paid during the year. The
difference between the expected return on plan assets and the interest cost is recognized in the income statement as other finance income or
expense.
Actuarial gains and losses are recognized in full in the group statement of recognized income and expense in the period in which they occur.
The defined benefit pension asset or liability in the balance sheet comprises the total for each plan of the present value of the defined benefit
obligation (using a discount rate based on high quality corporate bonds), less the fair value of plan assets out of which the obligations are to be settled
directly. Fair value is based on market price information and, in the case of quoted securities, is the published bid price.
Contributions to defined contribution schemes are recognized in the income statement in the period in which they become payable.
Corporate taxes
Income tax expense represents the sum of the tax currently payable and deferred tax. Interest and penalties relating to tax are also included in income
tax expense.
The tax currently payable is based on the taxable profits for the period. Taxable profit differs from net profit as reported in the income statement
because it excludes items of income or expense that are taxable or deductible in other periods and it further excludes items that are never taxable or
deductible. The group’s liability for current tax is calculated using tax rates that have been enacted or substantively enacted by the balance sheet date.
Any liability relating to unrecognized tax benefits is included in current tax payable on the group balance sheet.
Deferred tax is provided, using the liability method, on all temporary differences at the balance sheet date between the tax bases of assets and
liabilities and their carrying amounts for financial reporting purposes.
Filename: U54368_doc8.3d Time: 14:49:56 Date: 25/02/08
Checksum: 388421600
BP ANNUAL REPORT AND ACCOUNTS 2007 107
1 Significant accounting policies continued
Deferred tax liabilities are recognized for all taxable temporary differences:
– Except where the deferred tax liability arises on goodwill that is not tax deductible or the initial recognition of an asset or liability in a transaction that
is not a business combination and, at the time of the transaction, affects neither the accounting profit nor taxable profit or loss.
– In respect of taxable temporary differences associated with investments in subsidiaries, jointly controlled entities and associates, except where the
group is able to control the timing of the reversal of the temporary differences and it is probable that the temporary differences will not reverse in
the foreseeable future.
Deferred tax assets are recognized for all deductible temporary differences, carry-forward of unused tax assets and unused tax losses, to the extent
that it is probable that taxable profit will be available against which the deductible temporary differences and the carry-forward of unused tax assets
and unused tax losses can be utilized:
– Except where the deferred income tax asset relating to the deductible temporary difference arises from the initial recognition of an asset or liability
in a transaction that is not a business combination and, at the time of the transaction, affects neither the accounting profit nor taxable profit or loss.
– In respect of deductible temporary differences associated with investments in subsidiaries, jointly controlled entities and associates, deferred tax
assets are only recognized to the extent that it is probable that the temporary differences will reverse in the foreseeable future and taxable profit
will be available against which the temporary differences can be utilized.
The carrying amount of deferred income tax assets is reviewed at each balance sheet date and reduced to the extent that it is no longer probable
that sufficient taxable profit will be available to allow all or part of the deferred income tax asset to be utilized.
Deferred tax assets and liabilities are measured at the tax rates that are expected to apply to the year when the asset is realized or the liability is
settled, based on tax rates (and tax laws) that have been enacted or substantively enacted at the balance sheet date.
Tax relating to items recognized directly in equity is recognized in equity and not in the income statement.
Customs duties and sales taxes
Revenues, expenses and assets are recognized net of the amount of customs duties or sales tax except:
– Where the customs duty or sales tax incurred on a purchase of goods and services is not recoverable from the taxation authority, in which case the
customs duty or sales tax is recognized as part of the cost of acquisition of the asset or as part of the expense item as applicable.
– Receivables and payables are stated with the amount of customs duty or sales tax included.
The net amount of sales tax recoverable from, or payable to, the taxation authority is included as part of receivables or payables in the balance
sheet.
Own equity instruments
The group’s holding in its own equity instruments, including ordinary shares held by Employee Share Ownership Plans (ESOPs), are classified as
‘treasury shares’, and shown as deductions from shareholders’ equity at cost. Consideration received for the sale of such shares is also recognized in
equity, with any difference between the proceeds from sale and the original cost being taken to the profit and loss account reserve. No gain or loss is
recognized in the performance statements on the purchase, sale, issue or cancellation of equity shares.
Revenue
Revenue arising from the sale of goods is recognized when the significant risks and rewards of ownership have passed to the buyer and it can be
reliably measured.
Revenue is measured at the fair value of the consideration received or receivable and represents amounts receivable for goods provided in the
normal course of business, net of discounts, customs duties and sales taxes.
Revenues associated with the sale of oil, natural gas, natural gas liquids, liquefied natural gas, petroleum and chemicals products and all other items
are recognized when the title passes to the customer. Physical exchanges are reported net, as are sales and purchases made with a common
counterparty, as part of an arrangement similar to a physical exchange. Similarly, where the group acts as agent on behalf of a third party to procure or
market energy commodities, any associated fee income is recognized but no purchase or sale is recorded. Additionally, where forward sale and
purchase contracts for oil, natural gas or power have been determined to be for trading purposes, the associated sales and purchases are reported net
within sales and other operating revenues whether or not physical delivery has occurred.
Generally, revenues from the production of oil and natural gas properties in which the group has an interest with joint venture partners are
recognized on the basis of the group’s working interest in those properties (the entitlement method). Differences between the production sold and the
group’s share of production are not significant.
Interest income is recognized as the interest accrues (using the effective interest rate that is the rate that exactly discounts estimated future cash
receipts through the expected life of the financial instrument) to the net carrying amount of the financial asset.
Dividend income from investments is recognized when the shareholders’ right to receive the payment is established.
Research
Research costs are expensed as incurred.
Finance costs
Finance costs directly attributable to the acquisition, construction or production of qualifying assets, which are assets that necessarily take a
substantial period of time to get ready for their intended use, are added to the cost of those assets, until such time as the assets are substantially
ready for their intended use.
All other finance costs are recognized in the income statement in the period in which they are incurred.
Use of estimates
The preparation of financial statements requires management to make estimates and assumptions that affect the reported amounts of assets and
liabilities as well as the disclosure of contingent assets and liabilities at the balance sheet date and the reported amounts of revenues and expenses
during the reporting period. Actual outcomes could differ from those estimates.
Filename: U54368_doc8.3d Time: 14:49:57 Date: 25/02/08
Checksum: -358599465
108
1 Significant accounting policies continued
Impact of new International Financial Reporting Standards
Adopted for 2007
The following new IFRS, amendment to IFRS and IFRIC interpretations have been adopted by the group with effect from 1 January 2007.
IFRS 7 ‘Financial Instruments: Disclosures’ was issued in August 2005 and replaced the disclosure requirements previously contained in IAS 32
‘Financial Instruments: Presentation and Disclosure’. The group has disclosed in its annual report additional information about its financial instruments,
their significance and the nature and extent of risks to which they give rise. More specifically, the group has also made specified disclosures about
market risk, credit risk and liquidity risk. There was no effect on the group’s reported income or net assets as a result of adoption of this new
standard.
Also in August 2005, the IASB issued Amendment to IAS 1 ‘Presentation of Financial Statements’ – Capital Disclosures, which requires disclosures
of an entity’s objectives, policies and processes for managing capital, quantitative data about what the entity regards as capital, whether the entity has
complied with any capital requirements, and the consequences of any non-compliance. The group has included the required disclosures in its annual
report. There was no effect on the group’s reported income or net assets as a result of adoption of this amendment.
In addition, in 2007 BP has adopted IFRIC 10 ‘Interim Financial Reporting and Impairment’ and early adopted IFRIC 11 ‘IFRS 2 – Group and Treasury
Share Transactions’. There were no changes in the group’s accounting policies and no restatement of financial information consequent upon adoption
of these interpretations.
Not yet adopted
The following pronouncements from the IASB will become effective for future financial reporting periods and have not yet been adopted by the group.
IFRS 8 ‘Operating Segments’ was issued in October 2006 and defines operating segments as components of an entity about which separate
financial information is available and is evaluated regularly by the chief operating decision maker in deciding how to allocate resources and in assessing
performance. The new standard sets out the required disclosures for operating segments and is effective for annual periods beginning on or after
1 January 2009. BP has not yet completed its evaluation of the impact on its disclosures of adopting IFRS 8. There will be no effect on the group’s
reported income or net assets. IFRS 8 has been adopted by the EU.
In September 2007, the IASB issued Amendments to IAS 1 ‘Presentation of Financial Statements’ – A Revised Presentation, which requires
separate presentation of owner and non-owner changes in equity by introducing the statement of comprehensive income. The statement of
recognized income and expense will no longer be presented. Whenever there is a restatement or reclassification, an additional balance sheet, as at
the beginning of the earliest period presented, will be required to be published. The revised standard is effective for annual periods beginning on or
after 1 January 2009. There will be no effect on the group’s reported income or net assets. IAS 1 revised has not yet been adopted by the EU.
An amendment to IAS 23 ‘Borrowing Costs’ was issued by the IASB in March 2007 and eliminates the option of recognizing borrowing costs
immediately as an expense if they are directly attributable to the acquisition, construction or production of a qualifying asset. The amended standard is
effective for annual periods beginning on or after 1 January 2009. There will be no effect on the group’s reported income or net assets. This
amendment has not yet been adopted by the EU.
In January 2008, the IASB issued a revised version of IFRS 3 ‘Business Combinations’. The revised standard still requires the purchase method of
accounting to be applied to business combinations but will introduce some changes to existing accounting treatment. For example, contingent
consideration should be measured at fair value at the date of acquisition and subsequently remeasured to fair value with changes recognized in profit
or loss. Goodwill may be calculated based on the parent’s share of net assets or it may include goodwill related to the minority interest. All transaction
costs will be expensed. The standard is applicable to business combinations occurring in accounting periods beginning on or after 1 July 2009. Assets
and liabilities arising from business combinations occurring before the date of adoption by the group will not be restated and thus there will be no
effect on the group’s reported income or net assets on adoption. The revised standard has not yet been adopted by the EU.
Also in January 2008, the IASB issued an amended version of IAS 27 ‘Consolidated and Separate Financial Statements’. This requires the effects of
all transactions with non-controlling interests to be recorded in equity if there is no change in control. Such transactions will no longer result in goodwill
or gains or losses. When control is lost, any remaining interest in the entity is remeasured to fair value and a gain or loss recognized in profit or loss.
The amendments are effective for annual periods beginning on or after 1 July 2009 and are to be applied retrospectively, with certain exceptions. BP
has not yet completed its evaluation of the effect of adopting this amendment. The revised standard has not yet been adopted by the EU.
An amendment to IFRS 2 ‘Share-based Payment’ was issued in January 2008, clarifying that only service conditions and performance conditions are
vesting conditions, and other features of a share-based payment are not vesting conditions. In addition, it specifies that all cancellations, whether by
the entity or by other parties, should receive the same accounting treatment. The amendment is effective for annual periods beginning on or after
1 January 2009 and has not yet been adopted by the EU. BP has not yet completed its evaluation of the effect of adopting this amendment.
In February 2008, the IASB issued Amendments to IAS 32 ‘Financial Instruments: Presentation’ and IAS 1 ‘Presentation of Financial Statements’ –
Puttable Financial Instruments and Obligations Arising on Liquidation. The amended standards require entities to classify as equity certain financial
instruments provided certain criteria are met. The instruments to be classified as equity are puttable financial instruments and those instruments that
impose an obligation on the entity to deliver to another party a pro rata share of the net assets of the entity only on liquidation. The amendments are
effective for annual periods beginning on or after 1 January 2009 and have not yet been adopted by the EU. BP has not yet completed its evaluation of
the effect of adopting these amendments.
Three IFRIC interpretations have been issued but are not yet effective and have not yet been adopted by the EU.
IFRIC 12 ‘Service Concession Arrangements’ gives guidance on the accounting by operators for public-to-private service concession arrangements.
The directors do not anticipate that the adoption of this interpretation will have a material effect on the reported income or net assets of the group. We
plan to adopt this interpretation with effect from 1 January 2008.
IFRIC 13 ‘Customer Loyalty Programmes’ addresses the accounting by entities that grant loyalty award credits (e.g. ‘points’ or travel miles) to
customers who buy other goods or services. The directors do not anticipate that the adoption of this interpretation will have a material effect on the
reported income or net assets of the group. We plan to adopt this interpretation with effect from 1 January 2009.
IFRIC 14 ‘IAS 19 – The Limit on a Defined Benefit Asset, Minimum Funding Requirements, and their Interaction’ provides clarification regarding how
to determine whether a surplus may be recognized on the balance sheet in relation to a retirement benefit plan. The directors do not anticipate that
the adoption of this interpretation will have a material effect on the reported income or net assets of the group. We plan to adopt this interpretation
with effect from 1 January 2008.

Filename: U54368_doc8.3d Time: 14:49:57 Date: 25/02/08
Checksum: 938348990
BP ANNUAL REPORT AND ACCOUNTS 2007 109
2 Acquisitions
Acquisitions in 2007
BP made a number of acquisitions in 2007 for a total consideration of $1,200 million. These business combinations were predominantly in the Refining
and Marketing segment, the most significant of which was the acquisition of Chevron’s Netherlands manufacturing company, Texaco Raffiniderij
Pernis B.V. The acquisition included Chevron’s 31% minority shareholding in Nerefco, its 31% shareholding in the 22.5 megawatt wind farm co-
located at the refinery as well as a 22.8% shareholding in the TEAM joint venture terminal and shareholdings in two local pipelines linking the TEAM
terminal to the refinery. Fair value adjustments were made to the acquired assets and liabilities. Goodwill of $270 million arose on these acquisitions.
Acquisitions in 2006
BP made a number of acquisitions in 2006 for a total consideration of $256 million. All these business combinations were in the Gas, Power and
Renewables segment. Fair value adjustments were made to the acquired assets and liabilities and goodwill of $64 million arose on these acquisitions.
Acquisitions in 2005
BP made a number of acquisitions in 2005 for a total consideration of $84 million. No significant fair value adjustments were made to the acquired
assets and liabilities. Goodwill of $27 million arose on these acquisitions. Also in 2005, additional goodwill of $59 million was recognized relating to the
2004 acquisition from Solvay of the remaining interests in two equity-accounted entities. This goodwill arose due to final closing adjustments and
selling costs and was written off.
Filename: U54368_doc8.3d Time: 14:49:57 Date: 25/02/08
Checksum: -1986108007
110
3 Non-current assets held for sale and discontinued operations
Non-current assets held for sale
On 5 December 2007, BP announced it had signed a memorandum of understanding with Husky Energy Inc. to form an integrated North American oil
sands business. BP will contribute its Toledo refinery to a US joint venture in return for Husky contributing its Sunrise field to a Canadian joint venture.
The transaction is expected to be completed by the end of March 2008. At 31 December 2007, certain Toledo refinery assets and associated liabilities
were classified as a disposal group held for sale. No impairment loss has been recognized in relation to this disposal group.
On 27 June 2006, BP announced its intention to sell the Coryton refinery in the UK, following a review of its European refinery portfolio, that
concluded that the group would optimize its value by focusing on a smaller, but more advantaged, refining portfolio in Europe. In addition, given the
integrated nature of the operations, the bitumen business in the UK was also included with the divestment, along with the Coryton bulk terminal
(together ‘the Coryton disposal group’).
At 31 December 2006, negotiations for the sale were in progress and the assets and associated liabilities were classified as a disposal group held
for sale. No impairment loss was recognized at the time of reclassification of the Coryton disposal group as held for sale nor at 31 December 2006.
The major classes of assets and liabilities of the Toledo and Coryton disposal groups, both reported within the Refining and Marketing segment,
classified as held for sale at 31 December 2007 and 2006 respectively, are set out below.
$ million--------------------------------------------------------------------------------------------------------------------------------------------------------------------------------------------------------------------------------------------------------------------------------------------------------
2007 2006--------------------------------------------------------------------------------------------------------------------------------------------------------------------------------------------------------------------------------------------------------------------------------------------------------
Assets
Property, plant and equipment 635 564
Goodwill 90 60
Inventories 561 454--------------------------------------------------------------------------------------------------------------------------------------------------------------------------------------------------------------------------------------------------------------------------------------------------------
Assets classified as held for sale 1,286 1,078--------------------------------------------------------------------------------------------------------------------------------------------------------------------------------------------------------------------------------------------------------------------------------------------------------
Liabilities
Current liabilities 163 54--------------------------------------------------------------------------------------------------------------------------------------------------------------------------------------------------------------------------------------------------------------------------------------------------------
Liabilities directly associated with assets classified as held for sale 163 54
In addition, accumulated foreign exchange gains recognized directly in equity relating to the Coryton disposal group amounted to $122 million at
31 December 2006. On disposal such foreign exchange differences were recycled to the income statement. The disposal of the Coryton disposal
group was completed in May 2007. For further information see Note 4.
Discontinued operations
The sale of Innovene, BP’s olefins, derivatives and refining group, to INEOS was completed on 16 December 2005.
The Innovene operations represented a separate major line of business for BP. As a result of the sale, these operations were treated as
discontinued operations for the year ended 31 December 2005. A single amount was shown on the face of the income statement comprising the
post-tax result of discontinued operations and the post-tax loss recognized on the remeasurement to fair value less costs to sell and on disposal of the
discontinued operation. That is, the income and expenses of Innovene are reported separately from the continuing operations of the BP group. The
table below provides further detail of the amount shown in the income statement.
In the cash flow statement, the cash provided by the operating activities of Innovene was separated from that of the rest of the group and reported
as a single line item.
Gross proceeds received amounted to $8,477 million. In 2005, there were selling costs of $120 million and initial closing adjustments of $43 million.
In 2006, there was a final closing adjustment of $34 million. The remeasurement to fair value less costs to sell resulted in a loss of $775 million before
tax ($184 million recognized in 2006 and $591 million in 2005).
Financial information for the Innovene operations after group eliminations is presented below.
$ million--------------------------------------------------------------------------------------------------------------------------------------------------------------------------------------------------------------------------------------------------------------------------------------------------------
2007 2006 2005--------------------------------------------------------------------------------------------------------------------------------------------------------------------------------------------------------------------------------------------------------------------------------------------------------
Total revenues and other income – – 12,441
Expenses – – 11,709--------------------------------------------------------------------------------------------------------------------------------------------------------------------------------------------------------------------------------------------------------------------------------------------------------
Profit (loss) before interest and taxation – – 732
Other finance income (expense) – –--------------------------------------------------------------------------------------------------------------------------------------------------------------------------------------------------------------------------------------------------------------------------------------------------------
Profit (loss) before taxation and loss recognized on remeasurement to fair value less costs to sell and on disposal – – 735
Loss recognized on the remeasurement to fair value less costs to sell and on disposal – (184) (591)--------------------------------------------------------------------------------------------------------------------------------------------------------------------------------------------------------------------------------------------------------------------------------------------------------
Profit (loss) before taxation from Innovene operations – (184) 144
Tax (charge) credit
on profit (loss) before loss recognized on remeasurement to fair value less costs to sell and on disposal – 166 (306)
on loss recognized on the remeasurement to fair value less costs to sell and on disposal – (7) 346--------------------------------------------------------------------------------------------------------------------------------------------------------------------------------------------------------------------------------------------------------------------------------------------------------
Profit (loss) from Innovene operations – (25) 184
Earnings (loss) per share from Innovene operations – cents
Basic – (0.13) 0.87
Diluted – (0.12) 0.86
The cash flows of Innovene operations are presented below
Net cash provided by operating activities – – 970
Net cash used in investing activities – – (524)
Net cash used in financing activities – – (446)
Further information is contained in Note 4.
3
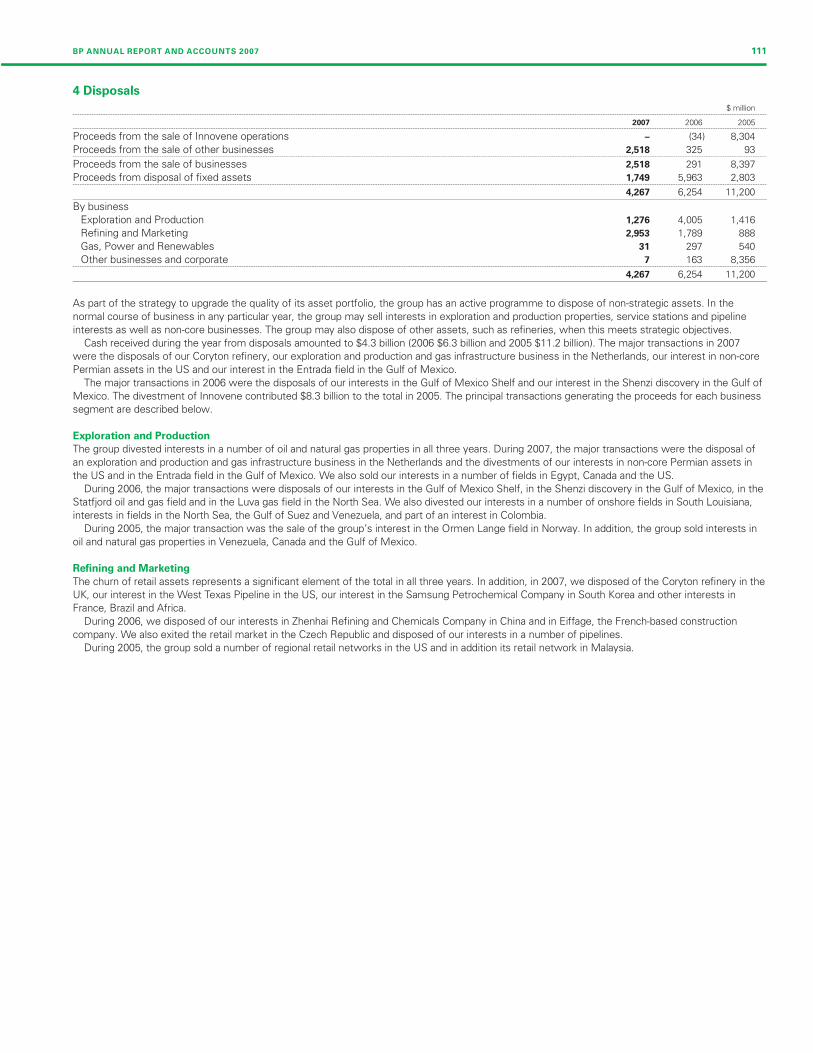
Filename: U54368_doc8.3d Time: 14:49:57 Date: 25/02/08
Checksum: -824124139
BP ANNUAL REPORT AND ACCOUNTS 2007 111
4 Disposals
$ million--------------------------------------------------------------------------------------------------------------------------------------------------------------------------------------------------------------------------------------------------------------------------------------------------------
2007 2006 2005--------------------------------------------------------------------------------------------------------------------------------------------------------------------------------------------------------------------------------------------------------------------------------------------------------
Proceeds from the sale of Innovene operations – (34) 8,304
Proceeds from the sale of other businesses 2,518 325 93--------------------------------------------------------------------------------------------------------------------------------------------------------------------------------------------------------------------------------------------------------------------------------------------------------
Proceeds from the sale of businesses 2,518 291 8,397
Proceeds from disposal of fixed assets 1,749 5,963 2,803--------------------------------------------------------------------------------------------------------------------------------------------------------------------------------------------------------------------------------------------------------------------------------------------------------
4,267 6,254 11,200
By business
Exploration and Production 1,276 4,005 1,416
Refining and Marketing 2,953 1,789 888
Gas, Power and Renewables 31 297 540
Other businesses and corporate 7 163 8,356--------------------------------------------------------------------------------------------------------------------------------------------------------------------------------------------------------------------------------------------------------------------------------------------------------
4,267 6,254 11,200
As part of the strategy to upgrade the quality of its asset portfolio, the group has an active programme to dispose of non-strategic assets. In the
normal course of business in any particular year, the group may sell interests in exploration and production properties, service stations and pipeline
interests as well as non-core businesses. The group may also dispose of other assets, such as refineries, when this meets strategic objectives.
Cash received during the year from disposals amounted to $4.3 billion (2006 $6.3 billion and 2005 $11.2 billion). The major transactions in 2007
were the disposals of our Coryton refinery, our exploration and production and gas infrastructure business in the Netherlands, our interest in non-core
Permian assets in the US and our interest in the Entrada field in the Gulf of Mexico.
The major transactions in 2006 were the disposals of our interests in the Gulf of Mexico Shelf and our interest in the Shenzi discovery in the Gulf of
Mexico. The divestment of Innovene contributed $8.3 billion to the total in 2005. The principal transactions generating the proceeds for each business
segment are described below.
Exploration and Production
The group divested interests in a number of oil and natural gas properties in all three years. During 2007, the major transactions were the disposal of
an exploration and production and gas infrastructure business in the Netherlands and the divestments of our interests in non-core Permian assets in
the US and in the Entrada field in the Gulf of Mexico. We also sold our interests in a number of fields in Egypt, Canada and the US.
During 2006, the major transactions were disposals of our interests in the Gulf of Mexico Shelf, in the Shenzi discovery in the Gulf of Mexico, in the
Statfjord oil and gas field and in the Luva gas field in the North Sea. We also divested our interests in a number of onshore fields in South Louisiana,
interests in fields in the North Sea, the Gulf of Suez and Venezuela, and part of an interest in Colombia.
During 2005, the major transaction was the sale of the group’s interest in the Ormen Lange field in Norway. In addition, the group sold interests in
oil and natural gas properties in Venezuela, Canada and the Gulf of Mexico.
Refining and Marketing
The churn of retail assets represents a significant element of the total in all three years. In addition, in 2007, we disposed of the Coryton refinery in the
UK, our interest in the West Texas Pipeline in the US, our interest in the Samsung Petrochemical Company in South Korea and other interests in
France, Brazil and Africa.
During 2006, we disposed of our interests in Zhenhai Refining and Chemicals Company in China and in Eiffage, the French-based construction
company. We also exited the retail market in the Czech Republic and disposed of our interests in a number of pipelines.
During 2005, the group sold a number of regional retail networks in the US and in addition its retail network in Malaysia.
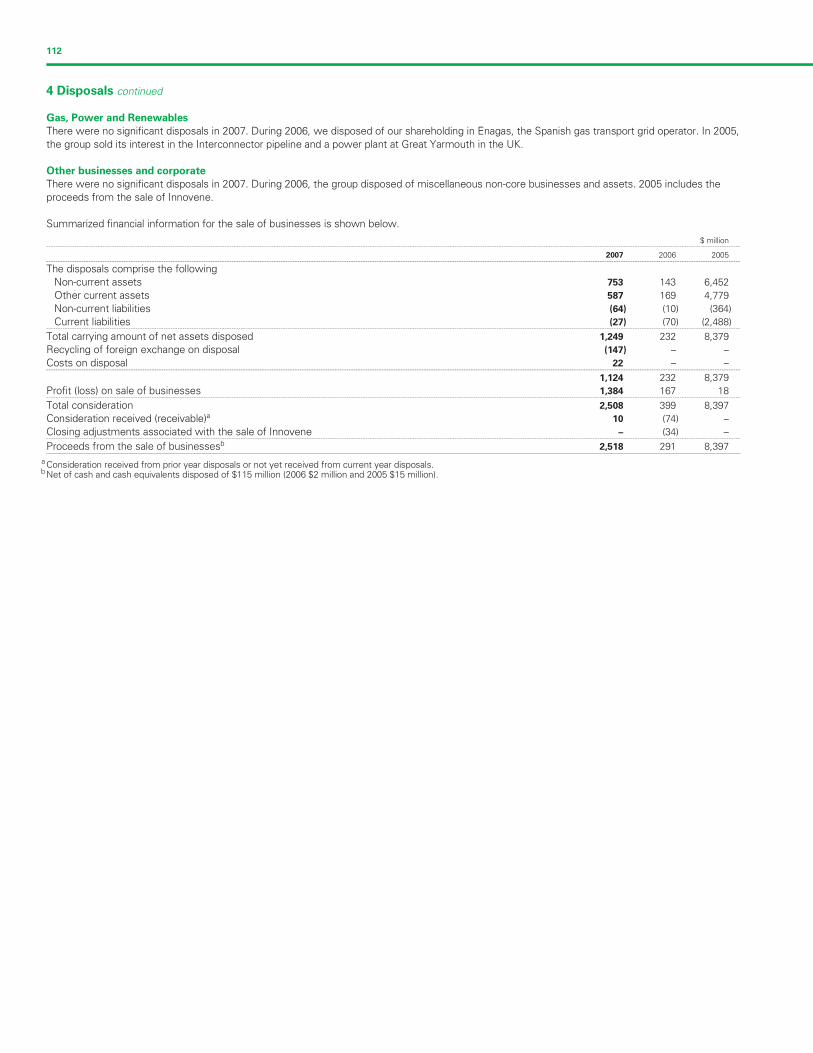
Filename: U54368_doc8.3d Time: 14:49:57 Date: 25/02/08
Checksum: 1512759619
112
4 Disposals continued
Gas, Power and Renewables
There were no significant disposals in 2007. During 2006, we disposed of our shareholding in Enagas, the Spanish gas transport grid operator. In 2005,
the group sold its interest in the Interconnector pipeline and a power plant at Great Yarmouth in the UK.
Other businesses and corporate
There were no significant disposals in 2007. During 2006, the group disposed of miscellaneous non-core businesses and assets. 2005 includes the
proceeds from the sale of Innovene.
Summarized financial information for the sale of businesses is shown below.
$ million--------------------------------------------------------------------------------------------------------------------------------------------------------------------------------------------------------------------------------------------------------------------------------------------------------
2007 2006 2005--------------------------------------------------------------------------------------------------------------------------------------------------------------------------------------------------------------------------------------------------------------------------------------------------------
The disposals comprise the following
Non-current assets 753 143 6,452
Other current assets 587 169 4,779
Non-current liabilities (64) (10) (364)
Current liabilities (27) (70) (2,488)--------------------------------------------------------------------------------------------------------------------------------------------------------------------------------------------------------------------------------------------------------------------------------------------------------
Total carrying amount of net assets disposed 1,249 232 8,379
Recycling of foreign exchange on disposal (147) –
Costs on disposal 22 –--------------------------------------------------------------------------------------------------------------------------------------------------------------------------------------------------------------------------------------------------------------------------------------------------------
1,124 232 8,379
Profit (loss) on sale of businesses 1,384 167 18--------------------------------------------------------------------------------------------------------------------------------------------------------------------------------------------------------------------------------------------------------------------------------------------------------
Total consideration 2,508 399 8,397
Consideration received (receivable)a 10 (74) –
Closing adjustments associated with the sale of Innovene – (34) –--------------------------------------------------------------------------------------------------------------------------------------------------------------------------------------------------------------------------------------------------------------------------------------------------------
Proceeds from the sale of businessesb 2,518 291 8,397
a Consideration received from prior year disposals or not yet received from current year disposals.b Net of cash and cash equivalents disposed of $115 million (2006 $2 million and 2005 $15 million).
–
–
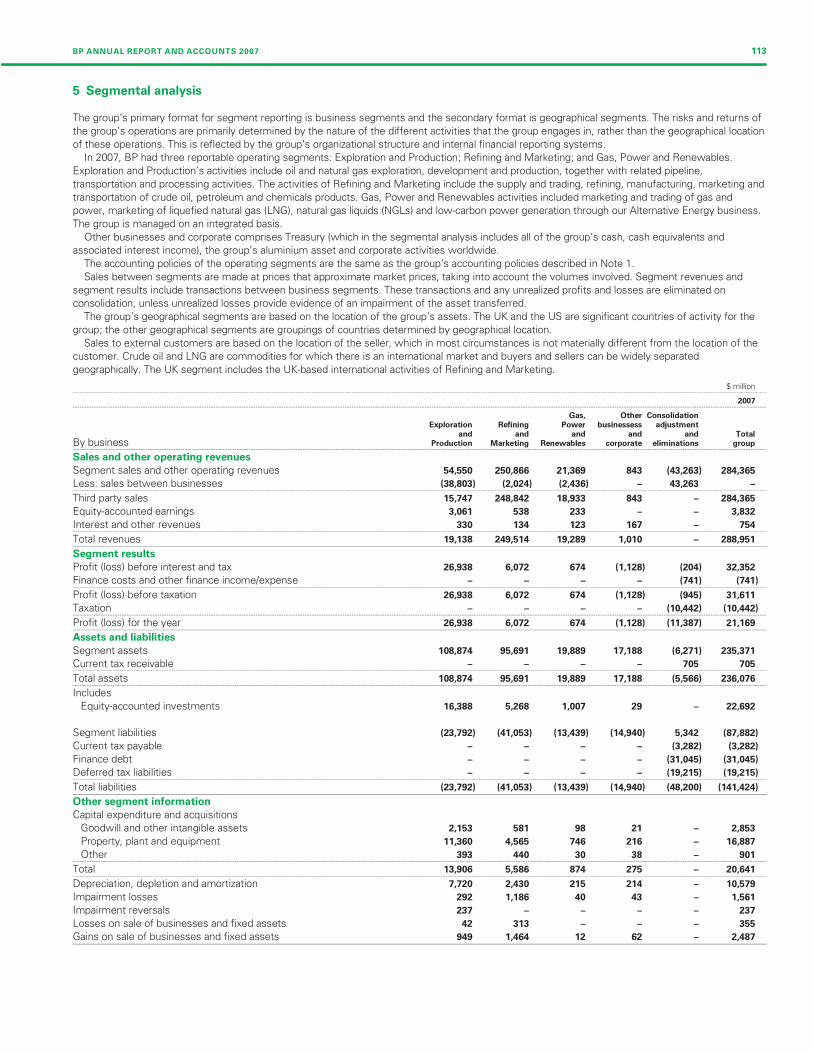
Filename: U54368_doc8.3d Time: 14:49:57 Date: 25/02/08
Checksum: 2102010583
BP ANNUAL REPORT AND ACCOUNTS 2007 113
5 Segmental analysis
The group’s primary format for segment reporting is business segments and the secondary format is geographical segments. The risks and returns of
the group’s operations are primarily determined by the nature of the different activities that the group engages in, rather than the geographical location
of these operations. This is reflected by the group’s organizational structure and internal financial reporting systems.
In 2007, BP had three reportable operating segments: Exploration and Production; Refining and Marketing; and Gas, Power and Renewables.
Exploration and Production’s activities include oil and natural gas exploration, development and production, together with related pipeline,
transportation and processing activities. The activities of Refining and Marketing include the supply and trading, refining, manufacturing, marketing and
transportation of crude oil, petroleum and chemicals products. Gas, Power and Renewables activities included marketing and trading of gas and
power, marketing of liquefied natural gas (LNG), natural gas liquids (NGLs) and low-carbon power generation through our Alternative Energy business.
The group is managed on an integrated basis.
Other businesses and corporate comprises Treasury (which in the segmental analysis includes all of the group’s cash, cash equivalents and
associated interest income), the group’s aluminium asset and corporate activities worldwide.
The accounting policies of the operating segments are the same as the group’s accounting policies described in Note 1.
Sales between segments are made at prices that approximate market prices, taking into account the volumes involved. Segment revenues and
segment results include transactions between business segments. These transactions and any unrealized profits and losses are eliminated on
consolidation, unless unrealized losses provide evidence of an impairment of the asset transferred.
The group’s geographical segments are based on the location of the group’s assets. The UK and the US are significant countries of activity for the
group; the other geographical segments are groupings of countries determined by geographical location.
Sales to external customers are based on the location of the seller, which in most circumstances is not materially different from the location of the
customer. Crude oil and LNG are commodities for which there is an international market and buyers and sellers can be widely separated
geographically. The UK segment includes the UK-based international activities of Refining and Marketing.
$ million--------------------------------------------------------------------------------------------------------------------------------------------------------------------------------------------------------------------------------------------------------------------------------------------------------
2007--------------------------------------------------------------------------------------------------------------------------------------------------------------------------------------------------------------------------------------------------------------------------------------------------------
Gas, Other Consolidation
Exploration Refining Power businessess adjustment
and and and and and Total
By business Production Marketing Renewables corporate eliminations group--------------------------------------------------------------------------------------------------------------------------------------------------------------------------------------------------------------------------------------------------------------------------------------------------------
Sales and other operating revenues
Segment sales and other operating revenues 54,550 250,866 21,369 843 (43,263) 284,365
Less: sales between businesses (38,803) (2,024) (2,436) – 43,263 –--------------------------------------------------------------------------------------------------------------------------------------------------------------------------------------------------------------------------------------------------------------------------------------------------------
Third party sales 15,747 248,842 18,933 843 – 284,365
Equity-accounted earnings 3,061 538 233 – – 3,832
Interest and other revenues 330 134 123 167 – 754--------------------------------------------------------------------------------------------------------------------------------------------------------------------------------------------------------------------------------------------------------------------------------------------------------
Total revenues 19,138 249,514 19,289 1,010 – 288,951
Segment results
Profit (loss) before interest and tax 26,938 6,072 674 (1,128) (204) 32,352
Finance costs and other finance income/expense – – – – (741)--------------------------------------------------------------------------------------------------------------------------------------------------------------------------------------------------------------------------------------------------------------------------------------------------------
Profit (loss) before taxation 26,938 6,072 674 (1,128) (945) 31,611
Taxation – – – – (10,442) (10--------------------------------------------------------------------------------------------------------------------------------------------------------------------------------------------------------------------------------------------------------------------------------------------------------
Profit (loss) for the year 26,938 6,072 674 (1,128) (11,387) 21,169
Assets and liabilities
Segment assets 108,874 95,691 19,889 17,188 (6,271) 235,371
Current tax receivable – – – – 705--------------------------------------------------------------------------------------------------------------------------------------------------------------------------------------------------------------------------------------------------------------------------------------------------------
Total assets 108,874 95,691 19,889 17,188 (5,566) 236,076--------------------------------------------------------------------------------------------------------------------------------------------------------------------------------------------------------------------------------------------------------------------------------------------------------
Includes
Equity-accounted investments 16,388 5,268 1,007 29 – 22,692
Segment liabilities (23,792) (41,053) (13,439) (14,940) 5,342 (87,882)
Current tax payable – – – – (3,282) (3
Finance debt – – – – (31,045) (31
Deferred tax liabilities – – – – (19,215) (19--------------------------------------------------------------------------------------------------------------------------------------------------------------------------------------------------------------------------------------------------------------------------------------------------------
Total liabilities (23,792) (41,053) (13,439) (14,940) (48,200) (141,424)
Other segment information
Capital expenditure and acquisitions
Goodwill and other intangible assets 2,153 581 98 21 – 2,853
Property, plant and equipment 11,360 4,565 746 216 – 16,887
Other 393 440 30 38 – 901--------------------------------------------------------------------------------------------------------------------------------------------------------------------------------------------------------------------------------------------------------------------------------------------------------
Total 13,906 5,586 874 275 – 20,641--------------------------------------------------------------------------------------------------------------------------------------------------------------------------------------------------------------------------------------------------------------------------------------------------------
Depreciation, depletion and amortization 7,720 2,430 215 214 – 10,579
Impairment losses 292 1,186 40 43 – 1,561
Impairment reversals 237 – – – –
Losses on sale of businesses and fixed assets 42 313 – – – 355
Gains on sale of businesses and fixed assets 949 1,464 12 62 – 2,487
(741)
,442)
705
,282)
,045)
,215)
237
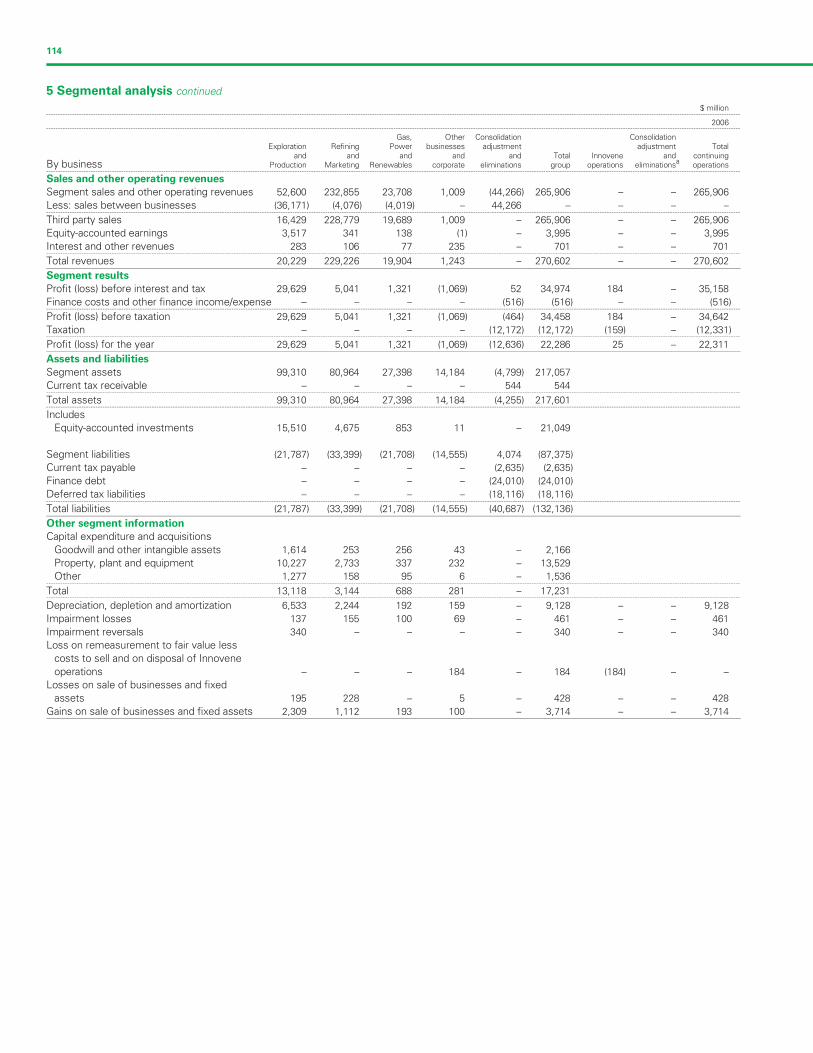
Filename: U54368_doc8.3d Time: 14:49:58 Date: 25/02/08
Checksum: -749179048
114
–
5 Segmental analysis continued
$ million--------------------------------------------------------------------------------------------------------------------------------------------------------------------------------------------------------------------------------------------------------------------------------------------------------
2006--------------------------------------------------------------------------------------------------------------------------------------------------------------------------------------------------------------------------------------------------------------------------------------------------------
Gas, Other Consolidation ConsolidationExploration Refining Power businesses adjustment adjustment Total
and and and and and Total Innovene and continuingBy business aProduction Marketing Renewables corporate eliminations group operations eliminations operations--------------------------------------------------------------------------------------------------------------------------------------------------------------------------------------------------------------------------------------------------------------------------------------------------------
Sales and other operating revenues
Segment sales and other operating revenues 52,600 232,855 23,708 1,009 (44,266) 265,906 – – 265,906
Less: sales between businesses (36,171) (4,076) (4,019) – 44,266 – – –--------------------------------------------------------------------------------------------------------------------------------------------------------------------------------------------------------------------------------------------------------------------------------------------------------
Third party sales 16,429 228,779 19,689 1,009 – 265,906 – – 265,906
Equity-accounted earnings 3,517 341 138 (1) – 3,995 – – 3,995
Interest and other revenues 283 106 77 235 – 701 – – 701--------------------------------------------------------------------------------------------------------------------------------------------------------------------------------------------------------------------------------------------------------------------------------------------------------
Total revenues 20,229 229,226 19,904 1,243 – 270,602 – – 270,602
Segment results
Profit (loss) before interest and tax 29,629 5,041 1,321 (1,069) 52 34,974 184 – 35,158
Finance costs and other finance income/expense – – – – (516) (516) – – (516)--------------------------------------------------------------------------------------------------------------------------------------------------------------------------------------------------------------------------------------------------------------------------------------------------------
Profit (loss) before taxation 29,629 5,041 1,321 (1,069) (464) 34,458 184 – 34,642
Taxation – – – – (12,172) (12,172) (159) – (12,33--------------------------------------------------------------------------------------------------------------------------------------------------------------------------------------------------------------------------------------------------------------------------------------------------------
Profit (loss) for the year 29,629 5,041 1,321 (1,069) (12,636) 22,286 25 – 22,311
Assets and liabilities
Segment assets 99,310 80,964 27,398 14,184 (4,799) 217,057
Current tax receivable – – – – 544 544--------------------------------------------------------------------------------------------------------------------------------------------------------------------------------------------------------------------------------------------------------------------------------------------------------
Total assets 99,310 80,964 27,398 14,184 (4,255) 217,601--------------------------------------------------------------------------------------------------------------------------------------------------------------------------------------------------------------------------------------------------------------------------------------------------------
Includes
Equity-accounted investments 15,510 4,675 853 11 – 21,049
Segment liabilities (21,787) (33,399) (21,708) (14,555) 4,074 (87,375)
Current tax payable – – – – (2,635) (2,635)
Finance debt – – – – (24,010) (24,010)
Deferred tax liabilities – – – – (18,116) (18,116)--------------------------------------------------------------------------------------------------------------------------------------------------------------------------------------------------------------------------------------------------------------------------------------------------------
Total liabilities (21,787) (33,399) (21,708) (14,555) (40,687) (132,136)
Other segment information
Capital expenditure and acquisitions
Goodwill and other intangible assets 1,614 253 256 43 – 2,166
Property, plant and equipment 10,227 2,733 337 232 – 13,529
Other 1,277 158 95 6 – 1,536--------------------------------------------------------------------------------------------------------------------------------------------------------------------------------------------------------------------------------------------------------------------------------------------------------
Total 13,118 3,144 688 281 – 17,231--------------------------------------------------------------------------------------------------------------------------------------------------------------------------------------------------------------------------------------------------------------------------------------------------------
Depreciation, depletion and amortization 6,533 2,244 192 159 – 9,128 – – 9,128
Impairment losses 137 155 100 69 – 461 – – 461
Impairment reversals 340 – – – – 340 – – 34
Loss on remeasurement to fair value less
costs to sell and on disposal of Innovene
operations – – – 184 – 184 (184) – –
Losses on sale of businesses and fixed
assets 195 228 – 5 – 428 – – 428
Gains on sale of businesses and fixed assets 2,309 1,112 193 100 – 3,714 – – 3,714
1)
0
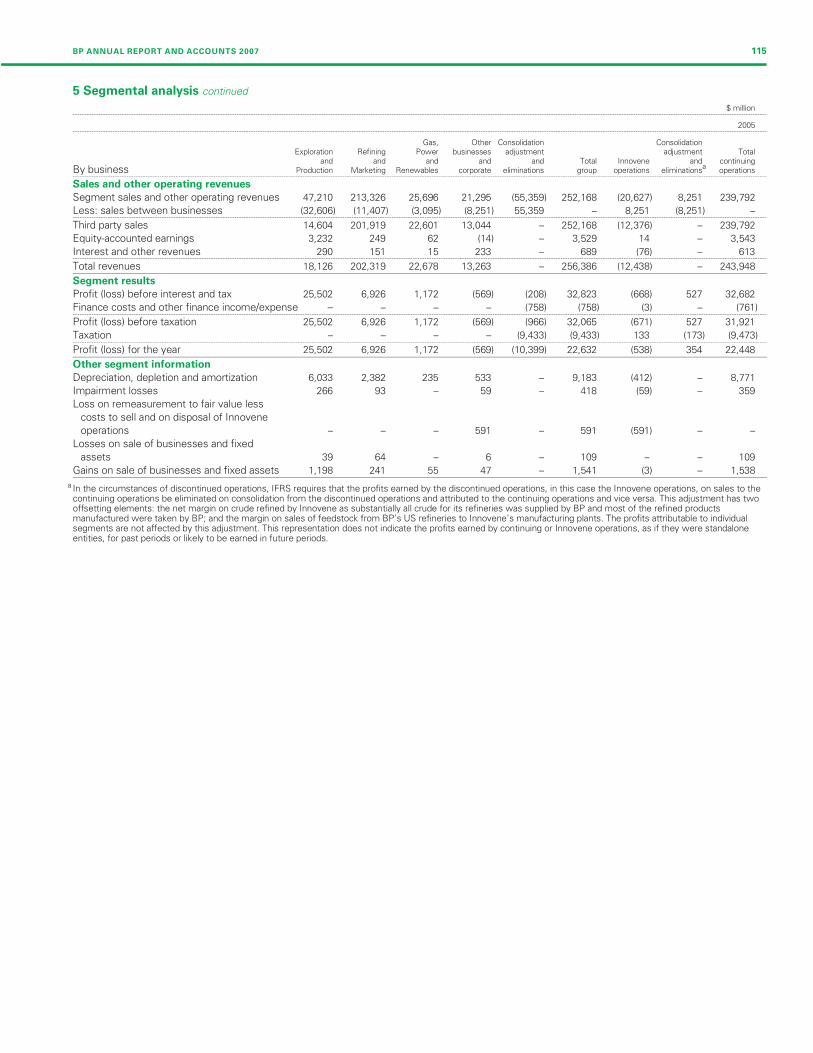
Filename: U54368_doc8.3d Time: 14:49:58 Date: 25/02/08
Checksum: 425573424
BP ANNUAL REPORT AND ACCOUNTS 2007 115
5 Segmental analysis continued
$ million--------------------------------------------------------------------------------------------------------------------------------------------------------------------------------------------------------------------------------------------------------------------------------------------------------
2005--------------------------------------------------------------------------------------------------------------------------------------------------------------------------------------------------------------------------------------------------------------------------------------------------------
Gas, Other Consolidation ConsolidationExploration Refining Power businesses adjustment adjustment Total
and and and and and Total Innovene and continuingBy business a
Production Marketing Renewables corporate eliminations group operations eliminations operations--------------------------------------------------------------------------------------------------------------------------------------------------------------------------------------------------------------------------------------------------------------------------------------------------------
Sales and other operating revenues
Segment sales and other operating revenues 47,210 213,326 25,696 21,295 (55,359) 252,168 (20,627) 8,251 239,792
Less: sales between businesses (32,606) (11,407) (3,095) (8,251) 55,359 – 8,251 (8,251) –--------------------------------------------------------------------------------------------------------------------------------------------------------------------------------------------------------------------------------------------------------------------------------------------------------
Third party sales 14,604 201,919 22,601 13,044 – 252,168 (12,376) – 239,792
Equity-accounted earnings 3,232 249 62 (14) – 3,529 14 – 3,543
Interest and other revenues 290 151 15 233 – 689 (76) – 613--------------------------------------------------------------------------------------------------------------------------------------------------------------------------------------------------------------------------------------------------------------------------------------------------------
Total revenues 18,126 202,319 22,678 13,263 – 256,386 (12,438) – 243,948
Segment results
Profit (loss) before interest and tax 25,502 6,926 1,172 (569) (208) 32,823 (668) 527 32,682
Finance costs and other finance income/expense – – – – (758) (758) (3) – (761)--------------------------------------------------------------------------------------------------------------------------------------------------------------------------------------------------------------------------------------------------------------------------------------------------------
Profit (loss) before taxation 25,502 6,926 1,172 (569) (966) 32,065 (671) 527 31,921
Taxation – – – – (9,433) (9,433) 133 (173) (9,4--------------------------------------------------------------------------------------------------------------------------------------------------------------------------------------------------------------------------------------------------------------------------------------------------------
Profit (loss) for the year 25,502 6,926 1,172 (569) (10,399) 22,632 (538) 354 22,448
Other segment information
Depreciation, depletion and amortization 6,033 2,382 235 533 – 9,183 (412) – 8,771
Impairment losses 266 93 – 59 – 418 (59) – 359
Loss on remeasurement to fair value less
costs to sell and on disposal of Innovene
operations – – – 591 – 591 (591) – –
Losses on sale of businesses and fixed
assets 39 64 – 6 – 109 – – 109
Gains on sale of businesses and fixed assets 1,198 241 55 47 – 1,541 (3) – 1,538
a In the circumstances of discontinued operations, IFRS requires that the profits earned by the discontinued operations, in this case the Innovene operations, on sales to thecontinuing operations be eliminated on consolidation from the discontinued operations and attributed to the continuing operations and vice versa. This adjustment has twooffsetting elements: the net margin on crude refined by Innovene as substantially all crude for its refineries was supplied by BP and most of the refined productsmanufactured were taken by BP; and the margin on sales of feedstock from BP’s US refineries to Innovene’s manufacturing plants. The profits attributable to individualsegments are not affected by this adjustment. This representation does not indicate the profits earned by continuing or Innovene operations, as if they were standaloneentities, for past periods or likely to be earned in future periods.
73)
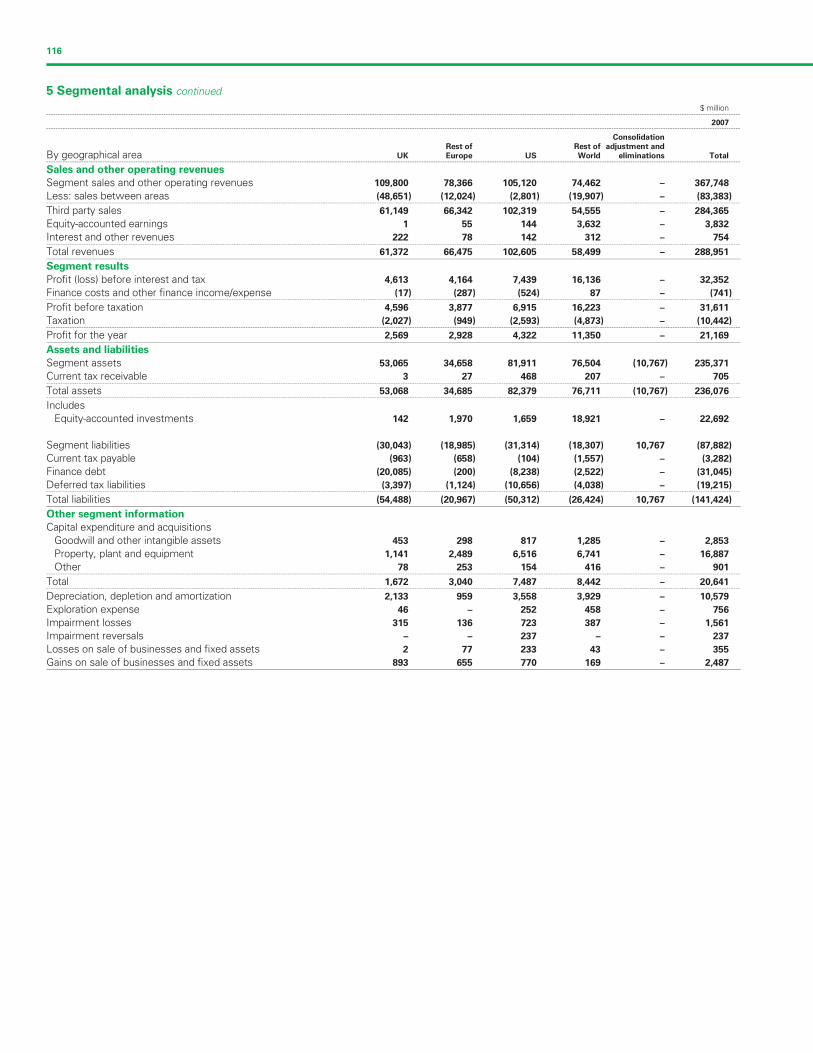
Filename: U54368_doc8.3d Time: 14:49:58 Date: 25/02/08
Checksum: -753722551
116
5 Segmental analysis continued
$ million--------------------------------------------------------------------------------------------------------------------------------------------------------------------------------------------------------------------------------------------------------------------------------------------------------
2007--------------------------------------------------------------------------------------------------------------------------------------------------------------------------------------------------------------------------------------------------------------------------------------------------------
Consolidation
Rest of Rest of adjustment and
By geographical area UK Europe US World eliminations Total--------------------------------------------------------------------------------------------------------------------------------------------------------------------------------------------------------------------------------------------------------------------------------------------------------
Sales and other operating revenues
Segment sales and other operating revenues 109,800 78,366 105,120 74,462 – 367,748
Less: sales between areas (48,651) (12,024) (2,801) (19,907) – (83,383)--------------------------------------------------------------------------------------------------------------------------------------------------------------------------------------------------------------------------------------------------------------------------------------------------------
Third party sales 61,149 66,342 102,319 54,555 – 284,365
Equity-accounted earnings 1 55 144 3,632 – 3,832
Interest and other revenues 222 78 142 312 – 754--------------------------------------------------------------------------------------------------------------------------------------------------------------------------------------------------------------------------------------------------------------------------------------------------------
Total revenues 61,372 66,475 102,605 58,499 – 288,951
Segment results
Profit (loss) before interest and tax 4,613 4,164 7,439 16,136 – 32,352
Finance costs and other finance income/expense (17) (287) (524) 87 – (741)--------------------------------------------------------------------------------------------------------------------------------------------------------------------------------------------------------------------------------------------------------------------------------------------------------
Profit before taxation 4,596 3,877 6,915 16,223 – 31,611
Taxation (2,027) (949) (2,593) (4,873) – (10,442)--------------------------------------------------------------------------------------------------------------------------------------------------------------------------------------------------------------------------------------------------------------------------------------------------------
Profit for the year 2,569 2,928 4,322 11,350 – 21,169
Assets and liabilities
Segment assets 53,065 34,658 81,911 76,504 (10,767) 235,371
Current tax receivable 3 27 468 207 – 705--------------------------------------------------------------------------------------------------------------------------------------------------------------------------------------------------------------------------------------------------------------------------------------------------------
Total assets 53,068 34,685 82,379 76,711 (10,767) 236,076--------------------------------------------------------------------------------------------------------------------------------------------------------------------------------------------------------------------------------------------------------------------------------------------------------
Includes
Equity-accounted investments 142 1,970 1,659 18,921 – 22,692
Segment liabilities (30,043) (18,985) (31,314) (18,307) 10,767 (87,882)
Current tax payable (963) (658) (104) (1,557) – (3,282)
Finance debt (20,085) (200) (8,238) (2,522) – (31,045)
Deferred tax liabilities (3,397) (1,124) (10,656) (4,038) – (19,215)--------------------------------------------------------------------------------------------------------------------------------------------------------------------------------------------------------------------------------------------------------------------------------------------------------
Total liabilities (54,488) (20,967) (50,312) (26,424) 10,767 (141,424)
Other segment information
Capital expenditure and acquisitions
Goodwill and other intangible assets 453 298 817 1,285 – 2,853
Property, plant and equipment 1,141 2,489 6,516 6,741 – 16,887
Other 78 253 154 416 – 901--------------------------------------------------------------------------------------------------------------------------------------------------------------------------------------------------------------------------------------------------------------------------------------------------------
Total 1,672 3,040 7,487 8,442 – 20,641--------------------------------------------------------------------------------------------------------------------------------------------------------------------------------------------------------------------------------------------------------------------------------------------------------
Depreciation, depletion and amortization 2,133 959 3,558 3,929 – 10,579
Exploration expense 46 – 252 458 – 756
Impairment losses 315 136 723 387 – 1,561
Impairment reversals – – 237 – – 237
Losses on sale of businesses and fixed assets 2 77 233 43 – 355
Gains on sale of businesses and fixed assets 893 655 770 169 – 2,487
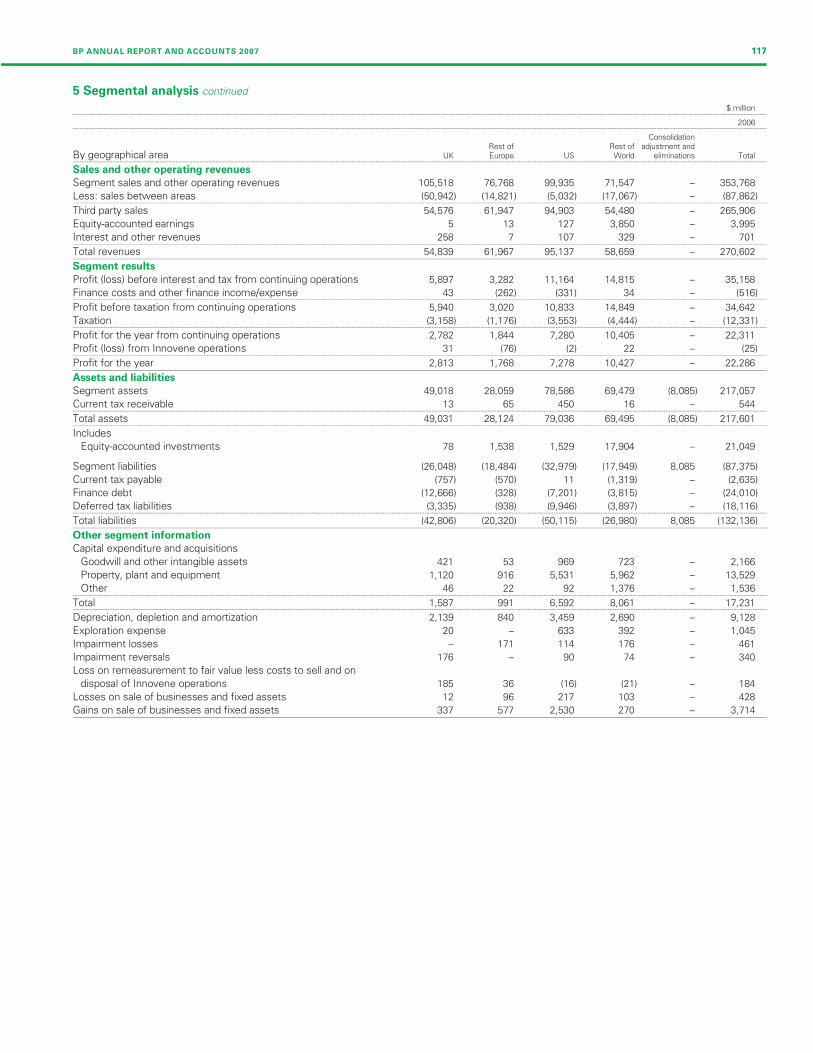
Filename: U54368_doc8.3d Time: 14:49:59 Date: 25/02/08
Checksum: -1093837427
BP ANNUAL REPORT AND ACCOUNTS 2007 117
5 Segmental analysis continued
$ million--------------------------------------------------------------------------------------------------------------------------------------------------------------------------------------------------------------------------------------------------------------------------------------------------------
2006--------------------------------------------------------------------------------------------------------------------------------------------------------------------------------------------------------------------------------------------------------------------------------------------------------
ConsolidationRest of Rest of adjustment and
By geographical area UK Europe US World eliminations Total--------------------------------------------------------------------------------------------------------------------------------------------------------------------------------------------------------------------------------------------------------------------------------------------------------
Sales and other operating revenues
Segment sales and other operating revenues 105,518 76,768 99,935 71,547 – 353,768
Less: sales between areas (50,942) (14,821) (5,032) (17,067) – (87,862)--------------------------------------------------------------------------------------------------------------------------------------------------------------------------------------------------------------------------------------------------------------------------------------------------------
Third party sales 54,576 61,947 94,903 54,480 – 265,906
Equity-accounted earnings 5 13 127 3,850 – 3,995
Interest and other revenues 258 7 107 329 – 701--------------------------------------------------------------------------------------------------------------------------------------------------------------------------------------------------------------------------------------------------------------------------------------------------------
Total revenues 54,839 61,967 95,137 58,659 – 270,602
Segment results
Profit (loss) before interest and tax from continuing operations 5,897 3,282 11,164 14,815 – 35,158
Finance costs and other finance income/expense 43 (262) (331) 34 – (516)--------------------------------------------------------------------------------------------------------------------------------------------------------------------------------------------------------------------------------------------------------------------------------------------------------
Profit before taxation from continuing operations 5,940 3,020 10,833 14,849 – 34,642
Taxation (3,158) (1,176) (3,553) (4,444) – (12,331)--------------------------------------------------------------------------------------------------------------------------------------------------------------------------------------------------------------------------------------------------------------------------------------------------------
Profit for the year from continuing operations 2,782 1,844 7,280 10,405 – 22,311
Profit (loss) from Innovene operations 31 (76) (2) 22 – (25)--------------------------------------------------------------------------------------------------------------------------------------------------------------------------------------------------------------------------------------------------------------------------------------------------------
Profit for the year 2,813 1,768 7,278 10,427 – 22,286
Assets and liabilities
Segment assets 49,018 28,059 78,586 69,479 (8,085) 217,057
Current tax receivable 13 65 450 16 – 544--------------------------------------------------------------------------------------------------------------------------------------------------------------------------------------------------------------------------------------------------------------------------------------------------------
Total assets 49,031 28,124 79,036 69,495 (8,085) 217,601--------------------------------------------------------------------------------------------------------------------------------------------------------------------------------------------------------------------------------------------------------------------------------------------------------
Includes
Equity-accounted investments 78 1,538 1,529 17,904 – 21,049
Segment liabilities (26,048) (18,484) (32,979) (17,949) 8,085 (87,375)
Current tax payable (757) (570) 11 (1,319) – (2,635)
Finance debt (12,666) (328) (7,201) (3,815) – (24,010)
Deferred tax liabilities (3,335) (938) (9,946) (3,897) – (18,116)--------------------------------------------------------------------------------------------------------------------------------------------------------------------------------------------------------------------------------------------------------------------------------------------------------
Total liabilities (42,806) (20,320) (50,115) (26,980) 8,085 (132,136)
Other segment information
Capital expenditure and acquisitions
Goodwill and other intangible assets 421 53 969 723 – 2,166
Property, plant and equipment 1,120 916 5,531 5,962 – 13,529
Other 46 22 92 1,376 – 1,536--------------------------------------------------------------------------------------------------------------------------------------------------------------------------------------------------------------------------------------------------------------------------------------------------------
Total 1,587 991 6,592 8,061 – 17,231--------------------------------------------------------------------------------------------------------------------------------------------------------------------------------------------------------------------------------------------------------------------------------------------------------
Depreciation, depletion and amortization 2,139 840 3,459 2,690 – 9,128
Exploration expense 20 – 633 392 – 1,045
Impairment losses – 171 114 176 – 461
Impairment reversals 176 – 90 74 – 340
Loss on remeasurement to fair value less costs to sell and on
disposal of Innovene operations 185 36 (16) (21) – 184
Losses on sale of businesses and fixed assets 12 96 217 103 – 428
Gains on sale of businesses and fixed assets 337 577 2,530 270 – 3,714
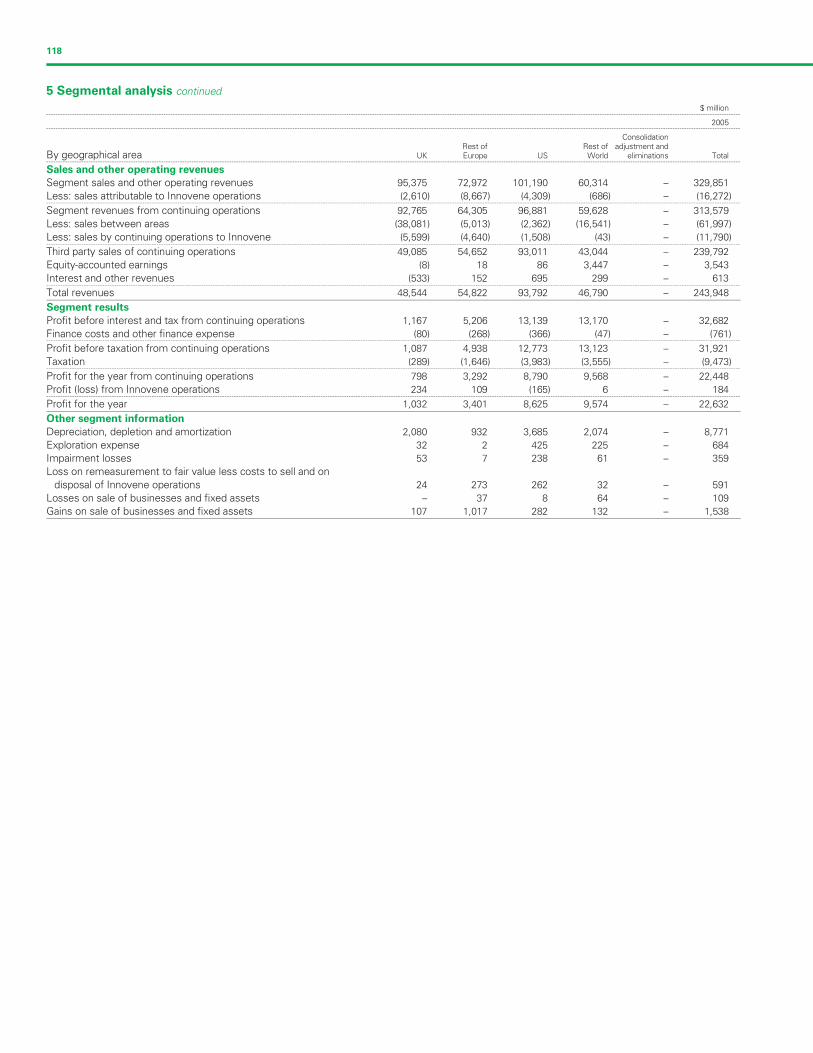
Filename: U54368_doc8.3d Time: 14:49:59 Date: 25/02/08
Checksum: 781858062
118
5 Segmental analysis continued
$ million--------------------------------------------------------------------------------------------------------------------------------------------------------------------------------------------------------------------------------------------------------------------------------------------------------
2005--------------------------------------------------------------------------------------------------------------------------------------------------------------------------------------------------------------------------------------------------------------------------------------------------------
ConsolidationRest of Rest of adjustment and
By geographical area UK Europe US World eliminations Total--------------------------------------------------------------------------------------------------------------------------------------------------------------------------------------------------------------------------------------------------------------------------------------------------------
Sales and other operating revenues
Segment sales and other operating revenues 95,375 72,972 101,190 60,314 – 329,851
Less: sales attributable to Innovene operations (2,610) (8,667) (4,309) (686) – (16,272)--------------------------------------------------------------------------------------------------------------------------------------------------------------------------------------------------------------------------------------------------------------------------------------------------------
Segment revenues from continuing operations 92,765 64,305 96,881 59,628 – 313,579
Less: sales between areas (38,081) (5,013) (2,362) (16,541) – (61,997)
Less: sales by continuing operations to Innovene (5,599) (4,640) (1,508) (43) – (11,790)--------------------------------------------------------------------------------------------------------------------------------------------------------------------------------------------------------------------------------------------------------------------------------------------------------
Third party sales of continuing operations 49,085 54,652 93,011 43,044 – 239,792
Equity-accounted earnings (8) 18 86 3,447 – 3,543
Interest and other revenues (533) 152 695 299 – 613--------------------------------------------------------------------------------------------------------------------------------------------------------------------------------------------------------------------------------------------------------------------------------------------------------
Total revenues 48,544 54,822 93,792 46,790 – 243,948
Segment results
Profit before interest and tax from continuing operations 1,167 5,206 13,139 13,170 – 32,682
Finance costs and other finance expense (80) (268) (366) (47) – (761)--------------------------------------------------------------------------------------------------------------------------------------------------------------------------------------------------------------------------------------------------------------------------------------------------------
Profit before taxation from continuing operations 1,087 4,938 12,773 13,123 – 31,921
Taxation (289) (1,646) (3,983) (3,555) – (9,473)--------------------------------------------------------------------------------------------------------------------------------------------------------------------------------------------------------------------------------------------------------------------------------------------------------
Profit for the year from continuing operations 798 3,292 8,790 9,568 – 22,448
Profit (loss) from Innovene operations 234 109 (165) 6 – 184--------------------------------------------------------------------------------------------------------------------------------------------------------------------------------------------------------------------------------------------------------------------------------------------------------
Profit for the year 1,032 3,401 8,625 9,574 – 22,632
Other segment information
Depreciation, depletion and amortization 2,080 932 3,685 2,074 – 8,771
Exploration expense 32 2 425 225 – 684
Impairment losses 53 7 238 61 – 359
Loss on remeasurement to fair value less costs to sell and on
disposal of Innovene operations 24 273 262 32 – 591
Losses on sale of businesses and fixed assets – 37 8 64 – 1
Gains on sale of businesses and fixed assets 107 1,017 282 132 – 1,538
09
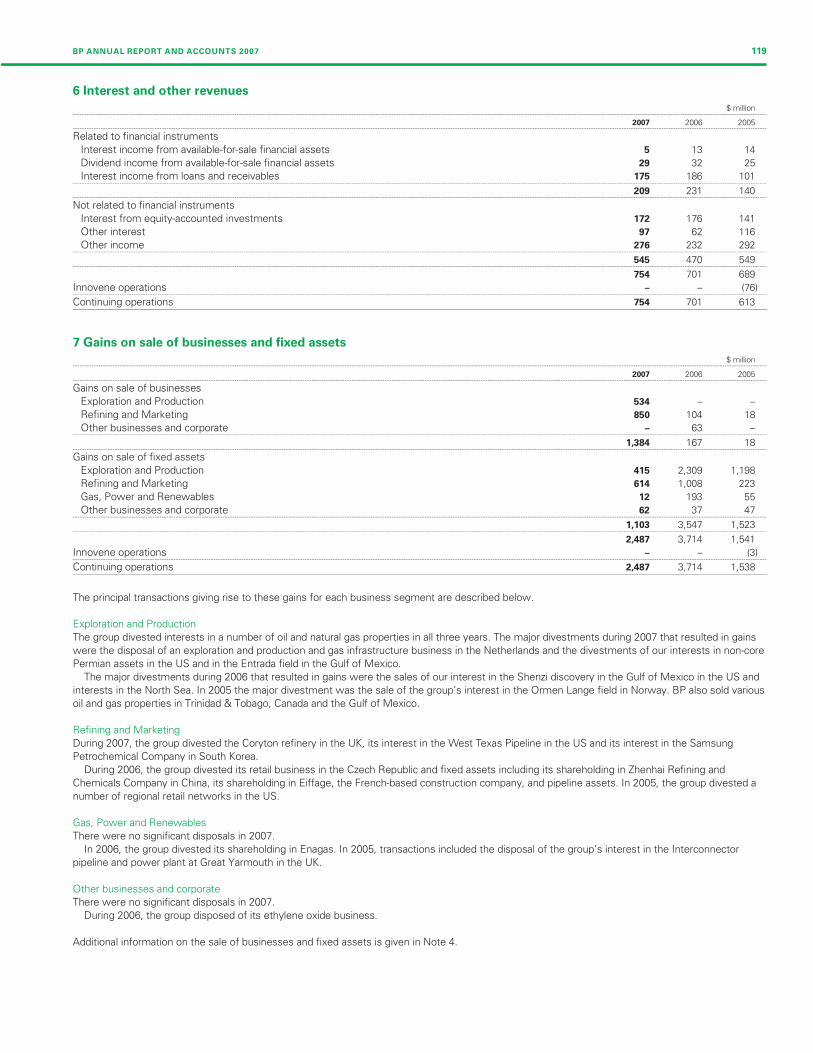
Filename: U54368_doc8.3d Time: 14:49:59 Date: 25/02/08
Checksum: 70324990
BP ANNUAL REPORT AND ACCOUNTS 2007 119
6 Interest and other revenues
$ million--------------------------------------------------------------------------------------------------------------------------------------------------------------------------------------------------------------------------------------------------------------------------------------------------------
2007 2006 2005--------------------------------------------------------------------------------------------------------------------------------------------------------------------------------------------------------------------------------------------------------------------------------------------------------
Related to financial instruments
Interest income from available-for-sale financial assets 5 13 14
Dividend income from available-for-sale financial assets 29 32 25
Interest income from loans and receivables 175 186 101--------------------------------------------------------------------------------------------------------------------------------------------------------------------------------------------------------------------------------------------------------------------------------------------------------
209 231 140--------------------------------------------------------------------------------------------------------------------------------------------------------------------------------------------------------------------------------------------------------------------------------------------------------
Not related to financial instruments
Interest from equity-accounted investments 172 176 141
Other interest 97 62 116
Other income 276 232 292--------------------------------------------------------------------------------------------------------------------------------------------------------------------------------------------------------------------------------------------------------------------------------------------------------
545 470 549--------------------------------------------------------------------------------------------------------------------------------------------------------------------------------------------------------------------------------------------------------------------------------------------------------
754 701 689
Innovene operations – – (7--------------------------------------------------------------------------------------------------------------------------------------------------------------------------------------------------------------------------------------------------------------------------------------------------------
Continuing operations 754 701 613
7 Gains on sale of businesses and fixed assets
$ million--------------------------------------------------------------------------------------------------------------------------------------------------------------------------------------------------------------------------------------------------------------------------------------------------------
2007 2006 2005--------------------------------------------------------------------------------------------------------------------------------------------------------------------------------------------------------------------------------------------------------------------------------------------------------
Gains on sale of businesses
Exploration and Production 534 –
Refining and Marketing 850 104 18
Other businesses and corporate – 63 –--------------------------------------------------------------------------------------------------------------------------------------------------------------------------------------------------------------------------------------------------------------------------------------------------------
1,384 167 18--------------------------------------------------------------------------------------------------------------------------------------------------------------------------------------------------------------------------------------------------------------------------------------------------------
Gains on sale of fixed assets
Exploration and Production 415 2,309 1,198
Refining and Marketing 614 1,008 223
Gas, Power and Renewables 12 193 55
Other businesses and corporate 62 37 47--------------------------------------------------------------------------------------------------------------------------------------------------------------------------------------------------------------------------------------------------------------------------------------------------------
1,103 3,547 1,523--------------------------------------------------------------------------------------------------------------------------------------------------------------------------------------------------------------------------------------------------------------------------------------------------------
2,487 3,714 1,541
Innovene operations – – (3)--------------------------------------------------------------------------------------------------------------------------------------------------------------------------------------------------------------------------------------------------------------------------------------------------------
Continuing operations 2,487 3,714 1,538
The principal transactions giving rise to these gains for each business segment are described below.
Exploration and Production
The group divested interests in a number of oil and natural gas properties in all three years. The major divestments during 2007 that resulted in gains
were the disposal of an exploration and production and gas infrastructure business in the Netherlands and the divestments of our interests in non-core
Permian assets in the US and in the Entrada field in the Gulf of Mexico.
The major divestments during 2006 that resulted in gains were the sales of our interest in the Shenzi discovery in the Gulf of Mexico in the US and
interests in the North Sea. In 2005 the major divestment was the sale of the group’s interest in the Ormen Lange field in Norway. BP also sold various
oil and gas properties in Trinidad & Tobago, Canada and the Gulf of Mexico.
Refining and Marketing
During 2007, the group divested the Coryton refinery in the UK, its interest in the West Texas Pipeline in the US and its interest in the Samsung
Petrochemical Company in South Korea.
During 2006, the group divested its retail business in the Czech Republic and fixed assets including its shareholding in Zhenhai Refining and
Chemicals Company in China, its shareholding in Eiffage, the French-based construction company, and pipeline assets. In 2005, the group divested a
number of regional retail networks in the US.
Gas, Power and Renewables
There were no significant disposals in 2007.
In 2006, the group divested its shareholding in Enagas. In 2005, transactions included the disposal of the group’s interest in the Interconnector
pipeline and power plant at Great Yarmouth in the UK.
Other businesses and corporate
There were no significant disposals in 2007.
During 2006, the group disposed of its ethylene oxide business.
Additional information on the sale of businesses and fixed assets is given in Note 4.
6)
–
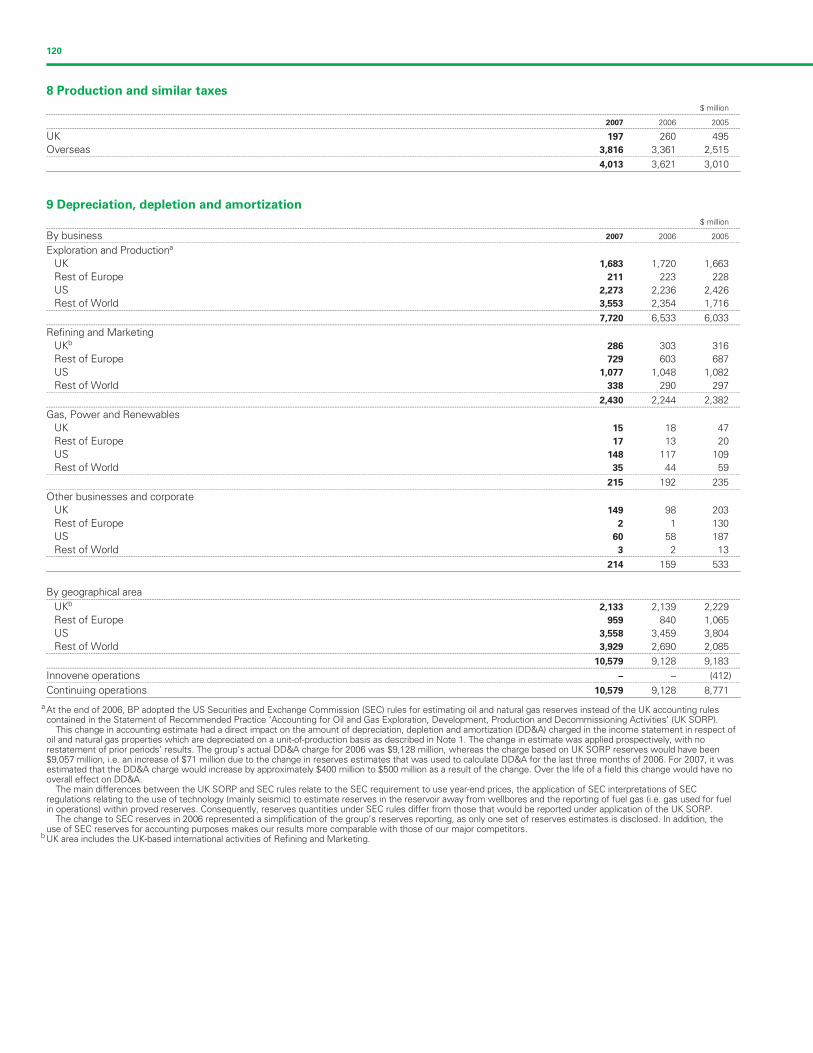
Filename: U54368_doc8.3d Time: 14:50:00 Date: 25/02/08
Checksum: 1203040851
120
8 Production and similar taxes
$ million--------------------------------------------------------------------------------------------------------------------------------------------------------------------------------------------------------------------------------------------------------------------------------------------------------
2007 2006 2005--------------------------------------------------------------------------------------------------------------------------------------------------------------------------------------------------------------------------------------------------------------------------------------------------------
UK 197 260 495
Overseas 3,816 3,361 2,515--------------------------------------------------------------------------------------------------------------------------------------------------------------------------------------------------------------------------------------------------------------------------------------------------------
4,013 3,621 3,010
9 Depreciation, depletion and amortization
$ million--------------------------------------------------------------------------------------------------------------------------------------------------------------------------------------------------------------------------------------------------------------------------------------------------------
By business 2007 2006 2005--------------------------------------------------------------------------------------------------------------------------------------------------------------------------------------------------------------------------------------------------------------------------------------------------------
Exploration and Productiona
UK 1,683 1,720 1,663
Rest of Europe 211 223 228
US 2,273 2,236 2,426
Rest of World 3,553 2,354 1,716--------------------------------------------------------------------------------------------------------------------------------------------------------------------------------------------------------------------------------------------------------------------------------------------------------
7,720 6,533 6,033--------------------------------------------------------------------------------------------------------------------------------------------------------------------------------------------------------------------------------------------------------------------------------------------------------
Refining and Marketing
UKb 286 303 316
Rest of Europe 729 603 687
US 1,077 1,048 1,082
Rest of World 338 290 297--------------------------------------------------------------------------------------------------------------------------------------------------------------------------------------------------------------------------------------------------------------------------------------------------------
2,430 2,244 2,382--------------------------------------------------------------------------------------------------------------------------------------------------------------------------------------------------------------------------------------------------------------------------------------------------------
Gas, Power and Renewables
UK 15 18 47
Rest of Europe 17 13 20
US 148 117 109
Rest of World 35 44 59--------------------------------------------------------------------------------------------------------------------------------------------------------------------------------------------------------------------------------------------------------------------------------------------------------
215 192 235--------------------------------------------------------------------------------------------------------------------------------------------------------------------------------------------------------------------------------------------------------------------------------------------------------
Other businesses and corporate
UK 149 98 203
Rest of Europe 2 1
US 60 58 187
Rest of World 3 2--------------------------------------------------------------------------------------------------------------------------------------------------------------------------------------------------------------------------------------------------------------------------------------------------------
214 159 533
By geographical area--------------------------------------------------------------------------------------------------------------------------------------------------------------------------------------------------------------------------------------------------------------------------------------------------------
UKb 2,133 2,139 2,229
Rest of Europe 959 840 1,065
US 3,558 3,459 3,804
Rest of World 3,929 2,690 2,085--------------------------------------------------------------------------------------------------------------------------------------------------------------------------------------------------------------------------------------------------------------------------------------------------------
10,579 9,128 9,183--------------------------------------------------------------------------------------------------------------------------------------------------------------------------------------------------------------------------------------------------------------------------------------------------------
Innovene operations – – (412)--------------------------------------------------------------------------------------------------------------------------------------------------------------------------------------------------------------------------------------------------------------------------------------------------------
Continuing operations 10,579 9,128 8,771
a At the end of 2006, BP adopted the US Securities and Exchange Commission (SEC) rules for estimating oil and natural gas reserves instead of the UK accounting rulescontained in the Statement of Recommended Practice ‘Accounting for Oil and Gas Exploration, Development, Production and Decommissioning Activities’ (UK SORP).
This change in accounting estimate had a direct impact on the amount of depreciation, depletion and amortization (DD&A) charged in the income statement in respect ofoil and natural gas properties which are depreciated on a unit-of-production basis as described in Note 1. The change in estimate was applied prospectively, with norestatement of prior periods’ results. The group’s actual DD&A charge for 2006 was $9,128 million, whereas the charge based on UK SORP reserves would have been$9,057 million, i.e. an increase of $71 million due to the change in reserves estimates that was used to calculate DD&A for the last three months of 2006. For 2007, it wasestimated that the DD&A charge would increase by approximately $400 million to $500 million as a result of the change. Over the life of a field this change would have nooverall effect on DD&A.
The main differences between the UK SORP and SEC rules relate to the SEC requirement to use year-end prices, the application of SEC interpretations of SECregulations relating to the use of technology (mainly seismic) to estimate reserves in the reservoir away from wellbores and the reporting of fuel gas (i.e. gas used for fuelin operations) within proved reserves. Consequently, reserves quantities under SEC rules differ from those that would be reported under application of the UK SORP.
The change to SEC reserves in 2006 represented a simplification of the group’s reserves reporting, as only one set of reserves estimates is disclosed. In addition, theuse of SEC reserves for accounting purposes makes our results more comparable with those of our major competitors.
b UK area includes the UK-based international activities of Refining and Marketing.
130
13
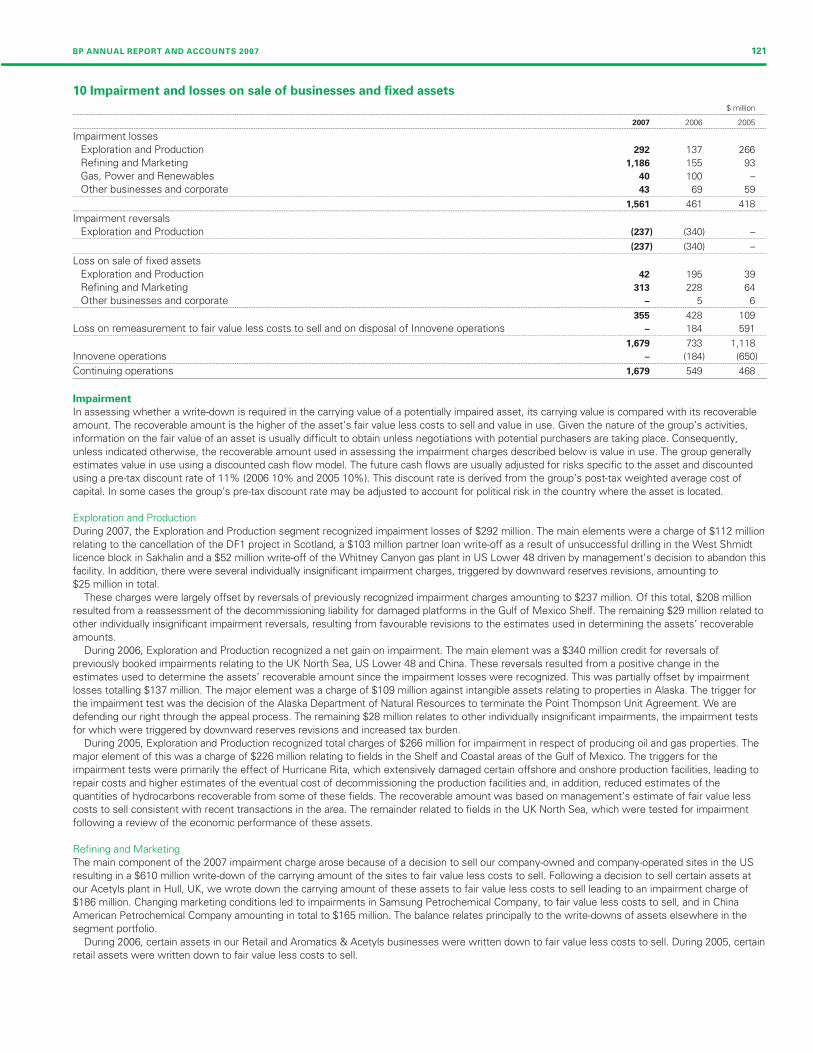
Filename: U54368_doc8.3d Time: 14:50:00 Date: 25/02/08
Checksum: 2098990379
BP ANNUAL REPORT AND ACCOUNTS 2007 121
10 Impairment and losses on sale of businesses and fixed assets
$ million--------------------------------------------------------------------------------------------------------------------------------------------------------------------------------------------------------------------------------------------------------------------------------------------------------
2007 2006 2005--------------------------------------------------------------------------------------------------------------------------------------------------------------------------------------------------------------------------------------------------------------------------------------------------------
Impairment losses
Exploration and Production 292 137 266
Refining and Marketing 1,186 155 93
Gas, Power and Renewables 40 100 –
Other businesses and corporate 43 69 59--------------------------------------------------------------------------------------------------------------------------------------------------------------------------------------------------------------------------------------------------------------------------------------------------------
1,561 461 418--------------------------------------------------------------------------------------------------------------------------------------------------------------------------------------------------------------------------------------------------------------------------------------------------------
Impairment reversals
Exploration and Production (237) (340) –--------------------------------------------------------------------------------------------------------------------------------------------------------------------------------------------------------------------------------------------------------------------------------------------------------
(237) (340) –--------------------------------------------------------------------------------------------------------------------------------------------------------------------------------------------------------------------------------------------------------------------------------------------------------
Loss on sale of fixed assets
Exploration and Production 42 195 39
Refining and Marketing 313 228 64
Other businesses and corporate – 5--------------------------------------------------------------------------------------------------------------------------------------------------------------------------------------------------------------------------------------------------------------------------------------------------------
355 428 109
Loss on remeasurement to fair value less costs to sell and on disposal of Innovene operations – 184 591--------------------------------------------------------------------------------------------------------------------------------------------------------------------------------------------------------------------------------------------------------------------------------------------------------
1,679 733 1,118
Innovene operations – (184) (650)--------------------------------------------------------------------------------------------------------------------------------------------------------------------------------------------------------------------------------------------------------------------------------------------------------
Continuing operations 1,679 549 468
Impairment
In assessing whether a write-down is required in the carrying value of a potentially impaired asset, its carrying value is compared with its recoverable
amount. The recoverable amount is the higher of the asset’s fair value less costs to sell and value in use. Given the nature of the group’s activities,
information on the fair value of an asset is usually difficult to obtain unless negotiations with potential purchasers are taking place. Consequently,
unless indicated otherwise, the recoverable amount used in assessing the impairment charges described below is value in use. The group generally
estimates value in use using a discounted cash flow model. The future cash flows are usually adjusted for risks specific to the asset and discounted
using a pre-tax discount rate of 11% (2006 10% and 2005 10%). This discount rate is derived from the group’s post-tax weighted average cost of
capital. In some cases the group’s pre-tax discount rate may be adjusted to account for political risk in the country where the asset is located.
Exploration and Production
During 2007, the Exploration and Production segment recognized impairment losses of $292 million. The main elements were a charge of $112 million
relating to the cancellation of the DF1 project in Scotland, a $103 million partner loan write-off as a result of unsuccessful drilling in the West Shmidt
licence block in Sakhalin and a $52 million write-off of the Whitney Canyon gas plant in US Lower 48 driven by management’s decision to abandon this
facility. In addition, there were several individually insignificant impairment charges, triggered by downward reserves revisions, amounting to
$25 million in total.
These charges were largely offset by reversals of previously recognized impairment charges amounting to $237 million. Of this total, $208 million
resulted from a reassessment of the decommissioning liability for damaged platforms in the Gulf of Mexico Shelf. The remaining $29 million related to
other individually insignificant impairment reversals, resulting from favourable revisions to the estimates used in determining the assets’ recoverable
amounts.
During 2006, Exploration and Production recognized a net gain on impairment. The main element was a $340 million credit for reversals of
previously booked impairments relating to the UK North Sea, US Lower 48 and China. These reversals resulted from a positive change in the
estimates used to determine the assets’ recoverable amount since the impairment losses were recognized. This was partially offset by impairment
losses totalling $137 million. The major element was a charge of $109 million against intangible assets relating to properties in Alaska. The trigger for
the impairment test was the decision of the Alaska Department of Natural Resources to terminate the Point Thompson Unit Agreement. We are
defending our right through the appeal process. The remaining $28 million relates to other individually insignificant impairments, the impairment tests
for which were triggered by downward reserves revisions and increased tax burden.
During 2005, Exploration and Production recognized total charges of $266 million for impairment in respect of producing oil and gas properties. The
major element of this was a charge of $226 million relating to fields in the Shelf and Coastal areas of the Gulf of Mexico. The triggers for the
impairment tests were primarily the effect of Hurricane Rita, which extensively damaged certain offshore and onshore production facilities, leading to
repair costs and higher estimates of the eventual cost of decommissioning the production facilities and, in addition, reduced estimates of the
quantities of hydrocarbons recoverable from some of these fields. The recoverable amount was based on management’s estimate of fair value less
costs to sell consistent with recent transactions in the area. The remainder related to fields in the UK North Sea, which were tested for impairment
following a review of the economic performance of these assets.
Refining and Marketing
The main component of the 2007 impairment charge arose because of a decision to sell our company-owned and company-operated sites in the US
resulting in a $610 million write-down of the carrying amount of the sites to fair value less costs to sell. Following a decision to sell certain assets at
our Acetyls plant in Hull, UK, we wrote down the carrying amount of these assets to fair value less costs to sell leading to an impairment charge of
$186 million. Changing marketing conditions led to impairments in Samsung Petrochemical Company, to fair value less costs to sell, and in China
American Petrochemical Company amounting in total to $165 million. The balance relates principally to the write-downs of assets elsewhere in the
segment portfolio.
During 2006, certain assets in our Retail and Aromatics & Acetyls businesses were written down to fair value less costs to sell. During 2005, certain
retail assets were written down to fair value less costs to sell.
6
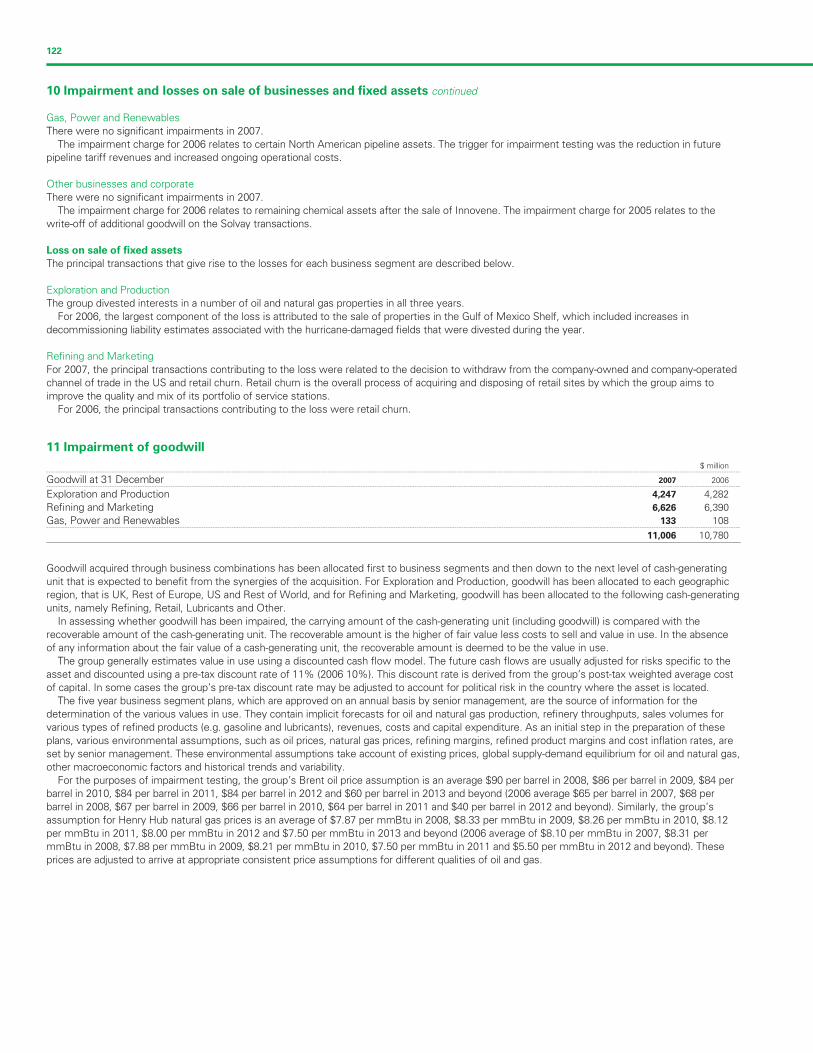
Filename: U54368_doc8.3d Time: 14:50:00 Date: 25/02/08
Checksum: 1889582011
122
10 Impairment and losses on sale of businesses and fixed assets continued
Gas, Power and Renewables
There were no significant impairments in 2007.
The impairment charge for 2006 relates to certain North American pipeline assets. The trigger for impairment testing was the reduction in future
pipeline tariff revenues and increased ongoing operational costs.
Other businesses and corporate
There were no significant impairments in 2007.
The impairment charge for 2006 relates to remaining chemical assets after the sale of Innovene. The impairment charge for 2005 relates to the
write-off of additional goodwill on the Solvay transactions.
Loss on sale of fixed assets
The principal transactions that give rise to the losses for each business segment are described below.
Exploration and Production
The group divested interests in a number of oil and natural gas properties in all three years.
For 2006, the largest component of the loss is attributed to the sale of properties in the Gulf of Mexico Shelf, which included increases in
decommissioning liability estimates associated with the hurricane-damaged fields that were divested during the year.
Refining and Marketing
For 2007, the principal transactions contributing to the loss were related to the decision to withdraw from the company-owned and company-operated
channel of trade in the US and retail churn. Retail churn is the overall process of acquiring and disposing of retail sites by which the group aims to
improve the quality and mix of its portfolio of service stations.
For 2006, the principal transactions contributing to the loss were retail churn.
11 Impairment of goodwill
$ million--------------------------------------------------------------------------------------------------------------------------------------------------------------------------------------------------------------------------------------------------------------------------------------------------------
Goodwill at 31 December 2007 2006--------------------------------------------------------------------------------------------------------------------------------------------------------------------------------------------------------------------------------------------------------------------------------------------------------
Exploration and Production 4,247 4,282
Refining and Marketing 6,626 6,390
Gas, Power and Renewables 133 108--------------------------------------------------------------------------------------------------------------------------------------------------------------------------------------------------------------------------------------------------------------------------------------------------------
11,006 10,780
Goodwill acquired through business combinations has been allocated first to business segments and then down to the next level of cash-generating
unit that is expected to benefit from the synergies of the acquisition. For Exploration and Production, goodwill has been allocated to each geographic
region, that is UK, Rest of Europe, US and Rest of World, and for Refining and Marketing, goodwill has been allocated to the following cash-generating
units, namely Refining, Retail, Lubricants and Other.
In assessing whether goodwill has been impaired, the carrying amount of the cash-generating unit (including goodwill) is compared with the
recoverable amount of the cash-generating unit. The recoverable amount is the higher of fair value less costs to sell and value in use. In the absence
of any information about the fair value of a cash-generating unit, the recoverable amount is deemed to be the value in use.
The group generally estimates value in use using a discounted cash flow model. The future cash flows are usually adjusted for risks specific to the
asset and discounted using a pre-tax discount rate of 11% (2006 10%). This discount rate is derived from the group’s post-tax weighted average cost
of capital. In some cases the group’s pre-tax discount rate may be adjusted to account for political risk in the country where the asset is located.
The five year business segment plans, which are approved on an annual basis by senior management, are the source of information for the
determination of the various values in use. They contain implicit forecasts for oil and natural gas production, refinery throughputs, sales volumes for
various types of refined products (e.g. gasoline and lubricants), revenues, costs and capital expenditure. As an initial step in the preparation of these
plans, various environmental assumptions, such as oil prices, natural gas prices, refining margins, refined product margins and cost inflation rates, are
set by senior management. These environmental assumptions take account of existing prices, global supply-demand equilibrium for oil and natural gas,
other macroeconomic factors and historical trends and variability.
For the purposes of impairment testing, the group’s Brent oil price assumption is an average $90 per barrel in 2008, $86 per barrel in 2009, $84 per
barrel in 2010, $84 per barrel in 2011, $84 per barrel in 2012 and $60 per barrel in 2013 and beyond (2006 average $65 per barrel in 2007, $68 per
barrel in 2008, $67 per barrel in 2009, $66 per barrel in 2010, $64 per barrel in 2011 and $40 per barrel in 2012 and beyond). Similarly, the group’s
assumption for Henry Hub natural gas prices is an average of $7.87 per mmBtu in 2008, $8.33 per mmBtu in 2009, $8.26 per mmBtu in 2010, $8.12
per mmBtu in 2011, $8.00 per mmBtu in 2012 and $7.50 per mmBtu in 2013 and beyond (2006 average of $8.10 per mmBtu in 2007, $8.31 per
mmBtu in 2008, $7.88 per mmBtu in 2009, $8.21 per mmBtu in 2010, $7.50 per mmBtu in 2011 and $5.50 per mmBtu in 2012 and beyond). These
prices are adjusted to arrive at appropriate consistent price assumptions for different qualities of oil and gas.
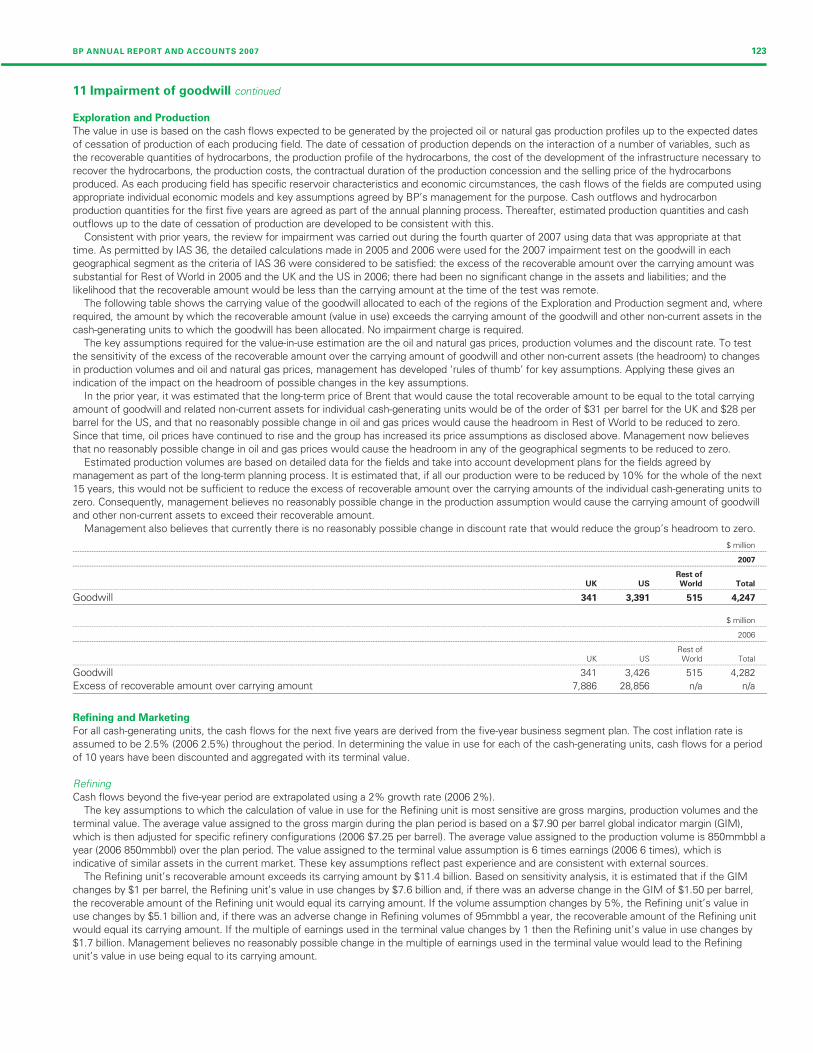
Filename: U54368_doc8.3d Time: 14:50:00 Date: 25/02/08
Checksum: -1129701407
BP ANNUAL REPORT AND ACCOUNTS 2007 123
11 Impairment of goodwill continued
Exploration and Production
The value in use is based on the cash flows expected to be generated by the projected oil or natural gas production profiles up to the expected dates
of cessation of production of each producing field. The date of cessation of production depends on the interaction of a number of variables, such as
the recoverable quantities of hydrocarbons, the production profile of the hydrocarbons, the cost of the development of the infrastructure necessary to
recover the hydrocarbons, the production costs, the contractual duration of the production concession and the selling price of the hydrocarbons
produced. As each producing field has specific reservoir characteristics and economic circumstances, the cash flows of the fields are computed using
appropriate individual economic models and key assumptions agreed by BP’s management for the purpose. Cash outflows and hydrocarbon
production quantities for the first five years are agreed as part of the annual planning process. Thereafter, estimated production quantities and cash
outflows up to the date of cessation of production are developed to be consistent with this.
Consistent with prior years, the review for impairment was carried out during the fourth quarter of 2007 using data that was appropriate at that
time. As permitted by IAS 36, the detailed calculations made in 2005 and 2006 were used for the 2007 impairment test on the goodwill in each
geographical segment as the criteria of IAS 36 were considered to be satisfied: the excess of the recoverable amount over the carrying amount was
substantial for Rest of World in 2005 and the UK and the US in 2006; there had been no significant change in the assets and liabilities; and the
likelihood that the recoverable amount would be less than the carrying amount at the time of the test was remote.
The following table shows the carrying value of the goodwill allocated to each of the regions of the Exploration and Production segment and, where
required, the amount by which the recoverable amount (value in use) exceeds the carrying amount of the goodwill and other non-current assets in the
cash-generating units to which the goodwill has been allocated. No impairment charge is required.
The key assumptions required for the value-in-use estimation are the oil and natural gas prices, production volumes and the discount rate. To test
the sensitivity of the excess of the recoverable amount over the carrying amount of goodwill and other non-current assets (the headroom) to changes
in production volumes and oil and natural gas prices, management has developed ‘rules of thumb’ for key assumptions. Applying these gives an
indication of the impact on the headroom of possible changes in the key assumptions.
In the prior year, it was estimated that the long-term price of Brent that would cause the total recoverable amount to be equal to the total carrying
amount of goodwill and related non-current assets for individual cash-generating units would be of the order of $31 per barrel for the UK and $28 per
barrel for the US, and that no reasonably possible change in oil and gas prices would cause the headroom in Rest of World to be reduced to zero.
Since that time, oil prices have continued to rise and the group has increased its price assumptions as disclosed above. Management now believes
that no reasonably possible change in oil and gas prices would cause the headroom in any of the geographical segments to be reduced to zero.
Estimated production volumes are based on detailed data for the fields and take into account development plans for the fields agreed by
management as part of the long-term planning process. It is estimated that, if all our production were to be reduced by 10% for the whole of the next
15 years, this would not be sufficient to reduce the excess of recoverable amount over the carrying amounts of the individual cash-generating units to
zero. Consequently, management believes no reasonably possible change in the production assumption would cause the carrying amount of goodwill
and other non-current assets to exceed their recoverable amount.
Management also believes that currently there is no reasonably possible change in discount rate that would reduce the group’s headroom to zero.
$ million--------------------------------------------------------------------------------------------------------------------------------------------------------------------------------------------------------------------------------------------------------------------------------------------------------
2007--------------------------------------------------------------------------------------------------------------------------------------------------------------------------------------------------------------------------------------------------------------------------------------------------------
Rest of
UK US World Total--------------------------------------------------------------------------------------------------------------------------------------------------------------------------------------------------------------------------------------------------------------------------------------------------------
Goodwill 341 3,391 515 4,247
$ million--------------------------------------------------------------------------------------------------------------------------------------------------------------------------------------------------------------------------------------------------------------------------------------------------------
2006--------------------------------------------------------------------------------------------------------------------------------------------------------------------------------------------------------------------------------------------------------------------------------------------------------
Rest ofUK US World Total
--------------------------------------------------------------------------------------------------------------------------------------------------------------------------------------------------------------------------------------------------------------------------------------------------------
Goodwill 341 3,426 515 4,282
Excess of recoverable amount over carrying amount 7,886 28,856 n/a n/a
Refining and Marketing
For all cash-generating units, the cash flows for the next five years are derived from the five-year business segment plan. The cost inflation rate is
assumed to be 2.5% (2006 2.5%) throughout the period. In determining the value in use for each of the cash-generating units, cash flows for a period
of 10 years have been discounted and aggregated with its terminal value.
Refining
Cash flows beyond the five-year period are extrapolated using a 2% growth rate (2006 2%).
The key assumptions to which the calculation of value in use for the Refining unit is most sensitive are gross margins, production volumes and the
terminal value. The average value assigned to the gross margin during the plan period is based on a $7.90 per barrel global indicator margin (GIM),
which is then adjusted for specific refinery configurations (2006 $7.25 per barrel). The average value assigned to the production volume is 850mmbbl a
year (2006 850mmbbl) over the plan period. The value assigned to the terminal value assumption is 6 times earnings (2006 6 times), which is
indicative of similar assets in the current market. These key assumptions reflect past experience and are consistent with external sources.
The Refining unit’s recoverable amount exceeds its carrying amount by $11.4 billion. Based on sensitivity analysis, it is estimated that if the GIM
changes by $1 per barrel, the Refining unit’s value in use changes by $7.6 billion and, if there was an adverse change in the GIM of $1.50 per barrel,
the recoverable amount of the Refining unit would equal its carrying amount. If the volume assumption changes by 5%, the Refining unit’s value in
use changes by $5.1 billion and, if there was an adverse change in Refining volumes of 95mmbbl a year, the recoverable amount of the Refining unit
would equal its carrying amount. If the multiple of earnings used in the terminal value changes by 1 then the Refining unit’s value in use changes by
$1.7 billion. Management believes no reasonably possible change in the multiple of earnings used in the terminal value would lead to the Refining
unit’s value in use being equal to its carrying amount.
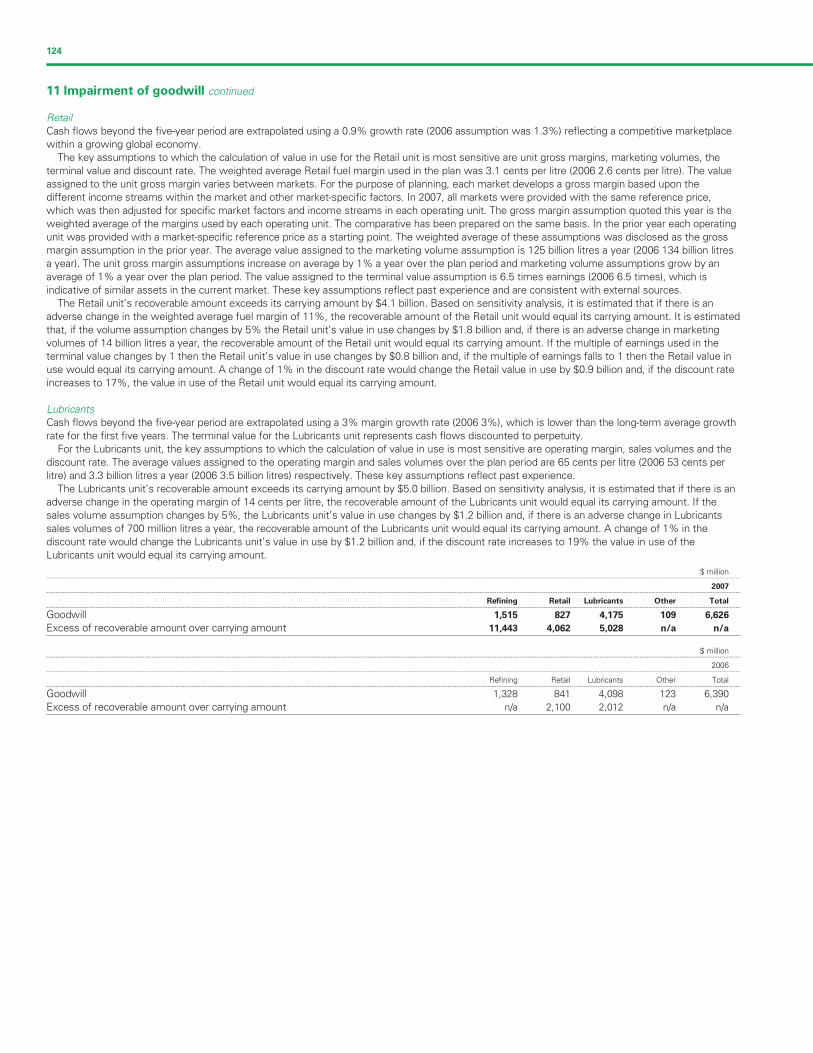
Filename: U54368_doc8.3d Time: 14:50:00 Date: 25/02/08
Checksum: -1208693007
124
11 Impairment of goodwill continued
Retail
Cash flows beyond the five-year period are extrapolated using a 0.9% growth rate (2006 assumption was 1.3%) reflecting a competitive marketplace
within a growing global economy.
The key assumptions to which the calculation of value in use for the Retail unit is most sensitive are unit gross margins, marketing volumes, the
terminal value and discount rate. The weighted average Retail fuel margin used in the plan was 3.1 cents per litre (2006 2.6 cents per litre). The value
assigned to the unit gross margin varies between markets. For the purpose of planning, each market develops a gross margin based upon the
different income streams within the market and other market-specific factors. In 2007, all markets were provided with the same reference price,
which was then adjusted for specific market factors and income streams in each operating unit. The gross margin assumption quoted this year is the
weighted average of the margins used by each operating unit. The comparative has been prepared on the same basis. In the prior year each operating
unit was provided with a market-specific reference price as a starting point. The weighted average of these assumptions was disclosed as the gross
margin assumption in the prior year. The average value assigned to the marketing volume assumption is 125 billion litres a year (2006 134 billion litres
a year). The unit gross margin assumptions increase on average by 1% a year over the plan period and marketing volume assumptions grow by an
average of 1% a year over the plan period. The value assigned to the terminal value assumption is 6.5 times earnings (2006 6.5 times), which is
indicative of similar assets in the current market. These key assumptions reflect past experience and are consistent with external sources.
The Retail unit’s recoverable amount exceeds its carrying amount by $4.1 billion. Based on sensitivity analysis, it is estimated that if there is an
adverse change in the weighted average fuel margin of 11%, the recoverable amount of the Retail unit would equal its carrying amount. It is estimated
that, if the volume assumption changes by 5% the Retail unit’s value in use changes by $1.8 billion and, if there is an adverse change in marketing
volumes of 14 billion litres a year, the recoverable amount of the Retail unit would equal its carrying amount. If the multiple of earnings used in the
terminal value changes by 1 then the Retail unit’s value in use changes by $0.8 billion and, if the multiple of earnings falls to 1 then the Retail value in
use would equal its carrying amount. A change of 1% in the discount rate would change the Retail value in use by $0.9 billion and, if the discount rate
increases to 17%, the value in use of the Retail unit would equal its carrying amount.
Lubricants
Cash flows beyond the five-year period are extrapolated using a 3% margin growth rate (2006 3%), which is lower than the long-term average growth
rate for the first five years. The terminal value for the Lubricants unit represents cash flows discounted to perpetuity.
For the Lubricants unit, the key assumptions to which the calculation of value in use is most sensitive are operating margin, sales volumes and the
discount rate. The average values assigned to the operating margin and sales volumes over the plan period are 65 cents per litre (2006 53 cents per
litre) and 3.3 billion litres a year (2006 3.5 billion litres) respectively. These key assumptions reflect past experience.
The Lubricants unit’s recoverable amount exceeds its carrying amount by $5.0 billion. Based on sensitivity analysis, it is estimated that if there is an
adverse change in the operating margin of 14 cents per litre, the recoverable amount of the Lubricants unit would equal its carrying amount. If the
sales volume assumption changes by 5%, the Lubricants unit’s value in use changes by $1.2 billion and, if there is an adverse change in Lubricants
sales volumes of 700 million litres a year, the recoverable amount of the Lubricants unit would equal its carrying amount. A change of 1% in the
discount rate would change the Lubricants unit’s value in use by $1.2 billion and, if the discount rate increases to 19% the value in use of the
Lubricants unit would equal its carrying amount.
$ million--------------------------------------------------------------------------------------------------------------------------------------------------------------------------------------------------------------------------------------------------------------------------------------------------------
2007--------------------------------------------------------------------------------------------------------------------------------------------------------------------------------------------------------------------------------------------------------------------------------------------------------
Refining Retail Lubricants Other Total--------------------------------------------------------------------------------------------------------------------------------------------------------------------------------------------------------------------------------------------------------------------------------------------------------
Goodwill 1,515 827 4,175 109 6,626
Excess of recoverable amount over carrying amount 11,443 4,062 5,028 n/a n/a
$ million--------------------------------------------------------------------------------------------------------------------------------------------------------------------------------------------------------------------------------------------------------------------------------------------------------
2006--------------------------------------------------------------------------------------------------------------------------------------------------------------------------------------------------------------------------------------------------------------------------------------------------------
Refining Retail Lubricants Other Total--------------------------------------------------------------------------------------------------------------------------------------------------------------------------------------------------------------------------------------------------------------------------------------------------------
Goodwill 1,328 841 4,098 123 6,390
Excess of recoverable amount over carrying amount n/a 2,100 2,012 n/a n/a
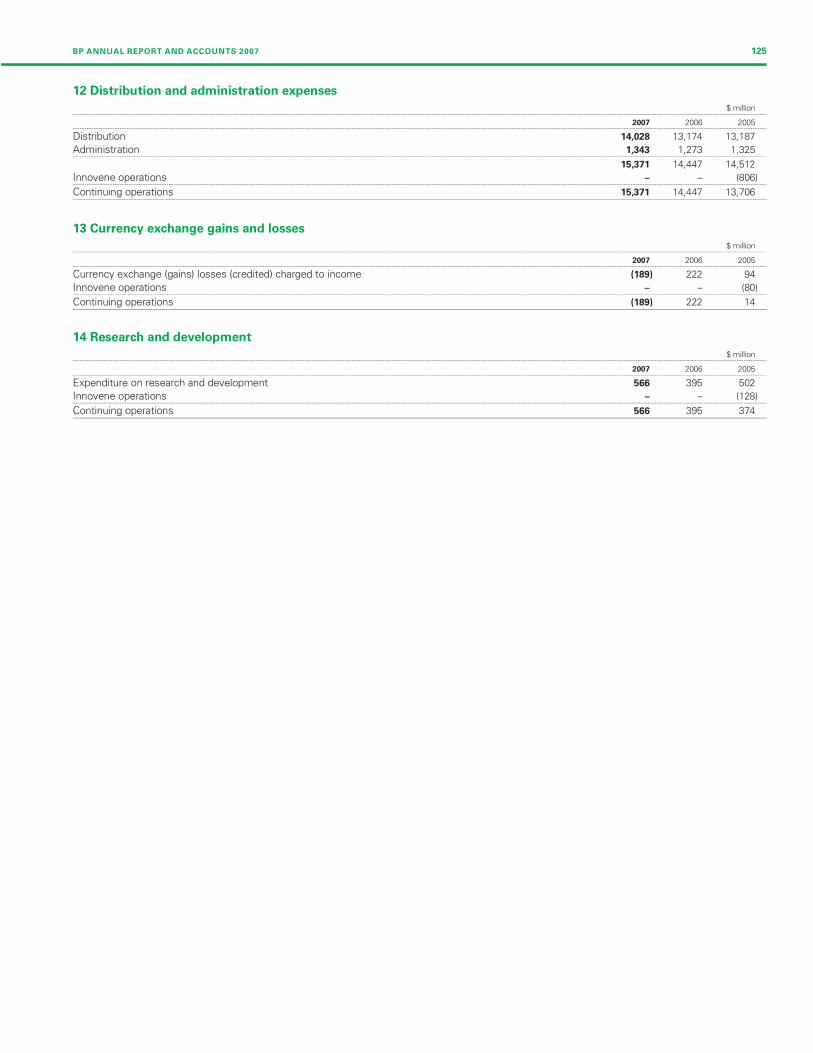
Filename: U54368_doc8.3d Time: 14:50:00 Date: 25/02/08
Checksum: 526447002
BP ANNUAL REPORT AND ACCOUNTS 2007 125
12 Distribution and administration expenses
$ million--------------------------------------------------------------------------------------------------------------------------------------------------------------------------------------------------------------------------------------------------------------------------------------------------------
2007 2006 2005--------------------------------------------------------------------------------------------------------------------------------------------------------------------------------------------------------------------------------------------------------------------------------------------------------
Distribution 14,028 13,174 13,187
Administration 1,343 1,273 1,325--------------------------------------------------------------------------------------------------------------------------------------------------------------------------------------------------------------------------------------------------------------------------------------------------------
15,371 14,447 14,512
Innovene operations – – (806)--------------------------------------------------------------------------------------------------------------------------------------------------------------------------------------------------------------------------------------------------------------------------------------------------------
Continuing operations 15,371 14,447 13,706
13 Currency exchange gains and losses
$ million--------------------------------------------------------------------------------------------------------------------------------------------------------------------------------------------------------------------------------------------------------------------------------------------------------
2007 2006 2005--------------------------------------------------------------------------------------------------------------------------------------------------------------------------------------------------------------------------------------------------------------------------------------------------------
Currency exchange (gains) losses (credited) charged to income (189) 222 94
Innovene operations – – (80)--------------------------------------------------------------------------------------------------------------------------------------------------------------------------------------------------------------------------------------------------------------------------------------------------------
Continuing operations (189) 222 14
14 Research and development
$ million--------------------------------------------------------------------------------------------------------------------------------------------------------------------------------------------------------------------------------------------------------------------------------------------------------
2007 2006 2005--------------------------------------------------------------------------------------------------------------------------------------------------------------------------------------------------------------------------------------------------------------------------------------------------------
Expenditure on research and development 566 395 502
Innovene operations – – (128)--------------------------------------------------------------------------------------------------------------------------------------------------------------------------------------------------------------------------------------------------------------------------------------------------------
Continuing operations 566 395 374
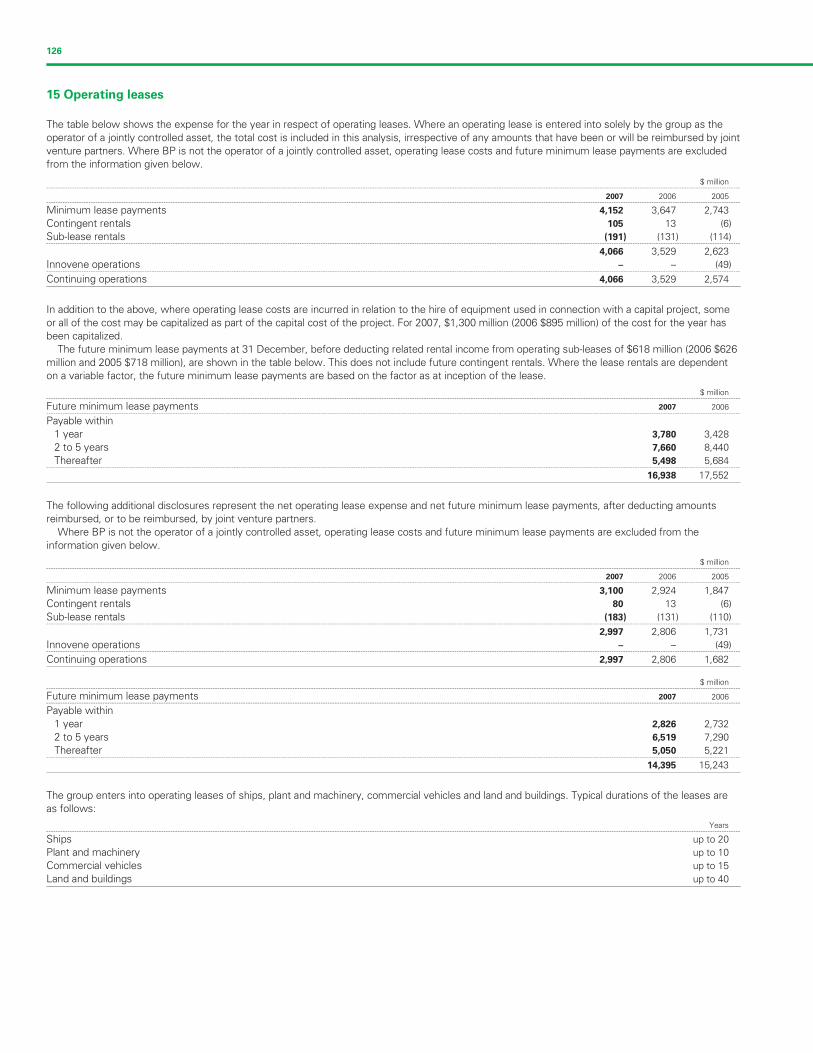
Filename: U54368_doc8.3d Time: 14:50:01 Date: 25/02/08
Checksum: -889673599
126
15 Operating leases
The table below shows the expense for the year in respect of operating leases. Where an operating lease is entered into solely by the group as the
operator of a jointly controlled asset, the total cost is included in this analysis, irrespective of any amounts that have been or will be reimbursed by joint
venture partners. Where BP is not the operator of a jointly controlled asset, operating lease costs and future minimum lease payments are excluded
from the information given below.
$ million--------------------------------------------------------------------------------------------------------------------------------------------------------------------------------------------------------------------------------------------------------------------------------------------------------
2007 2006 2005--------------------------------------------------------------------------------------------------------------------------------------------------------------------------------------------------------------------------------------------------------------------------------------------------------
Minimum lease payments 4,152 3,647 2,743
Contingent rentals 105 13 (6)
Sub-lease rentals (191) (131) (114)--------------------------------------------------------------------------------------------------------------------------------------------------------------------------------------------------------------------------------------------------------------------------------------------------------
4,066 3,529 2,623
Innovene operations – – (49)--------------------------------------------------------------------------------------------------------------------------------------------------------------------------------------------------------------------------------------------------------------------------------------------------------
Continuing operations 4,066 3,529 2,574
In addition to the above, where operating lease costs are incurred in relation to the hire of equipment used in connection with a capital project, some
or all of the cost may be capitalized as part of the capital cost of the project. For 2007, $1,300 million (2006 $895 million) of the cost for the year has
been capitalized.
The future minimum lease payments at 31 December, before deducting related rental income from operating sub-leases of $618 million (2006 $626
million and 2005 $718 million), are shown in the table below. This does not include future contingent rentals. Where the lease rentals are dependent
on a variable factor, the future minimum lease payments are based on the factor as at inception of the lease.
$ million--------------------------------------------------------------------------------------------------------------------------------------------------------------------------------------------------------------------------------------------------------------------------------------------------------
Future minimum lease payments 2007 2006--------------------------------------------------------------------------------------------------------------------------------------------------------------------------------------------------------------------------------------------------------------------------------------------------------
Payable within
1 year 3,780 3,428
2 to 5 years 7,660 8,440
Thereafter 5,498 5,684--------------------------------------------------------------------------------------------------------------------------------------------------------------------------------------------------------------------------------------------------------------------------------------------------------
16,938 17,552
The following additional disclosures represent the net operating lease expense and net future minimum lease payments, after deducting amounts
reimbursed, or to be reimbursed, by joint venture partners.
Where BP is not the operator of a jointly controlled asset, operating lease costs and future minimum lease payments are excluded from the
information given below.
$ million--------------------------------------------------------------------------------------------------------------------------------------------------------------------------------------------------------------------------------------------------------------------------------------------------------
2007 2006 2005--------------------------------------------------------------------------------------------------------------------------------------------------------------------------------------------------------------------------------------------------------------------------------------------------------
Minimum lease payments 3,100 2,924 1,847
Contingent rentals 80 13 (6)
Sub-lease rentals (183) (131) (110)--------------------------------------------------------------------------------------------------------------------------------------------------------------------------------------------------------------------------------------------------------------------------------------------------------
2,997 2,806 1,731
Innovene operations – – (49)--------------------------------------------------------------------------------------------------------------------------------------------------------------------------------------------------------------------------------------------------------------------------------------------------------
Continuing operations 2,997 2,806 1,682
$ million--------------------------------------------------------------------------------------------------------------------------------------------------------------------------------------------------------------------------------------------------------------------------------------------------------
Future minimum lease payments 2007 2006--------------------------------------------------------------------------------------------------------------------------------------------------------------------------------------------------------------------------------------------------------------------------------------------------------
Payable within
1 year 2,826 2,732
2 to 5 years 6,519 7,290
Thereafter 5,050 5,221--------------------------------------------------------------------------------------------------------------------------------------------------------------------------------------------------------------------------------------------------------------------------------------------------------
14,395 15,243
The group enters into operating leases of ships, plant and machinery, commercial vehicles and land and buildings. Typical durations of the leases are
as follows:
Years--------------------------------------------------------------------------------------------------------------------------------------------------------------------------------------------------------------------------------------------------------------------------------------------------------
Ships up to 20
Plant and machinery up to 10
Commercial vehicles up to 15
Land and buildings up to 40

Filename: U54368_doc8.3d Time: 14:50:01 Date: 25/02/08
Checksum: -1483546040
BP ANNUAL REPORT AND ACCOUNTS 2007 127
The group has entered into a number of structured operating leases for ships and in most cases the lease rental payments vary with market interest
rates. The variable portion of the lease payments above or below the amount based on the market interest rate prevailing at inception of the lease is
treated as contingent rental expense, but the amounts of such contingent rentals are not significant for the years presented. The group also routinely
enters into bareboat charters, time-charters and spot-charters for ships on standard industry terms.
The most significant items of plant and machinery hired under operating leases are drilling rigs used in the Exploration and Production segment. In
some cases, drilling rig lease rental rates are adjusted periodically to market rates that are influenced by oil prices and may be significantly different
from the rates at the inception of the lease. Differences between the rate paid and rate at inception of the lease are treated as contingent rental
expense.
Commercial vehicles hired under operating leases are primarily railcars. Retail service station sites and office accommodation are the main items in
the land and buildings category.
The terms and conditions of these operating leases do not impose any significant financial restrictions on the group. Some of the leases of ships
and buildings allow for renewals at BP’s option.
16 Exploration for and evaluation of oil and natural gas resources
The following financial information represents the amounts included within the group totals relating to activity associated with the exploration for and
evaluation of oil and natural gas resources. All such activity is recorded within the Exploration and Production segment.
$ million--------------------------------------------------------------------------------------------------------------------------------------------------------------------------------------------------------------------------------------------------------------------------------------------------------
2007 2006 2005--------------------------------------------------------------------------------------------------------------------------------------------------------------------------------------------------------------------------------------------------------------------------------------------------------
Exploration and evaluation costs
Exploration expenditure written off 347 624 305
Other exploration costs 409 421 379--------------------------------------------------------------------------------------------------------------------------------------------------------------------------------------------------------------------------------------------------------------------------------------------------------
Exploration expense for the year 756 1,045 684
Intangible assets – exploration expenditure 5,252 4,110 4,008--------------------------------------------------------------------------------------------------------------------------------------------------------------------------------------------------------------------------------------------------------------------------------------------------------
Net assets 5,252 4,110 4,008
Capital expenditure 2,000 1,537 950
Net cash used in operating activities 409 421 379
Net cash used in investing activities 2,000 1,498 950
17 Auditors’ remuneration
$ million--------------------------------------------------------------------------------------------------------------------------------------------------------------------------------------------------------------------------------------------------------------------------------------------------------
Fees – Ernst & Young 2007 2006 2005--------------------------------------------------------------------------------------------------------------------------------------------------------------------------------------------------------------------------------------------------------------------------------------------------------
Fees payable to the company’s auditors for the audit of the company’s accountsa 18 15 19
Fees payable to the company’s auditors and its associates for other services
Audit of the company’s subsidiaries pursuant to legislation 31 31 34
Other services pursuant to legislation 14 15 6--------------------------------------------------------------------------------------------------------------------------------------------------------------------------------------------------------------------------------------------------------------------------------------------------------
63 61 59
Tax services 2 1 1
Services relating to corporate finance transactions 1 2
All other services 8 9 2
Audit fees in respect of the BP pension plans 1 –--------------------------------------------------------------------------------------------------------------------------------------------------------------------------------------------------------------------------------------------------------------------------------------------------------
75 73 96
Innovene operations – – (9)--------------------------------------------------------------------------------------------------------------------------------------------------------------------------------------------------------------------------------------------------------------------------------------------------------
Continuing operations 75 73 87
a Fees in respect of the audit of the accounts of BP p.l.c. including the group’s consolidated financial statements.
Total fees for 2007 include $7 million of additional fees for 2006 (2006 includes $5 million of additional fees for 2005 and 2005 includes $4 million of
additional fees for 2004). Auditors’ remuneration is included in the income statement within distribution and administration expenses.
The tax services relate to income tax and indirect tax compliance, employee tax services and tax advisory services.
The audit committee has established pre-approval policies and procedures for the engagement of Ernst & Young to render audit and certain
assurance and tax services. The audit fees payable to Ernst & Young are reviewed by the audit committee in the context of other global companies for
cost-effectiveness. Ernst & Young performed further assurance and tax services that were not prohibited by regulatory or other professional
requirements and were pre-approved by the committee. Ernst & Young is engaged for these services when its expertise and experience of BP are
important. Most of this work is of an audit nature. Tax services were awarded either through a full competitive tender process or following an
assessment of the expertise of Ernst & Young compared with that of other potential service providers. These services are for a fixed term.
0
3
3
1
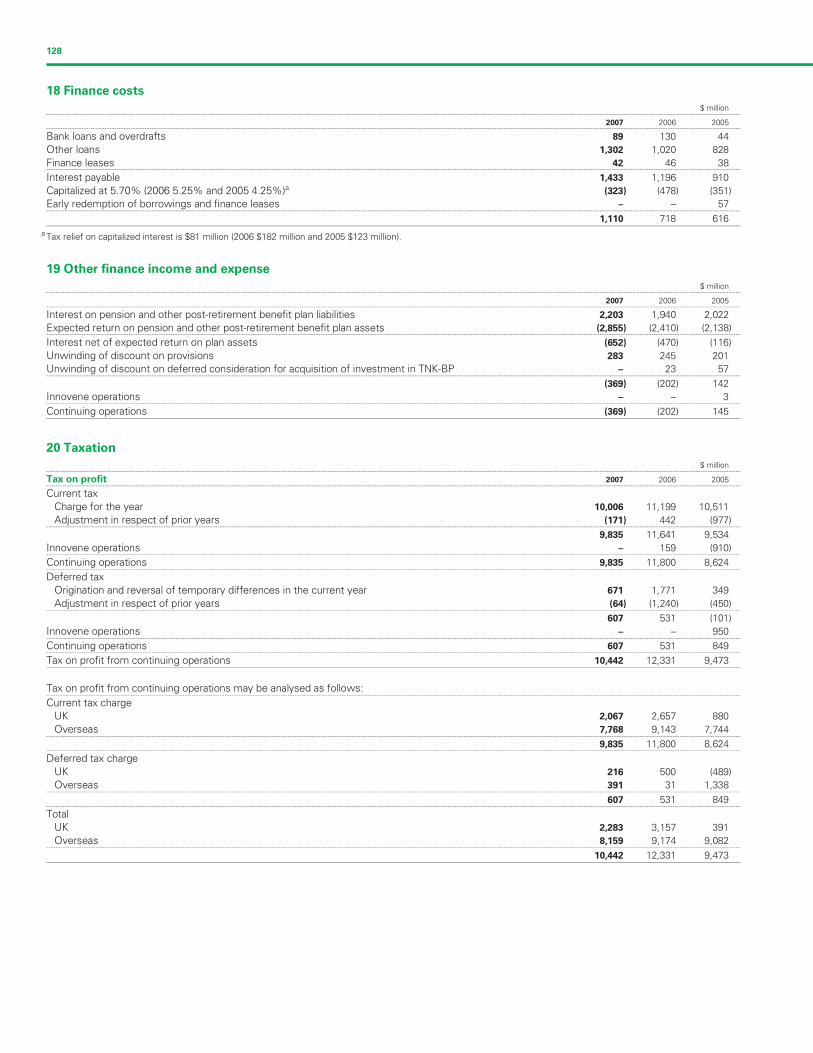
Filename: U54368_doc8.3d Time: 14:50:01 Date: 25/02/08
Checksum: 1119307142
128
18 Finance costs
$ million--------------------------------------------------------------------------------------------------------------------------------------------------------------------------------------------------------------------------------------------------------------------------------------------------------
2007 2006 2005--------------------------------------------------------------------------------------------------------------------------------------------------------------------------------------------------------------------------------------------------------------------------------------------------------
Bank loans and overdrafts 89 130 44
Other loans 1,302 1,020 828
Finance leases 42 46 38--------------------------------------------------------------------------------------------------------------------------------------------------------------------------------------------------------------------------------------------------------------------------------------------------------
Interest payable 1,433 1,196 910
Capitalized at 5.70% (2006 5.25% and 2005 4.25%)a (323) (478) (351)
Early redemption of borrowings and finance leases – – 57--------------------------------------------------------------------------------------------------------------------------------------------------------------------------------------------------------------------------------------------------------------------------------------------------------
1,110 718 616
a Tax relief on capitalized interest is $81 million (2006 $182 million and 2005 $123 million).
19 Other finance income and expense
$ million--------------------------------------------------------------------------------------------------------------------------------------------------------------------------------------------------------------------------------------------------------------------------------------------------------
2007 2006 2005--------------------------------------------------------------------------------------------------------------------------------------------------------------------------------------------------------------------------------------------------------------------------------------------------------
Interest on pension and other post-retirement benefit plan liabilities 2,203 1,940 2,022
Expected return on pension and other post-retirement benefit plan assets (2,855) (2,410) (2,138)--------------------------------------------------------------------------------------------------------------------------------------------------------------------------------------------------------------------------------------------------------------------------------------------------------
Interest net of expected return on plan assets (652) (470) (116)
Unwinding of discount on provisions 283 245 201
Unwinding of discount on deferred consideration for acquisition of investment in TNK-BP – 23 57--------------------------------------------------------------------------------------------------------------------------------------------------------------------------------------------------------------------------------------------------------------------------------------------------------
(369) (202) 142
Innovene operations – – 3--------------------------------------------------------------------------------------------------------------------------------------------------------------------------------------------------------------------------------------------------------------------------------------------------------
Continuing operations (369) (202) 145
20 Taxation
$ million--------------------------------------------------------------------------------------------------------------------------------------------------------------------------------------------------------------------------------------------------------------------------------------------------------
Tax on profit 2007 2006 2005--------------------------------------------------------------------------------------------------------------------------------------------------------------------------------------------------------------------------------------------------------------------------------------------------------
Current tax
Charge for the year 10,006 11,199 10,511
Adjustment in respect of prior years (171) 442 (977)--------------------------------------------------------------------------------------------------------------------------------------------------------------------------------------------------------------------------------------------------------------------------------------------------------
9,835 11,641 9,534
Innovene operations – 159 (910)--------------------------------------------------------------------------------------------------------------------------------------------------------------------------------------------------------------------------------------------------------------------------------------------------------
Continuing operations 9,835 11,800 8,624--------------------------------------------------------------------------------------------------------------------------------------------------------------------------------------------------------------------------------------------------------------------------------------------------------
Deferred tax
Origination and reversal of temporary differences in the current year 671 1,771 349
Adjustment in respect of prior years (64) (1,240) (450)--------------------------------------------------------------------------------------------------------------------------------------------------------------------------------------------------------------------------------------------------------------------------------------------------------
607 531 (101)
Innovene operations – – 950--------------------------------------------------------------------------------------------------------------------------------------------------------------------------------------------------------------------------------------------------------------------------------------------------------
Continuing operations 607 531 849--------------------------------------------------------------------------------------------------------------------------------------------------------------------------------------------------------------------------------------------------------------------------------------------------------
Tax on profit from continuing operations 10,442 12,331 9,473
Tax on profit from continuing operations may be analysed as follows:--------------------------------------------------------------------------------------------------------------------------------------------------------------------------------------------------------------------------------------------------------------------------------------------------------
Current tax charge
UK 2,067 2,657 880
Overseas 7,768 9,143 7,744--------------------------------------------------------------------------------------------------------------------------------------------------------------------------------------------------------------------------------------------------------------------------------------------------------
9,835 11,800 8,624--------------------------------------------------------------------------------------------------------------------------------------------------------------------------------------------------------------------------------------------------------------------------------------------------------
Deferred tax charge
UK 216 500 (489)
Overseas 391 31 1,338--------------------------------------------------------------------------------------------------------------------------------------------------------------------------------------------------------------------------------------------------------------------------------------------------------
607 531 849--------------------------------------------------------------------------------------------------------------------------------------------------------------------------------------------------------------------------------------------------------------------------------------------------------
Total
UK 2,283 3,157 391
Overseas 8,159 9,174 9,082--------------------------------------------------------------------------------------------------------------------------------------------------------------------------------------------------------------------------------------------------------------------------------------------------------
10,442 12,331 9,473
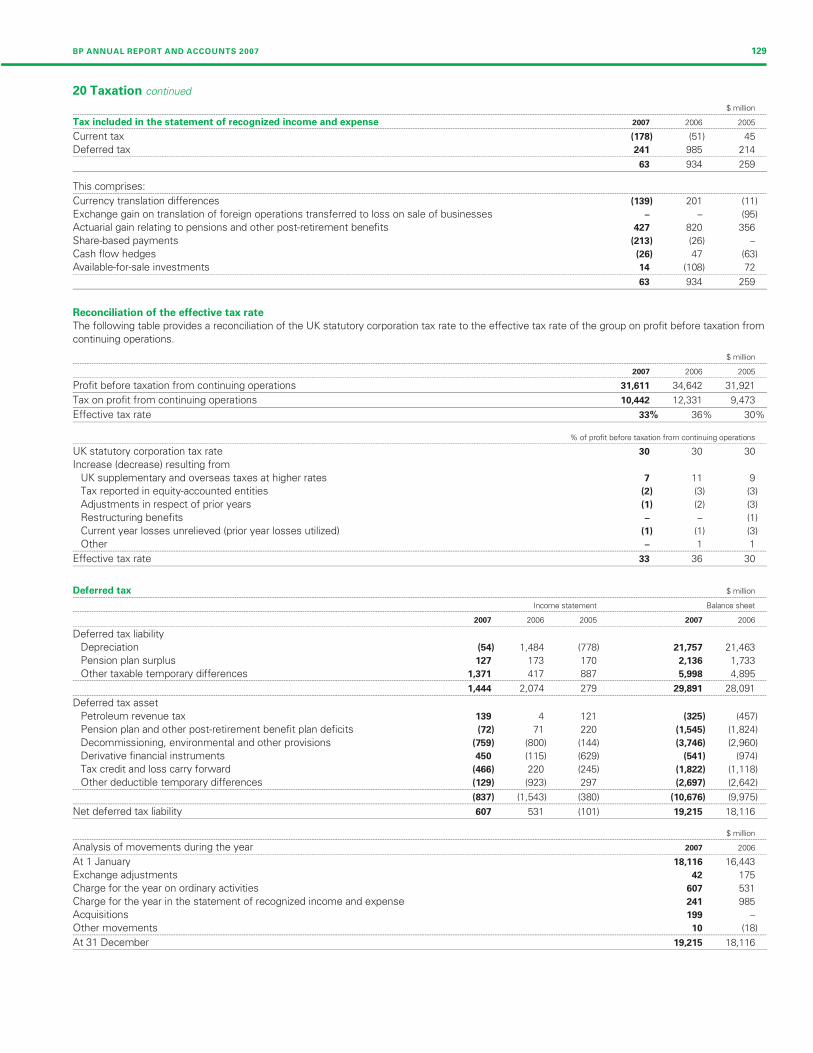
Filename: U54368_doc8.3d Time: 14:50:02 Date: 25/02/08
Checksum: -387343888
BP ANNUAL REPORT AND ACCOUNTS 2007 129
20 Taxation continued
$ million--------------------------------------------------------------------------------------------------------------------------------------------------------------------------------------------------------------------------------------------------------------------------------------------------------
Tax included in the statement of recognized income and expense 2007 2006 2005--------------------------------------------------------------------------------------------------------------------------------------------------------------------------------------------------------------------------------------------------------------------------------------------------------
Current tax (178) (51) 45
Deferred tax 241 985 214--------------------------------------------------------------------------------------------------------------------------------------------------------------------------------------------------------------------------------------------------------------------------------------------------------
63 934 259
This comprises:--------------------------------------------------------------------------------------------------------------------------------------------------------------------------------------------------------------------------------------------------------------------------------------------------------
Currency translation differences (139) 201 (11)
Exchange gain on translation of foreign operations transferred to loss on sale of businesses – – (
Actuarial gain relating to pensions and other post-retirement benefits 427 820 356
Share-based payments (213) (26) –
Cash flow hedges (26) 47 (63)
Available-for-sale investments 14 (108) 72--------------------------------------------------------------------------------------------------------------------------------------------------------------------------------------------------------------------------------------------------------------------------------------------------------
63 934 259
Reconciliation of the effective tax rate
The following table provides a reconciliation of the UK statutory corporation tax rate to the effective tax rate of the group on profit before taxation from
continuing operations.
$ million--------------------------------------------------------------------------------------------------------------------------------------------------------------------------------------------------------------------------------------------------------------------------------------------------------
2007 2006 2005--------------------------------------------------------------------------------------------------------------------------------------------------------------------------------------------------------------------------------------------------------------------------------------------------------
Profit before taxation from continuing operations 31,611 34,642 31,921
Tax on profit from continuing operations 10,442 12,331 9,473
Effective tax rate 33% 36% 30%
% of profit before taxation from continuing operations--------------------------------------------------------------------------------------------------------------------------------------------------------------------------------------------------------------------------------------------------------------------------------------------------------
UK statutory corporation tax rate 30 30 30
Increase (decrease) resulting from
UK supplementary and overseas taxes at higher rates 7 11 9
Tax reported in equity-accounted entities (2) (3) (3)
Adjustments in respect of prior years (1) (2) (3)
Restructuring benefits – – (1)
Current year losses unrelieved (prior year losses utilized) (1) (1) (3)
Other – 1--------------------------------------------------------------------------------------------------------------------------------------------------------------------------------------------------------------------------------------------------------------------------------------------------------
Effective tax rate 33 36 30
Deferred tax $ million--------------------------------------------------------------------------------------------------------------------------------------------------------------------------------------------------------------------------------------------------------------------------------------------------------
Income statement Balance sheet--------------------------------------------------------------------------------------------------------------------------------------------------------------------------------------------------------------------------------------------------------------------------------------------------------
2007 2006 2005 2007 2006--------------------------------------------------------------------------------------------------------------------------------------------------------------------------------------------------------------------------------------------------------------------------------------------------------
Deferred tax liability
Depreciation (54) 1,484 (778) 21,757 21,463
Pension plan surplus 127 173 170 2,136 1,733
Other taxable temporary differences 1,371 417 887 5,998 4,895--------------------------------------------------------------------------------------------------------------------------------------------------------------------------------------------------------------------------------------------------------------------------------------------------------
1,444 2,074 279 29,891 28,091--------------------------------------------------------------------------------------------------------------------------------------------------------------------------------------------------------------------------------------------------------------------------------------------------------
Deferred tax asset
Petroleum revenue tax 139 4 121 (325) (457)
Pension plan and other post-retirement benefit plan deficits (72) 71 220 (1,545) (1,824)
Decommissioning, environmental and other provisions (759) (800) (144) (3,746) (2,960)
Derivative financial instruments 450 (115) (629) (541) (974)
Tax credit and loss carry forward (466) 220 (245) (1,822) (1,118)
Other deductible temporary differences (129) (923) 297 (2,697) (2,642)--------------------------------------------------------------------------------------------------------------------------------------------------------------------------------------------------------------------------------------------------------------------------------------------------------
(837) (1,543) (380) (10,676) (9,975)--------------------------------------------------------------------------------------------------------------------------------------------------------------------------------------------------------------------------------------------------------------------------------------------------------
Net deferred tax liability 607 531 (101) 19,215 18,116
$ million--------------------------------------------------------------------------------------------------------------------------------------------------------------------------------------------------------------------------------------------------------------------------------------------------------
Analysis of movements during the year 2007 2006--------------------------------------------------------------------------------------------------------------------------------------------------------------------------------------------------------------------------------------------------------------------------------------------------------
At 1 January 18,116 16,443
Exchange adjustments 42 175
Charge for the year on ordinary activities 607 531
Charge for the year in the statement of recognized income and expense 241 985
Acquisitions 199 –
Other movements 10 (18)--------------------------------------------------------------------------------------------------------------------------------------------------------------------------------------------------------------------------------------------------------------------------------------------------------
At 31 December 19,215 18,116
95)
1
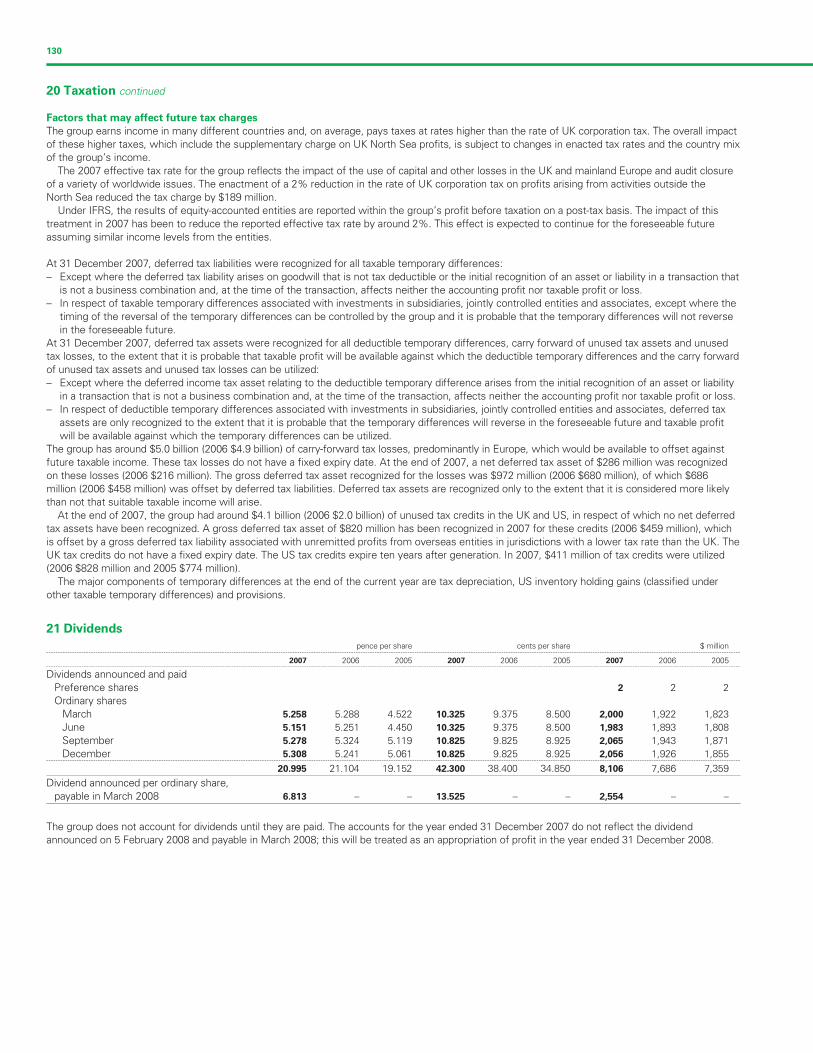
Filename: U54368_doc8.3d Time: 14:50:02 Date: 25/02/08
Checksum: 1351621001
130
20 Taxation continued
Factors that may affect future tax charges
The group earns income in many different countries and, on average, pays taxes at rates higher than the rate of UK corporation tax. The overall impact
of these higher taxes, which include the supplementary charge on UK North Sea profits, is subject to changes in enacted tax rates and the country mix
of the group’s income.
The 2007 effective tax rate for the group reflects the impact of the use of capital and other losses in the UK and mainland Europe and audit closure
of a variety of worldwide issues. The enactment of a 2% reduction in the rate of UK corporation tax on profits arising from activities outside the
North Sea reduced the tax charge by $189 million.
Under IFRS, the results of equity-accounted entities are reported within the group’s profit before taxation on a post-tax basis. The impact of this
treatment in 2007 has been to reduce the reported effective tax rate by around 2%. This effect is expected to continue for the foreseeable future
assuming similar income levels from the entities.
At 31 December 2007, deferred tax liabilities were recognized for all taxable temporary differences:
– Except where the deferred tax liability arises on goodwill that is not tax deductible or the initial recognition of an asset or liability in a transaction that
is not a business combination and, at the time of the transaction, affects neither the accounting profit nor taxable profit or loss.
– In respect of taxable temporary differences associated with investments in subsidiaries, jointly controlled entities and associates, except where the
timing of the reversal of the temporary differences can be controlled by the group and it is probable that the temporary differences will not reverse
in the foreseeable future.
At 31 December 2007, deferred tax assets were recognized for all deductible temporary differences, carry forward of unused tax assets and unused
tax losses, to the extent that it is probable that taxable profit will be available against which the deductible temporary differences and the carry forward
of unused tax assets and unused tax losses can be utilized:
– Except where the deferred income tax asset relating to the deductible temporary difference arises from the initial recognition of an asset or liability
in a transaction that is not a business combination and, at the time of the transaction, affects neither the accounting profit nor taxable profit or loss.
– In respect of deductible temporary differences associated with investments in subsidiaries, jointly controlled entities and associates, deferred tax
assets are only recognized to the extent that it is probable that the temporary differences will reverse in the foreseeable future and taxable profit
will be available against which the temporary differences can be utilized.
The group has around $5.0 billion (2006 $4.9 billion) of carry-forward tax losses, predominantly in Europe, which would be available to offset against
future taxable income. These tax losses do not have a fixed expiry date. At the end of 2007, a net deferred tax asset of $286 million was recognized
on these losses (2006 $216 million). The gross deferred tax asset recognized for the losses was $972 million (2006 $680 million), of which $686
million (2006 $458 million) was offset by deferred tax liabilities. Deferred tax assets are recognized only to the extent that it is considered more likely
than not that suitable taxable income will arise.
At the end of 2007, the group had around $4.1 billion (2006 $2.0 billion) of unused tax credits in the UK and US, in respect of which no net deferred
tax assets have been recognized. A gross deferred tax asset of $820 million has been recognized in 2007 for these credits (2006 $459 million), which
is offset by a gross deferred tax liability associated with unremitted profits from overseas entities in jurisdictions with a lower tax rate than the UK. The
UK tax credits do not have a fixed expiry date. The US tax credits expire ten years after generation. In 2007, $411 million of tax credits were utilized
(2006 $828 million and 2005 $774 million).
The major components of temporary differences at the end of the current year are tax depreciation, US inventory holding gains (classified under
other taxable temporary differences) and provisions.
21 Dividends
pence per share cents per share $ million--------------------------------------------------------------------------------------------------------------------------------------------------------------------------------------------------------------------------------------------------------------------------------------------------------
2007 2006 2005 2007 2006 2005 2007 2006 2005--------------------------------------------------------------------------------------------------------------------------------------------------------------------------------------------------------------------------------------------------------------------------------------------------------
Dividends announced and paid
Preference shares 2 2 2
Ordinary shares
March 5.258 5.288 4.522 10.325 9.375 8.500 2,000 1,922 1,823
June 5.151 5.251 4.450 10.325 9.375 8.500 1,983 1,893 1,808
September 5.278 5.324 5.119 10.825 9.825 8.925 2,065 1,943 1,871
December 5.308 5.241 5.061 10.825 9.825 8.925 2,056 1,926 1,855--------------------------------------------------------------------------------------------------------------------------------------------------------------------------------------------------------------------------------------------------------------------------------------------------------
20.995 21.104 19.152 42.300 38.400 34.850 8,106 7,686 7,359
Dividend announced per ordinary share,
payable in March 2008 6.813 – – 13.525 – – 2,554 – –
The group does not account for dividends until they are paid. The accounts for the year ended 31 December 2007 do not reflect the dividend
announced on 5 February 2008 and payable in March 2008; this will be treated as an appropriation of profit in the year ended 31 December 2008.
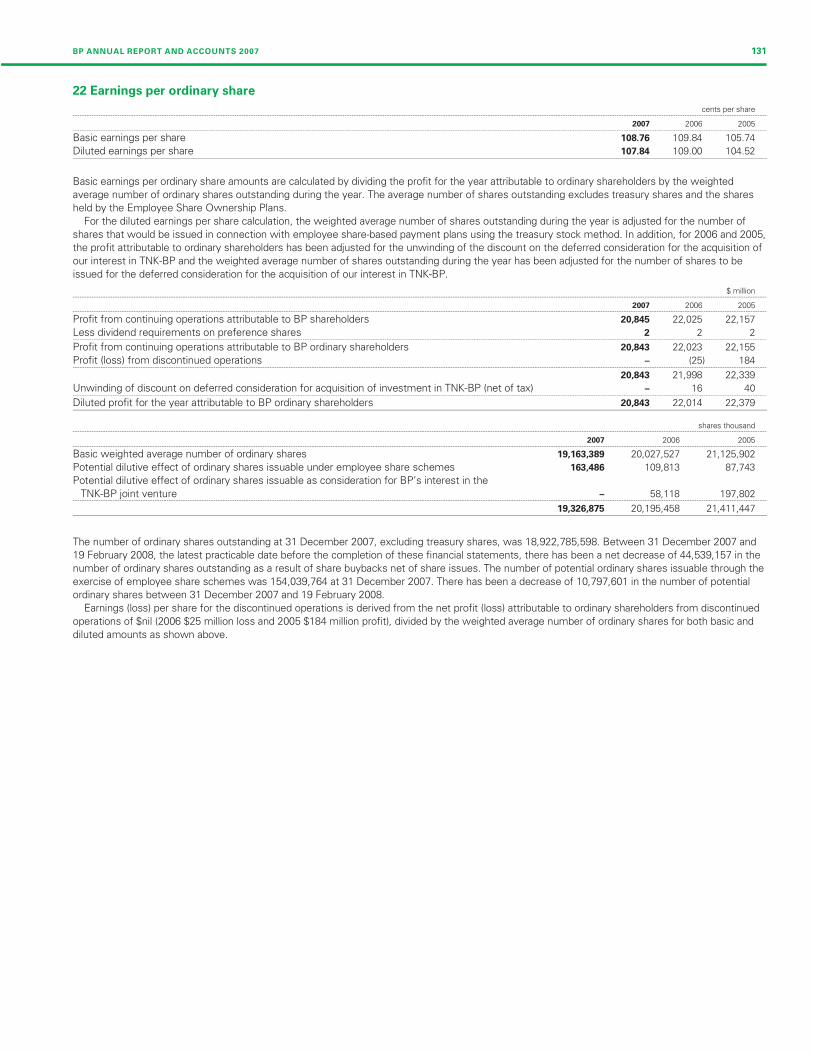
Filename: U54368_doc8.3d Time: 14:50:02 Date: 25/02/08
Checksum: -116957040
BP ANNUAL REPORT AND ACCOUNTS 2007 131
22 Earnings per ordinary share
cents per share--------------------------------------------------------------------------------------------------------------------------------------------------------------------------------------------------------------------------------------------------------------------------------------------------------
2007 2006 2005--------------------------------------------------------------------------------------------------------------------------------------------------------------------------------------------------------------------------------------------------------------------------------------------------------
Basic earnings per share 108.76 109.84 105.74
Diluted earnings per share 107.84 109.00 104.52
Basic earnings per ordinary share amounts are calculated by dividing the profit for the year attributable to ordinary shareholders by the weighted
average number of ordinary shares outstanding during the year. The average number of shares outstanding excludes treasury shares and the shares
held by the Employee Share Ownership Plans.
For the diluted earnings per share calculation, the weighted average number of shares outstanding during the year is adjusted for the number of
shares that would be issued in connection with employee share-based payment plans using the treasury stock method. In addition, for 2006 and 2005,
the profit attributable to ordinary shareholders has been adjusted for the unwinding of the discount on the deferred consideration for the acquisition of
our interest in TNK-BP and the weighted average number of shares outstanding during the year has been adjusted for the number of shares to be
issued for the deferred consideration for the acquisition of our interest in TNK-BP.
$ million--------------------------------------------------------------------------------------------------------------------------------------------------------------------------------------------------------------------------------------------------------------------------------------------------------
2007 2006 2005--------------------------------------------------------------------------------------------------------------------------------------------------------------------------------------------------------------------------------------------------------------------------------------------------------
Profit from continuing operations attributable to BP shareholders 20,845 22,025 22,157
Less dividend requirements on preference shares 2 2--------------------------------------------------------------------------------------------------------------------------------------------------------------------------------------------------------------------------------------------------------------------------------------------------------
Profit from continuing operations attributable to BP ordinary shareholders 20,843 22,023 22,155
Profit (loss) from discontinued operations – (25) 184--------------------------------------------------------------------------------------------------------------------------------------------------------------------------------------------------------------------------------------------------------------------------------------------------------
20,843 21,998 22,339
Unwinding of discount on deferred consideration for acquisition of investment in TNK-BP (net of tax) – 16 40--------------------------------------------------------------------------------------------------------------------------------------------------------------------------------------------------------------------------------------------------------------------------------------------------------
Diluted profit for the year attributable to BP ordinary shareholders 20,843 22,014 22,379
shares thousand--------------------------------------------------------------------------------------------------------------------------------------------------------------------------------------------------------------------------------------------------------------------------------------------------------
2007 2006 2005--------------------------------------------------------------------------------------------------------------------------------------------------------------------------------------------------------------------------------------------------------------------------------------------------------
Basic weighted average number of ordinary shares 19,163,389 20,027,527 21,125,902
Potential dilutive effect of ordinary shares issuable under employee share schemes 163,486 109,813 87,743
Potential dilutive effect of ordinary shares issuable as consideration for BP’s interest in the
TNK-BP joint venture – 58,118 197,802--------------------------------------------------------------------------------------------------------------------------------------------------------------------------------------------------------------------------------------------------------------------------------------------------------
19,326,875 20,195,458 21,411,447
The number of ordinary shares outstanding at 31 December 2007, excluding treasury shares, was 18,922,785,598. Between 31 December 2007 and
19 February 2008, the latest practicable date before the completion of these financial statements, there has been a net decrease of 44,539,157 in the
number of ordinary shares outstanding as a result of share buybacks net of share issues. The number of potential ordinary shares issuable through the
exercise of employee share schemes was 154,039,764 at 31 December 2007. There has been a decrease of 10,797,601 in the number of potential
ordinary shares between 31 December 2007 and 19 February 2008.
Earnings (loss) per share for the discontinued operations is derived from the net profit (loss) attributable to ordinary shareholders from discontinued
operations of $nil (2006 $25 million loss and 2005 $184 million profit), divided by the weighted average number of ordinary shares for both basic and
diluted amounts as shown above.
2

Filename: U54368_doc8.3d Time: 14:50:02 Date: 25/02/08
Checksum: 546767763
132
23 Property, plant and equipment
$ million--------------------------------------------------------------------------------------------------------------------------------------------------------------------------------------------------------------------------------------------------------------------------------------------------------
Land and Plant, Fixtures, fittings Oil depots,land Oil and gas machinery and office storage tanks and
improvements Buildings properties and equipment equipment Transportation service stations Total--------------------------------------------------------------------------------------------------------------------------------------------------------------------------------------------------------------------------------------------------------------------------------------------------------
Cost
At 1 January 2007 4,442 3,129 123,493 32,203 3,006 11,930 11,076 189,279
Exchange adjustments 271 148 22 1,182 73 32 733 2,461
Acquisitions – – – 910 – – –
Additions 78 171 12,107 3,662 466 181 643 17,308
Transfers – – 422 – – – –
Reclassified as assets held for sale (16) – – (1,114) – – – (1,130)
Deletions (259) (298) (1,429) (478) (376) (277) (1,042) (4,159)--------------------------------------------------------------------------------------------------------------------------------------------------------------------------------------------------------------------------------------------------------------------------------------------------------
At 31 December 2007 4,516 3,150 134,615 36,365 3,169 11,866 11,410 205,091
Depreciation
At 1 January 2007 675 1,470 66,189 16,189 1,762 6,876 5,119 98,280
Exchange adjustments 25 89 19 556 45 16 299 1,049
Charge for the year 52 98 7,370 1,266 341 373 741 10,241
Impairment losses 86 62 189 236 9 14 643 1,239
Impairment reversals – – (237) – – – –
Reclassified as assets held for sale (9) – – (486) – – – (495)
Deletions (111) (186) (1,044) (344) (337) (153) (800) (2,975)--------------------------------------------------------------------------------------------------------------------------------------------------------------------------------------------------------------------------------------------------------------------------------------------------------
At 31 December 2007 718 1,533 72,486 17,417 1,820 7,126 6,002 107,102
Net book amount at 31 December
2007 3,798 1,617 62,129 18,948 1,349 4,740 5,408 97,989
Cost
At 1 January 2006 4,576 2,835 114,413 30,341 2,247 13,196 11,100 178,708
Exchange adjustments 255 239 72 1,028 138 27 517 2,276
Acquisitions – – – 16 – – –
Additions 81 381 11,264 2,146 841 22 918 15,653
Transfersa – – (628) – (1) – – (629)
Reclassified as assets held for sale (15) (1) – (842) – (1) (47) (906)
Deletions (455) (325) (1,628) (486) (219) (1,314) (1,412) (5,839)--------------------------------------------------------------------------------------------------------------------------------------------------------------------------------------------------------------------------------------------------------------------------------------------------------
At 31 December 2006 4,442 3,129 123,493 32,203 3,006 11,930 11,076 189,279
Depreciation
At 1 January 2006 709 1,437 62,192 14,978 1,450 7,034 4,961 92,761
Exchange adjustments 15 147 54 552 107 12 154 1,041
Charge for the year 52 149 6,214 1,059 418 301 718 8,911
Impairment losses 87 5 4 98 – 1 9 204
Impairment reversals – – (340) – – – –
Transfersb – – (887) – (1) – – (888)
Reclassified as assets held for sale – (1) – (325) – (1) (15) (342)
Deletions (188) (267) (1,048) (173) (212) (471) (708) (3,067)--------------------------------------------------------------------------------------------------------------------------------------------------------------------------------------------------------------------------------------------------------------------------------------------------------
At 31 December 2006 675 1,470 66,189 16,189 1,762 6,876 5,119 98,280
Net book amount at 31 December
2006 3,767 1,659 57,304 16,014 1,244 5,054 5,957 90,999
Assets held under finance leases at
net book amount included above
At 31 December 2007 – 17 155 185 – 11 24 392
At 31 December 2006 5 18 42 341 1 9 29 445
Decommissioning asset at net book amount included above--------------------------------------------------------------------------------------------------------------------------------------------------------------------------------------------------------------------------------------------------------------------------------------------------------
Cost Depreciation Net--------------------------------------------------------------------------------------------------------------------------------------------------------------------------------------------------------------------------------------------------------------------------------------------------------
At 31 December 2007 7,851 3,328 4,523
At 31 December 2006 6,391 2,558 3,833
Assets under construction included above--------------------------------------------------------------------------------------------------------------------------------------------------------------------------------------------------------------------------------------------------------------------------------------------------------
At 31 December 2007 18,658
At 31 December 2006 17,800
a Includes $1,087 million transferred to equity-accounted investments.b Includes $890 million transferred to equity-accounted investments.
910
422
(237)
16
(340)
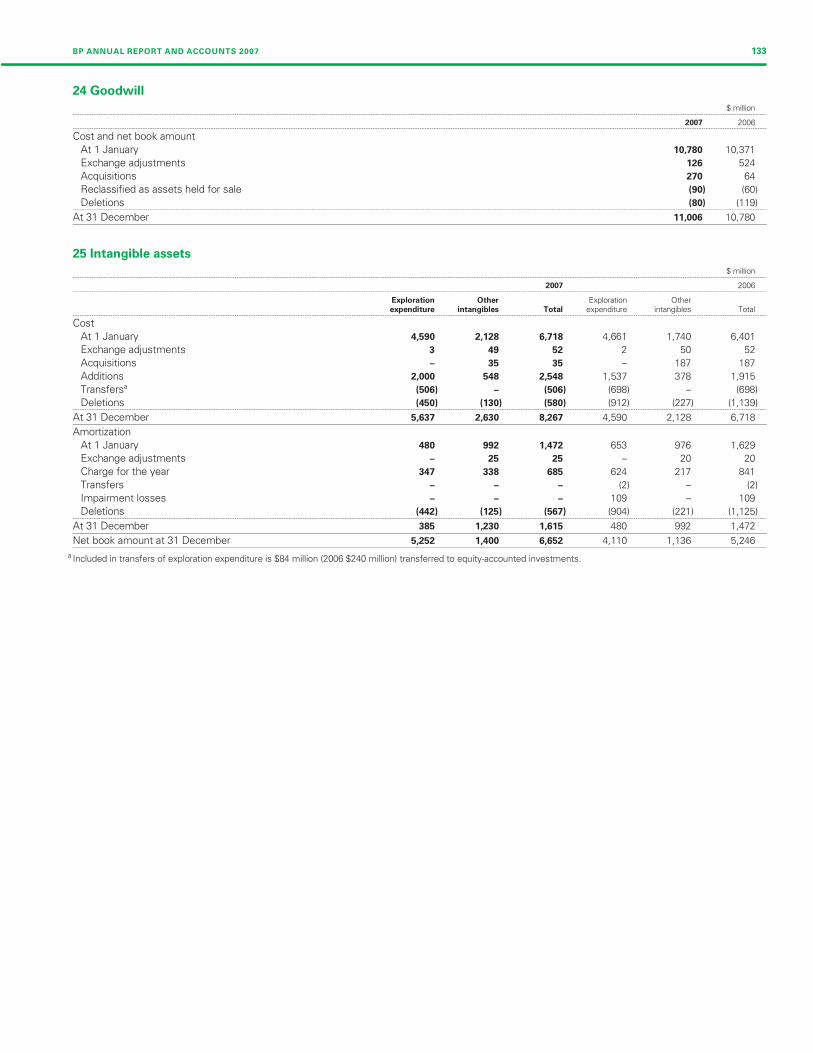
Filename: U54368_doc8.3d Time: 14:50:03 Date: 25/02/08
Checksum: 54139634
BP ANNUAL REPORT AND ACCOUNTS 2007 133
24 Goodwill
$ million--------------------------------------------------------------------------------------------------------------------------------------------------------------------------------------------------------------------------------------------------------------------------------------------------------
2007 2006--------------------------------------------------------------------------------------------------------------------------------------------------------------------------------------------------------------------------------------------------------------------------------------------------------
Cost and net book amount
At 1 January 10,780 10,371
Exchange adjustments 126 524
Acquisitions 270 64
Reclassified as assets held for sale (90) (60)
Deletions (80) (119)--------------------------------------------------------------------------------------------------------------------------------------------------------------------------------------------------------------------------------------------------------------------------------------------------------
At 31 December 11,006 10,780
25 Intangible assets
$ million--------------------------------------------------------------------------------------------------------------------------------------------------------------------------------------------------------------------------------------------------------------------------------------------------------
2007 2006--------------------------------------------------------------------------------------------------------------------------------------------------------------------------------------------------------------------------------------------------------------------------------------------------------
Exploration Other Exploration Otherexpenditure intangibles Total expenditure intangibles Total
--------------------------------------------------------------------------------------------------------------------------------------------------------------------------------------------------------------------------------------------------------------------------------------------------------
Cost
At 1 January 4,590 2,128 6,718 4,661 1,740 6,401
Exchange adjustments 3 49 52 2 50
Acquisitions – 35 35 – 187 187
Additions 2,000 548 2,548 1,537 378 1,915
Transfersa (506) – (506) (698) – (698)
Deletions (450) (130) (580) (912) (227) (1,139)--------------------------------------------------------------------------------------------------------------------------------------------------------------------------------------------------------------------------------------------------------------------------------------------------------
At 31 December 5,637 2,630 8,267 4,590 2,128 6,718
Amortization
At 1 January 480 992 1,472 653 976 1,629
Exchange adjustments – 25 25 – 20
Charge for the year 347 338 685 624 217 841
Transfers – – – (2) – (2)
Impairment losses – – – 109 – 109
Deletions (442) (125) (567) (904) (221) (1,125)--------------------------------------------------------------------------------------------------------------------------------------------------------------------------------------------------------------------------------------------------------------------------------------------------------
At 31 December 385 1,230 1,615 480 992 1,472
Net book amount at 31 December 5,252 1,400 6,652 4,110 1,136 5,246
a Included in transfers of exploration expenditure is $84 million (2006 $240 million) transferred to equity-accounted investments.
52
20
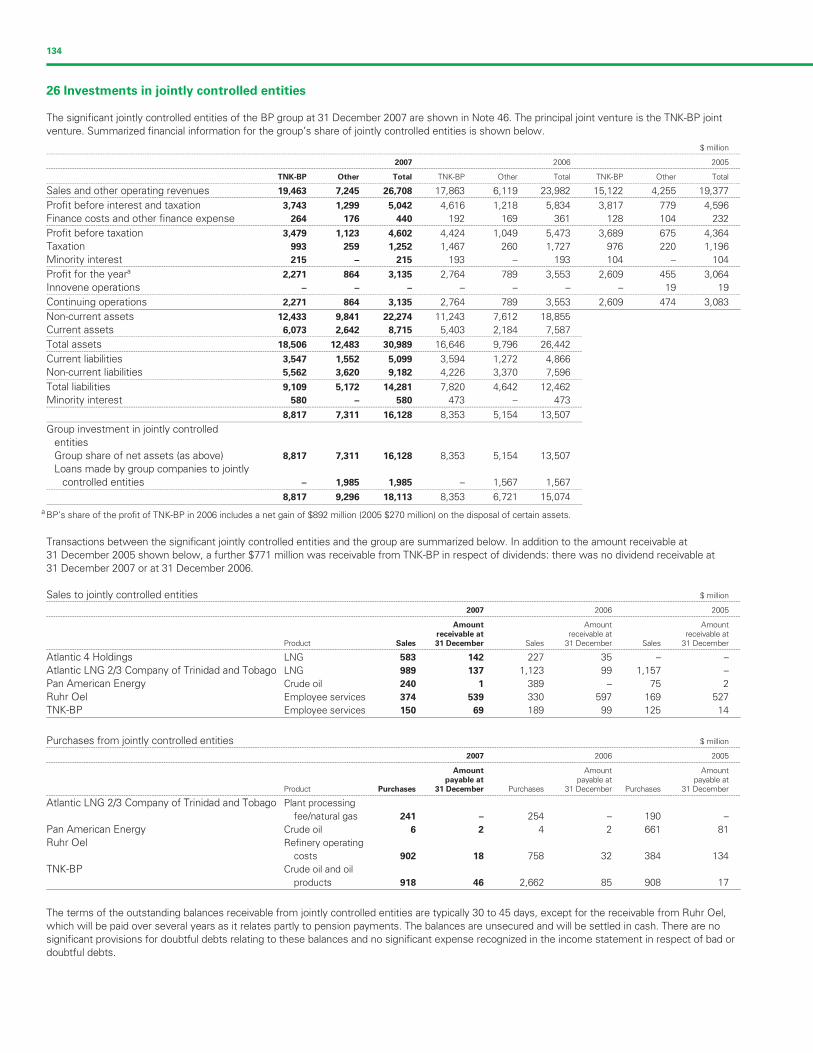
Filename: U54368_doc8.3d Time: 14:50:03 Date: 25/02/08
Checksum: -2029843473
134
26 Investments in jointly controlled entities
The significant jointly controlled entities of the BP group at 31 December 2007 are shown in Note 46. The principal joint venture is the TNK-BP joint
venture. Summarized financial information for the group’s share of jointly controlled entities is shown below.
$ million--------------------------------------------------------------------------------------------------------------------------------------------------------------------------------------------------------------------------------------------------------------------------------------------------------
2007 2006 2005--------------------------------------------------------------------------------------------------------------------------------------------------------------------------------------------------------------------------------------------------------------------------------------------------------
TNK-BP Other Total TNK-BP Other Total TNK-BP Other Total--------------------------------------------------------------------------------------------------------------------------------------------------------------------------------------------------------------------------------------------------------------------------------------------------------
Sales and other operating revenues 19,463 7,245 26,708 17,863 6,119 23,982 15,122 4,255 19,377--------------------------------------------------------------------------------------------------------------------------------------------------------------------------------------------------------------------------------------------------------------------------------------------------------
Profit before interest and taxation 3,743 1,299 5,042 4,616 1,218 5,834 3,817 779 4,596
Finance costs and other finance expense 264 176 440 192 169 361 128 104 232--------------------------------------------------------------------------------------------------------------------------------------------------------------------------------------------------------------------------------------------------------------------------------------------------------
Profit before taxation 3,479 1,123 4,602 4,424 1,049 5,473 3,689 675 4,364
Taxation 993 259 1,252 1,467 260 1,727 976 220 1,196
Minority interest 215 – 215 193 – 193 104 – 104--------------------------------------------------------------------------------------------------------------------------------------------------------------------------------------------------------------------------------------------------------------------------------------------------------
Profit for the yeara 2,271 864 3,135 2,764 789 3,553 2,609 455 3,064
Innovene operations – – – – – – – 19--------------------------------------------------------------------------------------------------------------------------------------------------------------------------------------------------------------------------------------------------------------------------------------------------------
Continuing operations 2,271 864 3,135 2,764 789 3,553 2,609 474 3,083
Non-current assets 12,433 9,841 22,274 11,243 7,612 18,855
Current assets 6,073 2,642 8,715 5,403 2,184 7,587------------------------------------------------------------------------------------------------------------------------------------------------------------------------------------------------------------------------------------
Total assets 18,506 12,483 30,989 16,646 9,796 26,442------------------------------------------------------------------------------------------------------------------------------------------------------------------------------------------------------------------------------------
Current liabilities 3,547 1,552 5,099 3,594 1,272 4,866
Non-current liabilities 5,562 3,620 9,182 4,226 3,370 7,596------------------------------------------------------------------------------------------------------------------------------------------------------------------------------------------------------------------------------------
Total liabilities 9,109 5,172 14,281 7,820 4,642 12,462
Minority interest 580 – 580 473 – 473------------------------------------------------------------------------------------------------------------------------------------------------------------------------------------------------------------------------------------
8,817 7,311 16,128 8,353 5,154 13,507
Group investment in jointly controlled
entities
Group share of net assets (as above) 8,817 7,311 16,128 8,353 5,154 13,507
Loans made by group companies to jointly
controlled entities – 1,985 1,985 – 1,567 1,567------------------------------------------------------------------------------------------------------------------------------------------------------------------------------------------------------------------------------------
8,817 9,296 18,113 8,353 6,721 15,074
a BP’s share of the profit of TNK-BP in 2006 includes a net gain of $892 million (2005 $270 million) on the disposal of certain assets.
Transactions between the significant jointly controlled entities and the group are summarized below. In addition to the amount receivable at
31 December 2005 shown below, a further $771 million was receivable from TNK-BP in respect of dividends: there was no dividend receivable at
31 December 2007 or at 31 December 2006.
Sales to jointly controlled entities $ million--------------------------------------------------------------------------------------------------------------------------------------------------------------------------------------------------------------------------------------------------------------------------------------------------------
2007 2006 2005--------------------------------------------------------------------------------------------------------------------------------------------------------------------------------------------------------------------------------------------------------------------------------------------------------
Amount Amount Amountreceivable at receivable at receivable at
Product Sales 31 December Sales 31 December Sales 31 December--------------------------------------------------------------------------------------------------------------------------------------------------------------------------------------------------------------------------------------------------------------------------------------------------------
Atlantic 4 Holdings LNG 583 142 227 35 – –
Atlantic LNG 2/3 Company of Trinidad and Tobago LNG 989 137 1,123 99 1,157 –
Pan American Energy Crude oil 240 1 389 – 75 2
Ruhr Oel Employee services 374 539 330 597 169 527
TNK-BP Employee services 150 69 189 99 125 14
Purchases from jointly controlled entities $ million--------------------------------------------------------------------------------------------------------------------------------------------------------------------------------------------------------------------------------------------------------------------------------------------------------
2007 2006 2005--------------------------------------------------------------------------------------------------------------------------------------------------------------------------------------------------------------------------------------------------------------------------------------------------------
Amount Amount Amountpayable at payable at payable at
Product Purchases 31 December Purchases 31 December Purchases 31 December--------------------------------------------------------------------------------------------------------------------------------------------------------------------------------------------------------------------------------------------------------------------------------------------------------
Atlantic LNG 2/3 Company of Trinidad and Tobago Plant processing
fee/natural gas 241 – 254 – 190 –
Pan American Energy Crude oil 6 2 4 2 661 81
Ruhr Oel Refinery operating
costs 902 18 758 32 384 134
TNK-BP Crude oil and oil
products 918 46 2,662 85 908 17
The terms of the outstanding balances receivable from jointly controlled entities are typically 30 to 45 days, except for the receivable from Ruhr Oel,
which will be paid over several years as it relates partly to pension payments. The balances are unsecured and will be settled in cash. There are no
significant provisions for doubtful debts relating to these balances and no significant expense recognized in the income statement in respect of bad or
doubtful debts.
19
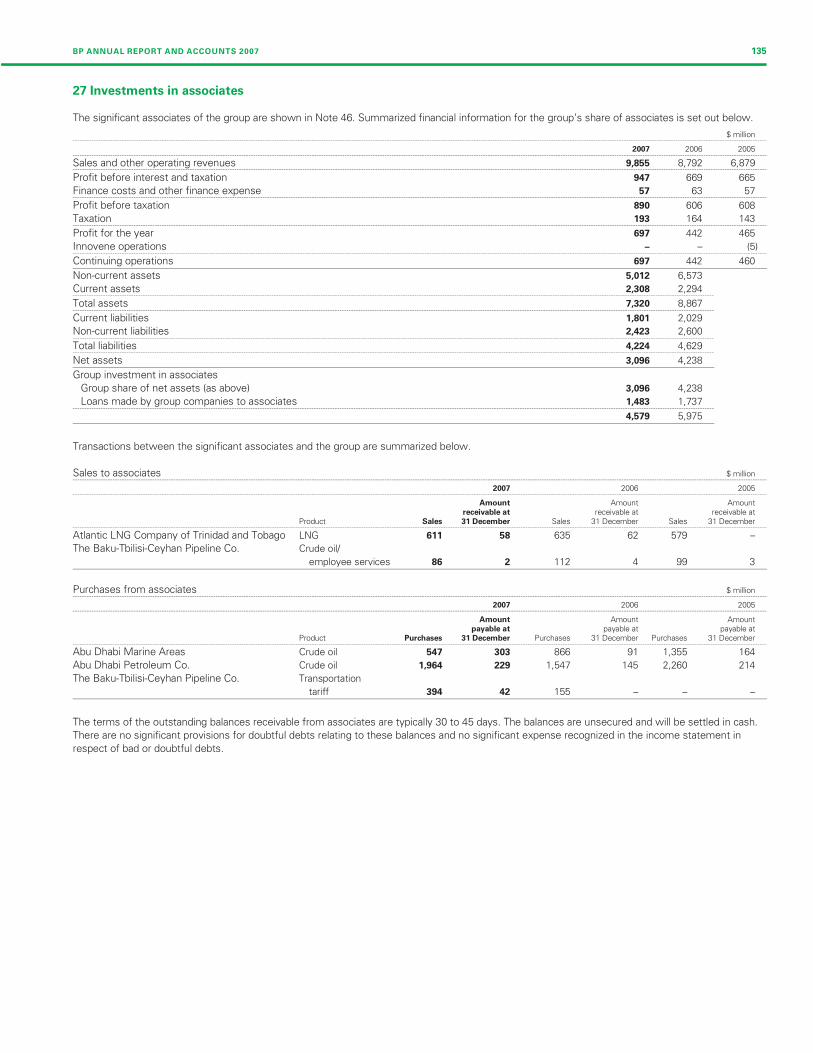
Filename: U54368_doc8.3d Time: 14:50:03 Date: 25/02/08
Checksum: -205991753
BP ANNUAL REPORT AND ACCOUNTS 2007 135
27 Investments in associates
The significant associates of the group are shown in Note 46. Summarized financial information for the group’s share of associates is set out below.
$ million--------------------------------------------------------------------------------------------------------------------------------------------------------------------------------------------------------------------------------------------------------------------------------------------------------
2007 2006 2005--------------------------------------------------------------------------------------------------------------------------------------------------------------------------------------------------------------------------------------------------------------------------------------------------------
Sales and other operating revenues 9,855 8,792 6,879--------------------------------------------------------------------------------------------------------------------------------------------------------------------------------------------------------------------------------------------------------------------------------------------------------
Profit before interest and taxation 947 669 665
Finance costs and other finance expense 57 63 57--------------------------------------------------------------------------------------------------------------------------------------------------------------------------------------------------------------------------------------------------------------------------------------------------------
Profit before taxation 890 606 608
Taxation 193 164 143--------------------------------------------------------------------------------------------------------------------------------------------------------------------------------------------------------------------------------------------------------------------------------------------------------
Profit for the year 697 442 465
Innovene operations – – (5)--------------------------------------------------------------------------------------------------------------------------------------------------------------------------------------------------------------------------------------------------------------------------------------------------------
Continuing operations 697 442 460
Non-current assets 5,012 6,573
Current assets 2,308 2,294----------------------------------------------------------------------------------------------------------------------------------------- -----------------------------------------------------------------------------------------------------------------------------------------
Total assets 7,320 8,867----------------------------------------------------------------------------------------------------------------------------------------- -----------------------------------------------------------------------------------------------------------------------------------------
Current liabilities 1,801 2,029
Non-current liabilities 2,423 2,600----------------------------------------------------------------------------------------------------------------------------------------- -----------------------------------------------------------------------------------------------------------------------------------------
Total liabilities 4,224 4,629----------------------------------------------------------------------------------------------------------------------------------------- -----------------------------------------------------------------------------------------------------------------------------------------
Net assets 3,096 4,238
Group investment in associates
Group share of net assets (as above) 3,096 4,238
Loans made by group companies to associates 1,483 1,737----------------------------------------------------------------------------------------------------------------------------------------- -----------------------------------------------------------------------------------------------------------------------------------------
4,579 5,975
Transactions between the significant associates and the group are summarized below.
Sales to associates $ million--------------------------------------------------------------------------------------------------------------------------------------------------------------------------------------------------------------------------------------------------------------------------------------------------------
2007 2006 2005--------------------------------------------------------------------------------------------------------------------------------------------------------------------------------------------------------------------------------------------------------------------------------------------------------
Amount Amount Amountreceivable at receivable at receivable at
Product Sales 31 December Sales 31 December Sales 31 December--------------------------------------------------------------------------------------------------------------------------------------------------------------------------------------------------------------------------------------------------------------------------------------------------------
Atlantic LNG Company of Trinidad and Tobago LNG 611 58 635 62 579 –
The Baku-Tbilisi-Ceyhan Pipeline Co. Crude oil/
employee services 86 2 112 4 99 3
Purchases from associates $ million--------------------------------------------------------------------------------------------------------------------------------------------------------------------------------------------------------------------------------------------------------------------------------------------------------
2007 2006 2005--------------------------------------------------------------------------------------------------------------------------------------------------------------------------------------------------------------------------------------------------------------------------------------------------------
Amount Amount Amountpayable at payable at payable at
Product Purchases 31 December Purchases 31 December Purchases 31 December--------------------------------------------------------------------------------------------------------------------------------------------------------------------------------------------------------------------------------------------------------------------------------------------------------
Abu Dhabi Marine Areas Crude oil 547 303 866 91 1,355 164
Abu Dhabi Petroleum Co. Crude oil 1,964 229 1,547 145 2,260 214
The Baku-Tbilisi-Ceyhan Pipeline Co. Transportation
tariff 394 42 155 – – –
The terms of the outstanding balances receivable from associates are typically 30 to 45 days. The balances are unsecured and will be settled in cash.
There are no significant provisions for doubtful debts relating to these balances and no significant expense recognized in the income statement in
respect of bad or doubtful debts.
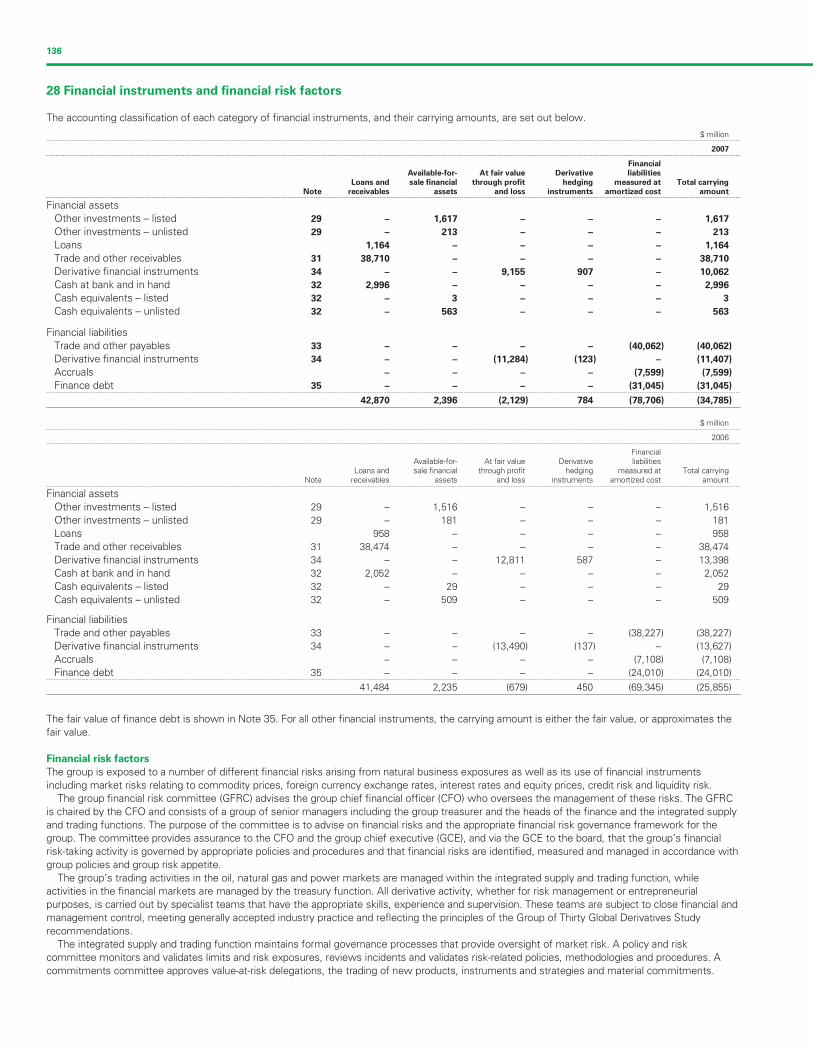
Filename: U54368_doc8.3d Time: 14:50:04 Date: 25/02/08
Checksum: 1180088478
136
28 Financial instruments and financial risk factors
The accounting classification of each category of financial instruments, and their carrying amounts, are set out below.
$ million--------------------------------------------------------------------------------------------------------------------------------------------------------------------------------------------------------------------------------------------------------------------------------------------------------
2007--------------------------------------------------------------------------------------------------------------------------------------------------------------------------------------------------------------------------------------------------------------------------------------------------------
Financial
Available-for- At fair value Derivative liabilities
Loans and sale financial through profit hedging measured at Total carrying
Note receivables assets and loss instruments amortized cost amount--------------------------------------------------------------------------------------------------------------------------------------------------------------------------------------------------------------------------------------------------------------------------------------------------------
Financial assets
Other investments – listed 29 – 1,617 – – – 1,617
Other investments – unlisted 29 – 213 – – – 213
Loans 1,164 – – – – 1,
Trade and other receivables 31 38,710 – – – – 38,
Derivative financial instruments 34 – – 9,155 907 – 10,062
Cash at bank and in hand 32 2,996 – – – – 2,
Cash equivalents – listed 32 – 3 – – –
Cash equivalents – unlisted 32 – 563 – – – 563
Financial liabilities
Trade and other payables 33 – – – – (40,062) (40,
Derivative financial instruments 34 – – (11,284) (123) – (11,407)
Accruals – – – – (7,599) (7,
Finance debt 35 – – – – (31,045) (31,--------------------------------------------------------------------------------------------------------------------------------------------------------------------------------------------------------------------------------------------------------------------------------------------------------
42,870 2,396 (2,129) 784 (78,706) (34,785)
$ million--------------------------------------------------------------------------------------------------------------------------------------------------------------------------------------------------------------------------------------------------------------------------------------------------------
2006--------------------------------------------------------------------------------------------------------------------------------------------------------------------------------------------------------------------------------------------------------------------------------------------------------
FinancialAvailable-for- At fair value Derivative liabilities
Loans and sale financial through profit hedging measured at Total carryingNote receivables assets and loss instruments amortized cost amount
--------------------------------------------------------------------------------------------------------------------------------------------------------------------------------------------------------------------------------------------------------------------------------------------------------
Financial assets
Other investments – listed 29 – 1,516 – – – 1,516
Other investments – unlisted 29 – 181 – – – 181
Loans 958 – – – – 9
Trade and other receivables 31 38,474 – – – – 38,4
Derivative financial instruments 34 – – 12,811 587 – 13,398
Cash at bank and in hand 32 2,052 – – – – 2,0
Cash equivalents – listed 32 – 29 – – – 29
Cash equivalents – unlisted 32 – 509 – – – 509
Financial liabilities
Trade and other payables 33 – – – – (38,227) (38,2
Derivative financial instruments 34 – – (13,490) (137) – (13,627)
Accruals – – – – (7,108) (7,1
Finance debt 35 – – – – (24,010) (24,0--------------------------------------------------------------------------------------------------------------------------------------------------------------------------------------------------------------------------------------------------------------------------------------------------------
41,484 2,235 (679) 450 (69,345) (25,855)
The fair value of finance debt is shown in Note 35. For all other financial instruments, the carrying amount is either the fair value, or approximates the
fair value.
Financial risk factors
The group is exposed to a number of different financial risks arising from natural business exposures as well as its use of financial instruments
including market risks relating to commodity prices, foreign currency exchange rates, interest rates and equity prices, credit risk and liquidity risk.
The group financial risk committee (GFRC) advises the group chief financial officer (CFO) who oversees the management of these risks. The GFRC
is chaired by the CFO and consists of a group of senior managers including the group treasurer and the heads of the finance and the integrated supply
and trading functions. The purpose of the committee is to advise on financial risks and the appropriate financial risk governance framework for the
group. The committee provides assurance to the CFO and the group chief executive (GCE), and via the GCE to the board, that the group’s financial
risk-taking activity is governed by appropriate policies and procedures and that financial risks are identified, measured and managed in accordance with
group policies and group risk appetite.
The group’s trading activities in the oil, natural gas and power markets are managed within the integrated supply and trading function, while
activities in the financial markets are managed by the treasury function. All derivative activity, whether for risk management or entrepreneurial
purposes, is carried out by specialist teams that have the appropriate skills, experience and supervision. These teams are subject to close financial and
management control, meeting generally accepted industry practice and reflecting the principles of the Group of Thirty Global Derivatives Study
recommendations.
The integrated supply and trading function maintains formal governance processes that provide oversight of market risk. A policy and risk
committee monitors and validates limits and risk exposures, reviews incidents and validates risk-related policies, methodologies and procedures. A
commitments committee approves value-at-risk delegations, the trading of new products, instruments and strategies and material commitments.
164
710
996
3
062)
599)
045)
58
74
52
27)
08)
10)
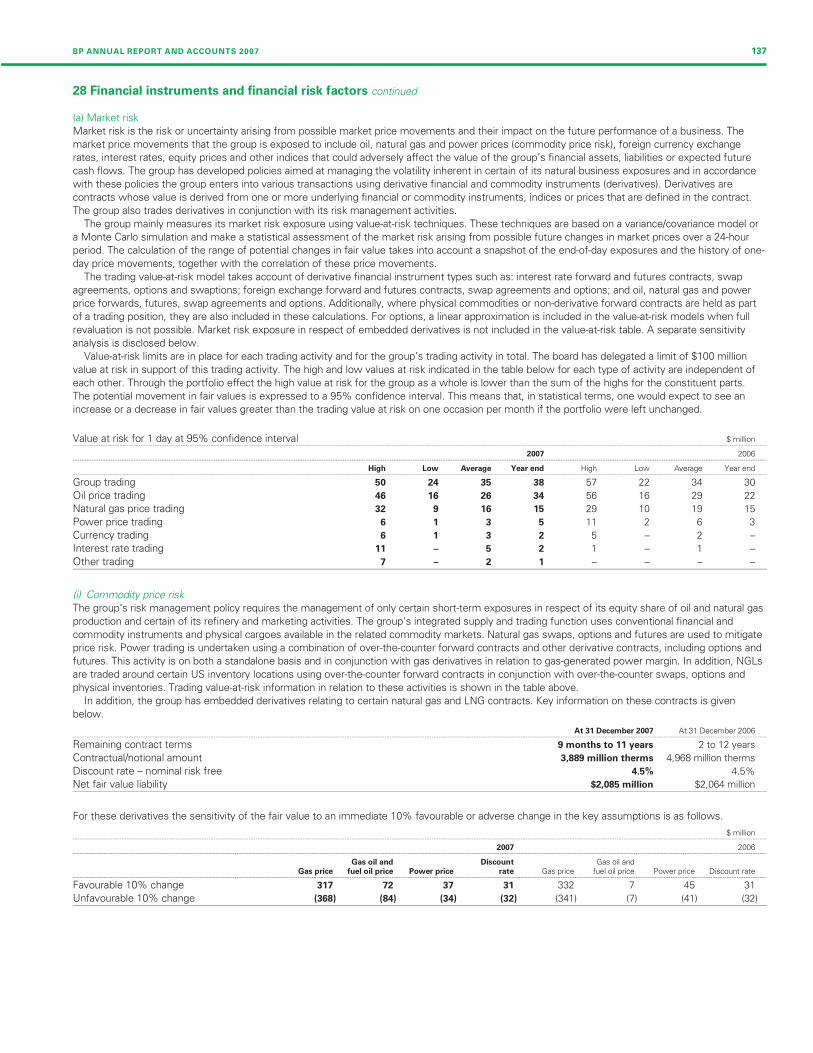
Filename: U54368_doc8.3d Time: 14:50:04 Date: 25/02/08
Checksum: -365561442
BP ANNUAL REPORT AND ACCOUNTS 2007 137
3
–
–
–
28 Financial instruments and financial risk factors continued
(a) Market risk
Market risk is the risk or uncertainty arising from possible market price movements and their impact on the future performance of a business. The
market price movements that the group is exposed to include oil, natural gas and power prices (commodity price risk), foreign currency exchange
rates, interest rates, equity prices and other indices that could adversely affect the value of the group’s financial assets, liabilities or expected future
cash flows. The group has developed policies aimed at managing the volatility inherent in certain of its natural business exposures and in accordance
with these policies the group enters into various transactions using derivative financial and commodity instruments (derivatives). Derivatives are
contracts whose value is derived from one or more underlying financial or commodity instruments, indices or prices that are defined in the contract.
The group also trades derivatives in conjunction with its risk management activities.
The group mainly measures its market risk exposure using value-at-risk techniques. These techniques are based on a variance/covariance model or
a Monte Carlo simulation and make a statistical assessment of the market risk arising from possible future changes in market prices over a 24-hour
period. The calculation of the range of potential changes in fair value takes into account a snapshot of the end-of-day exposures and the history of one-
day price movements, together with the correlation of these price movements.
The trading value-at-risk model takes account of derivative financial instrument types such as: interest rate forward and futures contracts, swap
agreements, options and swaptions; foreign exchange forward and futures contracts, swap agreements and options; and oil, natural gas and power
price forwards, futures, swap agreements and options. Additionally, where physical commodities or non-derivative forward contracts are held as part
of a trading position, they are also included in these calculations. For options, a linear approximation is included in the value-at-risk models when full
revaluation is not possible. Market risk exposure in respect of embedded derivatives is not included in the value-at-risk table. A separate sensitivity
analysis is disclosed below.
Value-at-risk limits are in place for each trading activity and for the group’s trading activity in total. The board has delegated a limit of $100 million
value at risk in support of this trading activity. The high and low values at risk indicated in the table below for each type of activity are independent of
each other. Through the portfolio effect the high value at risk for the group as a whole is lower than the sum of the highs for the constituent parts.
The potential movement in fair values is expressed to a 95% confidence interval. This means that, in statistical terms, one would expect to see an
increase or a decrease in fair values greater than the trading value at risk on one occasion per month if the portfolio were left unchanged.
Value at risk for 1 day at 95% confidence interval $ million--------------------------------------------------------------------------------------------------------------------------------------------------------------------------------------------------------------------------------------------------------------------------------------------------------
2007 2006--------------------------------------------------------------------------------------------------------------------------------------------------------------------------------------------------------------------------------------------------------------------------------------------------------
High Low Average Year end High Low Average Year end--------------------------------------------------------------------------------------------------------------------------------------------------------------------------------------------------------------------------------------------------------------------------------------------------------
Group trading 50 24 35 38 57 22 34 30
Oil price trading 46 16 26 34 56 16 29 22
Natural gas price trading 32 9 16 15 29 10 19 15
Power price trading 6 1 3 5 11 2 6
Currency trading 6 1 3 2 5 – 2
Interest rate trading 11 – 5 2 1 – 1
Other trading 7 – 2 1 – – –
(i) Commodity price risk
The group’s risk management policy requires the management of only certain short-term exposures in respect of its equity share of oil and natural gas
production and certain of its refinery and marketing activities. The group’s integrated supply and trading function uses conventional financial and
commodity instruments and physical cargoes available in the related commodity markets. Natural gas swaps, options and futures are used to mitigate
price risk. Power trading is undertaken using a combination of over-the-counter forward contracts and other derivative contracts, including options and
futures. This activity is on both a standalone basis and in conjunction with gas derivatives in relation to gas-generated power margin. In addition, NGLs
are traded around certain US inventory locations using over-the-counter forward contracts in conjunction with over-the-counter swaps, options and
physical inventories. Trading value-at-risk information in relation to these activities is shown in the table above.
In addition, the group has embedded derivatives relating to certain natural gas and LNG contracts. Key information on these contracts is given
below.
At 31 December 2007 At 31 December 2006--------------------------------------------------------------------------------------------------------------------------------------------------------------------------------------------------------------------------------------------------------------------------------------------------------
Remaining contract terms 9 months to 11 years 2 to 12 years
Contractual/notional amount 3,889 million therms 4,968 million therms
Discount rate – nominal risk free 4.5% 4.5%
Net fair value liability $2,085 million $2,064 million
For these derivatives the sensitivity of the fair value to an immediate 10% favourable or adverse change in the key assumptions is as follows.
$ million--------------------------------------------------------------------------------------------------------------------------------------------------------------------------------------------------------------------------------------------------------------------------------------------------------
2007 2006--------------------------------------------------------------------------------------------------------------------------------------------------------------------------------------------------------------------------------------------------------------------------------------------------------
Gas oil and Discount Gas oil andGas price fuel oil price Power price rate Gas price fuel oil price Power price Discount rate
--------------------------------------------------------------------------------------------------------------------------------------------------------------------------------------------------------------------------------------------------------------------------------------------------------
Favourable 10% change 317 72 37 31 332 7 45 31
Unfavourable 10% change (368) (84) (34) (32) (341) (7) (41) (32)

Filename: U54368_doc8.3d Time: 14:50:04 Date: 25/02/08
Checksum: -1857244474
138
28 Financial instruments and financial risk factors continued
These sensitivities are hypothetical and should not be considered to be predictive of future performance. Changes in fair value generally cannot be
extrapolated because the relationship of change in assumption to change in fair value may not be linear. In addition, for the purposes of this analysis,
in this table, the effect of a variation in a particular assumption on the fair value of the embedded derivatives is calculated independently of any change
in another assumption. In reality, changes in one factor may contribute to changes in another, which may magnify or counteract the sensitivities.
Furthermore, the estimated fair values as disclosed should not be considered indicative of future earnings on these contracts.
(ii) Foreign currency exchange risk
Where the group enters into foreign currency exchange contracts for entrepreneurial trading purposes the activity is controlled using trading value-at-
risk techniques as explained above. This activity is described as currency trading in the value at risk table above.
Since BP has global operations fluctuations in foreign currency exchange rates can have significant effects on the group’s reported results. The
effects of most exchange rate fluctuations are absorbed in business operating results through changing cost competitiveness, lags in market
adjustment to movements in rates and conversion differences accounted for on specific transactions. For this reason, the total effect of exchange rate
fluctuations is not identifiable separately in the group’s reported results. The main underlying economic currency of the group’s cash flows is the US
dollar. This is because BP’s major product, oil, is priced internationally in US dollars. BP’s foreign currency exchange management policy is to minimize
economic and material transactional exposures arising from currency movements against the US dollar. The group co-ordinates the handling of foreign
currency exchange risks centrally, by netting off naturally-occurring opposite exposures wherever possible, and then dealing with any material residual
foreign currency exchange risks.
The group manages these exposures by constantly reviewing the foreign currency economic value at risk and managing such risk to keep the 12-
month foreign currency value at risk below $200 million. At 31 December 2007, the foreign currency value at risk was $60 million (2006 $107 million).
At no point over the past two years did the value at risk exceed the maximum risk limit. The most significant exposures relate to capital expenditure
commitments and other UK and European operational requirements, for which a hedging programme is in place and hedge accounting is claimed as
outlined in Note 34.
For highly probable forecast capital expenditures the group locks in the US-dollar cost of non-US dollar supplies by using currency futures. The main
exposures are sterling and euro, and at 31 December 2007 open contracts were in place for $732 million sterling and $931 million euro capital
expenditures, with over 80% of the deals maturing within two years (2006 $630 million sterling and $957 million euro capital expenditures with over
95% of the deals maturing within two years).
For other UK and European operational requirements the group predominantly uses cylinders to hedge the estimated exposures on a 12-month
rolling basis at minimal cost. At 31 December 2007, the main open positions consisted of receive sterling, pay US dollar, purchased call and sold put
options for $2,800 million; and receive euro, pay US dollar cylinders for $1,400 million.
In addition, most of the group’s borrowings are in US dollars or are hedged with respect to the US dollar. At 31 December 2007, the total of foreign
currency borrowings not swapped into US dollars amounted to $1,045 million (2006 $957 million). Of this total, $268 million (2006 $300 million) of
these borrowings were denominated in currencies other than the functional currency of the individual operating unit, $191 million in Canadian dollars
and $77 million in Trinidad & Tobago dollars (2006 $224 million in Canadian dollars and $76 million in Trinidad & Tobago dollars). It is estimated that a
10% change in the corresponding exchange rates would result in an exchange gain or loss in the income statement of $27 million (2006 $30 million).
(iii) Interest rate risk
Where the group enters into money market contracts for entrepreneurial trading purposes the activity is controlled using value-at-risk techniques as
described above. This activity is described as interest rate trading in the value at risk table above.
BP is also exposed to interest rate risk from the possibility that changes in interest rates will affect future cash flows or the fair values of its financial
instruments, principally finance debt. While the group issues debt in a variety of currencies based on market opportunities, it uses derivatives to swap
the debt to a US dollar exposure with an overall profile of one-third fixed rate to two-thirds floating rate. The proportion of floating rate debt net of
interest rate swaps at 31 December 2007 was 68% of total finance debt outstanding (2006 73%). The weighted average interest rate on finance debt
is 5% (2006 5%).
The group’s earnings are sensitive to changes in interest rates on the floating rate element of the group’s finance debt. If the interest rates
applicable to floating rate instruments were to have increased by 1% on 1 January 2008, it is estimated that the group’s profit before taxation for
2008 would decrease by approximately $168 million (2006 $180 million). This assumes that the amount and mix of fixed and floating rate debt,
including finance leases, remains unchanged from that in place at 31 December 2007 and that the change in interest rates is effective from the
beginning of the year. Where the interest rate applicable to an instrument is reset during a quarter it is assumed that this occurs at the beginning of
the quarter and remains unchanged for the rest of the year. In reality, the fixed/floating rate mix will fluctuate over the year and interest rates will
change continually. Furthermore, the effect on earnings shown by this analysis does not consider the effect of an overall reduction in economic activity
that could accompany such an increase in interest rates.
(iv) Equity price risk
The group holds equity investments that are classified as non-current available-for-sale financial assets and are measured initially at fair value with
changes in fair value recognized directly in equity. On disposal, accumulated fair value changes are recycled to the income statement. Such
investments are typically made for strategic purposes. At 31 December 2007, it is estimated that a change of 10% in equity prices would result in an
immediate charge or credit to equity of $162 million (2006 $152 million).
At 31 December 2007, 70% of the carrying amount of non-current available-for-sale financial assets represented one equity investment, thus the
group’s exposure is concentrated on changes in the share prices of this equity in particular. For further information see Note 29.
(b) Credit risk
Credit risk is the risk that a customer or counterparty to a financial instrument will fail to perform or fail to pay amounts due causing financial loss to
the group and arises from cash and cash equivalents, derivative financial instruments and deposits with financial institutions and principally from credit
exposures to customers relating to outstanding receivables.
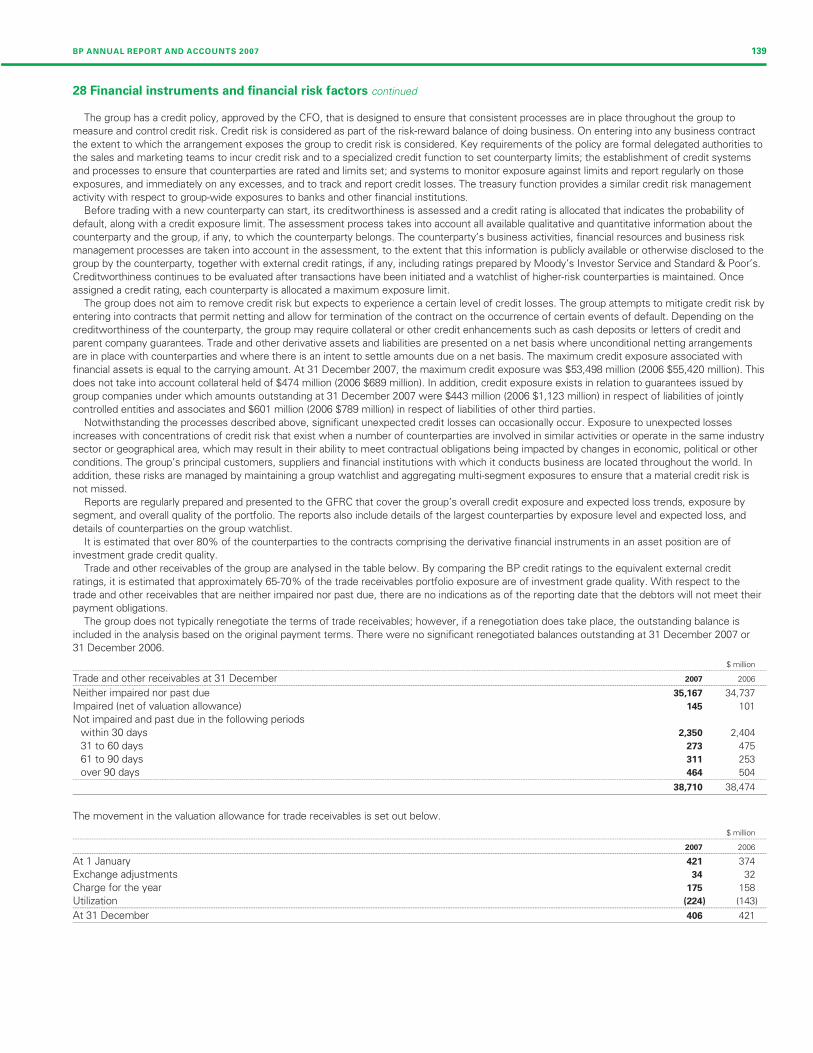
Filename: U54368_doc8.3d Time: 14:50:04 Date: 25/02/08
Checksum: -665315401
BP ANNUAL REPORT AND ACCOUNTS 2007 139
28 Financial instruments and financial risk factors continued
The group has a credit policy, approved by the CFO, that is designed to ensure that consistent processes are in place throughout the group to
measure and control credit risk. Credit risk is considered as part of the risk-reward balance of doing business. On entering into any business contract
the extent to which the arrangement exposes the group to credit risk is considered. Key requirements of the policy are formal delegated authorities to
the sales and marketing teams to incur credit risk and to a specialized credit function to set counterparty limits; the establishment of credit systems
and processes to ensure that counterparties are rated and limits set; and systems to monitor exposure against limits and report regularly on those
exposures, and immediately on any excesses, and to track and report credit losses. The treasury function provides a similar credit risk management
activity with respect to group-wide exposures to banks and other financial institutions.
Before trading with a new counterparty can start, its creditworthiness is assessed and a credit rating is allocated that indicates the probability of
default, along with a credit exposure limit. The assessment process takes into account all available qualitative and quantitative information about the
counterparty and the group, if any, to which the counterparty belongs. The counterparty’s business activities, financial resources and business risk
management processes are taken into account in the assessment, to the extent that this information is publicly available or otherwise disclosed to the
group by the counterparty, together with external credit ratings, if any, including ratings prepared by Moody’s Investor Service and Standard & Poor’s.
Creditworthiness continues to be evaluated after transactions have been initiated and a watchlist of higher-risk counterparties is maintained. Once
assigned a credit rating, each counterparty is allocated a maximum exposure limit.
The group does not aim to remove credit risk but expects to experience a certain level of credit losses. The group attempts to mitigate credit risk by
entering into contracts that permit netting and allow for termination of the contract on the occurrence of certain events of default. Depending on the
creditworthiness of the counterparty, the group may require collateral or other credit enhancements such as cash deposits or letters of credit and
parent company guarantees. Trade and other derivative assets and liabilities are presented on a net basis where unconditional netting arrangements
are in place with counterparties and where there is an intent to settle amounts due on a net basis. The maximum credit exposure associated with
financial assets is equal to the carrying amount. At 31 December 2007, the maximum credit exposure was $53,498 million (2006 $55,420 million). This
does not take into account collateral held of $474 million (2006 $689 million). In addition, credit exposure exists in relation to guarantees issued by
group companies under which amounts outstanding at 31 December 2007 were $443 million (2006 $1,123 million) in respect of liabilities of jointly
controlled entities and associates and $601 million (2006 $789 million) in respect of liabilities of other third parties.
Notwithstanding the processes described above, significant unexpected credit losses can occasionally occur. Exposure to unexpected losses
increases with concentrations of credit risk that exist when a number of counterparties are involved in similar activities or operate in the same industry
sector or geographical area, which may result in their ability to meet contractual obligations being impacted by changes in economic, political or other
conditions. The group’s principal customers, suppliers and financial institutions with which it conducts business are located throughout the world. In
addition, these risks are managed by maintaining a group watchlist and aggregating multi-segment exposures to ensure that a material credit risk is
not missed.
Reports are regularly prepared and presented to the GFRC that cover the group’s overall credit exposure and expected loss trends, exposure by
segment, and overall quality of the portfolio. The reports also include details of the largest counterparties by exposure level and expected loss, and
details of counterparties on the group watchlist.
It is estimated that over 80% of the counterparties to the contracts comprising the derivative financial instruments in an asset position are of
investment grade credit quality.
Trade and other receivables of the group are analysed in the table below. By comparing the BP credit ratings to the equivalent external credit
ratings, it is estimated that approximately 65-70% of the trade receivables portfolio exposure are of investment grade quality. With respect to the
trade and other receivables that are neither impaired nor past due, there are no indications as of the reporting date that the debtors will not meet their
payment obligations.
The group does not typically renegotiate the terms of trade receivables; however, if a renegotiation does take place, the outstanding balance is
included in the analysis based on the original payment terms. There were no significant renegotiated balances outstanding at 31 December 2007 or
31 December 2006.
$ million--------------------------------------------------------------------------------------------------------------------------------------------------------------------------------------------------------------------------------------------------------------------------------------------------------
Trade and other receivables at 31 December 2007 2006--------------------------------------------------------------------------------------------------------------------------------------------------------------------------------------------------------------------------------------------------------------------------------------------------------
Neither impaired nor past due 35,167 34,737
Impaired (net of valuation allowance) 145 101
Not impaired and past due in the following periods
within 30 days 2,350 2,404
31 to 60 days 273 475
61 to 90 days 311 253
over 90 days 464 504--------------------------------------------------------------------------------------------------------------------------------------------------------------------------------------------------------------------------------------------------------------------------------------------------------
38,710 38,474
The movement in the valuation allowance for trade receivables is set out below.
$ million--------------------------------------------------------------------------------------------------------------------------------------------------------------------------------------------------------------------------------------------------------------------------------------------------------
2007 2006--------------------------------------------------------------------------------------------------------------------------------------------------------------------------------------------------------------------------------------------------------------------------------------------------------
At 1 January 421 374
Exchange adjustments 34 32
Charge for the year 175 158
Utilization (224) (143)--------------------------------------------------------------------------------------------------------------------------------------------------------------------------------------------------------------------------------------------------------------------------------------------------------
At 31 December 406 421
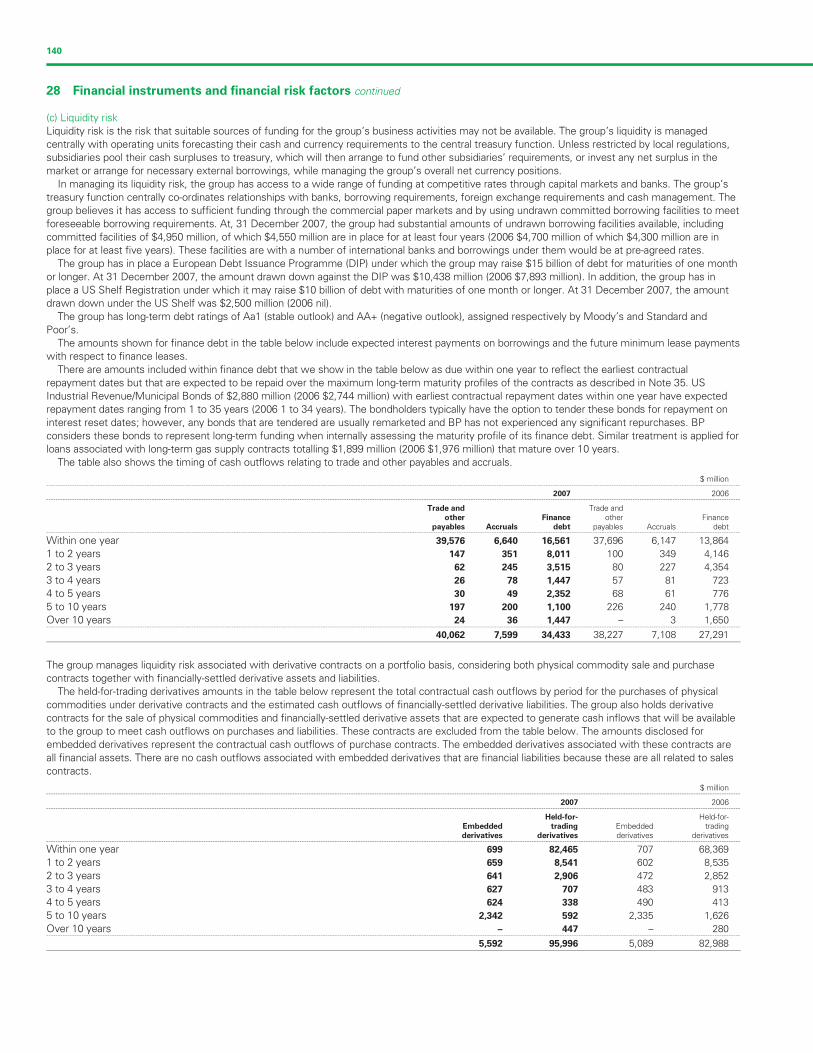
Filename: U54368_doc8.3d Time: 14:50:05 Date: 25/02/08
Checksum: 1874765623
140
28 Financial instruments and financial risk factors continued
(c) Liquidity risk
Liquidity risk is the risk that suitable sources of funding for the group’s business activities may not be available. The group’s liquidity is managed
centrally with operating units forecasting their cash and currency requirements to the central treasury function. Unless restricted by local regulations,
subsidiaries pool their cash surpluses to treasury, which will then arrange to fund other subsidiaries’ requirements, or invest any net surplus in the
market or arrange for necessary external borrowings, while managing the group’s overall net currency positions.
In managing its liquidity risk, the group has access to a wide range of funding at competitive rates through capital markets and banks. The group’s
treasury function centrally co-ordinates relationships with banks, borrowing requirements, foreign exchange requirements and cash management. The
group believes it has access to sufficient funding through the commercial paper markets and by using undrawn committed borrowing facilities to meet
foreseeable borrowing requirements. At, 31 December 2007, the group had substantial amounts of undrawn borrowing facilities available, including
committed facilities of $4,950 million, of which $4,550 million are in place for at least four years (2006 $4,700 million of which $4,300 million are in
place for at least five years). These facilities are with a number of international banks and borrowings under them would be at pre-agreed rates.
The group has in place a European Debt Issuance Programme (DIP) under which the group may raise $15 billion of debt for maturities of one month
or longer. At 31 December 2007, the amount drawn down against the DIP was $10,438 million (2006 $7,893 million). In addition, the group has in
place a US Shelf Registration under which it may raise $10 billion of debt with maturities of one month or longer. At 31 December 2007, the amount
drawn down under the US Shelf was $2,500 million (2006 nil).
The group has long-term debt ratings of Aa1 (stable outlook) and AA+ (negative outlook), assigned respectively by Moody’s and Standard and
Poor’s.
The amounts shown for finance debt in the table below include expected interest payments on borrowings and the future minimum lease payments
with respect to finance leases.
There are amounts included within finance debt that we show in the table below as due within one year to reflect the earliest contractual
repayment dates but that are expected to be repaid over the maximum long-term maturity profiles of the contracts as described in Note 35. US
Industrial Revenue/Municipal Bonds of $2,880 million (2006 $2,744 million) with earliest contractual repayment dates within one year have expected
repayment dates ranging from 1 to 35 years (2006 1 to 34 years). The bondholders typically have the option to tender these bonds for repayment on
interest reset dates; however, any bonds that are tendered are usually remarketed and BP has not experienced any significant repurchases. BP
considers these bonds to represent long-term funding when internally assessing the maturity profile of its finance debt. Similar treatment is applied for
loans associated with long-term gas supply contracts totalling $1,899 million (2006 $1,976 million) that mature over 10 years.
The table also shows the timing of cash outflows relating to trade and other payables and accruals.
$ million--------------------------------------------------------------------------------------------------------------------------------------------------------------------------------------------------------------------------------------------------------------------------------------------------------
2007 2006--------------------------------------------------------------------------------------------------------------------------------------------------------------------------------------------------------------------------------------------------------------------------------------------------------
Trade and Trade andother Finance other Finance
payables Accruals debt payables Accruals debt--------------------------------------------------------------------------------------------------------------------------------------------------------------------------------------------------------------------------------------------------------------------------------------------------------
Within one year 39,576 6,640 16,561 37,696 6,147 13,864
1 to 2 years 147 351 8,011 100 349 4,146
2 to 3 years 62 245 3,515 80 227 4,354
3 to 4 years 26 78 1,447 57 81 723
4 to 5 years 30 49 2,352 68 61 776
5 to 10 years 197 200 1,100 226 240 1,778
Over 10 years 24 36 1,447 – 3 1,650--------------------------------------------------------------------------------------------------------------------------------------------------------------------------------------------------------------------------------------------------------------------------------------------------------
40,062 7,599 34,433 38,227 7,108 27,291
The group manages liquidity risk associated with derivative contracts on a portfolio basis, considering both physical commodity sale and purchase
contracts together with financially-settled derivative assets and liabilities.
The held-for-trading derivatives amounts in the table below represent the total contractual cash outflows by period for the purchases of physical
commodities under derivative contracts and the estimated cash outflows of financially-settled derivative liabilities. The group also holds derivative
contracts for the sale of physical commodities and financially-settled derivative assets that are expected to generate cash inflows that will be available
to the group to meet cash outflows on purchases and liabilities. These contracts are excluded from the table below. The amounts disclosed for
embedded derivatives represent the contractual cash outflows of purchase contracts. The embedded derivatives associated with these contracts are
all financial assets. There are no cash outflows associated with embedded derivatives that are financial liabilities because these are all related to sales
contracts.
$ million--------------------------------------------------------------------------------------------------------------------------------------------------------------------------------------------------------------------------------------------------------------------------------------------------------
2007 2006--------------------------------------------------------------------------------------------------------------------------------------------------------------------------------------------------------------------------------------------------------------------------------------------------------
Held-for- Held-for-Embedded trading Embedded tradingderivatives derivatives derivatives derivatives
--------------------------------------------------------------------------------------------------------------------------------------------------------------------------------------------------------------------------------------------------------------------------------------------------------
Within one year 699 82,465 707 68,369
1 to 2 years 659 8,541 602 8,535
2 to 3 years 641 2,906 472 2,852
3 to 4 years 627 707 483 913
4 to 5 years 624 338 490 413
5 to 10 years 2,342 592 2,335 1,626
Over 10 years – 447 – 2--------------------------------------------------------------------------------------------------------------------------------------------------------------------------------------------------------------------------------------------------------------------------------------------------------
5,592 95,996 5,089 82,988
80

Filename: U54368_doc8.3d Time: 14:50:05 Date: 25/02/08
Checksum: -1523896407
BP ANNUAL REPORT AND ACCOUNTS 2007 141
28 Financial instruments and financial risk factors continued
The table below shows cash outflows for derivative hedging instruments based upon contractual payment dates. The amounts reflect the maturity
profile of the fair value liability where the instruments will be settled net, and the gross settlement amount where the pay leg of a derivative will be
settled separately to the receive leg, as in the case of cross-currency interest rate swaps hedging non-US dollar finance debt. The swaps are with high
investment-grade counterparties and therefore the settlement day risk exposure is considered to be negligible.
$ million--------------------------------------------------------------------------------------------------------------------------------------------------------------------------------------------------------------------------------------------------------------------------------------------------------
2007 2006--------------------------------------------------------------------------------------------------------------------------------------------------------------------------------------------------------------------------------------------------------------------------------------------------------
Within one year 1,708 1,228
1 to 2 years 1,220 1,711
2 to 3 years 3,759 2,772
3 to 4 years 365 117
4 to 5 years 1,650 –
5 to 10 years 105 220
Over 10 years – –--------------------------------------------------------------------------------------------------------------------------------------------------------------------------------------------------------------------------------------------------------------------------------------------------------
8,807 6,048
29 Other investments
$ million--------------------------------------------------------------------------------------------------------------------------------------------------------------------------------------------------------------------------------------------------------------------------------------------------------
2007 2006--------------------------------------------------------------------------------------------------------------------------------------------------------------------------------------------------------------------------------------------------------------------------------------------------------
Listed 1,617 1,516
Unlisted 213 181--------------------------------------------------------------------------------------------------------------------------------------------------------------------------------------------------------------------------------------------------------------------------------------------------------
1,830 1,697
Other investments comprise equity investments that have no fixed maturity date or coupon rate. These investments are classified as available-for-sale
financial assets and as such are recorded at fair value with the gain or loss arising as a result of changes in fair value recorded directly in equity.
The fair value of listed investments has been determined by reference to quoted market bid prices. Unlisted investments are stated at cost less
accumulated impairment losses.
The most significant investment is the group’s stake in Rosneft which had a fair value of $1,285 million at 31 December 2007.
30 Inventories
$ million--------------------------------------------------------------------------------------------------------------------------------------------------------------------------------------------------------------------------------------------------------------------------------------------------------
2007 2006--------------------------------------------------------------------------------------------------------------------------------------------------------------------------------------------------------------------------------------------------------------------------------------------------------
Crude oil 8,157 5,357
Natural gas 160 127
Refined petroleum and petrochemical products 14,723 10,817--------------------------------------------------------------------------------------------------------------------------------------------------------------------------------------------------------------------------------------------------------------------------------------------------------
23,040 16,301
Supplies 1,517 1,222--------------------------------------------------------------------------------------------------------------------------------------------------------------------------------------------------------------------------------------------------------------------------------------------------------
24,557 17,523
Trading inventories 1,997 1,392--------------------------------------------------------------------------------------------------------------------------------------------------------------------------------------------------------------------------------------------------------------------------------------------------------
26,554 18,915
Cost of inventories expensed in the income statement 200,766 187,183
31 Trade and other receivables
$ million--------------------------------------------------------------------------------------------------------------------------------------------------------------------------------------------------------------------------------------------------------------------------------------------------------
2007 2006--------------------------------------------------------------------------------------------------------------------------------------------------------------------------------------------------------------------------------------------------------------------------------------------------------
Current Non-current Current Non-current--------------------------------------------------------------------------------------------------------------------------------------------------------------------------------------------------------------------------------------------------------------------------------------------------------
Financial assets
Trade receivables 33,012 – 32,460 –
Amounts receivable from jointly controlled entities 888 – 830 –
Amounts receivable from associates 380 – 268 –
Other receivables 3,462 968 4,054 862--------------------------------------------------------------------------------------------------------------------------------------------------------------------------------------------------------------------------------------------------------------------------------------------------------
37,742 968 37,612 862--------------------------------------------------------------------------------------------------------------------------------------------------------------------------------------------------------------------------------------------------------------------------------------------------------
Non-financial assets
Other receivables 278 – 1,080 –--------------------------------------------------------------------------------------------------------------------------------------------------------------------------------------------------------------------------------------------------------------------------------------------------------
38,020 968 38,692 862
Trade and other receivables are predominantly non-interest bearing.
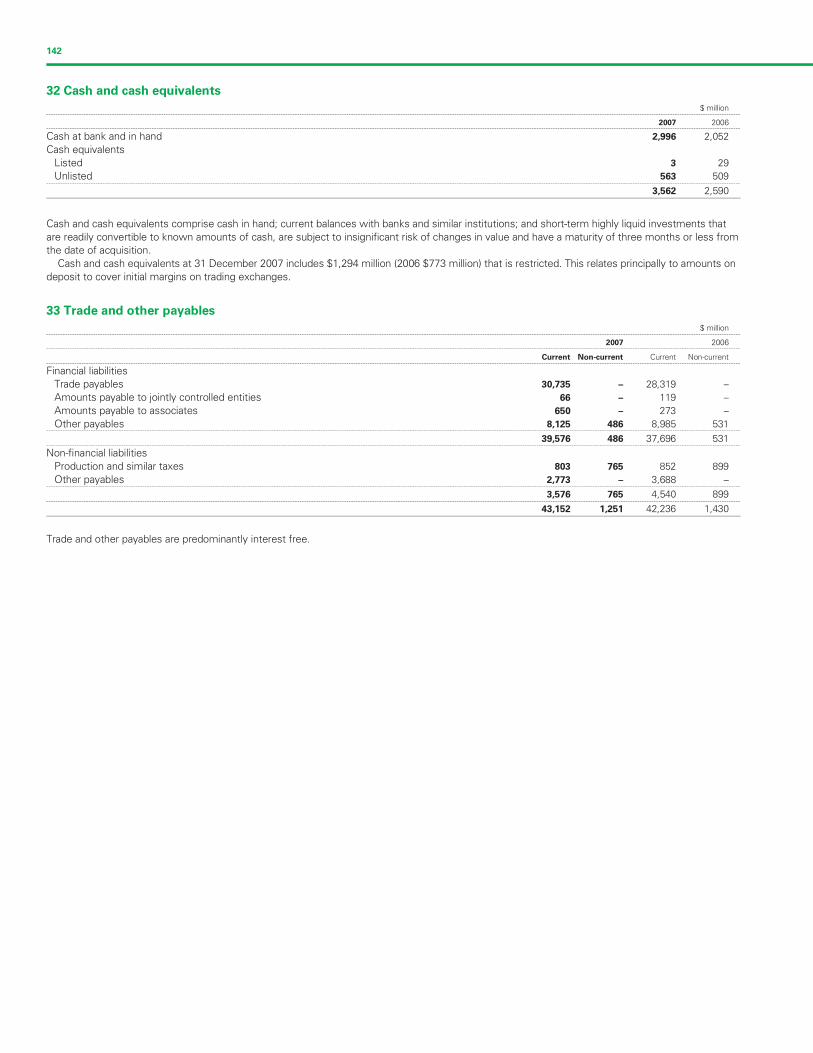
Filename: U54368_doc8.3d Time: 14:50:05 Date: 25/02/08
Checksum: -1278313749
142
32 Cash and cash equivalents
$ million--------------------------------------------------------------------------------------------------------------------------------------------------------------------------------------------------------------------------------------------------------------------------------------------------------
2007 2006--------------------------------------------------------------------------------------------------------------------------------------------------------------------------------------------------------------------------------------------------------------------------------------------------------
Cash at bank and in hand 2,996 2,052
Cash equivalents
Listed 3 29
Unlisted 563 509--------------------------------------------------------------------------------------------------------------------------------------------------------------------------------------------------------------------------------------------------------------------------------------------------------
3,562 2,590
Cash and cash equivalents comprise cash in hand; current balances with banks and similar institutions; and short-term highly liquid investments that
are readily convertible to known amounts of cash, are subject to insignificant risk of changes in value and have a maturity of three months or less from
the date of acquisition.
Cash and cash equivalents at 31 December 2007 includes $1,294 million (2006 $773 million) that is restricted. This relates principally to amounts on
deposit to cover initial margins on trading exchanges.
33 Trade and other payables
$ million--------------------------------------------------------------------------------------------------------------------------------------------------------------------------------------------------------------------------------------------------------------------------------------------------------
2007 2006--------------------------------------------------------------------------------------------------------------------------------------------------------------------------------------------------------------------------------------------------------------------------------------------------------
Current Non-current Current Non-current--------------------------------------------------------------------------------------------------------------------------------------------------------------------------------------------------------------------------------------------------------------------------------------------------------
Financial liabilities
Trade payables 30,735 – 28,319 –
Amounts payable to jointly controlled entities 66 – 119 –
Amounts payable to associates 650 – 273 –
Other payables 8,125 486 8,985 531--------------------------------------------------------------------------------------------------------------------------------------------------------------------------------------------------------------------------------------------------------------------------------------------------------
39,576 486 37,696 531--------------------------------------------------------------------------------------------------------------------------------------------------------------------------------------------------------------------------------------------------------------------------------------------------------
Non-financial liabilities
Production and similar taxes 803 765 852 899
Other payables 2,773 – 3,688 –--------------------------------------------------------------------------------------------------------------------------------------------------------------------------------------------------------------------------------------------------------------------------------------------------------
3,576 765 4,540 899--------------------------------------------------------------------------------------------------------------------------------------------------------------------------------------------------------------------------------------------------------------------------------------------------------
43,152 1,251 42,236 1,430
Trade and other payables are predominantly interest free.
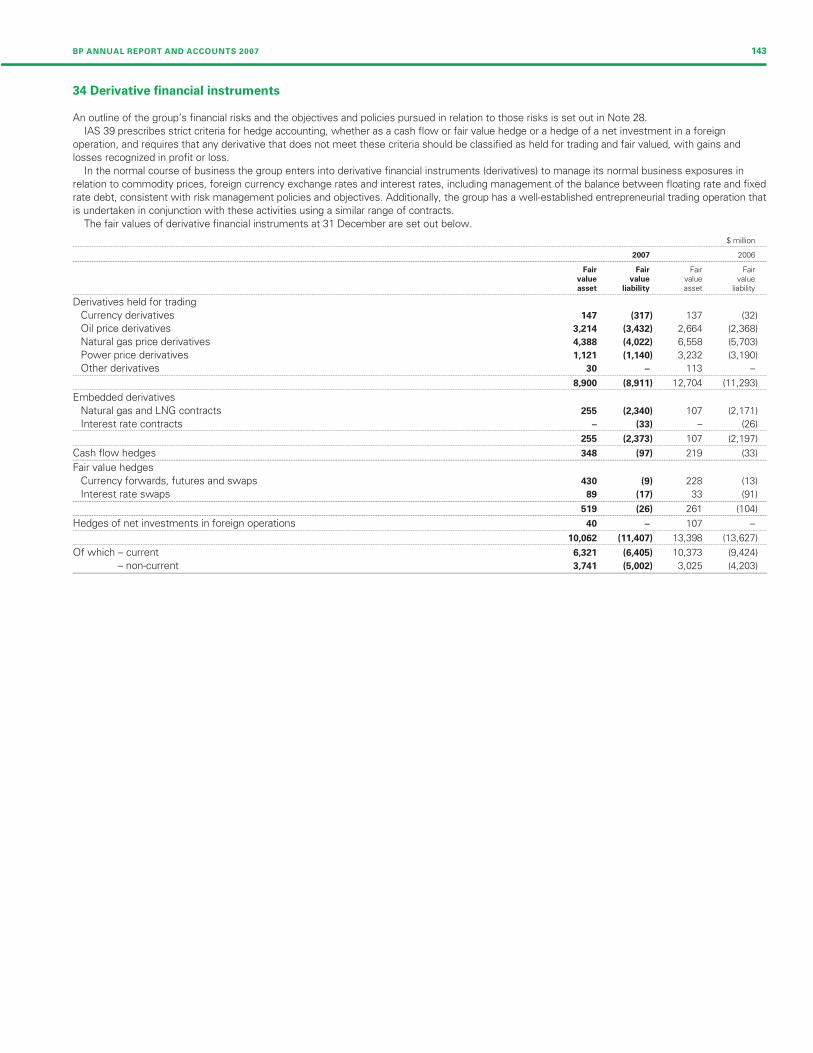
Filename: U54368_doc8.3d Time: 14:50:05 Date: 25/02/08
Checksum: 552944362
BP ANNUAL REPORT AND ACCOUNTS 2007 143
34 Derivative financial instruments
An outline of the group’s financial risks and the objectives and policies pursued in relation to those risks is set out in Note 28.
IAS 39 prescribes strict criteria for hedge accounting, whether as a cash flow or fair value hedge or a hedge of a net investment in a foreign
operation, and requires that any derivative that does not meet these criteria should be classified as held for trading and fair valued, with gains and
losses recognized in profit or loss.
In the normal course of business the group enters into derivative financial instruments (derivatives) to manage its normal business exposures in
relation to commodity prices, foreign currency exchange rates and interest rates, including management of the balance between floating rate and fixed
rate debt, consistent with risk management policies and objectives. Additionally, the group has a well-established entrepreneurial trading operation that
is undertaken in conjunction with these activities using a similar range of contracts.
The fair values of derivative financial instruments at 31 December are set out below.
$ million--------------------------------------------------------------------------------------------------------------------------------------------------------------------------------------------------------------------------------------------------------------------------------------------------------
2007 2006--------------------------------------------------------------------------------------------------------------------------------------------------------------------------------------------------------------------------------------------------------------------------------------------------------
Fair Fair Fair Fairvalue value value valueasset liability asset liability
--------------------------------------------------------------------------------------------------------------------------------------------------------------------------------------------------------------------------------------------------------------------------------------------------------
Derivatives held for trading
Currency derivatives 147 (317) 137 (32)
Oil price derivatives 3,214 (3,432) 2,664 (2,368)
Natural gas price derivatives 4,388 (4,022) 6,558 (5,703)
Power price derivatives 1,121 (1,140) 3,232 (3,190)
Other derivatives 30 – 113 –--------------------------------------------------------------------------------------------------------------------------------------------------------------------------------------------------------------------------------------------------------------------------------------------------------
8,900 (8,911) 12,704 (11,293)--------------------------------------------------------------------------------------------------------------------------------------------------------------------------------------------------------------------------------------------------------------------------------------------------------
Embedded derivatives
Natural gas and LNG contracts 255 (2,340) 107 (2,171)
Interest rate contracts – (33) – (26--------------------------------------------------------------------------------------------------------------------------------------------------------------------------------------------------------------------------------------------------------------------------------------------------------
255 (2,373) 107 (2,197)--------------------------------------------------------------------------------------------------------------------------------------------------------------------------------------------------------------------------------------------------------------------------------------------------------
Cash flow hedges 348 (97) 219 (33)--------------------------------------------------------------------------------------------------------------------------------------------------------------------------------------------------------------------------------------------------------------------------------------------------------
Fair value hedges
Currency forwards, futures and swaps 430 (9) 228 (13)
Interest rate swaps 89 (17) 33 (91)--------------------------------------------------------------------------------------------------------------------------------------------------------------------------------------------------------------------------------------------------------------------------------------------------------
519 (26) 261 (104)--------------------------------------------------------------------------------------------------------------------------------------------------------------------------------------------------------------------------------------------------------------------------------------------------------
Hedges of net investments in foreign operations 40 – 107 –--------------------------------------------------------------------------------------------------------------------------------------------------------------------------------------------------------------------------------------------------------------------------------------------------------
10,062 (11,407) 13,398 (13,627)--------------------------------------------------------------------------------------------------------------------------------------------------------------------------------------------------------------------------------------------------------------------------------------------------------
Of which – current 6,321 (6,405) 10,373 (9,424)
– non-current 3,741 (5,002) 3,025 (4,203)
)
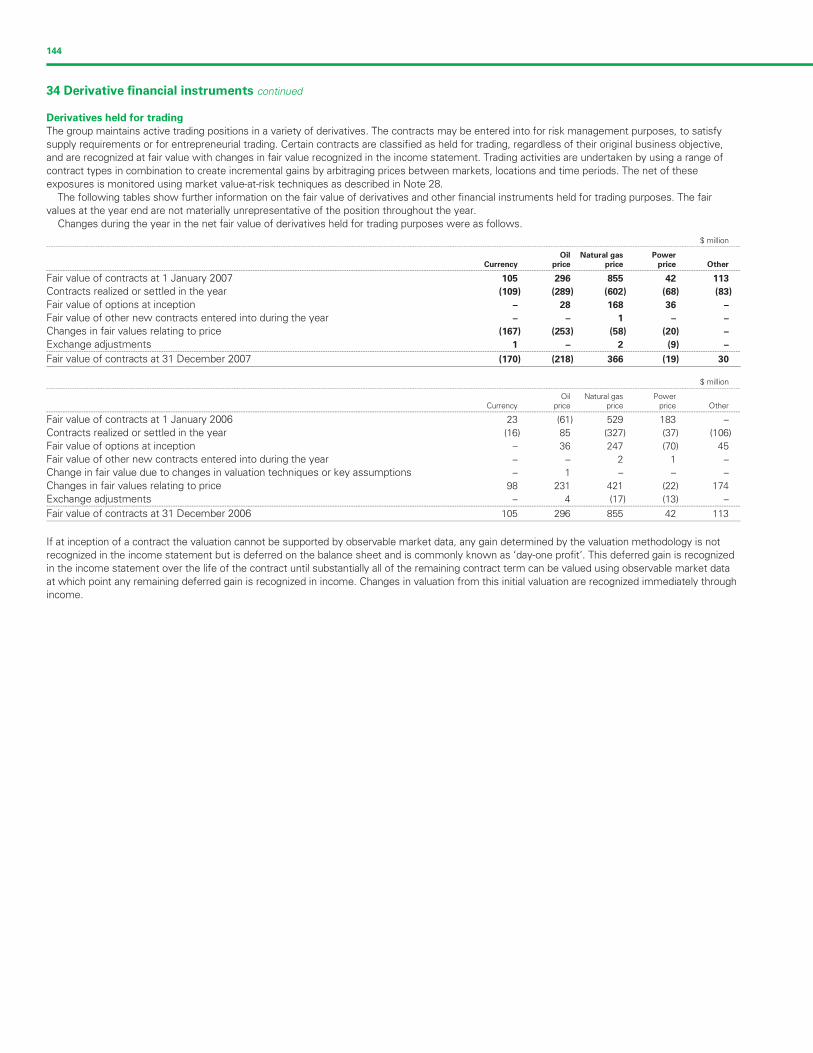
Filename: U54368_doc8.3d Time: 14:50:06 Date: 25/02/08
Checksum: 1154054064
144
34 Derivative financial instruments continued
Derivatives held for trading
The group maintains active trading positions in a variety of derivatives. The contracts may be entered into for risk management purposes, to satisfy
supply requirements or for entrepreneurial trading. Certain contracts are classified as held for trading, regardless of their original business objective,
and are recognized at fair value with changes in fair value recognized in the income statement. Trading activities are undertaken by using a range of
contract types in combination to create incremental gains by arbitraging prices between markets, locations and time periods. The net of these
exposures is monitored using market value-at-risk techniques as described in Note 28.
The following tables show further information on the fair value of derivatives and other financial instruments held for trading purposes. The fair
values at the year end are not materially unrepresentative of the position throughout the year.
Changes during the year in the net fair value of derivatives held for trading purposes were as follows.
$ million--------------------------------------------------------------------------------------------------------------------------------------------------------------------------------------------------------------------------------------------------------------------------------------------------------
Oil Natural gas Power
Currency price price price Other--------------------------------------------------------------------------------------------------------------------------------------------------------------------------------------------------------------------------------------------------------------------------------------------------------
Fair value of contracts at 1 January 2007 105 296 855 42 113
Contracts realized or settled in the year (109) (289) (602) (68) (83)
Fair value of options at inception – 28 168 36 –
Fair value of other new contracts entered into during the year – – 1 –
Changes in fair values relating to price (167) (253) (58) (20) –
Exchange adjustments 1 – 2 (9) –--------------------------------------------------------------------------------------------------------------------------------------------------------------------------------------------------------------------------------------------------------------------------------------------------------
Fair value of contracts at 31 December 2007 (170) (218) 366 (19) 30
$ million--------------------------------------------------------------------------------------------------------------------------------------------------------------------------------------------------------------------------------------------------------------------------------------------------------
Oil Natural gas PowerCurrency price price price Other
--------------------------------------------------------------------------------------------------------------------------------------------------------------------------------------------------------------------------------------------------------------------------------------------------------
Fair value of contracts at 1 January 2006 23 (61) 529 183 –
Contracts realized or settled in the year (16) 85 (327) (37) (106)
Fair value of options at inception – 36 247 (70) 45
Fair value of other new contracts entered into during the year – – 2 1
Change in fair value due to changes in valuation techniques or key assumptions – 1 – –
Changes in fair values relating to price 98 231 421 (22) 174
Exchange adjustments – 4 (17) (13) –--------------------------------------------------------------------------------------------------------------------------------------------------------------------------------------------------------------------------------------------------------------------------------------------------------
Fair value of contracts at 31 December 2006 105 296 855 42 113
If at inception of a contract the valuation cannot be supported by observable market data, any gain determined by the valuation methodology is not
recognized in the income statement but is deferred on the balance sheet and is commonly known as ‘day-one profit’. This deferred gain is recognized
in the income statement over the life of the contract until substantially all of the remaining contract term can be valued using observable market data
at which point any remaining deferred gain is recognized in income. Changes in valuation from this initial valuation are recognized immediately through
income.
–
–
–
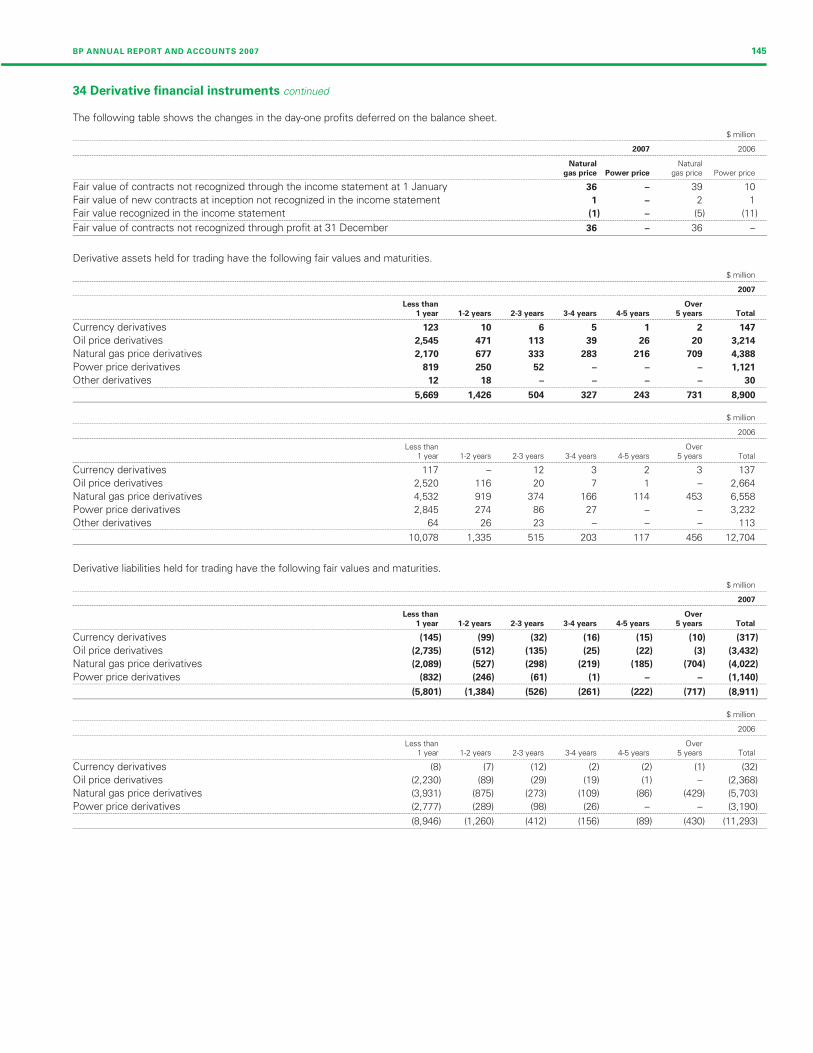
Filename: U54368_doc8.3d Time: 14:50:06 Date: 25/02/08
Checksum: 1900696956
BP ANNUAL REPORT AND ACCOUNTS 2007 145
1
34 Derivative financial instruments continued
The following table shows the changes in the day-one profits deferred on the balance sheet.
$ million--------------------------------------------------------------------------------------------------------------------------------------------------------------------------------------------------------------------------------------------------------------------------------------------------------
2007 2006--------------------------------------------------------------------------------------------------------------------------------------------------------------------------------------------------------------------------------------------------------------------------------------------------------
Natural Naturalgas price Power price gas price Power price
--------------------------------------------------------------------------------------------------------------------------------------------------------------------------------------------------------------------------------------------------------------------------------------------------------
Fair value of contracts not recognized through the income statement at 1 January 36 – 39 10
Fair value of new contracts at inception not recognized in the income statement 1 – 2
Fair value recognized in the income statement (1) – (5) (11)--------------------------------------------------------------------------------------------------------------------------------------------------------------------------------------------------------------------------------------------------------------------------------------------------------
Fair value of contracts not recognized through profit at 31 December 36 – 36 –
Derivative assets held for trading have the following fair values and maturities.
$ million--------------------------------------------------------------------------------------------------------------------------------------------------------------------------------------------------------------------------------------------------------------------------------------------------------
2007--------------------------------------------------------------------------------------------------------------------------------------------------------------------------------------------------------------------------------------------------------------------------------------------------------
Less than Over
1 year 1-2 years 2-3 years 3-4 years 4-5 years 5 years Total--------------------------------------------------------------------------------------------------------------------------------------------------------------------------------------------------------------------------------------------------------------------------------------------------------
Currency derivatives 123 10 6 5 1 2
Oil price derivatives 2,545 471 113 39 26 20 3,214
Natural gas price derivatives 2,170 677 333 283 216 709 4,388
Power price derivatives 819 250 52 – – – 1,121
Other derivatives 12 18 – – – –--------------------------------------------------------------------------------------------------------------------------------------------------------------------------------------------------------------------------------------------------------------------------------------------------------
5,669 1,426 504 327 243 731 8,900
$ million--------------------------------------------------------------------------------------------------------------------------------------------------------------------------------------------------------------------------------------------------------------------------------------------------------
2006--------------------------------------------------------------------------------------------------------------------------------------------------------------------------------------------------------------------------------------------------------------------------------------------------------
Less than Over1 year 1-2 years 2-3 years 3-4 years 4-5 years 5 years Total
--------------------------------------------------------------------------------------------------------------------------------------------------------------------------------------------------------------------------------------------------------------------------------------------------------
Currency derivatives 117 – 12 3 2 3 137
Oil price derivatives 2,520 116 20 7 1 – 2,664
Natural gas price derivatives 4,532 919 374 166 114 453 6,558
Power price derivatives 2,845 274 86 27 – – 3,232
Other derivatives 64 26 23 – – – 113--------------------------------------------------------------------------------------------------------------------------------------------------------------------------------------------------------------------------------------------------------------------------------------------------------
10,078 1,335 515 203 117 456 12,704
Derivative liabilities held for trading have the following fair values and maturities.
$ million--------------------------------------------------------------------------------------------------------------------------------------------------------------------------------------------------------------------------------------------------------------------------------------------------------
2007--------------------------------------------------------------------------------------------------------------------------------------------------------------------------------------------------------------------------------------------------------------------------------------------------------
Less than Over
1 year 1-2 years 2-3 years 3-4 years 4-5 years 5 years Total--------------------------------------------------------------------------------------------------------------------------------------------------------------------------------------------------------------------------------------------------------------------------------------------------------
Currency derivatives (145) (99) (32) (16) (15) (10) (317)
Oil price derivatives (2,735) (512) (135) (25) (22) (3) (3,432)
Natural gas price derivatives (2,089) (527) (298) (219) (185) (704) (4,022)
Power price derivatives (832) (246) (61) (1) – – (1,140)--------------------------------------------------------------------------------------------------------------------------------------------------------------------------------------------------------------------------------------------------------------------------------------------------------
(5,801) (1,384) (526) (261) (222) (717) (8,911)
$ million--------------------------------------------------------------------------------------------------------------------------------------------------------------------------------------------------------------------------------------------------------------------------------------------------------
2006--------------------------------------------------------------------------------------------------------------------------------------------------------------------------------------------------------------------------------------------------------------------------------------------------------
Less than Over1 year 1-2 years 2-3 years 3-4 years 4-5 years 5 years Total
--------------------------------------------------------------------------------------------------------------------------------------------------------------------------------------------------------------------------------------------------------------------------------------------------------
Currency derivatives (8) (7) (12) (2) (2) (1) (32)
Oil price derivatives (2,230) (89) (29) (19) (1) – (2,368)
Natural gas price derivatives (3,931) (875) (273) (109) (86) (429) (5,703)
Power price derivatives (2,777) (289) (98) (26) – – (3,190)--------------------------------------------------------------------------------------------------------------------------------------------------------------------------------------------------------------------------------------------------------------------------------------------------------
(8,946) (1,260) (412) (156) (89) (430) (11,293)
147
30
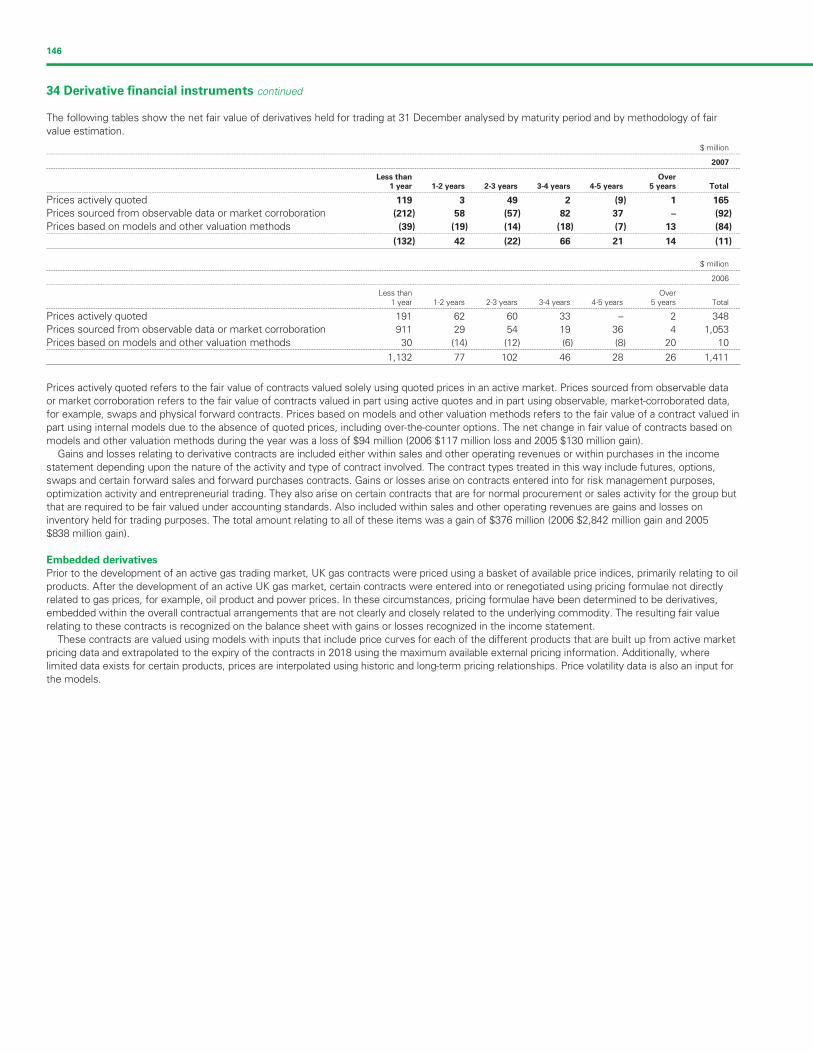
Filename: U54368_doc8.3d Time: 14:50:06 Date: 25/02/08
Checksum: 402958817
146
34 Derivative financial instruments continued
The following tables show the net fair value of derivatives held for trading at 31 December analysed by maturity period and by methodology of fair
value estimation.
$ million--------------------------------------------------------------------------------------------------------------------------------------------------------------------------------------------------------------------------------------------------------------------------------------------------------
2007--------------------------------------------------------------------------------------------------------------------------------------------------------------------------------------------------------------------------------------------------------------------------------------------------------
Less than Over
1 year 1-2 years 2-3 years 3-4 years 4-5 years 5 years Total--------------------------------------------------------------------------------------------------------------------------------------------------------------------------------------------------------------------------------------------------------------------------------------------------------
Prices actively quoted 119 3 49 2 (9) 1 165
Prices sourced from observable data or market corroboration (212) 58 (57) 82 37 – (92)
Prices based on models and other valuation methods (39) (19) (14) (18) (7) 13 (84)--------------------------------------------------------------------------------------------------------------------------------------------------------------------------------------------------------------------------------------------------------------------------------------------------------
(132) 42 (22) 66 21 14 (11)
$ million--------------------------------------------------------------------------------------------------------------------------------------------------------------------------------------------------------------------------------------------------------------------------------------------------------
2006--------------------------------------------------------------------------------------------------------------------------------------------------------------------------------------------------------------------------------------------------------------------------------------------------------
Less than Over1 year 1-2 years 2-3 years 3-4 years 4-5 years 5 years Total
--------------------------------------------------------------------------------------------------------------------------------------------------------------------------------------------------------------------------------------------------------------------------------------------------------
Prices actively quoted 191 62 60 33 – 2
Prices sourced from observable data or market corroboration 911 29 54 19 36 4 1,053
Prices based on models and other valuation methods 30 (14) (12) (6) (8) 20 10--------------------------------------------------------------------------------------------------------------------------------------------------------------------------------------------------------------------------------------------------------------------------------------------------------
1,132 77 102 46 28 26 1,411
Prices actively quoted refers to the fair value of contracts valued solely using quoted prices in an active market. Prices sourced from observable data
or market corroboration refers to the fair value of contracts valued in part using active quotes and in part using observable, market-corroborated data,
for example, swaps and physical forward contracts. Prices based on models and other valuation methods refers to the fair value of a contract valued in
part using internal models due to the absence of quoted prices, including over-the-counter options. The net change in fair value of contracts based on
models and other valuation methods during the year was a loss of $94 million (2006 $117 million loss and 2005 $130 million gain).
Gains and losses relating to derivative contracts are included either within sales and other operating revenues or within purchases in the income
statement depending upon the nature of the activity and type of contract involved. The contract types treated in this way include futures, options,
swaps and certain forward sales and forward purchases contracts. Gains or losses arise on contracts entered into for risk management purposes,
optimization activity and entrepreneurial trading. They also arise on certain contracts that are for normal procurement or sales activity for the group but
that are required to be fair valued under accounting standards. Also included within sales and other operating revenues are gains and losses on
inventory held for trading purposes. The total amount relating to all of these items was a gain of $376 million (2006 $2,842 million gain and 2005
$838 million gain).
Embedded derivatives
Prior to the development of an active gas trading market, UK gas contracts were priced using a basket of available price indices, primarily relating to oil
products. After the development of an active UK gas market, certain contracts were entered into or renegotiated using pricing formulae not directly
related to gas prices, for example, oil product and power prices. In these circumstances, pricing formulae have been determined to be derivatives,
embedded within the overall contractual arrangements that are not clearly and closely related to the underlying commodity. The resulting fair value
relating to these contracts is recognized on the balance sheet with gains or losses recognized in the income statement.
These contracts are valued using models with inputs that include price curves for each of the different products that are built up from active market
pricing data and extrapolated to the expiry of the contracts in 2018 using the maximum available external pricing information. Additionally, where
limited data exists for certain products, prices are interpolated using historic and long-term pricing relationships. Price volatility data is also an input for
the models.
348
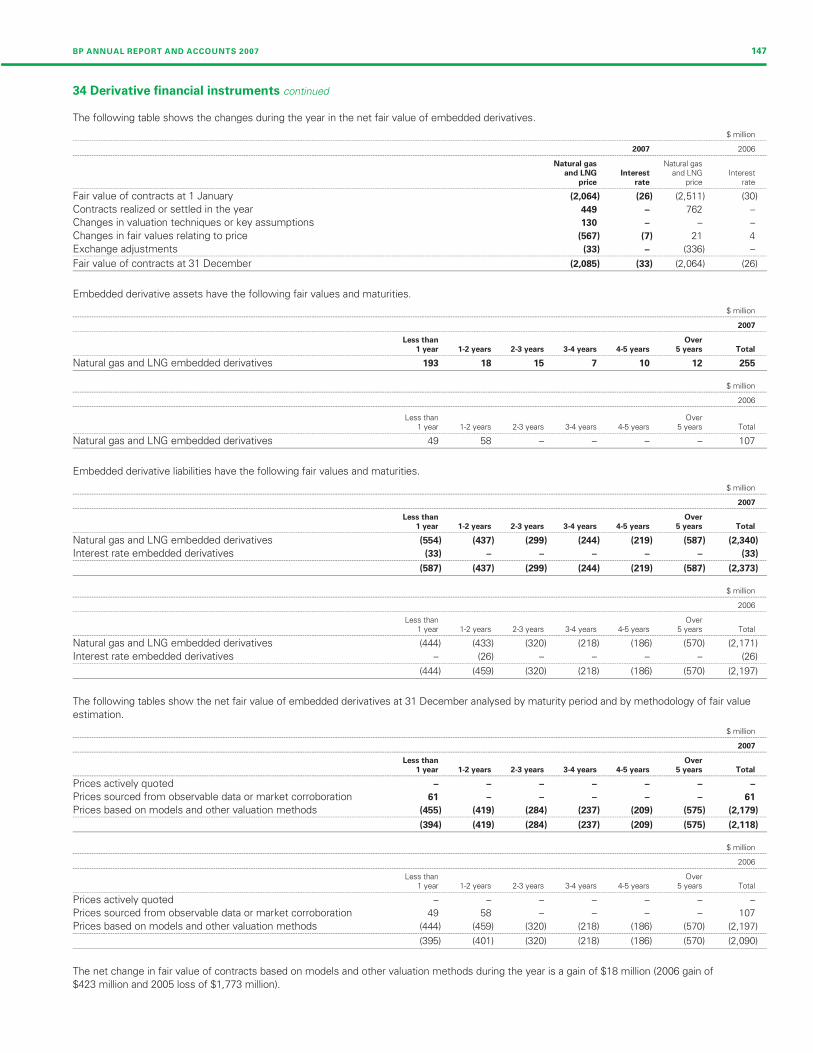
Filename: U54368_doc8.3d Time: 14:50:07 Date: 25/02/08
Checksum: 2057519047
BP ANNUAL REPORT AND ACCOUNTS 2007 147
34 Derivative financial instruments continued
The following table shows the changes during the year in the net fair value of embedded derivatives.
$ million--------------------------------------------------------------------------------------------------------------------------------------------------------------------------------------------------------------------------------------------------------------------------------------------------------
2007 2006--------------------------------------------------------------------------------------------------------------------------------------------------------------------------------------------------------------------------------------------------------------------------------------------------------
Natural gas Natural gasand LNG Interest and LNG Interest
price rate price rate--------------------------------------------------------------------------------------------------------------------------------------------------------------------------------------------------------------------------------------------------------------------------------------------------------
Fair value of contracts at 1 January (2,064) (26) (2,511) (30)
Contracts realized or settled in the year 449 – 762 –
Changes in valuation techniques or key assumptions 130 – –
Changes in fair values relating to price (567) (7) 21 4
Exchange adjustments (33) – (336) –--------------------------------------------------------------------------------------------------------------------------------------------------------------------------------------------------------------------------------------------------------------------------------------------------------
Fair value of contracts at 31 December (2,085) (33) (2,064) (26)
Embedded derivative assets have the following fair values and maturities.
$ million--------------------------------------------------------------------------------------------------------------------------------------------------------------------------------------------------------------------------------------------------------------------------------------------------------
2007--------------------------------------------------------------------------------------------------------------------------------------------------------------------------------------------------------------------------------------------------------------------------------------------------------
Less than Over
1 year 1-2 years 2-3 years 3-4 years 4-5 years 5 years Total--------------------------------------------------------------------------------------------------------------------------------------------------------------------------------------------------------------------------------------------------------------------------------------------------------
Natural gas and LNG embedded derivatives 193 18 15 7 10 12 255
$ million--------------------------------------------------------------------------------------------------------------------------------------------------------------------------------------------------------------------------------------------------------------------------------------------------------
2006--------------------------------------------------------------------------------------------------------------------------------------------------------------------------------------------------------------------------------------------------------------------------------------------------------
Less than Over1 year 1-2 years 2-3 years 3-4 years 4-5 years 5 years Total
--------------------------------------------------------------------------------------------------------------------------------------------------------------------------------------------------------------------------------------------------------------------------------------------------------
Natural gas and LNG embedded derivatives 49 58 – – – –
Embedded derivative liabilities have the following fair values and maturities.
$ million--------------------------------------------------------------------------------------------------------------------------------------------------------------------------------------------------------------------------------------------------------------------------------------------------------
2007--------------------------------------------------------------------------------------------------------------------------------------------------------------------------------------------------------------------------------------------------------------------------------------------------------
Less than Over
1 year 1-2 years 2-3 years 3-4 years 4-5 years 5 years Total--------------------------------------------------------------------------------------------------------------------------------------------------------------------------------------------------------------------------------------------------------------------------------------------------------
Natural gas and LNG embedded derivatives (554) (437) (299) (244) (219) (587) (2,340)
Interest rate embedded derivatives (33) – – – – –--------------------------------------------------------------------------------------------------------------------------------------------------------------------------------------------------------------------------------------------------------------------------------------------------------
(587) (437) (299) (244) (219) (587) (2,373)
$ million--------------------------------------------------------------------------------------------------------------------------------------------------------------------------------------------------------------------------------------------------------------------------------------------------------
2006--------------------------------------------------------------------------------------------------------------------------------------------------------------------------------------------------------------------------------------------------------------------------------------------------------
Less than Over1 year 1-2 years 2-3 years 3-4 years 4-5 years 5 years Total
--------------------------------------------------------------------------------------------------------------------------------------------------------------------------------------------------------------------------------------------------------------------------------------------------------
Natural gas and LNG embedded derivatives (444) (433) (320) (218) (186) (570) (2,171)
Interest rate embedded derivatives – (26) – – – –--------------------------------------------------------------------------------------------------------------------------------------------------------------------------------------------------------------------------------------------------------------------------------------------------------
(444) (459) (320) (218) (186) (570) (2,197)
The following tables show the net fair value of embedded derivatives at 31 December analysed by maturity period and by methodology of fair value
estimation.
$ million--------------------------------------------------------------------------------------------------------------------------------------------------------------------------------------------------------------------------------------------------------------------------------------------------------
2007--------------------------------------------------------------------------------------------------------------------------------------------------------------------------------------------------------------------------------------------------------------------------------------------------------
Less than Over
1 year 1-2 years 2-3 years 3-4 years 4-5 years 5 years Total--------------------------------------------------------------------------------------------------------------------------------------------------------------------------------------------------------------------------------------------------------------------------------------------------------
Prices actively quoted – – – – – –
Prices sourced from observable data or market corroboration 61 – – – – –
Prices based on models and other valuation methods (455) (419) (284) (237) (209) (575) (2,179)--------------------------------------------------------------------------------------------------------------------------------------------------------------------------------------------------------------------------------------------------------------------------------------------------------
(394) (419) (284) (237) (209) (575) (2,118)
$ million--------------------------------------------------------------------------------------------------------------------------------------------------------------------------------------------------------------------------------------------------------------------------------------------------------
2006--------------------------------------------------------------------------------------------------------------------------------------------------------------------------------------------------------------------------------------------------------------------------------------------------------
Less than Over1 year 1-2 years 2-3 years 3-4 years 4-5 years 5 years Total
--------------------------------------------------------------------------------------------------------------------------------------------------------------------------------------------------------------------------------------------------------------------------------------------------------
Prices actively quoted – – – – – –
Prices sourced from observable data or market corroboration 49 58 – – – –
Prices based on models and other valuation methods (444) (459) (320) (218) (186) (570) (2,197)--------------------------------------------------------------------------------------------------------------------------------------------------------------------------------------------------------------------------------------------------------------------------------------------------------
(395) (401) (320) (218) (186) (570) (2,090)
The net change in fair value of contracts based on models and other valuation methods during the year is a gain of $18 million (2006 gain of
$423 million and 2005 loss of $1,773 million).
–
107
(33)
(26)
–
61
–
107

Filename: U54368_doc8.3d Time: 14:50:07 Date: 25/02/08
Checksum: 410478488
148
34 Derivative financial instruments continued
The fair value gain (loss) on embedded derivatives is shown below.
$ million--------------------------------------------------------------------------------------------------------------------------------------------------------------------------------------------------------------------------------------------------------------------------------------------------------
2007 2006 2005--------------------------------------------------------------------------------------------------------------------------------------------------------------------------------------------------------------------------------------------------------------------------------------------------------
Natural gas and LNG embedded derivatives – 604 (2,034)
Interest rate embedded derivatives (7) 4 (13)--------------------------------------------------------------------------------------------------------------------------------------------------------------------------------------------------------------------------------------------------------------------------------------------------------
Fair value gain (loss) (7) 608 (2,047)
The fair value gain (loss) in the above table includes $12 million of exchange losses (2006 $179 million of exchange losses and 2005 $115 million of
exchange gains) arising on contracts that are denominated in a currency other than the functional currency of the individual operating unit.
Cash flow hedges
At 31 December 2007, the group held futures currency contracts and cylinders that were being used to hedge the foreign currency risk of highly
probable forecast transactions, as well as cross-currency interest rate swaps to fix the US dollar interest rate and US dollar redemption value, with
matching critical terms on the currency leg of the swap with the underlying non-US dollar debt issuance. Note 28 outlines the management of risk
aspects for currency and interest rate risk. For cash flow hedges the group only claims for the intrinsic value on the currency with any fair value
attributable to time value taken immediately to profit or loss. There were no highly probable transactions for which hedge accounting has been claimed
that have not occurred and no significant element of hedge ineffectiveness requiring recognition in the income statement. For cash flow hedges the
pre-tax amount removed from equity during the period and included in the income statement is a gain of $74 million (2006 $93 million and 2005 $36
million loss). Of this, a gain of $143 million is included in production and manufacturing expenses (2006 $162 million gain and 2005 $33 million gain)
and a loss of $69 million is included in finance costs (2006 $69 million loss and 2005 $69 million loss). The amount removed from equity during the
period and included in the carrying amount of non-financial assets was a gain of $40 million (2006 $6 million gain and nil for 2005).
The amounts retained in equity at 31 December 2007 are expected to mature and affect the income statement by a $48 million gain in 2008, a loss
of $10 million in 2009 and a gain of $28 million in 2010 and beyond.
Fair value hedges
At 31 December 2007, the group held interest rate and currency swap contracts as fair value hedges of the interest rate risk on fixed rate debt
issued by the group. The receive leg of the swap contracts is largely identical for all critical aspects to the terms of the underlying debt and thus
the hedging is highly effective. The gain on the hedging derivative instruments taken to the income statement in 2007 was $334 million (2006
$257 million) offset by a loss on the fair value of the finance debt of $327 million (2006 $257 million loss).
The interest rate and currency swaps have an average maturity of one to two years, (2006 two to three years) and are used to convert sterling,
euro, Swiss franc and Australian dollar denominated borrowings into US dollar floating rate debt. Note 28 outlines the group’s approach to interest rate
risk management.
Hedges of net investments in foreign operations
The group holds currency swap contracts as a hedge of a long-term investment in a UK subsidiary expiring in 2009. At 31 December 2007, the hedge
had a fair value of $40 million (2006 $107 million) and the loss on the hedge recognized in equity in 2007 was $67 million (2006 $105 million gain, 2005
$58 million gain). US dollars have been sold forward for sterling purchased and match the underlying liability with no significant ineffectiveness
reflected in the income statement.
35 Finance debt
$ million--------------------------------------------------------------------------------------------------------------------------------------------------------------------------------------------------------------------------------------------------------------------------------------------------------
2007 2006--------------------------------------------------------------------------------------------------------------------------------------------------------------------------------------------------------------------------------------------------------------------------------------------------------
Within After Within Aftera a
1 year 1 year Total 1 year 1 year Total--------------------------------------------------------------------------------------------------------------------------------------------------------------------------------------------------------------------------------------------------------------------------------------------------------
Bank loans 542 978 1,520 543 806 1,349
Other loans 14,607 14,026 28,633 12,321 9,525 21,846--------------------------------------------------------------------------------------------------------------------------------------------------------------------------------------------------------------------------------------------------------------------------------------------------------
Total borrowings 15,149 15,004 30,153 12,864 10,331 23,195
Net obligations under finance leases 245 647 892 60 755 815--------------------------------------------------------------------------------------------------------------------------------------------------------------------------------------------------------------------------------------------------------------------------------------------------------
15,394 15,651 31,045 12,924 11,086 24,010
a Amounts due within one year include current maturities of long-term debt and borrowings that are expected to be repaid later than the earliest contractual repayment datesof within one year. US Industrial Revenue/Municipal Bonds of $2,880 million (2006 $2,744 million) with earliest contractual repayment dates within one year have expectedrepayment dates ranging from 1 to 35 years (2006 1 to 34 years). The bondholders typically have the option to tender these bonds for repayment on interest reset dates;however, any bonds that are tendered are usually remarketed and BP has not experienced any significant repurchases. BP considers these bonds to represent long-termfunding when internally assessing the maturity profile of its finance debt. Similar treatment is applied for loans associated with long-term gas supply contracts totalling$1,899 million (2006 $1,976 million) that mature over 10 years.
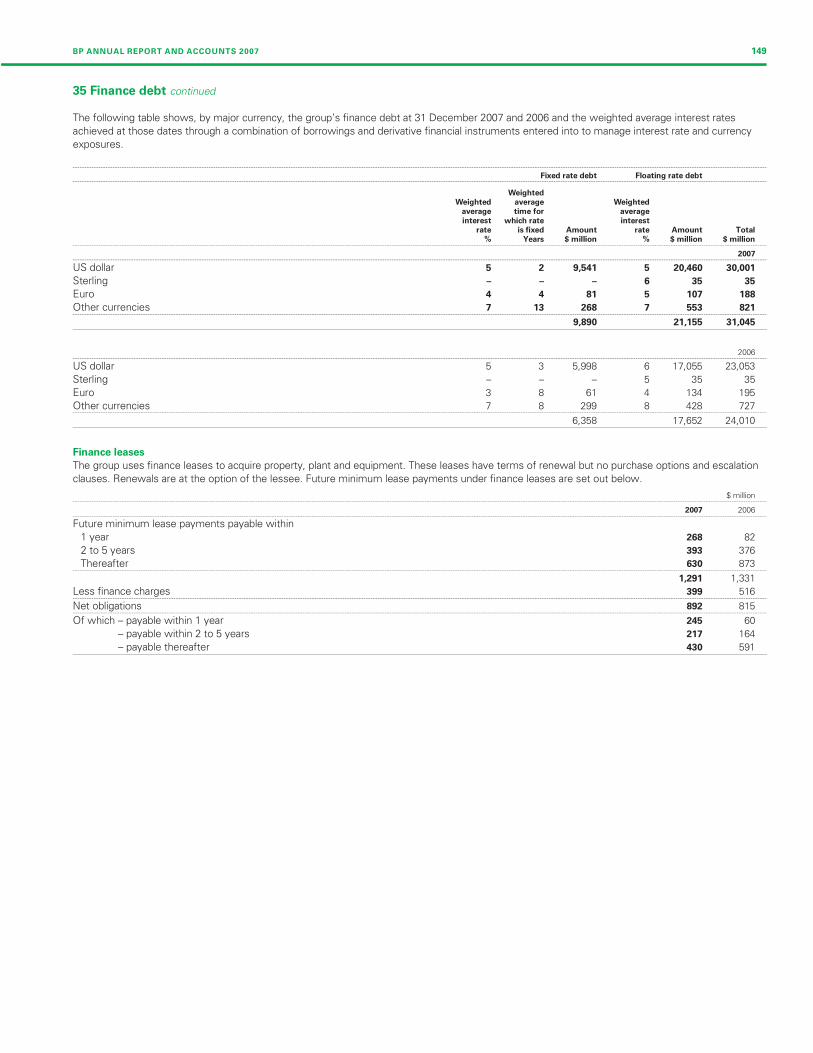
Filename: U54368_doc8.3d Time: 14:50:07 Date: 25/02/08
Checksum: 1072390906
BP ANNUAL REPORT AND ACCOUNTS 2007 149
35 Finance debt continued
The following table shows, by major currency, the group’s finance debt at 31 December 2007 and 2006 and the weighted average interest rates
achieved at those dates through a combination of borrowings and derivative financial instruments entered into to manage interest rate and currency
exposures.
--------------------------------------------------------------------------------------------------------------------------------------------------------------------------------------------------------------------------------------------------------------------------------------------------------
Fixed rate debt Floating rate debt--------------------------------------------------------------------------------------------------------------------------------------------------------------------------------------------------------------------------------------------------------------------------------------------------------
Weighted
Weighted average Weighted
average time for average
interest which rate interest
rate is fixed Amount rate Amount Total
% Years $ million % $ million $ million--------------------------------------------------------------------------------------------------------------------------------------------------------------------------------------------------------------------------------------------------------------------------------------------------------
2007--------------------------------------------------------------------------------------------------------------------------------------------------------------------------------------------------------------------------------------------------------------------------------------------------------
US dollar 5 2 9,541 5 20,460 30,001
Sterling – – – 6 35
Euro 4 4 81 5 107 188
Other currencies 7 13 268 7 553 821--------------------------------------------------------------------------------------------------------------------------------------------------------------------------------------------------------------------------------------------------------------------------------------------------------
9,890 21,155 31,045
2006--------------------------------------------------------------------------------------------------------------------------------------------------------------------------------------------------------------------------------------------------------------------------------------------------------
US dollar 5 3 5,998 6 17,055 23,053
Sterling – – – 5 35
Euro 3 8 61 4 134 195
Other currencies 7 8 299 8 428 7--------------------------------------------------------------------------------------------------------------------------------------------------------------------------------------------------------------------------------------------------------------------------------------------------------
6,358 17,652 24,010
Finance leases
The group uses finance leases to acquire property, plant and equipment. These leases have terms of renewal but no purchase options and escalation
clauses. Renewals are at the option of the lessee. Future minimum lease payments under finance leases are set out below.
$ million--------------------------------------------------------------------------------------------------------------------------------------------------------------------------------------------------------------------------------------------------------------------------------------------------------
2007 2006--------------------------------------------------------------------------------------------------------------------------------------------------------------------------------------------------------------------------------------------------------------------------------------------------------
Future minimum lease payments payable within
1 year 268 82
2 to 5 years 393 376
Thereafter 630 873--------------------------------------------------------------------------------------------------------------------------------------------------------------------------------------------------------------------------------------------------------------------------------------------------------
1,291 1,331
Less finance charges 399 516--------------------------------------------------------------------------------------------------------------------------------------------------------------------------------------------------------------------------------------------------------------------------------------------------------
Net obligations 892 815--------------------------------------------------------------------------------------------------------------------------------------------------------------------------------------------------------------------------------------------------------------------------------------------------------
Of which – payable within 1 year 245 60
– payable within 2 to 5 years 217 164
– payable thereafter 430 591
35
35
27
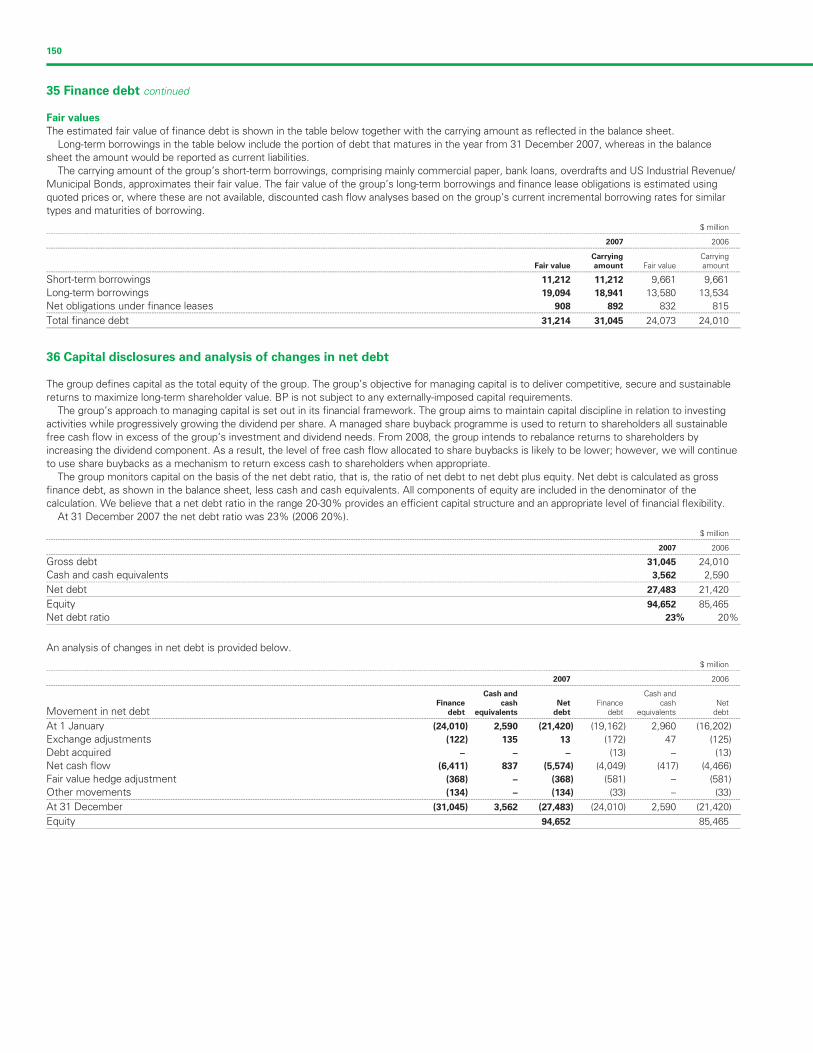
Filename: U54368_doc8.3d Time: 14:50:08 Date: 25/02/08
Checksum: -863681003
150
35 Finance debt continued
Fair values
The estimated fair value of finance debt is shown in the table below together with the carrying amount as reflected in the balance sheet.
Long-term borrowings in the table below include the portion of debt that matures in the year from 31 December 2007, whereas in the balance
sheet the amount would be reported as current liabilities.
The carrying amount of the group’s short-term borrowings, comprising mainly commercial paper, bank loans, overdrafts and US Industrial Revenue/
Municipal Bonds, approximates their fair value. The fair value of the group’s long-term borrowings and finance lease obligations is estimated using
quoted prices or, where these are not available, discounted cash flow analyses based on the group’s current incremental borrowing rates for similar
types and maturities of borrowing.
$ million--------------------------------------------------------------------------------------------------------------------------------------------------------------------------------------------------------------------------------------------------------------------------------------------------------
2007 2006--------------------------------------------------------------------------------------------------------------------------------------------------------------------------------------------------------------------------------------------------------------------------------------------------------
Carrying CarryingFair value amount Fair value amount
--------------------------------------------------------------------------------------------------------------------------------------------------------------------------------------------------------------------------------------------------------------------------------------------------------
Short-term borrowings 11,212 11,212 9,661 9,661
Long-term borrowings 19,094 18,941 13,580 13,534
Net obligations under finance leases 908 892 832 815--------------------------------------------------------------------------------------------------------------------------------------------------------------------------------------------------------------------------------------------------------------------------------------------------------
Total finance debt 31,214 31,045 24,073 24,010
36 Capital disclosures and analysis of changes in net debt
The group defines capital as the total equity of the group. The group’s objective for managing capital is to deliver competitive, secure and sustainable
returns to maximize long-term shareholder value. BP is not subject to any externally-imposed capital requirements.
The group’s approach to managing capital is set out in its financial framework. The group aims to maintain capital discipline in relation to investing
activities while progressively growing the dividend per share. A managed share buyback programme is used to return to shareholders all sustainable
free cash flow in excess of the group’s investment and dividend needs. From 2008, the group intends to rebalance returns to shareholders by
increasing the dividend component. As a result, the level of free cash flow allocated to share buybacks is likely to be lower; however, we will continue
to use share buybacks as a mechanism to return excess cash to shareholders when appropriate.
The group monitors capital on the basis of the net debt ratio, that is, the ratio of net debt to net debt plus equity. Net debt is calculated as gross
finance debt, as shown in the balance sheet, less cash and cash equivalents. All components of equity are included in the denominator of the
calculation. We believe that a net debt ratio in the range 20-30% provides an efficient capital structure and an appropriate level of financial flexibility.
At 31 December 2007 the net debt ratio was 23% (2006 20%).
$ million--------------------------------------------------------------------------------------------------------------------------------------------------------------------------------------------------------------------------------------------------------------------------------------------------------
2007 2006--------------------------------------------------------------------------------------------------------------------------------------------------------------------------------------------------------------------------------------------------------------------------------------------------------
Gross debt 31,045 24,010
Cash and cash equivalents 3,562 2,590--------------------------------------------------------------------------------------------------------------------------------------------------------------------------------------------------------------------------------------------------------------------------------------------------------
Net debt 27,483 21,420
Equity 94,652 85,465
Net debt ratio 23% 20%
An analysis of changes in net debt is provided below.
$ million--------------------------------------------------------------------------------------------------------------------------------------------------------------------------------------------------------------------------------------------------------------------------------------------------------
2007 2006--------------------------------------------------------------------------------------------------------------------------------------------------------------------------------------------------------------------------------------------------------------------------------------------------------
Cash and Cash andFinance cash Net Finance cash Net
Movement in net debt debt equivalents debt debt equivalents debt--------------------------------------------------------------------------------------------------------------------------------------------------------------------------------------------------------------------------------------------------------------------------------------------------------
At 1 January (24,010) 2,590 (21,420) (19,162) 2,960 (16,202)
Exchange adjustments (122) 135 13 (172) 47 (125)
Debt acquired – – – (13) – (13)
Net cash flow (6,411) 837 (5,574) (4,049) (417) (4,466)
Fair value hedge adjustment (368) – (368) (581) – (581)
Other movements (134) – (134) (33) – (33)--------------------------------------------------------------------------------------------------------------------------------------------------------------------------------------------------------------------------------------------------------------------------------------------------------
At 31 December (31,045) 3,562 (27,483) (24,010) 2,590 (21,420)
Equity 94,652 85,465

Filename: U54368_doc8.3d Time: 14:50:08 Date: 25/02/08
Checksum: -2049711255
BP ANNUAL REPORT AND ACCOUNTS 2007 151
37 Provisions
$ million--------------------------------------------------------------------------------------------------------------------------------------------------------------------------------------------------------------------------------------------------------------------------------------------------------
Litigation
Decommissioning Environmental and other Total--------------------------------------------------------------------------------------------------------------------------------------------------------------------------------------------------------------------------------------------------------------------------------------------------------
At 1 January 2007 8,365 2,127 3,152 13,644
Exchange adjustments 168 19 11 198
New or increased provisions 1,163 373 1,376 2,912
Write-back of unused provisions – (151) (196) (347)
Unwinding of discount 195 44 44 283
Utilization (297) (305) (899) (1,501)
Deletions (93) – (1) (94)--------------------------------------------------------------------------------------------------------------------------------------------------------------------------------------------------------------------------------------------------------------------------------------------------------
At 31 December 2007 9,501 2,107 3,487 15,095
Of which – expected to be incurred within 1 year 447 431 1,317 2,195
– expected to be incurred in more than 1 year 9,054 1,676 2,170 12,900
$ million--------------------------------------------------------------------------------------------------------------------------------------------------------------------------------------------------------------------------------------------------------------------------------------------------------
LitigationDecommissioning Environmental and other Total
--------------------------------------------------------------------------------------------------------------------------------------------------------------------------------------------------------------------------------------------------------------------------------------------------------
At 1 January 2006 6,450 2,311 2,295 11,056
Exchange adjustments 13 31 44 88
New or increased provisions 2,142 423 2,111 4,676
Write-back of unused provisions – (355) (270) (625)
Unwinding of discount 153 45 47 245
Utilization (179) (324) (1,068) (1,571)
Deletions (214) (4) (7) (225)--------------------------------------------------------------------------------------------------------------------------------------------------------------------------------------------------------------------------------------------------------------------------------------------------------
At 31 December 2006 8,365 2,127 3,152 13,644
Of which – expected to be incurred within 1 year 324 444 1,164 1,932
– expected to be incurred in more than 1 year 8,041 1,683 1,988 11,712
The group makes full provision for the future cost of decommissioning oil and natural gas production facilities and related pipelines on a discounted
basis on the installation of those facilities. The provision for the costs of decommissioning these production facilities and pipelines at the end of their
economic lives has been estimated using existing technology, at current prices and discounted using a real discount rate of 2.0% (2006 2.0%). These
costs are generally expected to be incurred over the next 30 years. While the provision is based on the best estimate of future costs and the
economic lives of the facilities and pipelines, there is uncertainty regarding both the amount and timing of incurring these costs.
Provisions for environmental remediation are made when a clean-up is probable and the amount is reliably determinable. Generally, this coincides
with commitment to a formal plan of action or, if earlier, on divestment or closure of inactive sites. The provision for environmental liabilities has been
estimated using existing technology, at current prices and discounted using a real discount rate of 2.0% (2006 2.0%). The majority of these costs are
expected to be incurred over the next 10 years. The extent and cost of future remediation programmes are inherently difficult to estimate. They
depend on the scale of any possible contamination, the timing and extent of corrective actions, and also the group’s share of the liability.
Included within the litigation and other category at 31 December 2007 are provisions for litigation of $1,737 million (2006 $1,474 million) for deferred
employee compensation of $761 million (2006 $760 million) and provisions for expected rental shortfalls on surplus properties of $320 million (2006
$320 million). New or increased provisions made for 2007 included an amount of $500 million (2006 $925 million) in respect of the Texas City incident,
of which, disbursements to claimants in 2007 were $314 million (2006 $863 million) and the provision at 31 December 2007 was $456 million (2006
$270 million).
To the extent that these liabilities are not expected to be settled within the next three years, the provisions are discounted using either a nominal
discount rate of 4.5% (2006 4.5%) or a real discount rate of 2.0% (2006 2.0%), as appropriate.
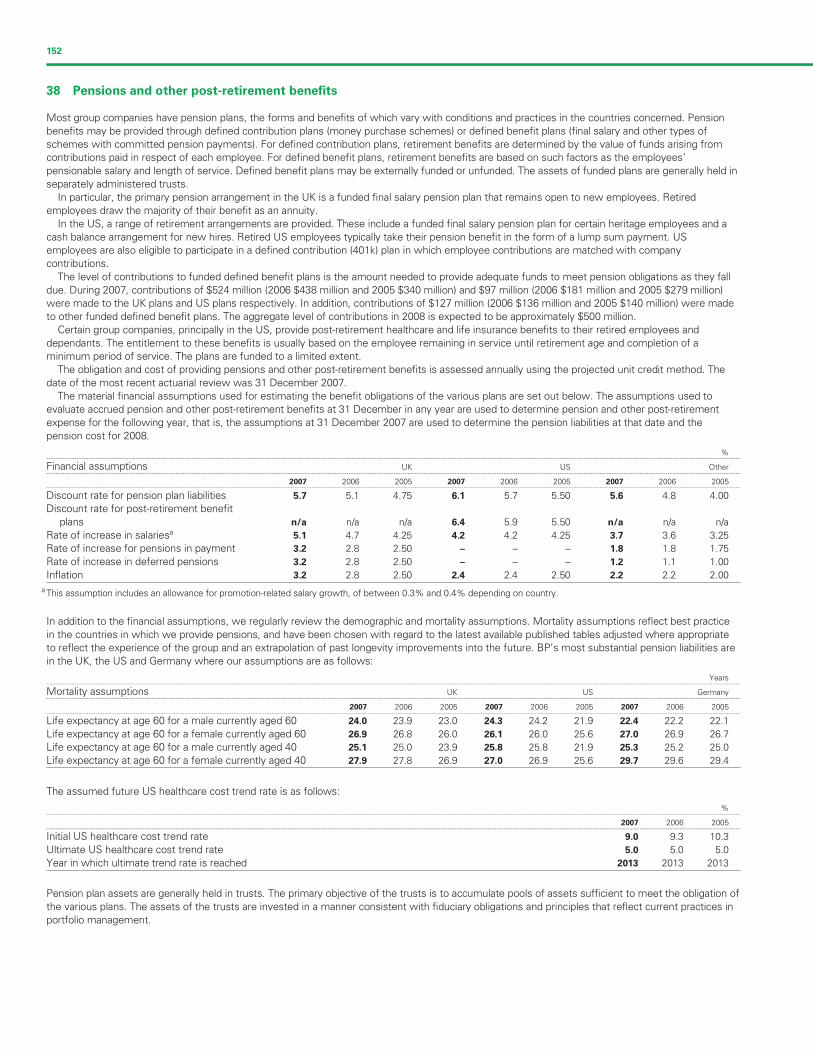
Filename: U54368_doc8.3d Time: 14:50:08 Date: 25/02/08
Checksum: -2069079847
152
38 Pensions and other post-retirement benefits
Most group companies have pension plans, the forms and benefits of which vary with conditions and practices in the countries concerned. Pension
benefits may be provided through defined contribution plans (money purchase schemes) or defined benefit plans (final salary and other types of
schemes with committed pension payments). For defined contribution plans, retirement benefits are determined by the value of funds arising from
contributions paid in respect of each employee. For defined benefit plans, retirement benefits are based on such factors as the employees’
pensionable salary and length of service. Defined benefit plans may be externally funded or unfunded. The assets of funded plans are generally held in
separately administered trusts.
In particular, the primary pension arrangement in the UK is a funded final salary pension plan that remains open to new employees. Retired
employees draw the majority of their benefit as an annuity.
In the US, a range of retirement arrangements are provided. These include a funded final salary pension plan for certain heritage employees and a
cash balance arrangement for new hires. Retired US employees typically take their pension benefit in the form of a lump sum payment. US
employees are also eligible to participate in a defined contribution (401k) plan in which employee contributions are matched with company
contributions.
The level of contributions to funded defined benefit plans is the amount needed to provide adequate funds to meet pension obligations as they fall
due. During 2007, contributions of $524 million (2006 $438 million and 2005 $340 million) and $97 million (2006 $181 million and 2005 $279 million)
were made to the UK plans and US plans respectively. In addition, contributions of $127 million (2006 $136 million and 2005 $140 million) were made
to other funded defined benefit plans. The aggregate level of contributions in 2008 is expected to be approximately $500 million.
Certain group companies, principally in the US, provide post-retirement healthcare and life insurance benefits to their retired employees and
dependants. The entitlement to these benefits is usually based on the employee remaining in service until retirement age and completion of a
minimum period of service. The plans are funded to a limited extent.
The obligation and cost of providing pensions and other post-retirement benefits is assessed annually using the projected unit credit method. The
date of the most recent actuarial review was 31 December 2007.
The material financial assumptions used for estimating the benefit obligations of the various plans are set out below. The assumptions used to
evaluate accrued pension and other post-retirement benefits at 31 December in any year are used to determine pension and other post-retirement
expense for the following year, that is, the assumptions at 31 December 2007 are used to determine the pension liabilities at that date and the
pension cost for 2008.
%--------------------------------------------------------------------------------------------------------------------------------------------------------------------------------------------------------------------------------------------------------------------------------------------------------
Financial assumptions UK US Other--------------------------------------------------------------------------------------------------------------------------------------------------------------------------------------------------------------------------------------------------------------------------------------------------------
2007 2006 2005 2007 2006 2005 2007 2006 2005--------------------------------------------------------------------------------------------------------------------------------------------------------------------------------------------------------------------------------------------------------------------------------------------------------
Discount rate for pension plan liabilities 5.7 5.1 4.75 6.1 5.7 5.50 5.6 4.8 4.00
Discount rate for post-retirement benefit
plans n/a n/a n/a 6.4 5.9 5.50 n/a n/a n/a
Rate of increase in salariesa 5.1 4.7 4.25 4.2 4.2 4.25 3.7 3.6 3.25
Rate of increase for pensions in payment 3.2 2.8 2.50 – – – 1.8 1.8 1.75
Rate of increase in deferred pensions 3.2 2.8 2.50 – – – 1.2 1.1 1.00
Inflation 3.2 2.8 2.50 2.4 2.4 2.50 2.2 2.2 2.00
a This assumption includes an allowance for promotion-related salary growth, of between 0.3% and 0.4% depending on country.
In addition to the financial assumptions, we regularly review the demographic and mortality assumptions. Mortality assumptions reflect best practice
in the countries in which we provide pensions, and have been chosen with regard to the latest available published tables adjusted where appropriate
to reflect the experience of the group and an extrapolation of past longevity improvements into the future. BP’s most substantial pension liabilities are
in the UK, the US and Germany where our assumptions are as follows:
Years--------------------------------------------------------------------------------------------------------------------------------------------------------------------------------------------------------------------------------------------------------------------------------------------------------
Mortality assumptions UK US Germany--------------------------------------------------------------------------------------------------------------------------------------------------------------------------------------------------------------------------------------------------------------------------------------------------------
2007 2006 2005 2007 2006 2005 2007 2006 2005--------------------------------------------------------------------------------------------------------------------------------------------------------------------------------------------------------------------------------------------------------------------------------------------------------
Life expectancy at age 60 for a male currently aged 60 24.0 23.9 23.0 24.3 24.2 21.9 22.4 22.2 22.1
Life expectancy at age 60 for a female currently aged 60 26.9 26.8 26.0 26.1 26.0 25.6 27.0 26.9 26.7
Life expectancy at age 60 for a male currently aged 40 25.1 25.0 23.9 25.8 25.8 21.9 25.3 25.2 25.0
Life expectancy at age 60 for a female currently aged 40 27.9 27.8 26.9 27.0 26.9 25.6 29.7 29.6 29.4
The assumed future US healthcare cost trend rate is as follows:
%--------------------------------------------------------------------------------------------------------------------------------------------------------------------------------------------------------------------------------------------------------------------------------------------------------
2007 2006 2005--------------------------------------------------------------------------------------------------------------------------------------------------------------------------------------------------------------------------------------------------------------------------------------------------------
Initial US healthcare cost trend rate 9.0 9.3 10.3
Ultimate US healthcare cost trend rate 5.0 5.0 5.0
Year in which ultimate trend rate is reached 2013 2013 2013
Pension plan assets are generally held in trusts. The primary objective of the trusts is to accumulate pools of assets sufficient to meet the obligation of
the various plans. The assets of the trusts are invested in a manner consistent with fiduciary obligations and principles that reflect current practices in
portfolio management.

Filename: U54368_doc8.3d Time: 14:50:08 Date: 25/02/08
Checksum: -1137233356
BP ANNUAL REPORT AND ACCOUNTS 2007 153
38 Pensions and other post-retirement benefits continued
A significant proportion of the assets are held in equities, owing to a higher expected level of return over the long term with an acceptable level of risk.
In order to provide reasonable assurance that no single security or type of security has an unwarranted impact on the total portfolio, the investment
portfolios are highly diversified. The long-term asset allocation policy for the major plans is as follows:
--------------------------------------------------------------------------------------------------------------------------------------------------------------------------------------------------------------------------------------------------------------------------------------------------------
Policy rangeAsset category %--------------------------------------------------------------------------------------------------------------------------------------------------------------------------------------------------------------------------------------------------------------------------------------------------------
Total equity 55-85
Fixed income/cash 15-35
Property/real estate 0-10
Some of the group’s pension funds use derivatives as part of their asset mix and to manage the level of risk. The group’s main pension funds do not
directly invest in either securities or property/real estate of the company or of any subsidiary.
Return on asset assumptions reflect the group’s expectations built up by asset class and by plan. The group’s expectation is derived from a
combination of historical returns over the long term and the forecasts of market professionals.
The expected long-term rates of return and market values of the various categories of asset held by the defined benefit plans at 31 December are
set out below. The market values shown include the effects of derivative financial instruments.
--------------------------------------------------------------------------------------------------------------------------------------------------------------------------------------------------------------------------------------------------------------------------------------------------------
2007 2006 2005--------------------------------------------------------------------------------------------------------------------------------------------------------------------------------------------------------------------------------------------------------------------------------------------------------
Expected Expected Expectedlong-term Market long-term Market long-term Market
rate of return value rate of return value rate of return value--------------------------------------------------------------------------------------------------------------------------------------------------------------------------------------------------------------------------------------------------------------------------------------------------------
% $ million % $ million % $ million--------------------------------------------------------------------------------------------------------------------------------------------------------------------------------------------------------------------------------------------------------------------------------------------------------
UK pension plans
Equities 8.0 24,106 7.5 23,631 7.50 18,465
Bonds 4.4 5,279 4.7 3,881 4.25 2,719
Property 6.5 1,259 6.5 1,370 6.50 1,097
Cash 5.6 977 3.8 379 3.50 1,001--------------------------------------------------------------------------------------------------------------------------------------------------------------------------------------------------------------------------------------------------------------------------------------------------------
7.3 31,621 7.0 29,261 7.00 23,282
US pension plans
Equities 8.5 6,610 8.5 6,528 8.50 5,961
Bonds 5.0 1,347 5.0 1,371 4.75 1,079
Property 8.0 16 8.0 15 8.00 21
Cash 3.6 72 3.2 41 3.00 256--------------------------------------------------------------------------------------------------------------------------------------------------------------------------------------------------------------------------------------------------------------------------------------------------------
8.0 8,045 8.0 7,955 8.00 7,317
US other post-retirement benefit plans
Equities 8.5 17 8.5 19 8.50 20
Bonds 5.0 6 5.0 7 4.75 8--------------------------------------------------------------------------------------------------------------------------------------------------------------------------------------------------------------------------------------------------------------------------------------------------------
7.6 23 7.5 26 7.25 28
Other plans
Equities 8.1 1,260 7.6 1,158 7.50 991
Bonds 5.0 1,491 4.6 1,199 4.00 943
Property 5.7 145 4.7 120 5.75 130
Cash 4.2 214 3.0 191 1.50 216--------------------------------------------------------------------------------------------------------------------------------------------------------------------------------------------------------------------------------------------------------------------------------------------------------
6.4 3,110 5.8 2,668 5.50 2,280
The assumed rate of investment return and discount rate have a significant effect on the amounts reported. A one-percentage point change in these
assumptions for the group’s plans would have had the following effects:
$ million--------------------------------------------------------------------------------------------------------------------------------------------------------------------------------------------------------------------------------------------------------------------------------------------------------
One-percentage point--------------------------------------------------------------------------------------------------------------------------------------------------------------------------------------------------------------------------------------------------------------------------------------------------------
Increase Decrease--------------------------------------------------------------------------------------------------------------------------------------------------------------------------------------------------------------------------------------------------------------------------------------------------------
Investment return
Effect on pension and other post-retirement benefit expense in 2008 (419) 415
Discount rate
Effect on pension and other post-retirement benefit expense in 2008 (84) 114
Effect on pension and other post-retirement benefit obligation at 31 December 2007 (5,039) 6,459
The assumed US healthcare cost trend rate has a significant effect on the amounts reported. A one-percentage point change in the assumed US
healthcare cost trend rate would have had the following effects:
$ million--------------------------------------------------------------------------------------------------------------------------------------------------------------------------------------------------------------------------------------------------------------------------------------------------------
One-percentage point--------------------------------------------------------------------------------------------------------------------------------------------------------------------------------------------------------------------------------------------------------------------------------------------------------
Increase Decrease--------------------------------------------------------------------------------------------------------------------------------------------------------------------------------------------------------------------------------------------------------------------------------------------------------
Effect on US other post-retirement benefit expense in 2008 32 (26)
Effect on US other post-retirement obligation at 31 December 2007 358 (295)
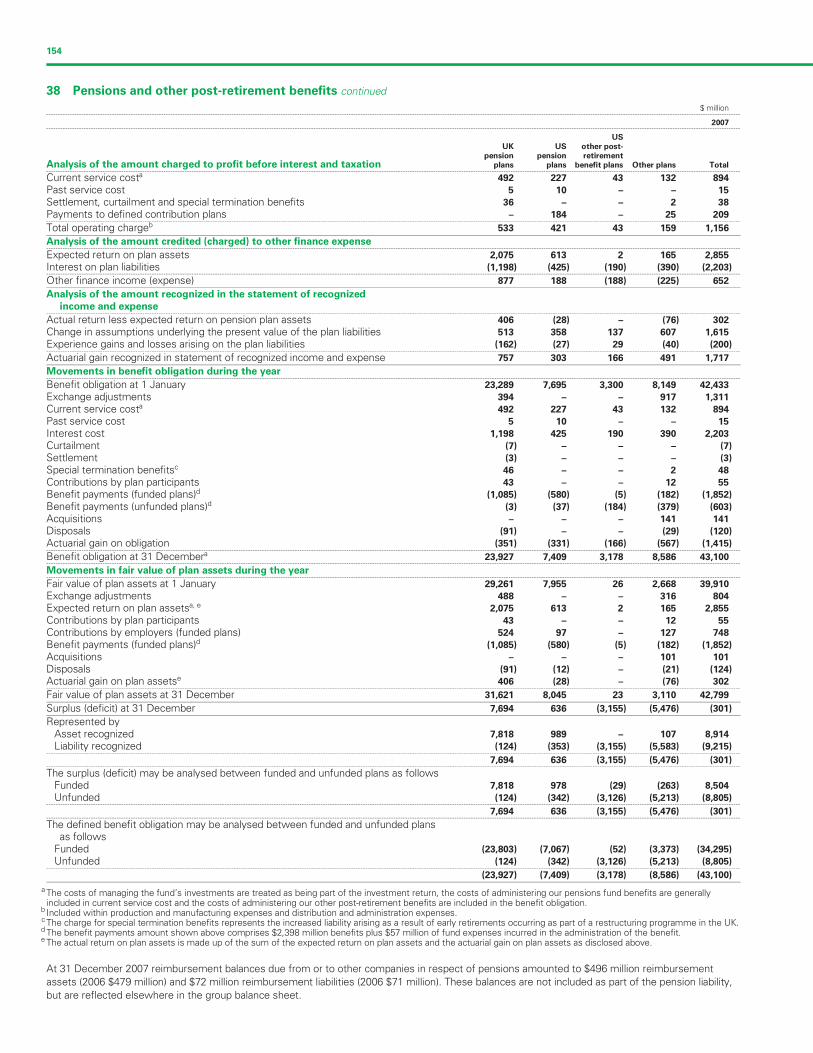
Filename: U54368_doc8.3d Time: 14:50:09 Date: 25/02/08
Checksum: 1449349700
154
38 Pensions and other post-retirement benefits continued
$ million--------------------------------------------------------------------------------------------------------------------------------------------------------------------------------------------------------------------------------------------------------------------------------------------------------
2007--------------------------------------------------------------------------------------------------------------------------------------------------------------------------------------------------------------------------------------------------------------------------------------------------------
US
UK US other post-
pension pension retirement
Analysis of the amount charged to profit before interest and taxation plans plans benefit plans Other plans Total--------------------------------------------------------------------------------------------------------------------------------------------------------------------------------------------------------------------------------------------------------------------------------------------------------
Current service costa 492 227 43 132 894
Past service cost 5 10 – – 15
Settlement, curtailment and special termination benefits 36 – – 2 38
Payments to defined contribution plans – 184 – 25 209--------------------------------------------------------------------------------------------------------------------------------------------------------------------------------------------------------------------------------------------------------------------------------------------------------
Total operating chargeb 533 421 43 159 1,156
Analysis of the amount credited (charged) to other finance expense--------------------------------------------------------------------------------------------------------------------------------------------------------------------------------------------------------------------------------------------------------------------------------------------------------
Expected return on plan assets 2,075 613 2 165 2,855
Interest on plan liabilities (1,198) (425) (190) (390) (2,203)--------------------------------------------------------------------------------------------------------------------------------------------------------------------------------------------------------------------------------------------------------------------------------------------------------
Other finance income (expense) 877 188 (188) (225) 652
Analysis of the amount recognized in the statement of recognized
income and expense--------------------------------------------------------------------------------------------------------------------------------------------------------------------------------------------------------------------------------------------------------------------------------------------------------
Actual return less expected return on pension plan assets 406 (28) – (76) 302
Change in assumptions underlying the present value of the plan liabilities 513 358 137 607 1,615
Experience gains and losses arising on the plan liabilities (162) (27) 29 (40) (200)--------------------------------------------------------------------------------------------------------------------------------------------------------------------------------------------------------------------------------------------------------------------------------------------------------
Actuarial gain recognized in statement of recognized income and expense 757 303 166 491 1,717
Movements in benefit obligation during the year--------------------------------------------------------------------------------------------------------------------------------------------------------------------------------------------------------------------------------------------------------------------------------------------------------
Benefit obligation at 1 January 23,289 7,695 3,300 8,149 42,433
Exchange adjustments 394 – – 917 1,311
Current service costa 492 227 43 132 894
Past service cost 5 10 – – 15
Interest cost 1,198 425 190 390 2,203
Curtailment (7) – – – (7)
Settlement (3) – – – (3)
Special termination benefitsc 46 – – 2 48
Contributions by plan participants 43 – – 12 55
Benefit payments (funded plans)d (1,085) (580) (5) (182) (1,852)
Benefit payments (unfunded plans)d (3) (37) (184) (379) (603)
Acquisitions – – – 141 141
Disposals (91) – – (29) (120)
Actuarial gain on obligation (351) (331) (166) (567) (1,415)--------------------------------------------------------------------------------------------------------------------------------------------------------------------------------------------------------------------------------------------------------------------------------------------------------
Benefit obligation at 31 Decembera 23,927 7,409 3,178 8,586 43,100--------------------------------------------------------------------------------------------------------------------------------------------------------------------------------------------------------------------------------------------------------------------------------------------------------
Movements in fair value of plan assets during the year--------------------------------------------------------------------------------------------------------------------------------------------------------------------------------------------------------------------------------------------------------------------------------------------------------
Fair value of plan assets at 1 January 29,261 7,955 26 2,668 39,910
Exchange adjustments 488 – – 316 804
Expected return on plan assetsa, e 2,075 613 2 165 2,855
Contributions by plan participants 43 – – 12 55
Contributions by employers (funded plans) 524 97 – 127 748
Benefit payments (funded plans)d (1,085) (580) (5) (182) (1,852)
Acquisitions – – – 101 101
Disposals (91) (12) – (21) (124)
Actuarial gain on plan assetse 406 (28) – (76) 302--------------------------------------------------------------------------------------------------------------------------------------------------------------------------------------------------------------------------------------------------------------------------------------------------------
Fair value of plan assets at 31 December 31,621 8,045 23 3,110 42,799
Surplus (deficit) at 31 December 7,694 636 (3,155) (5,476) (301)
Represented byAsset recognized 7,818 989 – 107 8,914
Liability recognized (124) (353) (3,155) (5,583) (9,215)--------------------------------------------------------------------------------------------------------------------------------------------------------------------------------------------------------------------------------------------------------------------------------------------------------
7,694 636 (3,155) (5,476) (301)--------------------------------------------------------------------------------------------------------------------------------------------------------------------------------------------------------------------------------------------------------------------------------------------------------
The surplus (deficit) may be analysed between funded and unfunded plans as followsFunded 7,818 978 (29) (263) 8,504
Unfunded (124) (342) (3,126) (5,213) (8,805)--------------------------------------------------------------------------------------------------------------------------------------------------------------------------------------------------------------------------------------------------------------------------------------------------------
7,694 636 (3,155) (5,476) (301)--------------------------------------------------------------------------------------------------------------------------------------------------------------------------------------------------------------------------------------------------------------------------------------------------------
The defined benefit obligation may be analysed between funded and unfunded plansas follows
Funded (23,803) (7,067) (52) (3,373) (34,295)
Unfunded (124) (342) (3,126) (5,213) (8,805)--------------------------------------------------------------------------------------------------------------------------------------------------------------------------------------------------------------------------------------------------------------------------------------------------------
(23,927) (7,409) (3,178) (8,586) (43,100)
a The costs of managing the fund’s investments are treated as being part of the investment return, the costs of administering our pensions fund benefits are generallyincluded in current service cost and the costs of administering our other post-retirement benefits are included in the benefit obligation.
b Included within production and manufacturing expenses and distribution and administration expenses.c The charge for special termination benefits represents the increased liability arising as a result of early retirements occurring as part of a restructuring programme in the UK.d The benefit payments amount shown above comprises $2,398 million benefits plus $57 million of fund expenses incurred in the administration of the benefit.e The actual return on plan assets is made up of the sum of the expected return on plan assets and the actuarial gain on plan assets as disclosed above.
At 31 December 2007 reimbursement balances due from or to other companies in respect of pensions amounted to $496 million reimbursement
assets (2006 $479 million) and $72 million reimbursement liabilities (2006 $71 million). These balances are not included as part of the pension liability,
but are reflected elsewhere in the group balance sheet.

Filename: U54368_doc8.3d Time: 14:50:09 Date: 25/02/08
Checksum: 1079902292
BP ANNUAL REPORT AND ACCOUNTS 2007 155
38 Pensions and other post-retirement benefits continued
$ million--------------------------------------------------------------------------------------------------------------------------------------------------------------------------------------------------------------------------------------------------------------------------------------------------------
2006--------------------------------------------------------------------------------------------------------------------------------------------------------------------------------------------------------------------------------------------------------------------------------------------------------
USUK US other post-
pension pension retirementAnalysis of the amount charged to profit before interest and taxation plans plans benefit plans Other plans Total--------------------------------------------------------------------------------------------------------------------------------------------------------------------------------------------------------------------------------------------------------------------------------------------------------
Current service costa 432 216 42 139 829
Past service cost (74) 38 – 39 3
Settlement, curtailment and special termination benefits 4 – – 227 231
Payments to defined contribution plans – 161 – 16 177--------------------------------------------------------------------------------------------------------------------------------------------------------------------------------------------------------------------------------------------------------------------------------------------------------
Total operating chargeb 362 415 42 421 1,240
Analysis of the amount credited (charged) to other finance expense--------------------------------------------------------------------------------------------------------------------------------------------------------------------------------------------------------------------------------------------------------------------------------------------------------
Expected return on plan assets 1,711 564 2 133 2,410
Interest on plan liabilities (1,006) (423) (186) (325) (1,940)--------------------------------------------------------------------------------------------------------------------------------------------------------------------------------------------------------------------------------------------------------------------------------------------------------
Other finance income (expense) 705 141 (184) (192) 470
Analysis of the amount recognized in the statement of recognized income
and expense--------------------------------------------------------------------------------------------------------------------------------------------------------------------------------------------------------------------------------------------------------------------------------------------------------
Actual return less expected return on pension plan assets 1,305 521 – 141 1,967
Change in assumptions underlying the present value of the plan liabilities 114 195 111 352 772
Experience gains and losses arising on the plan liabilities (24) 17 80 (197) (124)--------------------------------------------------------------------------------------------------------------------------------------------------------------------------------------------------------------------------------------------------------------------------------------------------------
Actuarial gain recognized in statement of recognized income and expense 1,395 733 191 296 2,615
Movements in benefit obligation during the year--------------------------------------------------------------------------------------------------------------------------------------------------------------------------------------------------------------------------------------------------------------------------------------------------------
Benefit obligation at 1 January 20,063 7,900 3,478 7,414 38,855
Exchange adjustments 2,748 – – 632 3,380
Current service cost 432 216 42 139 829
Past service cost (74) 38 – 39 3
Interest cost 1,006 423 186 325 1,940
Curtailment (20) – – – (20)
Settlement (22) – – – (22)
Special termination benefitsc 46 – – 227 273
Contributions by plan participants 38 – – 5 43
Benefit payments (funded plans)d (981) (615) (4) (149) (1,749)
Benefit payments (unfunded plans)d – (37) (211) (321) (569)
Acquisitions – – – –
Disposals 143 (18) – (7) 118
Actuarial gain on obligation (90) (212) (191) (155) (648)--------------------------------------------------------------------------------------------------------------------------------------------------------------------------------------------------------------------------------------------------------------------------------------------------------
Benefit obligation at 31 December 23,289 7,695 3,300 8,149 42,433--------------------------------------------------------------------------------------------------------------------------------------------------------------------------------------------------------------------------------------------------------------------------------------------------------
Movements in fair value of plan assets during the year--------------------------------------------------------------------------------------------------------------------------------------------------------------------------------------------------------------------------------------------------------------------------------------------------------
Fair value of plan assets at 1 January 23,282 7,317 28 2,280 32,907
Exchange adjustments 3,325 – – 122 3,447
Expected return on plan assetsa, e 1,711 564 2 133 2,410
Contributions by plan participants 38 – – 5 43
Contributions by employers (funded plans) 438 181 – 136 755
Benefit payments (funded plans)d (981) (615) (4) (149) (1,749)
Acquisitions – – – –
Disposals 143 (13) – – 130
Actuarial gain on plan assetse 1,305 521 – 141 1,967--------------------------------------------------------------------------------------------------------------------------------------------------------------------------------------------------------------------------------------------------------------------------------------------------------
Fair value of plan assets at 31 December 29,261 7,955 26 2,668 39,910
Surplus (deficit) at 31 December 5,972 260 (3,274) (5,481) (2,523)
Represented byAsset recognized 6,089 617 – 47 6,753
Liability recognized (117) (357) (3,274) (5,528) (9,276)--------------------------------------------------------------------------------------------------------------------------------------------------------------------------------------------------------------------------------------------------------------------------------------------------------
5,972 260 (3,274) (5,481) (2,523)--------------------------------------------------------------------------------------------------------------------------------------------------------------------------------------------------------------------------------------------------------------------------------------------------------
The surplus (deficit) may be analysed between funded and unfunded plans as followsFunded 6,089 601 (30) (379) 6,281
Unfunded (117) (341) (3,244) (5,102) (8,804)--------------------------------------------------------------------------------------------------------------------------------------------------------------------------------------------------------------------------------------------------------------------------------------------------------
5,972 260 (3,274) (5,481) (2,523)--------------------------------------------------------------------------------------------------------------------------------------------------------------------------------------------------------------------------------------------------------------------------------------------------------
The defined benefit obligation may be analysed between funded and unfunded plansas follows
Funded (23,172) (7,354) (56) (3,047) (33,629)
Unfunded (117) (341) (3,244) (5,102) (8,804)--------------------------------------------------------------------------------------------------------------------------------------------------------------------------------------------------------------------------------------------------------------------------------------------------------
(23,289) (7,695) (3,300) (8,149) (42,433)
a The costs of managing the fund’s investments are treated as being part of the investment return, the costs of administering our pensions fund benefits are generallyincluded in current service cost and the costs of administering our other post-retirement benefits are included in the benefit obligation.
b Included within production and manufacturing expenses and distribution and administration expenses.c The charge for special termination benefits represents the increased liability arising as a result of early retirements occurring as part of a restructuring programme in the UKand Europe.
d The benefit payments amount shown above comprises $2,266 million benefits plus $52 million of fund expenses incurred in the administration of the benefit.e The actual return on plan assets is made up of the sum of the expected return on plan assets and the actuarial gain on plan assets as disclosed above.
–
–
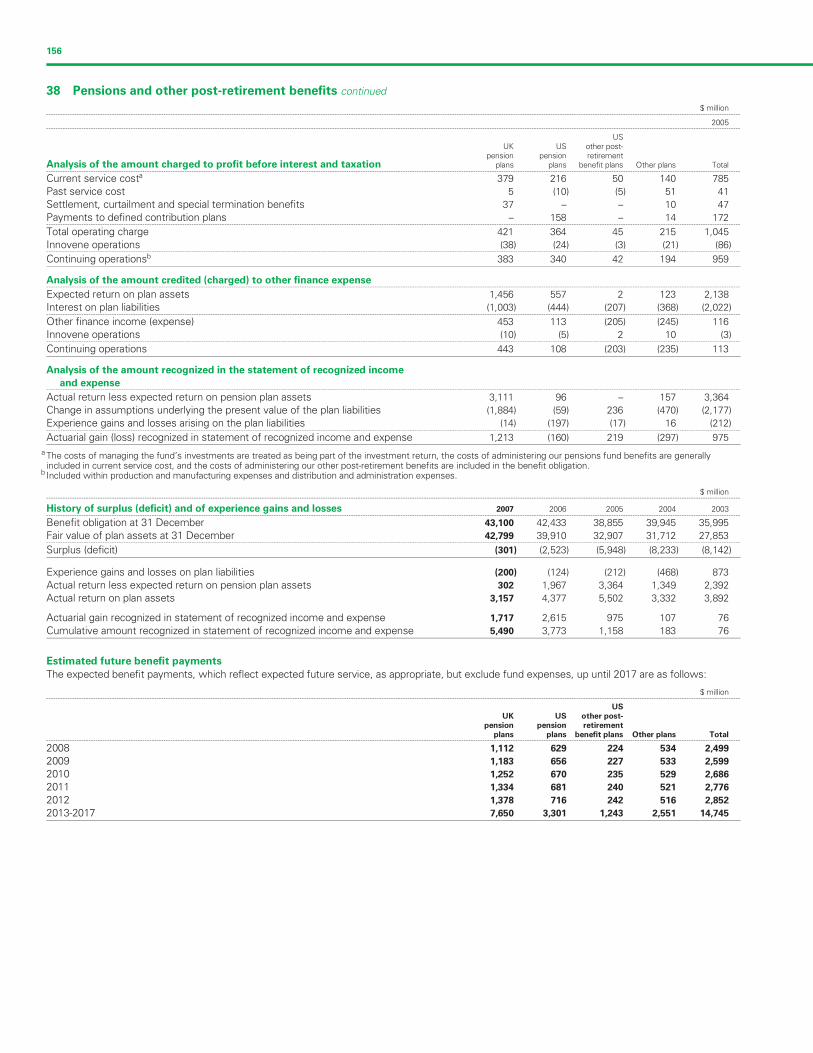
Filename: U54368_doc8.3d Time: 14:50:10 Date: 25/02/08
Checksum: 858349696
156
38 Pensions and other post-retirement benefits continued
$ million--------------------------------------------------------------------------------------------------------------------------------------------------------------------------------------------------------------------------------------------------------------------------------------------------------
2005--------------------------------------------------------------------------------------------------------------------------------------------------------------------------------------------------------------------------------------------------------------------------------------------------------
USUK US other post-
pension pension retirementAnalysis of the amount charged to profit before interest and taxation plans plans benefit plans Other plans Total--------------------------------------------------------------------------------------------------------------------------------------------------------------------------------------------------------------------------------------------------------------------------------------------------------
Current service costa 379 216 50 140 785
Past service cost 5 (10) (5) 51 41
Settlement, curtailment and special termination benefits 37 – – 10 47
Payments to defined contribution plans – 158 – 14 172--------------------------------------------------------------------------------------------------------------------------------------------------------------------------------------------------------------------------------------------------------------------------------------------------------
Total operating charge 421 364 45 215 1,045
Innovene operations (38) (24) (3) (21) (86)--------------------------------------------------------------------------------------------------------------------------------------------------------------------------------------------------------------------------------------------------------------------------------------------------------
Continuing operationsb 383 340 42 194 959
Analysis of the amount credited (charged) to other finance expense--------------------------------------------------------------------------------------------------------------------------------------------------------------------------------------------------------------------------------------------------------------------------------------------------------
Expected return on plan assets 1,456 557 2 123 2,138
Interest on plan liabilities (1,003) (444) (207) (368) (2,022)--------------------------------------------------------------------------------------------------------------------------------------------------------------------------------------------------------------------------------------------------------------------------------------------------------
Other finance income (expense) 453 113 (205) (245) 116
Innovene operations (10) (5) 2 10 (3)--------------------------------------------------------------------------------------------------------------------------------------------------------------------------------------------------------------------------------------------------------------------------------------------------------
Continuing operations 443 108 (203) (235) 113
Analysis of the amount recognized in the statement of recognized income
and expense--------------------------------------------------------------------------------------------------------------------------------------------------------------------------------------------------------------------------------------------------------------------------------------------------------
Actual return less expected return on pension plan assets 3,111 96 – 157 3,364
Change in assumptions underlying the present value of the plan liabilities (1,884) (59) 236 (470) (2,177)
Experience gains and losses arising on the plan liabilities (14) (197) (17) 16 (212)--------------------------------------------------------------------------------------------------------------------------------------------------------------------------------------------------------------------------------------------------------------------------------------------------------
Actuarial gain (loss) recognized in statement of recognized income and expense 1,213 (160) 219 (297) 975
a The costs of managing the fund’s investments are treated as being part of the investment return, the costs of administering our pensions fund benefits are generallyincluded in current service cost, and the costs of administering our other post-retirement benefits are included in the benefit obligation.
b Included within production and manufacturing expenses and distribution and administration expenses.
$ million--------------------------------------------------------------------------------------------------------------------------------------------------------------------------------------------------------------------------------------------------------------------------------------------------------
History of surplus (deficit) and of experience gains and losses 2007 2006 2005 2004 2003--------------------------------------------------------------------------------------------------------------------------------------------------------------------------------------------------------------------------------------------------------------------------------------------------------
Benefit obligation at 31 December 43,100 42,433 38,855 39,945 35,995
Fair value of plan assets at 31 December 42,799 39,910 32,907 31,712 27,853--------------------------------------------------------------------------------------------------------------------------------------------------------------------------------------------------------------------------------------------------------------------------------------------------------
Surplus (deficit) (301) (2,523) (5,948) (8,233) (8,142)
Experience gains and losses on plan liabilities (200) (124) (212) (468) 873
Actual return less expected return on pension plan assets 302 1,967 3,364 1,349 2,392
Actual return on plan assets 3,157 4,377 5,502 3,332 3,892
Actuarial gain recognized in statement of recognized income and expense 1,717 2,615 975 107 76
Cumulative amount recognized in statement of recognized income and expense 5,490 3,773 1,158 183 76
Estimated future benefit payments
The expected benefit payments, which reflect expected future service, as appropriate, but exclude fund expenses, up until 2017 are as follows:
$ million--------------------------------------------------------------------------------------------------------------------------------------------------------------------------------------------------------------------------------------------------------------------------------------------------------
US
UK US other post-
pension pension retirement
plans plans benefit plans Other plans Total--------------------------------------------------------------------------------------------------------------------------------------------------------------------------------------------------------------------------------------------------------------------------------------------------------
2008 1,112 629 224 534 2,499
2009 1,183 656 227 533 2,599
2010 1,252 670 235 529 2,686
2011 1,334 681 240 521 2,776
2012 1,378 716 242 516 2,852
2013-2017 7,650 3,301 1,243 2,551 14,745
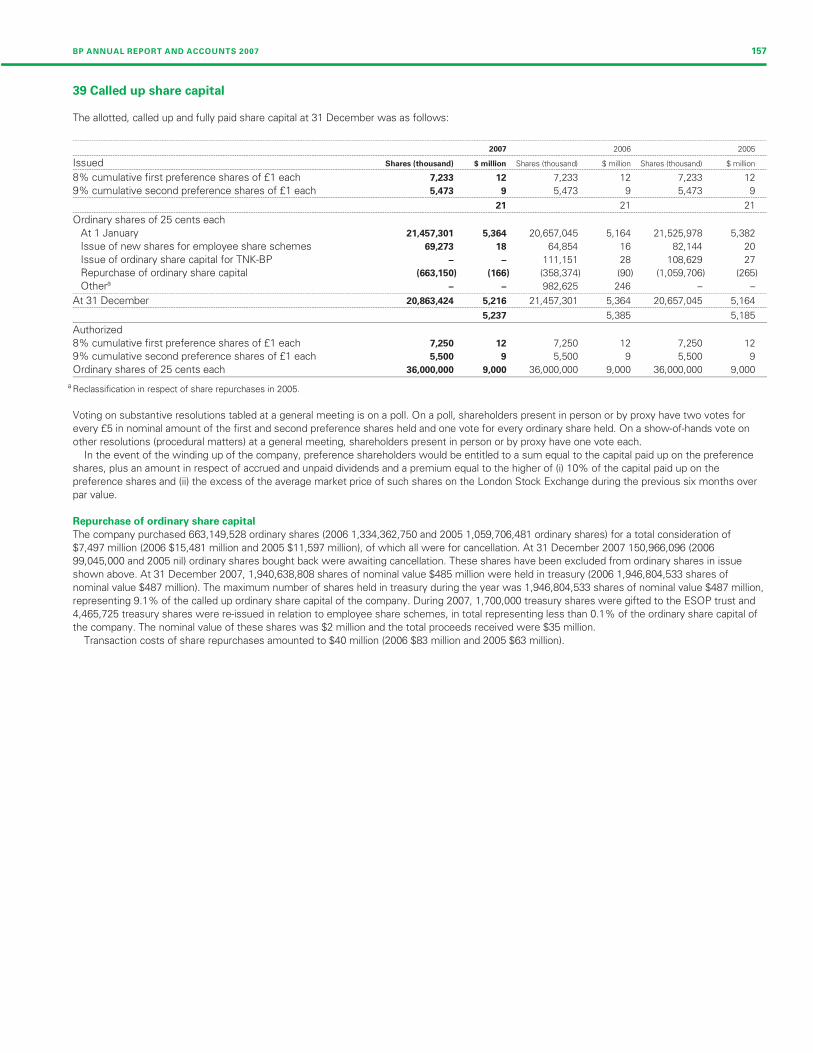
Filename: U54368_doc8.3d Time: 14:50:10 Date: 25/02/08
Checksum: -673393344
BP ANNUAL REPORT AND ACCOUNTS 2007 157
39 Called up share capital
The allotted, called up and fully paid share capital at 31 December was as follows:
--------------------------------------------------------------------------------------------------------------------------------------------------------------------------------------------------------------------------------------------------------------------------------------------------------
2007 2006 2005--------------------------------------------------------------------------------------------------------------------------------------------------------------------------------------------------------------------------------------------------------------------------------------------------------
Issued Shares (thousand) $ million Shares (thousand) $ million Shares (thousand) $ million--------------------------------------------------------------------------------------------------------------------------------------------------------------------------------------------------------------------------------------------------------------------------------------------------------
8% cumulative first preference shares of £1 each 7,233 12 7,233 12 7,233 12
9% cumulative second preference shares of £1 each 5,473 9 5,473 9 5,473 9--------------------------------------------------------------------------------------------------------------------------------------------------------------------------------------------------------------------------------------------------------------------------------------------------------
21 21 21--------------------------------------------------------------------------------------------------------------------------------------------------------------------------------------------------------------------------------------------------------------------------------------------------------
Ordinary shares of 25 cents each
At 1 January 21,457,301 5,364 20,657,045 5,164 21,525,978 5,382
Issue of new shares for employee share schemes 69,273 18 64,854 16 82,144 20
Issue of ordinary share capital for TNK-BP – – 111,151 28 108,629 27
Repurchase of ordinary share capital (663,150) (166) (358,374) (90) (1,059,706) (265)
Othera – – 982,625 246 – –--------------------------------------------------------------------------------------------------------------------------------------------------------------------------------------------------------------------------------------------------------------------------------------------------------
At 31 December 20,863,424 5,216 21,457,301 5,364 20,657,045 5,164--------------------------------------------------------------------------------------------------------------------------------------------------------------------------------------------------------------------------------------------------------------------------------------------------------
5,237 5,385 5,185
Authorized
8% cumulative first preference shares of £1 each 7,250 12 7,250 12 7,250 12
9% cumulative second preference shares of £1 each 5,500 9 5,500 9 5,500 9
Ordinary shares of 25 cents each 36,000,000 9,000 36,000,000 9,000 36,000,000 9,000
a Reclassification in respect of share repurchases in 2005.
Voting on substantive resolutions tabled at a general meeting is on a poll. On a poll, shareholders present in person or by proxy have two votes for
every £5 in nominal amount of the first and second preference shares held and one vote for every ordinary share held. On a show-of-hands vote on
other resolutions (procedural matters) at a general meeting, shareholders present in person or by proxy have one vote each.
In the event of the winding up of the company, preference shareholders would be entitled to a sum equal to the capital paid up on the preference
shares, plus an amount in respect of accrued and unpaid dividends and a premium equal to the higher of (i) 10% of the capital paid up on the
preference shares and (ii) the excess of the average market price of such shares on the London Stock Exchange during the previous six months over
par value.
Repurchase of ordinary share capital
The company purchased 663,149,528 ordinary shares (2006 1,334,362,750 and 2005 1,059,706,481 ordinary shares) for a total consideration of
$7,497 million (2006 $15,481 million and 2005 $11,597 million), of which all were for cancellation. At 31 December 2007 150,966,096 (2006
99,045,000 and 2005 nil) ordinary shares bought back were awaiting cancellation. These shares have been excluded from ordinary shares in issue
shown above. At 31 December 2007, 1,940,638,808 shares of nominal value $485 million were held in treasury (2006 1,946,804,533 shares of
nominal value $487 million). The maximum number of shares held in treasury during the year was 1,946,804,533 shares of nominal value $487 million,
representing 9.1% of the called up ordinary share capital of the company. During 2007, 1,700,000 treasury shares were gifted to the ESOP trust and
4,465,725 treasury shares were re-issued in relation to employee share schemes, in total representing less than 0.1% of the ordinary share capital of
the company. The nominal value of these shares was $2 million and the total proceeds received were $35 million.
Transaction costs of share repurchases amounted to $40 million (2006 $83 million and 2005 $63 million).

Filename: U54368_doc8.3d Time: 14:50:10 Date: 25/02/08
Checksum: -543161300
158
40 Capital and reserves
--------------------------------------------------------------------------------------------------------------------------------------------------------------------------------------------------------------------------------------------------------------------------------------------------------
Share Capital
Share premium redemption Merger
capital account reserve reserve--------------------------------------------------------------------------------------------------------------------------------------------------------------------------------------------------------------------------------------------------------------------------------------------------------
At 1 January 2007 5,385 9,074 839 27,201
Currency translation differences (net of tax) – – –
Exchange gain on translation of foreign operations transferred to (profit) or loss on sale (net of tax) – – –
Actuarial gain relating to pension and other post-retirement benefits (net of tax) – – –
Available-for-sale investments marked to market (net of tax) – – –
Available-for-sale investments recycling (net of tax) – – –
Repurchase of ordinary share capital (166) – 166 –
Share-based payments (net of tax) 18 507 – 5
Cash flow hedges marked to market (net of tax) – – –
Cash flow hedges recycling (net of tax) – – –
Profit for the year – – –
Dividends – – –--------------------------------------------------------------------------------------------------------------------------------------------------------------------------------------------------------------------------------------------------------------------------------------------------------
At 31 December 2007 5,237 9,581 1,005 27,206
--------------------------------------------------------------------------------------------------------------------------------------------------------------------------------------------------------------------------------------------------------------------------------------------------------
Share CapitalShare premium redemption Mergercapital account reserve reserve
--------------------------------------------------------------------------------------------------------------------------------------------------------------------------------------------------------------------------------------------------------------------------------------------------------
At 1 January 2006 5,185 7,371 749 27,190
Currency translation differences (net of tax) – – –
Actuarial gain relating to pension and other post-retirement benefits (net of tax) – – –
Issue of ordinary share capital for TNK-BP 28 1,222 – –
Available-for-sale investments marked to market (net of tax) – – –
Available-for-sale investments recycling (net of tax) – – –
Repurchase of ordinary share capital (90) – 90 –
Share-based payments (net of tax) 16 481 – 11
Cash flow hedges marked to market (net of tax) – – –
Cash flow hedges recycling (net of tax) – – –
Profit for the year – – –
Dividends – – –
Otherb 246 – –--------------------------------------------------------------------------------------------------------------------------------------------------------------------------------------------------------------------------------------------------------------------------------------------------------
At 31 December 2006 5,385 9,074 839 27,201
--------------------------------------------------------------------------------------------------------------------------------------------------------------------------------------------------------------------------------------------------------------------------------------------------------
Share CapitalShare premium redemption Mergercapital account reserve reserve
--------------------------------------------------------------------------------------------------------------------------------------------------------------------------------------------------------------------------------------------------------------------------------------------------------
At 31 December 2004 5,403 5,636 730 27,162
Adoption of IAS 39 – – –--------------------------------------------------------------------------------------------------------------------------------------------------------------------------------------------------------------------------------------------------------------------------------------------------------
At 1 January 2005 5,403 5,636 730 27,162
Currency translation differences (net of tax) – – –
Exchange gain on translation of foreign operations transferred to (profit) or loss on sale (net of tax) – – –
Actuarial gain relating to pension and other post retirement benefits (net of tax) – – –
Issue of ordinary share capital for TNK-BP 27 1,223 – –
Available-for-sale investments marked to market (net of tax) – – –
Available-for-sale investments recycling (net of tax) – – –
Repurchase of ordinary share capital (265) – 19 –
Share-based payments (net of tax) 20 512 – 28
Cash flow hedges marked to market (net of tax) – – –
Cash flow hedges recycling (net of tax) – – –
Profit for the year – – –
Dividends – – –--------------------------------------------------------------------------------------------------------------------------------------------------------------------------------------------------------------------------------------------------------------------------------------------------------
At 31 December 2005 5,185 7,371 749 27,190
a At 31 December 2006, the foreign currency translation reserve included $122 million relating to non-current assets held for sale. During 2007, this was included in the$147 million recycled to the income statement relating to disposals in 2007. For further details see Note 4.
b Reclassification in respect of share repurchases in 2005.
–
–
–
–
–
–
–
–
–
–
–
–
–
–
–
–
–
–
–
–
–
–
–
–
–
–
–
–

Filename: U54368_doc8.3d Time: 14:50:11 Date: 25/02/08
Checksum: 649450966
BP ANNUAL REPORT AND ACCOUNTS 2007 159
1,290
(7,997)
21,169
(8,333)
$ million----------------------------------------------------------------------------------------------------------------------------------------------- -----------------------------------------------------------------------------------------------------------------------------------------------
Foreign Share-
currency Available- based Profit BP
Other Own Treasury translation for-sale Cash flow payment and loss shareholders’ Minority Total
reserve shares shares reserve investments hedges reserve account equity interest equity----------------------------------------------------------------------------------------------------------------------------------------------- -----------------------------------------------------------------------------------------------------------------------------------------------
5 (154) (22,182) 4,685 386 39 859 58,487 84,624 841 85,465
– – – 2,002 – – – – 2,002 24 2,026
– – – (147) – – – – (147) – (147)
– – – – – – – 1,290 1,290 –
– – – – 152 – – – 152 – 152
– – – – (57) – – – (57) – (57)
– – – – – – – (7,997) (7,997) –
(5) 94 70 – – – 337 (9) 1,017 – 1,017
– – – – – 138 – – 138 – 138
– – – – – (71) – – (71) – (71)
– – – – – – – 20,845 20,845 324
– – – – – – – (8,106) (8,106) (227)----------------------------------------------------------------------------------------------------------------------------------------------- -----------------------------------------------------------------------------------------------------------------------------------------------
– (60) (22,112) 6,540 481 106 1,196 64,510 93,690 962 94,652
$ million----------------------------------------------------------------------------------------------------------------------------------------------- -----------------------------------------------------------------------------------------------------------------------------------------------
Foreign Share-currency Available- based Profit BP
Other Own Treasury translation for-sale Cash flow payment and loss shareholders’ Minority Totala
reserve shares shares reserve investments hedges reserve account equity interest equity----------------------------------------------------------------------------------------------------------------------------------------------- -----------------------------------------------------------------------------------------------------------------------------------------------
16 (140) (10,598) 2,943 385 (234) 643 46,466 79,976 789 80,765
– (19) – 1,742 27 6 – – 1,756 49 1,805
– – – – – – – 1,795 1,795 –
– – – – – – – – 1,250 –
– – – – 478 – – – 478 – 478
– – – – (504) – – – (504) – (504)
– – (11,472) – – – – (4,009) (15,481) – (15,481)
(11) 5 134 – – – 216 (79) 773 – 773
– – – – – 313 – – 313 –
– – – – – (46) – – (46) – (46)
– – – – – – – 22,000 22,000 286
– – – – – – – (7,686) (7,686) (283)
– – (246) – – – – – – –----------------------------------------------------------------------------------------------------------------------------------------------- -----------------------------------------------------------------------------------------------------------------------------------------------
5 (154) (22,182) 4,685 386 39 859 58,487 84,624 841 85,465
$ million----------------------------------------------------------------------------------------------------------------------------------------------- -----------------------------------------------------------------------------------------------------------------------------------------------
Foreign Share-currency Available- based Profit BP
Other Own Treasury translation for-sale Cash flow payment and loss shareholders’ Minority Totalreserve shares shares reserve investments hedges reserve account equity interest equity
----------------------------------------------------------------------------------------------------------------------------------------------- -----------------------------------------------------------------------------------------------------------------------------------------------
44 (82) – 5,616 – – 443 31,940 76,892 1,343 78,235
– – – – 230 (118) – (355) (243) – (243)----------------------------------------------------------------------------------------------------------------------------------------------- -----------------------------------------------------------------------------------------------------------------------------------------------
44 (82) – 5,616 230 (118) 443 31,585 76,649 1,343 77,992
– 12 – (2,453) (35) (3) – – (2,479) (18) (2,497)
– – – (220) – – – – (220) – (220)
– – – – – – – 619 619 – 619
– – – – – – – – 1,250 –
– – – – 232 – – – 232 – 232
– – – – (42) – – – (42) – (42)
– – (10,601) – – – – (750) (11,597) – (11,597)
(28) (70) 3 – – – 200 30 695 – 695
– – – – – (149) – – (149) – (149)
– – – – – 36 – – 36 –
– – – – – – – 22,341 22,341 291
– – – – – – – (7,359) (7,359) (827)----------------------------------------------------------------------------------------------------------------------------------------------- -----------------------------------------------------------------------------------------------------------------------------------------------
16 (140) (10,598) 2,943 385 (234) 643 46,466 79,976 789 80,765
1,795
1,250
313
22,286
(7,969)
–
1,250
36
22,632
(8,186)

Filename: U54368_doc8.3d Time: 14:50:11 Date: 25/02/08
Checksum: 10324827
160
40 Capital and reserves continued
Share capital
The balance on the share capital account represents the aggregate nominal value of all ordinary and preference shares in issue, including treasury
shares.
Share premium account
The balance on the share premium account represents the amounts received in excess of the nominal value of the ordinary and preference shares.
Capital redemption reserve
The balance on the capital redemption reserve represents the aggregate nominal value of all the ordinary shares repurchased and cancelled.
Merger reserve
The balance on the merger reserve represents the fair value of the consideration given in excess of the nominal value of the ordinary shares issued in
an acquisition made by the issue of shares.
Other reserve
The balance on the other reserve represents the fair value of the consideration given in excess of the nominal value of the ordinary shares to be issued
in the ARCO acquisition on the exercise of ARCO share options.
Own shares
Own shares represent BP shares held in Employee Share Ownership Plans (ESOPs) to meet the future requirements of the employee share-based
payment arrangements.
Treasury shares
Treasury shares represent BP shares repurchased and available for re-issue.
Foreign currency translation reserve
The foreign currency translation reserve is used to record exchange differences arising from the translations of the financial statements of foreign
operations. Upon disposal of foreign operations, the related accumulated exchange differences are recycled to the income statement. This reserve is
also used to record the effect of hedging net investments in foreign operations.
Available-for-sale investments
This reserve records the changes in fair value on available-for-sale investments. On disposal, the cumulative changes in fair value are recycled to the
income statement.
Cash flow hedges
This reserve records the portion of the gain or loss on a hedging instrument in a cash flow hedge that is determined to be an effective hedge. When
the hedged transaction occurs, the gain or loss on the hedging instrument is transferred out of equity to either profit or loss or the carrying value of
assets, as appropriate. If the forecast transaction is no longer expected to occur the gain or loss recognized in equity is transferred to profit or loss.
Share-based payment reserve
This reserve represents cumulative amounts charged to profit in respect of employee share-based payment arrangements where the scheme has not
yet been settled by means of an award of shares to an individual.
Profit and loss account
The balance held on this reserve is the accumulated retained profits of the group.
41 Share-based payments
$ million--------------------------------------------------------------------------------------------------------------------------------------------------------------------------------------------------------------------------------------------------------------------------------------------------------
Effect of share-based payment transactions on the group’s result and financial position 2007 2006 2005--------------------------------------------------------------------------------------------------------------------------------------------------------------------------------------------------------------------------------------------------------------------------------------------------------
Total expense recognized for equity-settled share-based payment transactions 412 405 348
Total expense recognized for cash-settled share-based payment transactions 16 14 20--------------------------------------------------------------------------------------------------------------------------------------------------------------------------------------------------------------------------------------------------------------------------------------------------------
Total expense recognized for share-based payment transactions 428 419 368--------------------------------------------------------------------------------------------------------------------------------------------------------------------------------------------------------------------------------------------------------------------------------------------------------
Closing balance of liability for cash-settled share-based payment transactions 40 38 48
Total intrinsic value for vested cash-settled share-based payments 22 23 41
For ease of presentation, option and share holdings detailed in the tables within this note are stated as UK ordinary share equivalents in US dollars. US
employees are granted American depositary shares (ADSs) or options over the company’s ADSs (one ADS is equivalent to six ordinary shares). The
share-based payment plans that existed during the year are detailed below. All plans are ongoing unless otherwise stated.
Plans for executive directors
Executive Directors’ Incentive Plan (EDIP) – share element (2005 onwards)
An equity-settled incentive share plan for executive directors driven by one performance measure over a three-year performance period. The award of
shares is determined by comparing BP’s total shareholder return (TSR) against the other oil majors. In addition, for the group chief executive, 27% of
the grant is based on long-term leadership (LTL) measures. After the performance period, the shares that vest (net of tax) are then subject to a three-
year retention period. The director’s remuneration report on pages 63-73 includes full details of this plan.
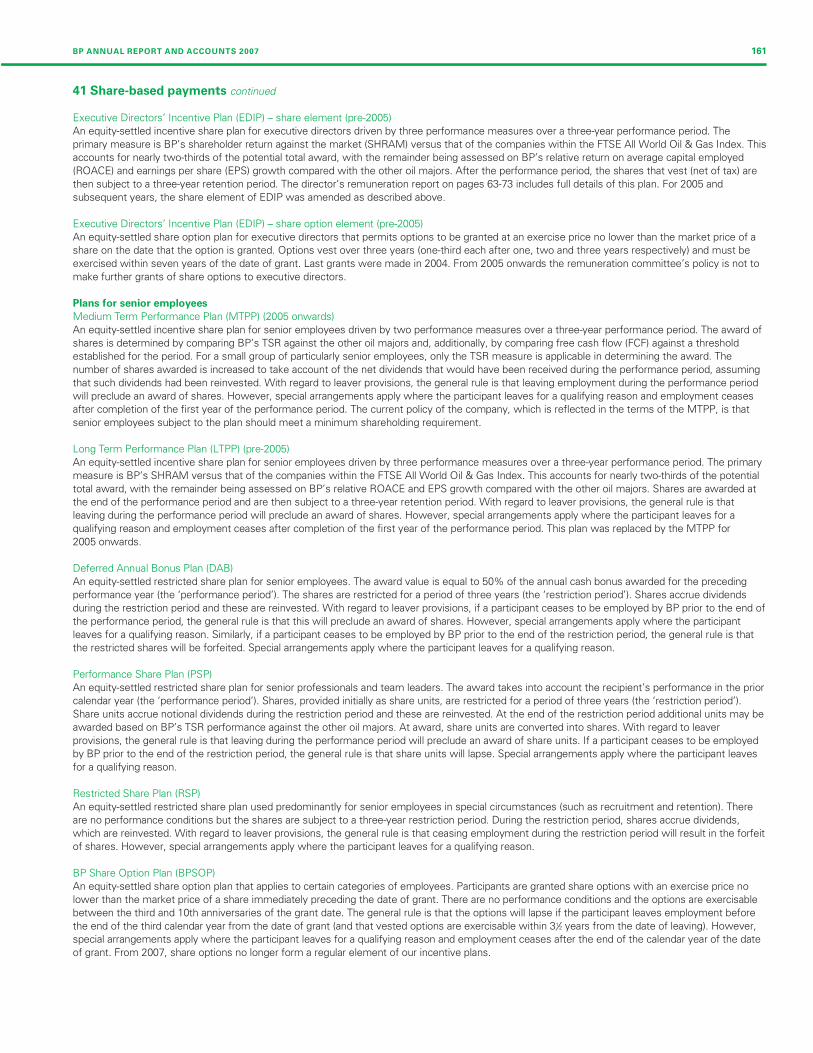
Filename: U54368_doc8.3d Time: 14:50:11 Date: 25/02/08
Checksum: -1480880831
BP ANNUAL REPORT AND ACCOUNTS 2007 161
41 Share-based payments continued
Executive Directors’ Incentive Plan (EDIP) – share element (pre-2005)
An equity-settled incentive share plan for executive directors driven by three performance measures over a three-year performance period. The
primary measure is BP’s shareholder return against the market (SHRAM) versus that of the companies within the FTSE All World Oil & Gas Index. This
accounts for nearly two-thirds of the potential total award, with the remainder being assessed on BP’s relative return on average capital employed
(ROACE) and earnings per share (EPS) growth compared with the other oil majors. After the performance period, the shares that vest (net of tax) are
then subject to a three-year retention period. The director’s remuneration report on pages 63-73 includes full details of this plan. For 2005 and
subsequent years, the share element of EDIP was amended as described above.
Executive Directors’ Incentive Plan (EDIP) – share option element (pre-2005)
An equity-settled share option plan for executive directors that permits options to be granted at an exercise price no lower than the market price of a
share on the date that the option is granted. Options vest over three years (one-third each after one, two and three years respectively) and must be
exercised within seven years of the date of grant. Last grants were made in 2004. From 2005 onwards the remuneration committee’s policy is not to
make further grants of share options to executive directors.
Plans for senior employees
Medium Term Performance Plan (MTPP) (2005 onwards)
An equity-settled incentive share plan for senior employees driven by two performance measures over a three-year performance period. The award of
shares is determined by comparing BP’s TSR against the other oil majors and, additionally, by comparing free cash flow (FCF) against a threshold
established for the period. For a small group of particularly senior employees, only the TSR measure is applicable in determining the award. The
number of shares awarded is increased to take account of the net dividends that would have been received during the performance period, assuming
that such dividends had been reinvested. With regard to leaver provisions, the general rule is that leaving employment during the performance period
will preclude an award of shares. However, special arrangements apply where the participant leaves for a qualifying reason and employment ceases
after completion of the first year of the performance period. The current policy of the company, which is reflected in the terms of the MTPP, is that
senior employees subject to the plan should meet a minimum shareholding requirement.
Long Term Performance Plan (LTPP) (pre-2005)
An equity-settled incentive share plan for senior employees driven by three performance measures over a three-year performance period. The primary
measure is BP’s SHRAM versus that of the companies within the FTSE All World Oil & Gas Index. This accounts for nearly two-thirds of the potential
total award, with the remainder being assessed on BP’s relative ROACE and EPS growth compared with the other oil majors. Shares are awarded at
the end of the performance period and are then subject to a three-year retention period. With regard to leaver provisions, the general rule is that
leaving during the performance period will preclude an award of shares. However, special arrangements apply where the participant leaves for a
qualifying reason and employment ceases after completion of the first year of the performance period. This plan was replaced by the MTPP for
2005 onwards.
Deferred Annual Bonus Plan (DAB)
An equity-settled restricted share plan for senior employees. The award value is equal to 50% of the annual cash bonus awarded for the preceding
performance year (the ‘performance period’). The shares are restricted for a period of three years (the ‘restriction period’). Shares accrue dividends
during the restriction period and these are reinvested. With regard to leaver provisions, if a participant ceases to be employed by BP prior to the end of
the performance period, the general rule is that this will preclude an award of shares. However, special arrangements apply where the participant
leaves for a qualifying reason. Similarly, if a participant ceases to be employed by BP prior to the end of the restriction period, the general rule is that
the restricted shares will be forfeited. Special arrangements apply where the participant leaves for a qualifying reason.
Performance Share Plan (PSP)
An equity-settled restricted share plan for senior professionals and team leaders. The award takes into account the recipient’s performance in the prior
calendar year (the ‘performance period’). Shares, provided initially as share units, are restricted for a period of three years (the ‘restriction period’).
Share units accrue notional dividends during the restriction period and these are reinvested. At the end of the restriction period additional units may be
awarded based on BP’s TSR performance against the other oil majors. At award, share units are converted into shares. With regard to leaver
provisions, the general rule is that leaving during the performance period will preclude an award of share units. If a participant ceases to be employed
by BP prior to the end of the restriction period, the general rule is that share units will lapse. Special arrangements apply where the participant leaves
for a qualifying reason.
Restricted Share Plan (RSP)
An equity-settled restricted share plan used predominantly for senior employees in special circumstances (such as recruitment and retention). There
are no performance conditions but the shares are subject to a three-year restriction period. During the restriction period, shares accrue dividends,
which are reinvested. With regard to leaver provisions, the general rule is that ceasing employment during the restriction period will result in the forfeit
of shares. However, special arrangements apply where the participant leaves for a qualifying reason.
BP Share Option Plan (BPSOP)
An equity-settled share option plan that applies to certain categories of employees. Participants are granted share options with an exercise price no
lower than the market price of a share immediately preceding the date of grant. There are no performance conditions and the options are exercisable
between the third and 10th anniversaries of the grant date. The general rule is that the options will lapse if the participant leaves employment before
the end of the third calendar year from the date of grant (and that vested options are exercisable within 3/12 years from the date of leaving). However,
special arrangements apply where the participant leaves for a qualifying reason and employment ceases after the end of the calendar year of the date
of grant. From 2007, share options no longer form a regular element of our incentive plans.
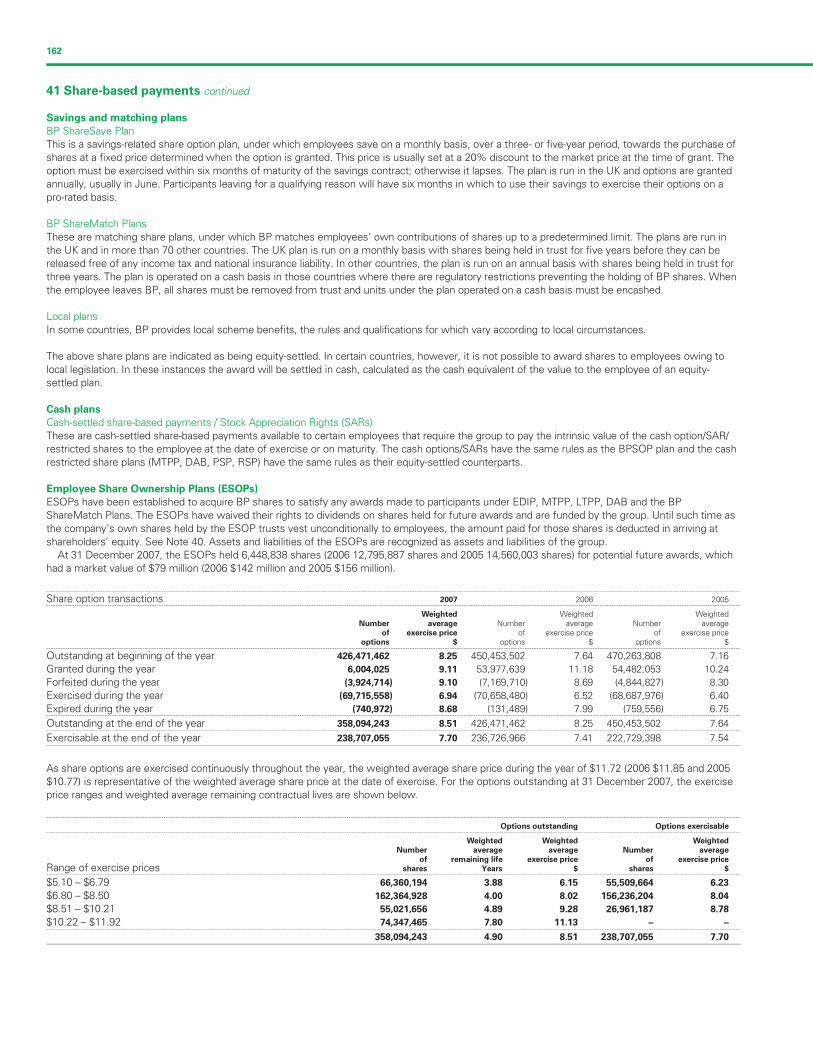
Filename: U54368_doc8.3d Time: 14:50:11 Date: 25/02/08
Checksum: -2020528184
162
41 Share-based payments continued
Savings and matching plans
BP ShareSave Plan
This is a savings-related share option plan, under which employees save on a monthly basis, over a three- or five-year period, towards the purchase of
shares at a fixed price determined when the option is granted. This price is usually set at a 20% discount to the market price at the time of grant. The
option must be exercised within six months of maturity of the savings contract; otherwise it lapses. The plan is run in the UK and options are granted
annually, usually in June. Participants leaving for a qualifying reason will have six months in which to use their savings to exercise their options on a
pro-rated basis.
BP ShareMatch Plans
These are matching share plans, under which BP matches employees’ own contributions of shares up to a predetermined limit. The plans are run in
the UK and in more than 70 other countries. The UK plan is run on a monthly basis with shares being held in trust for five years before they can be
released free of any income tax and national insurance liability. In other countries, the plan is run on an annual basis with shares being held in trust for
three years. The plan is operated on a cash basis in those countries where there are regulatory restrictions preventing the holding of BP shares. When
the employee leaves BP, all shares must be removed from trust and units under the plan operated on a cash basis must be encashed.
Local plans
In some countries, BP provides local scheme benefits, the rules and qualifications for which vary according to local circumstances.
The above share plans are indicated as being equity-settled. In certain countries, however, it is not possible to award shares to employees owing to
local legislation. In these instances the award will be settled in cash, calculated as the cash equivalent of the value to the employee of an equity-
settled plan.
Cash plans
Cash-settled share-based payments / Stock Appreciation Rights (SARs)
These are cash-settled share-based payments available to certain employees that require the group to pay the intrinsic value of the cash option/SAR/
restricted shares to the employee at the date of exercise or on maturity. The cash options/SARs have the same rules as the BPSOP plan and the cash
restricted share plans (MTPP, DAB, PSP, RSP) have the same rules as their equity-settled counterparts.
Employee Share Ownership Plans (ESOPs)
ESOPs have been established to acquire BP shares to satisfy any awards made to participants under EDIP, MTPP, LTPP, DAB and the BP
ShareMatch Plans. The ESOPs have waived their rights to dividends on shares held for future awards and are funded by the group. Until such time as
the company’s own shares held by the ESOP trusts vest unconditionally to employees, the amount paid for those shares is deducted in arriving at
shareholders’ equity. See Note 40. Assets and liabilities of the ESOPs are recognized as assets and liabilities of the group.
At 31 December 2007, the ESOPs held 6,448,838 shares (2006 12,795,887 shares and 2005 14,560,003 shares) for potential future awards, which
had a market value of $79 million (2006 $142 million and 2005 $156 million).
--------------------------------------------------------------------------------------------------------------------------------------------------------------------------------------------------------------------------------------------------------------------------------------------------------
Share option transactions 2007 2006 2005--------------------------------------------------------------------------------------------------------------------------------------------------------------------------------------------------------------------------------------------------------------------------------------------------------
Weighted Weighted WeightedNumber average Number average Number average
of exercise price of exercise price of exercise priceoptions $ options $ options $
--------------------------------------------------------------------------------------------------------------------------------------------------------------------------------------------------------------------------------------------------------------------------------------------------------
Outstanding at beginning of the year 426,471,462 8.25 450,453,502 7.64 470,263,808 7.16
Granted during the year 6,004,025 9.11 53,977,639 11.18 54,482,053 10.24
Forfeited during the year (3,924,714) 9.10 (7,169,710) 8.69 (4,844,827) 8.30
Exercised during the year (69,715,558) 6.94 (70,658,480) 6.52 (68,687,976) 6.40
Expired during the year (740,972) 8.68 (131,489) 7.99 (759,556) 6.75--------------------------------------------------------------------------------------------------------------------------------------------------------------------------------------------------------------------------------------------------------------------------------------------------------
Outstanding at the end of the year 358,094,243 8.51 426,471,462 8.25 450,453,502 7.64--------------------------------------------------------------------------------------------------------------------------------------------------------------------------------------------------------------------------------------------------------------------------------------------------------
Exercisable at the end of the year 238,707,055 7.70 236,726,966 7.41 222,729,398 7.54
As share options are exercised continuously throughout the year, the weighted average share price during the year of $11.72 (2006 $11.85 and 2005
$10.77) is representative of the weighted average share price at the date of exercise. For the options outstanding at 31 December 2007, the exercise
price ranges and weighted average remaining contractual lives are shown below.
--------------------------------------------------------------------------------------------------------------------------------------------------------------------------------------------------------------------------------------------------------------------------------------------------------
Options outstanding Options exercisable--------------------------------------------------------------------------------------------------------------------------------------------------------------------------------------------------------------------------------------------------------------------------------------------------------
Weighted Weighted Weighted
Number average average Number average
of remaining life exercise price of exercise price
Range of exercise prices shares Years $ shares $--------------------------------------------------------------------------------------------------------------------------------------------------------------------------------------------------------------------------------------------------------------------------------------------------------
$5.10 – $6.79 66,360,194 3.88 6.15 55,509,664 6.23
$6.80 – $8.50 162,364,928 4.00 8.02 156,236,204 8.04
$8.51 – $10.21 55,021,656 4.89 9.28 26,961,187 8.78
$10.22 – $11.92 74,347,465 7.80 11.13 – –--------------------------------------------------------------------------------------------------------------------------------------------------------------------------------------------------------------------------------------------------------------------------------------------------------
358,094,243 4.90 8.51 238,707,055 7.70
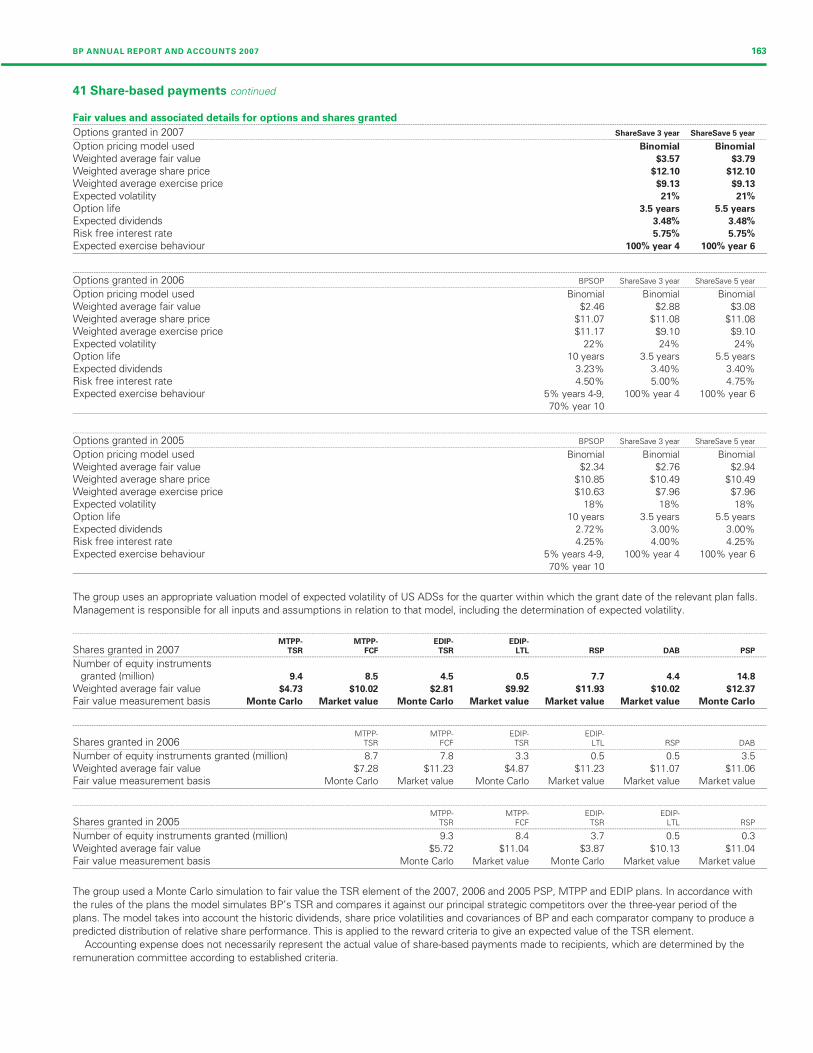
Filename: U54368_doc8.3d Time: 14:50:12 Date: 25/02/08
Checksum: -484227993
BP ANNUAL REPORT AND ACCOUNTS 2007 163
41 Share-based payments continued
Fair values and associated details for options and shares granted--------------------------------------------------------------------------------------------------------------------------------------------------------------------------------------------------------------------------------------------------------------------------------------------------------
Options granted in 2007 ShareSave 3 year ShareSave 5 year--------------------------------------------------------------------------------------------------------------------------------------------------------------------------------------------------------------------------------------------------------------------------------------------------------
Option pricing model used Binomial Binomial
Weighted average fair value $3.57 $3.79
Weighted average share price $12.10 $12.10
Weighted average exercise price $9.13 $9.13
Expected volatility 21% 21%
Option life 3.5 years 5.5 years
Expected dividends 3.48% 3.48%
Risk free interest rate 5.75% 5.75%
Expected exercise behaviour 100% year 4 100% year 6
--------------------------------------------------------------------------------------------------------------------------------------------------------------------------------------------------------------------------------------------------------------------------------------------------------
Options granted in 2006 BPSOP ShareSave 3 year ShareSave 5 year--------------------------------------------------------------------------------------------------------------------------------------------------------------------------------------------------------------------------------------------------------------------------------------------------------
Option pricing model used Binomial Binomial Binomial
Weighted average fair value $2.46 $2.88 $3.08
Weighted average share price $11.07 $11.08 $11.08
Weighted average exercise price $11.17 $9.10 $9.10
Expected volatility 22% 24% 24%
Option life 10 years 3.5 years 5.5 years
Expected dividends 3.23% 3.40% 3.40%
Risk free interest rate 4.50% 5.00% 4.75%
Expected exercise behaviour 5% years 4-9, 100% year 4 100% year 6
70% year 10
--------------------------------------------------------------------------------------------------------------------------------------------------------------------------------------------------------------------------------------------------------------------------------------------------------
Options granted in 2005 BPSOP ShareSave 3 year ShareSave 5 year--------------------------------------------------------------------------------------------------------------------------------------------------------------------------------------------------------------------------------------------------------------------------------------------------------
Option pricing model used Binomial Binomial Binomial
Weighted average fair value $2.34 $2.76 $2.94
Weighted average share price $10.85 $10.49 $10.49
Weighted average exercise price $10.63 $7.96 $7.96
Expected volatility 18% 18% 18%
Option life 10 years 3.5 years 5.5 years
Expected dividends 2.72% 3.00% 3.00%
Risk free interest rate 4.25% 4.00% 4.25%
Expected exercise behaviour 5% years 4-9, 100% year 4 100% year 6
70% year 10
The group uses an appropriate valuation model of expected volatility of US ADSs for the quarter within which the grant date of the relevant plan falls.
Management is responsible for all inputs and assumptions in relation to that model, including the determination of expected volatility.
--------------------------------------------------------------------------------------------------------------------------------------------------------------------------------------------------------------------------------------------------------------------------------------------------------
MTPP- MTPP- EDIP- EDIP-
Shares granted in 2007 TSR FCF TSR LTL RSP DAB PSP--------------------------------------------------------------------------------------------------------------------------------------------------------------------------------------------------------------------------------------------------------------------------------------------------------
Number of equity instrumentsgranted (million) 9.4 8.5 4.5 0.5 7.7 4.4 14.8
Weighted average fair value $4.73 $10.02 $2.81 $9.92 $11.93 $10.02 $12.37
Fair value measurement basis Monte Carlo Market value Monte Carlo Market value Market value Market value Monte Carlo
--------------------------------------------------------------------------------------------------------------------------------------------------------------------------------------------------------------------------------------------------------------------------------------------------------
MTPP- MTPP- EDIP- EDIP-Shares granted in 2006 TSR FCF TSR LTL RSP DAB--------------------------------------------------------------------------------------------------------------------------------------------------------------------------------------------------------------------------------------------------------------------------------------------------------
Number of equity instruments granted (million) 8.7 7.8 3.3 0.5 0.5 3.5
Weighted average fair value $7.28 $11.23 $4.87 $11.23 $11.07 $11.06
Fair value measurement basis Monte Carlo Market value Monte Carlo Market value Market value Market value
--------------------------------------------------------------------------------------------------------------------------------------------------------------------------------------------------------------------------------------------------------------------------------------------------------
MTPP- MTPP- EDIP- EDIP-Shares granted in 2005 TSR FCF TSR LTL RSP--------------------------------------------------------------------------------------------------------------------------------------------------------------------------------------------------------------------------------------------------------------------------------------------------------
Number of equity instruments granted (million) 9.3 8.4 3.7 0.5 0.3
Weighted average fair value $5.72 $11.04 $3.87 $10.13 $11.04
Fair value measurement basis Monte Carlo Market value Monte Carlo Market value Market value
The group used a Monte Carlo simulation to fair value the TSR element of the 2007, 2006 and 2005 PSP, MTPP and EDIP plans. In accordance with
the rules of the plans the model simulates BP’s TSR and compares it against our principal strategic competitors over the three-year period of the
plans. The model takes into account the historic dividends, share price volatilities and covariances of BP and each comparator company to produce a
predicted distribution of relative share performance. This is applied to the reward criteria to give an expected value of the TSR element.
Accounting expense does not necessarily represent the actual value of share-based payments made to recipients, which are determined by the
remuneration committee according to established criteria.
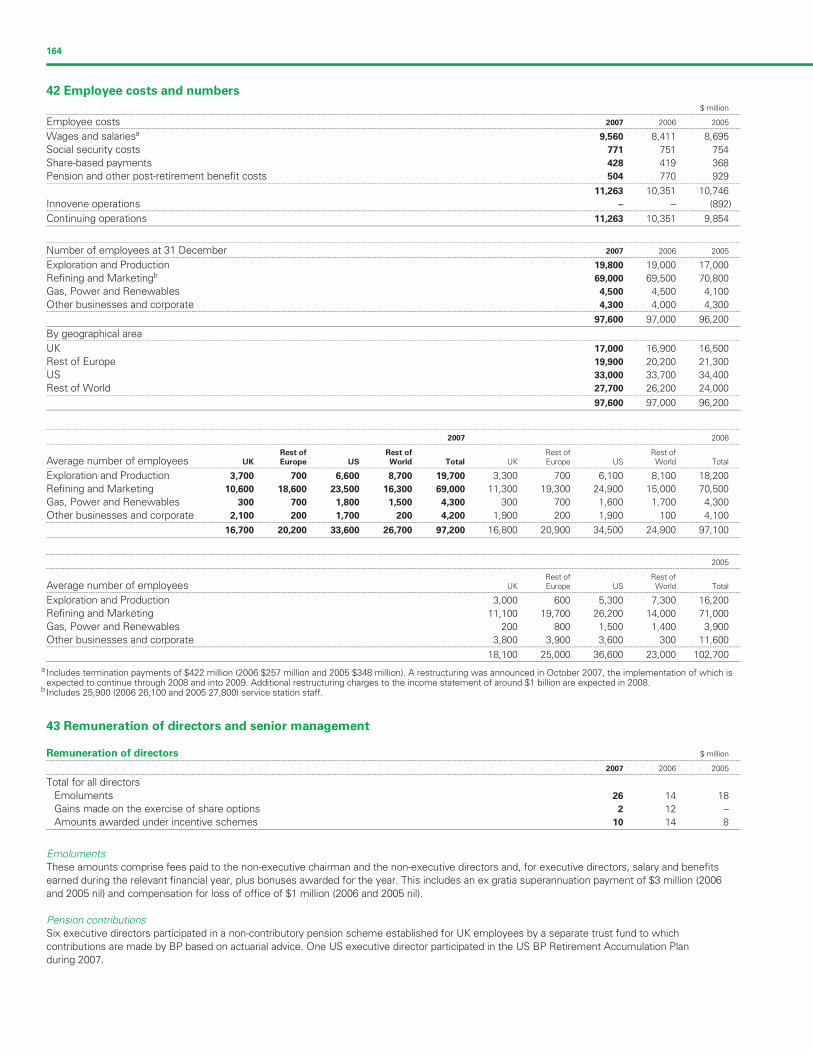
Filename: U54368_doc8.3d Time: 14:50:12 Date: 25/02/08
Checksum: 485807767
164
42 Employee costs and numbers
$ million--------------------------------------------------------------------------------------------------------------------------------------------------------------------------------------------------------------------------------------------------------------------------------------------------------
Employee costs 2007 2006 2005--------------------------------------------------------------------------------------------------------------------------------------------------------------------------------------------------------------------------------------------------------------------------------------------------------
Wages and salariesa 9,560 8,411 8,695
Social security costs 771 751 754
Share-based payments 428 419 368
Pension and other post-retirement benefit costs 504 770 929--------------------------------------------------------------------------------------------------------------------------------------------------------------------------------------------------------------------------------------------------------------------------------------------------------
11,263 10,351 10,746
Innovene operations – – (892)--------------------------------------------------------------------------------------------------------------------------------------------------------------------------------------------------------------------------------------------------------------------------------------------------------
Continuing operations 11,263 10,351 9,854
--------------------------------------------------------------------------------------------------------------------------------------------------------------------------------------------------------------------------------------------------------------------------------------------------------
Number of employees at 31 December 2007 2006 2005--------------------------------------------------------------------------------------------------------------------------------------------------------------------------------------------------------------------------------------------------------------------------------------------------------
Exploration and Production 19,800 19,000 17,000
Refining and Marketingb 69,000 69,500 70,800
Gas, Power and Renewables 4,500 4,500 4,100
Other businesses and corporate 4,300 4,000 4,300--------------------------------------------------------------------------------------------------------------------------------------------------------------------------------------------------------------------------------------------------------------------------------------------------------
97,600 97,000 96,200
By geographical area--------------------------------------------------------------------------------------------------------------------------------------------------------------------------------------------------------------------------------------------------------------------------------------------------------
UK 17,000 16,900 16,500
Rest of Europe 19,900 20,200 21,300
US 33,000 33,700 34,400
Rest of World 27,700 26,200 24,000--------------------------------------------------------------------------------------------------------------------------------------------------------------------------------------------------------------------------------------------------------------------------------------------------------
97,600 97,000 96,200
--------------------------------------------------------------------------------------------------------------------------------------------------------------------------------------------------------------------------------------------------------------------------------------------------------
2007 2006--------------------------------------------------------------------------------------------------------------------------------------------------------------------------------------------------------------------------------------------------------------------------------------------------------
Rest of Rest of Rest of Rest ofAverage number of employees UK Europe US World Total UK Europe US World Total--------------------------------------------------------------------------------------------------------------------------------------------------------------------------------------------------------------------------------------------------------------------------------------------------------
Exploration and Production 3,700 700 6,600 8,700 19,700 3,300 700 6,100 8,100 18,200
Refining and Marketing 10,600 18,600 23,500 16,300 69,000 11,300 19,300 24,900 15,000 70,500
Gas, Power and Renewables 300 700 1,800 1,500 4,300 300 700 1,600 1,700 4,300
Other businesses and corporate 2,100 200 1,700 200 4,200 1,900 200 1,900 100 4,100--------------------------------------------------------------------------------------------------------------------------------------------------------------------------------------------------------------------------------------------------------------------------------------------------------
16,700 20,200 33,600 26,700 97,200 16,800 20,900 34,500 24,900 97,100
--------------------------------------------------------------------------------------------------------------------------------------------------------------------------------------------------------------------------------------------------------------------------------------------------------
2005--------------------------------------------------------------------------------------------------------------------------------------------------------------------------------------------------------------------------------------------------------------------------------------------------------
Rest of Rest ofAverage number of employees UK Europe US World Total--------------------------------------------------------------------------------------------------------------------------------------------------------------------------------------------------------------------------------------------------------------------------------------------------------
Exploration and Production 3,000 600 5,300 7,300 16,200
Refining and Marketing 11,100 19,700 26,200 14,000 71,000
Gas, Power and Renewables 200 800 1,500 1,400 3,900
Other businesses and corporate 3,800 3,900 3,600 300 11,600--------------------------------------------------------------------------------------------------------------------------------------------------------------------------------------------------------------------------------------------------------------------------------------------------------
18,100 25,000 36,600 23,000 102,700
a Includes termination payments of $422 million (2006 $257 million and 2005 $348 million). A restructuring was announced in October 2007, the implementation of which isexpected to continue through 2008 and into 2009. Additional restructuring charges to the income statement of around $1 billion are expected in 2008.
b Includes 25,900 (2006 26,100 and 2005 27,800) service station staff.
43 Remuneration of directors and senior management
Remuneration of directors $ million--------------------------------------------------------------------------------------------------------------------------------------------------------------------------------------------------------------------------------------------------------------------------------------------------------
2007 2006 2005--------------------------------------------------------------------------------------------------------------------------------------------------------------------------------------------------------------------------------------------------------------------------------------------------------
Total for all directors
Emoluments 26 14 18
Gains made on the exercise of share options 2 12 –
Amounts awarded under incentive schemes 10 14 8
Emoluments
These amounts comprise fees paid to the non-executive chairman and the non-executive directors and, for executive directors, salary and benefits
earned during the relevant financial year, plus bonuses awarded for the year. This includes an ex gratia superannuation payment of $3 million (2006
and 2005 nil) and compensation for loss of office of $1 million (2006 and 2005 nil).
Pension contributions
Six executive directors participated in a non-contributory pension scheme established for UK employees by a separate trust fund to which
contributions are made by BP based on actuarial advice. One US executive director participated in the US BP Retirement Accumulation Plan
during 2007.
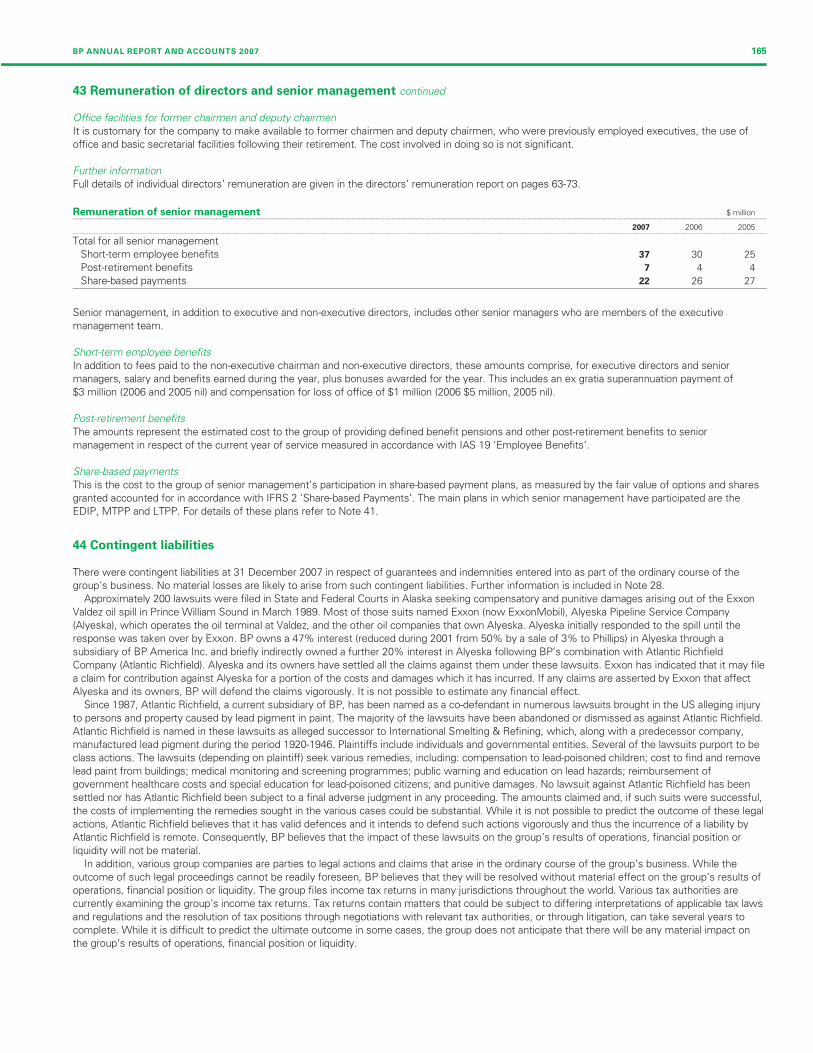
Filename: U54368_doc8.3d Time: 14:50:12 Date: 25/02/08
Checksum: -1336260327
BP ANNUAL REPORT AND ACCOUNTS 2007 165
43 Remuneration of directors and senior management continued
Office facilities for former chairmen and deputy chairmen
It is customary for the company to make available to former chairmen and deputy chairmen, who were previously employed executives, the use of
office and basic secretarial facilities following their retirement. The cost involved in doing so is not significant.
Further information
Full details of individual directors’ remuneration are given in the directors’ remuneration report on pages 63-73.
Remuneration of senior management $ million--------------------------------------------------------------------------------------------------------------------------------------------------------------------------------------------------------------------------------------------------------------------------------------------------------
2007 2006 2005--------------------------------------------------------------------------------------------------------------------------------------------------------------------------------------------------------------------------------------------------------------------------------------------------------
Total for all senior management
Short-term employee benefits 37 30 25
Post-retirement benefits 7 4
Share-based payments 22 26 27
Senior management, in addition to executive and non-executive directors, includes other senior managers who are members of the executive
management team.
Short-term employee benefits
In addition to fees paid to the non-executive chairman and non-executive directors, these amounts comprise, for executive directors and senior
managers, salary and benefits earned during the year, plus bonuses awarded for the year. This includes an ex gratia superannuation payment of
$3 million (2006 and 2005 nil) and compensation for loss of office of $1 million (2006 $5 million, 2005 nil).
Post-retirement benefits
The amounts represent the estimated cost to the group of providing defined benefit pensions and other post-retirement benefits to senior
management in respect of the current year of service measured in accordance with IAS 19 ‘Employee Benefits’.
Share-based payments
This is the cost to the group of senior management’s participation in share-based payment plans, as measured by the fair value of options and shares
granted accounted for in accordance with IFRS 2 ‘Share-based Payments’. The main plans in which senior management have participated are the
EDIP, MTPP and LTPP. For details of these plans refer to Note 41.
44 Contingent liabilities
There were contingent liabilities at 31 December 2007 in respect of guarantees and indemnities entered into as part of the ordinary course of the
group’s business. No material losses are likely to arise from such contingent liabilities. Further information is included in Note 28.
Approximately 200 lawsuits were filed in State and Federal Courts in Alaska seeking compensatory and punitive damages arising out of the Exxon
Valdez oil spill in Prince William Sound in March 1989. Most of those suits named Exxon (now ExxonMobil), Alyeska Pipeline Service Company
(Alyeska), which operates the oil terminal at Valdez, and the other oil companies that own Alyeska. Alyeska initially responded to the spill until the
response was taken over by Exxon. BP owns a 47% interest (reduced during 2001 from 50% by a sale of 3% to Phillips) in Alyeska through a
subsidiary of BP America Inc. and briefly indirectly owned a further 20% interest in Alyeska following BP’s combination with Atlantic Richfield
Company (Atlantic Richfield). Alyeska and its owners have settled all the claims against them under these lawsuits. Exxon has indicated that it may file
a claim for contribution against Alyeska for a portion of the costs and damages which it has incurred. If any claims are asserted by Exxon that affect
Alyeska and its owners, BP will defend the claims vigorously. It is not possible to estimate any financial effect.
Since 1987, Atlantic Richfield, a current subsidiary of BP, has been named as a co-defendant in numerous lawsuits brought in the US alleging injury
to persons and property caused by lead pigment in paint. The majority of the lawsuits have been abandoned or dismissed as against Atlantic Richfield.
Atlantic Richfield is named in these lawsuits as alleged successor to International Smelting & Refining, which, along with a predecessor company,
manufactured lead pigment during the period 1920-1946. Plaintiffs include individuals and governmental entities. Several of the lawsuits purport to be
class actions. The lawsuits (depending on plaintiff) seek various remedies, including: compensation to lead-poisoned children; cost to find and remove
lead paint from buildings; medical monitoring and screening programmes; public warning and education on lead hazards; reimbursement of
government healthcare costs and special education for lead-poisoned citizens; and punitive damages. No lawsuit against Atlantic Richfield has been
settled nor has Atlantic Richfield been subject to a final adverse judgment in any proceeding. The amounts claimed and, if such suits were successful,
the costs of implementing the remedies sought in the various cases could be substantial. While it is not possible to predict the outcome of these legal
actions, Atlantic Richfield believes that it has valid defences and it intends to defend such actions vigorously and thus the incurrence of a liability by
Atlantic Richfield is remote. Consequently, BP believes that the impact of these lawsuits on the group’s results of operations, financial position or
liquidity will not be material.
In addition, various group companies are parties to legal actions and claims that arise in the ordinary course of the group’s business. While the
outcome of such legal proceedings cannot be readily foreseen, BP believes that they will be resolved without material effect on the group’s results of
operations, financial position or liquidity. The group files income tax returns in many jurisdictions throughout the world. Various tax authorities are
currently examining the group’s income tax returns. Tax returns contain matters that could be subject to differing interpretations of applicable tax laws
and regulations and the resolution of tax positions through negotiations with relevant tax authorities, or through litigation, can take several years to
complete. While it is difficult to predict the ultimate outcome in some cases, the group does not anticipate that there will be any material impact on
the group’s results of operations, financial position or liquidity.
4

Filename: U54368_doc8.3d Time: 14:50:12 Date: 25/02/08
Checksum: -700964034
166
44 Contingent liabilities continued
The group is subject to numerous national and local environmental laws and regulations concerning its products, operations and other activities.
These laws and regulations may require the group to take future action to remediate the effects on the environment of prior disposal or release of
chemicals or petroleum substances by the group or other parties. Such contingencies may exist for various sites including refineries, chemical plants,
oil fields, service stations, terminals and waste disposal sites. In addition, the group may have obligations relating to prior asset sales or closed
facilities. The ultimate requirement for remediation and its cost are inherently difficult to estimate. However, the estimated cost of known
environmental obligations has been provided in these accounts in accordance with the group’s accounting policies. While the amounts of future costs
could be significant and could be material to the group’s results of operations in the period in which they are recognized, it is not practical to estimate
the amounts involved. BP does not expect these costs to have a material effect on the group’s financial position or liquidity.
The group generally restricts its purchase of insurance to situations where this is required for legal or contractual reasons. This is because external
insurance is not considered an economic means of financing losses for the group. Losses will therefore be borne as they arise rather than being
spread over time through insurance premiums with attendant transaction costs. The position is reviewed periodically.
45 Capital commitments
Authorized future capital expenditure for property, plant and equipment by group companies for which contracts had been placed at 31 December
2007 amounted to $8,263 million (2006 $9,773 million). In addition, at 31 December 2007, the group had contracts in place for future capital
expenditure relating to investments in jointly controlled entities of $1,039 million (2006 $32 million) and investments in associates of $74 million
(2006 $36 million).
Capital commitments of jointly controlled entities amounted to $2,273 million (2006 $1,217 million).
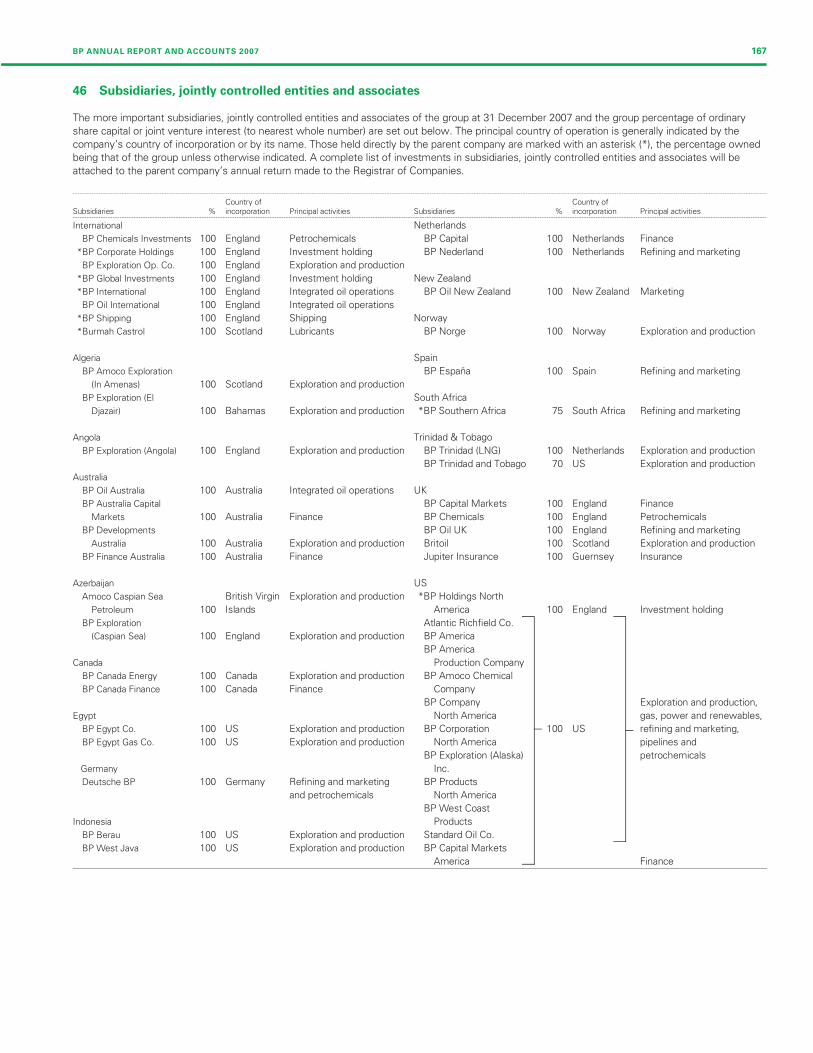
Filename: U54368_doc8.3d Time: 14:50:13 Date: 25/02/08
Checksum: -848188351
BP ANNUAL REPORT AND ACCOUNTS 2007 167
46 Subsidiaries, jointly controlled entities and associates
The more important subsidiaries, jointly controlled entities and associates of the group at 31 December 2007 and the group percentage of ordinary
share capital or joint venture interest (to nearest whole number) are set out below. The principal country of operation is generally indicated by the
company’s country of incorporation or by its name. Those held directly by the parent company are marked with an asterisk (*), the percentage owned
being that of the group unless otherwise indicated. A complete list of investments in subsidiaries, jointly controlled entities and associates will be
attached to the parent company’s annual return made to the Registrar of Companies.
--------------------------------------------------------------------------------------------------------------------------------------------------------------------------------------------------------------------------------------------------------------------------------------------------------
Country of Country ofSubsidiaries % incorporation Principal activities Subsidiaries % incorporation Principal activities--------------------------------------------------------------------------------------------------------------------------------------------------------------------------------------------------------------------------------------------------------------------------------------------------------
International Netherlands
BP Chemicals Investments 100 England Petrochemicals BP Capital 100 Netherlands Finance
*BP Corporate Holdings 100 England Investment holding BP Nederland 100 Netherlands Refining and marketing
BP Exploration Op. Co. 100 England Exploration and production
*BP Global Investments 100 England Investment holding New Zealand
*BP International 100 England Integrated oil operations BP Oil New Zealand 100 New Zealand Marketing
BP Oil International 100 England Integrated oil operations
*BP Shipping 100 England Shipping Norway
*Burmah Castrol 100 Scotland Lubricants BP Norge 100 Norway Exploration and production
Algeria Spain
BP Amoco Exploration BP Espana 100 Spain Refining and marketing
(In Amenas) 100 Scotland Exploration and production
BP Exploration (El South Africa
Djazair) 100 Bahamas Exploration and production *BP Southern Africa 75 South Africa Refining and marketing
Angola Trinidad & Tobago
BP Exploration (Angola) 100 England Exploration and production BP Trinidad (LNG) 100 Netherlands Exploration and production
BP Trinidad and Tobago 70 US Exploration and production
Australia
BP Oil Australia 100 Australia Integrated oil operations UK
BP Australia Capital BP Capital Markets 100 England Finance
Markets 100 Australia Finance BP Chemicals 100 England Petrochemicals
BP Developments BP Oil UK 100 England Refining and marketing
Australia 100 Australia Exploration and production Britoil 100 Scotland Exploration and production
BP Finance Australia 100 Australia Finance Jupiter Insurance 100 Guernsey Insurance
Azerbaijan US
Amoco Caspian Sea British Virgin Exploration and production *BP Holdings North
Petroleum 100 Islands America 100 England Investment holding
BP Exploration Atlantic Richfield Co.
(Caspian Sea) 100 England Exploration and production BP America
BP America
Canada Production Company
BP Canada Energy 100 Canada Exploration and production BP Amoco Chemical
BP Canada Finance 100 Canada Finance Company
BP Company Exploration and production,
Egypt North America gas, power and renewables,
BP Egypt Co. 100 US Exploration and production BP Corporation 100 US refining and marketing,
BP Egypt Gas Co. 100 US Exploration and production North America pipelines and
BP Exploration (Alaska) petrochemicals
Germany Inc.
Deutsche BP 100 Germany Refining and marketing BP Products
and petrochemicals North America
BP West Coast
Indonesia Products
BP Berau 100 US Exploration and production Standard Oil Co.
BP West Java 100 US Exploration and production BP Capital Markets
America Finance
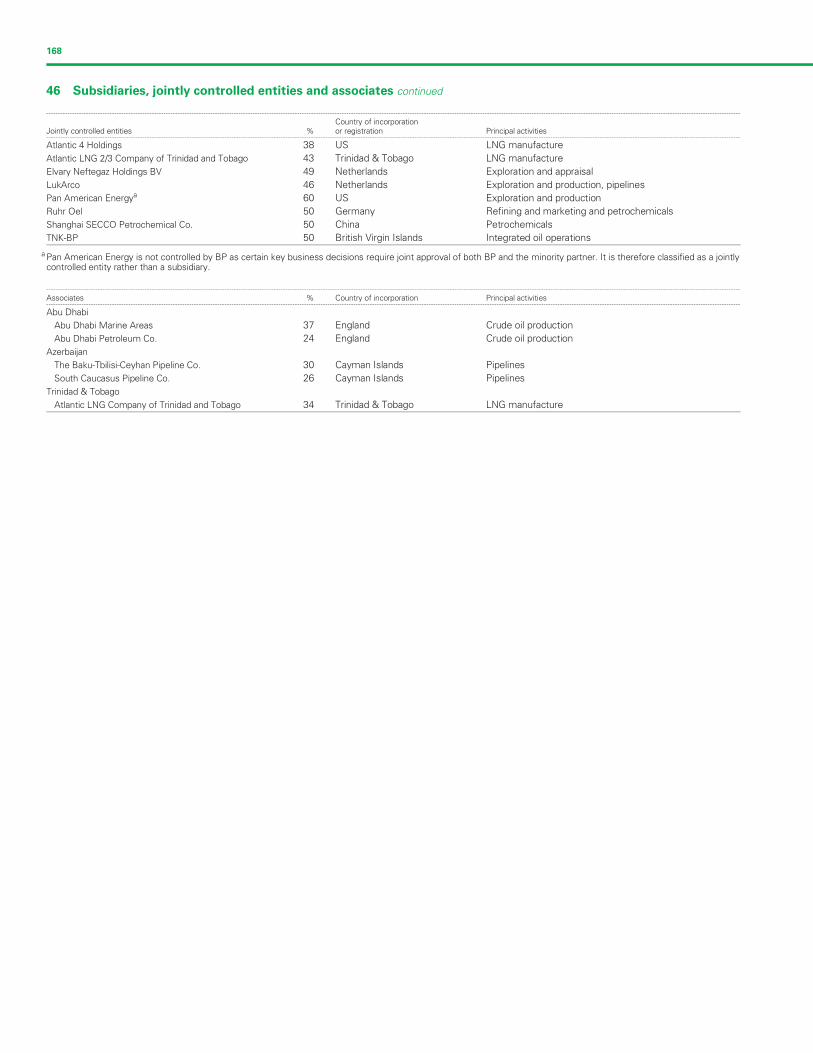
Filename: U54368_doc8.3d Time: 14:50:13 Date: 25/02/08
Checksum: 669544381
168
46 Subsidiaries, jointly controlled entities and associates continued
--------------------------------------------------------------------------------------------------------------------------------------------------------------------------------------------------------------------------------------------------------------------------------------------------------
Country of incorporationJointly controlled entities % or registration Principal activities--------------------------------------------------------------------------------------------------------------------------------------------------------------------------------------------------------------------------------------------------------------------------------------------------------
Atlantic 4 Holdings 38 US LNG manufacture
Atlantic LNG 2/3 Company of Trinidad and Tobago 43 Trinidad & Tobago LNG manufacture
Elvary Neftegaz Holdings BV 49 Netherlands Exploration and appraisal
LukArco 46 Netherlands Exploration and production, pipelinesaPan American Energy 60 US Exploration and production
Ruhr Oel 50 Germany Refining and marketing and petrochemicals
Shanghai SECCO Petrochemical Co. 50 China Petrochemicals
TNK-BP 50 British Virgin Islands Integrated oil operations
a Pan American Energy is not controlled by BP as certain key business decisions require joint approval of both BP and the minority partner. It is therefore classified as a jointlycontrolled entity rather than a subsidiary.
--------------------------------------------------------------------------------------------------------------------------------------------------------------------------------------------------------------------------------------------------------------------------------------------------------
Associates % Country of incorporation Principal activities--------------------------------------------------------------------------------------------------------------------------------------------------------------------------------------------------------------------------------------------------------------------------------------------------------
Abu Dhabi
Abu Dhabi Marine Areas 37 England Crude oil production
Abu Dhabi Petroleum Co. 24 England Crude oil production
Azerbaijan
The Baku-Tbilisi-Ceyhan Pipeline Co. 30 Cayman Islands Pipelines
South Caucasus Pipeline Co. 26 Cayman Islands Pipelines
Trinidad & Tobago
Atlantic LNG Company of Trinidad and Tobago 34 Trinidad & Tobago LNG manufacture
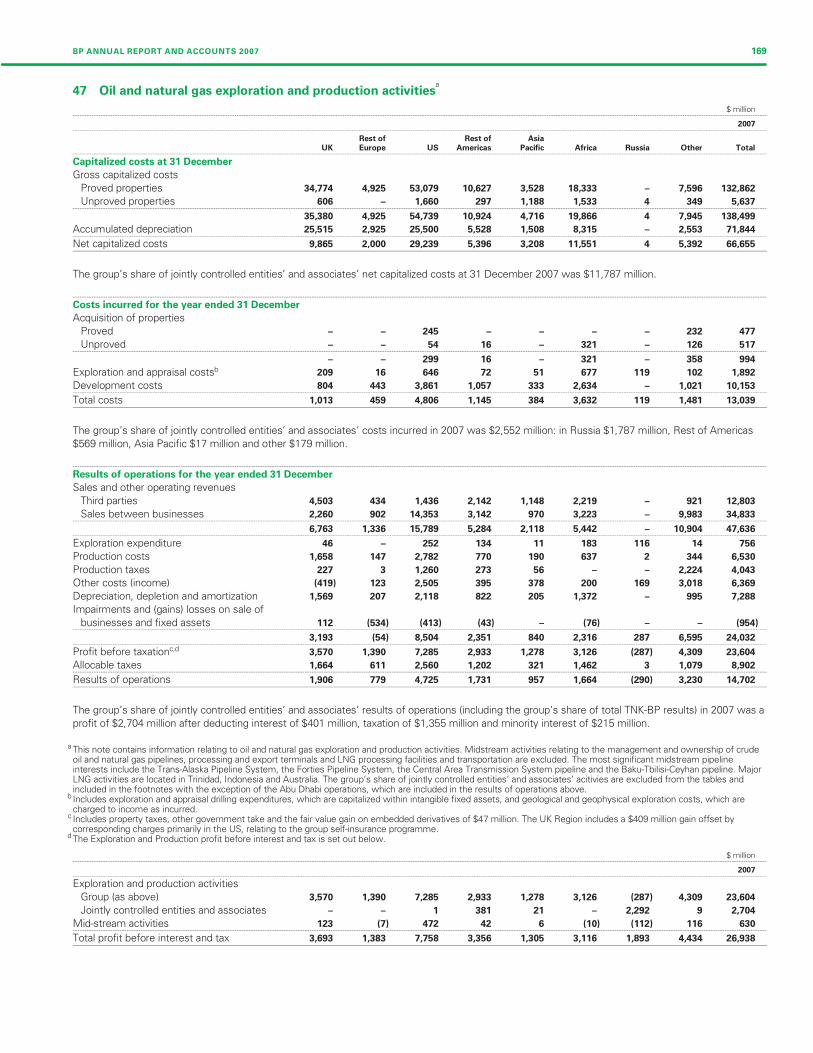
Filename: U54368_doc8.3d Time: 14:50:13 Date: 25/02/08
Checksum: 1295087533
BP ANNUAL REPORT AND ACCOUNTS 2007 169
a47 Oil and natural gas exploration and production activities
$ million--------------------------------------------------------------------------------------------------------------------------------------------------------------------------------------------------------------------------------------------------------------------------------------------------------
2007--------------------------------------------------------------------------------------------------------------------------------------------------------------------------------------------------------------------------------------------------------------------------------------------------------
Rest of Rest of Asia
UK Europe US Americas Pacific Africa Russia Other Total--------------------------------------------------------------------------------------------------------------------------------------------------------------------------------------------------------------------------------------------------------------------------------------------------------
Capitalized costs at 31 December
Gross capitalized costs
Proved properties 34,774 4,925 53,079 10,627 3,528 18,333 – 7,596 132,862
Unproved properties 606 – 1,660 297 1,188 1,533 4 349 5,637--------------------------------------------------------------------------------------------------------------------------------------------------------------------------------------------------------------------------------------------------------------------------------------------------------
35,380 4,925 54,739 10,924 4,716 19,866 4 7,945 138,499
Accumulated depreciation 25,515 2,925 25,500 5,528 1,508 8,315 – 2,553 71,844--------------------------------------------------------------------------------------------------------------------------------------------------------------------------------------------------------------------------------------------------------------------------------------------------------
Net capitalized costs 9,865 2,000 29,239 5,396 3,208 11,551 4 5,392 66,655
The group’s share of jointly controlled entities’ and associates’ net capitalized costs at 31 December 2007 was $11,787 million.
--------------------------------------------------------------------------------------------------------------------------------------------------------------------------------------------------------------------------------------------------------------------------------------------------------
Costs incurred for the year ended 31 December
Acquisition of properties
Proved – – 245 – – – – 232
Unproved – – 54 16 – 321 – 126 517--------------------------------------------------------------------------------------------------------------------------------------------------------------------------------------------------------------------------------------------------------------------------------------------------------
– – 299 16 – 321 – 358 994
Exploration and appraisal costsb 209 16 646 72 51 677 119 102 1,892
Development costs 804 443 3,861 1,057 333 2,634 – 1,021 10,153--------------------------------------------------------------------------------------------------------------------------------------------------------------------------------------------------------------------------------------------------------------------------------------------------------
Total costs 1,013 459 4,806 1,145 384 3,632 119 1,481 13,039
The group’s share of jointly controlled entities’ and associates’ costs incurred in 2007 was $2,552 million: in Russia $1,787 million, Rest of Americas
$569 million, Asia Pacific $17 million and other $179 million.
--------------------------------------------------------------------------------------------------------------------------------------------------------------------------------------------------------------------------------------------------------------------------------------------------------
Results of operations for the year ended 31 December
Sales and other operating revenues
Third parties 4,503 434 1,436 2,142 1,148 2,219 – 921 12,803
Sales between businesses 2,260 902 14,353 3,142 970 3,223 – 9,983 34,833--------------------------------------------------------------------------------------------------------------------------------------------------------------------------------------------------------------------------------------------------------------------------------------------------------
6,763 1,336 15,789 5,284 2,118 5,442 – 10,904 47,636--------------------------------------------------------------------------------------------------------------------------------------------------------------------------------------------------------------------------------------------------------------------------------------------------------
Exploration expenditure 46 – 252 134 11 183 116 14 756
Production costs 1,658 147 2,782 770 190 637 2 344 6,530
Production taxes 227 3 1,260 273 56 – – 2,224 4,043
Other costs (income) (419) 123 2,505 395 378 200 169 3,018 6,369
Depreciation, depletion and amortization 1,569 207 2,118 822 205 1,372 – 995 7,288
Impairments and (gains) losses on sale of
businesses and fixed assets 112 (534) (413) (43) – (76) – – (954)--------------------------------------------------------------------------------------------------------------------------------------------------------------------------------------------------------------------------------------------------------------------------------------------------------
3,193 (54) 8,504 2,351 840 2,316 287 6,595 24,032--------------------------------------------------------------------------------------------------------------------------------------------------------------------------------------------------------------------------------------------------------------------------------------------------------
Profit before taxationc,d 3,570 1,390 7,285 2,933 1,278 3,126 (287) 4,309 23,604
Allocable taxes 1,664 611 2,560 1,202 321 1,462 3 1,079 8,902--------------------------------------------------------------------------------------------------------------------------------------------------------------------------------------------------------------------------------------------------------------------------------------------------------
Results of operations 1,906 779 4,725 1,731 957 1,664 (290) 3,230 14,702
The group’s share of jointly controlled entities’ and associates’ results of operations (including the group’s share of total TNK-BP results) in 2007 was a
profit of $2,704 million after deducting interest of $401 million, taxation of $1,355 million and minority interest of $215 million.
a This note contains information relating to oil and natural gas exploration and production activities. Midstream activities relating to the management and ownership of crudeoil and natural gas pipelines, processing and export terminals and LNG processing facilities and transportation are excluded. The most significant midstream pipelineinterests include the Trans-Alaska Pipeline System, the Forties Pipeline System, the Central Area Transmission System pipeline and the Baku-Tbilisi-Ceyhan pipeline. MajorLNG activities are located in Trinidad, Indonesia and Australia. The group’s share of jointly controlled entities’ and associates’ acitivies are excluded from the tables andincluded in the footnotes with the exception of the Abu Dhabi operations, which are included in the results of operations above.
b Includes exploration and appraisal drilling expenditures, which are capitalized within intangible fixed assets, and geological and geophysical exploration costs, which arecharged to income as incurred.
c Includes property taxes, other government take and the fair value gain on embedded derivatives of $47 million. The UK Region includes a $409 million gain offset bycorresponding charges primarily in the US, relating to the group self-insurance programme.
d The Exploration and Production profit before interest and tax is set out below.
$ million--------------------------------------------------------------------------------------------------------------------------------------------------------------------------------------------------------------------------------------------------------------------------------------------------------
2007--------------------------------------------------------------------------------------------------------------------------------------------------------------------------------------------------------------------------------------------------------------------------------------------------------
Exploration and production activities
Group (as above) 3,570 1,390 7,285 2,933 1,278 3,126 (287) 4,309 23,604
Jointly controlled entities and associates – – 1 381 21 – 2,292 9 2,704
Mid-stream activities 123 (7) 472 42 6 (10) (112) 116 630--------------------------------------------------------------------------------------------------------------------------------------------------------------------------------------------------------------------------------------------------------------------------------------------------------
Total profit before interest and tax 3,693 1,383 7,758 3,356 1,305 3,116 1,893 4,434 26,938
477
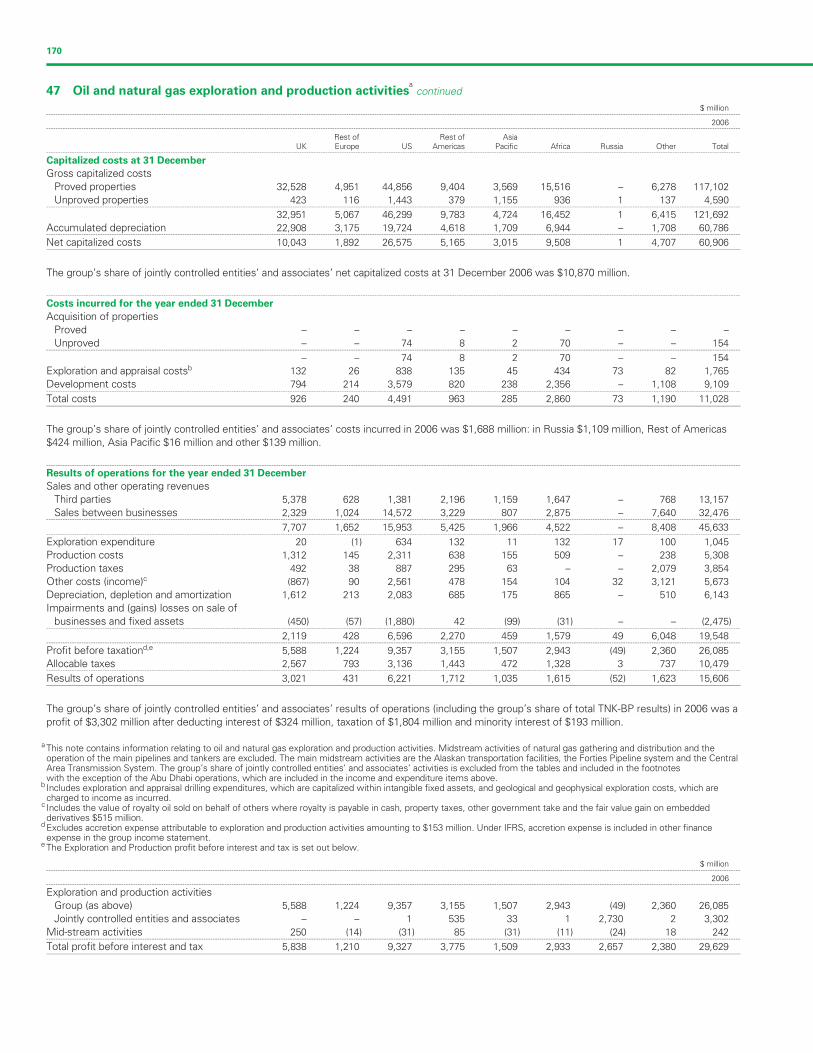
Filename: U54368_doc8.3d Time: 14:50:14 Date: 25/02/08
Checksum: -1430238631
170
a47 Oil and natural gas exploration and production activities continued
$ million--------------------------------------------------------------------------------------------------------------------------------------------------------------------------------------------------------------------------------------------------------------------------------------------------------
2006--------------------------------------------------------------------------------------------------------------------------------------------------------------------------------------------------------------------------------------------------------------------------------------------------------
Rest of Rest of AsiaUK Europe US Americas Pacific Africa Russia Other Total
--------------------------------------------------------------------------------------------------------------------------------------------------------------------------------------------------------------------------------------------------------------------------------------------------------
Capitalized costs at 31 December
Gross capitalized costs
Proved properties 32,528 4,951 44,856 9,404 3,569 15,516 – 6,278 117,102
Unproved properties 423 116 1,443 379 1,155 936 1 137 4,590--------------------------------------------------------------------------------------------------------------------------------------------------------------------------------------------------------------------------------------------------------------------------------------------------------
32,951 5,067 46,299 9,783 4,724 16,452 1 6,415 121,692
Accumulated depreciation 22,908 3,175 19,724 4,618 1,709 6,944 – 1,708 60,786--------------------------------------------------------------------------------------------------------------------------------------------------------------------------------------------------------------------------------------------------------------------------------------------------------
Net capitalized costs 10,043 1,892 26,575 5,165 3,015 9,508 1 4,707 60,906
The group’s share of jointly controlled entities’ and associates’ net capitalized costs at 31 December 2006 was $10,870 million.
--------------------------------------------------------------------------------------------------------------------------------------------------------------------------------------------------------------------------------------------------------------------------------------------------------
Costs incurred for the year ended 31 December
Acquisition of properties
Proved – – – – – – – –
Unproved – – 74 8 2 70 – – 154--------------------------------------------------------------------------------------------------------------------------------------------------------------------------------------------------------------------------------------------------------------------------------------------------------
– – 74 8 2 70 – – 154
Exploration and appraisal costsb 132 26 838 135 45 434 73 82 1,765
Development costs 794 214 3,579 820 238 2,356 – 1,108 9,109--------------------------------------------------------------------------------------------------------------------------------------------------------------------------------------------------------------------------------------------------------------------------------------------------------
Total costs 926 240 4,491 963 285 2,860 73 1,190 11,028
The group’s share of jointly controlled entities’ and associates’ costs incurred in 2006 was $1,688 million: in Russia $1,109 million, Rest of Americas
$424 million, Asia Pacific $16 million and other $139 million.
--------------------------------------------------------------------------------------------------------------------------------------------------------------------------------------------------------------------------------------------------------------------------------------------------------
Results of operations for the year ended 31 December
Sales and other operating revenues
Third parties 5,378 628 1,381 2,196 1,159 1,647 – 768 13,157
Sales between businesses 2,329 1,024 14,572 3,229 807 2,875 – 7,640 32,476--------------------------------------------------------------------------------------------------------------------------------------------------------------------------------------------------------------------------------------------------------------------------------------------------------
7,707 1,652 15,953 5,425 1,966 4,522 – 8,408 45,633--------------------------------------------------------------------------------------------------------------------------------------------------------------------------------------------------------------------------------------------------------------------------------------------------------
Exploration expenditure 20 (1) 634 132 11 132 17 100 1,045
Production costs 1,312 145 2,311 638 155 509 – 238 5,308
Production taxes 492 38 887 295 63 – – 2,079 3,854
Other costs (income)c (867) 90 2,561 478 154 104 32 3,121 5,673
Depreciation, depletion and amortization 1,612 213 2,083 685 175 865 – 510 6,143
Impairments and (gains) losses on sale of
businesses and fixed assets (450) (57) (1,880) 42 (99) (31) – – (2,475)--------------------------------------------------------------------------------------------------------------------------------------------------------------------------------------------------------------------------------------------------------------------------------------------------------
2,119 428 6,596 2,270 459 1,579 49 6,048 19,548--------------------------------------------------------------------------------------------------------------------------------------------------------------------------------------------------------------------------------------------------------------------------------------------------------
Profit before taxationd,e 5,588 1,224 9,357 3,155 1,507 2,943 (49) 2,360 26,085
Allocable taxes 2,567 793 3,136 1,443 472 1,328 3 737 10,479--------------------------------------------------------------------------------------------------------------------------------------------------------------------------------------------------------------------------------------------------------------------------------------------------------
Results of operations 3,021 431 6,221 1,712 1,035 1,615 (52) 1,623 15,606
The group’s share of jointly controlled entities’ and associates’ results of operations (including the group’s share of total TNK-BP results) in 2006 was a
profit of $3,302 million after deducting interest of $324 million, taxation of $1,804 million and minority interest of $193 million.
a This note contains information relating to oil and natural gas exploration and production activities. Midstream activities of natural gas gathering and distribution and theoperation of the main pipelines and tankers are excluded. The main midstream activities are the Alaskan transportation facilities, the Forties Pipeline system and the CentralArea Transmission System. The group’s share of jointly controlled entities’ and associates’ activities is excluded from the tables and included in the footnoteswith the exception of the Abu Dhabi operations, which are included in the income and expenditure items above.
b Includes exploration and appraisal drilling expenditures, which are capitalized within intangible fixed assets, and geological and geophysical exploration costs, which arecharged to income as incurred.
c Includes the value of royalty oil sold on behalf of others where royalty is payable in cash, property taxes, other government take and the fair value gain on embeddedderivatives $515 million.
d Excludes accretion expense attributable to exploration and production activities amounting to $153 million. Under IFRS, accretion expense is included in other financeexpense in the group income statement.
e The Exploration and Production profit before interest and tax is set out below.
$ million--------------------------------------------------------------------------------------------------------------------------------------------------------------------------------------------------------------------------------------------------------------------------------------------------------
2006--------------------------------------------------------------------------------------------------------------------------------------------------------------------------------------------------------------------------------------------------------------------------------------------------------
Exploration and production activities
Group (as above) 5,588 1,224 9,357 3,155 1,507 2,943 (49) 2,360 26,085
Jointly controlled entities and associates – – 1 535 33 1 2,730 2 3,302
Mid-stream activities 250 (14) (31) 85 (31) (11) (24) 18 242--------------------------------------------------------------------------------------------------------------------------------------------------------------------------------------------------------------------------------------------------------------------------------------------------------
Total profit before interest and tax 5,838 1,210 9,327 3,775 1,509 2,933 2,657 2,380 29,629
–

Filename: U54368_doc8.3d Time: 14:50:14 Date: 25/02/08
Checksum: -1778078701
BP ANNUAL REPORT AND ACCOUNTS 2007 171
a47 Oil and natural gas exploration and production activities continued
$ million--------------------------------------------------------------------------------------------------------------------------------------------------------------------------------------------------------------------------------------------------------------------------------------------------------
2005--------------------------------------------------------------------------------------------------------------------------------------------------------------------------------------------------------------------------------------------------------------------------------------------------------
Rest of Rest of AsiaUK Europe US Americas Pacific Africa Russia Other Total
--------------------------------------------------------------------------------------------------------------------------------------------------------------------------------------------------------------------------------------------------------------------------------------------------------
Capitalized costs at 31 December
Gross capitalized costs
Proved properties 31,552 4,608 46,288 9,585 2,922 12,183 – 5,184 112,322
Unproved properties 276 135 1,547 583 1,124 656 185 155 4,661--------------------------------------------------------------------------------------------------------------------------------------------------------------------------------------------------------------------------------------------------------------------------------------------------------
31,828 4,743 47,835 10,168 4,046 12,839 185 5,339 116,983
Accumulated depreciation 22,302 2,949 22,016 4,919 1,508 6,112 – 1,200 61,006--------------------------------------------------------------------------------------------------------------------------------------------------------------------------------------------------------------------------------------------------------------------------------------------------------
Net capitalized costs 9,526 1,794 25,819 5,249 2,538 6,727 185 4,139 55,977
The group’s share of jointly controlled entities’ and associates’ net capitalized costs at 31 December 2005 was $10,670 million.
--------------------------------------------------------------------------------------------------------------------------------------------------------------------------------------------------------------------------------------------------------------------------------------------------------
Costs incurred for the year ended 31 December
Acquisition of properties
Proved – – – – – – – –
Unproved – – 29 34 – – – –--------------------------------------------------------------------------------------------------------------------------------------------------------------------------------------------------------------------------------------------------------------------------------------------------------
– – 29 34 – – – –
Exploration and appraisal costsb 51 7 606 133 11 264 126 68 1,266
Development costs 790 188 2,965 681 186 1,691 – 1,177 7,678--------------------------------------------------------------------------------------------------------------------------------------------------------------------------------------------------------------------------------------------------------------------------------------------------------
Total costs 841 195 3,600 848 197 1,955 126 1,245 9,007
The group’s share of jointly controlled entities’ and associates’ costs incurred in 2005 was $1,205 million: in Russia $845 million and Rest of
Americas $360 million.
--------------------------------------------------------------------------------------------------------------------------------------------------------------------------------------------------------------------------------------------------------------------------------------------------------
Results of operations for the year ended 31 December
Sales and other operating revenues
Third parties 4,667 635 2,048 2,260 1,045 1,350 – 690 12,695
Sales between businesses 2,458 976 14,842 2,863 782 2,402 – 4,796 29,119--------------------------------------------------------------------------------------------------------------------------------------------------------------------------------------------------------------------------------------------------------------------------------------------------------
7,125 1,611 16,890 5,123 1,827 3,752 – 5,486 41,814--------------------------------------------------------------------------------------------------------------------------------------------------------------------------------------------------------------------------------------------------------------------------------------------------------
Exploration expenditure 32 1 426 84 6 81 37 17 684
Production costs 1,082 118 1,814 578 159 460 – 180 4,391
Production taxes 485 33 610 281 54 – – 1,536 2,999
Other costs (income)c 1,857 (55) 2,200 537 170 98 8 2,042 6,857
Depreciation, depletion and amortization 1,548 220 2,288 675 162 542 – 193 5,628
Impairments and (gains) losses on sale of
businesses and fixed assets 44 (1,038) 232 (133) – – 2 – (893)--------------------------------------------------------------------------------------------------------------------------------------------------------------------------------------------------------------------------------------------------------------------------------------------------------
5,048 (721) 7,570 2,022 551 1,181 47 3,968 19,666--------------------------------------------------------------------------------------------------------------------------------------------------------------------------------------------------------------------------------------------------------------------------------------------------------
Profit before taxationd,e 2,077 2,332 9,320 3,101 1,276 2,571 (47) 1,518 22,148
Allocable taxes 405 880 3,377 1,390 447 1,043 (1) 409 7,950--------------------------------------------------------------------------------------------------------------------------------------------------------------------------------------------------------------------------------------------------------------------------------------------------------
Results of operations 1,672 1,452 5,943 1,711 829 1,528 (46) 1,109 14,198
The group’s share of jointly controlled entities’ and associates’ results of operations (including the group’s share of total TNK-BP results) in 2005 was a
profit of $3,029 million after deducting interest of $226 million, taxation of $1,250 million and minority interest of $104 million.
a This note contains information relating to oil and natural gas exploration and production activities. Midstream activities of natural gas gathering and distribution and theoperation of the main pipelines and tankers are excluded. The main midstream activities are the Alaskan transportation facilities, the Forties Pipeline system and the CentralArea Transmission System. The group’s share of jointly controlled entities’ and associates’ activities is excluded from the tables and included in the footnoteswith the exception of the Abu Dhabi operations, which are included in the income and expenditure items above.
b Includes exploration and appraisal drilling expenditures, which are capitalized within intangible fixed assets, and geological and geophysical exploration costs, which arecharged to income as incurred.
c Includes the value of royalty oil sold on behalf of others where royalty is payable in cash, property taxes, other government take, the fair value loss on embeddedderivatives $1,688 million and a $265 million charge incurred on the cancellation of an intragroup gas supply contract. The UK region includes a $530 million charge offset bycorresponding gains primarily in the US, relating to the group’s self-insurance programme.
d Excludes accretion expense attributable to exploration and production activities amounting to $122 million. Under IFRS, accretion expense is included in other financeexpense in the group income statement.
e The Exploration and Production profit before interest and tax is set out below.
$ million--------------------------------------------------------------------------------------------------------------------------------------------------------------------------------------------------------------------------------------------------------------------------------------------------------
2005--------------------------------------------------------------------------------------------------------------------------------------------------------------------------------------------------------------------------------------------------------------------------------------------------------
Exploration and production activities
Group (as above) 2,077 2,332 9,320 3,101 1,276 2,571 (47) 1,518 22,148
Jointly controlled entities and associates – – – 309 35 – 2,685 – 3,029
Mid-stream activities 52 (11) 172 148 (20) (39) (1) 24 325--------------------------------------------------------------------------------------------------------------------------------------------------------------------------------------------------------------------------------------------------------------------------------------------------------
Total profit before interest and tax 2,129 2,321 9,492 3,558 1,291 2,532 2,637 1,542 25,502
–
63
63
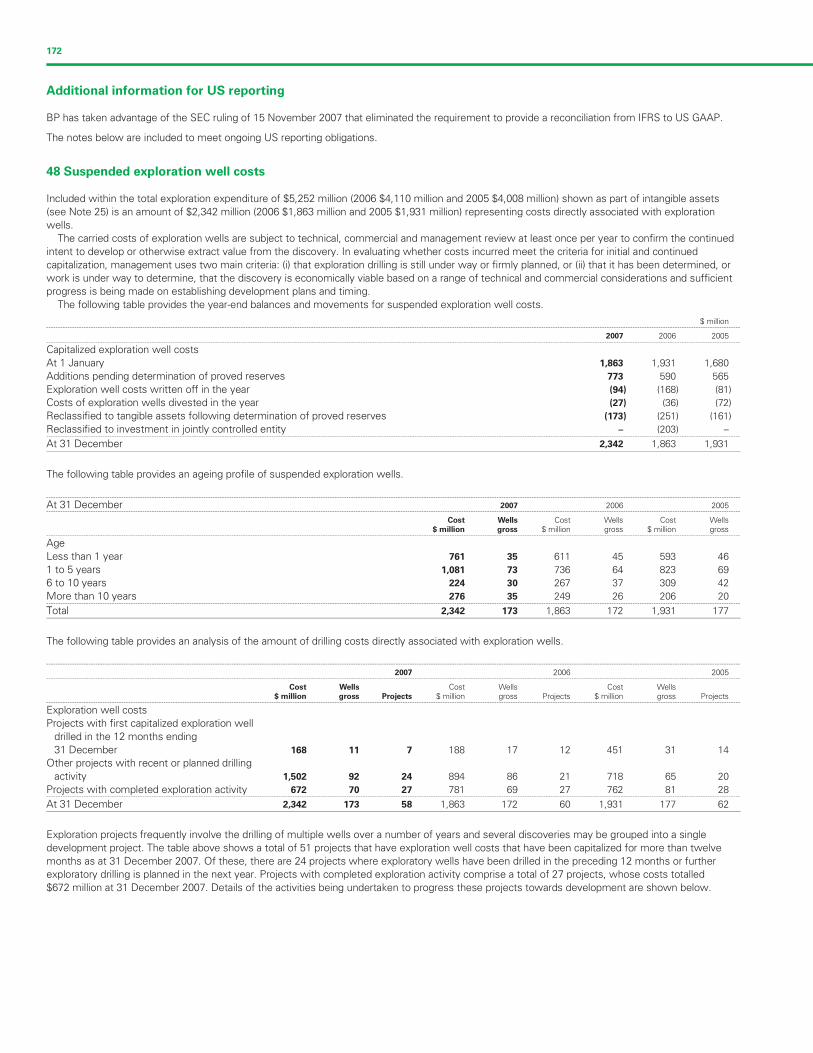
Filename: U54368_doc8.3d Time: 14:50:15 Date: 25/02/08
Checksum: 1430675457
172
Additional information for US reporting
BP has taken advantage of the SEC ruling of 15 November 2007 that eliminated the requirement to provide a reconciliation from IFRS to US GAAP.
The notes below are included to meet ongoing US reporting obligations.
48 Suspended exploration well costs
Included within the total exploration expenditure of $5,252 million (2006 $4,110 million and 2005 $4,008 million) shown as part of intangible assets
(see Note 25) is an amount of $2,342 million (2006 $1,863 million and 2005 $1,931 million) representing costs directly associated with exploration
wells.
The carried costs of exploration wells are subject to technical, commercial and management review at least once per year to confirm the continued
intent to develop or otherwise extract value from the discovery. In evaluating whether costs incurred meet the criteria for initial and continued
capitalization, management uses two main criteria: (i) that exploration drilling is still under way or firmly planned, or (ii) that it has been determined, or
work is under way to determine, that the discovery is economically viable based on a range of technical and commercial considerations and sufficient
progress is being made on establishing development plans and timing.
The following table provides the year-end balances and movements for suspended exploration well costs.
$ million--------------------------------------------------------------------------------------------------------------------------------------------------------------------------------------------------------------------------------------------------------------------------------------------------------
2007 2006 2005--------------------------------------------------------------------------------------------------------------------------------------------------------------------------------------------------------------------------------------------------------------------------------------------------------
Capitalized exploration well costs
At 1 January 1,863 1,931 1,680
Additions pending determination of proved reserves 773 590 565
Exploration well costs written off in the year (94) (168) (81)
Costs of exploration wells divested in the year (27) (36) (72)
Reclassified to tangible assets following determination of proved reserves (173) (251) (161)
Reclassified to investment in jointly controlled entity – (203) –--------------------------------------------------------------------------------------------------------------------------------------------------------------------------------------------------------------------------------------------------------------------------------------------------------
At 31 December 2,342 1,863 1,931
The following table provides an ageing profile of suspended exploration wells.
--------------------------------------------------------------------------------------------------------------------------------------------------------------------------------------------------------------------------------------------------------------------------------------------------------
At 31 December 2007 2006 2005--------------------------------------------------------------------------------------------------------------------------------------------------------------------------------------------------------------------------------------------------------------------------------------------------------
Cost Wells Cost Wells Cost Wells$ million gross $ million gross $ million gross
--------------------------------------------------------------------------------------------------------------------------------------------------------------------------------------------------------------------------------------------------------------------------------------------------------
Age
Less than 1 year 761 35 611 45 593 46
1 to 5 years 1,081 73 736 64 823 69
6 to 10 years 224 30 267 37 309 42
More than 10 years 276 35 249 26 206 20--------------------------------------------------------------------------------------------------------------------------------------------------------------------------------------------------------------------------------------------------------------------------------------------------------
Total 2,342 173 1,863 172 1,931 177
The following table provides an analysis of the amount of drilling costs directly associated with exploration wells.
--------------------------------------------------------------------------------------------------------------------------------------------------------------------------------------------------------------------------------------------------------------------------------------------------------
2007 2006 2005--------------------------------------------------------------------------------------------------------------------------------------------------------------------------------------------------------------------------------------------------------------------------------------------------------
Cost Wells Cost Wells Cost Wells$ million gross Projects $ million gross Projects $ million gross Projects
--------------------------------------------------------------------------------------------------------------------------------------------------------------------------------------------------------------------------------------------------------------------------------------------------------
Exploration well costs
Projects with first capitalized exploration well
drilled in the 12 months ending
31 December 168 11 7 188 17 12 451 31 14
Other projects with recent or planned drilling
activity 1,502 92 24 894 86 21 718 65 20
Projects with completed exploration activity 672 70 27 781 69 27 762 81 28--------------------------------------------------------------------------------------------------------------------------------------------------------------------------------------------------------------------------------------------------------------------------------------------------------
At 31 December 2,342 173 58 1,863 172 60 1,931 177 62
Exploration projects frequently involve the drilling of multiple wells over a number of years and several discoveries may be grouped into a single
development project. The table above shows a total of 51 projects that have exploration well costs that have been capitalized for more than twelve
months as at 31 December 2007. Of these, there are 24 projects where exploratory wells have been drilled in the preceding 12 months or further
exploratory drilling is planned in the next year. Projects with completed exploration activity comprise a total of 27 projects, whose costs totalled
$672 million at 31 December 2007. Details of the activities being undertaken to progress these projects towards development are shown below.

Filename: U54368_doc8.3d Time: 14:50:15 Date: 25/02/08
Checksum: 1789409502
BP ANNUAL REPORT AND ACCOUNTS 2007 173
48 Suspended exploration well costs continued
--------------------------------------------------------------------------------------------------------------------------------------------------------------------------------------------------------------------------------------------------------------------------------------------------------
Anticipated2007 Years year of
Cost wells wells developmentCountry Project $ million gross drilled project sanction Comment--------------------------------------------------------------------------------------------------------------------------------------------------------------------------------------------------------------------------------------------------------------------------------------------------------
Angola Chumbo 26 2 2003-2005 2011-2014 Assessment of hydrocarbon quantities as potentially
commercial completed; development option identified and
under evaluation; development plan for FPSO submitted.
Plutao/Saturno/Marte/Venus 51 5 2002-2005 2008 Assessment of hydrocarbon quantities as potentially
commercial completed; development option using FPSO
identified and under evaluation.
Cravo/Lirio/Orquidea/Violeta 32 7 1998-2006 2009 Assessment of hydrocarbon quantities as potentially
commercial completed; development option using FPSO
identified and under evaluation.--------------------------------------------------------------------------------------------------------------------------------------------------------------------------------------------------------------------------------------------------------------------------------------------------------
109 14--------------------------------------------------------------------------------------------------------------------------------------------------------------------------------------------------------------------------------------------------------------------------------------------------------
Egypt Ras El Bar Seth 3 1 1995 2008 Assessment of hydrocarbon quantities as potentially
commercial completed; development options identified
and under evaluation; development planned through
tie-back to existing infrastructure; gas sale agreement in
place.
Western Mediterranean 13 3 2002-2004 2008-2010 Assessment of hydrocarbon quantities as potentially
Block B commercial completed; development options identified
and under evaluation; seismic survey completed and under
review; concession agreement amendment negotiations
under way.
East Delta Deep Marine 11 2 2002-2006 2011 Assessment of hydrocarbon quantities as potentially
commercial completed; development options identified
and under evaluation involving tie-back to existing
infrastructure.--------------------------------------------------------------------------------------------------------------------------------------------------------------------------------------------------------------------------------------------------------------------------------------------------------
27 6--------------------------------------------------------------------------------------------------------------------------------------------------------------------------------------------------------------------------------------------------------------------------------------------------------
Indonesia Tangguh Phase II 51 9 1994-1997 2009-2011 Assessment of hydrocarbon quantities as potentially
commercial completed; assessment of economic aspects
of project in progress; onshore and offshore development
options identified and under evaluation. This is the second
phase of the LNG project that is currently under
development.--------------------------------------------------------------------------------------------------------------------------------------------------------------------------------------------------------------------------------------------------------------------------------------------------------
51 9--------------------------------------------------------------------------------------------------------------------------------------------------------------------------------------------------------------------------------------------------------------------------------------------------------
Trinidad Coconut 47 1 2005 2014 Assessment of hydrocarbon quantities as potentially
commercial completed; assessment of economic aspects
of project in progress; development options identified and
under evaluation; planned subsea tie-back to existing
infrastructure.
Corallita/Lantana 24 2 1996 2008 Assessment of hydrocarbon quantities as potentially
commercial completed; development options identified
and under evaluation; planned subsea tie-back to existing
infrastructure fields dedicated to LNG gas contract
delivery; dependent upon capacity in existing
infrastructure.
Manakin 22 1 2000 2011 Assessment of hydrocarbon quantities as potentially
commercial completed; assessment of economic aspects
of project in progress; development options identified and
under evaluation; planned subsea tie-back to existing
production facilities and LNG train; inter-governmental
discussions on unitization continue.--------------------------------------------------------------------------------------------------------------------------------------------------------------------------------------------------------------------------------------------------------------------------------------------------------
93 4
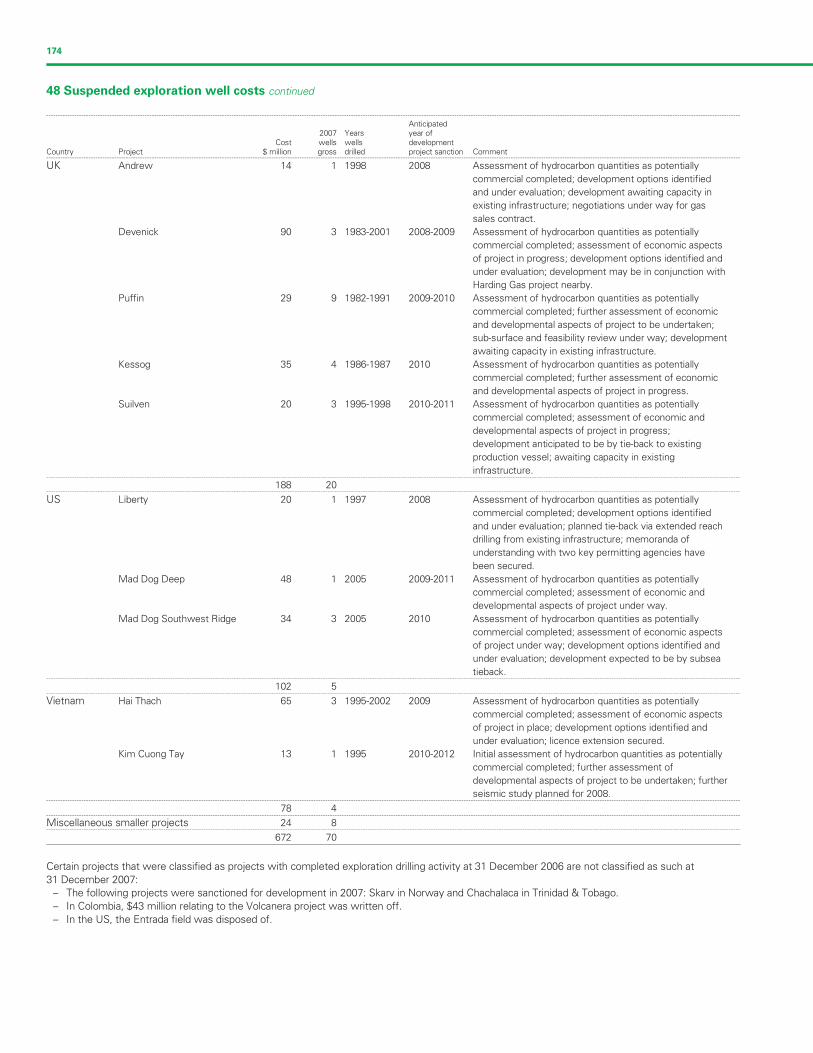
Filename: U54368_doc8.3d Time: 14:50:15 Date: 25/02/08
Checksum: -2091786544
174
48 Suspended exploration well costs continued
--------------------------------------------------------------------------------------------------------------------------------------------------------------------------------------------------------------------------------------------------------------------------------------------------------
Anticipated2007 Years year of
Cost wells wells developmentCountry Project $ million gross drilled project sanction Comment--------------------------------------------------------------------------------------------------------------------------------------------------------------------------------------------------------------------------------------------------------------------------------------------------------
UK Andrew 14 1 1998 2008 Assessment of hydrocarbon quantities as potentially
commercial completed; development options identified
and under evaluation; development awaiting capacity in
existing infrastructure; negotiations under way for gas
sales contract.
Devenick 90 3 1983-2001 2008-2009 Assessment of hydrocarbon quantities as potentially
commercial completed; assessment of economic aspects
of project in progress; development options identified and
under evaluation; development may be in conjunction with
Harding Gas project nearby.
Puffin 29 9 1982-1991 2009-2010 Assessment of hydrocarbon quantities as potentially
commercial completed; further assessment of economic
and developmental aspects of project to be undertaken;
sub-surface and feasibility review under way; development
awaiting capacity in existing infrastructure.
Kessog 35 4 1986-1987 2010 Assessment of hydrocarbon quantities as potentially
commercial completed; further assessment of economic
and developmental aspects of project in progress.
Suilven 20 3 1995-1998 2010-2011 Assessment of hydrocarbon quantities as potentially
commercial completed; assessment of economic and
developmental aspects of project in progress;
development anticipated to be by tie-back to existing
production vessel; awaiting capacity in existing
infrastructure.--------------------------------------------------------------------------------------------------------------------------------------------------------------------------------------------------------------------------------------------------------------------------------------------------------
188 20--------------------------------------------------------------------------------------------------------------------------------------------------------------------------------------------------------------------------------------------------------------------------------------------------------
US Liberty 20 1 1997 2008 Assessment of hydrocarbon quantities as potentially
commercial completed; development options identified
and under evaluation; planned tie-back via extended reach
drilling from existing infrastructure; memoranda of
understanding with two key permitting agencies have
been secured.
Mad Dog Deep 48 1 2005 2009-2011 Assessment of hydrocarbon quantities as potentially
commercial completed; assessment of economic and
developmental aspects of project under way.
Mad Dog Southwest Ridge 34 3 2005 2010 Assessment of hydrocarbon quantities as potentially
commercial completed; assessment of economic aspects
of project under way; development options identified and
under evaluation; development expected to be by subsea
tieback.--------------------------------------------------------------------------------------------------------------------------------------------------------------------------------------------------------------------------------------------------------------------------------------------------------
102 5--------------------------------------------------------------------------------------------------------------------------------------------------------------------------------------------------------------------------------------------------------------------------------------------------------
Vietnam Hai Thach 65 3 1995-2002 2009 Assessment of hydrocarbon quantities as potentially
commercial completed; assessment of economic aspects
of project in place; development options identified and
under evaluation; licence extension secured.
Kim Cuong Tay 13 1 1995 2010-2012 Initial assessment of hydrocarbon quantities as potentially
commercial completed; further assessment of
developmental aspects of project to be undertaken; further
seismic study planned for 2008.--------------------------------------------------------------------------------------------------------------------------------------------------------------------------------------------------------------------------------------------------------------------------------------------------------
78 4--------------------------------------------------------------------------------------------------------------------------------------------------------------------------------------------------------------------------------------------------------------------------------------------------------
Miscellaneous smaller projects 24 8--------------------------------------------------------------------------------------------------------------------------------------------------------------------------------------------------------------------------------------------------------------------------------------------------------
672 70
Certain projects that were classified as projects with completed exploration drilling activity at 31 December 2006 are not classified as such at
31 December 2007:
– The following projects were sanctioned for development in 2007: Skarv in Norway and Chachalaca in Trinidad & Tobago.
– In Colombia, $43 million relating to the Volcanera project was written off.
– In the US, the Entrada field was disposed of.
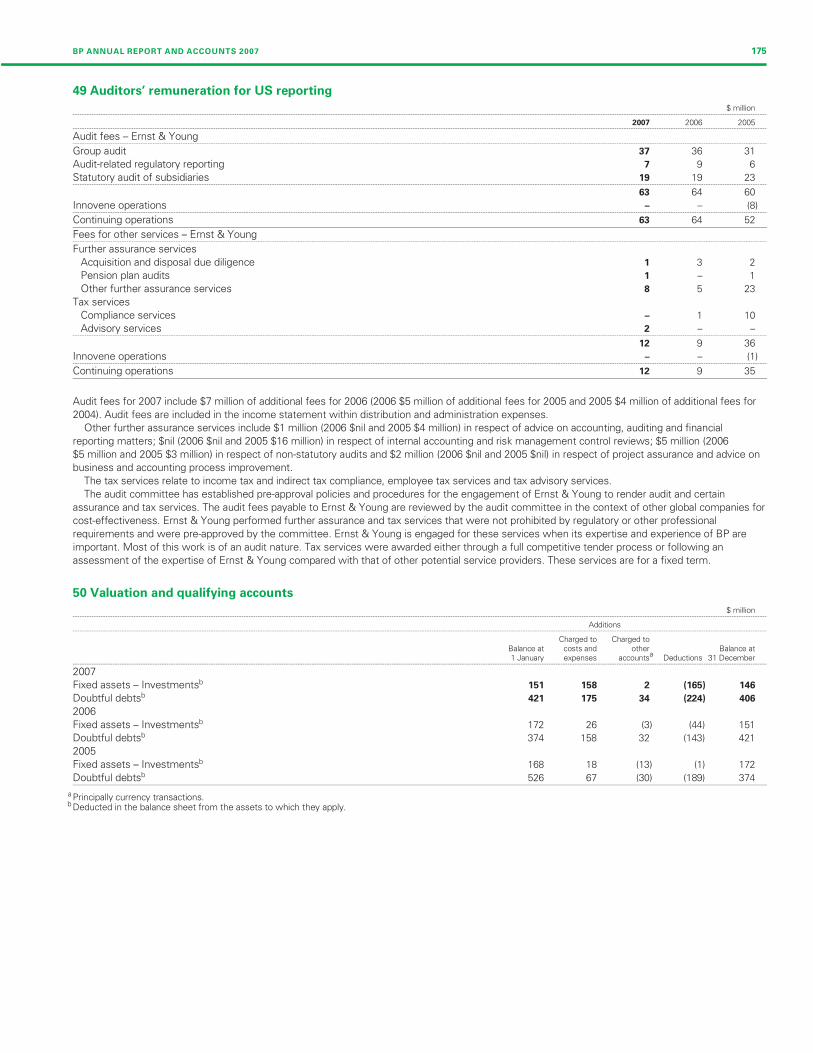
Filename: U54368_doc8.3d Time: 14:50:15 Date: 25/02/08
Checksum: 1405791529
BP ANNUAL REPORT AND ACCOUNTS 2007 175
49 Auditors’ remuneration for US reporting
$ million--------------------------------------------------------------------------------------------------------------------------------------------------------------------------------------------------------------------------------------------------------------------------------------------------------
2007 2006 2005--------------------------------------------------------------------------------------------------------------------------------------------------------------------------------------------------------------------------------------------------------------------------------------------------------
Audit fees – Ernst & Young--------------------------------------------------------------------------------------------------------------------------------------------------------------------------------------------------------------------------------------------------------------------------------------------------------
Group audit 37 36 31
Audit-related regulatory reporting 7 9
Statutory audit of subsidiaries 19 19 23--------------------------------------------------------------------------------------------------------------------------------------------------------------------------------------------------------------------------------------------------------------------------------------------------------
63 64 60
Innovene operations – – (8)--------------------------------------------------------------------------------------------------------------------------------------------------------------------------------------------------------------------------------------------------------------------------------------------------------
Continuing operations 63 64 52
Fees for other services – Ernst & Young--------------------------------------------------------------------------------------------------------------------------------------------------------------------------------------------------------------------------------------------------------------------------------------------------------
Further assurance services
Acquisition and disposal due diligence 1 3
Pension plan audits 1 –
Other further assurance services 8 5 23
Tax services
Compliance services – 1 10
Advisory services 2 –--------------------------------------------------------------------------------------------------------------------------------------------------------------------------------------------------------------------------------------------------------------------------------------------------------
12 9 36
Innovene operations – – (1)--------------------------------------------------------------------------------------------------------------------------------------------------------------------------------------------------------------------------------------------------------------------------------------------------------
Continuing operations 12 9 35
Audit fees for 2007 include $7 million of additional fees for 2006 (2006 $5 million of additional fees for 2005 and 2005 $4 million of additional fees for
2004). Audit fees are included in the income statement within distribution and administration expenses.
Other further assurance services include $1 million (2006 $nil and 2005 $4 million) in respect of advice on accounting, auditing and financial
reporting matters; $nil (2006 $nil and 2005 $16 million) in respect of internal accounting and risk management control reviews; $5 million (2006
$5 million and 2005 $3 million) in respect of non-statutory audits and $2 million (2006 $nil and 2005 $nil) in respect of project assurance and advice on
business and accounting process improvement.
The tax services relate to income tax and indirect tax compliance, employee tax services and tax advisory services.
The audit committee has established pre-approval policies and procedures for the engagement of Ernst & Young to render audit and certain
assurance and tax services. The audit fees payable to Ernst & Young are reviewed by the audit committee in the context of other global companies for
cost-effectiveness. Ernst & Young performed further assurance and tax services that were not prohibited by regulatory or other professional
requirements and were pre-approved by the committee. Ernst & Young is engaged for these services when its expertise and experience of BP are
important. Most of this work is of an audit nature. Tax services were awarded either through a full competitive tender process or following an
assessment of the expertise of Ernst & Young compared with that of other potential service providers. These services are for a fixed term.
50 Valuation and qualifying accounts
$ million--------------------------------------------------------------------------------------------------------------------------------------------------------------------------------------------------------------------------------------------------------------------------------------------------------
Additions--------------------------------------------------------------------------------------------------------------------------------------------------------------------------------------------------------------------------------------------------------------------------------------------------------
Charged to Charged toBalance at costs and other Balance at
a1 January expenses accounts Deductions 31 December--------------------------------------------------------------------------------------------------------------------------------------------------------------------------------------------------------------------------------------------------------------------------------------------------------
2007
Fixed assets – Investmentsb 151 158 2 (165) 146
Doubtful debtsb 421 175 34 (224) 406
2006
Fixed assets – Investmentsb 172 26 (3) (44) 151
Doubtful debtsb 374 158 32 (143) 421
2005
Fixed assets – Investmentsb 168 18 (13) (1) 172
Doubtful debtsb 526 67 (30) (189) 374
a Principally currency transactions.b Deducted in the balance sheet from the assets to which they apply.
6
2
1
–
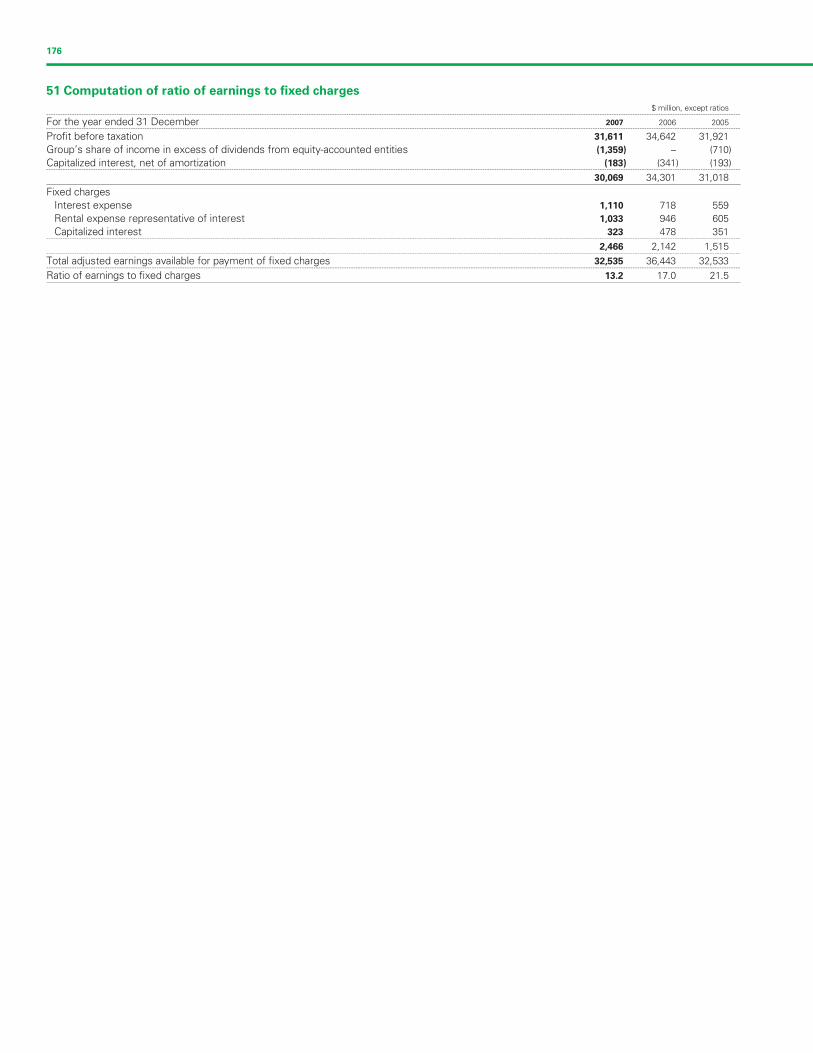
Filename: U54368_doc8.3d Time: 14:50:15 Date: 25/02/08
Checksum: -1895521294
176
51 Computation of ratio of earnings to fixed charges
$ million, except ratios--------------------------------------------------------------------------------------------------------------------------------------------------------------------------------------------------------------------------------------------------------------------------------------------------------
For the year ended 31 December 2007 2006 2005--------------------------------------------------------------------------------------------------------------------------------------------------------------------------------------------------------------------------------------------------------------------------------------------------------
Profit before taxation 31,611 34,642 31,921
Group’s share of income in excess of dividends from equity-accounted entities (1,359) – (710)
Capitalized interest, net of amortization (183) (341) (193)--------------------------------------------------------------------------------------------------------------------------------------------------------------------------------------------------------------------------------------------------------------------------------------------------------
30,069 34,301 31,018
Fixed charges
Interest expense 1,110 718 559
Rental expense representative of interest 1,033 946 605
Capitalized interest 323 478 351--------------------------------------------------------------------------------------------------------------------------------------------------------------------------------------------------------------------------------------------------------------------------------------------------------
2,466 2,142 1,515--------------------------------------------------------------------------------------------------------------------------------------------------------------------------------------------------------------------------------------------------------------------------------------------------------
Total adjusted earnings available for payment of fixed charges 32,535 36,443 32,533--------------------------------------------------------------------------------------------------------------------------------------------------------------------------------------------------------------------------------------------------------------------------------------------------------
Ratio of earnings to fixed charges 13.2 17.0 21.5
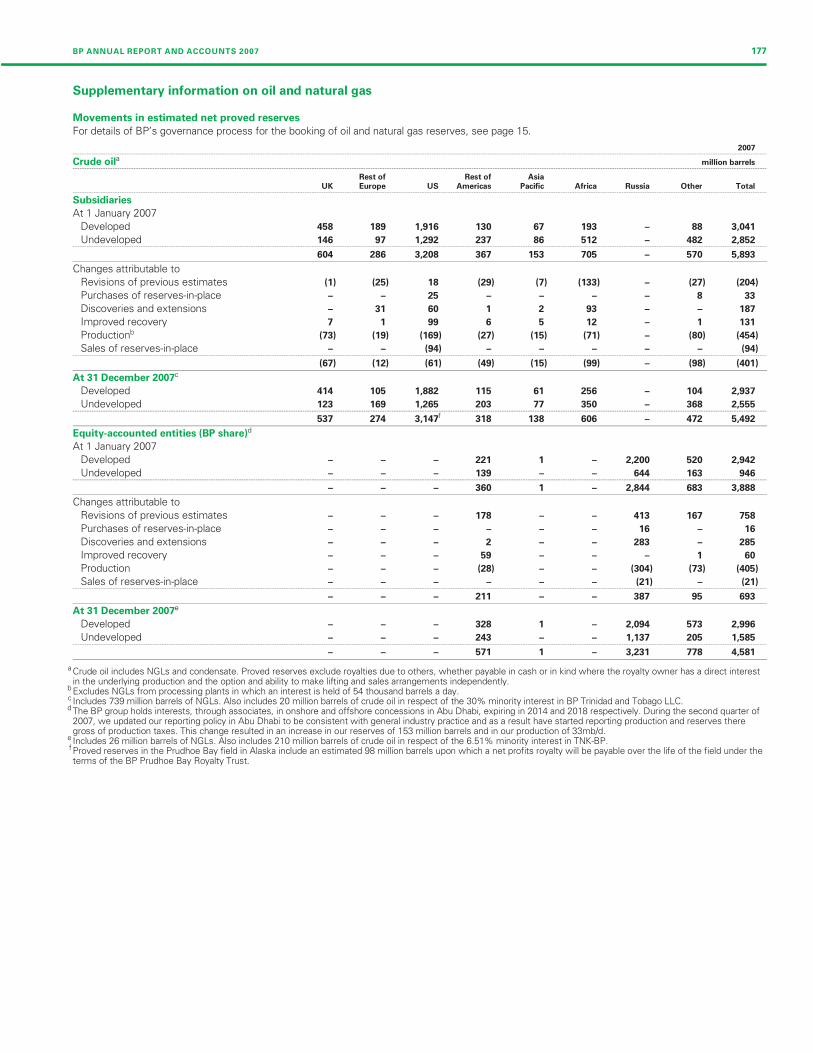
Filename: U54368_doc8.3d Time: 14:50:16 Date: 25/02/08
Checksum: 1340942421
BP ANNUAL REPORT AND ACCOUNTS 2007 177
Supplementary information on oil and natural gas
Movements in estimated net proved reserves
For details of BP’s governance process for the booking of oil and natural gas reserves, see page 15.
2007--------------------------------------------------------------------------------------------------------------------------------------------------------------------------------------------------------------------------------------------------------------------------------------------------------
Crude oila million barrels--------------------------------------------------------------------------------------------------------------------------------------------------------------------------------------------------------------------------------------------------------------------------------------------------------
Rest of Rest of Asia
UK Europe US Americas Pacific Africa Russia Other Total--------------------------------------------------------------------------------------------------------------------------------------------------------------------------------------------------------------------------------------------------------------------------------------------------------
Subsidiaries
At 1 January 2007
Developed 458 189 1,916 130 67 193 – 88 3,041
Undeveloped 146 97 1,292 237 86 512 – 482 2,852--------------------------------------------------------------------------------------------------------------------------------------------------------------------------------------------------------------------------------------------------------------------------------------------------------
604 286 3,208 367 153 705 – 570 5,893
Changes attributable to
Revisions of previous estimates (1) (25) 18 (29) (7) (133) – (27) (204)
Purchases of reserves-in-place – – 25 – – – – 8
Discoveries and extensions – 31 60 1 2 93 – – 187
Improved recovery 7 1 99 6 5 12 – 1 131
Productionb (73) (19) (169) (27) (15) (71) – (80) (454)
Sales of reserves-in-place – – (94) – – – – –--------------------------------------------------------------------------------------------------------------------------------------------------------------------------------------------------------------------------------------------------------------------------------------------------------
(67) (12) (61) (49) (15) (99) – (98) (401)
At 31 December 2007c
Developed 414 105 1,882 115 61 256 – 104 2,937
Undeveloped 123 169 1,265 203 77 350 – 368 2,555--------------------------------------------------------------------------------------------------------------------------------------------------------------------------------------------------------------------------------------------------------------------------------------------------------
537 274 3,147f 318 138 606 – 472 5,492
Equity-accounted entities (BP share)d
At 1 January 2007
Developed – – – 221 1 – 2,200 520 2,942
Undeveloped – – – 139 – – 644 163 946--------------------------------------------------------------------------------------------------------------------------------------------------------------------------------------------------------------------------------------------------------------------------------------------------------
– – – 360 1 – 2,844 683 3,888
Changes attributable to
Revisions of previous estimates – – – 178 – – 413 167 758
Purchases of reserves-in-place – – – – – – 16 –
Discoveries and extensions – – – 2 – – 283 – 285
Improved recovery – – – 59 – – – 1
Production – – – (28) – – (304) (73) (405)
Sales of reserves-in-place – – – – – – (21) –--------------------------------------------------------------------------------------------------------------------------------------------------------------------------------------------------------------------------------------------------------------------------------------------------------
– – – 211 – – 387 95 693
At 31 December 2007e
Developed – – – 328 1 – 2,094 573 2,996
Undeveloped – – – 243 – – 1,137 205 1,585--------------------------------------------------------------------------------------------------------------------------------------------------------------------------------------------------------------------------------------------------------------------------------------------------------
– – – 571 1 – 3,231 778 4,581
a Crude oil includes NGLs and condensate. Proved reserves exclude royalties due to others, whether payable in cash or in kind where the royalty owner has a direct interestin the underlying production and the option and ability to make lifting and sales arrangements independently.
b Excludes NGLs from processing plants in which an interest is held of 54 thousand barrels a day.c Includes 739 million barrels of NGLs. Also includes 20 million barrels of crude oil in respect of the 30% minority interest in BP Trinidad and Tobago LLC.d The BP group holds interests, through associates, in onshore and offshore concessions in Abu Dhabi, expiring in 2014 and 2018 respectively. During the second quarter of
2007, we updated our reporting policy in Abu Dhabi to be consistent with general industry practice and as a result have started reporting production and reserves theregross of production taxes. This change resulted in an increase in our reserves of 153 million barrels and in our production of 33mb/d.
e Includes 26 million barrels of NGLs. Also includes 210 million barrels of crude oil in respect of the 6.51% minority interest in TNK-BP.f Proved reserves in the Prudhoe Bay field in Alaska include an estimated 98 million barrels upon which a net profits royalty will be payable over the life of the field under theterms of the BP Prudhoe Bay Royalty Trust.
33
(94)
16
60
(21)
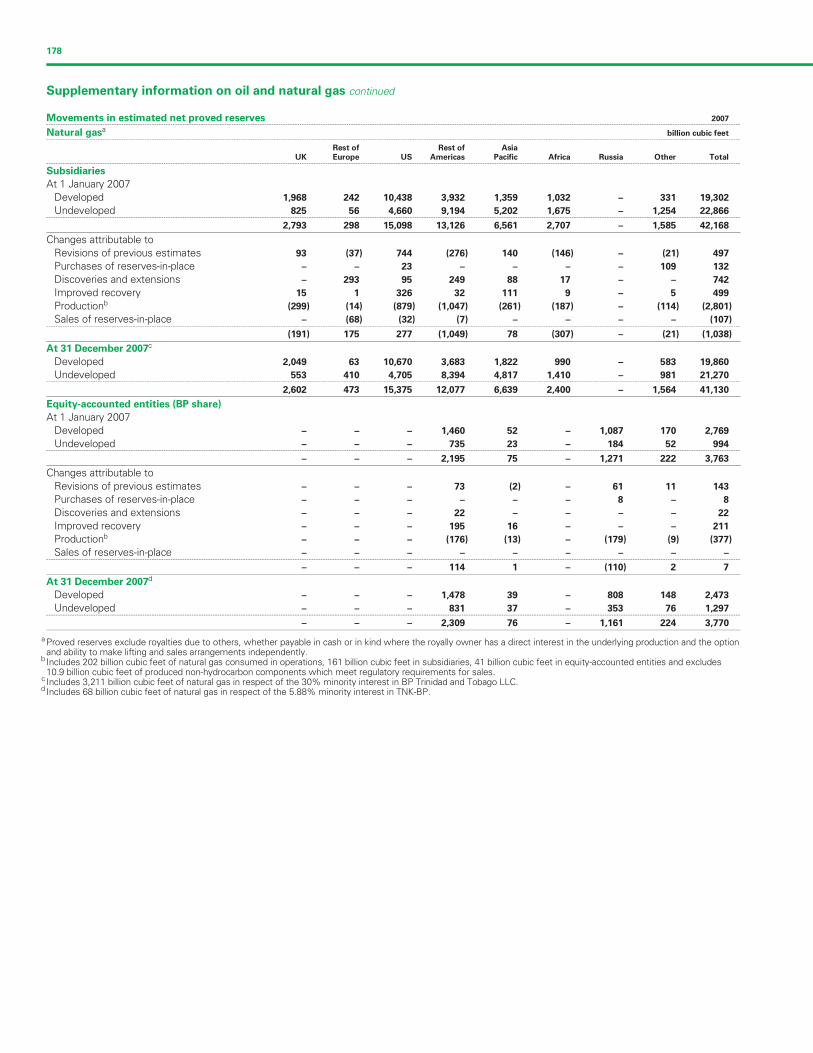
Filename: U54368_doc8.3d Time: 14:50:16 Date: 25/02/08
Checksum: -1123921960
178
Supplementary information on oil and natural gas continued
Movements in estimated net proved reserves 2007--------------------------------------------------------------------------------------------------------------------------------------------------------------------------------------------------------------------------------------------------------------------------------------------------------
Natural gasabillion cubic feet
--------------------------------------------------------------------------------------------------------------------------------------------------------------------------------------------------------------------------------------------------------------------------------------------------------
Rest of Rest of Asia
UK Europe US Americas Pacific Africa Russia Other Total--------------------------------------------------------------------------------------------------------------------------------------------------------------------------------------------------------------------------------------------------------------------------------------------------------
Subsidiaries
At 1 January 2007
Developed 1,968 242 10,438 3,932 1,359 1,032 – 331 19,302
Undeveloped 825 56 4,660 9,194 5,202 1,675 – 1,254 22,866--------------------------------------------------------------------------------------------------------------------------------------------------------------------------------------------------------------------------------------------------------------------------------------------------------
2,793 298 15,098 13,126 6,561 2,707 – 1,585 42,168
Changes attributable to
Revisions of previous estimates 93 (37) 744 (276) 140 (146) – (21) 497
Purchases of reserves-in-place – – 23 – – – – 109 1
Discoveries and extensions – 293 95 249 88 17 – – 742
Improved recovery 15 1 326 32 111 9 – 5 499
Productionb (299) (14) (879) (1,047) (261) (187) – (114) (2,801)
Sales of reserves-in-place – (68) (32) (7) – – – – (1--------------------------------------------------------------------------------------------------------------------------------------------------------------------------------------------------------------------------------------------------------------------------------------------------------
(191) 175 277 (1,049) 78 (307) – (21) (1,038)
At 31 December 2007c
Developed 2,049 63 10,670 3,683 1,822 990 – 583 19,860
Undeveloped 553 410 4,705 8,394 4,817 1,410 – 981 21,270--------------------------------------------------------------------------------------------------------------------------------------------------------------------------------------------------------------------------------------------------------------------------------------------------------
2,602 473 15,375 12,077 6,639 2,400 – 1,564 41,130
Equity-accounted entities (BP share)
At 1 January 2007
Developed – – – 1,460 52 – 1,087 170 2,769
Undeveloped – – – 735 23 – 184 52 994--------------------------------------------------------------------------------------------------------------------------------------------------------------------------------------------------------------------------------------------------------------------------------------------------------
– – – 2,195 75 – 1,271 222 3,763
Changes attributable to
Revisions of previous estimates – – – 73 (2) – 61 11 143
Purchases of reserves-in-place – – – – – – 8 –
Discoveries and extensions – – – 22 – – – –
Improved recovery – – – 195 16 – – – 211
Productionb – – – (176) (13) – (179) (9) (377)
Sales of reserves-in-place – – – – – – – –--------------------------------------------------------------------------------------------------------------------------------------------------------------------------------------------------------------------------------------------------------------------------------------------------------
– – – 114 1 – (110) 2 7
At 31 December 2007d
Developed – – – 1,478 39 – 808 148 2,473
Undeveloped – – – 831 37 – 353 76 1,297--------------------------------------------------------------------------------------------------------------------------------------------------------------------------------------------------------------------------------------------------------------------------------------------------------
– – – 2,309 76 – 1,161 224 3,770
a Proved reserves exclude royalties due to others, whether payable in cash or in kind where the royally owner has a direct interest in the underlying production and the optionand ability to make lifting and sales arrangements independently.
b Includes 202 billion cubic feet of natural gas consumed in operations, 161 billion cubic feet in subsidiaries, 41 billion cubic feet in equity-accounted entities and excludes10.9 billion cubic feet of produced non-hydrocarbon components which meet regulatory requirements for sales.
c Includes 3,211 billion cubic feet of natural gas in respect of the 30% minority interest in BP Trinidad and Tobago LLC.d Includes 68 billion cubic feet of natural gas in respect of the 5.88% minority interest in TNK-BP.
32
07)
8
22
–
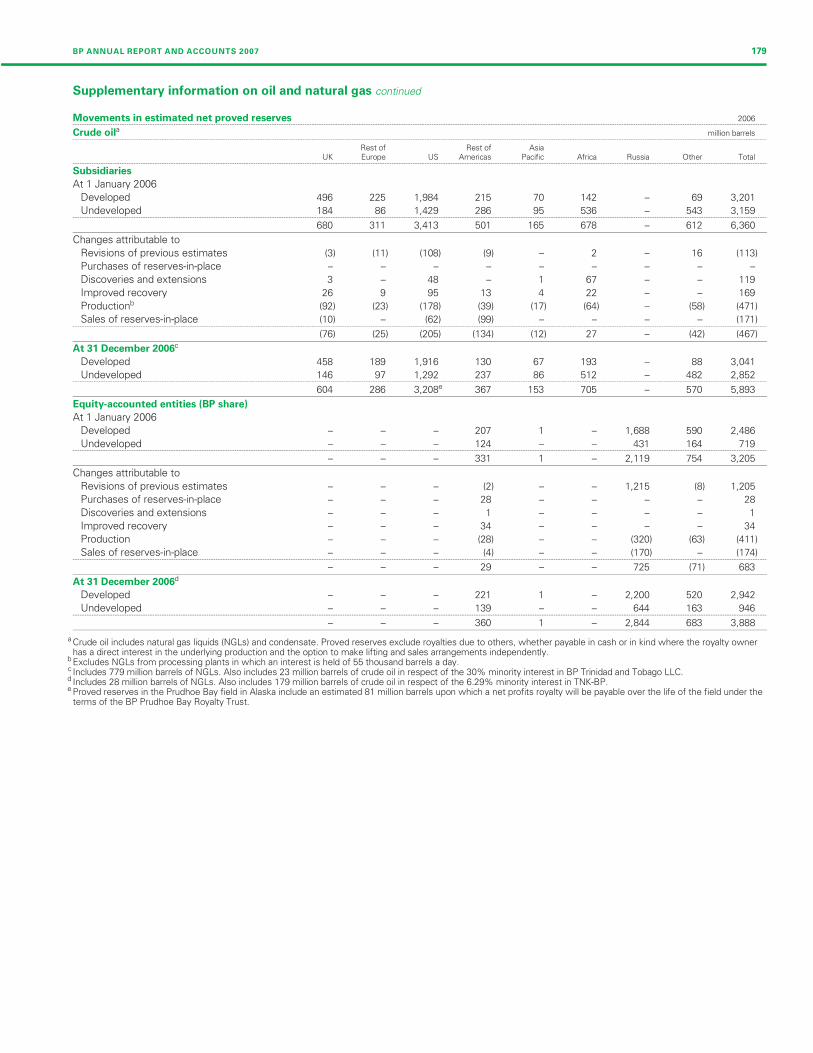
Filename: U54368_doc8.3d Time: 14:50:16 Date: 25/02/08
Checksum: -1756951142
BP ANNUAL REPORT AND ACCOUNTS 2007 179
Supplementary information on oil and natural gas continued
Movements in estimated net proved reserves 2006--------------------------------------------------------------------------------------------------------------------------------------------------------------------------------------------------------------------------------------------------------------------------------------------------------
Crude oila million barrels--------------------------------------------------------------------------------------------------------------------------------------------------------------------------------------------------------------------------------------------------------------------------------------------------------
Rest of Rest of AsiaUK Europe US Americas Pacific Africa Russia Other Total
--------------------------------------------------------------------------------------------------------------------------------------------------------------------------------------------------------------------------------------------------------------------------------------------------------
Subsidiaries
At 1 January 2006
Developed 496 225 1,984 215 70 142 – 69 3,201
Undeveloped 184 86 1,429 286 95 536 – 543 3,159--------------------------------------------------------------------------------------------------------------------------------------------------------------------------------------------------------------------------------------------------------------------------------------------------------
680 311 3,413 501 165 678 – 612 6,360
Changes attributable to
Revisions of previous estimates (3) (11) (108) (9) – 2 – 16 (113)
Purchases of reserves-in-place – – – – – – – –
Discoveries and extensions 3 – 48 – 1 67 – – 119
Improved recovery 26 9 95 13 4 22 – – 169
Productionb (92) (23) (178) (39) (17) (64) – (58) (471)
Sales of reserves-in-place (10) – (62) (99) – – – – (--------------------------------------------------------------------------------------------------------------------------------------------------------------------------------------------------------------------------------------------------------------------------------------------------------
(76) (25) (205) (134) (12) 27 – (42) (467)
At 31 December 2006c
Developed 458 189 1,916 130 67 193 – 88 3,041
Undeveloped 146 97 1,292 237 86 512 – 482 2,852--------------------------------------------------------------------------------------------------------------------------------------------------------------------------------------------------------------------------------------------------------------------------------------------------------
604 286 3,208e 367 153 705 – 570 5,893
Equity-accounted entities (BP share)
At 1 January 2006
Developed – – – 207 1 – 1,688 590 2,486
Undeveloped – – – 124 – – 431 164 719--------------------------------------------------------------------------------------------------------------------------------------------------------------------------------------------------------------------------------------------------------------------------------------------------------
– – – 331 1 – 2,119 754 3,205
Changes attributable to
Revisions of previous estimates – – – (2) – – 1,215 (8) 1,205
Purchases of reserves-in-place – – – 28 – – – –
Discoveries and extensions – – – 1 – – – –
Improved recovery – – – 34 – – – –
Production – – – (28) – – (320) (63) (411)
Sales of reserves-in-place – – – (4) – – (170) – (174)--------------------------------------------------------------------------------------------------------------------------------------------------------------------------------------------------------------------------------------------------------------------------------------------------------
– – – 29 – – 725 (71)
At 31 December 2006d
Developed – – – 221 1 – 2,200 520 2,942
Undeveloped – – – 139 – – 644 163 946--------------------------------------------------------------------------------------------------------------------------------------------------------------------------------------------------------------------------------------------------------------------------------------------------------
– – – 360 1 – 2,844 683 3,888
a Crude oil includes natural gas liquids (NGLs) and condensate. Proved reserves exclude royalties due to others, whether payable in cash or in kind where the royalty ownerhas a direct interest in the underlying production and the option to make lifting and sales arrangements independently.
b Excludes NGLs from processing plants in which an interest is held of 55 thousand barrels a day.c Includes 779 million barrels of NGLs. Also includes 23 million barrels of crude oil in respect of the 30% minority interest in BP Trinidad and Tobago LLC.d Includes 28 million barrels of NGLs. Also includes 179 million barrels of crude oil in respect of the 6.29% minority interest in TNK-BP.e Proved reserves in the Prudhoe Bay field in Alaska include an estimated 81 million barrels upon which a net profits royalty will be payable over the life of the field under the
terms of the BP Prudhoe Bay Royalty Trust.
–
171)
28
1
34
683
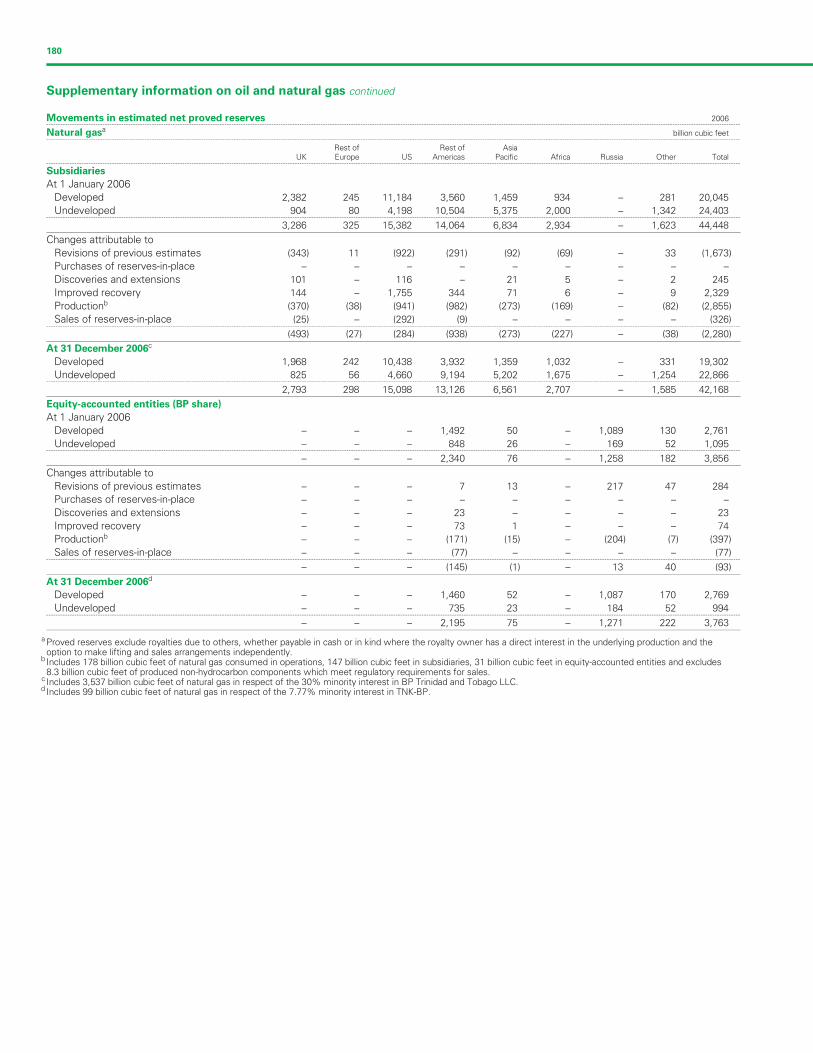
Filename: U54368_doc8.3d Time: 14:50:17 Date: 25/02/08
Checksum: -1124150194
180
Supplementary information on oil and natural gas continued
Movements in estimated net proved reserves 2006--------------------------------------------------------------------------------------------------------------------------------------------------------------------------------------------------------------------------------------------------------------------------------------------------------
Natural gasa billion cubic feet--------------------------------------------------------------------------------------------------------------------------------------------------------------------------------------------------------------------------------------------------------------------------------------------------------
Rest of Rest of AsiaUK Europe US Americas Pacific Africa Russia Other Total
--------------------------------------------------------------------------------------------------------------------------------------------------------------------------------------------------------------------------------------------------------------------------------------------------------
Subsidiaries
At 1 January 2006
Developed 2,382 245 11,184 3,560 1,459 934 – 281 20,045
Undeveloped 904 80 4,198 10,504 5,375 2,000 – 1,342 24,403--------------------------------------------------------------------------------------------------------------------------------------------------------------------------------------------------------------------------------------------------------------------------------------------------------
3,286 325 15,382 14,064 6,834 2,934 – 1,623 44,448
Changes attributable to
Revisions of previous estimates (343) 11 (922) (291) (92) (69) – 33 (1,673)
Purchases of reserves-in-place – – – – – – – – –
Discoveries and extensions 101 – 116 – 21 5 – 2 245
Improved recovery 144 – 1,755 344 71 6 – 9 2,329
Productionb (370) (38) (941) (982) (273) (169) – (82) (2,855)
Sales of reserves-in-place (25) – (292) (9) – – – – (326)--------------------------------------------------------------------------------------------------------------------------------------------------------------------------------------------------------------------------------------------------------------------------------------------------------
(493) (27) (284) (938) (273) (227) – (38) (2,280)
At 31 December 2006c
Developed 1,968 242 10,438 3,932 1,359 1,032 – 331 19,302
Undeveloped 825 56 4,660 9,194 5,202 1,675 – 1,254 22,866--------------------------------------------------------------------------------------------------------------------------------------------------------------------------------------------------------------------------------------------------------------------------------------------------------
2,793 298 15,098 13,126 6,561 2,707 – 1,585 42,168
Equity-accounted entities (BP share)
At 1 January 2006
Developed – – – 1,492 50 – 1,089 130 2,761
Undeveloped – – – 848 26 – 169 52 1,095--------------------------------------------------------------------------------------------------------------------------------------------------------------------------------------------------------------------------------------------------------------------------------------------------------
– – – 2,340 76 – 1,258 182 3,856
Changes attributable to
Revisions of previous estimates – – – 7 13 – 217 47 284
Purchases of reserves-in-place – – – – – – – – –
Discoveries and extensions – – – 23 – – – – 23
Improved recovery – – – 73 1 – – – 74
Productionb – – – (171) (15) – (204) (7) (397)
Sales of reserves-in-place – – – (77) – – – – (77)--------------------------------------------------------------------------------------------------------------------------------------------------------------------------------------------------------------------------------------------------------------------------------------------------------
– – – (145) (1) – 13 40 (93)
At 31 December 2006d
Developed – – – 1,460 52 – 1,087 170 2,769
Undeveloped – – – 735 23 – 184 52 994--------------------------------------------------------------------------------------------------------------------------------------------------------------------------------------------------------------------------------------------------------------------------------------------------------
– – – 2,195 75 – 1,271 222 3,763
a Proved reserves exclude royalties due to others, whether payable in cash or in kind where the royalty owner has a direct interest in the underlying production and theoption to make lifting and sales arrangements independently.
b Includes 178 billion cubic feet of natural gas consumed in operations, 147 billion cubic feet in subsidiaries, 31 billion cubic feet in equity-accounted entities and excludes8.3 billion cubic feet of produced non-hydrocarbon components which meet regulatory requirements for sales.
c Includes 3,537 billion cubic feet of natural gas in respect of the 30% minority interest in BP Trinidad and Tobago LLC.d Includes 99 billion cubic feet of natural gas in respect of the 7.77% minority interest in TNK-BP.

Filename: U54368_doc8.3d Time: 14:50:17 Date: 25/02/08
Checksum: -1892763095
BP ANNUAL REPORT AND ACCOUNTS 2007 181
Supplementary information on oil and natural gas continued
Movement in estimated net proved reserves 2005--------------------------------------------------------------------------------------------------------------------------------------------------------------------------------------------------------------------------------------------------------------------------------------------------------
Crude oila million barrels--------------------------------------------------------------------------------------------------------------------------------------------------------------------------------------------------------------------------------------------------------------------------------------------------------
Rest of Rest of AsiaUK Europe US Americas Pacific Africa Russia Other Total
--------------------------------------------------------------------------------------------------------------------------------------------------------------------------------------------------------------------------------------------------------------------------------------------------------
Subsidiaries
At 1 January 2005
Developed 559 231 2,041 311 65 204 – 62 3,473
Undeveloped 210 109 1,211 299 85 643 – 725 3,282--------------------------------------------------------------------------------------------------------------------------------------------------------------------------------------------------------------------------------------------------------------------------------------------------------
769 340 3,252 610 150 847 – 787 6,755
Changes attributable to
Revisions of previous estimates (31) (8) 103 (21) 21 (190) – (148) (274)
Purchases of reserves-in-place – – 2 – – – – –
Discoveries and extensions 11 – 40 3 11 83 – – 148
Improved recovery 32 21 217 1 – 2 – 7 280
Productionb (101) (27) (200) (53) (17) (64) – (34) (496)
Sales of reserves-in-place – (15) (1) (39) – – – – (--------------------------------------------------------------------------------------------------------------------------------------------------------------------------------------------------------------------------------------------------------------------------------------------------------
(89) (29) 161 (109) 15 (169) – (175) (395)
At 31 December 2005c
Developed 496 225 1,984 215 70 142 – 69 3,201
Undeveloped 184 86 1,429 286 95 536 – 543 3,159--------------------------------------------------------------------------------------------------------------------------------------------------------------------------------------------------------------------------------------------------------------------------------------------------------
680 311 3,413e 501 165 678 – 612 6,360
Equity-accounted entities (BP share)
At 1 January 2005
Developed – – – 204 1 – 1,863 592 2,660
Undeveloped – – – 125 – – 294 100 519--------------------------------------------------------------------------------------------------------------------------------------------------------------------------------------------------------------------------------------------------------------------------------------------------------
– – – 329 1 – 2,157 692 3,179
Changes attributable to
Revisions of previous estimates – – – 1 – – 319 119 439
Purchases of reserves-in-place – – – – – – – –
Discoveries and extensions – – – 2 – – – –
Improved recovery – – – 25 – – – –
Production – – – (26) – – (333) (57) (416)
Sales of reserves-in-place – – – – – – (24) – (--------------------------------------------------------------------------------------------------------------------------------------------------------------------------------------------------------------------------------------------------------------------------------------------------------
– – – 2 – – (38) 62
At 31 December 2005d
Developed – – – 207 1 – 1,688 590 2,486
Undeveloped – – – 124 – – 431 164 719--------------------------------------------------------------------------------------------------------------------------------------------------------------------------------------------------------------------------------------------------------------------------------------------------------
– – – 331 1 – 2,119 754 3,205
a Crude oil includes natural gas liquids (NGLs) and condensate. Proved reserves exclude royalties due to others whether payable in cash or in kind where the royalty ownerhas a direct interest in the underlying production and the option to make lifting and sales arrangements independently.
b Excludes NGLs from processing plants in which an interest is held of 58 thousand barrels a day.c Includes 818 million barrels of NGLs. Also includes 29 million barrels of crude oil in respect of the 30% minority interest in BP Trinidad and Tobago LLC.d Includes 33 million barrels of NGLs. Also includes 95 million barrels of crude oil in respect of the 4.47% minority interest in TNK-BP.e Proved reserves in the Prudhoe Bay field in Alaska include an estimated 85 million barrels upon which a net profits royalty will be payable over the life of the field under the
terms of the BP Prudhoe Bay Royalty Trust.
2
55)
–
2
25
24)
26
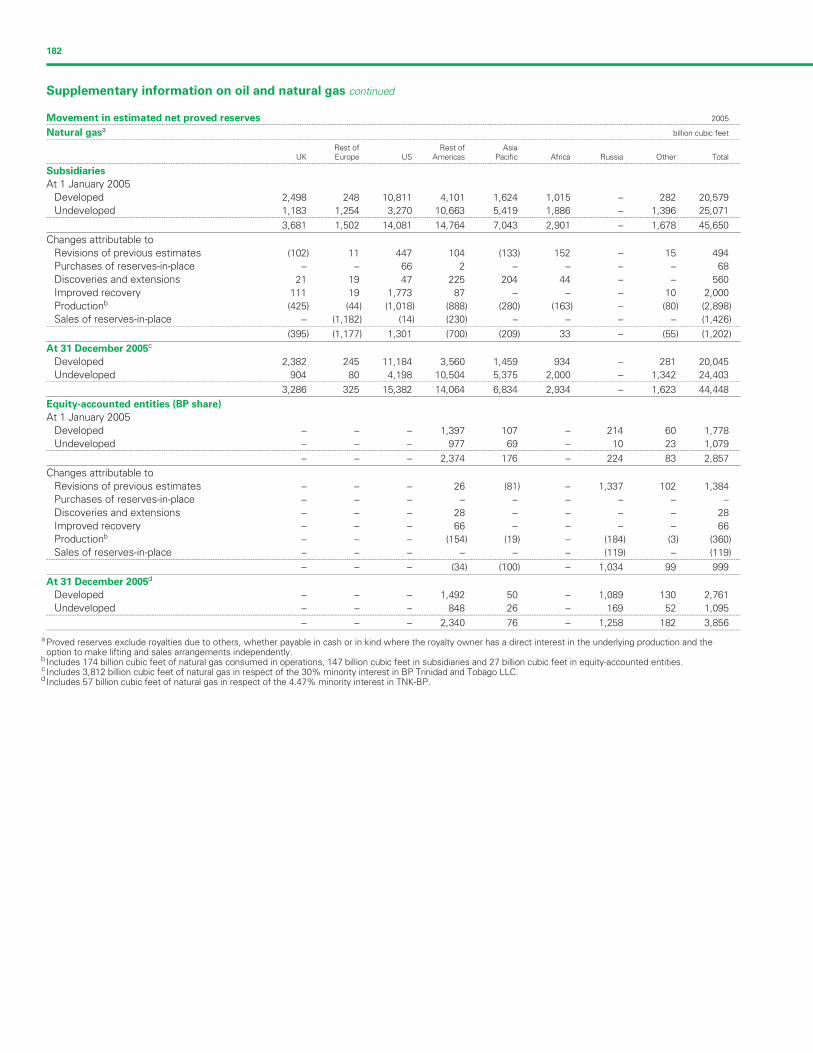
Filename: U54368_doc8.3d Time: 14:50:18 Date: 25/02/08
Checksum: -1262049667
182
Supplementary information on oil and natural gas continued
Movement in estimated net proved reserves 2005--------------------------------------------------------------------------------------------------------------------------------------------------------------------------------------------------------------------------------------------------------------------------------------------------------
Natural gasa billion cubic feet--------------------------------------------------------------------------------------------------------------------------------------------------------------------------------------------------------------------------------------------------------------------------------------------------------
Rest of Rest of AsiaUK Europe US Americas Pacific Africa Russia Other Total
--------------------------------------------------------------------------------------------------------------------------------------------------------------------------------------------------------------------------------------------------------------------------------------------------------
Subsidiaries
At 1 January 2005
Developed 2,498 248 10,811 4,101 1,624 1,015 – 282 20,579
Undeveloped 1,183 1,254 3,270 10,663 5,419 1,886 – 1,396 25,071--------------------------------------------------------------------------------------------------------------------------------------------------------------------------------------------------------------------------------------------------------------------------------------------------------
3,681 1,502 14,081 14,764 7,043 2,901 – 1,678 45,650
Changes attributable to
Revisions of previous estimates (102) 11 447 104 (133) 152 – 15 494
Purchases of reserves-in-place – – 66 2 – – – – 6
Discoveries and extensions 21 19 47 225 204 44 – – 560
Improved recovery 111 19 1,773 87 – – – 10 2,000
Productionb (425) (44) (1,018) (888) (280) (163) – (80) (2,898)
Sales of reserves-in-place – (1,182) (14) (230) – – – – (1,42--------------------------------------------------------------------------------------------------------------------------------------------------------------------------------------------------------------------------------------------------------------------------------------------------------
(395) (1,177) 1,301 (700) (209) 33 – (55) (1,202)
At 31 December 2005c
Developed 2,382 245 11,184 3,560 1,459 934 – 281 20,045
Undeveloped 904 80 4,198 10,504 5,375 2,000 – 1,342 24,403--------------------------------------------------------------------------------------------------------------------------------------------------------------------------------------------------------------------------------------------------------------------------------------------------------
3,286 325 15,382 14,064 6,834 2,934 – 1,623 44,448
Equity-accounted entities (BP share)
At 1 January 2005
Developed – – – 1,397 107 – 214 60 1,778
Undeveloped – – – 977 69 – 10 23 1,079--------------------------------------------------------------------------------------------------------------------------------------------------------------------------------------------------------------------------------------------------------------------------------------------------------
– – – 2,374 176 – 224 83 2,857
Changes attributable to
Revisions of previous estimates – – – 26 (81) – 1,337 102 1,384
Purchases of reserves-in-place – – – – – – – –
Discoveries and extensions – – – 28 – – – – 2
Improved recovery – – – 66 – – – – 6
Productionb – – – (154) (19) – (184) (3) (360)
Sales of reserves-in-place – – – – – – (119) – (11--------------------------------------------------------------------------------------------------------------------------------------------------------------------------------------------------------------------------------------------------------------------------------------------------------
– – – (34) (100) – 1,034 99 999
At 31 December 2005d
Developed – – – 1,492 50 – 1,089 130 2,761
Undeveloped – – – 848 26 – 169 52 1,095--------------------------------------------------------------------------------------------------------------------------------------------------------------------------------------------------------------------------------------------------------------------------------------------------------
– – – 2,340 76 – 1,258 182 3,856
a Proved reserves exclude royalties due to others, whether payable in cash or in kind where the royalty owner has a direct interest in the underlying production and theoption to make lifting and sales arrangements independently.
b Includes 174 billion cubic feet of natural gas consumed in operations, 147 billion cubic feet in subsidiaries and 27 billion cubic feet in equity-accounted entities.c Includes 3,812 billion cubic feet of natural gas in respect of the 30% minority interest in BP Trinidad and Tobago LLC.d Includes 57 billion cubic feet of natural gas in respect of the 4.47% minority interest in TNK-BP.
8
6)
–
8
6
9)
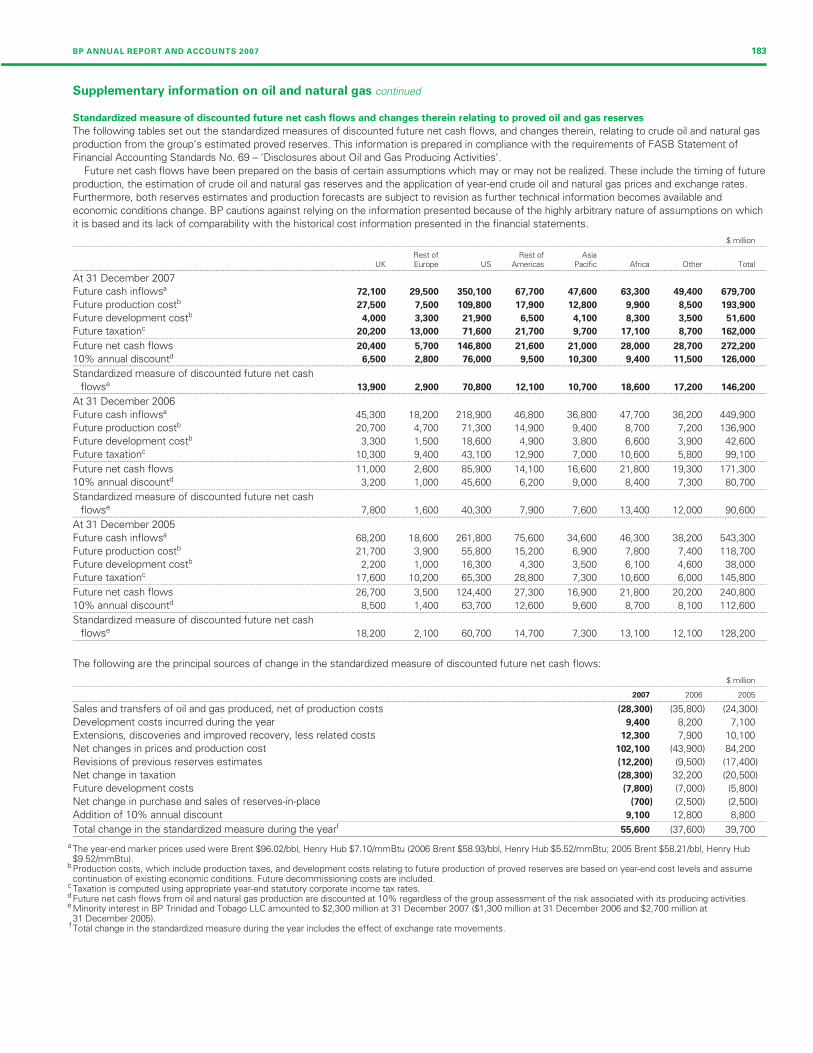
Filename: U54368_doc8.3d Time: 14:50:18 Date: 25/02/08
Checksum: -492816277
BP ANNUAL REPORT AND ACCOUNTS 2007 183
Supplementary information on oil and natural gas continued
Standardized measure of discounted future net cash flows and changes therein relating to proved oil and gas reserves
The following tables set out the standardized measures of discounted future net cash flows, and changes therein, relating to crude oil and natural gas
production from the group’s estimated proved reserves. This information is prepared in compliance with the requirements of FASB Statement of
Financial Accounting Standards No. 69 – ‘Disclosures about Oil and Gas Producing Activities’.
Future net cash flows have been prepared on the basis of certain assumptions which may or may not be realized. These include the timing of future
production, the estimation of crude oil and natural gas reserves and the application of year-end crude oil and natural gas prices and exchange rates.
Furthermore, both reserves estimates and production forecasts are subject to revision as further technical information becomes available and
economic conditions change. BP cautions against relying on the information presented because of the highly arbitrary nature of assumptions on which
it is based and its lack of comparability with the historical cost information presented in the financial statements.
$ million--------------------------------------------------------------------------------------------------------------------------------------------------------------------------------------------------------------------------------------------------------------------------------------------------------
Rest of Rest of AsiaUK Europe US Americas Pacific Africa Other Total
--------------------------------------------------------------------------------------------------------------------------------------------------------------------------------------------------------------------------------------------------------------------------------------------------------
At 31 December 2007
Future cash inflowsa 72,100 29,500 350,100 67,700 47,600 63,300 49,400 679,700
Future production costb 27,500 7,500 109,800 17,900 12,800 9,900 8,500 193,900
Future development costb 4,000 3,300 21,900 6,500 4,100 8,300 3,500 51,600
Future taxationc 20,200 13,000 71,600 21,700 9,700 17,100 8,700 162,000--------------------------------------------------------------------------------------------------------------------------------------------------------------------------------------------------------------------------------------------------------------------------------------------------------
Future net cash flows 20,400 5,700 146,800 21,600 21,000 28,000 28,700 272,200
10% annual discountd 6,500 2,800 76,000 9,500 10,300 9,400 11,500 126,000--------------------------------------------------------------------------------------------------------------------------------------------------------------------------------------------------------------------------------------------------------------------------------------------------------
Standardized measure of discounted future net cash
flowse 13,900 2,900 70,800 12,100 10,700 18,600 17,200 146,200--------------------------------------------------------------------------------------------------------------------------------------------------------------------------------------------------------------------------------------------------------------------------------------------------------
At 31 December 2006
Future cash inflowsa 45,300 18,200 218,900 46,800 36,800 47,700 36,200 449,900
Future production costb 20,700 4,700 71,300 14,900 9,400 8,700 7,200 136,900
Future development costb 3,300 1,500 18,600 4,900 3,800 6,600 3,900 42,600
Future taxationc 10,300 9,400 43,100 12,900 7,000 10,600 5,800 99,100--------------------------------------------------------------------------------------------------------------------------------------------------------------------------------------------------------------------------------------------------------------------------------------------------------
Future net cash flows 11,000 2,600 85,900 14,100 16,600 21,800 19,300 171,300
10% annual discountd 3,200 1,000 45,600 6,200 9,000 8,400 7,300 80,700--------------------------------------------------------------------------------------------------------------------------------------------------------------------------------------------------------------------------------------------------------------------------------------------------------
Standardized measure of discounted future net cash
flowse 7,800 1,600 40,300 7,900 7,600 13,400 12,000 90,600--------------------------------------------------------------------------------------------------------------------------------------------------------------------------------------------------------------------------------------------------------------------------------------------------------
At 31 December 2005
Future cash inflowsa 68,200 18,600 261,800 75,600 34,600 46,300 38,200 543,300
Future production costb 21,700 3,900 55,800 15,200 6,900 7,800 7,400 118,700
Future development costb 2,200 1,000 16,300 4,300 3,500 6,100 4,600 38,000
Future taxationc 17,600 10,200 65,300 28,800 7,300 10,600 6,000 145,800--------------------------------------------------------------------------------------------------------------------------------------------------------------------------------------------------------------------------------------------------------------------------------------------------------
Future net cash flows 26,700 3,500 124,400 27,300 16,900 21,800 20,200 240,800
10% annual discountd 8,500 1,400 63,700 12,600 9,600 8,700 8,100 112,600--------------------------------------------------------------------------------------------------------------------------------------------------------------------------------------------------------------------------------------------------------------------------------------------------------
Standardized measure of discounted future net cash
flowse 18,200 2,100 60,700 14,700 7,300 13,100 12,100 128,200
The following are the principal sources of change in the standardized measure of discounted future net cash flows:
$ million--------------------------------------------------------------------------------------------------------------------------------------------------------------------------------------------------------------------------------------------------------------------------------------------------------
2007 2006 2005--------------------------------------------------------------------------------------------------------------------------------------------------------------------------------------------------------------------------------------------------------------------------------------------------------
Sales and transfers of oil and gas produced, net of production costs (28,300) (35,800) (24,300)
Development costs incurred during the year 9,400 8,200 7,100
Extensions, discoveries and improved recovery, less related costs 12,300 7,900 10,100
Net changes in prices and production cost 102,100 (43,900) 84,200
Revisions of previous reserves estimates (12,200) (9,500) (17,400)
Net change in taxation (28,300) 32,200 (20,500)
Future development costs (7,800) (7,000) (5,800)
Net change in purchase and sales of reserves-in-place (700) (2,500) (2,500)
Addition of 10% annual discount 9,100 12,800 8,800--------------------------------------------------------------------------------------------------------------------------------------------------------------------------------------------------------------------------------------------------------------------------------------------------------
Total change in the standardized measure during the yearf 55,600 (37,600) 39,700
a The year-end marker prices used were Brent $96.02/bbl, Henry Hub $7.10/mmBtu (2006 Brent $58.93/bbl, Henry Hub $5.52/mmBtu; 2005 Brent $58.21/bbl, Henry Hub$9.52/mmBtu).
b Production costs, which include production taxes, and development costs relating to future production of proved reserves are based on year-end cost levels and assumecontinuation of existing economic conditions. Future decommissioning costs are included.
c Taxation is computed using appropriate year-end statutory corporate income tax rates.d Future net cash flows from oil and natural gas production are discounted at 10% regardless of the group assessment of the risk associated with its producing activities.e Minority interest in BP Trinidad and Tobago LLC amounted to $2,300 million at 31 December 2007 ($1,300 million at 31 December 2006 and $2,700 million at
31 December 2005).f Total change in the standardized measure during the year includes the effect of exchange rate movements.
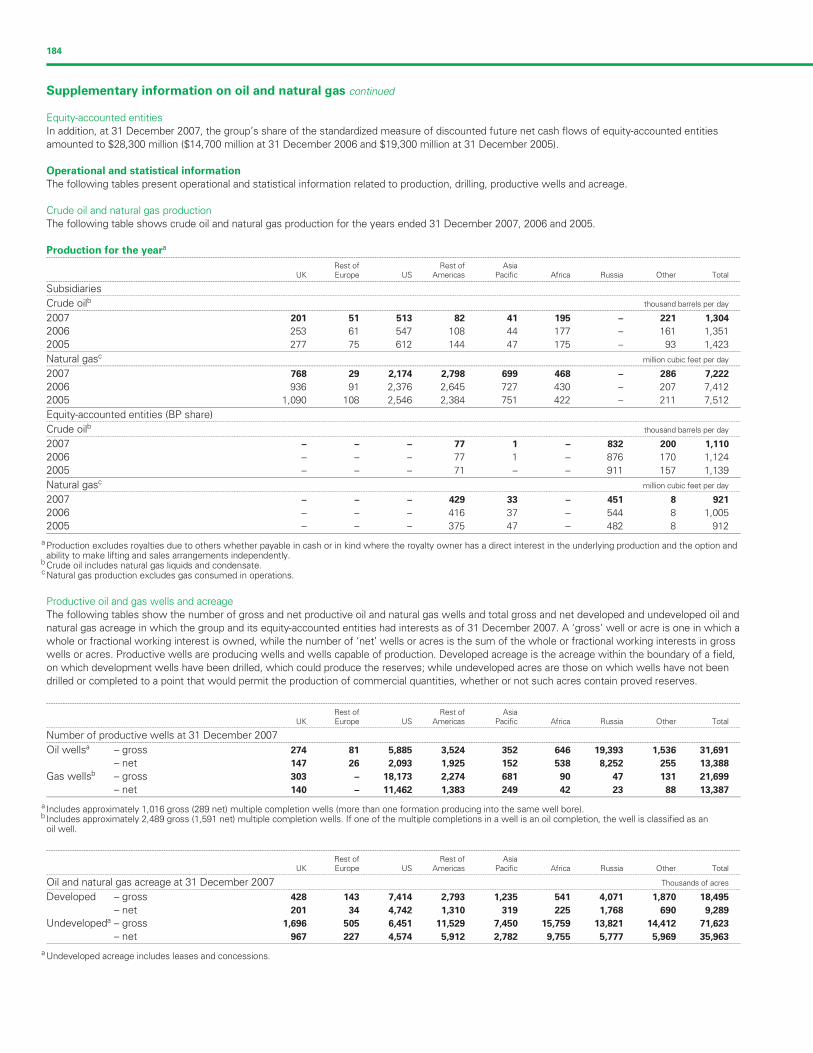
Filename: U54368_doc8.3d Time: 14:50:18 Date: 25/02/08
Checksum: 1901448514
184
Supplementary information on oil and natural gas continued
Equity-accounted entities
In addition, at 31 December 2007, the group’s share of the standardized measure of discounted future net cash flows of equity-accounted entities
amounted to $28,300 million ($14,700 million at 31 December 2006 and $19,300 million at 31 December 2005).
Operational and statistical information
The following tables present operational and statistical information related to production, drilling, productive wells and acreage.
Crude oil and natural gas production
The following table shows crude oil and natural gas production for the years ended 31 December 2007, 2006 and 2005.
Production for the yeara--------------------------------------------------------------------------------------------------------------------------------------------------------------------------------------------------------------------------------------------------------------------------------------------------------
Rest of Rest of AsiaUK Europe US Americas Pacific Africa Russia Other Total
--------------------------------------------------------------------------------------------------------------------------------------------------------------------------------------------------------------------------------------------------------------------------------------------------------
Subsidiaries--------------------------------------------------------------------------------------------------------------------------------------------------------------------------------------------------------------------------------------------------------------------------------------------------------
Crude oilb thousand barrels per day--------------------------------------------------------------------------------------------------------------------------------------------------------------------------------------------------------------------------------------------------------------------------------------------------------
2007 201 51 513 82 41 195 – 221 1,304
2006 253 61 547 108 44 177 – 161 1,351
2005 277 75 612 144 47 175 – 93 1,423
Natural gasc million cubic feet per day--------------------------------------------------------------------------------------------------------------------------------------------------------------------------------------------------------------------------------------------------------------------------------------------------------
2007 768 29 2,174 2,798 699 468 – 286 7,222
2006 936 91 2,376 2,645 727 430 – 207 7,412
2005 1,090 108 2,546 2,384 751 422 – 211 7,512
Equity-accounted entities (BP share)--------------------------------------------------------------------------------------------------------------------------------------------------------------------------------------------------------------------------------------------------------------------------------------------------------
Crude oilb thousand barrels per day--------------------------------------------------------------------------------------------------------------------------------------------------------------------------------------------------------------------------------------------------------------------------------------------------------
2007 – – – 77 1 – 832 200 1,110
2006 – – – 77 1 – 876 170 1,124
2005 – – – 71 – – 911 157 1,139
Natural gascmillion cubic feet per day
--------------------------------------------------------------------------------------------------------------------------------------------------------------------------------------------------------------------------------------------------------------------------------------------------------
2007 – – – 429 33 – 451 8 921
2006 – – – 416 37 – 544 8 1,005
2005 – – – 375 47 – 482 8 912
a Production excludes royalties due to others whether payable in cash or in kind where the royalty owner has a direct interest in the underlying production and the option andability to make lifting and sales arrangements independently.
b Crude oil includes natural gas liquids and condensate.c Natural gas production excludes gas consumed in operations.
Productive oil and gas wells and acreage
The following tables show the number of gross and net productive oil and natural gas wells and total gross and net developed and undeveloped oil and
natural gas acreage in which the group and its equity-accounted entities had interests as of 31 December 2007. A ‘gross’ well or acre is one in which a
whole or fractional working interest is owned, while the number of ‘net’ wells or acres is the sum of the whole or fractional working interests in gross
wells or acres. Productive wells are producing wells and wells capable of production. Developed acreage is the acreage within the boundary of a field,
on which development wells have been drilled, which could produce the reserves; while undeveloped acres are those on which wells have not been
drilled or completed to a point that would permit the production of commercial quantities, whether or not such acres contain proved reserves.
--------------------------------------------------------------------------------------------------------------------------------------------------------------------------------------------------------------------------------------------------------------------------------------------------------
Rest of Rest of AsiaUK Europe US Americas Pacific Africa Russia Other Total
--------------------------------------------------------------------------------------------------------------------------------------------------------------------------------------------------------------------------------------------------------------------------------------------------------
Number of productive wells at 31 December 2007--------------------------------------------------------------------------------------------------------------------------------------------------------------------------------------------------------------------------------------------------------------------------------------------------------
Oil wellsa – gross 274 81 5,885 3,524 352 646 19,393 1,536 31,691
– net 147 26 2,093 1,925 152 538 8,252 255 13,388
Gas wellsb – gross 303 – 18,173 2,274 681 90 47 131 21,699
– net 140 – 11,462 1,383 249 42 23 88 13,387
a Includes approximately 1,016 gross (289 net) multiple completion wells (more than one formation producing into the same well bore).b Includes approximately 2,489 gross (1,591 net) multiple completion wells. If one of the multiple completions in a well is an oil completion, the well is classified as an
oil well.
--------------------------------------------------------------------------------------------------------------------------------------------------------------------------------------------------------------------------------------------------------------------------------------------------------
Rest of Rest of AsiaUK Europe US Americas Pacific Africa Russia Other Total
--------------------------------------------------------------------------------------------------------------------------------------------------------------------------------------------------------------------------------------------------------------------------------------------------------
Oil and natural gas acreage at 31 December 2007 Thousands of acres--------------------------------------------------------------------------------------------------------------------------------------------------------------------------------------------------------------------------------------------------------------------------------------------------------
Developed – gross 428 143 7,414 2,793 1,235 541 4,071 1,870 18,495
– net 201 34 4,742 1,310 319 225 1,768 690 9,289
Undevelopeda – gross 1,696 505 6,451 11,529 7,450 15,759 13,821 14,412 71,623
– net 967 227 4,574 5,912 2,782 9,755 5,777 5,969 35,963
a Undeveloped acreage includes leases and concessions.

Filename: U54368_doc8.3d Time: 14:50:19 Date: 25/02/08
Checksum: 801542512
BP ANNUAL REPORT AND ACCOUNTS 2007 185
Supplementary information on oil and natural gas continued
Net oil and gas wells completed or abandoned
The following table shows the number of net productive and dry exploratory and development oil and natural gas wells completed or abandoned in the
years indicated by the group and its equity-accounted entities. Productive wells include wells in which hydrocarbons were encountered and the drilling
or completion of which, in the case of exploratory wells, has been suspended pending further drilling or evaluation. A dry well is one found to be
incapable of producing hydrocarbons in sufficient quantities to justify completion.
--------------------------------------------------------------------------------------------------------------------------------------------------------------------------------------------------------------------------------------------------------------------------------------------------------
Rest of Rest of AsiaUK Europe US Americas Pacific Africa Russia Other Total
--------------------------------------------------------------------------------------------------------------------------------------------------------------------------------------------------------------------------------------------------------------------------------------------------------
2007
Exploratory
Productive 1.6 – 4.1 0.5 1.1 6.1 16.0 1.7 31.1
Dry – – 0.7 0.5 0.4 1.6 9.0 1.0 13.2
Development
Productive 0.4 0.8 401.2 46.0 13.8 15.3 246.0 15.8 739.3
Dry 0.6 – 4.2 8.8 – – 9.5 – 23.1
2006
Exploratory
Productive 0.1 0.1 2.9 0.5 1.0 3.2 15.6 1.4 24.8
Dry – – 7.4 1.0 1.5 0.5 5.7 0.3 16.4
Development
Productive 4.9 1.6 418.8 154.0 12.4 23.8 227.2 14.5 857.2
Dry – – 4.5 5.0 0.2 – 20.8 1.0 31.5
2005
Exploratory
Productive 0.5 0.8 10.7 2.0 0.3 2.0 14.5 – 30.8
Dry 0.3 – 6.4 1.0 0.3 1.3 5.2 – 14.5
Development
Productive 10.6 3.5 473.9 151.7 22.7 17.9 212.8 12.1 905.2
Dry – 0.3 5.0 3.3 0.4 1.0 17.7 0.3 28.0
Drilling and production activities in progress
The following table shows the number of exploratory and development oil and natural gas wells in the process of being drilled by the group and its
equity-accounted entities as of 31 December 2007. Suspended development wells and long-term suspended exploratory wells are also included in
the table.
--------------------------------------------------------------------------------------------------------------------------------------------------------------------------------------------------------------------------------------------------------------------------------------------------------
Rest of Rest of AsiaUK Europe US Americas Pacific Africa Russia Other Total
--------------------------------------------------------------------------------------------------------------------------------------------------------------------------------------------------------------------------------------------------------------------------------------------------------
At 31 December 2007
Exploratory
Gross – 1 26 5 1 3 28 2 66
Net – 0.5 12.1 1.9 0.2 1.3 13.5 0.5 30.0
Development
Gross 6 2 258 39 12 25 30 9 381
Net 2.5 0.5 130.5 23.1 5.0 8.9 12.5 2.7 185.7
Filename: U54368_doc8.3d Time: 14:50:19 Date: 25/02/08
Checksum: 371542553
186
Parent company financial statements of BP p.l.c.
Statement of directors’ responsibilities in respect of the parent company financial statements
The directors are responsible for preparing the financial statements in accordance with applicable United Kingdom law and United Kingdom generally
accepted accounting practice.
Company law requires the directors to prepare financial statements for each financial year that give a true and fair view of the state of affairs of the
company. In preparing these financial statements, the directors are required:
– To select suitable accounting policies and then apply them consistently.
– To make judgements and estimates that are reasonable and prudent.
– To state whether applicable accounting standards have been followed, subject to any material departures disclosed and explained in the financial
statements.
– To prepare the financial statements on the going concern basis unless it is inappropriate to presume that the group will continue in business.
The directors are also responsible for keeping proper accounting records that disclose with reasonable accuracy at any time the financial position of
the company and enable them to ensure that the financial statements comply with the Companies Act 1985. They are also responsible for
safeguarding the assets of the company and hence for taking reasonable steps for the prevention and detection of fraud and other irregularities.
Having made the requisite enquiries, so far as the directors are aware, there is no relevant audit information (as defined by Section 234ZA of the
Companies Act 1985) of which the company’s auditors are unaware, and the directors have taken all the steps they ought to have taken to make
themselves aware of any relevant audit information and to establish that the company’s auditors are aware of that information.
BP ANNUAL REPORT AND ACCOUNTS 2007 187
Independent auditor’s report to the members of BP p.l.c.
We have audited the parent company financial statements of BP p.l.c. for the year ended 31 December 2007 which comprise the company balance
sheet, the company cash flow statement, the company statement of total recognized gains and losses and the related notes 1 to 13. These parent
company financial statements have been prepared under the accounting policies set out therein. We have also audited the information in the
Directors’ Remuneration Report that is described as having been audited.
We have reported separately on the consolidated financial statements of BP p.l.c. for the year ended 31 December 2007.
This report is made solely to the company’s members, as a body, in accordance with Section 235 of the Companies Act 1985. Our audit work has
been undertaken so that we might state to the company’s members those matters we are required to state to them in an auditors’ report and for no
other purpose. To the fullest extent permitted by law, we do not accept or assume responsibility to anyone other than the company and the
company’s members as a body, for our audit work, for this report, or for the opinions we have formed.
Respective responsibilities of directors and auditors
The directors’ responsibilities for preparing the Annual Report, the Directors’ Remuneration Report and the parent company financial statements in
accordance with applicable United Kingdom law and accounting standards (United Kingdom generally accepted accounting practice) are set out in the
Statement of Directors’ Responsibilities.
Our responsibility is to audit the parent company financial statements and the part of the Directors’ Remuneration Report to be audited in
accordance with relevant legal and regulatory requirements and International Standards on Auditing (UK and Ireland).
We report to you our opinion as to whether the parent company financial statements give a true and fair view and whether the parent company
financial statements and the part of the Directors’ Remuneration Report to be audited have been properly prepared in accordance with the Companies
Act 1985. We also report to you whether in our opinion the information given in the directors’ report is consistent with the financial statements.
In addition we report to you if, in our opinion, the company has not kept proper accounting records, if we have not received all the information and
explanations we require for our audit, or if information specified by law regarding directors’ remuneration and other transactions is not disclosed.
We read other information contained in the Annual Report and consider whether it is consistent with the audited parent company financial
statements. The other information comprises the Directors’ report and the unaudited part of the Directors’ Remuneration Report. We consider the
implications for our report if we become aware of any apparent misstatements or material inconsistencies with the parent company financial
statements. Our responsibilities do not extend to any other information.
Basis of audit opinion
We conducted our audit in accordance with International Standards on Auditing (UK and Ireland) issued by the Auditing Practices Board. An audit
includes examination, on a test basis, of evidence relevant to the amounts and disclosures in the parent company financial statements and the part of
the Directors’ Remuneration Report to be audited. It also includes an assessment of the significant estimates and judgements made by the directors
in the preparation of the parent company financial statements, and of whether the accounting policies are appropriate to the company’s
circumstances, consistently applied and adequately disclosed.
We planned and performed our audit so as to obtain all the information and explanations which we considered necessary in order to provide us with
sufficient evidence to give reasonable assurance that the parent company financial statements and the part of the Directors’ Remuneration Report to
be audited are free from material misstatement, whether caused by fraud or other irregularity or error. In forming our opinion we also evaluated the
overall adequacy of the presentation of information in the parent company financial statements and the part of the Directors’ Remuneration Report to
be audited.
Opinion
In our opinion:
– The parent company financial statements give a true and fair view, in accordance with United Kingdom generally accepted accounting practice, of
the state of the company’s affairs as at 31 December 2007.
– The parent company financial statements and the part of the Directors’ Remuneration Report to be audited have been properly prepared in
accordance with the Companies Act 1985.
– The information given in the directors’ report is consistent with the parent company financial statements.
Ernst & Young LLP
Registered auditor
London
22 February 2008
The maintenance and integrity of the BP p.l.c. website are the responsibility of the directors; the work carried out by the auditors does not involve
consideration of these matters and, accordingly, the auditors accept no responsibility for any changes that may have occurred to the financial
statements since they were initially presented on the website or any other website they are presented on.
Legislation in the United Kingdom governing the preparation and dissemination of financial statements may differ from legislation in other
jurisdictions.
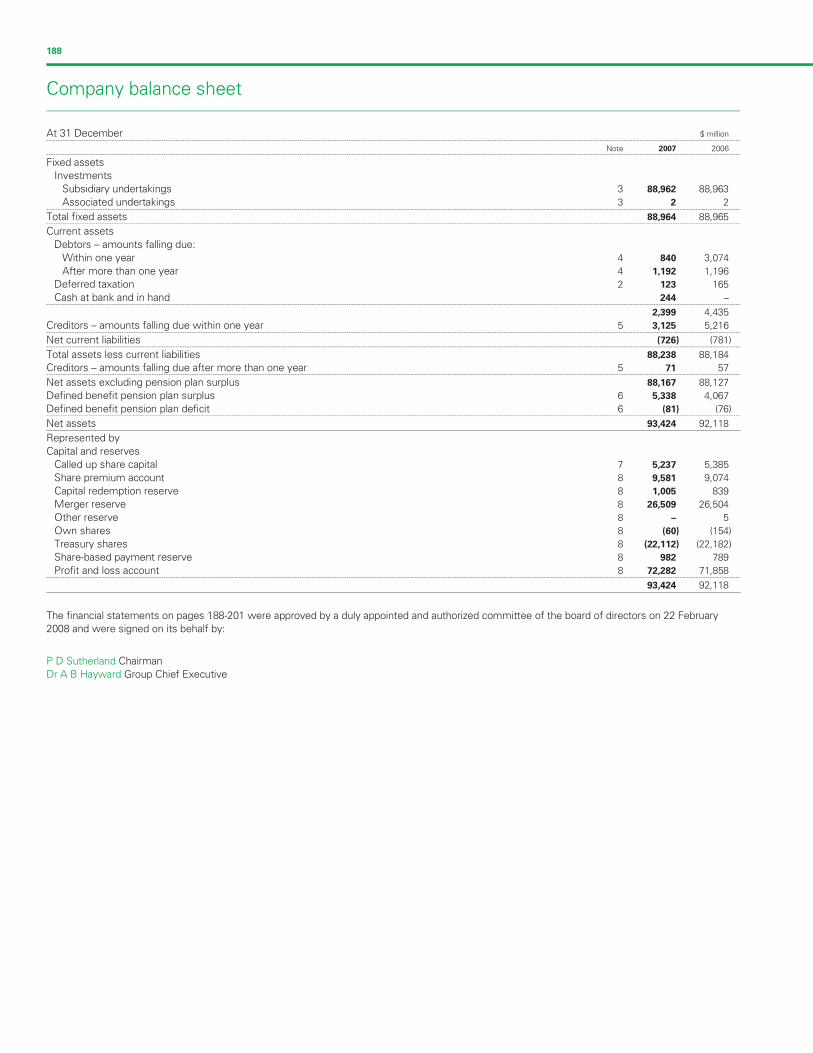
Filename: U54368_doc8.3d Time: 14:50:19 Date: 25/02/08
Checksum: -1868594696
188
Company balance sheet
At 31 December $ million--------------------------------------------------------------------------------------------------------------------------------------------------------------------------------------------------------------------------------------------------------------------------------------------------------
Note 2007 2006--------------------------------------------------------------------------------------------------------------------------------------------------------------------------------------------------------------------------------------------------------------------------------------------------------
Fixed assets
Investments
Subsidiary undertakings 3 88,962 88,963
Associated undertakings 3 2 2--------------------------------------------------------------------------------------------------------------------------------------------------------------------------------------------------------------------------------------------------------------------------------------------------------
Total fixed assets 88,964 88,965--------------------------------------------------------------------------------------------------------------------------------------------------------------------------------------------------------------------------------------------------------------------------------------------------------
Current assets
Debtors – amounts falling due:
Within one year 4 840 3,074
After more than one year 4 1,192 1,196
Deferred taxation 2 123 165
Cash at bank and in hand 244 –--------------------------------------------------------------------------------------------------------------------------------------------------------------------------------------------------------------------------------------------------------------------------------------------------------
2,399 4,435
Creditors – amounts falling due within one year 5 3,125 5,216--------------------------------------------------------------------------------------------------------------------------------------------------------------------------------------------------------------------------------------------------------------------------------------------------------
Net current liabilities (726) (781)--------------------------------------------------------------------------------------------------------------------------------------------------------------------------------------------------------------------------------------------------------------------------------------------------------
Total assets less current liabilities 88,238 88,184
Creditors – amounts falling due after more than one year 5 71 57--------------------------------------------------------------------------------------------------------------------------------------------------------------------------------------------------------------------------------------------------------------------------------------------------------
Net assets excluding pension plan surplus 88,167 88,127
Defined benefit pension plan surplus 6 5,338 4,067
Defined benefit pension plan deficit 6 (81) (76)--------------------------------------------------------------------------------------------------------------------------------------------------------------------------------------------------------------------------------------------------------------------------------------------------------
Net assets 93,424 92,118
Represented by
Capital and reserves
Called up share capital 7 5,237 5,385
Share premium account 8 9,581 9,074
Capital redemption reserve 8 1,005 839
Merger reserve 8 26,509 26,504
Other reserve 8 – 5
Own shares 8 (60) (154)
Treasury shares 8 (22,112) (22,182)
Share-based payment reserve 8 982 789
Profit and loss account 8 72,282 71,858--------------------------------------------------------------------------------------------------------------------------------------------------------------------------------------------------------------------------------------------------------------------------------------------------------
93,424 92,118
The financial statements on pages 188-201 were approved by a duly appointed and authorized committee of the board of directors on 22 February
2008 and were signed on its behalf by:
P D Sutherland Chairman
Dr A B Hayward Group Chief Executive

Filename: U54368_doc8.3d Time: 14:50:19 Date: 25/02/08
Checksum: -133248631
BP ANNUAL REPORT AND ACCOUNTS 2007 189
Company cash flow statement
For the year ended 31 December $ million--------------------------------------------------------------------------------------------------------------------------------------------------------------------------------------------------------------------------------------------------------------------------------------------------------
Note 2007 2006 2005--------------------------------------------------------------------------------------------------------------------------------------------------------------------------------------------------------------------------------------------------------------------------------------------------------
Net cash (outflow) inflow from operating activities 9 (833) (3,703) (1,108)--------------------------------------------------------------------------------------------------------------------------------------------------------------------------------------------------------------------------------------------------------------------------------------------------------
Servicing of finance and returns on investments
Interest received 202 177 110
Interest paid (381) (702) (249)
Dividends received 16,416 24,859 21,087--------------------------------------------------------------------------------------------------------------------------------------------------------------------------------------------------------------------------------------------------------------------------------------------------------
Net cash inflow from servicing of finance and returns on investments 16,237 24,334 20,948--------------------------------------------------------------------------------------------------------------------------------------------------------------------------------------------------------------------------------------------------------------------------------------------------------
Tax paid (1) (3) (8)--------------------------------------------------------------------------------------------------------------------------------------------------------------------------------------------------------------------------------------------------------------------------------------------------------
Capital expenditure and financial investment
Payments for fixed assets – investments (7) (1,397) (2,929)
Proceeds from sale of fixed assets – investments 8 2,240 519--------------------------------------------------------------------------------------------------------------------------------------------------------------------------------------------------------------------------------------------------------------------------------------------------------
Net cash inflow (outflow) for capital expenditure and financial investment 1 843 (2,410)--------------------------------------------------------------------------------------------------------------------------------------------------------------------------------------------------------------------------------------------------------------------------------------------------------
Equity dividends paid (8,106) (7,686) (7,359)--------------------------------------------------------------------------------------------------------------------------------------------------------------------------------------------------------------------------------------------------------------------------------------------------------
Net cash inflow before financing 7,298 13,785 10,063--------------------------------------------------------------------------------------------------------------------------------------------------------------------------------------------------------------------------------------------------------------------------------------------------------
Financing
Issue of ordinary share capital for TNK-BP – 1,250 1,250
Other share-based payment movements 464 422 283
Repurchase of ordinary share capital (7,497) (15,481) (11,597)--------------------------------------------------------------------------------------------------------------------------------------------------------------------------------------------------------------------------------------------------------------------------------------------------------
Net cash outflow from financing (7,033) (13,809) (10,064)--------------------------------------------------------------------------------------------------------------------------------------------------------------------------------------------------------------------------------------------------------------------------------------------------------
Increase (decrease) in cash 9 265 (24) (1)
Company statement of total recognized gains and losses
For the year ended 31 December $ million--------------------------------------------------------------------------------------------------------------------------------------------------------------------------------------------------------------------------------------------------------------------------------------------------------
2007 2006 2005--------------------------------------------------------------------------------------------------------------------------------------------------------------------------------------------------------------------------------------------------------------------------------------------------------
Profit for the year 16,013 23,628 21,141
Currency translation differences 89 558 (283)
Actuarial gain relating to pensions 6 698 1,120 1,159
Tax on actuarial gain relating to pensions 2 (195) (336) (348)--------------------------------------------------------------------------------------------------------------------------------------------------------------------------------------------------------------------------------------------------------------------------------------------------------
Total recognized gains and losses relating to the year 16,605 24,970 21,669
Filename: U54368_doc8.3d Time: 14:50:19 Date: 25/02/08
Checksum: 1895124334
190
Notes on financial statements
1 Accounting policies
Accounting standards
These accounts are prepared in accordance with applicable UK accounting standards.
Accounting convention
The accounts are prepared under the historical cost convention.
Foreign currency transactions
The functional currency is the currency of the primary economic environment in which an entity operates and is normally the currency in which the
entity generates cash. Foreign currency transactions are booked in the functional currency at the exchange rate ruling on the date of transaction.
Foreign currency monetary assets and liabilities are translated into the functional currency at rates of exchange ruling at the balance sheet date.
Exchange differences are included in profit for the year. Exchange adjustments arising when the opening net assets and the profits for the year
retained by non-US dollar functional currency branches are translated into US dollars are taken to a separate component of equity and reported in the
statement of total recognized gains and losses.
Investments
Investments in subsidiaries and associated undertakings are held at cost. The company assesses investments for impairment whenever events or
changes in circumstances indicate that the carrying value of an investment may not be recoverable. If any such indication of impairment exists, the
company makes an estimate of its recoverable amount. Where the carrying amount of an investment exceeds its recoverable amount, the investment
is considered impaired and is written down to its recoverable amount.
Share-based payments
Equity-settled transactions
The cost of equity-settled transactions with employees is measured by reference to the fair value at the date at which they are granted and is
recognized as an expense over the vesting period, which ends on the date on which the relevant employees become fully entitled to the award. Fair
value is determined by using an appropriate valuation model. In valuing equity-settled transactions, no account is taken of any vesting conditions, other
than conditions linked to the price of the shares of the company (market conditions).
No expense is recognized for awards that do not ultimately vest, except for awards where vesting is conditional upon a market condition, which are
treated as vesting irrespective of whether or not the market condition is satisfied, provided that all other performance conditions are satisfied.
At each balance sheet date before vesting, the cumulative expense is calculated, representing the extent to which the vesting period has expired
and management’s best estimate of the achievement or otherwise of non-market conditions and number of equity instruments that will ultimately
vest or, in the case of an instrument subject to a market condition, be treated as vesting as described above. The movement in cumulative expense
since the previous balance sheet date is recognized in the income statement, with a corresponding entry in equity.
Where the terms of an equity-settled award are modified or a new award is designated as replacing a cancelled or settled award, the cost based on
the original award terms continues to be recognized over the original vesting period. In addition, an expense is recognized over the remainder of the
new vesting period for the incremental fair value of any modification, based on the difference between the fair value of the original award and the fair
value of the modified award, both as measured on the date of the modification. No reduction is recognized if this difference is negative.
Where an equity-settled award is cancelled, it is treated as if it had vested on the date of cancellation, and any cost not yet recognized in the income
statement for the award is expensed immediately. Any compensation paid up to the fair value of the award at the cancellation or settlement date is
deducted from equity, with any excess over fair value being treated as an expense in the income statement.
Cash-settled transactions
The cost of cash-settled transactions is measured at fair value using an appropriate option valuation model.
Fair value is established initially at the grant date and at each balance sheet date thereafter until the awards are settled. During the vesting period a
liability is recognized representing the product of the fair value of the award and the portion of the vesting period expired as at the balance sheet date.
From the end of the vesting period until settlement, the liability represents the full fair value of the award as at the balance sheet date. Changes in the
carrying amount for the liability are recognized in profit or loss for the period.
Pensions and other post-retirement benefits
For defined benefit pension and other post-retirement benefit plans, plan assets are measured at fair value and plan liabilities are measured on an
actuarial basis using the projected unit credit method and discounted at an interest rate equivalent to the current rate of return on a high-quality
corporate bond of equivalent currency and term to the plan liabilities. Full actuarial valuations are obtained at least every three years and are updated at
each balance sheet date. The resulting surplus or deficit, net of taxation thereon, is presented separately above the total for net assets on the face of
the balance sheet.
The service cost of providing pension and other post-retirement benefits to employees for the year is charged to the income statement.
The cost of making improvements to pension and other post-retirement benefits is recognized in the income statement immediately when the
company becomes committed to the change.
When a settlement (eliminating all obligations for benefits already accrued) or a curtailment (reducing future obligations as a result of a material
reduction in the scheme membership or a reduction in future entitlement) occurs, the obligation and related plan assets are remeasured using current
actuarial assumptions and the resultant gain or loss recognized in the income statement during the period in which the settlement or curtailment
occurs.
A charge representing the unwinding of the discount on the plan liabilities during the year is included within other finance income.

Filename: U54368_doc8.3d Time: 14:50:20 Date: 25/02/08
Checksum: 1547938009
BP ANNUAL REPORT AND ACCOUNTS 2007 191
1 Accounting policies continued
A credit representing the expected return on the plan assets during the year is included within other finance income. This credit is based on an
assessment made at the beginning of the year of long-term market returns on plan assets, adjusted for the effect on the fair value of plan assets of
contributions received and benefits paid during the year.
Actuarial gains and losses may result from: differences between the expected return and the actual return on plan assets; differences between the
actuarial assumptions underlying the plan liabilities and actual experience during the year; or changes in the actuarial assumptions used in the valuation
of the plan liabilities. Actuarial gains and losses, and taxation thereon, are recognized in the statement of total recognized gains and losses.
Deferred taxation
Deferred tax is recognized in respect of all timing differences that have originated but not reversed at the balance sheet date where transactions or
events have occurred at that date that will result in an obligation to pay more, or a right to pay less, tax in the future.
Deferred tax assets are recognized only to the extent that it is considered more likely than not that there will be suitable taxable profits from which
the underlying timing differences can be deducted.
Deferred tax is measured on an undiscounted basis at the tax rates that are expected to apply in the periods in which timing differences reverse,
based on tax rates and laws enacted or substantively enacted at the balance sheet date.
Use of estimates
The preparation of accounts in conformity with generally accepted accounting practice requires management to make estimates and assumptions that
affect the reported amounts of assets and liabilities at the date of the accounts and the reported amounts of revenues and expenses during the
reporting period. Actual outcomes could differ from these estimates.
2 Taxation
$ million--------------------------------------------------------------------------------------------------------------------------------------------------------------------------------------------------------------------------------------------------------------------------------------------------------
Tax included in the statement of total recognized gains and losses 2007 2006 2005--------------------------------------------------------------------------------------------------------------------------------------------------------------------------------------------------------------------------------------------------------------------------------------------------------
Deferred tax
Origination and reversal of timing differences in the current year 195 336 348
This comprises:
Actuarial gain relating to pensions and other post-retirement benefits 195 336 348
Deferred tax--------------------------------------------------------------------------------------------------------------------------------------------------------------------------------------------------------------------------------------------------------------------------------------------------------
Balance sheet--------------------------------------------------------------------------------------------------------------------------------------------------------------------------------------------------------------------------------------------------------------------------------------------------------
Deferred tax liability
Pensions 2,008 1,671 968--------------------------------------------------------------------------------------------------------------------------------------------------------------------------------------------------------------------------------------------------------------------------------------------------------
Deferred tax asset
Other taxable timing differences 123 165 436--------------------------------------------------------------------------------------------------------------------------------------------------------------------------------------------------------------------------------------------------------------------------------------------------------
Net deferred tax liability 1,885 1,506 532
Analysis of movements during the year
At 1 January 1,506 532 265
Exchange adjustments 1 (18) (87)
Charge for the year on ordinary activities 183 656 6
Charge for the year in the statement of total recognized gains and losses 195 336 348--------------------------------------------------------------------------------------------------------------------------------------------------------------------------------------------------------------------------------------------------------------------------------------------------------
At 31 December 1,885 1,506 532

Filename: U54368_doc8.3d Time: 14:50:20 Date: 25/02/08
Checksum: 1077771846
192
3 Fixed assets – investments
$ million--------------------------------------------------------------------------------------------------------------------------------------------------------------------------------------------------------------------------------------------------------------------------------------------------------
Subsidiary Associatedundertakings undertakings
------------------------------------------------------------------
Shares Shares Loans Total--------------------------------------------------------------------------------------------------------------------------------------------------------------------------------------------------------------------------------------------------------------------------------------------------------
Cost
At 1 January 2007 89,037 2 2 89,041
Additions 7 – –
Deletions (8) – – (8)--------------------------------------------------------------------------------------------------------------------------------------------------------------------------------------------------------------------------------------------------------------------------------------------------------
At 31 December 2007 89,036 2 2 89,040
Amounts provided
At 1 January 2007 74 – 2 76--------------------------------------------------------------------------------------------------------------------------------------------------------------------------------------------------------------------------------------------------------------------------------------------------------
At 31 December 2007 74 – 2 76
Cost
At 1 January 2006 89,775 2 2 89,779
Additions 1,397 – – 1,397
Deletions (2,135) – – (2,135)--------------------------------------------------------------------------------------------------------------------------------------------------------------------------------------------------------------------------------------------------------------------------------------------------------
At 31 December 2006 89,037 2 2 89,041
Amounts provided
At 1 January 2006 17 – 2 19
Provided in year 57 – – 57--------------------------------------------------------------------------------------------------------------------------------------------------------------------------------------------------------------------------------------------------------------------------------------------------------
At 31 December 2006 74 – 2 76
Net book amount
At 31 December 2007 88,962 2 – 88,964
At 31 December 2006 88,963 2 – 88,965
The more important subsidiary undertakings of the company at 31 December 2007 and the percentage holding of ordinary share capital (to the nearest
whole number) are set out below. The principal country of operation is generally indicated by the company’s country of incorporation or by its name. A
complete list of investments in subsidiary undertakings, joint ventures and associated undertakings will be attached to the company’s annual return
made to the Registrar of Companies.
--------------------------------------------------------------------------------------------------------------------------------------------------------------------------------------------------------------------------------------------------------------------------------------------------------
Country ofSubsidiary undertakings % incorporation Principal activities--------------------------------------------------------------------------------------------------------------------------------------------------------------------------------------------------------------------------------------------------------------------------------------------------------
International
BP Global Investments 100 England Investment holding
BP International 100 England Integrated oil operations
BP Holdings North Americaa 100 England Investment holding
BP Shipping 100 England Shipping
BP Corporate Holdings 100 England Investment holding
Burmah Castrol 100 Scotland Lubricants
The carrying value of BP International Ltd in the accounts of the company at 31 December 2007 was $30.25 billion (2006 $30.25 billion).
a During the year the company disposed of its holding in BP America Inc to BP Holdings North America Ltd, receiving shares in BP Holdings North America Ltd in return. Thiswas accounted for as a share-for-share exchange, and has not affected overall cost of investments.
4 Debtors
$ million--------------------------------------------------------------------------------------------------------------------------------------------------------------------------------------------------------------------------------------------------------------------------------------------------------
2007 2006--------------------------------------------------------------------------------------------------------------------------------------------------------------------------------------------------------------------------------------------------------------------------------------------------------
Within After Within After1 year 1 year 1 year 1 year
--------------------------------------------------------------------------------------------------------------------------------------------------------------------------------------------------------------------------------------------------------------------------------------------------------
Group undertakings 835 1,153 2,890 1,157
Other 5 39 184 39--------------------------------------------------------------------------------------------------------------------------------------------------------------------------------------------------------------------------------------------------------------------------------------------------------
840 1,192 3,074 1,196
The carrying amounts of debtors approximate their fair value.
7
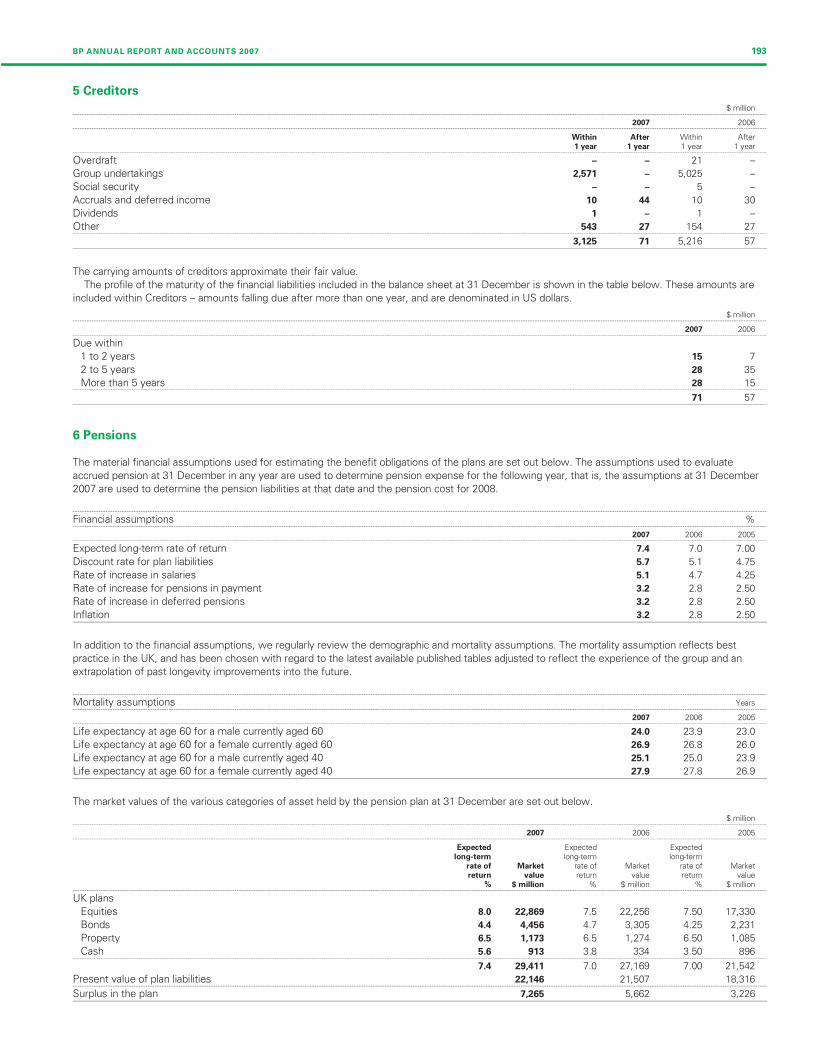
Filename: U54368_doc8.3d Time: 14:50:20 Date: 25/02/08
Checksum: -893708149
BP ANNUAL REPORT AND ACCOUNTS 2007 193
5 Creditors
$ million--------------------------------------------------------------------------------------------------------------------------------------------------------------------------------------------------------------------------------------------------------------------------------------------------------
2007 2006--------------------------------------------------------------------------------------------------------------------------------------------------------------------------------------------------------------------------------------------------------------------------------------------------------
Within After Within After1 year 1 year 1 year 1 year
--------------------------------------------------------------------------------------------------------------------------------------------------------------------------------------------------------------------------------------------------------------------------------------------------------
Overdraft – – 21 –
Group undertakings 2,571 – 5,025 –
Social security – – 5
Accruals and deferred income 10 44 10 30
Dividends 1 – 1
Other 543 27 154 27--------------------------------------------------------------------------------------------------------------------------------------------------------------------------------------------------------------------------------------------------------------------------------------------------------
3,125 71 5,216 57
The carrying amounts of creditors approximate their fair value.
The profile of the maturity of the financial liabilities included in the balance sheet at 31 December is shown in the table below. These amounts are
included within Creditors – amounts falling due after more than one year, and are denominated in US dollars.
$ million--------------------------------------------------------------------------------------------------------------------------------------------------------------------------------------------------------------------------------------------------------------------------------------------------------
2007 2006--------------------------------------------------------------------------------------------------------------------------------------------------------------------------------------------------------------------------------------------------------------------------------------------------------
Due within
1 to 2 years 15 7
2 to 5 years 28 35
More than 5 years 28 15--------------------------------------------------------------------------------------------------------------------------------------------------------------------------------------------------------------------------------------------------------------------------------------------------------
71 57
6 Pensions
The material financial assumptions used for estimating the benefit obligations of the plans are set out below. The assumptions used to evaluate
accrued pension at 31 December in any year are used to determine pension expense for the following year, that is, the assumptions at 31 December
2007 are used to determine the pension liabilities at that date and the pension cost for 2008.
--------------------------------------------------------------------------------------------------------------------------------------------------------------------------------------------------------------------------------------------------------------------------------------------------------
Financial assumptions %--------------------------------------------------------------------------------------------------------------------------------------------------------------------------------------------------------------------------------------------------------------------------------------------------------
2007 2006 2005--------------------------------------------------------------------------------------------------------------------------------------------------------------------------------------------------------------------------------------------------------------------------------------------------------
Expected long-term rate of return 7.4 7.0 7.00
Discount rate for plan liabilities 5.7 5.1 4.75
Rate of increase in salaries 5.1 4.7 4.25
Rate of increase for pensions in payment 3.2 2.8 2.50
Rate of increase in deferred pensions 3.2 2.8 2.50
Inflation 3.2 2.8 2.50
In addition to the financial assumptions, we regularly review the demographic and mortality assumptions. The mortality assumption reflects best
practice in the UK, and has been chosen with regard to the latest available published tables adjusted to reflect the experience of the group and an
extrapolation of past longevity improvements into the future.
--------------------------------------------------------------------------------------------------------------------------------------------------------------------------------------------------------------------------------------------------------------------------------------------------------
Mortality assumptions Years--------------------------------------------------------------------------------------------------------------------------------------------------------------------------------------------------------------------------------------------------------------------------------------------------------
2007 2006 2005--------------------------------------------------------------------------------------------------------------------------------------------------------------------------------------------------------------------------------------------------------------------------------------------------------
Life expectancy at age 60 for a male currently aged 60 24.0 23.9 23.0
Life expectancy at age 60 for a female currently aged 60 26.9 26.8 26.0
Life expectancy at age 60 for a male currently aged 40 25.1 25.0 23.9
Life expectancy at age 60 for a female currently aged 40 27.9 27.8 26.9
The market values of the various categories of asset held by the pension plan at 31 December are set out below.
$ million--------------------------------------------------------------------------------------------------------------------------------------------------------------------------------------------------------------------------------------------------------------------------------------------------------
2007 2006 2005--------------------------------------------------------------------------------------------------------------------------------------------------------------------------------------------------------------------------------------------------------------------------------------------------------
Expected Expected Expectedlong-term long-term long-term
rate of Market rate of Market rate of Marketreturn value return value return value
% $ million % $ million % $ million--------------------------------------------------------------------------------------------------------------------------------------------------------------------------------------------------------------------------------------------------------------------------------------------------------
UK plans
Equities 8.0 22,869 7.5 22,256 7.50 17,330
Bonds 4.4 4,456 4.7 3,305 4.25 2,231
Property 6.5 1,173 6.5 1,274 6.50 1,085
Cash 5.6 913 3.8 334 3.50 896--------------------------------------------------------------------------------------------------------------------------------------------------------------------------------------------------------------------------------------------------------------------------------------------------------
7.4 29,411 7.0 27,169 7.00 21,542
Present value of plan liabilities 22,146 21,507 18,316--------------------------------------------------------------------------------------------------------------------------------------------------------------------------------------------------------------------------------------------------------------------------------------------------------
Surplus in the plan 7,265 5,662 3,226
–
–

Filename: U54368_doc8.3d Time: 14:50:21 Date: 25/02/08
Checksum: -409934688
194
6 Pensions continued
$ million--------------------------------------------------------------------------------------------------------------------------------------------------------------------------------------------------------------------------------------------------------------------------------------------------------
2007 2006 2005--------------------------------------------------------------------------------------------------------------------------------------------------------------------------------------------------------------------------------------------------------------------------------------------------------
Analysis of the amount charged to operating profit--------------------------------------------------------------------------------------------------------------------------------------------------------------------------------------------------------------------------------------------------------------------------------------------------------
Current service cost 473 411 360
Past service cost 5 (74) 4
Settlement, curtailment and special termination benefits 35 – 36--------------------------------------------------------------------------------------------------------------------------------------------------------------------------------------------------------------------------------------------------------------------------------------------------------
Total operating charge 513 337 400
Analysis of the amount credited (charged) to other finance income--------------------------------------------------------------------------------------------------------------------------------------------------------------------------------------------------------------------------------------------------------------------------------------------------------
Expected return on pension plan assets 1,927 1,593 1,357
Interest on pension plan liabilities (1,108) (918) (914)--------------------------------------------------------------------------------------------------------------------------------------------------------------------------------------------------------------------------------------------------------------------------------------------------------
Other finance income 819 675 443
Analysis of the amount recognized in the statement of total recognized gains and losses--------------------------------------------------------------------------------------------------------------------------------------------------------------------------------------------------------------------------------------------------------------------------------------------------------
Actual return less expected return on pension plan assets 404 1,252 2,946
Change in assumptions underlying the present value of the plan liabilities 751 79 (1,721)
Experience gains and losses arising on the plan liabilities (457) (211) (66)--------------------------------------------------------------------------------------------------------------------------------------------------------------------------------------------------------------------------------------------------------------------------------------------------------
Actuarial gain (loss) recognized in statement of total recognized gains and losses 698 1,120 1,159
--------------------------------------------------------------------------------------------------------------------------------------------------------------------------------------------------------------------------------------------------------------------------------------------------------
Movements in benefit obligation during the year 2007 2006--------------------------------------------------------------------------------------------------------------------------------------------------------------------------------------------------------------------------------------------------------------------------------------------------------
Benefit obligation at 1 January 21,507 18,316
Exchange adjustment 363 2,524
Current service cost 473 411
Past service cost 5 (74)
Interest cost 1,108 918
Curtailment (7) (20)
Settlement (3) (22)
Special termination benefits 45 42
Contributions by plan participants 41 37
Benefit payments (funded plans) (998) (900)
Benefit payments (unfunded plans) (3) –
Disposals (91) 143
Actuarial (gain) loss on obligation (294) 132--------------------------------------------------------------------------------------------------------------------------------------------------------------------------------------------------------------------------------------------------------------------------------------------------------
Benefit obligation at 31 December 22,146 21,507
Movements in fair value of plan assets during the year--------------------------------------------------------------------------------------------------------------------------------------------------------------------------------------------------------------------------------------------------------------------------------------------------------
Fair value of plan assets at 1 January 27,169 21,542
Exchange adjustment 452 3,082
Expected return on plan assets 1,927 1,593
Contributions by plan participants 41 37
Contributions by employers (funded plans) 507 420
Benefit payments (funded plans) (998) (900)
Disposals (91) 143
Actuarial gain (loss) on plan assets 404 1,252--------------------------------------------------------------------------------------------------------------------------------------------------------------------------------------------------------------------------------------------------------------------------------------------------------
Fair value of plan assets at 31 Decembera 29,411 27,169
Surplus (deficit) at 31 December 7,265 5,662
Represented by
Asset recognized 7,381 5,771
Liability recognized (116) (109)--------------------------------------------------------------------------------------------------------------------------------------------------------------------------------------------------------------------------------------------------------------------------------------------------------
7,265 5,662--------------------------------------------------------------------------------------------------------------------------------------------------------------------------------------------------------------------------------------------------------------------------------------------------------
The surplus (deficit) may be analysed between funded and unfunded plans as follows
Funded 7,381 5,771
Unfunded (116) (109)--------------------------------------------------------------------------------------------------------------------------------------------------------------------------------------------------------------------------------------------------------------------------------------------------------
7,265 5,662--------------------------------------------------------------------------------------------------------------------------------------------------------------------------------------------------------------------------------------------------------------------------------------------------------
The defined benefit obligation may be analysed between funded and unfunded plans as follows
Fundedb (22,030) (21,398)
Unfunded (116) (109)--------------------------------------------------------------------------------------------------------------------------------------------------------------------------------------------------------------------------------------------------------------------------------------------------------
(22,146) (21,507)--------------------------------------------------------------------------------------------------------------------------------------------------------------------------------------------------------------------------------------------------------------------------------------------------------
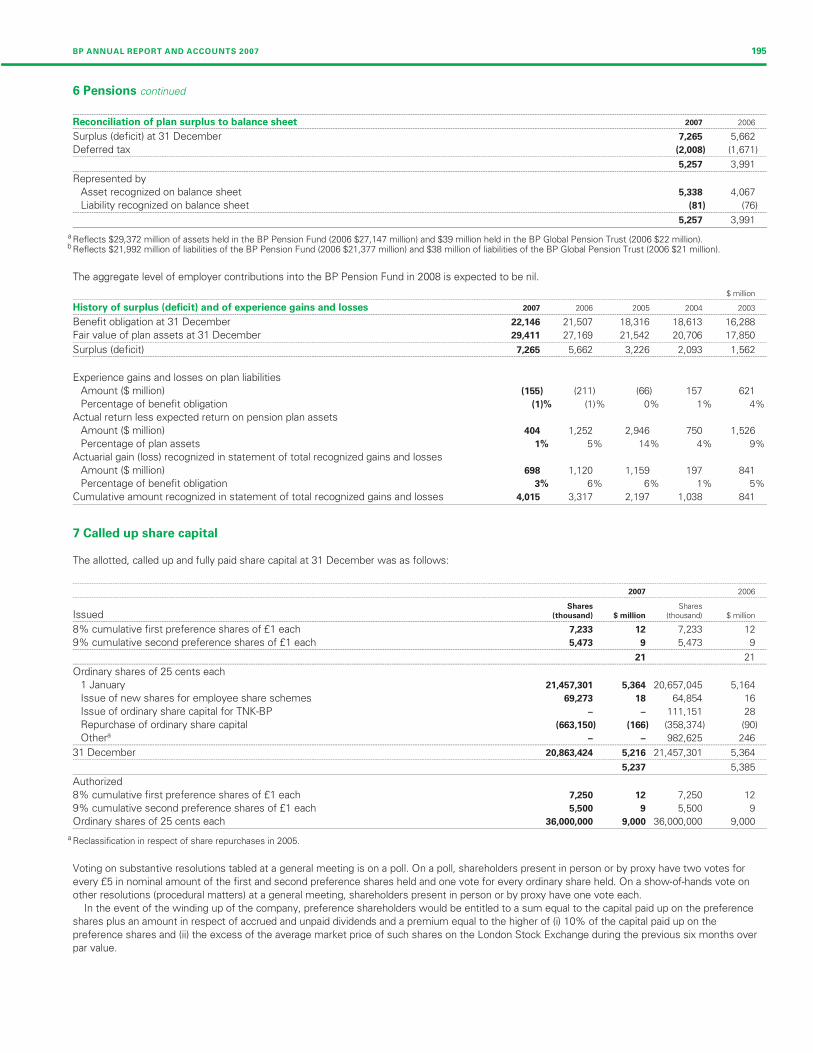
Filename: U54368_doc8.3d Time: 14:50:21 Date: 25/02/08
Checksum: 1598966408
BP ANNUAL REPORT AND ACCOUNTS 2007 195
6 Pensions continued
--------------------------------------------------------------------------------------------------------------------------------------------------------------------------------------------------------------------------------------------------------------------------------------------------------
Reconciliation of plan surplus to balance sheet 2007 2006--------------------------------------------------------------------------------------------------------------------------------------------------------------------------------------------------------------------------------------------------------------------------------------------------------
Surplus (deficit) at 31 December 7,265 5,662
Deferred tax (2,008) (1,671)--------------------------------------------------------------------------------------------------------------------------------------------------------------------------------------------------------------------------------------------------------------------------------------------------------
5,257 3,991--------------------------------------------------------------------------------------------------------------------------------------------------------------------------------------------------------------------------------------------------------------------------------------------------------
Represented by
Asset recognized on balance sheet 5,338 4,067
Liability recognized on balance sheet (81) (76)--------------------------------------------------------------------------------------------------------------------------------------------------------------------------------------------------------------------------------------------------------------------------------------------------------
5,257 3,991
a Reflects $29,372 million of assets held in the BP Pension Fund (2006 $27,147 million) and $39 million held in the BP Global Pension Trust (2006 $22 million).b Reflects $21,992 million of liabilities of the BP Pension Fund (2006 $21,377 million) and $38 million of liabilities of the BP Global Pension Trust (2006 $21 million).
The aggregate level of employer contributions into the BP Pension Fund in 2008 is expected to be nil.
$ million--------------------------------------------------------------------------------------------------------------------------------------------------------------------------------------------------------------------------------------------------------------------------------------------------------
History of surplus (deficit) and of experience gains and losses 2007 2006 2005 2004 2003--------------------------------------------------------------------------------------------------------------------------------------------------------------------------------------------------------------------------------------------------------------------------------------------------------
Benefit obligation at 31 December 22,146 21,507 18,316 18,613 16,288
Fair value of plan assets at 31 December 29,411 27,169 21,542 20,706 17,850--------------------------------------------------------------------------------------------------------------------------------------------------------------------------------------------------------------------------------------------------------------------------------------------------------
Surplus (deficit) 7,265 5,662 3,226 2,093 1,562--------------------------------------------------------------------------------------------------------------------------------------------------------------------------------------------------------------------------------------------------------------------------------------------------------
Experience gains and losses on plan liabilities
Amount ($ million) (155) (211) (66) 157 621
Percentage of benefit obligation (1)% (1)% 0% 1% 4%
Actual return less expected return on pension plan assets
Amount ($ million) 404 1,252 2,946 750 1,526
Percentage of plan assets 1% 5% 14% 4% 9%
Actuarial gain (loss) recognized in statement of total recognized gains and losses
Amount ($ million) 698 1,120 1,159 197 841
Percentage of benefit obligation 3% 6% 6% 1% 5%
Cumulative amount recognized in statement of total recognized gains and losses 4,015 3,317 2,197 1,038 841
7 Called up share capital
The allotted, called up and fully paid share capital at 31 December was as follows:
--------------------------------------------------------------------------------------------------------------------------------------------------------------------------------------------------------------------------------------------------------------------------------------------------------
2007 2006--------------------------------------------------------------------------------------------------------------------------------------------------------------------------------------------------------------------------------------------------------------------------------------------------------
Shares SharesIssued (thousand) $ million (thousand) $ million--------------------------------------------------------------------------------------------------------------------------------------------------------------------------------------------------------------------------------------------------------------------------------------------------------
8% cumulative first preference shares of £1 each 7,233 12 7,233 12
9% cumulative second preference shares of £1 each 5,473 9 5,473 9--------------------------------------------------------------------------------------------------------------------------------------------------------------------------------------------------------------------------------------------------------------------------------------------------------
21 21--------------------------------------------------------------------------------------------------------------------------------------------------------------------------------------------------------------------------------------------------------------------------------------------------------
Ordinary shares of 25 cents each
1 January 21,457,301 5,364 20,657,045 5,164
Issue of new shares for employee share schemes 69,273 18 64,854 16
Issue of ordinary share capital for TNK-BP – – 111,151 28
Repurchase of ordinary share capital (663,150) (166) (358,374) (90)
Othera – – 982,625 246--------------------------------------------------------------------------------------------------------------------------------------------------------------------------------------------------------------------------------------------------------------------------------------------------------
31 December 20,863,424 5,216 21,457,301 5,364--------------------------------------------------------------------------------------------------------------------------------------------------------------------------------------------------------------------------------------------------------------------------------------------------------
5,237 5,385
Authorized
8% cumulative first preference shares of £1 each 7,250 12 7,250 12
9% cumulative second preference shares of £1 each 5,500 9 5,500 9
Ordinary shares of 25 cents each 36,000,000 9,000 36,000,000 9,000
a Reclassification in respect of share repurchases in 2005.
Voting on substantive resolutions tabled at a general meeting is on a poll. On a poll, shareholders present in person or by proxy have two votes for
every £5 in nominal amount of the first and second preference shares held and one vote for every ordinary share held. On a show-of-hands vote on
other resolutions (procedural matters) at a general meeting, shareholders present in person or by proxy have one vote each.
In the event of the winding up of the company, preference shareholders would be entitled to a sum equal to the capital paid up on the preference
shares plus an amount in respect of accrued and unpaid dividends and a premium equal to the higher of (i) 10% of the capital paid up on the
preference shares and (ii) the excess of the average market price of such shares on the London Stock Exchange during the previous six months over
par value.
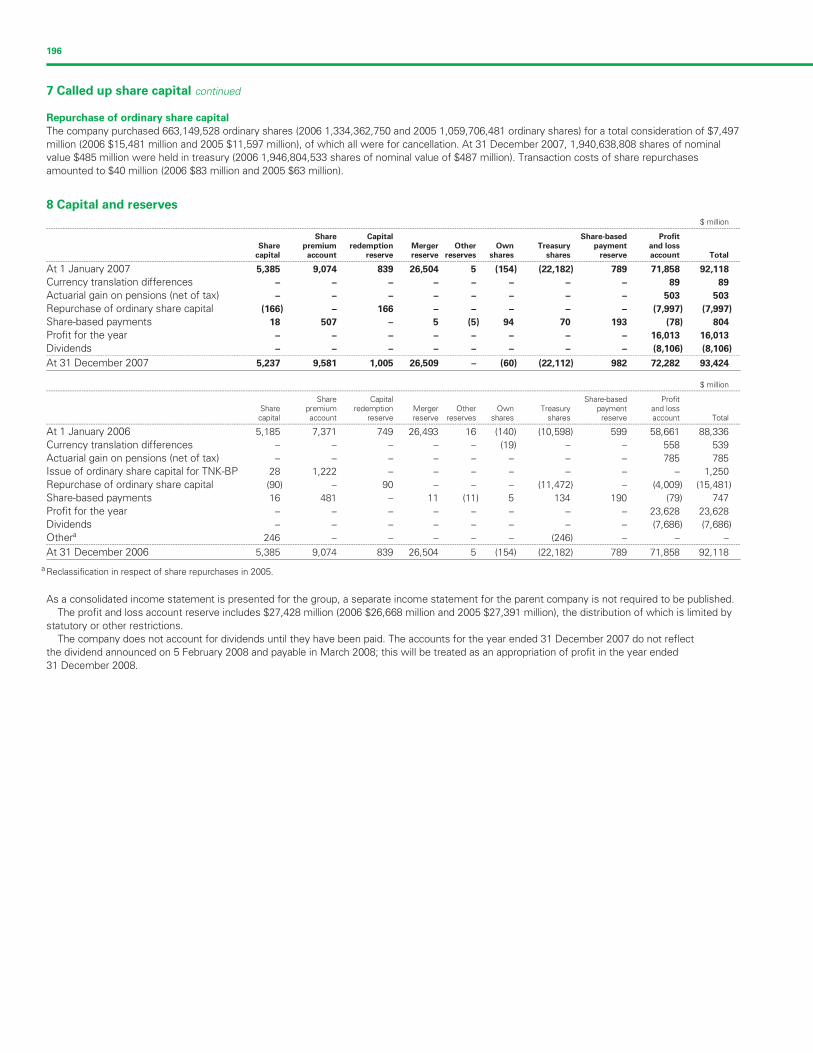
Filename: U54368_doc8.3d Time: 14:50:21 Date: 25/02/08
Checksum: -973093616
196
7 Called up share capital continued
Repurchase of ordinary share capital
The company purchased 663,149,528 ordinary shares (2006 1,334,362,750 and 2005 1,059,706,481 ordinary shares) for a total consideration of $7,497
million (2006 $15,481 million and 2005 $11,597 million), of which all were for cancellation. At 31 December 2007, 1,940,638,808 shares of nominal
value $485 million were held in treasury (2006 1,946,804,533 shares of nominal value of $487 million). Transaction costs of share repurchases
amounted to $40 million (2006 $83 million and 2005 $63 million).
8 Capital and reserves
$ million--------------------------------------------------------------------------------------------------------------------------------------------------------------------------------------------------------------------------------------------------------------------------------------------------------
Share Capital Share-based Profit
Share premium redemption Merger Other Own Treasury payment and loss
capital account reserve reserve reserves shares shares reserve account Total--------------------------------------------------------------------------------------------------------------------------------------------------------------------------------------------------------------------------------------------------------------------------------------------------------
At 1 January 2007 5,385 9,074 839 26,504 5 (154) (22,182) 789 71,858 92,118
Currency translation differences – – – – – – – – 89
Actuarial gain on pensions (net of tax) – – – – – – – – 503
Repurchase of ordinary share capital (166) – 166 – – – – – (7,997) (7,997)
Share-based payments 18 507 – 5 (5) 94 70 193 (78) 804
Profit for the year – – – – – – – – 16,013 16,013
Dividends – – – – – – – – (8,106) (8,106)--------------------------------------------------------------------------------------------------------------------------------------------------------------------------------------------------------------------------------------------------------------------------------------------------------
At 31 December 2007 5,237 9,581 1,005 26,509 – (60) (22,112) 982 72,282 93,424
$ million--------------------------------------------------------------------------------------------------------------------------------------------------------------------------------------------------------------------------------------------------------------------------------------------------------
Share Capital Share-based ProfitShare premium redemption Merger Other Own Treasury payment and losscapital account reserve reserve reserves shares shares reserve account Total
--------------------------------------------------------------------------------------------------------------------------------------------------------------------------------------------------------------------------------------------------------------------------------------------------------
At 1 January 2006 5,185 7,371 749 26,493 16 (140) (10,598) 599 58,661 88,336
Currency translation differences – – – – – (19) – – 558 539
Actuarial gain on pensions (net of tax) – – – – – – – – 785
Issue of ordinary share capital for TNK-BP 28 1,222 – – – – – – – 1,250
Repurchase of ordinary share capital (90) – 90 – – – (11,472) – (4,009) (15,481)
Share-based payments 16 481 – 11 (11) 5 134 190 (79) 747
Profit for the year – – – – – – – – 23,628 23,628
Dividends – – – – – – – – (7,686) (7,686)
Othera 246 – – – – – (246) – – –--------------------------------------------------------------------------------------------------------------------------------------------------------------------------------------------------------------------------------------------------------------------------------------------------------
At 31 December 2006 5,385 9,074 839 26,504 5 (154) (22,182) 789 71,858 92,118
a Reclassification in respect of share repurchases in 2005.
As a consolidated income statement is presented for the group, a separate income statement for the parent company is not required to be published.
The profit and loss account reserve includes $27,428 million (2006 $26,668 million and 2005 $27,391 million), the distribution of which is limited by
statutory or other restrictions.
The company does not account for dividends until they have been paid. The accounts for the year ended 31 December 2007 do not reflect
the dividend announced on 5 February 2008 and payable in March 2008; this will be treated as an appropriation of profit in the year ended
31 December 2008.
89
503
785
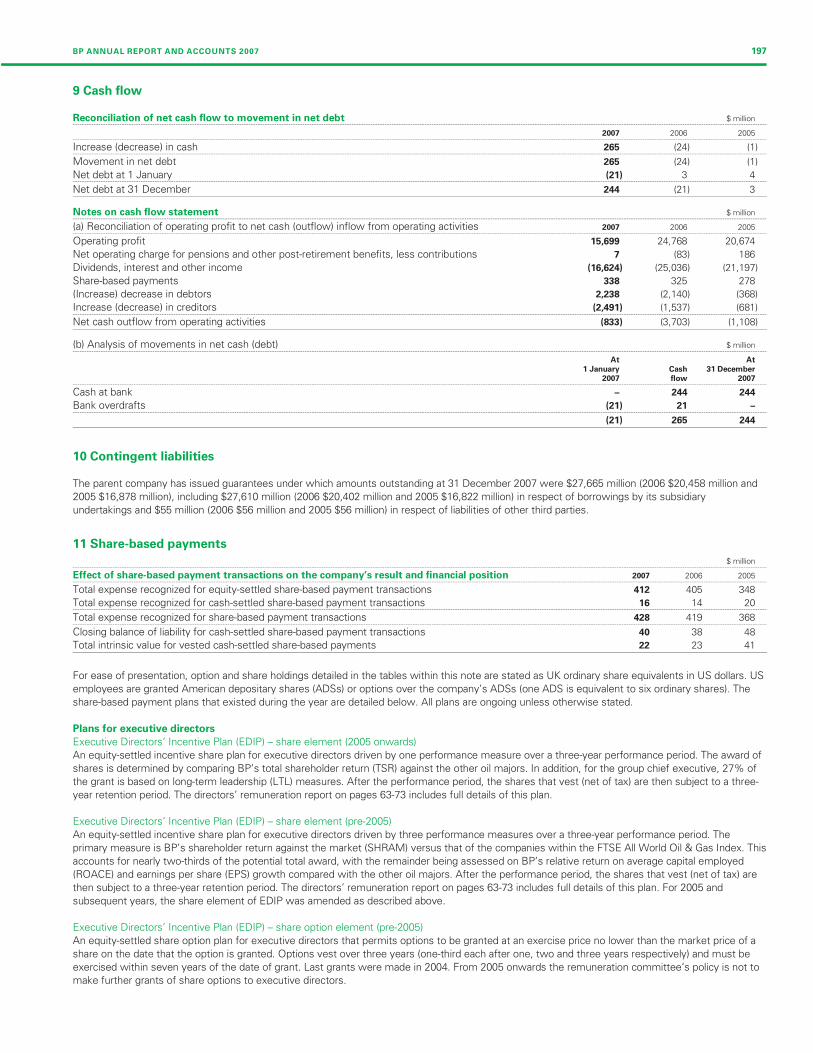
Filename: U54368_doc8.3d Time: 14:50:22 Date: 25/02/08
Checksum: 1078034891
BP ANNUAL REPORT AND ACCOUNTS 2007 197
9 Cash flow
Reconciliation of net cash flow to movement in net debt $ million--------------------------------------------------------------------------------------------------------------------------------------------------------------------------------------------------------------------------------------------------------------------------------------------------------
2007 2006 2005--------------------------------------------------------------------------------------------------------------------------------------------------------------------------------------------------------------------------------------------------------------------------------------------------------
Increase (decrease) in cash 265 (24) (1)--------------------------------------------------------------------------------------------------------------------------------------------------------------------------------------------------------------------------------------------------------------------------------------------------------
Movement in net debt 265 (24) (1)
Net debt at 1 January (21) 3--------------------------------------------------------------------------------------------------------------------------------------------------------------------------------------------------------------------------------------------------------------------------------------------------------
Net debt at 31 December 244 (21) 3
Notes on cash flow statement $ million--------------------------------------------------------------------------------------------------------------------------------------------------------------------------------------------------------------------------------------------------------------------------------------------------------
(a) Reconciliation of operating profit to net cash (outflow) inflow from operating activities 2007 2006 2005--------------------------------------------------------------------------------------------------------------------------------------------------------------------------------------------------------------------------------------------------------------------------------------------------------
Operating profit 15,699 24,768 20,674
Net operating charge for pensions and other post-retirement benefits, less contributions 7 (83) 186
Dividends, interest and other income (16,624) (25,036) (21,197)
Share-based payments 338 325 278
(Increase) decrease in debtors 2,238 (2,140) (368)
Increase (decrease) in creditors (2,491) (1,537) (681)--------------------------------------------------------------------------------------------------------------------------------------------------------------------------------------------------------------------------------------------------------------------------------------------------------
Net cash outflow from operating activities (833) (3,703) (1,108)
(b) Analysis of movements in net cash (debt) $ million--------------------------------------------------------------------------------------------------------------------------------------------------------------------------------------------------------------------------------------------------------------------------------------------------------
At At
1 January Cash 31 December
2007 flow 2007--------------------------------------------------------------------------------------------------------------------------------------------------------------------------------------------------------------------------------------------------------------------------------------------------------
Cash at bank – 244 244
Bank overdrafts (21) 21 –--------------------------------------------------------------------------------------------------------------------------------------------------------------------------------------------------------------------------------------------------------------------------------------------------------
(21) 265 244
10 Contingent liabilities
The parent company has issued guarantees under which amounts outstanding at 31 December 2007 were $27,665 million (2006 $20,458 million and
2005 $16,878 million), including $27,610 million (2006 $20,402 million and 2005 $16,822 million) in respect of borrowings by its subsidiary
undertakings and $55 million (2006 $56 million and 2005 $56 million) in respect of liabilities of other third parties.
11 Share-based payments
$ million--------------------------------------------------------------------------------------------------------------------------------------------------------------------------------------------------------------------------------------------------------------------------------------------------------
Effect of share-based payment transactions on the company’s result and financial position 2007 2006 2005--------------------------------------------------------------------------------------------------------------------------------------------------------------------------------------------------------------------------------------------------------------------------------------------------------
Total expense recognized for equity-settled share-based payment transactions 412 405 348
Total expense recognized for cash-settled share-based payment transactions 16 14 20--------------------------------------------------------------------------------------------------------------------------------------------------------------------------------------------------------------------------------------------------------------------------------------------------------
Total expense recognized for share-based payment transactions 428 419 368--------------------------------------------------------------------------------------------------------------------------------------------------------------------------------------------------------------------------------------------------------------------------------------------------------
Closing balance of liability for cash-settled share-based payment transactions 40 38 48
Total intrinsic value for vested cash-settled share-based payments 22 23 41
For ease of presentation, option and share holdings detailed in the tables within this note are stated as UK ordinary share equivalents in US dollars. US
employees are granted American depositary shares (ADSs) or options over the company’s ADSs (one ADS is equivalent to six ordinary shares). The
share-based payment plans that existed during the year are detailed below. All plans are ongoing unless otherwise stated.
Plans for executive directors
Executive Directors’ Incentive Plan (EDIP) – share element (2005 onwards)
An equity-settled incentive share plan for executive directors driven by one performance measure over a three-year performance period. The award of
shares is determined by comparing BP’s total shareholder return (TSR) against the other oil majors. In addition, for the group chief executive, 27% of
the grant is based on long-term leadership (LTL) measures. After the performance period, the shares that vest (net of tax) are then subject to a three-
year retention period. The directors’ remuneration report on pages 63-73 includes full details of this plan.
Executive Directors’ Incentive Plan (EDIP) – share element (pre-2005)
An equity-settled incentive share plan for executive directors driven by three performance measures over a three-year performance period. The
primary measure is BP’s shareholder return against the market (SHRAM) versus that of the companies within the FTSE All World Oil & Gas Index. This
accounts for nearly two-thirds of the potential total award, with the remainder being assessed on BP’s relative return on average capital employed
(ROACE) and earnings per share (EPS) growth compared with the other oil majors. After the performance period, the shares that vest (net of tax) are
then subject to a three-year retention period. The directors’ remuneration report on pages 63-73 includes full details of this plan. For 2005 and
subsequent years, the share element of EDIP was amended as described above.
Executive Directors’ Incentive Plan (EDIP) – share option element (pre-2005)
An equity-settled share option plan for executive directors that permits options to be granted at an exercise price no lower than the market price of a
share on the date that the option is granted. Options vest over three years (one-third each after one, two and three years respectively) and must be
exercised within seven years of the date of grant. Last grants were made in 2004. From 2005 onwards the remuneration committee’s policy is not to
make further grants of share options to executive directors.
4

Filename: U54368_doc8.3d Time: 14:50:22 Date: 25/02/08
Checksum: 1893580803
198
11 Share-based payments continued
Plans for senior employees
Medium Term Performance Plan (MTPP) (2005 onwards)
An equity-settled incentive share plan for senior employees driven by two performance measures over a three-year performance period. The award of
shares is determined by comparing BP’s TSR against the other oil majors and, additionally, by comparing free cash flow (FCF) against a threshold
established for the period. For a small group of particularly senior employees, only the TSR measure is applicable in determining the award. The
number of shares awarded is increased to take account of the net dividends that would have been received during the performance period, assuming
that such dividends had been reinvested. With regard to leaver provisions, the general rule is that leaving employment during the performance period
will preclude an award of shares. However, special arrangements apply where the participant leaves for a qualifying reason and employment ceases
after completion of the first year of the performance period. The current policy of the company, which is reflected in the terms of the MTPP, is that
senior employees subject to the plan should meet a minimum shareholding requirement.
Long Term Performance Plan (LTPP) (pre-2005)
An equity-settled incentive share plan for senior employees driven by three performance measures over a three-year performance period. The primary
measure is BP’s SHRAM versus that of the companies within the FTSE All World Oil & Gas Index. This accounts for nearly two-thirds of the potential
total award, with the remainder being assessed on BP’s relative ROACE and EPS growth compared with the other oil majors. Shares are awarded at
the end of the performance period and are then subject to a three-year retention period. With regard to leaver provisions, the general rule is that
leaving during the performance period will preclude an award of shares. However, special arrangements apply where the participant leaves for a
qualifying reason and employment ceases after completion of the first year of the performance period. This plan was replaced by the MTPP for
2005 onwards.
Deferred Annual Bonus Plan (DAB)
An equity-settled restricted share plan for senior employees. The award value is equal to 50% of the annual cash bonus awarded for the preceding
performance year (the ‘performance period’). The shares are restricted for a period of three years (the ‘restriction period’). Shares accrue dividends
during the restriction period and these are reinvested. With regard to leaver provisions, if a participant ceases to be employed by BP prior to the end of
the performance period, the general rule is that this will preclude an award of shares. However, special arrangements apply where the participant
leaves for a qualifying reason. Similarly, if a participant ceases to be employed by BP prior to the end of the restriction period, the general rule is that
the restricted shares will be forfeited. Special arrangements apply where the participant leaves for a qualifying reason.
Performance Share Plan (PSP)
An equity-settled restricted share plan for senior professionals and team leaders. The award takes into account the recipient’s performance in the prior
calendar year (the ‘performance period’). Shares, provided initially as share units, are restricted for a period of three years (the ‘restriction period’).
Share units accrue notional dividends during the restriction period and these are reinvested. At the end of the restriction period additional units may be
awarded based on BP’s TSR performance against the other oil majors. At award, share units are converted into shares. With regard to leaver
provisions, the general rule is that leaving during the performance period will preclude an award of share units. If a participant ceases to be employed
by BP prior to the end of the restriction period, the general rule is that share units will lapse. Special arrangements apply where the participant leaves
for a qualifying reason.
Restricted Share Plan (RSP)
An equity-settled restricted share plan used predominantly for senior employees in special circumstances (such as recruitment and retention). There
are no performance conditions but the shares are subject to a three-year restriction period. During the restriction period, shares accrue dividends,
which are reinvested. With regard to leaver provisions, the general rule is that ceasing employment during the restriction period will result in the forfeit
of shares. However, special arrangements apply where the participant leaves for a qualifying reason.
BP Share Option Plan (BPSOP)
An equity-settled share option plan that applies to certain categories of employees. Participants are granted share options with an exercise price no
lower than market price of a share immediately preceding the date of grant. There are no performance conditions and the options are exercisable
between the third and 10th anniversaries of the grant date. The general rule is that the options will lapse if the participant leaves employment before
the end of the third calendar year from the date of grant (and that vested options are exercisable within 3/12 years from the date of leaving). However,
special arrangements apply where the participant leaves for a qualifying reason and employment ceases after the end of the calendar year of the date
of grant. From 2007, share options no longer form a regular element of our incentive plans.
Savings and matching plans
BP ShareSave Plan
A savings-related share option plan, under which employees save on a monthly basis, over a three- or five-year period, towards the purchase of shares
at a fixed price determined when the option is granted. This price is usually set at a 20% discount to the market price at the time of grant. The option
must be exercised within six months of maturity of the savings contract; otherwise it lapses. The plan is run in the UK and options are granted
annually, usually in June. Participants leaving for a qualifying reason will have six months in which to use their savings to exercise their options on a
pro-rated basis.
BP ShareMatch Plans
Matching share plans, under which BP matches employees’ own contributions of shares up to a predetermined limit. The plans are run in the UK and
in over 70 other countries. The UK plan is run on a monthly basis with shares being held in trust for five years before they can be released free of any
income tax and national insurance liability. In other countries, the plan is run on an annual basis with shares being held in trust for three years. The plan
is operated on a cash basis in those countries where there are regulatory restrictions preventing the holding of BP shares. When the employee leaves
BP, all shares must be removed from trust and units under the plan operated on a cash basis must be encashed.
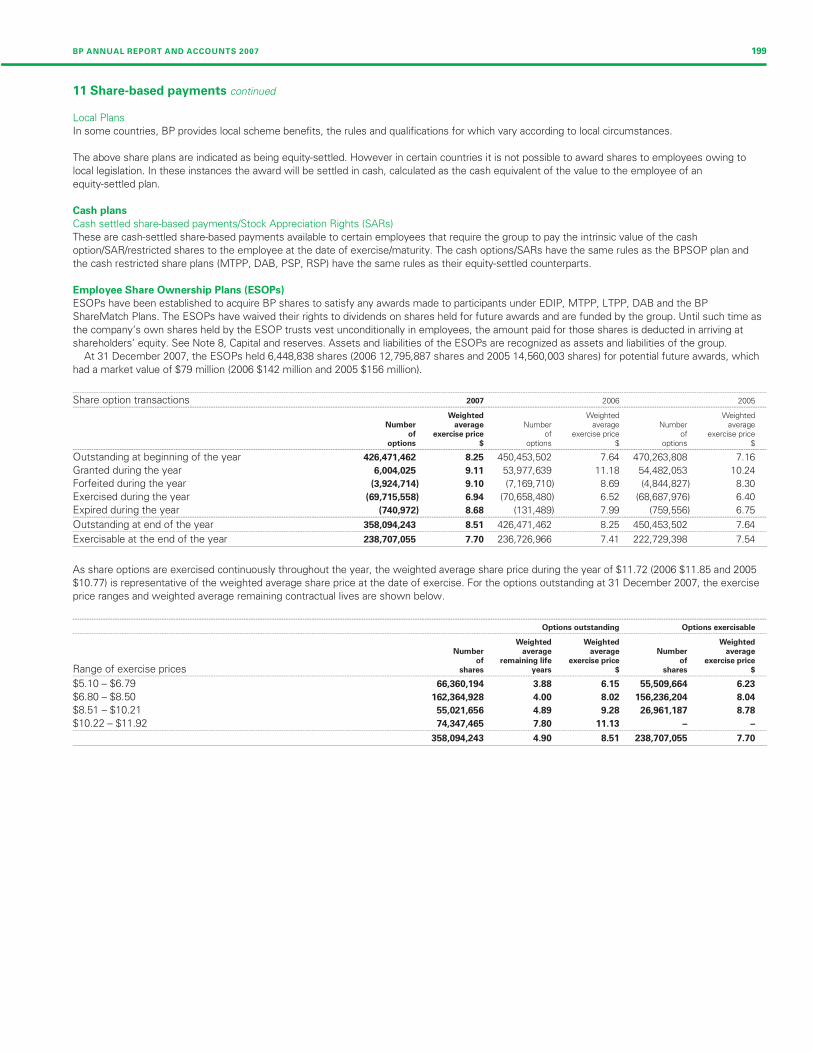
Filename: U54368_doc8.3d Time: 14:50:22 Date: 25/02/08
Checksum: -1478942577
BP ANNUAL REPORT AND ACCOUNTS 2007 199
11 Share-based payments continued
Local Plans
In some countries, BP provides local scheme benefits, the rules and qualifications for which vary according to local circumstances.
The above share plans are indicated as being equity-settled. However in certain countries it is not possible to award shares to employees owing to
local legislation. In these instances the award will be settled in cash, calculated as the cash equivalent of the value to the employee of an
equity-settled plan.
Cash plans
Cash settled share-based payments/Stock Appreciation Rights (SARs)
These are cash-settled share-based payments available to certain employees that require the group to pay the intrinsic value of the cash
option/SAR/restricted shares to the employee at the date of exercise/maturity. The cash options/SARs have the same rules as the BPSOP plan and
the cash restricted share plans (MTPP, DAB, PSP, RSP) have the same rules as their equity-settled counterparts.
Employee Share Ownership Plans (ESOPs)
ESOPs have been established to acquire BP shares to satisfy any awards made to participants under EDIP, MTPP, LTPP, DAB and the BP
ShareMatch Plans. The ESOPs have waived their rights to dividends on shares held for future awards and are funded by the group. Until such time as
the company’s own shares held by the ESOP trusts vest unconditionally in employees, the amount paid for those shares is deducted in arriving at
shareholders’ equity. See Note 8, Capital and reserves. Assets and liabilities of the ESOPs are recognized as assets and liabilities of the group.
At 31 December 2007, the ESOPs held 6,448,838 shares (2006 12,795,887 shares and 2005 14,560,003 shares) for potential future awards, which
had a market value of $79 million (2006 $142 million and 2005 $156 million).
--------------------------------------------------------------------------------------------------------------------------------------------------------------------------------------------------------------------------------------------------------------------------------------------------------
Share option transactions 2007 2006 2005--------------------------------------------------------------------------------------------------------------------------------------------------------------------------------------------------------------------------------------------------------------------------------------------------------
Weighted Weighted WeightedNumber average Number average Number average
of exercise price of exercise price of exercise priceoptions $ options $ options $
--------------------------------------------------------------------------------------------------------------------------------------------------------------------------------------------------------------------------------------------------------------------------------------------------------
Outstanding at beginning of the year 426,471,462 8.25 450,453,502 7.64 470,263,808 7.16
Granted during the year 6,004,025 9.11 53,977,639 11.18 54,482,053 10.24
Forfeited during the year (3,924,714) 9.10 (7,169,710) 8.69 (4,844,827) 8.30
Exercised during the year (69,715,558) 6.94 (70,658,480) 6.52 (68,687,976) 6.40
Expired during the year (740,972) 8.68 (131,489) 7.99 (759,556) 6.75--------------------------------------------------------------------------------------------------------------------------------------------------------------------------------------------------------------------------------------------------------------------------------------------------------
Outstanding at end of the year 358,094,243 8.51 426,471,462 8.25 450,453,502 7.64--------------------------------------------------------------------------------------------------------------------------------------------------------------------------------------------------------------------------------------------------------------------------------------------------------
Exercisable at the end of the year 238,707,055 7.70 236,726,966 7.41 222,729,398 7.54
As share options are exercised continuously throughout the year, the weighted average share price during the year of $11.72 (2006 $11.85 and 2005
$10.77) is representative of the weighted average share price at the date of exercise. For the options outstanding at 31 December 2007, the exercise
price ranges and weighted average remaining contractual lives are shown below.
--------------------------------------------------------------------------------------------------------------------------------------------------------------------------------------------------------------------------------------------------------------------------------------------------------
Options outstanding Options exercisable--------------------------------------------------------------------------------------------------------------------------------------------------------------------------------------------------------------------------------------------------------------------------------------------------------
Weighted Weighted Weighted
Number average average Number average
of remaining life exercise price of exercise price
Range of exercise prices shares years $ shares $--------------------------------------------------------------------------------------------------------------------------------------------------------------------------------------------------------------------------------------------------------------------------------------------------------
$5.10 – $6.79 66,360,194 3.88 6.15 55,509,664 6.23
$6.80 – $8.50 162,364,928 4.00 8.02 156,236,204 8.04
$8.51 – $10.21 55,021,656 4.89 9.28 26,961,187 8.78
$10.22 – $11.92 74,347,465 7.80 11.13 – –--------------------------------------------------------------------------------------------------------------------------------------------------------------------------------------------------------------------------------------------------------------------------------------------------------
358,094,243 4.90 8.51 238,707,055 7.70
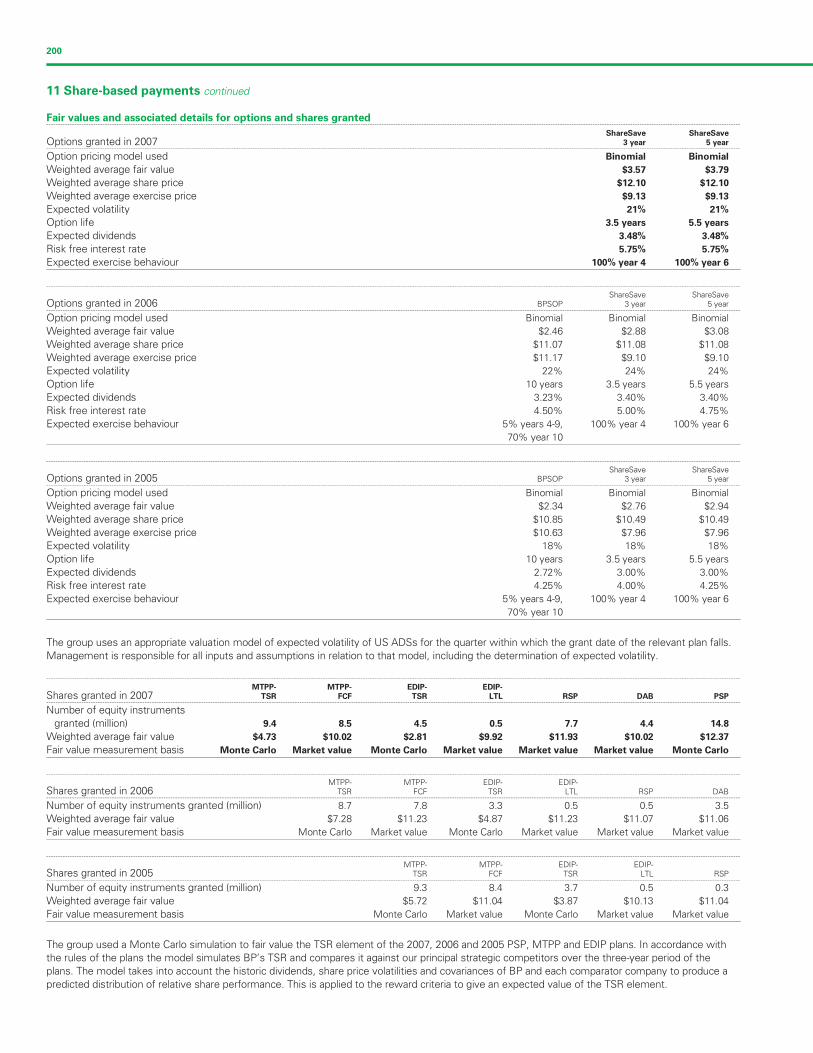
Filename: U54368_doc8.3d Time: 14:50:22 Date: 25/02/08
Checksum: -115545147
200
11 Share-based payments continued
Fair values and associated details for options and shares granted--------------------------------------------------------------------------------------------------------------------------------------------------------------------------------------------------------------------------------------------------------------------------------------------------------
ShareSave ShareSave
Options granted in 2007 3 year 5 year--------------------------------------------------------------------------------------------------------------------------------------------------------------------------------------------------------------------------------------------------------------------------------------------------------
Option pricing model used Binomial Binomial
Weighted average fair value $3.57 $3.79
Weighted average share price $12.10 $12.10
Weighted average exercise price $9.13 $9.13
Expected volatility 21% 21%
Option life 3.5 years 5.5 years
Expected dividends 3.48% 3.48%
Risk free interest rate 5.75% 5.75%
Expected exercise behaviour 100% year 4 100% year 6
--------------------------------------------------------------------------------------------------------------------------------------------------------------------------------------------------------------------------------------------------------------------------------------------------------
ShareSave ShareSaveOptions granted in 2006 BPSOP 3 year 5 year--------------------------------------------------------------------------------------------------------------------------------------------------------------------------------------------------------------------------------------------------------------------------------------------------------
Option pricing model used Binomial Binomial Binomial
Weighted average fair value $2.46 $2.88 $3.08
Weighted average share price $11.07 $11.08 $11.08
Weighted average exercise price $11.17 $9.10 $9.10
Expected volatility 22% 24% 24%
Option life 10 years 3.5 years 5.5 years
Expected dividends 3.23% 3.40% 3.40%
Risk free interest rate 4.50% 5.00% 4.75%
Expected exercise behaviour 5% years 4-9, 100% year 4 100% year 6
70% year 10
--------------------------------------------------------------------------------------------------------------------------------------------------------------------------------------------------------------------------------------------------------------------------------------------------------
ShareSave ShareSaveOptions granted in 2005 BPSOP 3 year 5 year--------------------------------------------------------------------------------------------------------------------------------------------------------------------------------------------------------------------------------------------------------------------------------------------------------
Option pricing model used Binomial Binomial Binomial
Weighted average fair value $2.34 $2.76 $2.94
Weighted average share price $10.85 $10.49 $10.49
Weighted average exercise price $10.63 $7.96 $7.96
Expected volatility 18% 18% 18%
Option life 10 years 3.5 years 5.5 years
Expected dividends 2.72% 3.00% 3.00%
Risk free interest rate 4.25% 4.00% 4.25%
Expected exercise behaviour 5% years 4-9, 100% year 4 100% year 6
70% year 10
The group uses an appropriate valuation model of expected volatility of US ADSs for the quarter within which the grant date of the relevant plan falls.
Management is responsible for all inputs and assumptions in relation to that model, including the determination of expected volatility.
--------------------------------------------------------------------------------------------------------------------------------------------------------------------------------------------------------------------------------------------------------------------------------------------------------
MTPP- MTPP- EDIP- EDIP-
Shares granted in 2007 TSR FCF TSR LTL RSP DAB PSP--------------------------------------------------------------------------------------------------------------------------------------------------------------------------------------------------------------------------------------------------------------------------------------------------------
Number of equity instruments
granted (million) 9.4 8.5 4.5 0.5 7.7 4.4 14.8
Weighted average fair value $4.73 $10.02 $2.81 $9.92 $11.93 $10.02 $12.37
Fair value measurement basis Monte Carlo Market value Monte Carlo Market value Market value Market value Monte Carlo
--------------------------------------------------------------------------------------------------------------------------------------------------------------------------------------------------------------------------------------------------------------------------------------------------------
MTPP- MTPP- EDIP- EDIP-Shares granted in 2006 TSR FCF TSR LTL RSP DAB--------------------------------------------------------------------------------------------------------------------------------------------------------------------------------------------------------------------------------------------------------------------------------------------------------
Number of equity instruments granted (million) 8.7 7.8 3.3 0.5 0.5 3.5
Weighted average fair value $7.28 $11.23 $4.87 $11.23 $11.07 $11.06
Fair value measurement basis Monte Carlo Market value Monte Carlo Market value Market value Market value
--------------------------------------------------------------------------------------------------------------------------------------------------------------------------------------------------------------------------------------------------------------------------------------------------------
MTPP- MTPP- EDIP- EDIP-Shares granted in 2005 TSR FCF TSR LTL RSP--------------------------------------------------------------------------------------------------------------------------------------------------------------------------------------------------------------------------------------------------------------------------------------------------------
Number of equity instruments granted (million) 9.3 8.4 3.7 0.5 0.3
Weighted average fair value $5.72 $11.04 $3.87 $10.13 $11.04
Fair value measurement basis Monte Carlo Market value Monte Carlo Market value Market value
The group used a Monte Carlo simulation to fair value the TSR element of the 2007, 2006 and 2005 PSP, MTPP and EDIP plans. In accordance with
the rules of the plans the model simulates BP’s TSR and compares it against our principal strategic competitors over the three-year period of the
plans. The model takes into account the historic dividends, share price volatilities and covariances of BP and each comparator company to produce a
predicted distribution of relative share performance. This is applied to the reward criteria to give an expected value of the TSR element.
Filename: U54368_doc8.3d Time: 14:50:23 Date: 25/02/08
Checksum: -1741505441
BP ANNUAL REPORT AND ACCOUNTS 2007 201
11 Share-based payments continued
Accounting expense does not necessarily represent the actual value of share-based payments made to recipients, which are determined by the
remuneration committee according to established criteria.
12 Auditors’ remuneration
Fees payable to the company’s auditors for the audit of the company’s accounts were $18 million (2006 $15 million and 2005 $19 million).
Remuneration receivable by the company’s auditors for the supply of other services to the company is not presented in the parent company
accounts as this information is provided in the group accounts.
13 Directors’ remuneration
Remuneration of directors $ million--------------------------------------------------------------------------------------------------------------------------------------------------------------------------------------------------------------------------------------------------------------------------------------------------------
2007 2006 2005--------------------------------------------------------------------------------------------------------------------------------------------------------------------------------------------------------------------------------------------------------------------------------------------------------
Total for all directors
Emoluments 26 14 18
Gains made on the exercise of share options 2 12 –
Amounts awarded under incentive schemes 10 14 8
Emoluments
These amounts comprise fees paid to the non-executive chairman and the non-executive directors and, for executive directors, salary and benefits
earned during the relevant financial year, plus bonuses awarded for the year. This includes an ex gratia superannuation payment of $3 million
(2006 and 2005 nil) and compensation for loss of office of $1 million (2006 and 2005 nil).
Pension contributions
Six executive directors participated in a non-contributory pension scheme established for UK staff by a separate trust fund to which contributions are
made by BP based on actuarial advice. One US executive director participated in the US BP Retirement Accumulation Plan during 2007.
Office facilities for former chairmen and deputy chairmen
It is customary for the company to make available to former chairmen and deputy chairmen, who were previously employed executives, the use of
office and basic secretarial facilities following their retirement. The cost involved in doing so is not significant.
Further information
Full details of individual directors’ remuneration are given in the directors’ remuneration report on pages 63-73.

Filename: U54368_doc8.3d Time: 14:50:23 Date: 25/02/08
Checksum: 788557500
202
This page is intentionally left blank.

Filename: U54368_doc8.3d Time: 14:50:23 Date: 25/02/08
Checksum: 414757801
BP ANNUAL REPORT AND ACCOUNTS 2007 203
This page is intentionally left blank.

Filename: U54368_doc8.3d Time: 14:50:23 Date: 25/02/08
Checksum: 788557207
204
This page is intentionally left blank.

Filename: U54368_doc8.3d Time: 14:50:23 Date: 25/02/08
Checksum: 414760217
BP ANNUAL REPORT AND ACCOUNTS 2007 205
This page is intentionally left blank.

Filename: U54368_doc8.3d Time: 14:50:23 Date: 25/02/08
Checksum: 788556381
206
This page is intentionally left blank.

Filename: U54368_doc8.3d Time: 14:50:23 Date: 25/02/08
Checksum: 414758674
BP ANNUAL REPORT AND ACCOUNTS 2007 207
This page is intentionally left blank.

Filename: U54368_doc8.3d Time: 14:50:23 Date: 25/02/08
Checksum: 788557739
208
This page is intentionally left blank.
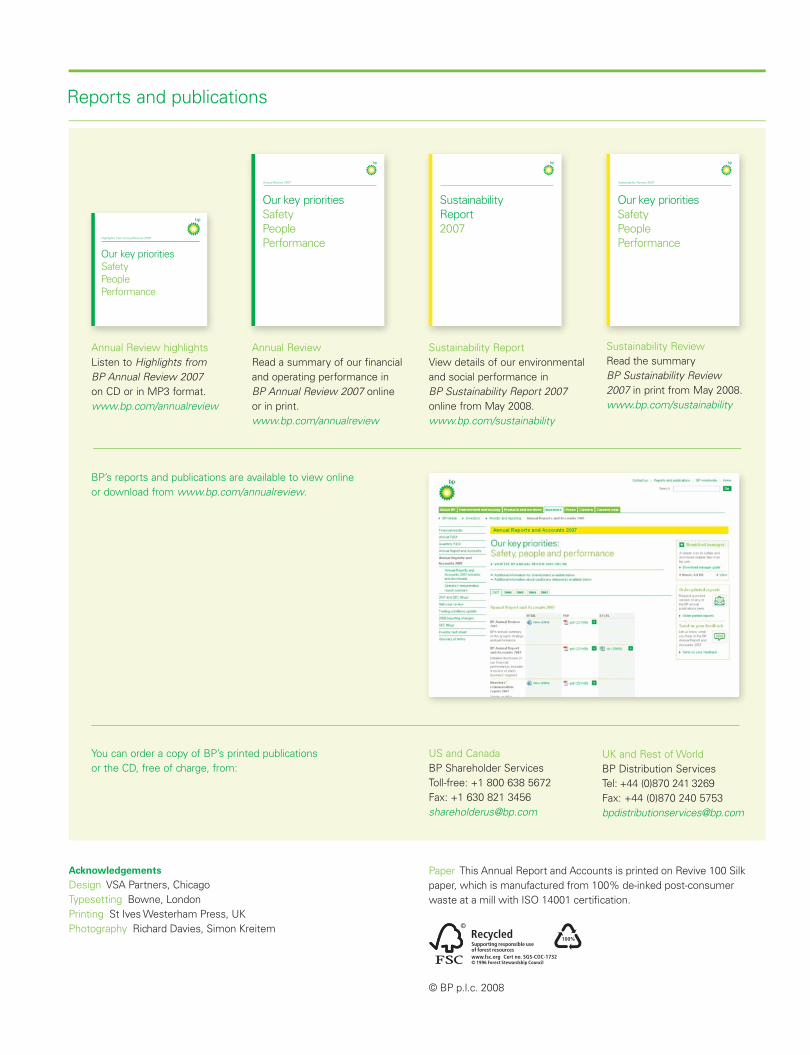
Reports and publications
Our key prioritiesSafetyPeoplePerformance
Annual Review 2007
Our key prioritiesSafetyPeoplePerformance
Sustainability Review 2007
Sustainability Report 2007
Our key priorities SafetyPeoplePerformance
Highlights from Annual Review 2007
Annual Review highlightsListen to Highlights from BP Annual Review 2007 on CD or in MP3 format.www.bp.com/annualreview
Annual Review Read a summary of our financialand operating performance in BP Annual Review 2007 online or in print.www.bp.com/annualreview
Sustainability Report View details of our environmental and social performance in BP Sustainability Report 2007 online from May 2008. www.bp.com/sustainability
Sustainability ReviewRead the summary BP Sustainability Review 2007 in print from May 2008.www.bp.com/sustainability
BP’s reports and publications are available to view online or download from www.bp.com/annualreview.
You can order a copy of BP’s printed publications or the CD, free of charge, from:
US and CanadaBP Shareholder ServicesToll-free: +1 800 638 5672Fax: +1 630 821 [email protected]
UK and Rest of WorldBP Distribution ServicesTel: +44 (0)870 241 3269Fax: +44 (0)870 240 [email protected]
AcknowledgementsDesign VSA Partners, ChicagoTypesetting Bowne, LondonPrinting St Ives Westerham Press, UKPhotography Richard Davies, Simon Kreitem
Paper This Annual Report and Accounts is printed on Revive 100 Silk paper, which is manufactured from 100% de-inked post-consumer waste at a mill with ISO 14001 certifi cation.
© BP p.l.c. 2008
C13862_BP_Report_Cover_Icon.indd BC3C13862_BP_Report_Cover_Icon.indd BC3 15/2/08 16:47:1415/2/08 16:47:14

beyond petroleum®
www.bp.com
Annual Reportand Accounts2007
BP A
nnual Report and A
ccounts 2007
C13862_BP_Report_Cover_Icon.indd BC2C13862_BP_Report_Cover_Icon.indd BC2 15/2/08 09:20:3015/2/08 09:20:30


