41
Bridgemere Land PLC and Redrow Homes Ltd Hartford Transport Note

Bridgemere Land PLC and Redrow Homes Ltd
Hartford
Transport Note

i
Contents
1 INTRODUCTION .......................................................................................................... 1
2 BACKGROUND ........................................................................................................... 2
Sustainability ............................................................................................................. 2
Traffic ........................................................................................................................ 6
Committed Mobility Improvements ............................................................................ 6
3 THE PROPOSAL ........................................................................................................... 8
Accessibility ............................................................................................................... 9
Traffic ...................................................................................................................... 10
4 SUMMARY & CONCLUSION ...................................................................................... 13
Figures
Figure 2.1 - Site Location in Local Context
Figure 2.2 - Active Travel Connections
Figure 2.3 - Public Transport Connections
Figure 3.1 - Site Location
Figure 3.2 - Local Accessibility
Figure 3.3 - Consented Vehicular Access on School Road
Appendices
Appendix A - Aerial Plans
Appendix B - Congestion Levels in 2012
Appendix C - DfT on A559
Appendix D - Travel Isochrones
Appendix E - Technical Note
Appendix F - PICADY Output

The Hollies, Hartford 1
H:\Projects\W140000\W141220 - The Hollies, Hartford\141220B - The Hollies, Hartford\WORD\R01-EA-141220-Transport
Note-Final.docx
April 2017
1 INTRODUCTION
1.1 This transport report supports the proposal by Bridgemere Land PLC and Redrow Homes Ltd
for 276 homes, a net increase of 205 homes to its consented and implemented development
of 350 homes at The Hollies, Hartford.
1.2 The proposal is contained within land defined by the Neighbourhood Plan1 as Hartford’s
settlement boundary.
1.3 The context of transport in Hartford, and at The Hollies, is set out by the February 2013
Inspector’s report for the planning appeals into development at The Hollies and Land at
Grange Farm, and the subsequent Secretary of State determination in November 20132.
1.4 The Secretary of State concluded that both developments represented sustainable
development, that the proposals would have an adverse impact on queuing on the highway
network in the morning peak, but that this effect does not represent severe impact on the
transportation network.
1.5 There has been no significant change to transport provision in the area since that decision,
and the superior policy document, the NPPF, remains relevant and unchanged. Therefore, it
is reasonable to conclude that an extension to The Hollies, within the Settlement Boundary,
represents sustainable development. It is reasonable to conclude that, based on the
judgements applied by the Inspector and the Secretary of State that the residual cumulative
transport impacts are not severe, and so this is not a material matter for the planning
balance.
1.6 We explain that it is reasonable to conclude that the proposal contributes positively to local
sustainable living, and in transport terms this is a good location for new housing
development.
1 Hartford’s Neighbourhood Plan, March 2016, p.35 2 Secretary of State Determination, 18 November 2013, Ref. APP/A0665/A/12/2179374

The Hollies, Hartford 2
H:\Projects\W140000\W141220 - The Hollies, Hartford\141220B - The Hollies, Hartford\WORD\R01-EA-141220-Transport
Note-Final.docx
April 2017
2 BACKGROUND
2.1 The site location in the context of Hartford, committed housing development, schools and
facilities is illustrated in Figure 2.1.
Figure 2.1 – Site Location in Local Context
Sustainability
2.2 Figure 2.2 establishes the local active travel (walking and cycling) connections, and Figure 2.3
shows the public transport connections. Appendix A puts this into context on aerial
photographs.

The Hollies, Hartford 3
H:\Projects\W140000\W141220 - The Hollies, Hartford\141220B - The Hollies, Hartford\WORD\R01-EA-141220-Transport
Note-Final.docx
April 2017
Figure 2.2 – Local Active Travel Connections
Figure 2.3 – Local Public Transport Connections
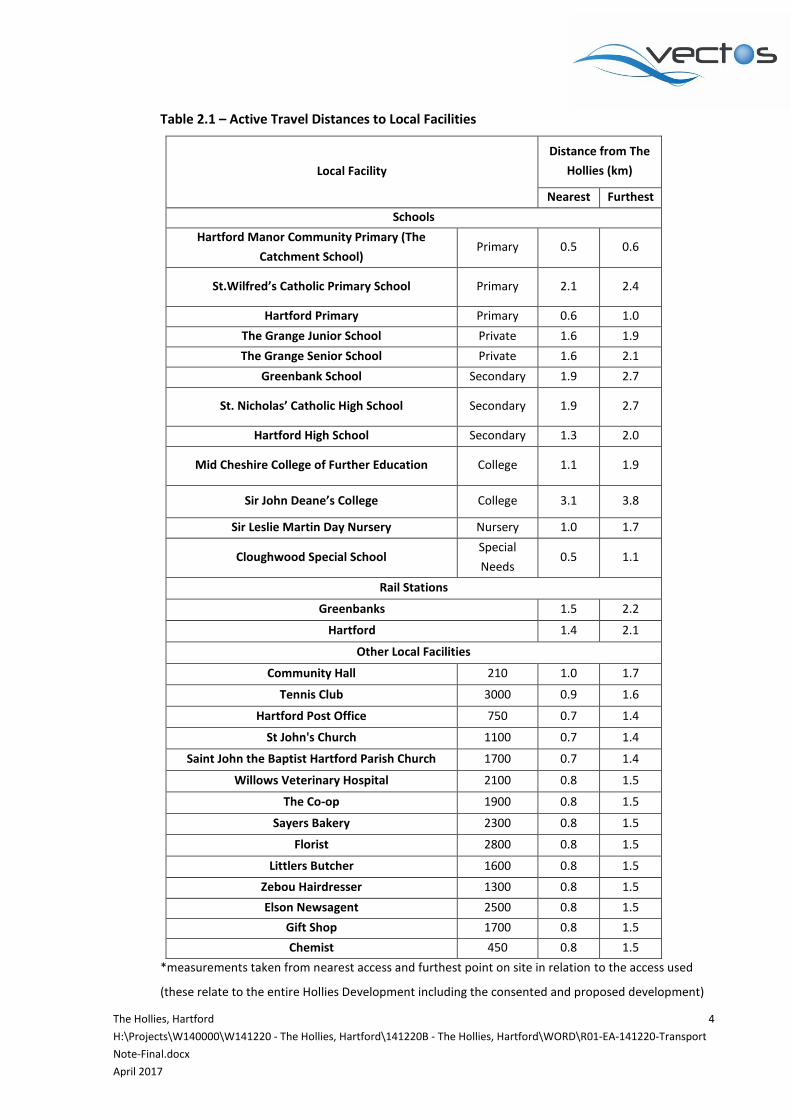
2.3 The propensity to walk and cycle (take active travel) is a function of the quality of the
community, ease and relative attractiveness compared with other options. Distance is one
determinant, but not the only determinant. Table 2.1 summarised the active travel distances
to local facilities.
The Hollies, Hartford 4
H:\Projects\W140000\W141220 - The Hollies, Hartford\141220B - The Hollies, Hartford\WORD\R01-EA-141220-Transport
Note-Final.docx
April 2017
Table 2.1 – Active Travel Distances to Local Facilities
Local Facility
Distance from The
Hollies (km)
Nearest Furthest
Schools
Hartford Manor Community Primary (The
Catchment School) Primary 0.5 0.6
St.Wilfred’s Catholic Primary School Primary 2.1 2.4
Hartford Primary Primary 0.6 1.0
The Grange Junior School Private 1.6 1.9
The Grange Senior School Private 1.6 2.1
Greenbank School Secondary 1.9 2.7
St. Nicholas’ Catholic High School Secondary 1.9 2.7
Hartford High School Secondary 1.3 2.0
Mid Cheshire College of Further Education College 1.1 1.9
Sir John Deane’s College College 3.1 3.8
Sir Leslie Martin Day Nursery Nursery 1.0 1.7
Cloughwood Special School Special
Needs 0.5 1.1
Rail Stations
Greenbanks 1.5 2.2
Hartford 1.4 2.1
Other Local Facilities
Community Hall 210 1.0 1.7
Tennis Club 3000 0.9 1.6
Hartford Post Office 750 0.7 1.4
St John's Church 1100 0.7 1.4
Saint John the Baptist Hartford Parish Church 1700 0.7 1.4
Willows Veterinary Hospital 2100 0.8 1.5
The Co-op 1900 0.8 1.5
Sayers Bakery 2300 0.8 1.5
Florist 2800 0.8 1.5
Littlers Butcher 1600 0.8 1.5
Zebou Hairdresser 1300 0.8 1.5
Elson Newsagent 2500 0.8 1.5
Gift Shop 1700 0.8 1.5
Chemist 450 0.8 1.5
*measurements taken from nearest access and furthest point on site in relation to the access used
(these relate to the entire Hollies Development including the consented and proposed development)

The Hollies, Hartford 5
H:\Projects\W140000\W141220 - The Hollies, Hartford\141220B - The Hollies, Hartford\WORD\R01-EA-141220-Transport
Note-Final.docx
April 2017
2.4 The public transport connectivity is summarised in Table 2.2.
Table 2.2 – Summary of Public Transport Connectivity - Buses
Service Route First
Bus
Last
Bus
Frequency (minutes) Operator
Weekday Saturday Sunday
1 Northwich - Weaverham
Circular 07:11 19:31 20 20 60
Arriva
29/ A Northwich - Over St Johns 06:07 18:25 30 30 -
Over St Johns - Northwich 07:13 19:57 30 30 -
31 Northwich - Winsford - Crewe 07:18 17:23 60 60 -
Crewe - Winsford - Northwich 06:51 18:55 60 60 -
37A/ E Northwich - Crewe 06:20 17:53 60 60 -
Crewe - Northwich 08:04 19:12 60 60 -
45 Northwich – Warrington 16:33 - 1 per day - - Network
Warrington Warrington - Northwich 08:36 - 1 per day - -
48/ A Northwich - Frodsham 09:10 16:50 120 - - Howards
Travel Frodsham - Northwich 08:25 16:38 120 - -
82/ A/ B
Northwich - Sandiway - Tarvin -
Chester 07:05 18:05 60 60 -
Arriva Chester - Tarvin - Sandiway -
Northwich 08:30 19:23 60 60 -
Table 2.3 – Summary of Public Transport Connectivity – Rail
Destination Closest
Station Links
Frequency (minutes)
Weekday Saturday Sunday
Manchester
Piccadilly Greenbank
Northwich, Lostock Gralam, Plumley,
Knutsford, Mobberley, Ashley, Hale
(Manchester, Altrincham, Navigation Road,
Stockport, Heaton Chapel, Levenshulme
60 60 60
Chester Cuddington, Delamere, Mouldsworth 60 60 120
Liverpool
Lime Street
Hartford
Runcorn, Liverpool South Parkway 60 30 60
Birmingham
New Street
Crewe, Stafford, Penkridge,
Wolverhampton, Smethwick Galton Bridge 30 30 60
2.5 The consented Hollies development already provides substantial benefits in terms of the
Government’s objective to secure the creation of high quality, sustainable, mixed and
The Hollies, Hartford 6
H:\Projects\W140000\W141220 - The Hollies, Hartford\141220B - The Hollies, Hartford\WORD\R01-EA-141220-Transport
Note-Final.docx
April 2017
inclusive communities3. The social benefits include the availability of day to day services
within walking distance, a variety of education facilities within the community and the
proximity of sustainable commuting opportunities4.
2.6 Hartford is a sustainable location, with an extraordinary range of educational facilities5.
Travel relating to education makes up about 50% of morning peak hour movement6, and so
Hartford, and the extension of The Hollies, is in principle an excellent location for growing
the sustainable community.
Traffic
2.7 Hartford currently suffers from congestion7 at peak commuting and school drop-off and pick-
up times. Appendix B summarises the position in 2012.
2.8 The limiting capacity of the local highway network has maintained zero growth over many
years8 and this has been the case despite general and development related growth over
time. This is likely to be the consequence of the inconvenience resulting from congestion,
and indicative of a supressed demand for trips.
2.9 In situations such as this, the right place for the right home is a sustainable location, where
many day to day facilities are available within walking distance and particularly where
education facilities exist within the local community. This is what the location of the proposal
achieves.
Committed Mobility Improvements
2.10 The approved Hollies development has committed to a number of transport measures,
which include:
Funding a Travel Plan Coordinator for a period of ten years from first occupation, or five
years post final completion (whichever is the later);
Issue of a Travel Information Pack for each household upon occupation;
3 February 2013, Inspector’s Report, paragraph 14.37 4 February 2013, Inspector’s Report, paragraph 14.36 5 February 2013, Inspector’s Report, paragraph 14.29 6 National Travel Survey (NTS) 2016 – Table NTS0502 7 February 2013, Inspector’s Report, paragraph 14.39 8 Appendix C – DfT Traffic Count Data on A559 in Hartford
The Hollies, Hartford 7
H:\Projects\W140000\W141220 - The Hollies, Hartford\141220B - The Hollies, Hartford\WORD\R01-EA-141220-Transport
Note-Final.docx
April 2017
Issue of a cycle or scooter voucher at each first household occupation and
encouragement of cycle to work scheme;
Improvements to, or funding of improvements to Greenbank Railway Station
Funding the provision of cycle and scooter parking at Hartford High School
Funding a footpath link through the Hartford Campus
Funding cycle and scooter parking at Hartford Manor Community Primary School
Funding a footpath from the development through Marshall’s Arm Natures Reserve to
Hartford Manor Community Primary School
Funding a walking bus shelter, cycle and scooter parking at Hartford Primary School
Funding improvements at Hartford Railway Station
Funding improvements to the footpaths along the Weaver Navigation Towpath
A Travel Plan Reserve Fund
2.11 Taken together these result in better permeability, better environment and better provision
of sustainable transport measures for the benefit of the wider community.

The Hollies, Hartford 8
H:\Projects\W140000\W141220 - The Hollies, Hartford\141220B - The Hollies, Hartford\WORD\R01-EA-141220-Transport
Note-Final.docx
April 2017
3 THE PROPOSAL
3.1 The proposal is for an intensification to the existing consented development of 350 homes at
The Hollies to a total of 555, resulting in a net increase of 205 homes. This includes land
within the previous Hollies consent.
Figure 3.1 – Site Location within Settlement Boundary
3.2 It draws the development boundary towards the southern edge of the Settlement Boundary,
and creates an active travel route that flows through the community, linking Hartford village
centre with the Weaver Navigation.

The Hollies, Hartford 9
H:\Projects\W140000\W141220 - The Hollies, Hartford\141220B - The Hollies, Hartford\WORD\R01-EA-141220-Transport
Note-Final.docx
April 2017
Accessibility
Figure 3.2 – Local Accessibility
3.3 The development is accessed from six places, including three active travel accesses linking to
the Weaver Navigation, and the committed Hollies development in four places. The
committed Hollies scheme links on to the Marshall’s Arm Nature Reserve, Douglas Close, and
School Lane by active travel routes.
3.4 Vehicular access is in two places to the committed Hollies scheme, with linkages on to School
Lane and Douglas Close (continuation of road link). The consented, and now constructed,
access arrangement is demonstrated in Figure 3.3.

The Hollies, Hartford 10
H:\Projects\W140000\W141220 - The Hollies, Hartford\141220B - The Hollies, Hartford\WORD\R01-EA-141220-Transport
Note-Final.docx
April 2017
Figure 3.3 – Consented & Implemented Vehicular Access on to School Road
3.5 The Mobility measures associated with the proposal include:
Extending the funding of The Hollies Travel Plan tying in with the community Travel
Plan9;
An extension of The Hollies cycle and scooter voucher scheme;
Active travel connection to the Weaver Navigation; and
Funding further improvements to active travel routes, subject to detailed discussion
with the relevant authorities
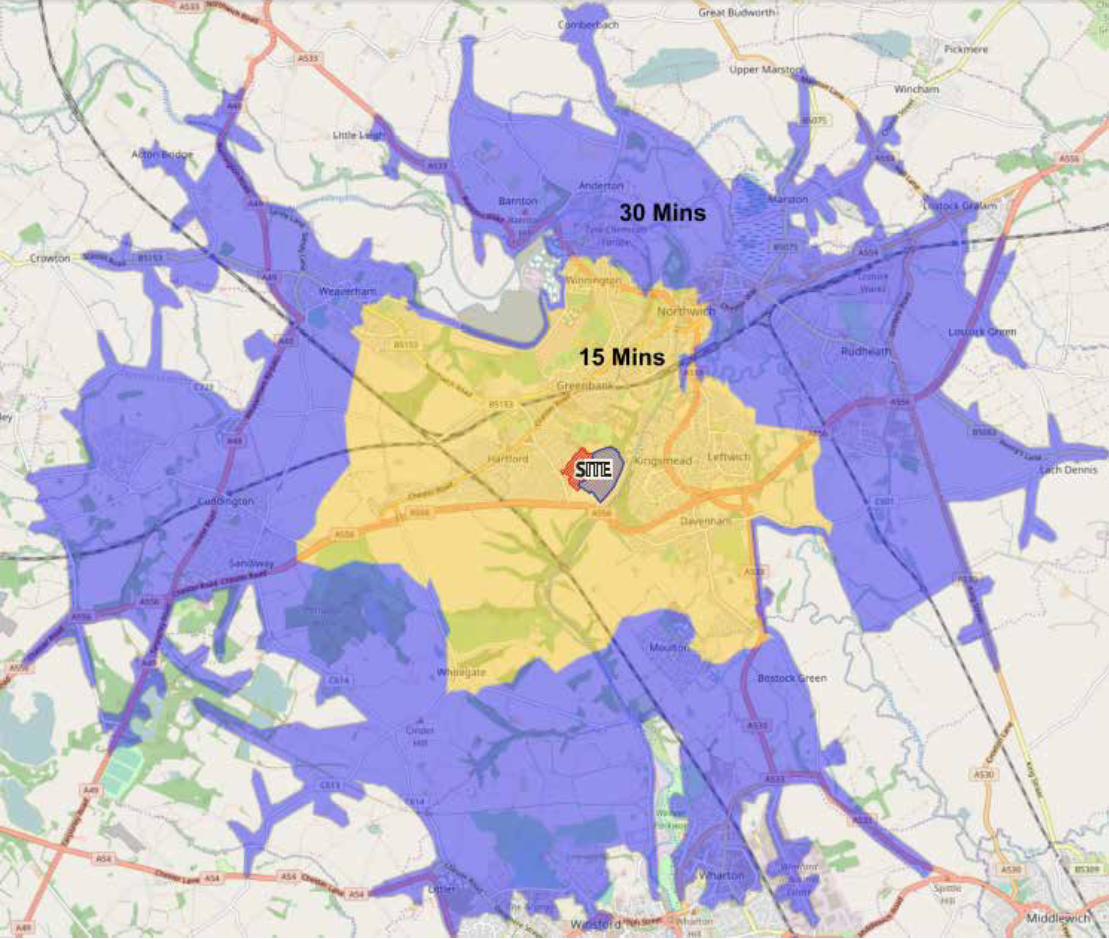
3.6 Indicative travel isochrones from the site (measured from the access onto School Lane),
taking into account the committed links from The Hollies development, and those included
with the proposals, are set out in Appendix D.
Traffic
3.7 This development will intensify the demand on the junction of School Lane with The Hollies.
9 Hartford’s Neighbourhood Plan 2010-2030, p.28

The Hollies, Hartford 11
H:\Projects\W140000\W141220 - The Hollies, Hartford\141220B - The Hollies, Hartford\WORD\R01-EA-141220-Transport
Note-Final.docx
April 2017
3.8 On the basis of an unfettered additional demand, calculated on the same basis as that
presented to the Inspector at the 2012 Inquiry, the junction will continue to perform within
its theoretical limits within the peak commuter hour. The general calculations are set out in
Appendix E.
3.9 The summary of performance based on 50 dwellings using the Douglas Close access,
therefore assuming 505 dwellings using the School Lane access following implementation of
this proposal, is set out in Tables 3.1 and 3.2. However, a robust assessment using a
proposed housing number of 517 dwellings accessed by the School Lane access has been
used.
Table 3.1 – Summary of Performance of School Lane/ The Hollies Junction – AM
AM Peak 567 dwellings
Max Q Max RFC
Arm A School Lane N - -
Arm B Site Access 6 0.89
Arm C School Lane S 1 0.20
Table 3.2 – Summary of Performance of School Lane/ The Hollies Junction - PM
PM Peak 567 dwellings
Max Q Max RFC
Arm A School Lane N - -
Arm B Site Access 6 0.88
Arm C School Lane S 9 0.84
3.10 If the unfettered demand continued through the network, it would add approximately 40
vehicles (circa 1 vehicle every 1½ minutes) northbound on School Lane. This is not significant.
This will not change the character or performance of the highway network. The PICADY
output is set out in Appendix F.
3.11 This takes no account of the effect on behaviour of congestion and alternatives. In practice,
it is reasonable to conclude that such behavioural change will occur and the continuation of
some suppressed demand would be likely10.
10 February 2013, Inspector’s Report, paragraph 14.60
The Hollies, Hartford 12
H:\Projects\W140000\W141220 - The Hollies, Hartford\141220B - The Hollies, Hartford\WORD\R01-EA-141220-Transport
Note-Final.docx
April 2017
3.12 Furthermore, any additional delay carries less weight in the planning context as it is not the
aim of policy to protect the convenience of commuting car drivers11. The Inspector at the
2012 Inquiry made a judgement that an additional 66 vehicles, and an average additional
delay of over 1 minute at the junction of The Green and Chester Road, would not have a
severe effect on traffic conditions in Hartford12. He made the judgement that whilst there
was an adverse impact it could not be characterised as severe compared with the existing
situation13.
3.13 The proposal provides development in the right location, and the traffic effects are well
within the bounds of what has already been considered reasonable in the context of policy.
11 February 2013, Inspector’s Report, paragraph 14.45 12 February 2013, Inspector’s Report, paragraph 14.63 13 February 2013, Inspector’s Report, paragraph 14.50
The Hollies, Hartford 13
H:\Projects\W140000\W141220 - The Hollies, Hartford\141220B - The Hollies, Hartford\WORD\R01-EA-141220-Transport
Note-Final.docx
April 2017
4 SUMMARY & CONCLUSION
4.1 This transport report supports the proposal for intensification of the consented and
implemented development of 350 dwellings at The Hollies, Hartford, to a total of 555
dwellings.
4.2 There has been no significant change to transport provision in Hartford, or the wider area
since the Inspector’s Report in 2013. Indeed, the traffic levels on the A559 have experienced
practically zero growth in the last fifteen years.
4.3 As exemplified by the Inspector in 2013, this site is located in a good location to encourage
travel by sustainable modes, especially for education purposes to the multitude of local
schools. The key to delivering this intensification of development is maintaining that
sustainability and the forecast social benefits within the existing consents.
4.4 There is no good reason to assume that this intensification will mar the social and
community benefits foreseen at this development. There is in fact a case to be made that the
larger the site, the greater this benefit. Building this critical mass provides an intensification
for the opportunity for social inclusion and sustainable travel choices, as well as increase in
funding.
4.5 As detailed in this report, there will be some adverse impacts on traffic. Whilst this is a
consideration of the scheme, the Inspector specifically indicated that the consented scheme
did not approach any limit to consider it unacceptable. Certainly, it is not the purpose of
planning policy to protect the convenience of the car driver.
4.6 In conclusion, our judgement is that the intensification to provide an extra 205 homes at The
Hollies is not ‘severe’ and certainly not enough to outweigh the benefits.

APPENDIX A

Weekday Saturday Sunday1 Northwich - Weaverham Circular 07:11 19:31 20 20 60
29/ A Northwich - Over St Johns 06:07 18:25 30 30 -Over St Johns - Northwich 07:13 19:57 30 30 -
31 Northwich - Winsford - Crewe 07:18 17:23 60 60 -Crewe - Winsford - Northwich 06:51 18:55 60 60 -
37A/ E Northwich - Crewe 06:20 17:53 60 60 -Crewe - Northwich 08:04 19:12 60 60 -
48/ A Northwich - Frodsham 09:10 16:50 120 - -Frodsham - Northwich 08:25 16:38 120 - -
82/ A/ B Northwich - Sandiway - Tarvin - Chester 07:05 18:05 60 60 -Chester - Tarvin - Sandiway - Northwich 08:30 19:23 60 60 -
OperatorFrequency (minutes)
Last BusFirst BusRouteService
Howards Travel
Arriva
Arriva
CLIENT:
PROJECT:
DRAWING TITLE :
DRAWN: CHECKED: DATE:
DRAWING NUMBER:
Key
EACLE 24.02.17
Land East of School Lane
Bridgemere Land Plc and
Redrow Homes Ltd
Active Travel
Footpath
Sustrans Route
Bridleway
Controlled Crossing
Proposed Footway
SITE

APPENDIX B

Queue Length Profiles (Vehicles)
Term Time (Tuesday 11/09/2012) School Holidays (Wednesday 29/08/2012)
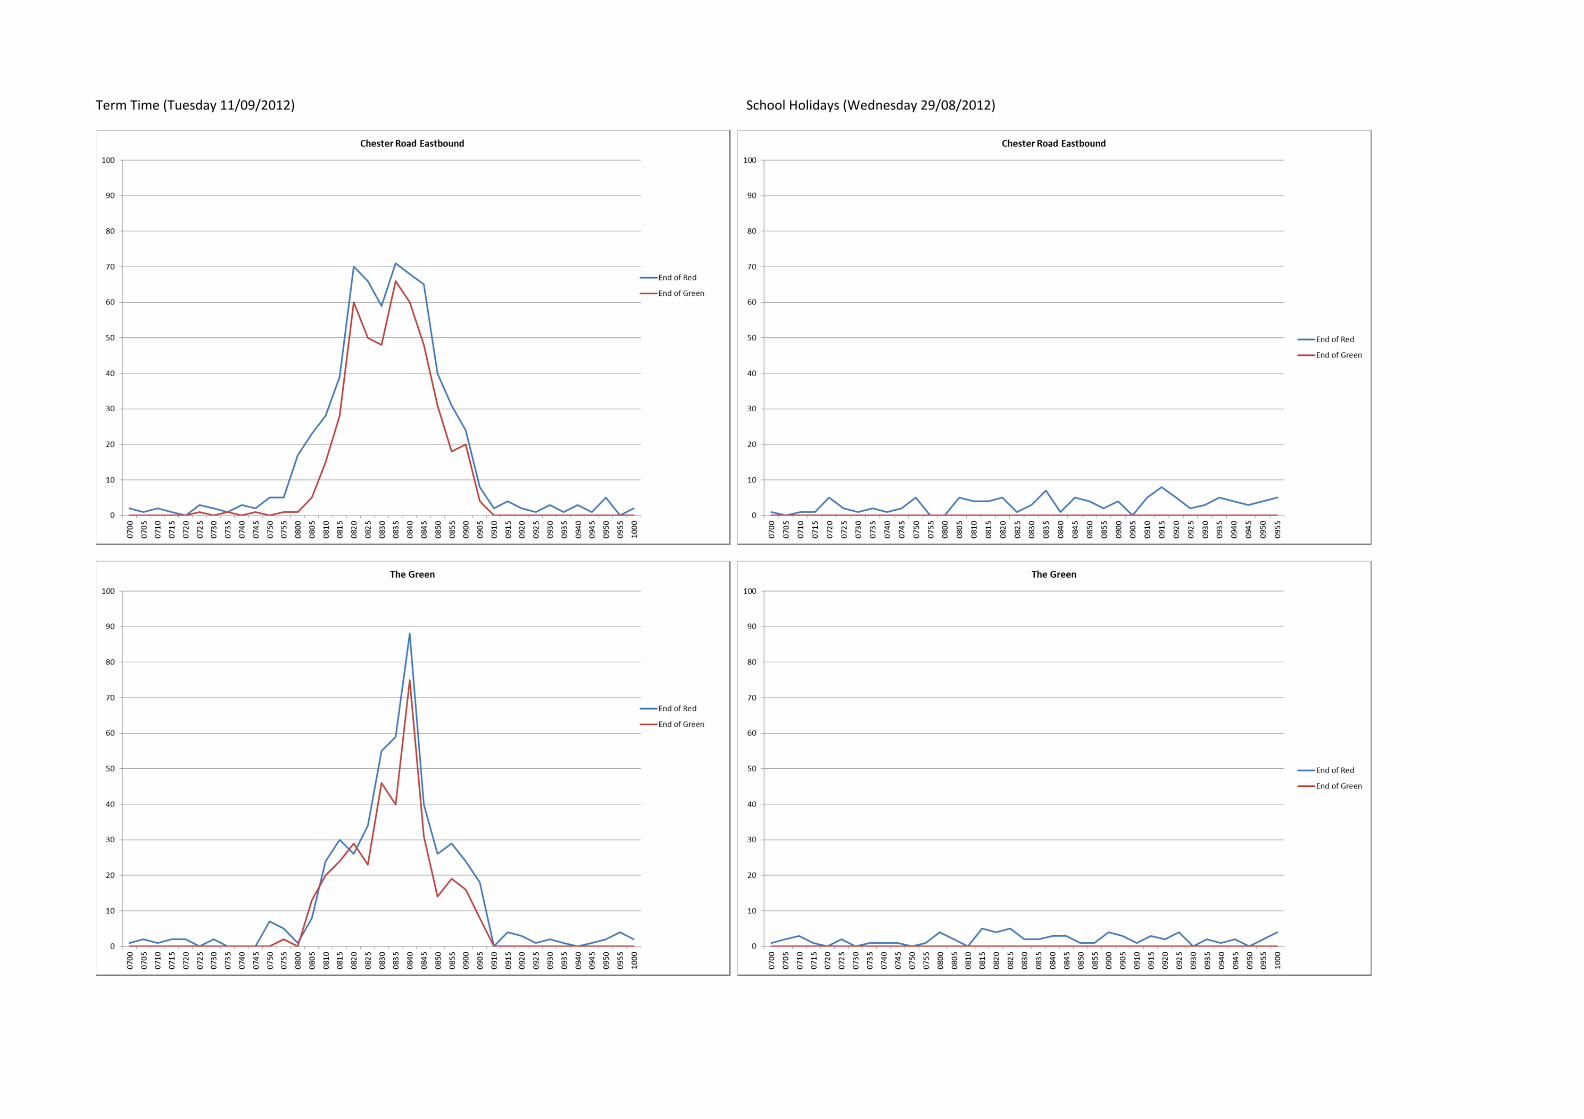
Term Time (Tuesday 11/09/2012) School Holidays (Wednesday 29/08/2012)
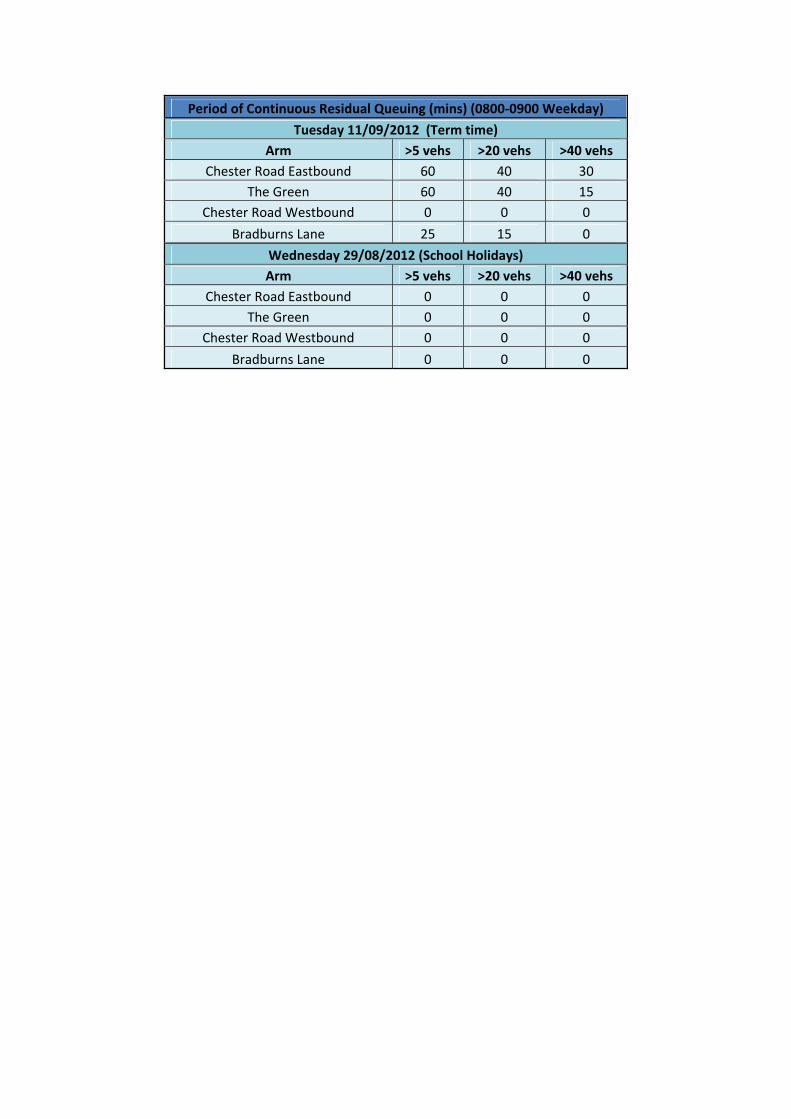
Period of Continuous Residual Queuing (mins) (0800‐0900 Weekday)
Tuesday 11/09/2012 (Term time)
Arm >5 vehs >20 vehs >40 vehs
Chester Road Eastbound 60 40 30 The Green 60 40 15
Chester Road Westbound 0 0 0 Bradburns Lane 25 15 0
Wednesday 29/08/2012 (School Holidays)
Arm >5 vehs >20 vehs >40 vehs
Chester Road Eastbound 0 0 0 The Green 0 0 0
Chester Road Westbound 0 0 0 Bradburns Lane 0 0 0

APPENDIX C

AADF obtained from DfT 'Traffic Counts' database
37329 77841
2000 16280 8662
2001 18770 8941
2002 16292 9188
2003 17044 9447
2004 13350 9661
2005 15596 9628
2006 15880 9816
2007 16234 9781
2008 16027 9469
2009 16340 8144
2010 16391 8020
2011 16492 8096
2012 16316 7925
2013 16294 7846
2014 16778 8002
2015 17147 7977
Year
Total Vehicles (AADF) - Count
Location
0
2000
4000
6000
8000
10000
12000
14000
16000
18000
20000
20
00
20
01
20
02
20
03
20
04
20
05
20
06
20
07
20
08
20
09
20
10
20
11
20
12
20
13
20
14
20
15
AADF 2000-2015
A559 (north) A559 (south)

APPENDIX D

30 Mins
15 Mins SITE

APPENDIX E

The Hollies, School Lane, Hartford
Residential Capacity Assessment
Introduction
1. Vectos have been retained by Bridgemere Land PLC and Redrow Homes Ltd to provide
transportation advice in relation to the Hollies Farm site that is located on land to the
east of School Lane in Hartford, Northwich, Cheshire.
2. A planning application (reference 11/05805/OUT) was submitted to Cheshire West and
Chester (CWAC) in December 2011 for the Hollies Farm site comprising of 350 dwellings
and associated amenity areas together with a new access onto School Lane. The
application was refused by CWAC in June 2012 along with the Grange Farm site located
in close proximity to the Hollies site in Hartford. The LPA refused the application for the
following two reasons:
1. The development proposals would have a severe impact on the highway network.
It is considered that the mitigation measures proposed are insufficient to
overcome such impact. Accordingly, the proposal is contrary to the provisions of
the National Planning Policy Framework and Policy T1 of the Vale Royal Borough
Local Plan First Review Alteration 2006.
2. Insufficient information has been provided as to the transport impact that the
proposed development would have on the Northwich Vision Area. Accordingly,
the proposal is contrary to Policy GS9P of the Vale Royal Borough Local Plan First
Review Alteration 2006.
3. An appeal was lodged and a Public Inquiry sat in December 2012. Prior to the Public
Inquiry commencing, the second reason for refusal was withdrawn. The
recommendation of the Inspector was for the appeal to be allowed and planning
permission granted for 350 dwellings and this was supported by the Secretary of State.
Consented Scheme
4. The access arrangements into the Hollies site comprised of a new priority junction on
School Lane in the form of a simple priority junction arrangement and the existing
access from Douglas Close via School Lane/Whitehall.
5. It was noted in the CBO Transport Assessment that was submitted with the application
that whilst the School Lane junction would be the primary access serving the site,
agreement was reached with CWaC that Douglas Close and the existing School
Lane/Whitehall Drive junction could accommodate up to 225 dwellings on the site. As a
Page: 2
separate access was being provided from School Lane the Transport Assessment
reported that only 50 dwellings would be accessed from Douglas Close.
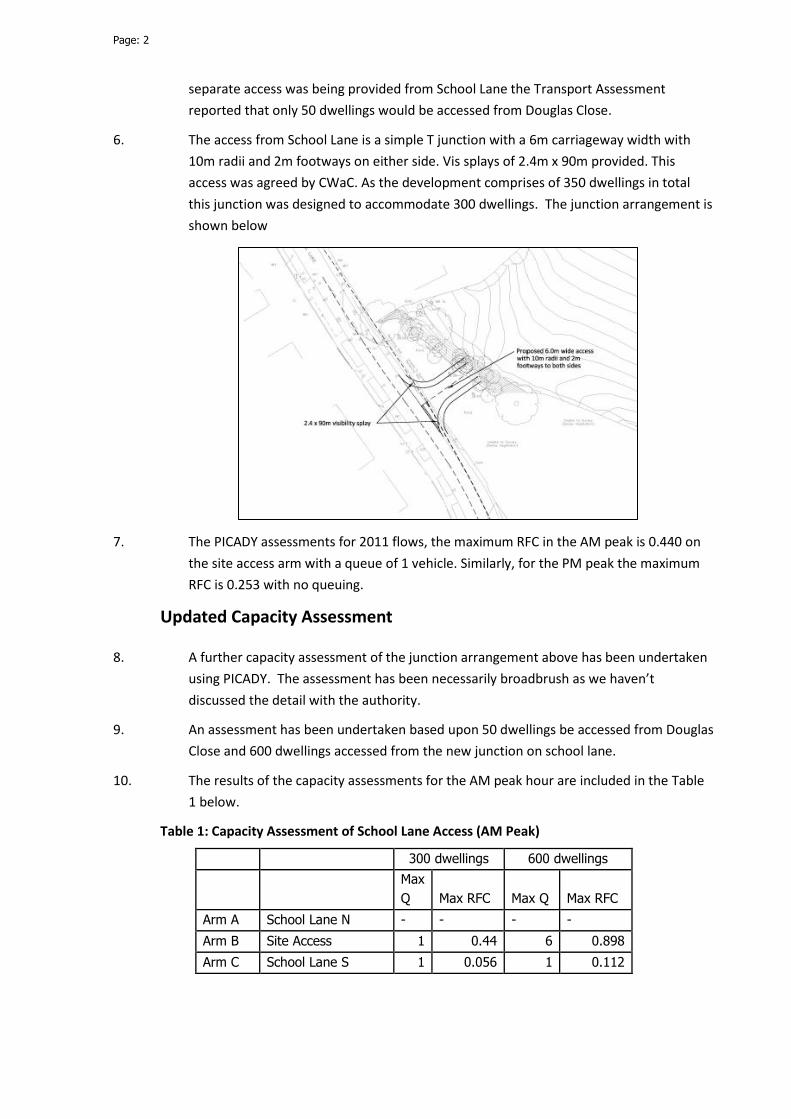
6. The access from School Lane is a simple T junction with a 6m carriageway width with
10m radii and 2m footways on either side. Vis splays of 2.4m x 90m provided. This
access was agreed by CWaC. As the development comprises of 350 dwellings in total
this junction was designed to accommodate 300 dwellings. The junction arrangement is
shown below
7. The PICADY assessments for 2011 flows, the maximum RFC in the AM peak is 0.440 on
the site access arm with a queue of 1 vehicle. Similarly, for the PM peak the maximum
RFC is 0.253 with no queuing.
Updated Capacity Assessment
8. A further capacity assessment of the junction arrangement above has been undertaken
using PICADY. The assessment has been necessarily broadbrush as we haven’t
discussed the detail with the authority.
9. An assessment has been undertaken based upon 50 dwellings be accessed from Douglas
Close and 600 dwellings accessed from the new junction on school lane.
10. The results of the capacity assessments for the AM peak hour are included in the Table
1 below.
Table 1: Capacity Assessment of School Lane Access (AM Peak)
300 dwellings 600 dwellings
Max
Q Max RFC Max Q Max RFC
Arm A School Lane N - - - -
Arm B Site Access 1 0.44 6 0.898
Arm C School Lane S 1 0.056 1 0.112

Page: 3
11. The findings demonstrate that with an additional 300 dwellings the junction operates
within its theoretical capacity. It should be noted that the site access arm operates
slightly above 0.85 and a queue length of 6 vehicles.
12. Similarly in the PM peak capacity assessment results are shown in Table 2
Table 2: Capacity Assessment of School Lane Access (PM Peak)
300 dwellings 600 dwellings
Max
Q Max RFC Max Q Max RFC
Arm A School Lane N - - - -
Arm B Site Access 1 0.253 1 0.422
Arm C School Lane S 1 0.244 3 0.514
13. In considering the findings of the capacity assessment, our judgement is that with a
combination of the two site accesses in use (with some trips via Douglas Close) a good
argument can be made for up to 650 homes.
14. It should be considered that whilst the junction has been shown to work this doesn’t
mean that the local highway network will not be subject to queuing. However, in
planning terms there is a good case for the additional number of dwellings.
15. An equally important consideration is that of the sustainable transport measures that
were developed over the course of the appeal. Whether or not the size of the
development will be found acceptable by either CWAC or the Secretary of State may
depend to a large extent on the confidence and deliverability of the sustainable travel
initiatives presented at the Inquiry.
16. At the Public Inquiry, the Inspector was convinced that the whilst the network was
congested at peak times, he was cognisant of the merits in adopting and implementing
a series of measures and initiatives that would provide real alternatives to the private
car.
17. It will be necessary to demonstrate the same level enthusiasm to deliver the Travel Plan
in order provide the authority with confidence in our sustainable travel measures. If we
can provide that confidence then it is reasonable to expect the Council to follow the
lead of the Inspector and accept that the traffic impact disbenefits are not so significant
as to outweigh the community and other benefits of delivering more homes.

APPENDIX F
Junctions 9
PICADY 9 - Priority Intersection Module
Version: 9.0.0.4211 []
© Copyright TRL Limited, 2017
For sales and distribution information, program advice and maintenance, contact TRL:
Tel: +44 (0)1344 770758 email: [email protected] Web: http://www.trlsoftware.co.uk
The users of this computer program for the solution of an engineering problem are in
no way relieved of their responsibility for the correctness of the solution
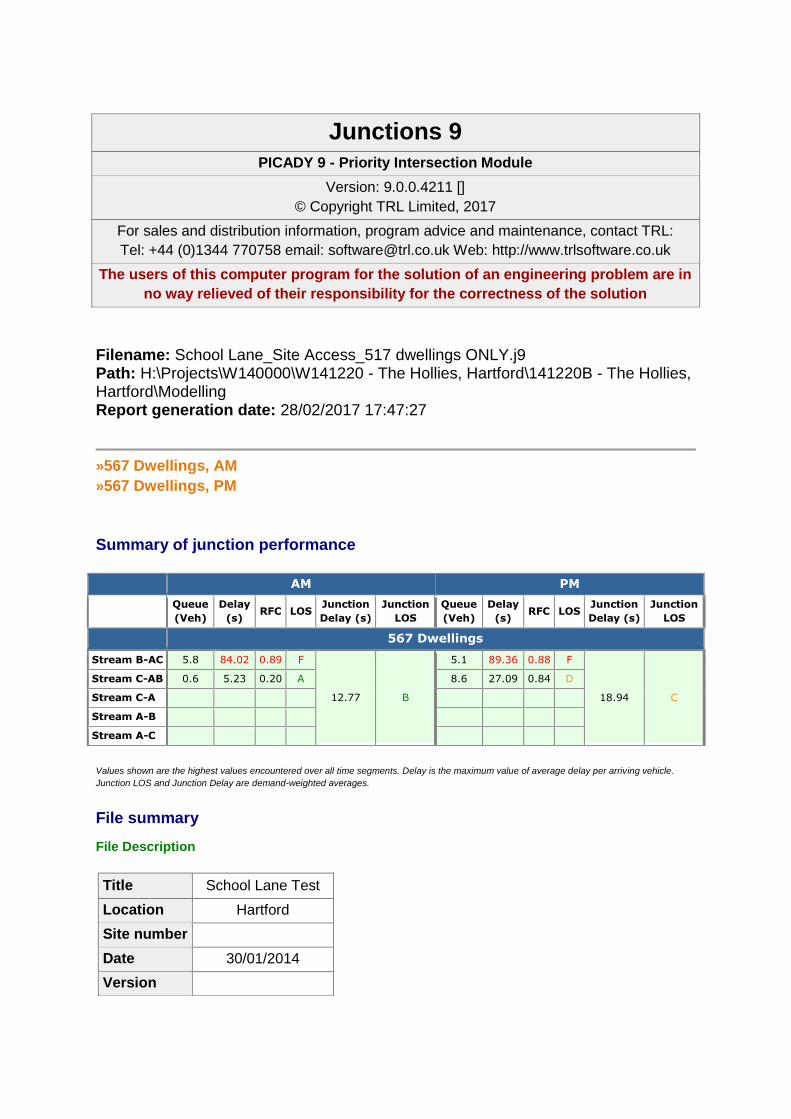
Filename: School Lane_Site Access_517 dwellings ONLY.j9 Path: H:\Projects\W140000\W141220 - The Hollies, Hartford\141220B - The Hollies, Hartford\Modelling Report generation date: 28/02/2017 17:47:27
»567 Dwellings, AM
»567 Dwellings, PM
Summary of junction performance
AM PM
Queue
(Veh)
Delay
(s) RFC LOS
Junction
Delay (s)
Junction
LOS
Queue
(Veh)
Delay
(s) RFC LOS
Junction
Delay (s)
Junction
LOS
567 Dwellings
Stream B-AC 5.8 84.02 0.89 F
12.77 B
5.1 89.36 0.88 F
18.94 C
Stream C-AB 0.6 5.23 0.20 A 8.6 27.09 0.84 D
Stream C-A
Stream A-B
Stream A-C
Values shown are the highest values encountered over all time segments. Delay is the maximum value of average delay per arriving vehicle.
Junction LOS and Junction Delay are demand-weighted averages.
File summary
File Description
Title School Lane Test
Location Hartford
Site number
Date 30/01/2014
Version

Status
Identifier
Client Harrow
Jobnumber 120759
Enumerator VECTOS"ellen.axon
Description
Units Distance
units
Speed
units
Traffic units
input
Traffic units
results Flow units
Average delay
units
Total delay
units
Rate of delay
units
m kph Veh Veh perHour s -Min perMin
Analysis Options Vehicle
length (m)
Calculate Queue
Percentiles
Calculate detailed
queueing delay
Calculate residual
capacity
RFC
Threshold
Average Delay
threshold (s)
Queue threshold
(PCU)
5.75
0.85 36.00 20.00
Demand Set Summary
Scenario name
Time
Period
name
Description Traffic profile
type
Model start
time (HH:mm)
Model finish
time (HH:mm)
Time segment
length (min)
Run
automatically
567
Dwellings AM
School
Lane
ONE
HOUR 07:45 09:15 15
567
Dwellings PM
School
Lane
ONE
HOUR 17:00 18:30 15
567 Dwellings, AM
Data Errors and Warnings No errors or warnings
Analysis Set Details ID Include in report Network flow scaling factor (%) Network capacity scaling factor (%)
A1 100.000 100.000
Junction Network
Junctions Junction Name Junction Type Major road direction Junction Delay (s) Junction LOS
1 untitled T-Junction Two-way 12.77 B
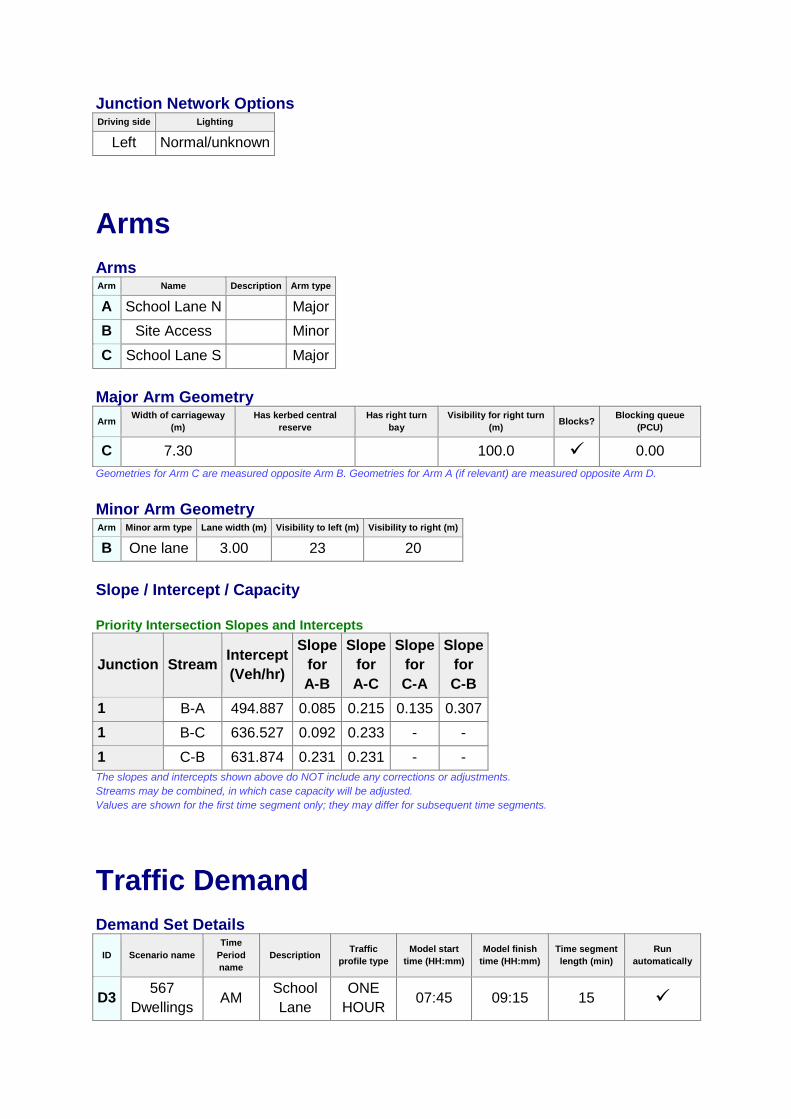
Junction Network Options Driving side Lighting
Left Normal/unknown
Arms
Arms Arm Name Description Arm type
A School Lane N
Major
B Site Access
Minor
C School Lane S
Major
Major Arm Geometry
Arm Width of carriageway
(m)
Has kerbed central
reserve
Has right turn
bay
Visibility for right turn
(m) Blocks?
Blocking queue
(PCU)
C 7.30
100.0 0.00
Geometries for Arm C are measured opposite Arm B. Geometries for Arm A (if relevant) are measured opposite Arm D.
Minor Arm Geometry Arm Minor arm type Lane width (m) Visibility to left (m) Visibility to right (m)
B One lane 3.00 23 20
Slope / Intercept / Capacity
Priority Intersection Slopes and Intercepts
Junction Stream Intercept
(Veh/hr)
Slope
for
A-B
Slope
for
A-C
Slope
for
C-A
Slope
for
C-B
1 B-A 494.887 0.085 0.215 0.135 0.307
1 B-C 636.527 0.092 0.233 - -
1 C-B 631.874 0.231 0.231 - - The slopes and intercepts shown above do NOT include any corrections or adjustments.
Streams may be combined, in which case capacity will be adjusted.
Values are shown for the first time segment only; they may differ for subsequent time segments.
Traffic Demand
Demand Set Details
ID Scenario name
Time
Period
name
Description Traffic
profile type
Model start
time (HH:mm)
Model finish
time (HH:mm)
Time segment
length (min)
Run
automatically
D3 567
Dwellings AM
School
Lane
ONE
HOUR 07:45 09:15 15
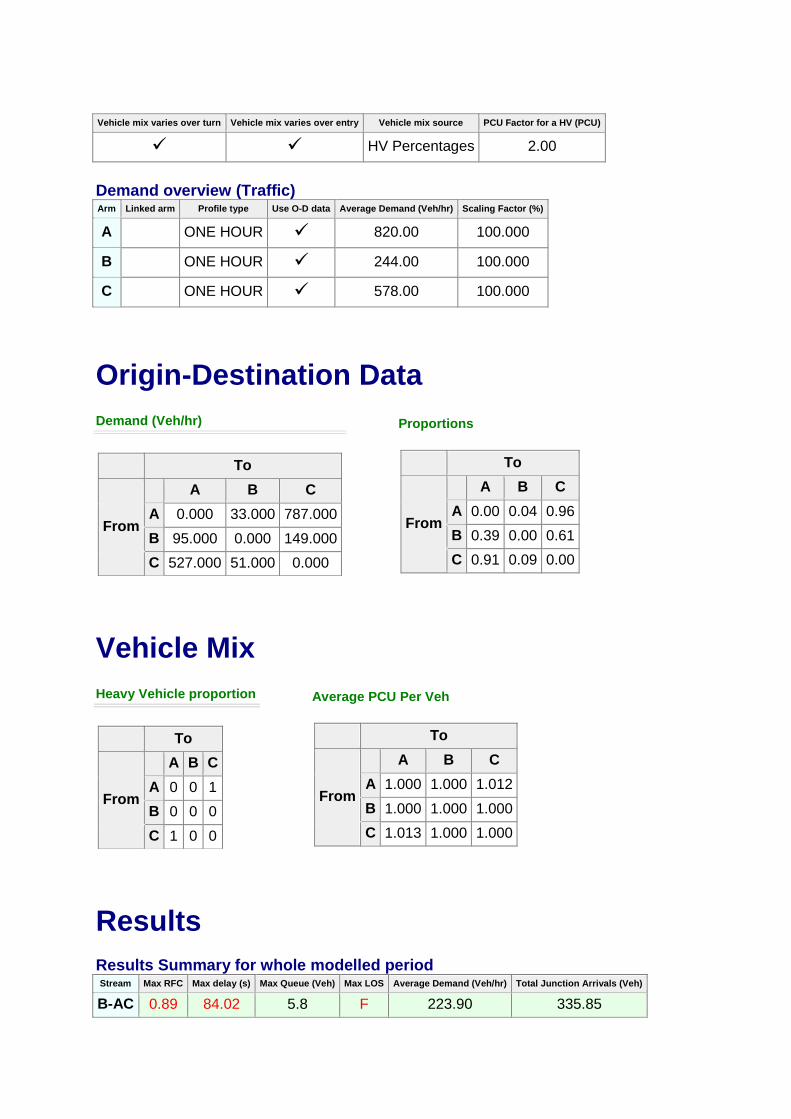
Vehicle mix varies over turn Vehicle mix varies over entry Vehicle mix source PCU Factor for a HV (PCU)
HV Percentages 2.00
Demand overview (Traffic) Arm Linked arm Profile type Use O-D data Average Demand (Veh/hr) Scaling Factor (%)
A
ONE HOUR 820.00 100.000
B
ONE HOUR 244.00 100.000
C
ONE HOUR 578.00 100.000
Origin-Destination Data
Demand (Veh/hr)
To
From
A B C
A 0.000 33.000 787.000
B 95.000 0.000 149.000
C 527.000 51.000 0.000
Proportions
To
From
A B C
A 0.00 0.04 0.96
B 0.39 0.00 0.61
C 0.91 0.09 0.00
Vehicle Mix
Heavy Vehicle proportion
To
From
A B C
A 0 0 1
B 0 0 0
C 1 0 0
Average PCU Per Veh
To
From
A B C
A 1.000 1.000 1.012
B 1.000 1.000 1.000
C 1.013 1.000 1.000
Results
Results Summary for whole modelled period Stream Max RFC Max delay (s) Max Queue (Veh) Max LOS Average Demand (Veh/hr) Total Junction Arrivals (Veh)
B-AC 0.89 84.02 5.8 F 223.90 335.85
C-AB 0.20 5.23 0.6 A 118.71 178.07
C-A
411.67 617.51
A-B
30.28 45.42
A-C
722.16 1083.25
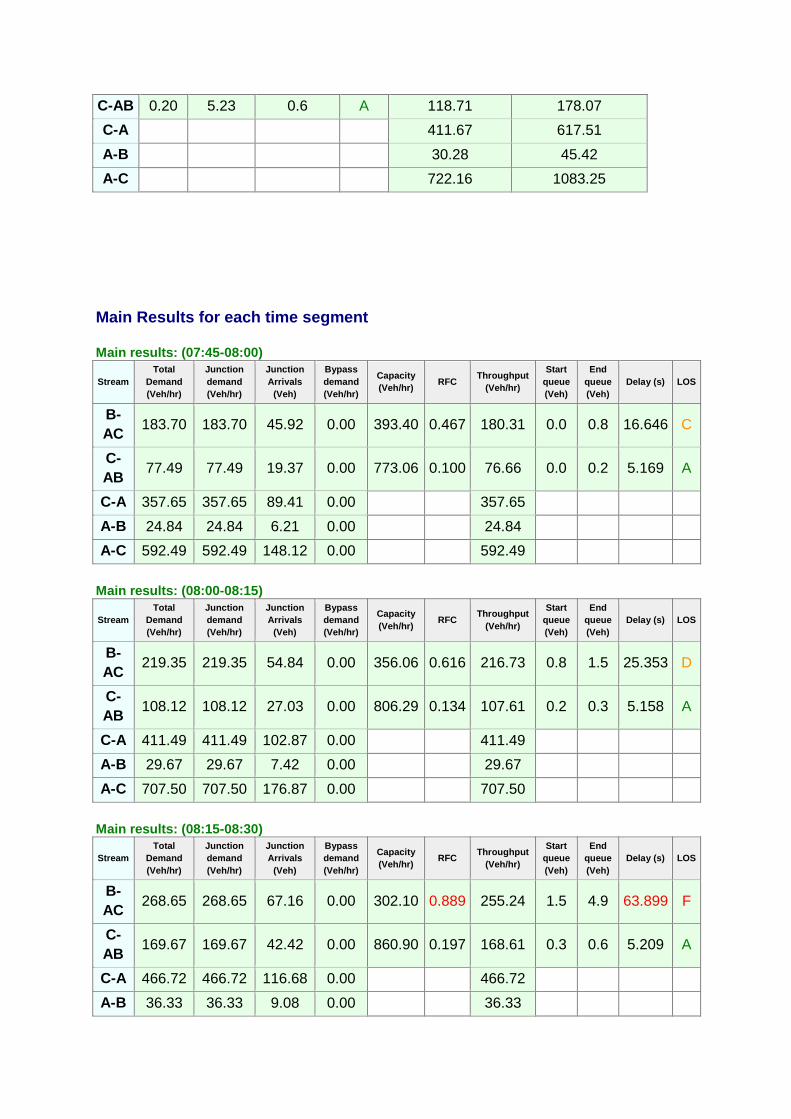
Main Results for each time segment
Main results: (07:45-08:00)
Stream
Total
Demand
(Veh/hr)
Junction
demand
(Veh/hr)
Junction
Arrivals
(Veh)
Bypass
demand
(Veh/hr)
Capacity
(Veh/hr) RFC
Throughput
(Veh/hr)
Start
queue
(Veh)
End
queue
(Veh)
Delay (s) LOS
B-
AC 183.70 183.70 45.92 0.00 393.40 0.467 180.31 0.0 0.8 16.646 C
C-
AB 77.49 77.49 19.37 0.00 773.06 0.100 76.66 0.0 0.2 5.169 A
C-A 357.65 357.65 89.41 0.00
357.65
A-B 24.84 24.84 6.21 0.00
24.84
A-C 592.49 592.49 148.12 0.00
592.49
Main results: (08:00-08:15)
Stream
Total
Demand
(Veh/hr)
Junction
demand
(Veh/hr)
Junction
Arrivals
(Veh)
Bypass
demand
(Veh/hr)
Capacity
(Veh/hr) RFC
Throughput
(Veh/hr)
Start
queue
(Veh)
End
queue
(Veh)
Delay (s) LOS
B-
AC 219.35 219.35 54.84 0.00 356.06 0.616 216.73 0.8 1.5 25.353 D
C-
AB 108.12 108.12 27.03 0.00 806.29 0.134 107.61 0.2 0.3 5.158 A
C-A 411.49 411.49 102.87 0.00
411.49
A-B 29.67 29.67 7.42 0.00
29.67
A-C 707.50 707.50 176.87 0.00
707.50
Main results: (08:15-08:30)
Stream
Total
Demand
(Veh/hr)
Junction
demand
(Veh/hr)
Junction
Arrivals
(Veh)
Bypass
demand
(Veh/hr)
Capacity
(Veh/hr) RFC
Throughput
(Veh/hr)
Start
queue
(Veh)
End
queue
(Veh)
Delay (s) LOS
B-
AC 268.65 268.65 67.16 0.00 302.10 0.889 255.24 1.5 4.9 63.899 F
C-
AB 169.67 169.67 42.42 0.00 860.90 0.197 168.61 0.3 0.6 5.209 A
C-A 466.72 466.72 116.68 0.00
466.72
A-B 36.33 36.33 9.08 0.00
36.33

A-C 866.50 866.50 216.63 0.00
866.50
Main results: (08:30-08:45)
Stream
Total
Demand
(Veh/hr)
Junction
demand
(Veh/hr)
Junction
Arrivals
(Veh)
Bypass
demand
(Veh/hr)
Capacity
(Veh/hr) RFC
Throughput
(Veh/hr)
Start
queue
(Veh)
End
queue
(Veh)
Delay (s) LOS
B-
AC 268.65 268.65 67.16 0.00 301.95 0.890 264.93 4.9 5.8 84.017 F
C-
AB 170.19 170.19 42.55 0.00 861.50 0.198 170.16 0.6 0.6 5.228 A
C-A 466.20 466.20 116.55 0.00
466.20
A-B 36.33 36.33 9.08 0.00
36.33
A-C 866.50 866.50 216.63 0.00
866.50
Main results: (08:45-09:00)
Stream
Total
Demand
(Veh/hr)
Junction
demand
(Veh/hr)
Junction
Arrivals
(Veh)
Bypass
demand
(Veh/hr)
Capacity
(Veh/hr) RFC
Throughput
(Veh/hr)
Start
queue
(Veh)
End
queue
(Veh)
Delay (s) LOS
B-
AC 219.35 219.35 54.84 0.00 355.85 0.616 235.56 5.8 1.7 33.185 D
C-
AB 108.68 108.68 27.17 0.00 807.10 0.135 109.71 0.6 0.4 5.186 A
C-A 410.93 410.93 102.73 0.00
410.93
A-B 29.67 29.67 7.42 0.00
29.67
A-C 707.50 707.50 176.87 0.00
707.50
Main results: (09:00-09:15)
Stream
Total
Demand
(Veh/hr)
Junction
demand
(Veh/hr)
Junction
Arrivals
(Veh)
Bypass
demand
(Veh/hr)
Capacity
(Veh/hr) RFC
Throughput
(Veh/hr)
Start
queue
(Veh)
End
queue
(Veh)
Delay (s) LOS
B-
AC 183.70 183.70 45.92 0.00 393.20 0.467 186.99 1.7 0.9 17.720 C
C-
AB 78.12 78.12 19.53 0.00 773.58 0.101 78.65 0.4 0.2 5.192 A
C-A 357.03 357.03 89.26 0.00
357.03
A-B 24.84 24.84 6.21 0.00
24.84
A-C 592.49 592.49 148.12 0.00
592.49
567 Dwellings, PM
Data Errors and Warnings No errors or warnings
Analysis Set Details

ID Include in report Network flow scaling factor (%) Network capacity scaling factor (%)
A1 100.000 100.000
Junction Network
Junctions Junction Name Junction Type Major road direction Junction Delay (s) Junction LOS
1 untitled T-Junction Two-way 18.94 C
Junction Network Options [same as above]
Arms
Arms [same as above]
Major Arm Geometry [same as above]
Minor Arm Geometry [same as above]
Slope / Intercept / Capacity [same as above]
Traffic Demand
Demand Set Details
ID Scenario name
Time
Period
name
Description Traffic
profile type
Model start
time (HH:mm)
Model finish
time (HH:mm)
Time segment
length (min)
Run
automatically
D4 567
Dwellings PM
School
Lane
ONE
HOUR 17:00 18:30 15
Vehicle mix varies over turn Vehicle mix varies over entry Vehicle mix source PCU Factor for a HV (PCU)
HV Percentages 2.00
Demand overview (Traffic) Arm Linked arm Profile type Use O-D data Average Demand (Veh/hr) Scaling Factor (%)
A
ONE HOUR 805.00 100.000

B
ONE HOUR 204.00 100.000
C
ONE HOUR 787.00 100.000
Origin-Destination Data
Demand (Veh/hr)
To
From
A B C
A 0.000 147.000 658.000
B 89.000 0.000 115.000
C 579.000 208.000 0.000
Proportions
To
From
A B C
A 0.00 0.18 0.82
B 0.44 0.00 0.56
C 0.74 0.26 0.00
Vehicle Mix
Heavy Vehicle proportion
To
From
A B C
A 0 0 0
B 0 0 0
C 0 0 0
Average PCU Per Veh
To
From
A B C
A 1.000 1.000 1.000
B 1.000 1.000 1.000
C 1.000 1.000 1.000
Results
Results Summary for whole modelled period Stream Max RFC Max delay (s) Max Queue (Veh) Max LOS Average Demand (Veh/hr) Total Junction Arrivals (Veh)
B-AC 0.88 89.36 5.1 F 187.19 280.79
C-AB 0.84 27.09 8.6 D 534.88 802.31
C-A
187.29 280.93
A-B
134.89 202.33
A-C
603.79 905.69
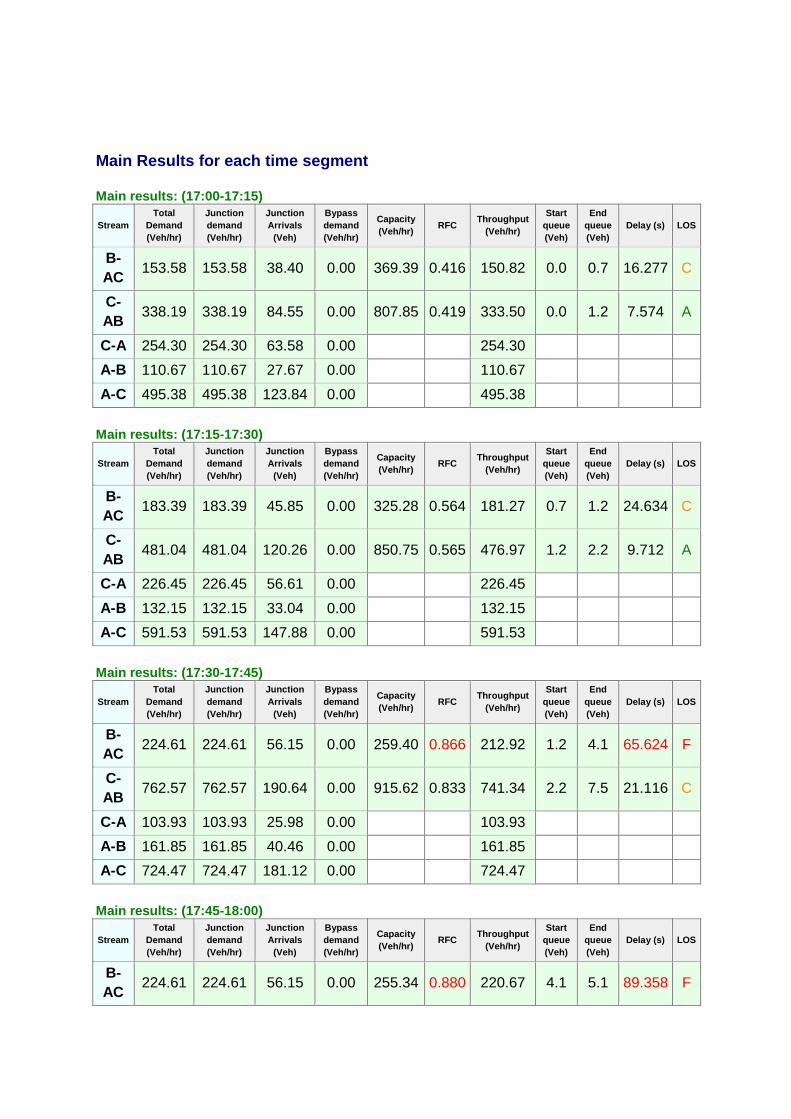
Main Results for each time segment
Main results: (17:00-17:15)
Stream
Total
Demand
(Veh/hr)
Junction
demand
(Veh/hr)
Junction
Arrivals
(Veh)
Bypass
demand
(Veh/hr)
Capacity
(Veh/hr) RFC
Throughput
(Veh/hr)
Start
queue
(Veh)
End
queue
(Veh)
Delay (s) LOS
B-
AC 153.58 153.58 38.40 0.00 369.39 0.416 150.82 0.0 0.7 16.277 C
C-
AB 338.19 338.19 84.55 0.00 807.85 0.419 333.50 0.0 1.2 7.574 A
C-A 254.30 254.30 63.58 0.00
254.30
A-B 110.67 110.67 27.67 0.00
110.67
A-C 495.38 495.38 123.84 0.00
495.38
Main results: (17:15-17:30)
Stream
Total
Demand
(Veh/hr)
Junction
demand
(Veh/hr)
Junction
Arrivals
(Veh)
Bypass
demand
(Veh/hr)
Capacity
(Veh/hr) RFC
Throughput
(Veh/hr)
Start
queue
(Veh)
End
queue
(Veh)
Delay (s) LOS
B-
AC 183.39 183.39 45.85 0.00 325.28 0.564 181.27 0.7 1.2 24.634 C
C-
AB 481.04 481.04 120.26 0.00 850.75 0.565 476.97 1.2 2.2 9.712 A
C-A 226.45 226.45 56.61 0.00
226.45
A-B 132.15 132.15 33.04 0.00
132.15
A-C 591.53 591.53 147.88 0.00
591.53
Main results: (17:30-17:45)
Stream
Total
Demand
(Veh/hr)
Junction
demand
(Veh/hr)
Junction
Arrivals
(Veh)
Bypass
demand
(Veh/hr)
Capacity
(Veh/hr) RFC
Throughput
(Veh/hr)
Start
queue
(Veh)
End
queue
(Veh)
Delay (s) LOS
B-
AC 224.61 224.61 56.15 0.00 259.40 0.866 212.92 1.2 4.1 65.624 F
C-
AB 762.57 762.57 190.64 0.00 915.62 0.833 741.34 2.2 7.5 21.116 C
C-A 103.93 103.93 25.98 0.00
103.93
A-B 161.85 161.85 40.46 0.00
161.85
A-C 724.47 724.47 181.12 0.00
724.47
Main results: (17:45-18:00)
Stream
Total
Demand
(Veh/hr)
Junction
demand
(Veh/hr)
Junction
Arrivals
(Veh)
Bypass
demand
(Veh/hr)
Capacity
(Veh/hr) RFC
Throughput
(Veh/hr)
Start
queue
(Veh)
End
queue
(Veh)
Delay (s) LOS
B-
AC 224.61 224.61 56.15 0.00 255.34 0.880 220.67 4.1 5.1 89.358 F

C-
AB 782.20 782.20 195.55 0.00 927.28 0.844 777.64 7.5 8.6 27.089 D
C-A 84.30 84.30 21.08 0.00
84.30
A-B 161.85 161.85 40.46 0.00
161.85
A-C 724.47 724.47 181.12 0.00
724.47
Main results: (18:00-18:15)
Stream
Total
Demand
(Veh/hr)
Junction
demand
(Veh/hr)
Junction
Arrivals
(Veh)
Bypass
demand
(Veh/hr)
Capacity
(Veh/hr) RFC
Throughput
(Veh/hr)
Start
queue
(Veh)
End
queue
(Veh)
Delay (s) LOS
B-
AC 183.39 183.39 45.85 0.00 320.43 0.572 198.18 5.1 1.4 32.409 D
C-
AB 501.91 501.91 125.48 0.00 868.26 0.578 526.38 8.6 2.5 11.557 B
C-A 205.58 205.58 51.40 0.00
205.58
A-B 132.15 132.15 33.04 0.00
132.15
A-C 591.53 591.53 147.88 0.00
591.53
Main results: (18:15-18:30)
Stream
Total
Demand
(Veh/hr)
Junction
demand
(Veh/hr)
Junction
Arrivals
(Veh)
Bypass
demand
(Veh/hr)
Capacity
(Veh/hr) RFC
Throughput
(Veh/hr)
Start
queue
(Veh)
End
queue
(Veh)
Delay (s) LOS
B-
AC 153.58 153.58 38.40 0.00 367.77 0.418 156.35 1.4 0.7 17.238 C
C-
AB 343.34 343.34 85.84 0.00 812.39 0.423 348.42 2.5 1.3 7.910 A
C-A 249.15 249.15 62.29 0.00
249.15
A-B 110.67 110.67 27.67 0.00
110.67
A-C 495.38 495.38 123.84 0.00
495.38


