Gilbane Building Company 1 BUILDING FOR THE FUTURE Construction Economics Market Conditions in Construction UW Cancer Center at ProHealth Care Pewaukee, Wisconsin 10 CELEBRATING GILBANE’S th EDITION 2016 Edition
Transcript
Gilbane Building Company1
BUILDING FOR THE FUTUREConstruction EconomicsMarket Conditions in Construction
UW Cancer Center at ProHealth CarePewaukee, Wisconsin
10CELEBRATING
GILBANE’Sth
EDITION
2016 Edition
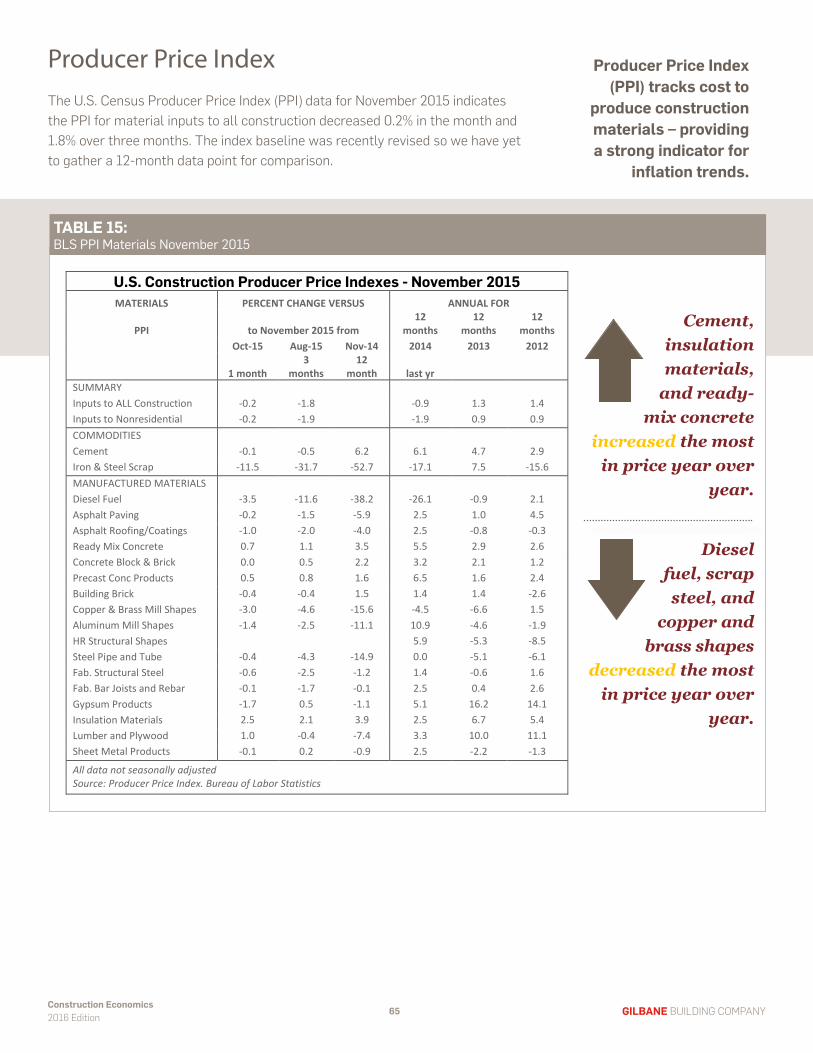
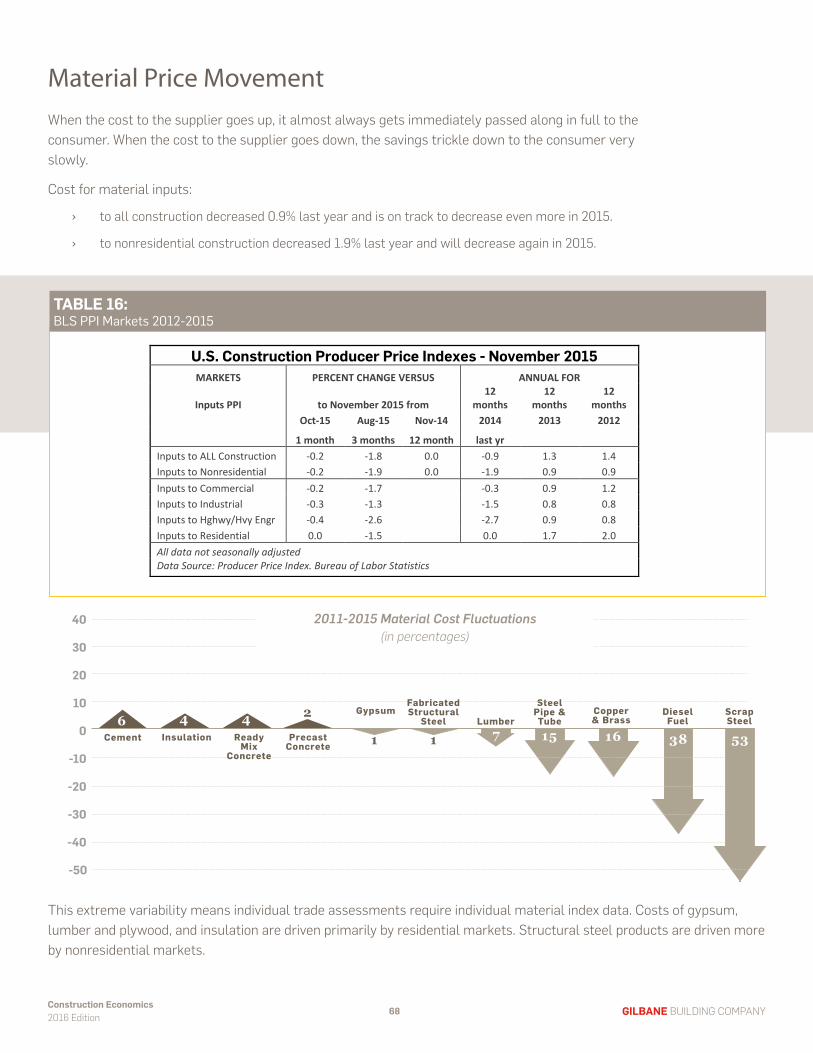
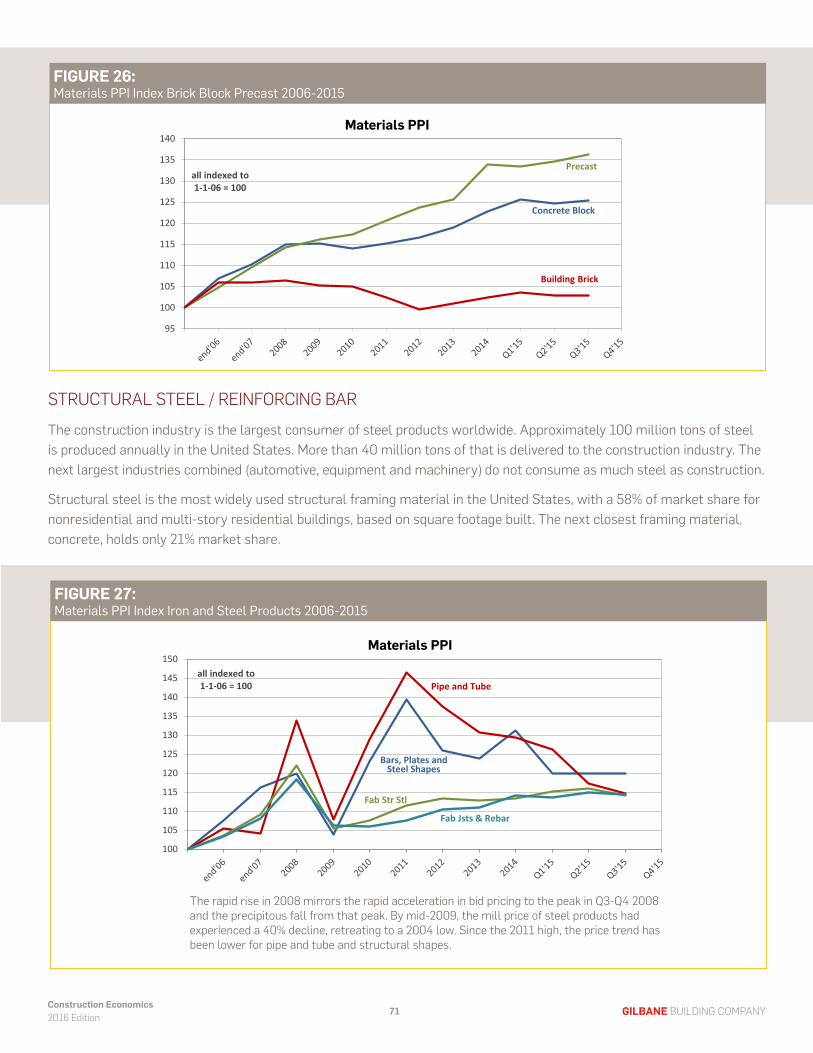
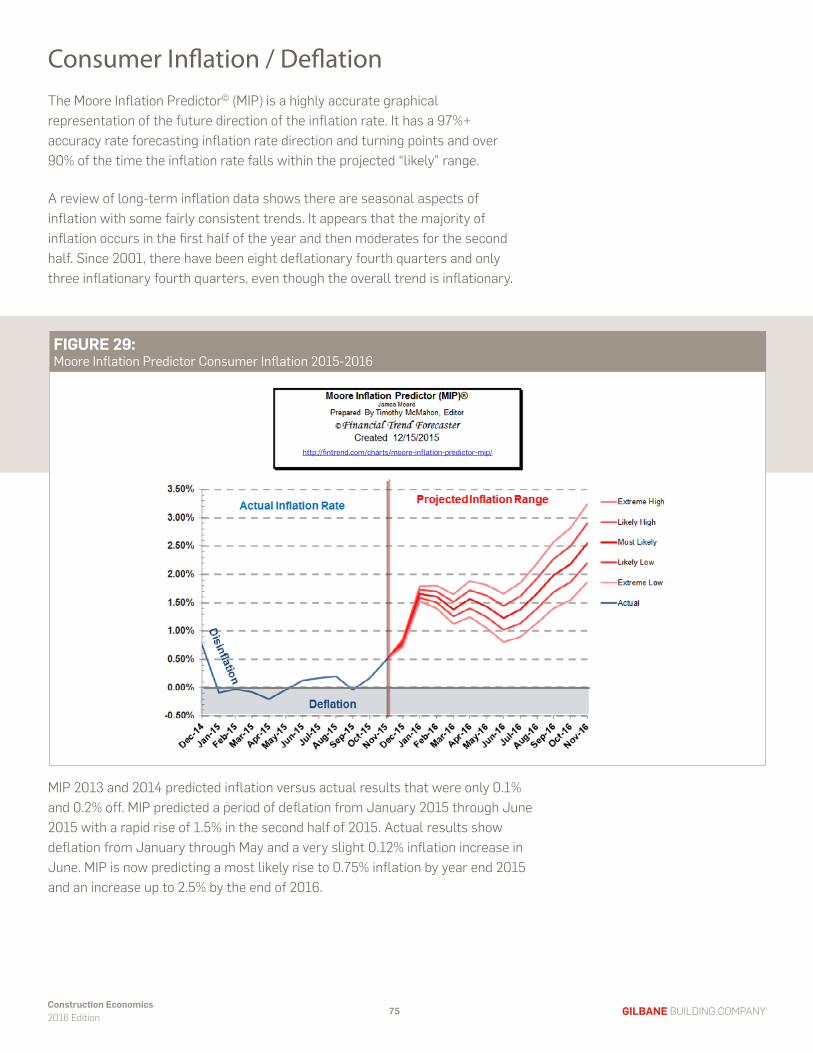
TABLESTable 1: U.S. Construction Market Outlook New Starts 2009-2016Table 2: Total Construction Spending Summary 2007-2016Table 3: Total Spending Predictions Comparisons 2015 Midyear vs. Year EndTable 4: Total Spending Predictions Comparisons 2015-2016Table 5: Construction Spending Major Nonbuilding Infrastructure Markets 2007-2016Table 6: Construction Spending Major Nonresidential Buildings Markets 2007-2016Table 7: Spending Predictions Comparisons – Nonresidential Buildings Total 2015Table 8: Spending Predictions Comparisons – Major Nonresidential Buildings Markets 2015Table 9: Spending Predictions Comparisons – Major Nonresidential Buildings Markets 2016Table 10: Construction Spending Summary Residential 2007- 2016Table 11: Construction Spending Summary Public vs. Private 2007-2016Table 12: ALL Construction Spending 2007-2016Table 13: Construction Spending Summary Adjusted 2007-2016 (Constant 2015$)Table 14: Construction – All Employees 2004-2015Table 15: BLS PPI Materials November 2015Table 16: BLS PPI Markets 2011-2015Table 17: ENR Building Cost Index HistoryTable 18: BLS PPI Buildings Completed 2011-2014Table 19: Gilbane Building Cost Index 2007-2016
FIGURESFigure A: All Construction Spending Rate of Growth 2013-2016Figure B: Construction Starts – Aggregate Cash Flow of Starts 2014-2017Figure C: Inflation/Escalation 2011-2017Figure 1: Construction Starts Trends 2015-2016Figure 2A: Construction Starts Nonresidential Buildings 2012-2016Figure 2B: Construction Starts Nonbuilding Infrastructure - 2012-2016Figure 2C: Construction Starts Residential Buildings - 2012-2016Figure 3: Dodge Momentum Index 2014-2015Figure 4: Architectural Billings Index 2013-2015Figure 5: Construction Starts – Aggregate Cash Flow of Starts 2014-2017Figure 6: ABI – DMI – Starts by Lead Times vs. Spending Figure 7: All Construction Spending Rate of Growth 2013-2016Figure 8: Spending Growth Nonresidential Buildings and Infrastructure 2013-2016Figure 9: Spending Growth Major Nonbuilding Infrastructure Markets 2013-2016Figure 10: Spending Growth Major Institutional Building Markets 2013-2016Figure 11: Spending Growth Major Commercial Building Markets 2013-2016Figure 12: Spending Growth Major Industrial Building Market 2013-2016Figure 13: Spending Growth Residential Building Market 2013-2016Figure 14: New Housing Starts Seasonally Adjusted Rate 2011-2016Figure 15: Spending Growth Public – Private Building Markets 2011-2016Figure 16: Construction Spending vs. Volume in Constant 2015$ 1993-2015Figure 17: Construction Spending by Sector 2005-2016 (constant 2015$)Figure 18: Construction Jobs vs. Construction Workforce 2005-2015Figure 19: Construction Jobs vs. Total Workforce Hours Worked 2008-2015Figure 20: Jobs per $billion 2006-2015 in constant 2015$ All ConstructionFigure 21: Jobs per $billion 2006-2015 in constant 2015$ Nonresidential Buildings OnlyFigure 22: Construction Spending vs. Volume in Constant 2015$ 1993-2015Figure 23: Materials PPI Index Gypsum Lumber Insulation 2006-2015Figure 24: Cement Consumption 2005-2018Figure 25: Materials PPI Index Cement Concrete Asphalt 2006-2015Figure 26: Materials PPI Index Brick Block Precast 2006-2015Figure 27: Materials PPI Index Iron and Steel Products 2006-2015Figure 28: Materials PPI Index Aluminum Copper Sheet Metal 2006-2015Figure 29: Moore Inflation Predictor Consumer Inflation 2015-2016Figure 30: Complete Building Cost Index by Building Type 2006-2015Figure 31: Complete Trades Cost Index by Trade 2006-2015Figure 32: City Location Cost Index 2015Figure 33: Nonresidential Buildings and Infrastructure Spending Rate of Growth 2013-2016Figure 34: Residential Spending Rate of Growth 2013-2016Figure 35: Escalation Growth vs. Actual Margin Cost 2005-2017Figure 36: Inflation/Escalation Minimum and Potential 2000-2017
Indexing – Addressing Fluctuation in Margins ..............91
Escalation – What Should You Carry?....... 94
Data Sources .......................................................98
DATA INCLUDED IN THIS REPORT
Dodge Data & Analytics Construction Starts through November, released December 18, 2015
U.S. Census Construction Spending (Put-In-Place) through November, released January 4, 2016
Bureau of Labor Statistics Construction Jobs through mid-November, released December 4, 2015
Producer Price Index Materials through November, released December 12, 2015
Producer Price Index Markets through November, released December 12, 2015
Architectural Billings Index through November, released December 22, 2015
Dodge Momentum Index through November, released December 7, 2015
Consumer Inflation Index through November, released December 15, 2015
BUILDING FOR THE FUTUREConstruction EconomicsMarket Conditions in Construction
2016 Edition
Construction Economics 2016 Edition 2 GILBANE BUILDING COMPANY
Summary
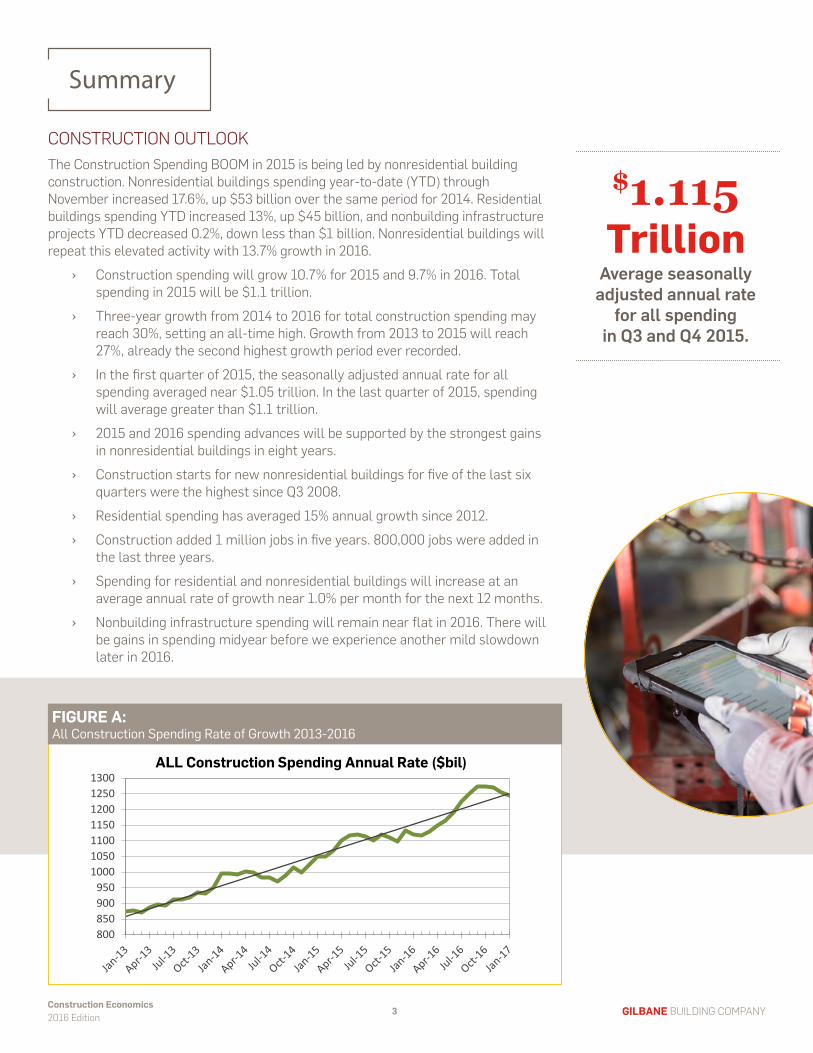
CONSTRUCTION OUTLOOKThe Construction Spending BOOM in 2015 is being led by nonresidential building construction. Nonresidential buildings spending year-to-date (YTD) through November increased 17.6%, up $53 billion over the same period for 2014. Residential buildings spending YTD increased 13%, up $45 billion, and nonbuilding infrastructure projects YTD decreased 0.2%, down less than $1 billion. Nonresidential buildings will repeat this elevated activity with 13.7% growth in 2016.
› Construction spending will grow 10.7% for 2015 and 9.7% in 2016. Total spending in 2015 will be $1.1 trillion.
› Three-year growth from 2014 to 2016 for total construction spending may reach 30%, setting an all-time high. Growth from 2013 to 2015 will reach 27%, already the second highest growth period ever recorded.
› In the first quarter of 2015, the seasonally adjusted annual rate for all spending averaged near $1.05 trillion. In the last quarter of 2015, spending will average greater than $1.1 trillion.
› 2015 and 2016 spending advances will be supported by the strongest gains in nonresidential buildings in eight years.
› Construction starts for new nonresidential buildings for five of the last six quarters were the highest since Q3 2008.
› Residential spending has averaged 15% annual growth since 2012. › Construction added 1 million jobs in five years. 800,000 jobs were added in
the last three years. › Spending for residential and nonresidential buildings will increase at an
average annual rate of growth near 1.0% per month for the next 12 months. › Nonbuilding infrastructure spending will remain near flat in 2016. There will
be gains in spending midyear before we experience another mild slowdown later in 2016.
800850900950
1000105011001150120012501300
ALL Construction Spending Annual Rate ($bil)
FIGURE A:All Construction Spending Rate of Growth 2013-2016
$1.115 Trillion
Average seasonally adjusted annual rate
for all spending in Q3 and Q4 2015.
Construction Economics 2016 Edition 3 GILBANE BUILDING COMPANY
RESTRAINTS TO GROWTH › The BLS Job Openings and Labor Turnover Survey (JOLTS) for the
construction industry for October is at 139,000 unfilled positions. Although down slightly this month and down from the summer peak, the openings rate has been trending upward since 2012. A relatively high rate of openings generally indicates high demand for labor and could lead to higher wage rates.
› In a 2015 Associated General Contractors (AGC) survey, 80% of contractors indicated some difficulty in acquiring trained workers.
› According to a June 2015 survey by the National Association of Home Builders (NAHB), 61% of homebuilders during the previous 12 months had raised home prices due to labor shortages across construction trades.
› New nonbuilding infrastructure project starts have been mixed over the last two years, with both new highs and new lows. Even with five months of new highs in 2015, the up and down spending pattern we’ve been seeing will continue at least until the end of 2016.
› Housing starts were off to a slow start. In February and March, new starts dropped well below expectations, holding down total starts for 2015. The consensus forecast was 1,134,000 and the final total will be closer to 1,110,000, an increase of only 110,000 new starts in 2015.
Hiring workers with the right skills will
continue to be a key constraint to economic growth through 2016.
FIGURE B:Construction Starts – Aggregate Cash Flow of Starts 2014-2017
Nonbuilding
Nonresidential Buildings
Residential
405060708090
100110120130140
INDEX of SAAR for Cashflows of Starts
Construction Economics 2016 Edition 4 GILBANE BUILDING COMPANY
THE EFFECTS OF RAPID GROWTH
› From 2012 through 2014, the most current completed period, construction spending grew 24%. Inflation was 13%, so volume increased only 11%. However, work output increased by 13%. In this current growth cycle, productivity loss is at 2%.
› 2015 predicted spending growth is near 11%. The 2012-2015 four-year period of spending growth (35%) will be greater than the 2003-2006 rate (33%) and 1996-1999 rate (32%), which were the two fastest growth periods on record with two of the highest rates inflation and productivity loss.
› As work volume continues to increase over the next few years, expect productivity to decline. There are many reasons why this will occur, among them: working longer hours until new workers are brought on; working more days; hiring less qualified workers; and acclimating new workers to the crew.
› Growth in nonresidential buildings and residential construction in 2014 and 2015 has led to more significant labor demand. This may lead to labor shortages in some trades. This will drive up labor cost.
› Construction inflation is very likely to advance more rapidly than some owners have planned for, potentially requiring that some project budgets be revisited before projects can begin.
› Construction inflation in rapid growth years is much higher than average long-term inflation.
› Long-term inflation is 3.3% for nonresidential buildings and 3.5% for residential buildings.
› During rapid growth periods, inflation is 8% for nonresidential buildings and 9% for residential buildings.
All Construction Spending Rate of Growth 2013-2015
0.0%1.0%2.0%3.0%4.0%5.0%6.0%7.0%
2011 2012 2013 2014 2015 2016 2017minimum and potential range
Inflation / Escalation 2011-2017
2015 is a breakout year for nonresidential
buildings construction spending, expected to finish at 17% growth. With expected growth of more than 13% in 2016, the three-year period of 2014-2016 could reach historic growth. Escalation will climb to levels typical of rapidly growing markets.
FIGURE C:Inflation/Escalation 2011-2017
Construction Economics 2016 Edition 5 GILBANE BUILDING COMPANY
Gilbane Building Company6
Construction Starts
All Construction Spending Rate of Growth 2013-2015
Res
Nonres
Nonbldg
total = 624 564 588 617 623
- 20 40 60 80
100 120 140 160 180 200 220 240 260 280 300
last 6 mo last 3 mo last 1 mo next 3 mo next 6 mo
SAAR based on data through November released Dec 18, 2015
Construction Starts Trend
= $ billions
Construction StartsConstruction Starts data is published monthly by Dodge Data & Analytics (DDA). Each month, they update the data for the previous month and for the 12 months prior. The previous month and year prior updates are incorporated into the charts and tables included here. Although DDA may publish further updates to its data, this report does not track any data beyond the 12-month update. This may result in values here that differ slightly from other published DDA data.
Construction Starts data is volatile from month to month, and this may cause unusual peaks and valleys in the data. For that reason, a three-month moving average (3mma) of starts data is used. Also, to observe trends in the data, the latest month is compared to the last three months and the last six months of the Seasonally Adjusted Annual Rate (SAAR) data.
FIGURE 1:Construction Starts Trends 2015-2016
Construction Economics 2016 Edition 7 GILBANE BUILDING COMPANY
dollars in millions includes Dodge Data & Analytics (DDA) data for November 2015 released 12-18-15
DDA data includes updates to 12 months ago data through November 2014 all data after November 2015 is predicted
EXPECTATIONS FOR 2015-2016 NEW CONSTRUCTION STARTS
› Total construction starts will slow to only 6% growth in 2016 but have averaged greater than 10% growth per year for the last four years. Nonresidential and residential buildings will record substantial growth in 2016. Nonbuilding infrastructure starts will decline from the high reached in 2015, and this will hold down 2016 totals.
› Nonresidential buildings starts will post a 7% drop for 2015, but primarily because the second half of 2015 slowed from the rapid pace of growth in the previous 15 months. 2015 is being compared to the resurgence in growth that started in early 2014, a year that posted 25% growth in new starts and the beginning of a period during which new starts posted the best five quarters since 2008. A 30% decline from the all-time high recorded in 2014 for new manufacturing building starts accounts for more than half of the full decline in this sector. Nonresidential buildings starts will increase 8.5% in 2016. The volume and evenness of the cash flows from 2014 and 2015 is supporting spending growth of 17% in 2015 and 14% in 2016.
› Residential starts growth for 2015 was consistently 15% above the same period in 2014. Residential starts are at a nine-year high. Starts averaged 20% per year growth for the last four years with 2014 held to only 10%. Growth in 2015 and 2016 is expected at 15% and 16%. This level of new starts activity will help keep spending growing at 12% to 15% per year.
› Nonbuilding infrastructure starts in the first half of 2015 reached the highest on record. Driven mostly by large power projects, cash flows are spread over longer durations than normal so they do not add significantly to monthly spending in 2015 or 2016. However, they will extend the period of spending. Current spending is being influenced by the completion of cash flows from starts in 2014 which were the lowest on record going back to January 2008. Starts in 2015 were expected to drop by 33% from first half to second half 2015, and they did drop by 36%. Starts in 2016 are projected to decline 14%, but this may change once we begin to see the impact of highway/bridge and transportation new starts as a result of the Fixing America’s Surface Transportation (FAST) Act.
TABLE 1:U.S. Construction Market Outlook New Starts 2009-2016
Construction Economics 2016 Edition 8 GILBANE BUILDING COMPANY
Construction Starts 3-month Moving Avg $bil Residential Buildings
Note: All DDA Starts seasonally adjusted (SAAR) data is revised one month later, and not seasonally adjusted (NSA) data is revised 12 months later. These plots include both 12-month and one-month adjustments. The vertical lines reflect the revision month.
Construction Economics 2016 Edition 9 GILBANE BUILDING COMPANY
Gilbane Building Company10
Leading Indicators
Leading Indicators Leading indicators give the first indications of the expected direction for future starts and spending. The Dodge Momentum Index (DMI) and the American Institute of Architects (AIA) Inquiries Index are similar in that they both lead the AIA Architectural Billings Index (ABI). The ABI leads new construction starts. Dodge Data & Analytics (DDA) new construction starts is the record of new building contracts. Cash flows that show expected spending from all new starts over the life of the projects give an indication of the direction in future spending.
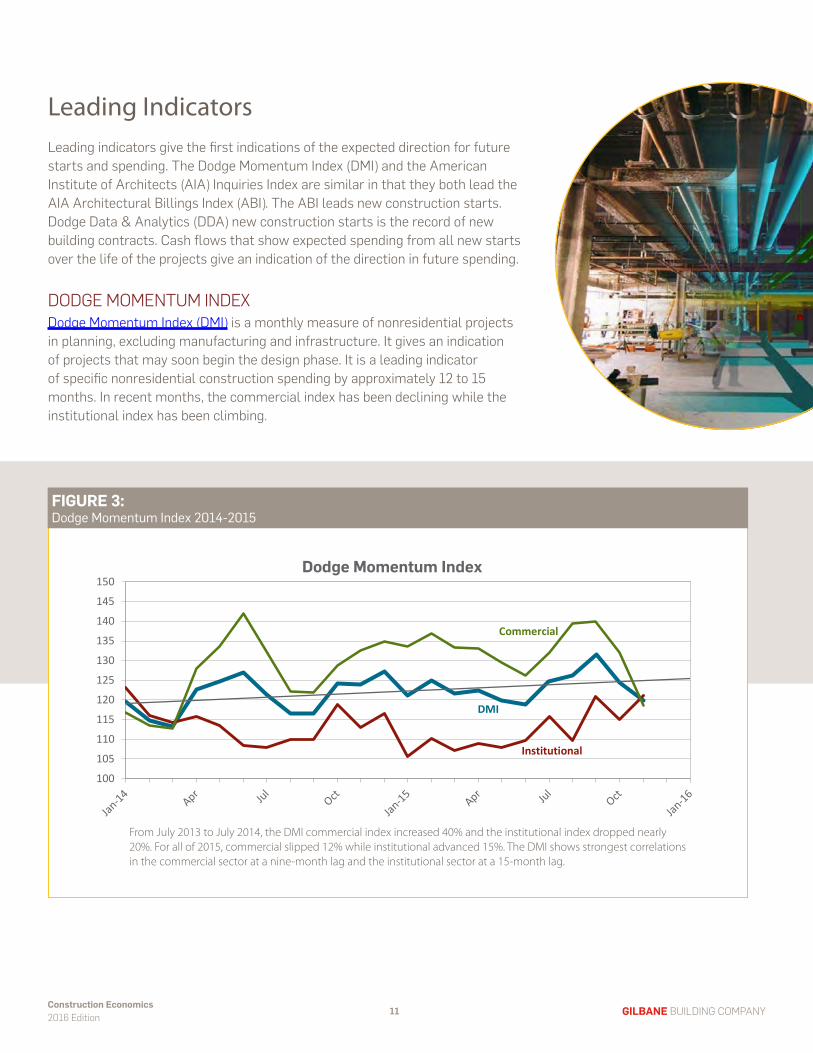
DODGE MOMENTUM INDEX Dodge Momentum Index (DMI) is a monthly measure of nonresidential projects in planning, excluding manufacturing and infrastructure. It gives an indication of projects that may soon begin the design phase. It is a leading indicator of specific nonresidential construction spending by approximately 12 to 15 months. In recent months, the commercial index has been declining while the institutional index has been climbing.
From July 2013 to July 2014, the DMI commercial index increased 40% and the institutional index dropped nearly 20%. For all of 2015, commercial slipped 12% while institutional advanced 15%. The DMI shows strongest correlations in the commercial sector at a nine-month lag and the institutional sector at a 15-month lag.
DMI
100
105
110
115
120
125
130
135
140
145
150Dodge Momentum Index
Commercial
Institutional
FIGURE 3:Dodge Momentum Index 2014-2015
Construction Economics 2016 Edition 11 GILBANE BUILDING COMPANY
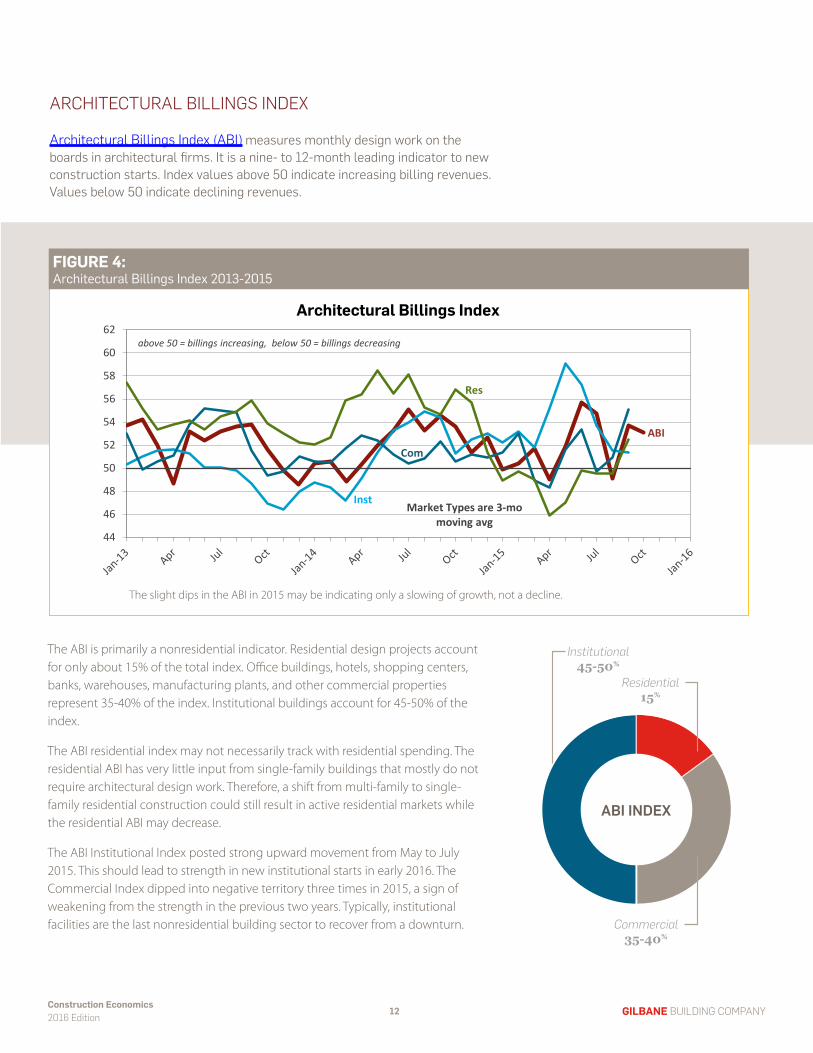
Architectural Billings Index (ABI) measures monthly design work on the boards in architectural firms. It is a nine- to 12-month leading indicator to new construction starts. Index values above 50 indicate increasing billing revenues. Values below 50 indicate declining revenues.
The ABI is primarily a nonresidential indicator. Residential design projects account for only about 15% of the total index. Office buildings, hotels, shopping centers, banks, warehouses, manufacturing plants, and other commercial properties represent 35-40% of the index. Institutional buildings account for 45-50% of the index.
The ABI residential index may not necessarily track with residential spending. The residential ABI has very little input from single-family buildings that mostly do not require architectural design work. Therefore, a shift from multi-family to single-family residential construction could still result in active residential markets while the residential ABI may decrease.
The ABI Institutional Index posted strong upward movement from May to July 2015. This should lead to strength in new institutional starts in early 2016. The Commercial Index dipped into negative territory three times in 2015, a sign of weakening from the strength in the previous two years. Typically, institutional facilities are the last nonresidential building sector to recover from a downturn.
DDA construction starts act as a leading indicator to spending. To see the effect all starts have on future spending, monthly cash flow values are spread out over the expected project duration from start to finish. Generally, project durations can range from six to twelve months for small projects and, on average, 24 to 36 months for large projects. Unique large projects can last several years. Project duration and cash flow begins in the month the data is posted. Monthly cash flow can be quite uneven due to the variation in the volume and duration of starts. The cumulative cash flow every month from all starts over the previous months or years shows the relative change in spending caused by change in starts.
All Construction Spending Rate of Growth 2013-2015 FIGURE 5:Construction Starts – Aggregate Cash Flow of Starts 2014-2017
Nonbuilding
Nonresidential Buildings
Residential
405060708090
100110120130140
INDEX for Aggregate Cashflows of Starts
Cash flow shows both residential and nonresidential buildings should experience strong growth in 2016 before both dip in late 2016 or early 2017. Nonbuilding infrastructure shows flat throughout 2016 and a slight rise in 2017. This could change once the impact of the FAST Act is assessed.
Construction Economics 2016 Edition 13 GILBANE BUILDING COMPANY
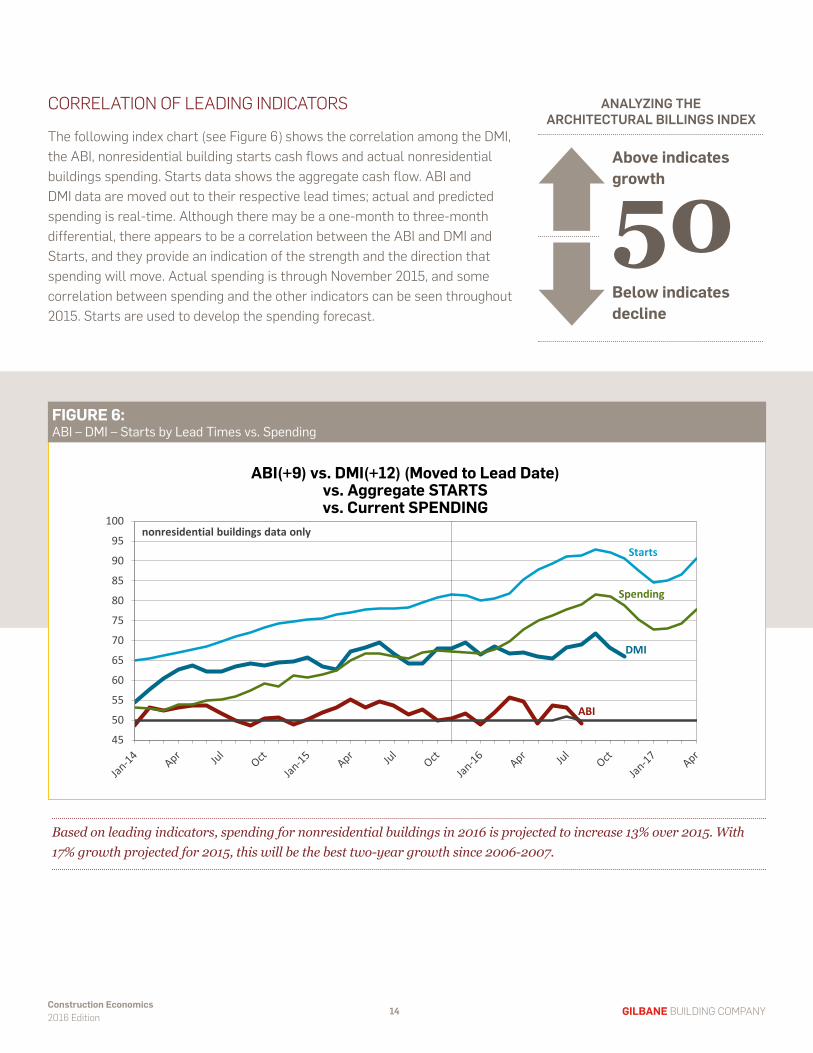
CORRELATION OF LEADING INDICATORS
The following index chart (see Figure 6) shows the correlation among the DMI, the ABI, nonresidential building starts cash flows and actual nonresidential buildings spending. Starts data shows the aggregate cash flow. ABI and DMI data are moved out to their respective lead times; actual and predicted spending is real-time. Although there may be a one-month to three-month differential, there appears to be a correlation between the ABI and DMI and Starts, and they provide an indication of the strength and the direction that spending will move. Actual spending is through November 2015, and some correlation between spending and the other indicators can be seen throughout 2015. Starts are used to develop the spending forecast.
All Construction Spending Rate of Growth 2013-2015
ABI
DMI
Starts
Spending
45
50
55
60
65
70
75
80
85
90
95
100nonresidential buildings data only
ABI(+9) vs. DMI(+12) (Moved to Lead Date) vs. Aggregate STARTS vs. Current SPENDING
50Above indicates growth
Below indicates decline
ANALYZING THE ARCHITECTURAL BILLINGS INDEX
FIGURE 6:ABI – DMI – Starts by Lead Times vs. Spending
Based on leading indicators, spending for nonresidential buildings in 2016 is projected to increase 13% over 2015. With 17% growth projected for 2015, this will be the best two-year growth since 2006-2007.
Construction Economics 2016 Edition 14 GILBANE BUILDING COMPANY
Gilbane Building Company15
Construction Spending
Construction SpendingTotal spending for all types of construction in 2015 will reach $1.1 trillion, up 10.7% year-over-year from 2014 spending.
›› 2015 spending will record the highest dollar amount year-over-year growth in 10 years.
›› In Q1 2014, the monthly rate of spending was $994 billion.
›› In Q1 2015, the monthly rate of spending was $1.056 trillion.
› In Q4 2015, the monthly rate of spending will average over $1.1 trillion.
For 2015, spending gains will be supported by the strongest gains in nonresidential buildings in eight years. Residential spending will also help total spending to advance. Nonbuilding infrastructure spending, after a brief gain, will go flat or decline until growth returns in the fourth quarter.
From the middle of Q1 2016 to the end of Q3 2016, construction spending will register an annual growth rate of 20%, but due to the dips at the beginning and the end of the year 2016, total construction spending growth will come in at 10%. Construction spending momentum is not losing steam. We are seeing the effect of a few years of erratic growth patterns and a shift from commercial to institutional work.
Expect a winter slowdown. It’s not because of the weather. There may be additional repercussions if we experience severe weather, but the slowdown is predetermined because very large starts that got booked from one to two years ago are now reaching completion and dropping out of the monthly spending. Starts can be erratic. This causes periodic, but normal, fluctuations in monthly spending.
800
850
900
950
1000
1050
1100
1150
1200
1250
1300$ annualized by historical monthly average
ALL Construction Spending Annual Rate ($bil)
FIGURE 7:All Construction Spending Rate of Growth 2013-2016
Construction Economics 2016 Edition 16 GILBANE BUILDING COMPANY
The November monthly construction spending report posted a slight loss month-over-month from October, but the data still shows rather exceptional trends. May plus June spending is the highest two-month total in seven years. Q2 2015 is the highest quarter since Q1 2008. At this rate, 2015 is on track to experience the second-highest ever dollar growth in spending, more than $100 billion. Only 2005 growth was greater.
› From August 2014 to May 2015, construction spending registered the fastest growth rate in more than nine years. 15% growth in nine months = 20% per year annualized. The growth rate is flat since.
› Manufacturing spending year-to-date versus same months in 2014 increased 47%.
› Nonresidential buildings spending year-to-date versus same months in 2014 increased 18%.
› Nonbuilding Infrastructure spending year-to-date versus same months in 2014 decreased 0.2%.
› Public spending is up 8% in a year and reached the highest level of spending in 12 quarters.
Anticipate that construction spending for 2015 will total $1.1 trillion supported by a 17% increase in nonresidential buildings spending and a 13% increase in residential spending.
U.S. Total Construction Spending Summary
TOTALS IN BILLIONS CURRENT U.S. DOLLARS
GILBANE GILBANE Actual FORECAST FORECAST
2007 2008 2009 2010 2011 2012 2013 2014 2015 2016
NONRESIDENTIAL BLDGS 403.9 438.6 377.5 291.9 284.3 300.7 303.2 330.0 386.4 439.2 % CHANGE YEAR OVER YEAR
Source $ Data: U.S. Census Bureau, Department of Commerce. See Nonbuilding Infrastructure section for list of markets in Nonbuilding Hvy Engr Actual spending data includes 2013 & 2014 revisions 7-1-15 and 2005-2015 revisions 1-4-16 Forecast Gilbane Building Company includes U.S. Census November year-to-date spending
TABLE 2:Total Construction Spending Summary 2007-2016
Construction Economics 2016 Edition 17 GILBANE BUILDING COMPANY
Once actual spending data through September is available, a select set of monthly data supports a statistical prediction of the yearly outcome for total spending within +/- 1%. It indicates 2015 should finish with total spending between $1.099 trillion and $1.119 trillion and nonresidential buildings spending between $386 billion and $395 billion. The actual final spending totals have not fallen outside the statistical range since 2001, as far back as Gilbane tracks the data. Gilbane’s 2015 forecasts of $1.068 trillion for total spending and $387 billion for nonresidential buildings fall within the expected ranges.
TOTAL AND NONRESIDENTIAL BUILDINGS CONSTRUCTION SPENDING 2015-2016 - HOW DO WE COMPARE?A comparison of most recent 2015 spending projections is shown in Table 3 and early 2016 projections are given in Table 4. Gilbane’s projections are compared to CMD Group (CMD), Markstein Advisors (Mrkst) and FMI. Other forecasts are now more in line with Gilbane’s forecast than earlier in the year. The FMI Fourth Quarter Outlook report’s final forecast for 2015 and forecast for 2016 is usually released in January but was not available at the time of this report.
Gilbane’s forecast has not changed much since July when it predicted $1,067 billion for total construction spending, $388 billion for residential and $397 billion for nonresidential buildings spending in 2015. Last December, Gilbane forecast 8.5% growth in spending for 2015 and by April, raised that forecast to 9.5%. Since August, Gilbane has been predicting 11% growth in 2015 when most other forecasts were in the 5% to 7% range. It now appears we will finish the year very close to 11% growth.
2015 Construction Spending Forecast VALUES ARE $ BILLIONS
VALUES ARE $ BILLIONS 2014 Midyear Estm 2015 Q3-Q4 Estm 2015 2014 DATA UPDATED 7-1-15 ACTUAL Gilbane CMD FMI Gilbane CMD Mrkst FMI
Values are billions of dollars Gilbane data midyear 2015 = July 2015, Q3-Q4 12-21-15 includes October spending CMD data midyear 2015 = 6-3-2015 report, Q3-Q4 12-23-15 Markstein Advisors (Mrkst) data Q3Q4 webcast 11-3-15 FMI data midyear 2015 = Outlook 2015 Q2, Q3-Q4 Outlook 9-28-15 FMI Transportation and Communication moved from Buildings to Nonbuilding to conform
On January 4, 2016, the U.S. Census released revisions to residential spending covering 2005 through 2015. Table 3 shows the last Gilbane projection of 2015 costs JUST PRIOR TO THE CENSUS UPDATE. Other firms that released cost projections prior to January 4, 2016 have not yet had the opportunity to incorporate this revised data. This table captures the equivalent 2015 comparison before the updated numbers change.
TABLE 3:Total Spending Predictions Comparisons 2015 Midyear vs. Year End
Construction Economics 2016 Edition 18 GILBANE BUILDING COMPANY
2015 -2016 Construction Spending Forecast VALUES ARE $ BILLIONS 2014 Q3-Q4 Estm 2015 Early Estm 2016
2014 DATA UPDATED 1-4-16 ACTUAL Gilbane CMD Mrkst FMI Gilbane CMD Mrkst FMI
TOTAL ALL 993 1100 1057 1064 1026 1206 1147 1169 1093
Change from previous year 10.7% 9.6% 8.6% 9.9% 6.6%
Includes U.S. Census November spending and 1-4-16 residential revisions Gilbane Building Company all data from update 1-4-16, includes census revisions released 1-4-16 CMD Construction Market Data all data from article 12-23-15 Markstein Advisors (Mrkst) all data from webcast 11-3-15 FMI data all data from Outlook 9-28-15 FMI Transportation and Communication moved from Buildings to Nonbuilding to conform
For 2016, expect spending to total $1.206 trillion with increases of 13% and 14% in nonresidential and residential buildings. For the 2016 forecast, new starts booked through December 2015 will contribute 75% to nonresidential buildings spending, 55% to residential spending and 80% to spending on nonbuilding infrastructure.
On January 4, 2016, the U.S. Census released revisions to residential spending covering 2005 through 2015. Table 4 INCLUDES those revisions in the Gilbane projection of 2015 costs and 2016 costs. Other firms that released cost projections prior to January 4, 2016 have not yet had the opportunity to incorporate this revised data. Census added about $33 billion to residential spending in 2015. For sake of fair comparison, add that amount to other 2015 projections and add that to other estimates for 2016.
Construction Economics 2016 Edition 19 GILBANE BUILDING COMPANY
Gilbane Building Company20
Nonresidential Construction
Spending
Nonresidential Construction Spending
Nonresidential construction consists of two main categories, nonbuilding infrastructure projects and nonresidential buildings.
Total spending for all nonresidential construction in 2015 will reach $678 billion, up 9.7% from 2014. Growth is entirely due to nonresidential buildings spending, up 18% year-to-date. Nonbuilding infrastructure spending increased less than 1% in 2015.
Nonresidential buildings spending will slow moderately in the next few months before we enter a period of 15% annual growth rate for the period Q2-Q3 2016. Spending will slow down late in 2016, leading into a considerably slower 2017.
Manufacturing starts are down 30% in 2015 and are still at the second highest rate ever recorded. Manufacturing will still provide very strong support to spending at 13% growth in 2016. The institutional sector will be the strongest sector in 2016 with work in educational and healthcare market sectors both climbing 13% to 14% and amusement/recreation adding 22%. Since 2013, major nonresidential buildings new starts increased an average 33% with healthcare coming up last. Total nonresidential buildings spending in 2016 will reach 14% growth.
Infrastructure projects spending will decline for the next six months due to the ending of massive projects that started 24 to 42 months ago. There will be big advances in spending midyear before we experience another mild slowdown later in 2016.
Infrastructure spending will grow less than 1% in 2016, held down by a 9% drop in the power sector, the second largest component of infrastructure work. Although power had very strong starts in 2015, spending in 2016 will be held down by the cash flows from a lower volume of project starts in 2013 and 2014. The strong starts in 2015 will boost 2017 spending. Highway/bridge and surface transportation spending will both benefit from the passage of the FAST Act with greater benefit occurring in 2017.
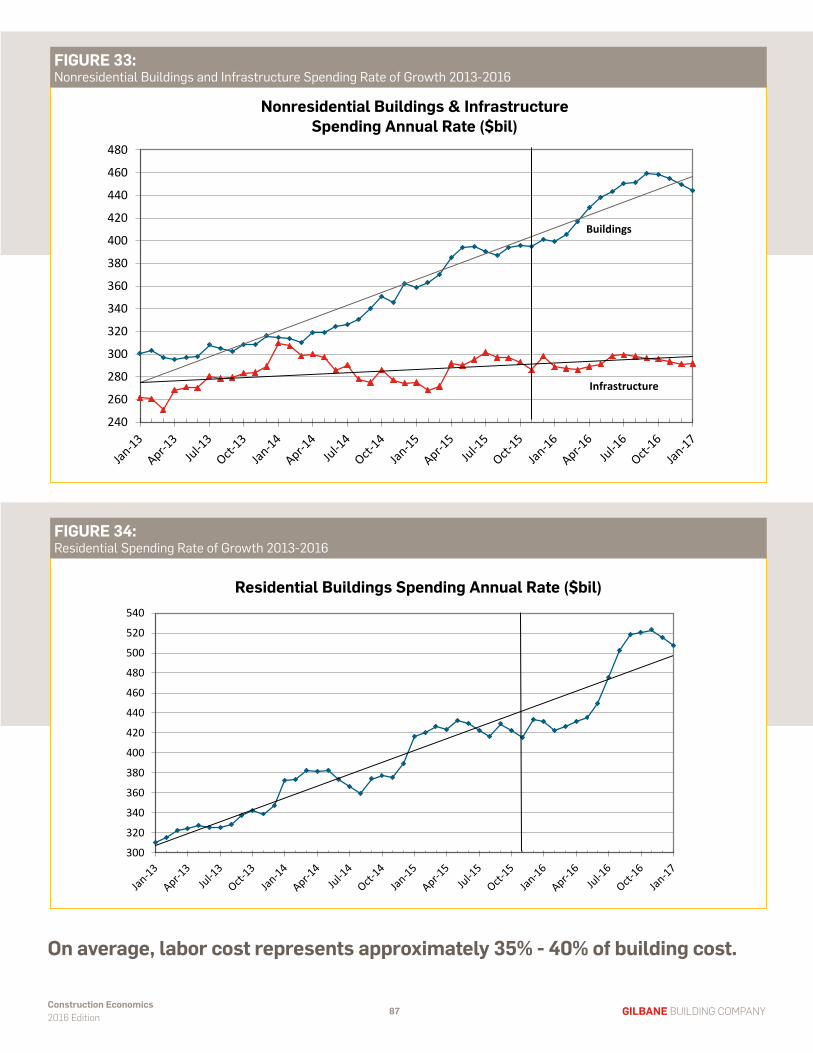
FIGURE 8:Spending Growth Nonresidential Buildings and Infrastructure 2013-2016
Construction Economics 2016 Edition 21 GILBANE BUILDING COMPANY
NONBUILDING INFRASTRUCTURE SPENDINGNonbuilding projects are composed of heavy engineering, heavy industrial and infrastructure projects. They include transportation, communication, power, highway and street, sewage and waste disposal, water supply, and conservation and development. Almost 60% of nonbuilding work is public work.
After holding at $290 billion for less than 1% growth in 2015, spending for nonbuilding infrastructure in 2016 will reach only $293 billion, again less than a 1% increase over 2015.
› In Q1 2015, the monthly rate of spending slipped to only $272 billion, down from all of 2014.
› For the entire second half of 2015, the monthly rate of spending has been averaging $297 billion.
› Most of 2016 will not reach the current level of spending, finishing the year at $293 billion.
U.S. Infrastructure Construction Spending
TOTALS IN BILLIONS CURRENT U.S. DOLLARS
GILBANE GILBANE Actual FORECAST FORECAST
2007 2008 2009 2010 2011 2012 2013 2014 2015 2016
POWER / ELECTRIC / GAS 66.1 81.1 88.9 77.9 75.2 97.4 93.3 101.2 87.4 78.9 % CHANGE YEAR OVER YEAR
Source $ Data: U.S. Census Bureau, Department of Commerce. Transportation includes terminal buildings Actual Spending data includes 2013 and 2014 revisions 7-1-15 and 2005-2015 revisions 1-4-16 Forecast Gilbane Building Company includes U.S. Census November year-to-date spending
TABLE 5:Construction Spending Major Nonbuilding Infrastructure Markets 2007-2016
Construction Economics 2016 Edition 22 GILBANE BUILDING COMPANY
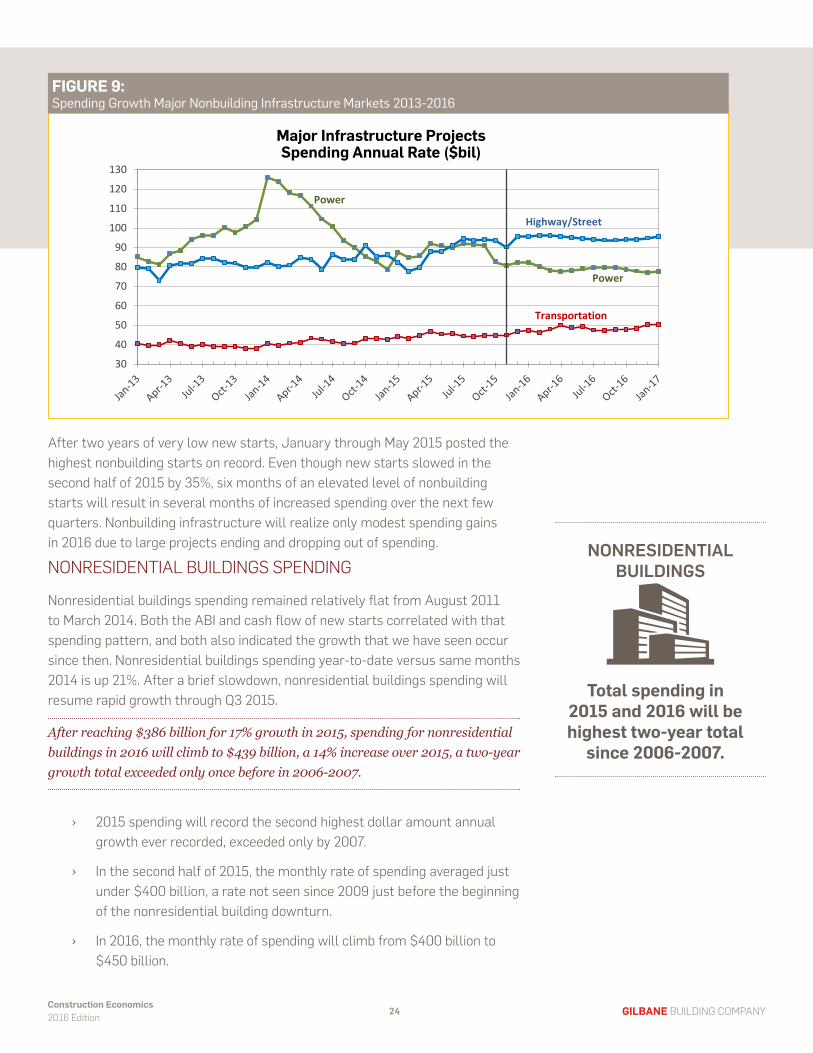
The largest components of nonbuilding infrastructure work are power and highway/street. The power sector represents approximately 25% to 30% of all nonbuilding spending and highway/street represents about 30%. Power is more than 85% private while highway/street is almost 100% public. Erratic movement in new starts in the power industry causes unusual fluctuations in nonbuilding infrastructure spending. The period from July 2012 through June 2014 had the lowest average new starts for infrastructure work of any period in the last seven years. The effect of all of those low starts will result in constrained spending continuing through 2016.
Power
After reaching a peak of $101 billion in 2014, total spending for power projects in 2015 is expected to reach only $87.4 billion, a 13.7% decrease from 2014.
Power spending only dropped 15% during the recession. It is the most volatile market of all with dramatically erratic spending patterns.
Spending for power projects in 2016 is forecast to decline 9.6% from 2015. Other industry projections for power spending in 2016 range from -5% to +10% growth over 2015, averaging 3% growth in 2016.
As of November 2015, project starts that will generate 80% of all power projects spending in 2016 are already booked. Although power starts more than doubled in 2015, these projects are of such long duration that they will not have the same effect on 2016 spending. Long-duration, lower-volume projects from 2013 and 2014 will drive 2016 spending down. Strong starts in 2015 will boost 2017 spending.
Highway/Bridge/Street
Total spending for highway/bridge/street projects in 2015 is expected to reach $90.4 billion, a 7.3% increase from 2014.
Spending in the highway/bridge/street market dropped only one year during the recession, 2011. It was supported in large part by government spending during the early stages of the recession.
In 2016, spending for highway projects is expected to increase 4.7% from 2015. Other industry projections for highway spending in 2016 range from -1% to +6% growth over 2015, averaging 3% growth in 2016. Once we begin to see the effects of the FAST Act projects, we may begin to see modifications to these projections.
As of November 2015, project starts that will generate 80% of all highway projects spending in 2016 are already booked. Highway/bridge spending will benefit from the passage of the FAST Act with potentially the most benefit occurring in 2017.
Construction Economics 2016 Edition 23 GILBANE BUILDING COMPANY
After two years of very low new starts, January through May 2015 posted the highest nonbuilding starts on record. Even though new starts slowed in the second half of 2015 by 35%, six months of an elevated level of nonbuilding starts will result in several months of increased spending over the next few quarters. Nonbuilding infrastructure will realize only modest spending gains in 2016 due to large projects ending and dropping out of spending.
NONRESIDENTIAL BUILDINGS SPENDING
Nonresidential buildings spending remained relatively flat from August 2011 to March 2014. Both the ABI and cash flow of new starts correlated with that spending pattern, and both also indicated the growth that we have seen occur since then. Nonresidential buildings spending year-to-date versus same months 2014 is up 21%. After a brief slowdown, nonresidential buildings spending will resume rapid growth through Q3 2015.
After reaching $386 billion for 17% growth in 2015, spending for nonresidential buildings in 2016 will climb to $439 billion, a 14% increase over 2015, a two-year growth total exceeded only once before in 2006-2007.
› 2015 spending will record the second highest dollar amount annual growth ever recorded, exceeded only by 2007.
› In the second half of 2015, the monthly rate of spending averaged just under $400 billion, a rate not seen since 2009 just before the beginning of the nonresidential building downturn.
› In 2016, the monthly rate of spending will climb from $400 billion to $450 billion.
Total spending in 2015 and 2016 will be highest two-year total
since 2006-2007.
NONRESIDENTIAL BUILDINGS
Power
Highway/Street
30
40
50
60
70
80
90
100
110
120
130
Major Infrastructure Projects Spending Annual Rate ($bil)
Transportation
Power
FIGURE 9:Spending Growth Major Nonbuilding Infrastructure Markets 2013-2016
Construction Economics 2016 Edition 24 GILBANE BUILDING COMPANY
This is clearly going to measure up as the breakout year for spending on nonresidential buildings. Growth year-to-date (YTD) is up 18%. We will finish the year with total growth up 17%. The last time we saw growth like this was 2007, the only time % growth (and $ volume growth) was ever larger than this year.
By far the largest spending contribution comes from the growth in manufacturing buildings, up 50% and up $23 billion YTD. Next closest is office buildings, up 22% and $8.3 billion YTD. Lodging, commercial-retail, educational, and amusement-recreation are each up approximately $4 billion YTD, impressive for lodging and amusement-recreation since they total only $17 billion each YTD.
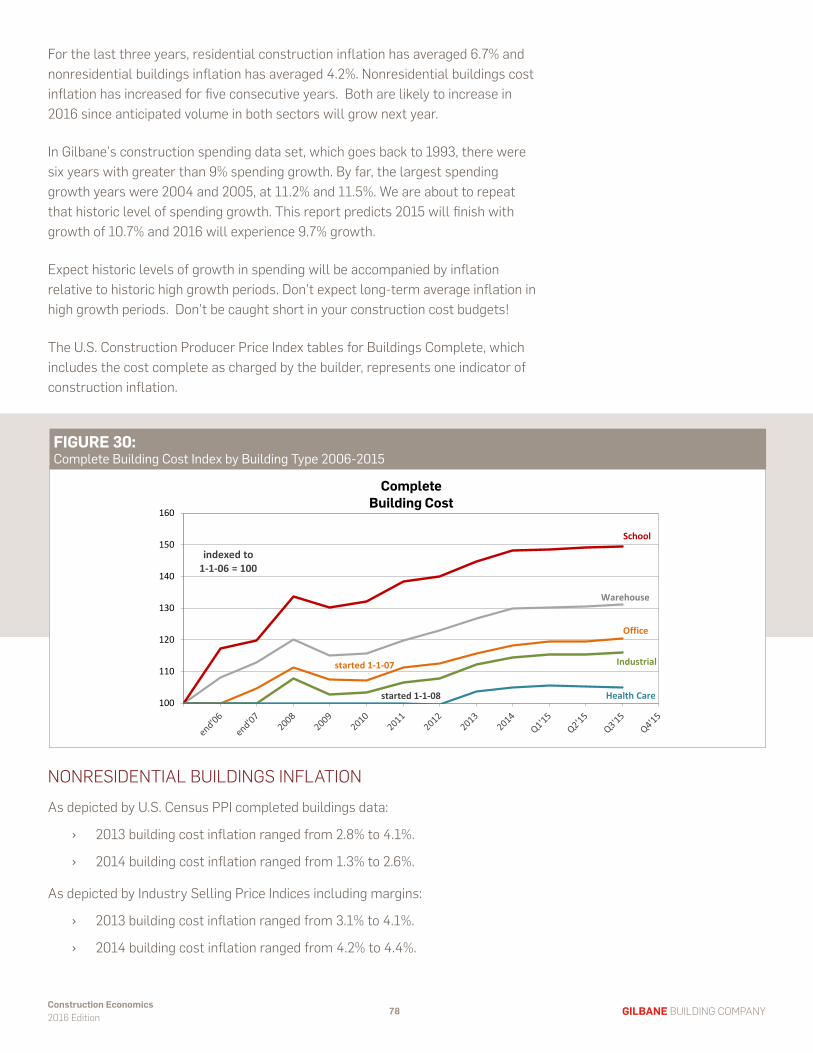
Nonresidential buildings spending will maintain a second year of 10% growth in 2016 – something achieved only five times in 25 years. In 2016, educational and healthcare buildings will both contribute strongly to the total annual growth. Manufacturing, office and lodging will all settle back but still maintain 10% or greater growth. Commercial-retail, which had three years of substantial growth from 2012 to 2014, adding nearly 50% spending growth during that time, will add only 6% next year.
Nonresidential buildings spending in 2014, 2015 and 2016 may reach or exceed growth of 40% in three years, a growth rate reached only once in history, during the last construction boom, from 2006 to 2008. Along with that boom in spending came the highest nonresidential buildings construction inflation ever recorded, an average inflation of more than 8% per year for the four years from 2005 to 2008. It looks like we are headed toward persistent high construction inflation. However, the last three years so far seem more like the period from 1995 to 2000 when nonresidential buildings inflation averaged 4.0%. Then we had 40% spending growth in four years, a lesser growth rate than now.
Construction Economics 2016 Edition 25 GILBANE BUILDING COMPANY
TABLE 6:Construction Spending Major Nonresidential Buildings Markets 2007-2016
U.S. Nonresidential Buildings Construction Spending
TOTALS IN BILLIONS CURRENT U.S. DOLLARS
GILBANE GILBANE Actual FORECAST FORECAST
2007 2008 2009 2010 2011 2012 2013 2014 2015 2016
EDUCATIONAL 96.8 104.9 103.2 88.4 85.0 84.7 79.1 79.7 85.6 97.2 % CHANGE YEAR OVER YEAR
SUBTOTAL SHARE % OF TOTAL NONRESIDENTIAL BLDGS 95.6% 95.4% 94.7% 94.4% 94.7% 95.3% 95.7% 96.2% 97.1% 95.0%
Source $ Data: U.S. Census Bureau, Department of Commerce. Commercial retail includes stores & warehouses, Recreation includes Stadiums, Office includes Data Centers Actual Spending data includes 2013 & 2014 revisions 7-1-15 and 2005-2015 revisions 1-4-16 Forecast Gilbane Building Company includes U.S. Census November year-to-date spending
Five market sectors represent over 80% of all nonresidential buildings spending: educational; healthcare; commercial/retail; office and manufacturing. Lodging and amusement/recreation are the next two largest markets, and those seven markets account for 95% of all nonresidential buildings spending.
Construction Economics 2016 Edition 26 GILBANE BUILDING COMPANY
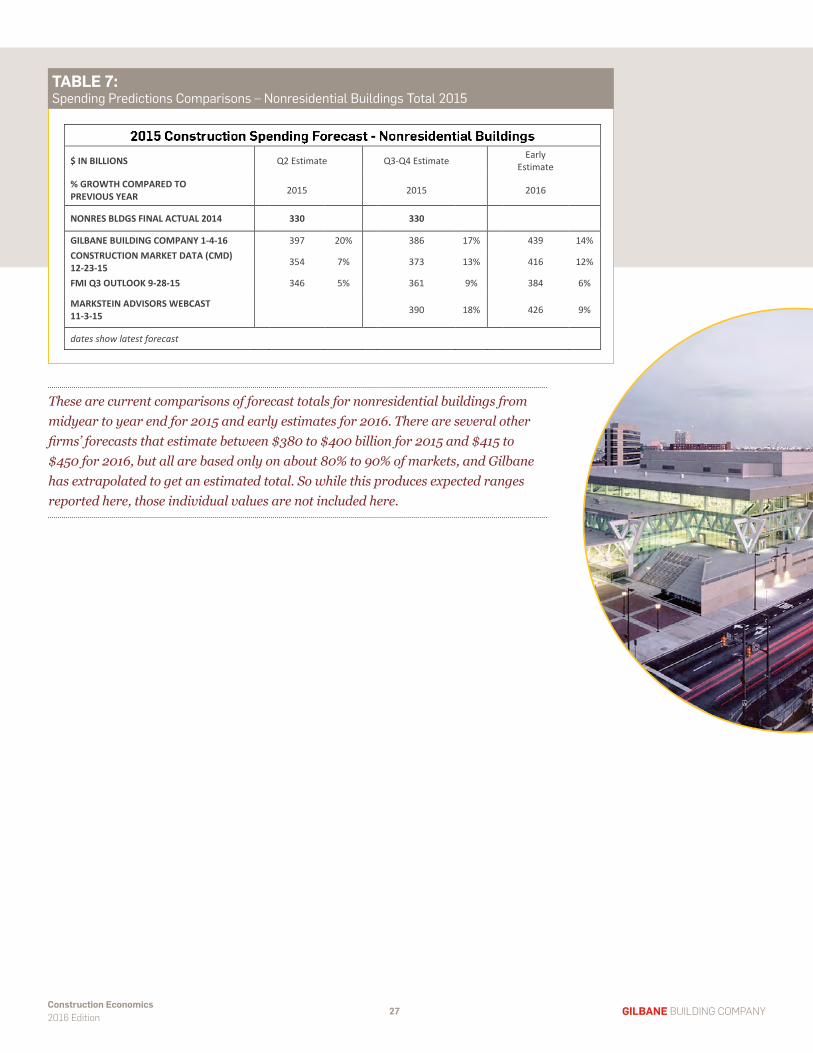
$ IN BILLIONS
Q2 Estimate Q3-Q4 Estimate Early
Estimate
% GROWTH COMPARED TO PREVIOUS YEAR
2015 2015 2016
NONRES BLDGS FINAL ACTUAL 2014 330 330 GILBANE BUILDING COMPANY 1-4-16 397 20% 386 17% 439 14% CONSTRUCTION MARKET DATA (CMD) 12-23-15 354 7% 373 13% 416 12%
FMI Q3 OUTLOOK 9-28-15 346 5% 361 9% 384 6%
MARKSTEIN ADVISORS WEBCAST 11-3-15 390 18% 426 9%
dates show latest forecast
These are current comparisons of forecast totals for nonresidential buildings from midyear to year end for 2015 and early estimates for 2016. There are several other firms’ forecasts that estimate between $380 to $400 billion for 2015 and $415 to $450 for 2016, but all are based only on about 80% to 90% of markets, and Gilbane has extrapolated to get an estimated total. So while this produces expected ranges reported here, those individual values are not included here.
TABLE 7:Spending Predictions Comparisons – Nonresidential Buildings Total 2015
Construction Economics 2016 Edition 27 GILBANE BUILDING COMPANY
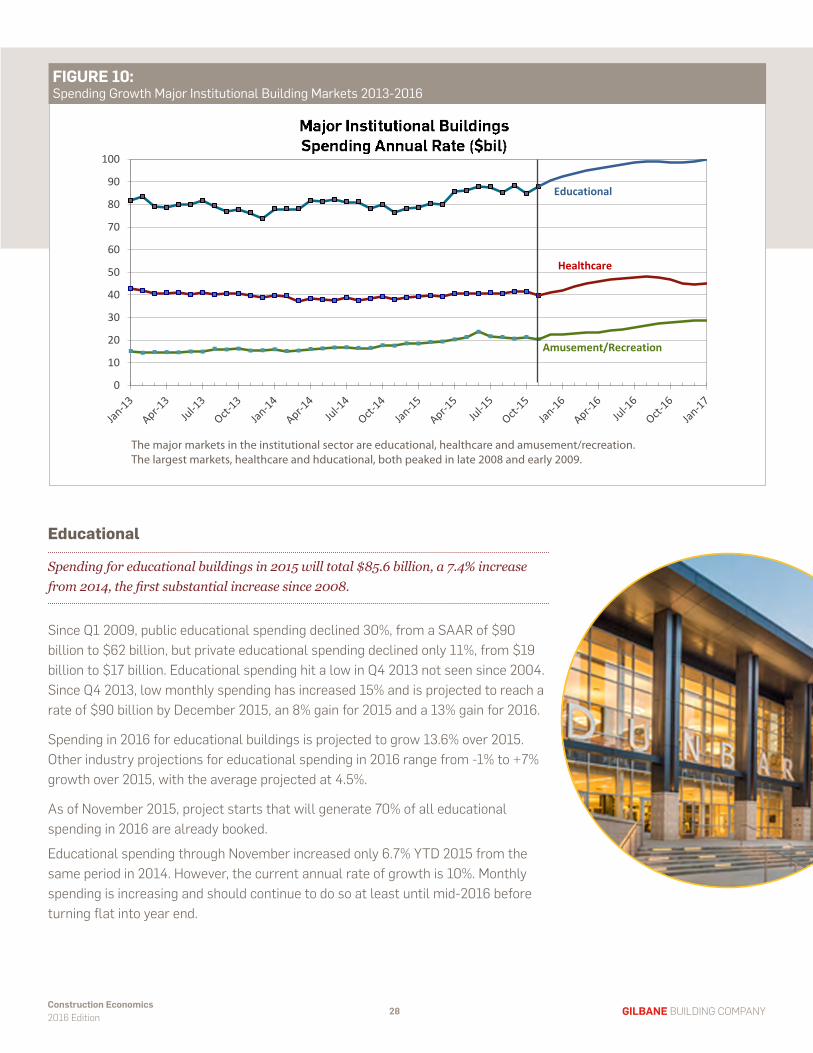
Educational
Spending for educational buildings in 2015 will total $85.6 billion, a 7.4% increase from 2014, the first substantial increase since 2008.
Since Q1 2009, public educational spending declined 30%, from a SAAR of $90 billion to $62 billion, but private educational spending declined only 11%, from $19 billion to $17 billion. Educational spending hit a low in Q4 2013 not seen since 2004. Since Q4 2013, low monthly spending has increased 15% and is projected to reach a rate of $90 billion by December 2015, an 8% gain for 2015 and a 13% gain for 2016.
Spending in 2016 for educational buildings is projected to grow 13.6% over 2015. Other industry projections for educational spending in 2016 range from -1% to +7% growth over 2015, with the average projected at 4.5%.
As of November 2015, project starts that will generate 70% of all educational spending in 2016 are already booked.
Educational spending through November increased only 6.7% YTD 2015 from the same period in 2014. However, the current annual rate of growth is 10%. Monthly spending is increasing and should continue to do so at least until mid-2016 before turning flat into year end.
All Construction Spending Rate of Growth 2013-2015 FIGURE 10:Spending Growth Major Institutional Building Markets 2013-2016
Healthcare
Educational
0
10
20
30
40
50
60
70
80
90
100
Amusement/Recreation
The major markets in the institutional sector are educational, healthcare and amusement/recreation. The largest markets, healthcare and hducational, both peaked in late 2008 and early 2009.
Construction Economics 2016 Edition 28 GILBANE BUILDING COMPANY
Healthcare
Total spending for healthcare buildings in 2015 is expected to reach $41.1 billion, a 7.0% increase from 2014.
Healthcare spending hit an eight-year low in Q2 2014 at $38 billion. It is now up to $41 billion. Healthcare spending will reach an annual rate of $48 billion by Q3 2016.
2016 spending for healthcare buildings is expected to grow 13.8% over 2015. Other industry projections for healthcare spending in 2016 range from +3% to +8% growth over 2015, averaging 6% growth in 2016.
As of November 2015, project starts that will generate 70% of all healthcare spending in 2016 are already booked. Although healthcare starts have not increased much over 2014, there are several months of very large starts from 2014 and early 2015 that will generate added spending above normal in 2016.
Healthcare spending through November increased only 4.6% YTD 2015 from the same period 2014. However, expect the annual growth rate to reach 15% in the first half of 2016, caused in part by long-duration, large-volume starts that are still ongoing from early 2014. Monthly spending is increasing and should continue to do so at least until the third quarter before turning flat into year end.
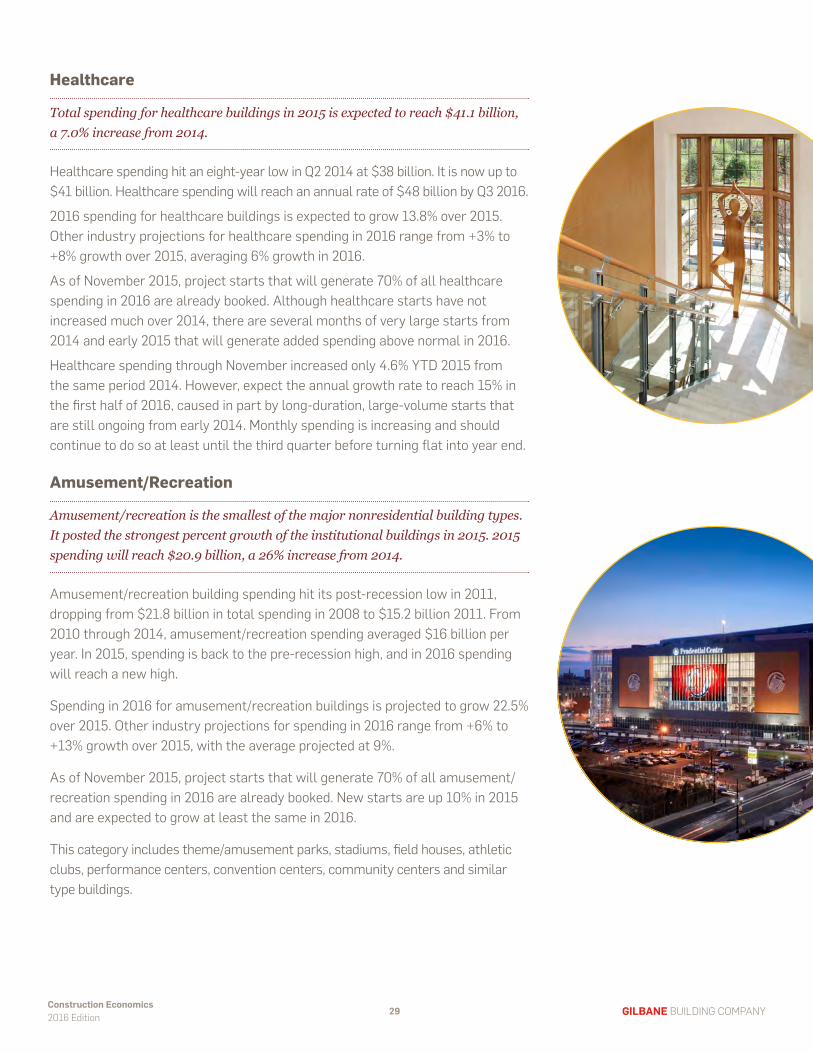
Amusement/Recreation
Amusement/recreation is the smallest of the major nonresidential building types. It posted the strongest percent growth of the institutional buildings in 2015. 2015 spending will reach $20.9 billion, a 26% increase from 2014.
Amusement/recreation building spending hit its post-recession low in 2011, dropping from $21.8 billion in total spending in 2008 to $15.2 billion 2011. From 2010 through 2014, amusement/recreation spending averaged $16 billion per year. In 2015, spending is back to the pre-recession high, and in 2016 spending will reach a new high.
Spending in 2016 for amusement/recreation buildings is projected to grow 22.5% over 2015. Other industry projections for spending in 2016 range from +6% to +13% growth over 2015, with the average projected at 9%.
As of November 2015, project starts that will generate 70% of all amusement/recreation spending in 2016 are already booked. New starts are up 10% in 2015 and are expected to grow at least the same in 2016.
This category includes theme/amusement parks, stadiums, field houses, athletic clubs, performance centers, convention centers, community centers and similar type buildings.
Construction Economics 2016 Edition 29 GILBANE BUILDING COMPANY
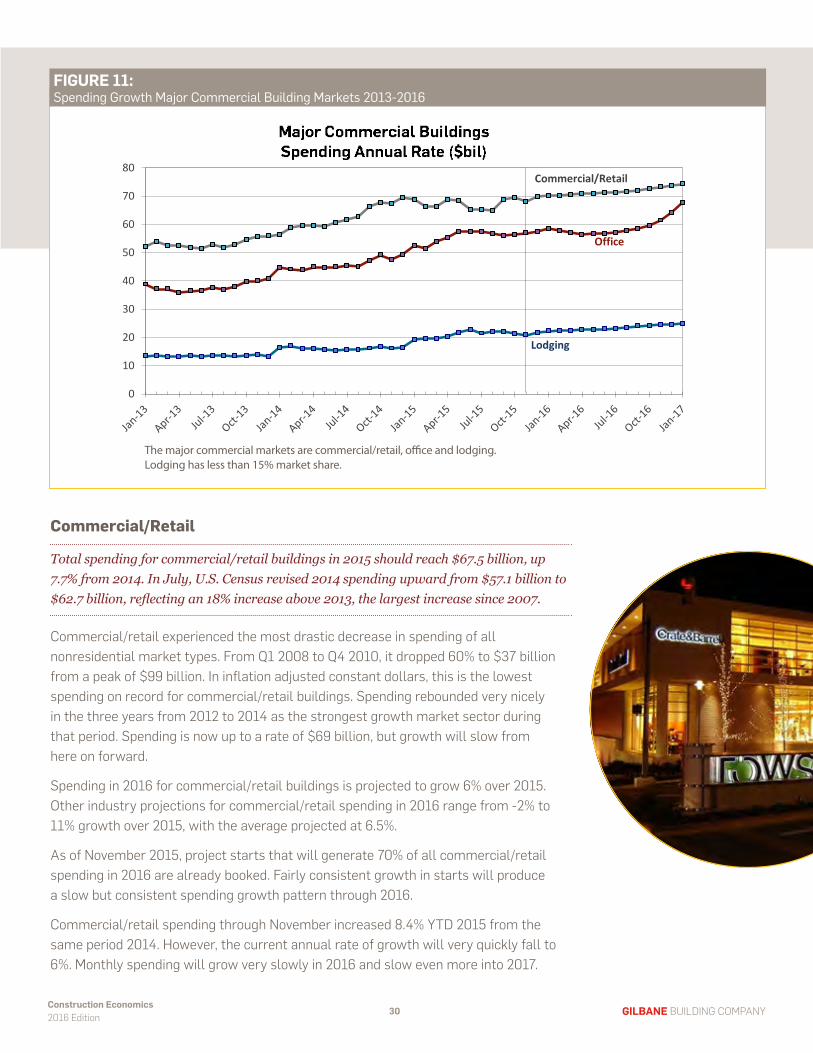
Commercial/Retail
Total spending for commercial/retail buildings in 2015 should reach $67.5 billion, up 7.7% from 2014. In July, U.S. Census revised 2014 spending upward from $57.1 billion to $62.7 billion, reflecting an 18% increase above 2013, the largest increase since 2007.
Commercial/retail experienced the most drastic decrease in spending of all nonresidential market types. From Q1 2008 to Q4 2010, it dropped 60% to $37 billion from a peak of $99 billion. In inflation adjusted constant dollars, this is the lowest spending on record for commercial/retail buildings. Spending rebounded very nicely in the three years from 2012 to 2014 as the strongest growth market sector during that period. Spending is now up to a rate of $69 billion, but growth will slow from here on forward.
Spending in 2016 for commercial/retail buildings is projected to grow 6% over 2015. Other industry projections for commercial/retail spending in 2016 range from -2% to 11% growth over 2015, with the average projected at 6.5%.
As of November 2015, project starts that will generate 70% of all commercial/retail spending in 2016 are already booked. Fairly consistent growth in starts will produce a slow but consistent spending growth pattern through 2016.
Commercial/retail spending through November increased 8.4% YTD 2015 from the same period 2014. However, the current annual rate of growth will very quickly fall to 6%. Monthly spending will grow very slowly in 2016 and slow even more into 2017.
Lodging
Office
Commercial/Retail
0
10
20
30
40
50
60
70
80
FIGURE 11:Spending Growth Major Commercial Building Markets 2013-2016
The major commercial markets are commercial/retail, office and lodging. Lodging has less than 15% market share.
Construction Economics 2016 Edition 30 GILBANE BUILDING COMPANY
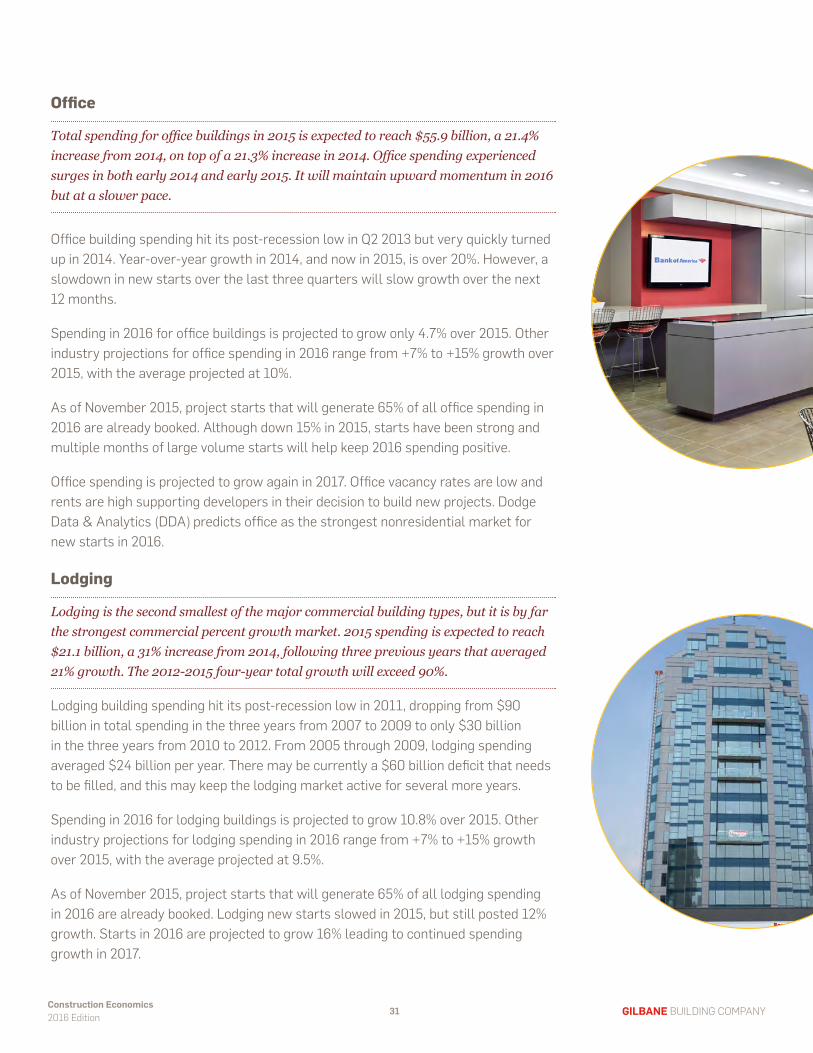
Office
Total spending for office buildings in 2015 is expected to reach $55.9 billion, a 21.4% increase from 2014, on top of a 21.3% increase in 2014. Office spending experienced surges in both early 2014 and early 2015. It will maintain upward momentum in 2016 but at a slower pace.
Office building spending hit its post-recession low in Q2 2013 but very quickly turned up in 2014. Year-over-year growth in 2014, and now in 2015, is over 20%. However, a slowdown in new starts over the last three quarters will slow growth over the next 12 months.
Spending in 2016 for office buildings is projected to grow only 4.7% over 2015. Other industry projections for office spending in 2016 range from +7% to +15% growth over 2015, with the average projected at 10%.
As of November 2015, project starts that will generate 65% of all office spending in 2016 are already booked. Although down 15% in 2015, starts have been strong and multiple months of large volume starts will help keep 2016 spending positive.
Office spending is projected to grow again in 2017. Office vacancy rates are low and rents are high supporting developers in their decision to build new projects. Dodge Data & Analytics (DDA) predicts office as the strongest nonresidential market for new starts in 2016.
Lodging
Lodging is the second smallest of the major commercial building types, but it is by far the strongest commercial percent growth market. 2015 spending is expected to reach $21.1 billion, a 31% increase from 2014, following three previous years that averaged 21% growth. The 2012-2015 four-year total growth will exceed 90%.
Lodging building spending hit its post-recession low in 2011, dropping from $90 billion in total spending in the three years from 2007 to 2009 to only $30 billion in the three years from 2010 to 2012. From 2005 through 2009, lodging spending averaged $24 billion per year. There may be currently a $60 billion deficit that needs to be filled, and this may keep the lodging market active for several more years.
Spending in 2016 for lodging buildings is projected to grow 10.8% over 2015. Other industry projections for lodging spending in 2016 range from +7% to +15% growth over 2015, with the average projected at 9.5%.
As of November 2015, project starts that will generate 65% of all lodging spending in 2016 are already booked. Lodging new starts slowed in 2015, but still posted 12% growth. Starts in 2016 are projected to grow 16% leading to continued spending growth in 2017.
Construction Economics 2016 Edition 31 GILBANE BUILDING COMPANY
Manufacturing
30
40
50
60
70
80
90
100
110
Industrial Buildings Spending Annual Rate ($bil)
Manufacturing buildings are the only building type classified in the industrial buildings sector. Spending peaked in early 2009 at a rate of $70 billion but then dropped 50% to hit a five-year low in January 2011. It quickly climbed from that bottom but remained between $40 and $50 billion until March 2014. Manufacturing is 100% private.
FIGURE 12:Spending Growth Major Industrial Building Market 2013-2016
Manufacturing
Total spending for manufacturing buildings in 2015 will reach $83.7 billion, up 44.8% from 2014. It is rare that any market grows close to 50% in a year.
Manufacturing buildings spending rose from a SAAR rate of $50 billion in Q1 2014 to its 2015 peak of $92 billion in May. From July 2014 through May 2015, manufacturing spending grew at an annual rate of 80%. Since then, spending has declined at an annual rate of 25%.
Spending in 2016 is projected to grow 13.2% over 2015. Other industry projections range from -10% to +15% growth over 2015, with the average of those projections at 6.5%.
As of November 2015, project starts that will generate 75% of all manufacturing spending in 2016 are already booked. Total starts for 2015 are projected to finish almost 30% lower than 2014. That will still result in the second highest year of starts on record and will result in spending growth in 2016.
Construction Economics 2016 Edition 32 GILBANE BUILDING COMPANY
2015 Construction Spending Forecast Comparison Selected Nonresidential Buildings
PCA in ENR 11-16-15 -0.6% 2.6% na 8.1% 3.8% 8.0% 4.2%
AGC in CMD webcast 11-19-15 3 to 5% 3 to 8% na -2 to +11% -10 to +15% 5 to 15% -10 to +10%
Actual 2015 Total $billions will be revised 3-1-16
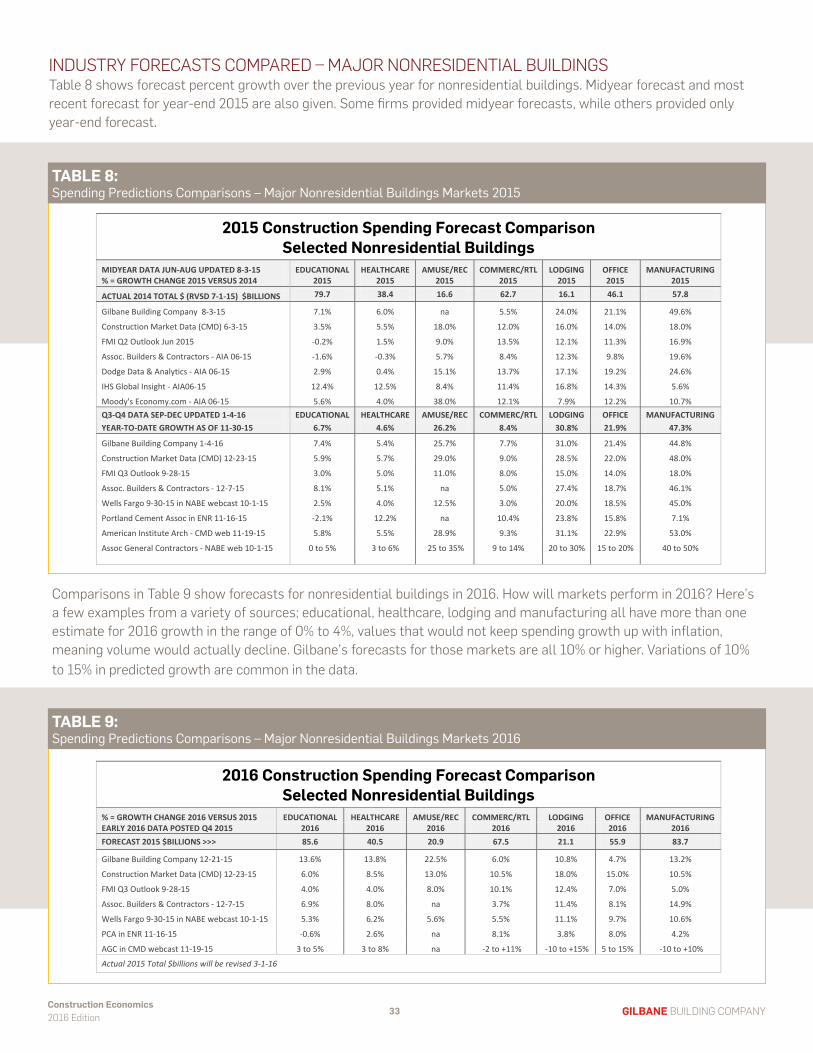
Comparisons in Table 9 show forecasts for nonresidential buildings in 2016. How will markets perform in 2016? Here’s a few examples from a variety of sources; educational, healthcare, lodging and manufacturing all have more than one estimate for 2016 growth in the range of 0% to 4%, values that would not keep spending growth up with inflation, meaning volume would actually decline. Gilbane’s forecasts for those markets are all 10% or higher. Variations of 10% to 15% in predicted growth are common in the data.
TABLE 8:Spending Predictions Comparisons – Major Nonresidential Buildings Markets 2015
INDUSTRY FORECASTS COMPARED – MAJOR NONRESIDENTIAL BUILDINGS Table 8 shows forecast percent growth over the previous year for nonresidential buildings. Midyear forecast and most recent forecast for year-end 2015 are also given. Some firms provided midyear forecasts, while others provided only year-end forecast.
Construction Economics 2016 Edition 33 GILBANE BUILDING COMPANY
Gilbane Building Company34
Residential Construction
Spending
Residential Construction Spending
On January 4, 2016, the U.S. Census released revisions to residential spending covering 2005 through 2015. Most years during that period were revised upwards. By far the largest adjustments were for 2014 and 2015 year-to-date, which were revised upward by $31 to $33 billion, 9% of total residential spending in the year. This modified our total growth reported for 2014 from less than 1% to +14%. While it modifies our total dollars for 2015, it does not have a large effect on our percent growth for 2015.
Total spending for residential construction in 2015 will reach $424 billion, a 13.0% increase from 2014. Single-family housing represents approximately 52% of spending. Multi-family housing represents 12% of spending. The remaining 36% of spending is renovation work.
› 2015 spending will grow 13% over 2014. Spending has averaged 14% per year growth for the last four years.
› Spending will post modest dips from Q4 2015 through Q1 2016.
› In 2016, the monthly rate of spending will grow more than 20% from Q1 to Q4.
› By the end of 2016 spending will be at an annual rate over $500 billion.
Spending in 2016 for residential buildings is projected to grow 11.8% over 2015. Other industry projections for residential spending in 2016 range from 5% to 10% growth over 2015, with the average projected at 7.5% growth.
As of November 2015, residential project starts that are booked will generate 55% of residential spending in 2016. Residential construction has the shortest durations so previously booked starts provide the lowest forecast certainty and new starts booked within the year contribute a lot to spending within the year. More than any other sector or market, residential construction is more dependent on future starts for total spending within the year.
RESIDENTIAL BUILDINGS
2015 spending will record the second
highest dollar amount annual growth ever recorded, exceeded
only by 2007.
Construction Economics 2016 Edition 35 GILBANE BUILDING COMPANY
All Construction Spending Rate of Growth 2013-2015
Residential spending peaked in Q1 2006 at an annual rate over $700 billion. It then dropped to a low point in Q4 2010 at an annual rate of less than $250 billion, a decline of 65%. Spending rebounded very nicely in the three years of 2012 to 2014 as the strongest growth market sector during that period. Spending is now averaging an annual rate of $430 billion, but growth will slow for the next few months. Residential spending will slow several percent to a low point in February before resuming upward momentum to finish 2016 stronger than 2015. Periods of low start volumes need to work their way through the system, and this produces growth patterns with periodic dips.
TOTALS IN BILLIONS CURRENT U.S. DOLLARS
GILBANE GILBANE Actual FORECAST FORECAST
2007 2008 2009 2010 2011 2012 2013 2014 2015 2016
RESIDENTIAL 496.1 366.7 255.5 252.3 252.6 276.1 329.2 375.1 423.8 473.8 % CHANGE YEAR OVER YEAR -19.2% -26.1% -30.3% -1.3% 0.1% 9.3% 19.3% 13.9% 13.0% 11.8%
Source $ Data: U.S. Census Bureau, Department of Commerce. See Nonbuilding Infrastructure section for list of markets in Nonbuilding Hvy Engr Actual spending data includes 2013 & 2014 revisions 7-1-15 and 2005-2015 revisions 1-4-16 Forecast Gilbane Building Company includes U.S. Census November year-to-date spending
All Construction Spending Rate of Growth 2013-2015
300320340360380400420440460480500520540
FIGURE 13:Spending Growth Residential Building Market 2013-2016
Construction Economics 2016 Edition 36 GILBANE BUILDING COMPANY
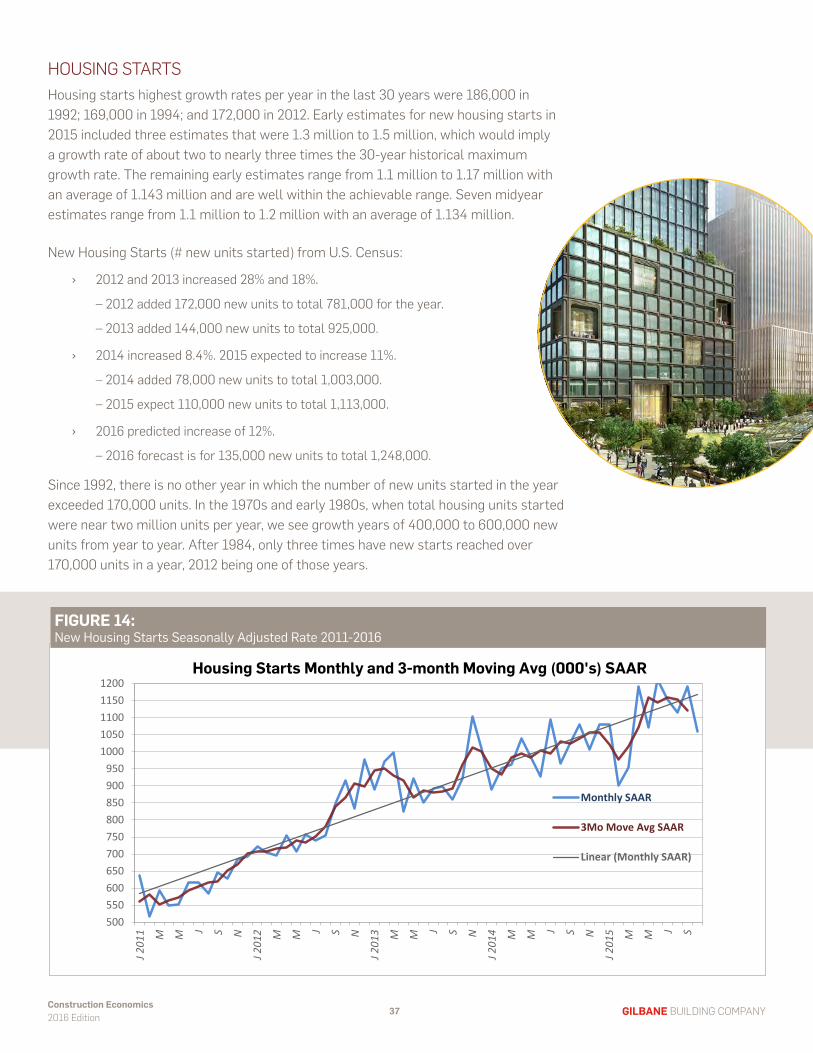
HOUSING STARTSHousing starts highest growth rates per year in the last 30 years were 186,000 in 1992; 169,000 in 1994; and 172,000 in 2012. Early estimates for new housing starts in 2015 included three estimates that were 1.3 million to 1.5 million, which would imply a growth rate of about two to nearly three times the 30-year historical maximum growth rate. The remaining early estimates range from 1.1 million to 1.17 million with an average of 1.143 million and are well within the achievable range. Seven midyear estimates range from 1.1 million to 1.2 million with an average of 1.134 million.
New Housing Starts (# new units started) from U.S. Census:
› 2012 and 2013 increased 28% and 18%.
– 2012 added 172,000 new units to total 781,000 for the year.
– 2013 added 144,000 new units to total 925,000.
› 2014 increased 8.4%. 2015 expected to increase 11%.
– 2014 added 78,000 new units to total 1,003,000.
– 2015 expect 110,000 new units to total 1,113,000.
› 2016 predicted increase of 12%.
– 2016 forecast is for 135,000 new units to total 1,248,000.
Since 1992, there is no other year in which the number of new units started in the year exceeded 170,000 units. In the 1970s and early 1980s, when total housing units started were near two million units per year, we see growth years of 400,000 to 600,000 new units from year to year. After 1984, only three times have new starts reached over 170,000 units in a year, 2012 being one of those years.
All Construction Spending Rate of Growth 2013-2015
500550600650700750800850900950
10001050110011501200
J 201
1 M M J S N
J 201
2 M M J S N
J 201
3 M M J S N
J 201
4 M M J S N
J 201
5 M M J S
Monthly SAAR
3Mo Move Avg SAAR
Linear (Monthly SAAR)
Housing Starts Monthly and 3-month Moving Avg (000's) SAAR
Construction Economics 2016 Edition 37 GILBANE BUILDING COMPANY
Gilbane’s midyear estimate of new housing starts in 2015 (based on starts in place, volume of permits and steady growth until year end) was an increase of 130,000 new units above 2014, for a total of 1,133,000. It now appears the year will end closer to 110,000 new units at a total new housing starts of 1,113,000 units. For 2016, Gilbane’s early estimate of new housing starts is an increase of 135,000 new units for a total of 1,248,000. Several other industry experts posted 2016 estimates ranging from 1.2 million to 1.3 million with the average at 1,254,000.
Monthly starts periodically peak and dip erratically. Consider February 2015, the biggest dip in five years. But then notice that it took less than four months for starts to come right back to the trend line and the trend remained intact. This is how the monthly housing starts data goes. So don’t be too alarmed when one month of data doesn’t measure up to expectations. It appears that the trend for the last several years is well established and growth is currently following the trend, whether up or down in a given month.
Construction Economics 2016 Edition 38 GILBANE BUILDING COMPANY
Gilbane Building Company39
Public / Private Spending
Public/Private Spending
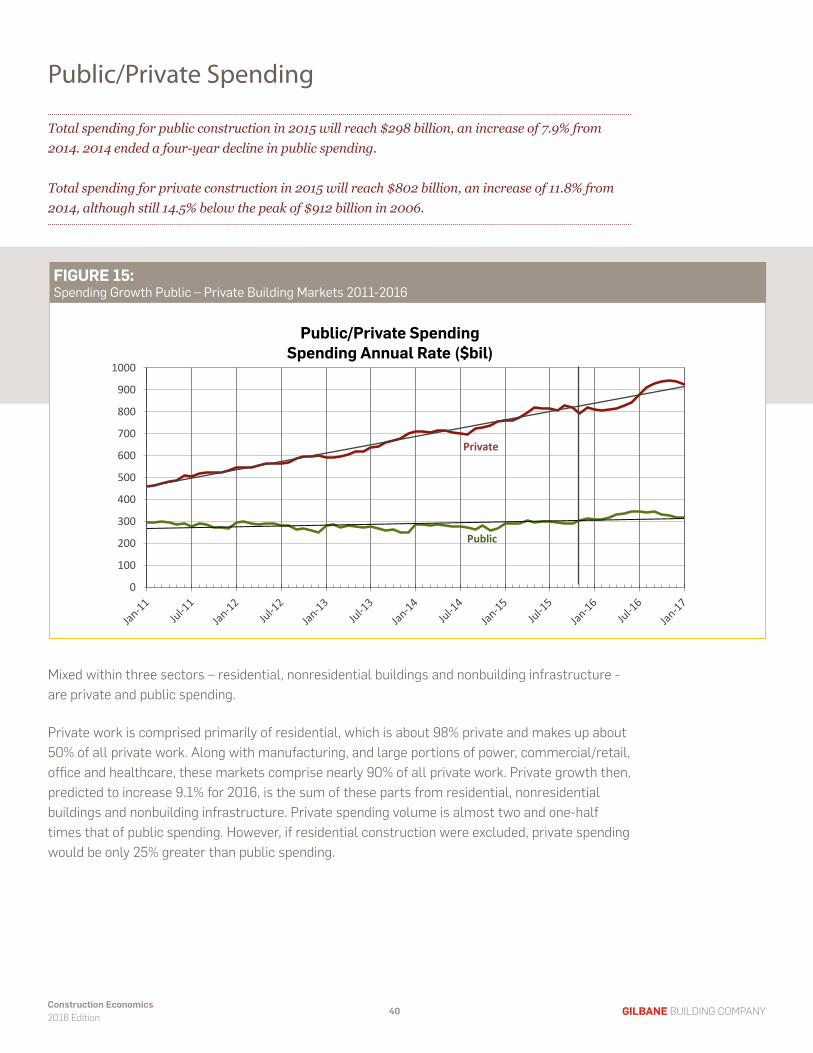
Total spending for public construction in 2015 will reach $298 billion, an increase of 7.9% from 2014. 2014 ended a four-year decline in public spending. Total spending for private construction in 2015 will reach $802 billion, an increase of 11.8% from 2014, although still 14.5% below the peak of $912 billion in 2006.
Mixed within three sectors – residential, nonresidential buildings and nonbuilding infrastructure - are private and public spending.
Private work is comprised primarily of residential, which is about 98% private and makes up about 50% of all private work. Along with manufacturing, and large portions of power, commercial/retail, office and healthcare, these markets comprise nearly 90% of all private work. Private growth then, predicted to increase 9.1% for 2016, is the sum of these parts from residential, nonresidential buildings and nonbuilding infrastructure. Private spending volume is almost two and one-half times that of public spending. However, if residential construction were excluded, private spending would be only 25% greater than public spending.
All Construction Spending Rate of Growth 2013-2015 FIGURE 15:Spending Growth Public – Private Building Markets 2011-2016
PRIVATE % OF TOTAL 74.8% 71.3% 65.3% 62.4% 63.7% 67.2% 70.1% 72.2% 72.9% 72.5%
PUBLIC % OF TOTAL 25.2% 28.7% 34.7% 37.6% 36.3% 32.8% 29.9% 27.8% 27.1% 27.5%
Source $ Data: U.S. Census Bureau, Department of Commerce. Public is 55% Nonbuilding Infrastructure 25% Educational Actual Spending data includes 2013 and 2014 revisions 7-1-15 and 2005-2015 revisions 1-4-16 Forecast Gilbane Building Company includes U.S. Census November year-to-date spending
Private spending in 2015 is being driven up by manufacturing, which represents 50% of the gains in year-to-date private spending.
Public work is all or a large portion of highway/street, educational, transportation and sewage/waste. The largest public construction markets are highway and education. These two markets alone represent more than half of all public construction. Along with small contributions from water and a portion of power, these markets comprise 80% of all public work. Again, the sum of parts shows growth at 11.3% in 2016.
Construction Economics 2016 Edition 41 GILBANE BUILDING COMPANY
All Construction Spending Rate of Growth 2013-2015 TABLE 12:ALL Construction Spending 2007-2016
U.S. Total Construction Spending Summary
TOTALS IN BILLIONS CURRENT U.S. DOLLARS
GILBANE GILBANE FORECAST FORECAST
2007 2008 2009 2010 2011 2012 2013 2014 2015 2016
NONRESIDENTIAL BLDGS 403.9 438.6 377.5 291.9 284.3 300.7 303.2 330.0 386.4 439.2 % GROWTH VS. PRIOR YEAR
Source $ Data: U.S. Census Bureau, Department of Commerce. See Nonbuilding Infrastructure section for list of markets in Nonbuilding Hvy Engr Actual Spending data includes 2013 and 2014 revisions 7-1-15 and 2005-2015 revisions 1-4-16 % is percent growth vs. prior year, except Share %, then it's percent Share of Total Forecast Gilbane Building Company includes U.S. Census November year-to-date spending
Construction Economics 2016 Edition 42 GILBANE BUILDING COMPANY
Gilbane Building Company43
Inflation Adjusted Volume
Inflation Adjusted Volume
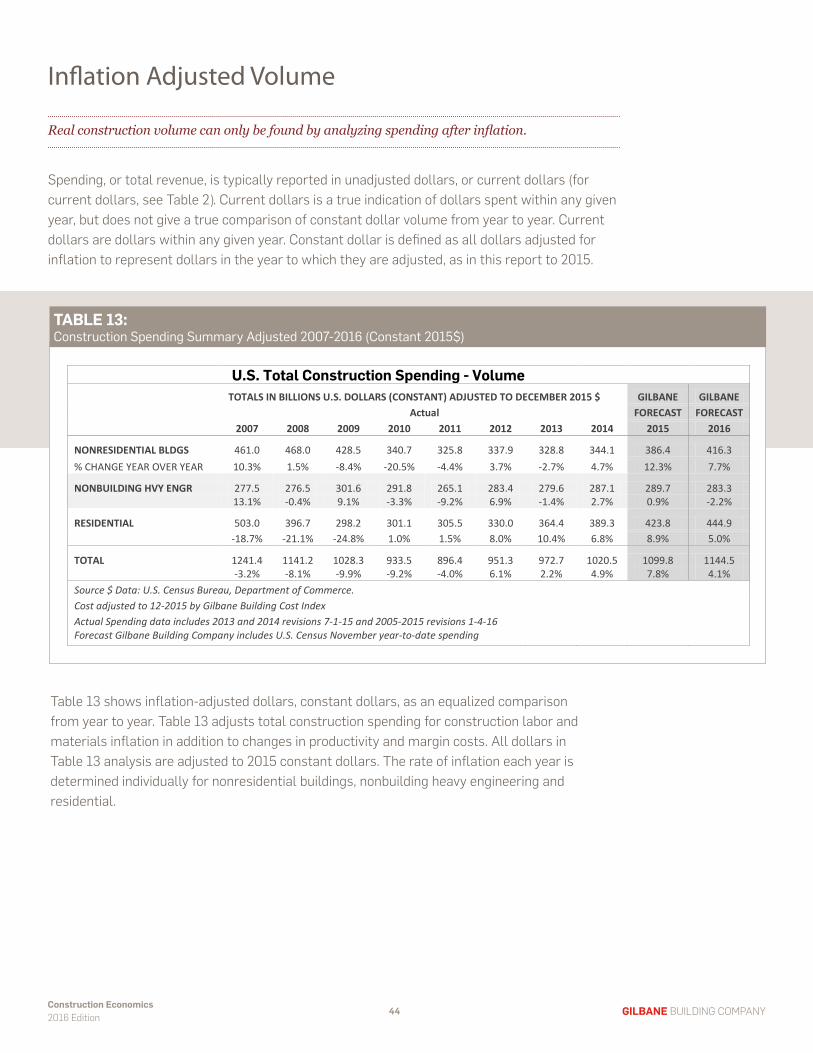
Real construction volume can only be found by analyzing spending after inflation.
Spending, or total revenue, is typically reported in unadjusted dollars, or current dollars (for current dollars, see Table 2). Current dollars is a true indication of dollars spent within any given year, but does not give a true comparison of constant dollar volume from year to year. Current dollars are dollars within any given year. Constant dollar is defined as all dollars adjusted for inflation to represent dollars in the year to which they are adjusted, as in this report to 2015.
All Construction Spending Rate of Growth 2013-2015 TABLE 13:Construction Spending Summary Adjusted 2007-2016 (Constant 2015$)
U.S. Total Construction Spending - Volume
TOTALS IN BILLIONS U.S. DOLLARS (CONSTANT) ADJUSTED TO DECEMBER 2015 $ GILBANE GILBANE Actual FORECAST FORECAST
2007 2008 2009 2010 2011 2012 2013 2014 2015 2016
NONRESIDENTIAL BLDGS 461.0 468.0 428.5 340.7 325.8 337.9 328.8 344.1 386.4 416.3 % CHANGE YEAR OVER YEAR 10.3% 1.5% -8.4% -20.5% -4.4% 3.7% -2.7% 4.7% 12.3% 7.7%
TOTAL 1241.4 1141.2 1028.3 933.5 896.4 951.3 972.7 1020.5 1099.8 1144.5 -3.2% -8.1% -9.9% -9.2% -4.0% 6.1% 2.2% 4.9% 7.8% 4.1% Source $ Data: U.S. Census Bureau, Department of Commerce. Cost adjusted to 12-2015 by Gilbane Building Cost Index Actual Spending data includes 2013 and 2014 revisions 7-1-15 and 2005-2015 revisions 1-4-16 Forecast Gilbane Building Company includes U.S. Census November year-to-date spending
Table 13 shows inflation-adjusted dollars, constant dollars, as an equalized comparison from year to year. Table 13 adjusts total construction spending for construction labor and materials inflation in addition to changes in productivity and margin costs. All dollars in Table 13 analysis are adjusted to 2015 constant dollars. The rate of inflation each year is determined individually for nonresidential buildings, nonbuilding heavy engineering and residential.
Construction Economics 2016 Edition 44 GILBANE BUILDING COMPANY
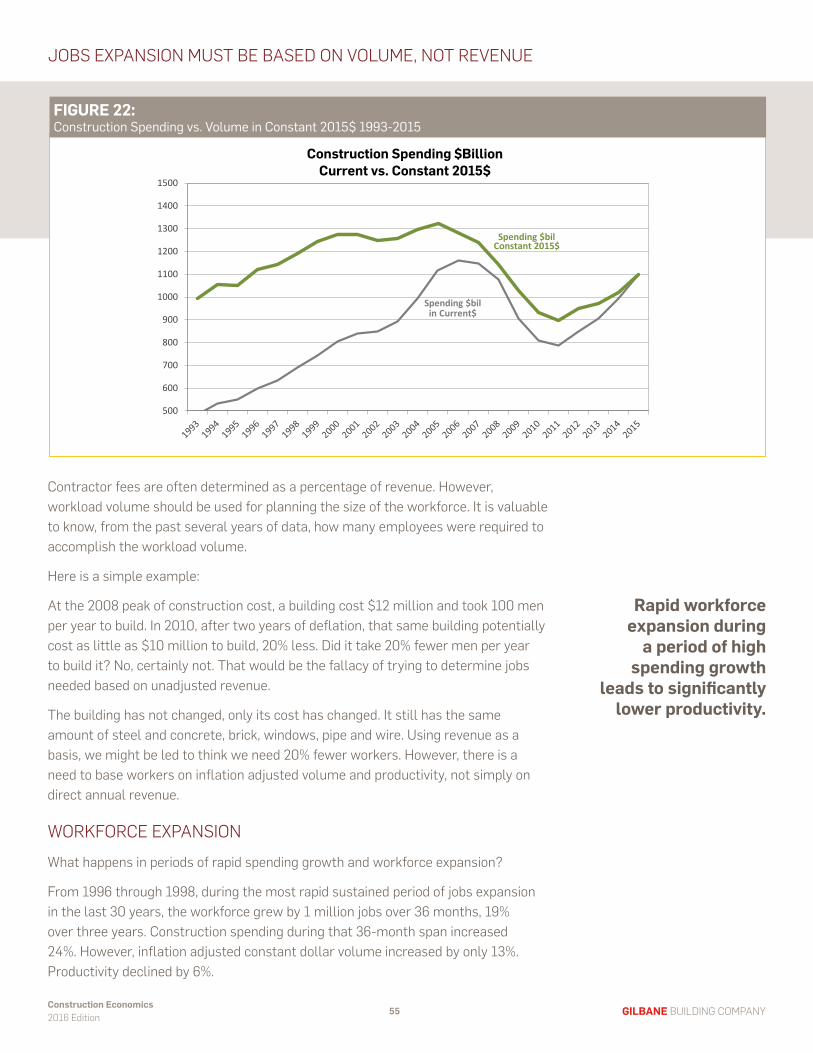
All Construction Spending Rate of Growth 2013-2015 FIGURE 16:Construction Spending vs. Volume 1993-2015 (constant 2015$)
Spending $bil in Current$
Spending $bil Constant 2015$
500
600
700
800
900
1000
1100
1200
1300
1400
1500
Construction Spending $Billion Current vs Constant 2015$
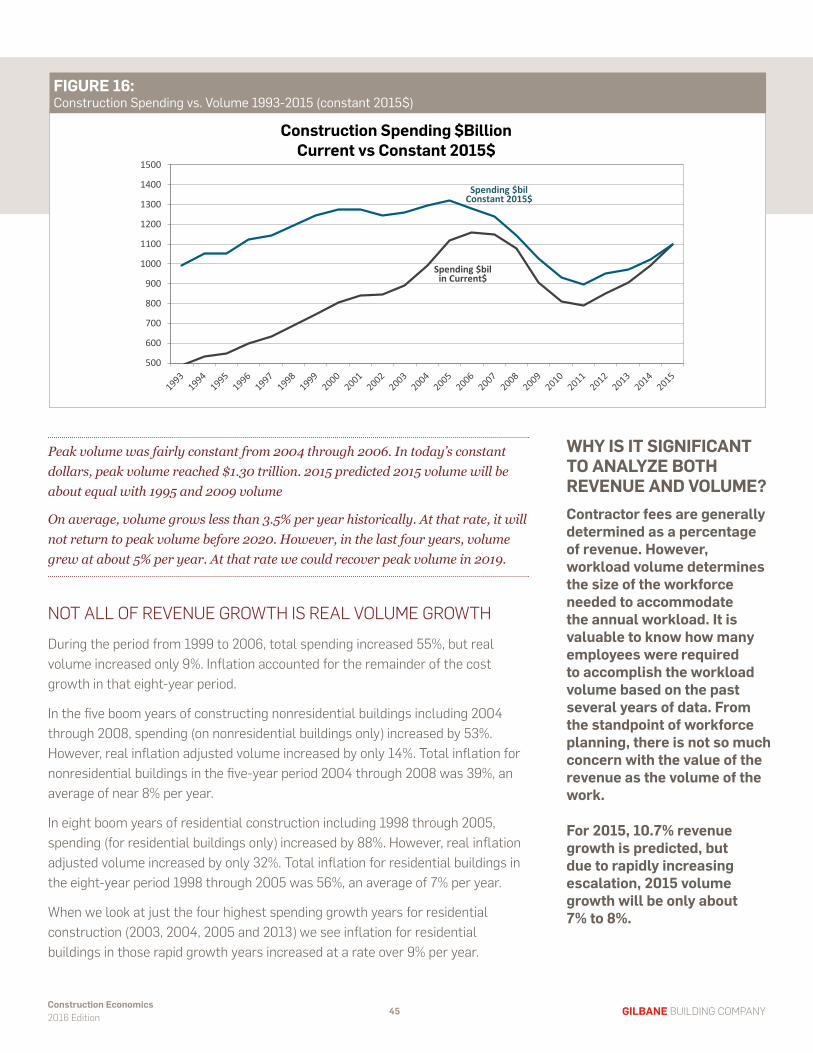
Peak volume was fairly constant from 2004 through 2006. In today’s constant dollars, peak volume reached $1.30 trillion. 2015 predicted 2015 volume will be about equal with 1995 and 2009 volume On average, volume grows less than 3.5% per year historically. At that rate, it will not return to peak volume before 2020. However, in the last four years, volume grew at about 5% per year. At that rate we could recover peak volume in 2019.
NOT ALL OF REVENUE GROWTH IS REAL VOLUME GROWTHDuring the period from 1999 to 2006, total spending increased 55%, but real volume increased only 9%. Inflation accounted for the remainder of the cost growth in that eight-year period.
In the five boom years of constructing nonresidential buildings including 2004 through 2008, spending (on nonresidential buildings only) increased by 53%. However, real inflation adjusted volume increased by only 14%. Total inflation for nonresidential buildings in the five-year period 2004 through 2008 was 39%, an average of near 8% per year.
In eight boom years of residential construction including 1998 through 2005, spending (for residential buildings only) increased by 88%. However, real inflation adjusted volume increased by only 32%. Total inflation for residential buildings in the eight-year period 1998 through 2005 was 56%, an average of 7% per year.
When we look at just the four highest spending growth years for residential construction (2003, 2004, 2005 and 2013) we see inflation for residential buildings in those rapid growth years increased at a rate over 9% per year.
WHY IS IT SIGNIFICANT TO ANALYZE BOTH REVENUE AND VOLUME?Contractor fees are generally determined as a percentage of revenue. However, workload volume determines the size of the workforce needed to accommodate the annual workload. It is valuable to know how many employees were required to accomplish the workload volume based on the past several years of data. From the standpoint of workforce planning, there is not so much concern with the value of the revenue as the volume of the work.
For 2015, 10.7% revenue growth is predicted, but due to rapidly increasing escalation, 2015 volume growth will be only about 7% to 8%.
Construction Economics 2016 Edition 45 GILBANE BUILDING COMPANY
All Construction Spending Rate of Growth 2013-2015 FIGURE 17:Construction Spending by Sector 2005-2016 (constant 2015$)
Construction Spending by Sector ($bil) Adjusted to December 2015 $ = Volume
INFLATION IS SIGNIFICANTLY AFFECTED BY RAPID GROWTH? › Construction inflation in rapid growth years is much higher than average long-term inflation. › Long-term 20-year inflation for nonresidential buildings is 3.3% › Long-term 20-year inflation for residential buildings is 3.5%. › In rapid growth years, inflation for nonresidential buildings is 8%. › In rapid growth years, inflation for residential buildings is above 9%.
Construction Economics 2016 Edition 46 GILBANE BUILDING COMPANY
Gilbane Building Company47
Jobs and Unemployment
Jobs and UnemploymentThe number of jobs is tracked as the measure of how many people are currently working to put in place the construction spending. The unemployment rate shows how many more people are available to go to work. Both added together shows the size of the workforce. The size of the workforce is important because it tells how many workers are available to draw from for future volume growth.
Table 9 includes both residential and nonresidential construction employment, as well as all trades and management personnel. The BLS suggests not using any single month but instead looking at long-term trends in the data.
2014 had near-record growth of 338,000 jobs, exceeded only by 1998 and 2005, both during the fastest spending growth periods within the past 30 years. In 2015 263,000 jobs were added. Since the bottom between Q4 2010 to Q1 2011, more than 1 million jobs have been added for total jobs growth of 18%.
All Construction Spending Rate of Growth 2013-2015 TABLE 14:Construction - All Employees 2004-2015
Industry: Construction Data Type: ALL EMPLOYEES, THOUSANDS
The unemployment rate in construction averaged 6.0% for the last six months. For December it is 7.5%. This is not an unusual jump in unemployment, since it is not seasonally adjusted. It is typical for December through March to reach unemployment 4% to 5% higher than June through October. Comparisons can be made to the same months in previous years. This is the lowest December unemployment since 2006. Average unemployment for the last six months, 6.2%, is at an eight-year low.
Construction Economics 2016 Edition 48 GILBANE BUILDING COMPANY
The historical long-term average seasonally adjusted unemployment rate is between 6% and 8%. This means, regardless whether markets are very active or slow, there is historically at least 6% of the construction workforce not working. Average unemployment for the last 12 months is 7.3%.
The reduction in available workers in the workforce will continue to have a detrimental effect on cost and schedule. Without a large volume of available and trained workers in the unemployment pool to draw from, the rate of expansion may be constrained.
The total construction workforce hit a 15-year low in 2013 at about 6.4 million. Currently the workforce is growing and is near 7.3 million, still near a 15-year low, about 1.0 million (~17%) lower than the 2006-2007 peak.
The unemployment rate is not seasonally adjusted. This adds to the short-term fluctuation. The seasonal fluctuation can be seen in Figure 18 where the upper (blue) line shows a repeated annual rise and fall in the unemployment rate. This analysis counts the available workforce or the nonworking pool using the statistical trend line of the unemployment rate.
All Construction Spending Rate of Growth 2013-2015 FIGURE 18:Construction Jobs vs. Construction Workforce 2005-2015
Total Workforce
Total Employed 5000
5500
6000
6500
7000
7500
8000
8500
Construction Economics 2016 Edition 49 GILBANE BUILDING COMPANY
WORKFORCE SHORTAGES
Some of the workers that were let go, moved on, or dropped out of the workforce had many years of experience and were highly trained. Unfortunately, some will never return. As a result, over the next few years the construction industry is going to be faced with a shortage of skilled, experienced workers. This will have the tendency to DRIVE COSTS UP and QUALITY DOWN due to the need to pay a premium for skilled workers and the necessity of training new workers in their job and company procedures.
› During periods of high volume and workforce expansion, productivity declines.
› Workforce shortages may force extended work schedules.
The BLS Job Openings and Labor Turnover Survey (JOLTS) for the construction industry for October is at 139,000 unfilled positions. Although down slightly this month and down from the summer peak, the openings rate has been trending upward since 2012. A relatively high rate of openings, this generally indicates high demand for labor and could lead to higher wage rates.
The job openings rate has been elevated since January 2013. The last time it stayed this high was 2007, leading into the peak of the previous expansion. A big difference this time around is that we have 1.5 million (or 20%) fewer workers in the workforce. This is a good sign for future hiring, but highlights the importance of workers having the right skills. An increase in job openings generally signifies that employers cannot find people with the right skills to fill open positions.
A recent NAHB survey indicates labor shortages have become more widespread than reported in 2014. According to a June 2015 survey by the NAHB, 61% of homebuilders during the previous 12 months had raised home prices due to labor shortages across construction trades.
In a recent ENR survey, executives from design firms, general contractors, subcontractors and construction managers were asked about their hiring and compensation plans for 2016. Of the 253 executives responding to the survey, 223 provided estimates of planned raises for their employees in 2016. The average planned increase was 4.63%.
The most common effects of skilled labor shortages have been the need to pay higher wages and difficulty completing projects on time.
Over the next five years, expect shortages of skilled workers, declining productivity, and rapidly increasing labor cost. If you are in a location where a large volume of pent-up work starts all at once, you will experience these three issues.
A last note on jobs: although there are surveys to support widespread agreement at firms indicating most everyone is experiencing labor shortages and having a difficult time hiring qualified people, the three-year period 2013 to 2015 ended with just over 800,000 new construction jobs added, a three-year total exceeded only once before since 2000. However, what might support the workforce shortage issue is during that same period hours worked increased. All employees are working longer hours having the same effect as adding additional jobs helping offset the shortage of qualified workers.
The most common effects of skilled
labor shortages have been the need to pay
higher wages and difficulty completing
projects on time.
Construction Economics 2016 Edition 50 GILBANE BUILDING COMPANY
Gilbane Building Company51
Jobs/Productivity
Jobs/Productivity Productivity is a measure of unit volume per worker output, not dollars put-in-place per worker. To analyze productivity:
› Use annual inflation adjusted constant volume, not annual unadjusted current spending.
› Use total work output, which takes into account total employed multiplied by hours worked.
All Construction Spending Rate of Growth 2013-2015 FIGURE 19:Construction Jobs vs. Total Workforce Hours Worked 2008-2015
Total Work Output
5000
6000
7000
8000
9000
10000
11000
12000
13000
14000
15000
total hours worked 12000 = 12 billion
total employed 6000 = 6 million
Construction Jobs vs. Total Hours Worked
Often overlooked in the jobs data is the number of hours worked. In the last five years, the average hours worked has increased from 37.75 to 39.1 hours per week. That has the same effect as adding another 230,000 jobs.
The following productivity analysis is based on put-in-place revenues, inflation adjusted to constant 2015 dollars, and compared to actual manpower at average hours worked.
Figure 20 that follows shows a line plotted for the number of jobs per $1 billion spending unadjusted. That is a result obtained by using unadjusted spending current dollars without considering inflation and jobs without consideration of hours worked. The unadjusted analysis should not be used to track changes in productivity.
Construction Economics 2016 Edition 52 GILBANE BUILDING COMPANY
Figure 20 shows a line plotting the number of jobs per $billion in current 2015 dollars adjusted for inflation using jobs adjusted for hours worked. Use this line to track changes in productivity.
To explain how significant these differences might be, consider this example. Total construction spending reached a bottom in January 2011. For the four-year period from January 2011 to the end of 2014:
› Total construction spending (revenue) grew 23%;
› Composite total construction inflation was 12%;
› Real construction volume grew by only 11%;
› Jobs grew 840,000 from the low of 5,432,000, or 15.5%;
› Hours worked increased from 37.5 per week to a four-year average of 38.7, a 3.2% increase.
An unadjusted analysis would compare total construction spending growth of 23% to 15.5% jobs growth. That would indicate more spending got added than jobs, which would show an increase in productivity of 7.5%. But that is not correct.
The adjusted analysis shows that after 12% inflation is factored out, there was only an 11% increase in real construction volume. That volume should be compared to the work output (jobs plus hours on entire workforce) which is an increase of slightly more than 18.7%. In the correct analysis we see over the four-year period, we put in place 11% additional volume of work, but added almost 19% additional work output during the same period. Real productivity declined by 8% in four years.
All Construction Spending Rate of Growth 2013-2015 FIGURE 20:Jobs per $billion 2006-2015 in constant 2015$ All Construction
Unadjusted #jobs per$bil in current $
Adjusted #jobs per $bil in constant 2015 $
5,000
5,500
6,000
6,500
7,000
7,500Jobs/$bil increasing means Productivity declining
Construction Economics 2016 Edition 53 GILBANE BUILDING COMPANY
Figure 21 below plots the exact same type of unadjusted and adjusted data as Figure 20, but represents only nonresidential buildings.
All Construction Spending Rate of Growth 2013-2015 FIGURE 21:Jobs per $billion 2006-2015 in constant 2015$ Nonresidential Buildings Only
Unadjusted #jobs per$bil in current $ Adjusted
#jobs per $bil in constant 2015 $
6,000
6,500
7,000
7,500
8,000
8,500
9,000
9,500
10,000# of Jobs to put-in-place $1 billion spending
Jobs per $Billion of Spending Adjusted to Constant 2015$ Nonresidential Buildings ONLY
Jobs/$bil increasing means Productivity declining
All data in the previous charts show national averages. On average, $1 billion of spending supports approximately 6,000 construction jobs. In a location where the city cost index is 1.2, it would take $1.2 billion in spending to support 6,000 jobs and in a location where the city cost index is 0.85, only $850 million in spending would support 6,000 jobs.
When spending and jobs are on the decline, and with diminished workload providing no other options, workers and management find ways to improve out of necessity. But at some point, longer hours and additional work burden causes productivity to decline. Also, a return to volume growth results in an easing of performance.
As workload begins to increase in coming years, net productivity gains will decline somewhat. This net effect cannot go unaddressed. The results of productivity declines are either decreased total output (if workforce remains constant) or increased workforce needed (if total workload remains constant).
6,000jobs
$1 billionspending supports
(on average)
Construction Economics 2016 Edition 54 GILBANE BUILDING COMPANY
JOBS EXPANSION MUST BE BASED ON VOLUME, NOT REVENUE
All Construction Spending Rate of Growth 2013-2015
Spending $bil in Current$
Spending $bil Constant 2015$
500
600
700
800
900
1000
1100
1200
1300
1400
1500
Construction Spending $Billion Current vs. Constant 2015$
Contractor fees are often determined as a percentage of revenue. However, workload volume should be used for planning the size of the workforce. It is valuable to know, from the past several years of data, how many employees were required to accomplish the workload volume.
Here is a simple example:
At the 2008 peak of construction cost, a building cost $12 million and took 100 men per year to build. In 2010, after two years of deflation, that same building potentially cost as little as $10 million to build, 20% less. Did it take 20% fewer men per year to build it? No, certainly not. That would be the fallacy of trying to determine jobs needed based on unadjusted revenue.
The building has not changed, only its cost has changed. It still has the same amount of steel and concrete, brick, windows, pipe and wire. Using revenue as a basis, we might be led to think we need 20% fewer workers. However, there is a need to base workers on inflation adjusted volume and productivity, not simply on direct annual revenue.
WORKFORCE EXPANSIONWhat happens in periods of rapid spending growth and workforce expansion?
From 1996 through 1998, during the most rapid sustained period of jobs expansion in the last 30 years, the workforce grew by 1 million jobs over 36 months, 19% over three years. Construction spending during that 36-month span increased 24%. However, inflation adjusted constant dollar volume increased by only 13%. Productivity declined by 6%.
Rapid workforce expansion during
a period of high spending growth
leads to significantly lower productivity.
FIGURE 22:Construction Spending vs. Volume in Constant 2015$ 1993-2015
Construction Economics 2016 Edition 55 GILBANE BUILDING COMPANY
From 2004 through 2006, construction spending increased by 28%, the most rapid pace on record. The workforce added 860,000 jobs, an increase of 15%. But inflation during that three-year period was 25%, the highest ever recorded. Real inflation adjusted volume increased by only 3%. Productivity declined by 12%, the most ever.
These spans were both periods when construction volume was rapidly expanding and approaching or at the all-time peak. Such a rapid workforce expansion during high spending growth led to measurably significant lost productivity. We are currently in a similar period.
From 2012 through 2014, the most current completed period, construction spending grew 21%, approaching the levels in the examples above. Inflation was 11%, so volume increased only 10%. Work output increased by 13%.
In this current growth cycle, we are currently at a productivity loss of 3%. With 2015 predicted spending near 11%, the current four-year period will be almost identical to 2003-2006 (33%) and 1996-1999 (32%), the two fastest growth periods on record with two of the highest rates inflation and productivity loss. 2015 may be similar to these previous periods.
If we continue to experience uninterrupted economic expansion at a rapid level, even for just the next few years, it will produce an extremely active extended duration market unlike anything ever measured. The workforce will expand, but there will be skilled worker shortages, and productivity will decline. When that occurs, it leads to rapidly increasing prices.
HOW MANY JOBS GET CREATED BY CONSTRUCTION?
Here are some details regarding how many jobs get created for every dollar spent on construction. For further reference, see “Jobs and Unemployment”.
› Historical averages (adjusted for inflation) since year 2000 show the number of direct construction jobs supported by $1 billion in construction spending varies +/- from 6,000 jobs. That calculates to one job for every $170,000 (in 2015 dollars) spent on construction, or approximately six jobs per $1 million spent. Direct construction jobs include all Architecture/Engineering/Construction (AEC), but not, for instance, lumber or steel mill product manufacturing.
› In part, the wide variation in the number of jobs created is a result of productivity. In times of increasing work volume activity, productivity declines. In times of decreasing activity, productivity climbs. In 2009, construction activity declined drastically, but jobs declined even more, resulting in an 8% average increase of productivity. Because productivity increased, it took fewer workers to put in place the same volume of work. The net result is that $1 billion in spending supported far less jobs than previous years.
spent on
HISTORICAL AVERAGE
= $170,000Job 2015 dollars
1
construction
Construction Economics 2016 Edition 56 GILBANE BUILDING COMPANY
› As work volume starts to increase over the next few years, expect productivity to decline. There are many reasons why this will occur, among them: working longer hours until new workers are brought on; working more days; crowding the work area; hiring less qualified workers; and acclimating new workers to the crew.
There are several studies available, including one by the federal government and one by the Associated General Contractors of America (AGC), that state for every construction job, there are three additional jobs created in the economy. So while $1 billion of building construction may create 6,000 to 7000 direct construction jobs, overall it generates approximately as many as 28,000 jobs in the economy.
The data shown previously in this section on jobs, unemployment and productivity includes only jobs counted in the official U.S. Census Bureau of Labor Statistics (BLS) jobs report. There are two reports, one by Pew Research Center and one by National Association of Home Builders, that both document a large, unaccounted for shadow workforce in construction. By some accounts, 40% or more of the construction workforces in California and Texas are immigrant workers. Immigrants may comprise between 14% and 22% of the total construction workforce. It is not clear how many within that total may be included or not included in the U.S. Census BLS jobs report. However, the totals are significant enough that they may alter some of the results reported above. There is currently a level of uncertainty in this data.
Construction Economics 2016 Edition 57 GILBANE BUILDING COMPANY
Gilbane Building Company58
Behind The Headlines
Behind the Headlines
CONSTRUCTION SPENDING – IS A MONTHLY DECLINE AN INDICATION OF WEAKNESS?
Here’s the headline – U.S. construction spending fell in November for the first time in 17 months, reflecting weakness in spending…
Almost all news releases concerning construction spending repeat the numbers published in the U.S. Census construction spending report. That headline is referring to month to month comparisons and states this is the first time in 17 months this measure has gone down. That comparison is being made using U.S. Census seasonally adjusted annual rates for spending.
The Gilbane report uses historical statistical averages for monthly spending, a different mathematical form of seasonally adjusting rates. The historical averages for each month give an indication of how much should be spent in any given month compared to every other month in the year. For instance, about 6% of annual spending occurs in January or February. About 10% of annual spending occurs in August or September. Therefore, January divided by 6% and August divided by 10% result in the same answer for a seasonally adjusted annual rate of spending.
When referring to the historical averages of expected spending rates, monthly construction has fallen eight times in the last 17 months, so this monthly decline is not unusual. Gilbane’s data analysis predicted a slight decline in October and November, so in this report’s analysis the decline was not unexpected, nor is it alarming.
Spending advances and declines are almost completely predetermined by the amounts of activity generated from the cash flow of all starts recorded in the previous two or three years. If two months of project starts that began three years ago come to an end this month, and these are offset only by one current month of new starts, we will see a decline this month in spending. This is a normal fluctuation in the amount of work starting, ongoing and completing. Spending patterns are affected mostly by the pattern of starts recorded over the previous 12 to 36 months.
Expect two more monthly declines in the next few months. In news articles, it may be attributed to winter weather or a drop in demand for new capital investment causing a slowdown, when in fact each of the three major sectors has some project completions dropping out of the monthly cash flows that will result in month to month declines.
Construction Economics 2016 Edition 59 GILBANE BUILDING COMPANY
CONSTRUCTION SPENDING OR CONSTRUCTION STARTS – MEDIA HEADLINES THAT GET IT CONFUSED
Here’s a headline published recently. “Construction spending rose year-over-year during first 9 months of 2015.”
What they really meant to say; “Construction STARTS rose year-over-year during first 9 months of 2015.”
What’s the big difference between these two statements? Well, here’s an example:The brief states “nonbuilding work climbed 35%” during the first nine months of 2015 compared to same months 2014. That is TRUE, if we are looking at new construction STARTS, but construction spending for nonbuilding work is down 2.5% during the first eight months of 2015 vs. 2014.
Construction starts help us understand where future spending is headed. Construction spending is based on how much is occurring this month from all the projects that started in the previous 12 to 36 months.
Current spending is based on the last one to three years of starts. New starts will generate the next one to three years of spending. Monthly increases or decreases in new starts is not telling us how much spending is going on right now, it gives us the data to determine how much spending to expect in the future. The only way to get the real picture of what to expect in the future is to look at the cumulative cash flows that occur in any given future month from all the previous starts that are still ongoing.
Furthermore, the construction starts values that are published every month represent a sampling of new construction activity, approximately 50% to 60% of total construction activity. While the total reported construction starts for a year might be $500 to $600 billion, the total spending in that year will be more like $1.0 to $1.1 trillion.
So, while a headline can certainly state correctly “Construction STARTS rose year-over-year during first 9 months of 2015”, that doesn’t tell us much about current spending.
Construction Economics 2016 Edition 60 GILBANE BUILDING COMPANY
Gilbane Building Company61
Some Signs Ahead
Some Signs AheadThe following reports can be accessed by clicking on the hyperlinks provided.
American Institute of Architects (AIA) Architectural Billings Index (ABI) measures monthly design work on the boards in architectural firms. It is a nine- to 12-month leading indicator to new construction starts. Index values above 50 show increasing billing revenues, and below 50 indicates declining revenues. The ABI Institutional Index posted strong movement from May to July 2015. This should lead to strength in new institutional starts in early 2016. The Commercial Index dipped into negative territory three times in 2015, a sign of weakening from the strength in the previous two years. Typically, institutional facilities are the last nonresidential building sector to recover from a downturn.
Associated Builders and Contractors (ABC) Spending Forecast predicts continued growth for the construction industry in 2016. ABC predicts nonresidential construction will increase 7.4% in 2016.
ABC Construction Backlog Indicator (CBI) third quarter 2015 report released December 16, 2015 is a quarterly forward-looking economic indicator reflecting the amount of work that will be performed by commercial and industrial contractors in the months ahead. The CBI is measured in months of backlog and reflects the amount of construction work under contract, but not yet completed.
ABC Charts and Graphs for Q3 2015 show strong advances peaking in Q3 2014. Indices are at post-recession highs. The current national index is at 8.5 months of backlog. The index was created in Q1 2009, so there is no comparison to pre-recession workload.
Associated General Contractors (AGC) in conjunction with Sage released a study in January. “The 2016 Construction Hiring and Business Outlook” survey conducted in November – December 2015 includes responses from more than 1500 firms. 71% of firms plan to add employees in 2016. 70% of firms report they are having a hard time finding qualified workers, including salaried and craft professionals.
AIA Consensus Second Half 2015 Construction Forecast is a semi-annual survey of construction economists’ projections for future spending. Posted on the AIA economics page, the Second Half 2015 report of expectations for nonresidential construction shows predicted growth has been revised upward to 8.9% for 2015. It remains at 8.2% for 2016. All commercial sectors and the industrial (manufacturing) sector show expectations for double digit growth in 2015. The AIA consensus of spending growth for manufacturing buildings is 22% for 2015. Gilbane data predicts 45% growth in 2015 spending for manufacturing buildings. The AIA semi-annual Consensus report, forecasts of 2016 nonresidential buildings only, will be released in January.
Bloomberg News published this article in December 2015 that states “Labor shortages in the construction industry as a whole actually have a much greater impact on home prices than interest rates. According to a June survey by the NAHB, 61% of homebuilders during the previous 12 months had raised home prices due to labor shortages across construction trades.”
The ABI Institutional Index, up 17 consecutive months, hit 59 in June, highest in a decade.
Construction Economics 2016 Edition 62 GILBANE BUILDING COMPANY
CMD Construction Data Spending Forecast, in its December report, is currently predicting 10% spending growth in 2015 and 8.6% growth in 2016. CMD predicts residential construction will increase 11.5% in 2015 and 10.5% in 2016. CMD predicts infrastructure heavy engineering projects will drop 0.8% in 2015 but grow 3.5% in 2016. This CMD update was released prior to the U.S. Census revisions to residential spending.
CMD Construction Data New Construction Starts, released November 2, 2015, is predicting starts will increase 6.8% in 2015 and 8.4% in 2016 with strongest increases in residential and commercial construction.
Dodge Momentum Index (DMI) is a monthly measure of nonresidential projects in planning, excluding manufacturing and infrastructure. It gives an indication of projects that may soon begin the design phase. It is a leading indicator of specific nonresidential construction spending by approximately 12 to 15 months. In recent months the commercial index has been declining while the institutional index has been climbing.
Engineering News-Record (ENR) 2015 Fourth Quarterly Cost Report shows general purpose cost indices up on average about 2% year-over-year. However, selling price building indices for nonresidential buildings are up on average 6%. The difference between these indices is increased margins.
ENR Fourth Quarter Construction Industry Confidence Index Survey asked executives from design firms, general contractors, subcontractors and construction managers about their hiring and compensation plans for 2016. Of the 253 executives responding to the survey, 223 provided estimates of planned raises for their employees in 2016. The average planned increase was 4.63%.
FMI Fourth Quarter 2015 Nonresidential Construction Index (NRCI) is now 59.5, the lowest since Q4 2013. The NCRI is a report based on a survey of opinions submitted by nonresidential construction executives. The NCRI declined in Q3 and Q4 2014 from a very strong Q2 2014. It has since fallen to levels below all of 2014, primarily driven by a declining outlook for the overall economy.
FMI Construction Outlook Third Quarter 2015 Report predicts residential construction will increase 9% in 2015. At the time of this report, released September 24, 2015, FMI predicted 6% spending growth in 2015 and 7% growth in 2016. The FMI Fourth Quarter Outlook report, updated forecast for 2015 and 2016, is usually released in January.
Institute for Supply Management (ISM) Non-Manufacturing Index (NMI) Report for December 2015 is a better indicator of activity in the construction industry than the ISM manufacturing report. The NMI measures economic activity in 13 industries (including construction) not covered in the manufacturing sector. The December NMI is 55.3, well below the level of 60.3 in July but above 52 for 71 consecutive months, indicating continued economic growth.
Job Openings and Labor Turnover Survey JOLTS released in December for October, data shows the quits rate and the number of positions open that need to be filled. Values for construction have been elevated since January 2013.
Markstein Advisors Economic and Construction Outlook most closely agrees with the Gilbane forecast. Markstein predicts construction spending will increase 10.6% in 2015 and 9.9% in 2016.
Portland Cement Association, on December 15, 2015, released a report titled “What the FAST Act Means for Cement and Concrete.” According to PCA, “the five-year transportation bill recently signed into law will add an average of 835 thousand tons of cement each year from 2016 through 2020.”
Construction Economics 2016 Edition 63 GILBANE BUILDING COMPANY
Producer Price IndexThe U.S. Census Producer Price Index (PPI) data for November 2015 indicates the PPI for material inputs to all construction decreased 0.2% in the month and 1.8% over three months. The index baseline was recently revised so we have yet to gather a 12-month data point for comparison.
All Construction Spending Rate of Growth 2013-2015 TABLE 15:BLS PPI Materials November 2015
U.S. Construction Producer Price Indexes - November 2015 MATERIALS PERCENT CHANGE VERSUS ANNUAL FOR
PPI to November 2015 from 12
months 12
months 12
months Oct-15 Aug-15 Nov-14 2014 2013 2012
1 month 3
months 12
month last yr SUMMARY Inputs to ALL Construction -0.2 -1.8
All data not seasonally adjusted Source: Producer Price Index. Bureau of Labor Statistics
Producer Price Index (PPI) tracks cost to
produce construction materials – providing a strong indicator for
inflation trends.
Cement, insulation materials,
and ready-mix concrete
increased the most in price year over
year.
Diesel fuel, scrap steel, and
copper and brass shapes
decreased the most in price year over
year.
Construction Economics 2016 Edition 65 GILBANE BUILDING COMPANY
The relative impact of cost changes for several materials is a function of how much the material is used within a typical building.
For a typical nonresidential building, a 10% increase in the cost of these materials has this impact on the overall cost of the building:
The PPI for construction materials gives us an indication whether costs for material inputs are going up or down. The PPI tracks producers’ cost to supply finished products. This tells us if contractors are paying more or less for materials and generally indicates what to expect in the trend for inflation.
PPI TRENDS HELP TO INTERPRET THE DATA
› 60% of the time, the highest increase of the year in the PPI is in the first quarter.
› 90% of the time, the highest increase of the year is in the first six months.
› In 20 years, the highest increase for the year has never been in Q4.
› 60% of the time, the lowest increase of the year is in Q4.
› 50% of the time, Q4 is negative, yet in 22 years the PPI was negative only twice.
So when you see monthly news reports from the industry exclaiming, “PPI is up strong for Q1” or “PPI dropped in the 4th Qtr.” it helps to have an understanding that this may not be unusual at all and instead may be the norm.
Gypsum+.05-.08%
Copper+.20-.60%
Concrete+.20-.60%
Structural Steel
+.50-1.0%
Construction Economics 2016 Edition 66 GILBANE BUILDING COMPANY
Gilbane Building Company67
Material Price
Movement
Material Price MovementWhen the cost to the supplier goes up, it almost always gets immediately passed along in full to the consumer. When the cost to the supplier goes down, the savings trickle down to the consumer very slowly.
Cost for material inputs:
› to all construction decreased 0.9% last year and is on track to decrease even more in 2015.
› to nonresidential construction decreased 1.9% last year and will decrease again in 2015.
All Construction Spending Rate of Growth 2013-2015 TABLE 16:BLS PPI Markets 2012-2015
U.S. Construction Producer Price Indexes - November 2015 MARKETS PERCENT CHANGE VERSUS ANNUAL FOR
Inputs PPI to November 2015 from 12
months 12
months 12
months Oct-15 Aug-15 Nov-14 2014 2013 2012
1 month 3 months 12 month last yr Inputs to ALL Construction -0.2 -1.8 0.0 -0.9 1.3 1.4 Inputs to Nonresidential -0.2 -1.9 0.0 -1.9 0.9 0.9 Inputs to Commercial -0.2 -1.7 -0.3 0.9 1.2 Inputs to Industrial -0.3 -1.3
-1.5 0.8 0.8
Inputs to Hghwy/Hvy Engr -0.4 -2.6
-2.7 0.9 0.8 Inputs to Residential 0.0 -1.5 0.0 1.7 2.0 All data not seasonally adjusted Data Source: Producer Price Index. Bureau of Labor Statistics
6Cement
4Insulation
2 Lumber7
Steel Pipe & Tube15
Copper & Brass
16
Diesel Fuel
380
-10
-20
30
20
10
40
-30
-40
2011-2015 Material Cost Fluctuations(in percentages)
Gypsum
1Ready Mix
Concrete
4Precast
Concrete
2Fabricated Structural
Steel
1
Scrap Steel
53
-50
This extreme variability means individual trade assessments require individual material index data. Costs of gypsum, lumber and plywood, and insulation are driven primarily by residential markets. Structural steel products are driven more by nonresidential markets.
Construction Economics 2016 Edition 68 GILBANE BUILDING COMPANY
GYPSUM / LUMBER / INSULATION
Gypsum, lumber and insulation demand is primarily driven by residential construction.
All Construction Spending Rate of Growth 2013-2015 FIGURE 23:Materials PPI Index Gypsum Lumber Insulation 2006-2015
Insulation
Gypsum Products
all indexed to 1-1-06 = 100
Materials PPI
Lumber & Plywood
75
85
95
105
115
125
135
CEMENT / CONCRETE / ASPHALT / BRICK / BLOCK
Portland Cement Association (PCA) reports the volume of cement demand as an indicator of economic activity. It is a reliable coincident indicator. PCA reported an 8.9% rise in consumption in 2012, and consumption grew 4.5% in 2013. Consumption grew more than expected in 2014, up 8.7%. In 2015 consumption grew only 3.5%.
On December 15, 2015, PCA released a report titled “What the FAST Act Means for Cement and Concrete.” According to PCA, “the five-year transportation bill recently signed into law will add an average of 835 thousand tons of cement each year from 2016 through 2020.” That represents about a 1% increase in concrete demand.
Nearly two-thirds of U.S. cement consumption occurs in the six months between May and October. Rising consumption and prices leading into summer can lead to large shifts in demand and seasonal pricing and is not an indicator of long-term growth but only reflects periodic seasonal fluctuating consumption rates. Look at total annual volumes for trends.
Construction Economics 2016 Edition 69 GILBANE BUILDING COMPANY
Cement prices increased 2.9% in 2012, after dropping four years in a row. Cement prices increased 4.7% in 2013 and 6.1% in 2014. IHS Global Insight predicted cement prices would rise 5.0% in 2015. Through November, prices are up 8.0%. IHS forecast cement price will increase 4.7% in 2016.
All Construction Spending Rate of Growth 2013-2015 FIGURE 24:Cement Consumption 2005-2018
millions metric tons
2010 = 28yr low
0.0
20.0
40.0
60.0
80.0
100.0
120.0
140.0
2005
2006
2007
2008
2009
2010
2011
2012
2013
2014
2015
2016
2017
2018
Cement Consumption
All Construction Spending Rate of Growth 2013-2015 FIGURE 25:Materials PPI Index Cement Concrete Asphalt 2006-2015
Asphalt Pave
Cement
all indexed to 1-1-06 = 100
Materials PPI
ReadyMix Conc
80
100
120
140
160
180
200
Construction Economics 2016 Edition 70 GILBANE BUILDING COMPANY
All Construction Spending Rate of Growth 2013-2015 FIGURE 26:Materials PPI Index Brick Block Precast 2006-2015
Concrete Block
Precast all indexed to 1-1-06 = 100
Materials PPI
Building Brick
95
100
105
110
115
120
125
130
135
140
STRUCTURAL STEEL / REINFORCING BARThe construction industry is the largest consumer of steel products worldwide. Approximately 100 million tons of steel is produced annually in the United States. More than 40 million tons of that is delivered to the construction industry. The next largest industries combined (automotive, equipment and machinery) do not consume as much steel as construction.
Structural steel is the most widely used structural framing material in the United States, with a 58% of market share for nonresidential and multi-story residential buildings, based on square footage built. The next closest framing material, concrete, holds only 21% market share.
All Construction Spending Rate of Growth 2013-2015 FIGURE 27:Materials PPI Index Iron and Steel Products 2006-2015
Bars, Plates and Steel Shapes
all indexed to 1-1-06 = 100
Materials PPI
Pipe and Tube
Fab Str Stl
Fab Jsts & Rebar
100
105
110
115
120
125
130
135
140
145
150
The rapid rise in 2008 mirrors the rapid acceleration in bid pricing to the peak in Q3-Q4 2008 and the precipitous fall from that peak. By mid-2009, the mill price of steel products had experienced a 40% decline, retreating to a 2004 low. Since the 2011 high, the price trend has been lower for pipe and tube and structural shapes.
Construction Economics 2016 Edition 71 GILBANE BUILDING COMPANY
The rapid rise in 2008 mirrors the rapid acceleration in bid pricing to the peak in Q3-Q4 2008 and the precipitous fall from that peak. By mid-2009, the mill price of steel products had experienced a 40% decline, retreating to a 2004 low. Since the 2011 high, the price trend has been lower for pipe and tube and structural shapes.
Steel.org reports steel mill capacity utilization is currently at 60% as of January 2, 2016. Capacity utilization a year ago was at 75%. This leaves considerable room for capacity expansion, and this will tend to hold down prices.
The November 2015 PPI shows fabricated structural steel cost is down 1.2% in the last 12 months.
Structural steel is very much dependent on recycled steel. Structural steel is made 90% from scrap steel. Scrap prices are down 53% in the last year and down 65% from a 10-year peak in 2011.
COPPER / ALUMINUM / SHEET METAL
All Construction Spending Rate of Growth 2013-2015
Aluminum
Copper
all indexed to 1-1-06 = 100
Materials PPI
Sheet Metal
95
105
115
125
135
145
155
165
175
WHAT MAKES COPPER SO IMPORTANT TO WATCH?
Copper is a leading economic indicator that has rarely (if ever) failed to indicate the direction of world economies. When copper rises in price, world economies are leading into expansion. When copper drops in price, a decline in world economies very quickly follows. Copper prices and the U.S. workforce move almost perfectly together. Also, because copper is so widely used in buildings, and manufacturing facilities must be built to see a big increase in production, copper demand is an excellent predictor of industrial production 12 months out.
FIGURE 28:Materials PPI Index Aluminum Copper Sheet Metal 2006-2015
Construction Economics 2016 Edition 72 GILBANE BUILDING COMPANY
Click here to view copper price charts on metalprices.comWhat drives copper prices up or down? Unlike some other metals, it is not speculation. Quite often it is demand. Increasing demand equals increasing prices. When demand wanes, prices drop.
What effects do copper price changes have on the cost of projects?
Roughly speaking, copper material is about:
› 10% electrical contract or 1% of cost of project
› 5% of an HVAC contract or 0.6% of cost of project
› 10% of a plumbing contract or 0.3% of cost of project
So, for an average project, copper material can represent approximately 2% of the total cost of the project. Therefore, a 10% increase in the cost of copper will increase the cost of a project by 0.2%.
There are exceptions. For example, if copper is 2% of the total cost of the typical project, it is probably 4% to 5% of total cost on a heavy mechanical/electrical project, such as a data center. So a 10% increase in the cost of copper increases the total cost of a data center by 0.4% to 0.5%. For a copper roof, material is 65% of total cost and can represent ~1% of typical project cost.
Construction Economics 2016 Edition 73 GILBANE BUILDING COMPANY
A review of long-term inflation data shows there are seasonal aspects of inflation with some fairly consistent trends. It appears that the majority of inflation occurs in the first half of the year and then moderates for the second half. Since 2001, there have been eight deflationary fourth quarters and only three inflationary fourth quarters, even though the overall trend is inflationary.
All Construction Spending Rate of Growth 2013-2015 FIGURE 29:Moore Inflation Predictor Consumer Inflation 2015-2016
MIP 2013 and 2014 predicted inflation versus actual results that were only 0.1% and 0.2% off. MIP predicted a period of deflation from January 2015 through June 2015 with a rapid rise of 1.5% in the second half of 2015. Actual results show deflation from January through May and a very slight 0.12% inflation increase in June. MIP is now predicting a most likely rise to 0.75% inflation by year end 2015 and an increase up to 2.5% by the end of 2016.
Construction InflationConstruction inflation, based on several decades of trends, is approximately double consumer inflation. From mid-2009 to late 2012, that long-term trend did not hold up. During that period, construction inflation/deflation was primarily influenced by depressed bid margins, which had been driven lower due to diminished work volume. Over the last 24 months, that has changed. Work volume has increased and short-term construction inflation has increased to more than double consumer inflation. It appears construction inflation is already advancing well ahead of consumer inflation, which supports that consumer inflation is not an indication of movements in construction inflation.
It is always important to carry the proper value for cost inflation. Whether adjusting the cost of a recently built project to predict what it might cost to build a similar project in the near future, or answering a client question, “What will it cost if I delay my project start?”, the proper value for inflation (which differs by sector and differs every year) can make or break your estimate.
These points must be taken into consideration when addressing construction inflation:
› Long-term construction cost inflation is normally about double consumer price inflation (CPI).
› Average long-term (30 years) construction cost inflation is about 3.75%.
› In times of rapid construction spending growth, construction inflation averages about 8%.
› Although inflation is affected by labor and material costs, a large part of the change in inflation is due to change in contractors/suppliers’ margins.
› When construction volume increases rapidly, margins increase rapidly.
› Construction inflation can be very different from one major sector to the other and can vary from one market to another. It can even vary considerably from one material to another.
› In the five years of rapid growth in spending for nonresidential buildings from 2004 through 2008, nonresidential buildings cost inflation totaled 39%, or averaged ~8% per year.
› In the six years of spending during the residential construction boom from 2000 through 2005, residential building cost inflation totaled 47%, or averaged ~8% per year.
› Neither the producer price index (PPI) for construction inputs nor the CPI is a good indicator of total construction cost inflation.
› Some construction cost indices include only the cost changes for a market basket of labor and materials and do not include any change for margins. Those indices are not a complete analysis of construction cost inflation.
Construction cost inflation must include all changes related to labor wages, productivity, materials cost, materials availability, equipment and finally contractors margins. Margins are affected by the volume growth of new work and demand for new buildings. Be sure to verify what is included in any cost index you reference for real construction cost inflation.
Construction Economics 2016 Edition 77 GILBANE BUILDING COMPANY
For the last three years, residential construction inflation has averaged 6.7% and nonresidential buildings inflation has averaged 4.2%. Nonresidential buildings cost inflation has increased for five consecutive years. Both are likely to increase in 2016 since anticipated volume in both sectors will grow next year.
In Gilbane’s construction spending data set, which goes back to 1993, there were six years with greater than 9% spending growth. By far, the largest spending growth years were 2004 and 2005, at 11.2% and 11.5%. We are about to repeat that historic level of spending growth. This report predicts 2015 will finish with growth of 10.7% and 2016 will experience 9.7% growth.
Expect historic levels of growth in spending will be accompanied by inflation relative to historic high growth periods. Don’t expect long-term average inflation in high growth periods. Don’t be caught short in your construction cost budgets!
The U.S. Construction Producer Price Index tables for Buildings Complete, which includes the cost complete as charged by the builder, represents one indicator of construction inflation.
All Construction Spending Rate of Growth 2013-2015
started 1-1-08
Industrial
Warehouse
indexed to 1-1-06 = 100
Complete Building Cost
School
started 1-1-07
Office
Health Care 100
110
120
130
140
150
160
NONRESIDENTIAL BUILDINGS INFLATIONAs depicted by U.S. Census PPI completed buildings data:
› 2013 building cost inflation ranged from 2.8% to 4.1%.
› 2014 building cost inflation ranged from 1.3% to 2.6%.
As depicted by Industry Selling Price Indices including margins:
› 2013 building cost inflation ranged from 3.1% to 4.1%.
› 2014 building cost inflation ranged from 4.2% to 4.4%.
FIGURE 30:Complete Building Cost Index by Building Type 2006-2015
Construction Economics 2016 Edition 78 GILBANE BUILDING COMPANY
NEW HOUSING PRICE INFLATION
As depicted by U.S. Census and Industry Actual Cost Indices:
› 2013 building cost inflation ranged from 6.5 to 9.6%.
› 2014 building cost inflation ranged from 6.6% to 6.7%.
Construction spending is increasing at the fastest rate in more than 10 years. That will continue to support increasing margins. Therefore a building’s total construction (final cost) inflation will outpace construction labor and materials inflation.
Expect nonresidential construction cost inflation to remain above 4% for several years. See “Escalation” for near-term and long-term recommendations.
These average values, useful for adjusting whole building costs, cannot be considered to adjust a unique contract type. Construction inflation with a historical average range from 3% to 8% would not be accurate to adjust asphalt paving or shingles. Asphalt products increased 10% in 2005 and 2006 and 20% in both 2008 and 2009.
NONRESIDENTIAL TRADES INFLATION
As depicted by PPI complete trades cost data:
› 2013 trades cost inflation ranged from 1.7% to 4.9%.
› 2014 trades cost inflation ranged from 1.0% to 4.7%.
All Construction Spending Rate of Growth 2013-2015 FIGURE 31:Complete Trades Cost Index by Trade 2006-2015
Concrete
Roofing all indexed to 1-1-08 = 100
Complete Trades Cost
Electrical
ALL started 1-1-08
Plmbg/HVAC
100
105
110
115
120
125
130
Construction Economics 2016 Edition 79 GILBANE BUILDING COMPANY
Gilbane Building Company80
ENR Building Cost
Index
The annual average ENR Index has gone up every year for 70 years.
ENR Building Cost Index
2.4 3.6 2.3 2.02010 2011 2012 2013
ENR-BCI INDEX FLUCTUATIONS (in percentages)
2.12014
2.81.9 2.0 3.620102011 2012 2013
Selling Price Fluctuations (in percentages)
4.02014
1.52015
4.32015
The December 2015 Engineering News-Record 20 Cities Average Building Cost Index (ENR-BCI) is 5564, up 1.5% year-over-year. ENR predicts the BCI will increase 1.8% in 2016.
The ENR-BCI is one of the most well-known and most widely-used building cost indices. However, its long-term strengths can also be weaknesses, particularly in times of fluctuating selling prices because:
› It is made up of a small shopping basket of labor and materials. Therefore, it is not always the best representation of all building types, which can vary considerably in composition.
› That shopping basket includes no representation for any mechanical, electrical or plumbing items, which can comprise 30%-50% of the cost of the building. In many cases, the shopping basket comprises less than 20% of the building cost.
› Building materials differ widely in rate and timing of cost growth and can dramatically affect the cost of projects. In 2009, while structural steel products declined in price by 10% to 15%, copper products increased in price by 40%.
ENR-BCI does not take into consideration bid prices, so it often does not represent the final cost of buildings. Bid prices are referred to as Selling Price, and this is not included in the ENR-BCI. Selling prices show increased or reduced margin bids due to market activity.
Construction Economics 2016 Edition 81 GILBANE BUILDING COMPANY
There were several monthly declines in the ENR index from late 2008 through early 2010, but the annual average has gone up every year for 70 years. More importantly, from Q2 2008 through Q2 2011, during the only recent period in which true deflation occurred, the ENR-BCI would indicate a 10% cost increase! The actual final cost of buildings, documented by several reliable measures, from Q2 2008 through Q4 2010 went down by 8% to 13%.
Whenever there are very active periods or very depressed periods of construction activity, contractor selling prices rise or fall accordingly, and since the ENR-BCI does not track selling price, it cannot reflect accurately what effect selling price had on the cost of buildings during those periods. Nonetheless, the ENR-BCI is often relied upon as an indicator of cost movement over time.
All Construction Spending Rate of Growth 2013-2015
ENR’S BUILDING COST INDEX HISTORY (2000-2015) Base =
1913=100
JAN FEB MAR APR MAY JUN JUL AUG SEP OCT NOV DEC ANNUAL AVERAGE
Data reprinted by permission Engineering News-Record - ENR.com
For a procedure to adjust for actual selling prices see the “Indexing – Addressing the Fluctuation in Margins” section of this report, and refer to Figure 35: Escalation Growth vs. Actual Margin Cost. This is particularly important for those using conceptual cost modelling tools such as the Gilbane CostAdvisor.
TABLE 17:ENR Building Cost Index History
Construction Economics 2016 Edition 82 GILBANE BUILDING COMPANY
All Construction Spending Rate of Growth 2013-2015 FIGURE 32:City Location Cost Index 2015
60 80 100 120 140
San Juan P.R.Raleigh-Durham
CharlestonJacksonville
DallasHouston
Fort MyersBirmingham
AtlantaNew Orleans
PhoenixTampa
CincinnatiIndianapolis
BaltimoreDenver
AlexandriaWashington DC
NashuaHarrisburg
AlbanyCleveland
National AveragePittsburgh
DetroitSt. Louis
SeattleKansas CityMilwaukee
Los AngelesProvidence
MinneapolisHartfordNewark
PhiladelphiaSan JoseChicagoBoston
San FranciscoNew York
100 = national avg
City Costs Indexed to Jun 2015 Means ENR BCI
Equally important as indexing for time is the process of indexing for location. The practice of using historical projects, regardless of location, to get an idea of cost of future projects is quite common. Not only must project costs be moved over time, but also move the location. City indices provide the means to move project costs from one location to another.
Suppose the historical project was built in Phoenix and the goal is to determine the cost of a similar project built in Boston.
Assume › Project cost as built = $10,000,000
› Boston index = 120
› Phoenix index = 90
Move costs to Boston from Phoenix; Divide “To” city by “From” city Multiply original cost by factor.
› Boston / Phoenix = 120/90 = 1.33x
› $10,000,000 x 1.33 = $13,300,000
Through this example, you can see the danger of simply using unadjusted project costs from one location to determine costs in another location. Without adjusting for differences in cost due to location, it is possible to over- or under-state project costs by substantial amounts.
ENR provides city indices for 20 major metropolitan cities. RS Means annually updates tables for hundreds of cities. The chart here lists 40 major cities from highest to lowest RS Means index. The ENR index is shown for those available.
Construction Economics 2016 Edition 84 GILBANE BUILDING COMPANY
Gilbane Building Company85
Selling Price
Selling Price
Selling price is the total price at which a contractor is willing to bid to win a project, even if that selling price eliminates all profit from the bid.
You must take into consideration the selling price of buildings, past and present, if you want to accurately index the cost of buildings over time.
Few inflation or material/labor cost predictors address the issue of bidders raising or lowering margins in bids and hence affecting what is known as selling price. Selling price is dramatically affected by economic conditions such as market volume and contractor booked revenue. When market volume is low, contractor’s margin, or selling price, comes down. As business volume picks up, and contractors secure more work, even if material prices stay low, contractors begin to increase their margins and selling price increases.
In some areas, selling prices are still depressed, and it will take time before workload volumes increase to a point that contractors see a return to normal margins. In 2012 and 2013, margins were increasing. The AGC Business Outlook survey for 2014 indicates optimism at a post-recession high. That will lead to increased margins.
The industry is currently in a growth period as reflected in monthly construction spending. Construction spending is increasing at the fastest rate of growth in more than 10 years. From beginning to end of 2015, the rate of spending will increase by 15%. Construction spending is projected to grow by 6% to 10% for the next several years. Although it may be several years before building market activity returns to pre-recession levels, there is clear evidence that the rate of activity will remain strong. A growth trend leads to higher margins.
Increasing activity
leads to higher selling price.
Construction Economics 2016 Edition 86 GILBANE BUILDING COMPANY
All Construction Spending Rate of Growth 2013-2015 FIGURE 33:Nonresidential Buildings and Infrastructure Spending Rate of Growth 2013-2016
All Construction Spending Rate of Growth 2013-2015 FIGURE 34:Residential Spending Rate of Growth 2013-2016
300
320
340
360
380
400
420
440
460
480
500
520
540
Residential Buildings Spending Annual Rate ($bil)
On average, labor cost represents approximately 35% - 40% of building cost.
Construction Economics 2016 Edition 87 GILBANE BUILDING COMPANY
Contractors need to recover the cost for all expenses that affect their cost to build. Any cost not recovered is taken as a reduction to margin or reduced selling price. Cost recovered over and above expenses raises selling price and is a growth to margins.
› On average, labor cost represents approximately 35% - 40% of building cost.
› On average, materials cost represents approximately 50% -55% of building cost.
› Equipment and contractor services represent 10% of building cost.
› Margins are applied on all 100% of building costs.
Labor wage cost growth is generally 2% to 3% per year. The labor wage cost long-term average is 3%. Labor demand and changes in labor productivity either increases or decreases total labor cost. In growth periods, labor demand tends to increase wages, and productivity generally declines, increasing overall labor cost.
The Q4 Construction Industry Confidence Index Survey by ENR shows more than 85% of executives responded positively that they would increase compensation to hire new or keep existing employees in 2016. The average planned increase was 4.63%.
Materials cost growth is tracked by several reports such as the PPI. Materials costs fluctuate widely, but in general, in times of higher demand, material prices go up.
Equipment and services have the least effect on overall project cost. Contractor efficiencies or unusual project conditions may vary this cost. Margins represent contractor overhead and profit. Selling price includes contractor margins and is market activity dependent. Competition will cause project bid margins to move lower. Increasing volume will allow margins to move higher.
If... Then Cost to Project...Labor wage INCREASE by 3% +1.2%Productivity DECREASE by 2% +0.8%Material costs INCREASE by 5% +2.5%Services costs INCREASE by 5% +0.5%Margin INCREASE by 1% +1.0%
During a period of low volume and competitive pricing (assuming no room for margins to move lower), margins are not increasing. During a period of margin recovery, anticipate a 1% to 1.5% annual increase to margins until margins fully recover.
When there is substantial growth in the volume of projects coming to bid, the need to keep margins reduced will diminish, and margins will return to normal. There is no room left for depressed market activity to move margins lower. Expect margins to increase slowly over time.
Margins vary considerably by market and activity within individual markets.
Construction Economics 2016 Edition 88 GILBANE BUILDING COMPANY
MARGINS INCREASING OR DECREASING?Indices like the PPI MTRLS deal only with materials costs or prices charged at the producer level. They do not include delivery, equipment, installation, or markups, nor do they reflect the cost of services provided by the general contractor or construction manager.
Total project cost encompasses all of these other costs. Whole Buildings Completed PPI doesn’t give us any details about the retail price of the materials used, but it does include all of the contractors costs incurred for delivery, labor for installation and markups on the final product delivered to the consumer, the building owner.
The PPI for construction materials IS NOT an indicator of construction inflation. It does not include the selling price. In 2010, the PPI for construction inputs was up 5.3%, but the selling price was flat. In 2009, PPI for inputs was flat, but construction inflation as measured by cost of buildings decreased 8% to 10%.
For several years, many construction firms have been competing for a very low volume of new work. In 2011 and 2012, construction spending, adjusted for inflation to get real volume, reached a 20-year low. There was little work available for bidders, forcing contractors to remain extremely competitive. As a result, contractors had been unable to pass on all cost increases to the owner. This had the effect of keeping selling price low, reducing both contractors’ and producers’ margins. In some cases, margins may be reduced to a loss just to get work.
Expect whole building costs to rise and remain above material/labor inflation as long as work volume continues to increase.
All Construction Spending Rate of Growth 2013-2015 TABLE 18:BLS PPI Buildings Completed 2011-2014
U.S. Construction Producer Price Indexes - November Buildings annual for
Completed whole building cost 2014 2013 2012 2011
Inputs to Nonresidential -1.9 0.9 0.9 5.7
New Nonrsdntl Bldgs 2.1 3.3 1.5 4.0
New Industrial Bldg 1.8 4.1 1.4 3.1 New Warehouse Bldg 2.6 2.9 2.6 3.7 New School Bldg 2.3 3.4 1.2 4.8 New Office Bldg 2.1 2.8 1.2 3.8
New Health Care Bldg 1.3 4.1 -0.5 NA
except inputs, includes labor, material overhead and profit Source: Producer Price Index. Bureau of Labor Statistics
Construction Economics 2016 Edition 89 GILBANE BUILDING COMPANY
Margin growth resumed in 2012. Independent selling price indices show both 2014 and 2015 margins increasing by over 2%.
The flow of projects coming to bid during the coming months will strongly influence the cost movement of the bids. If the volume of projects coming to bid decreases, overall construction business will remain depressed and bids will remain low, strongly influenced by depressed margins. When there is a continued increase in the volume of projects coming to bid, the need to keep margins reduced will diminish and margins will continue a return to normal.
Indicators are pointing to growth signs, and that will eventually lead to a more normal bidding environment and higher margins.
Construction Economics 2016 Edition 90 GILBANE BUILDING COMPANY
Gilbane Building Company91
Indexing - Addressing
Fluctuations In Margins
Indexing - Addressing Fluctuation in Margins
The cost of previously built buildings is often looked at as a historical guide for what to expect in the future. Escalation indices allow the cost of buildings to be moved over time. City indices allow location to be moved. To index accurately, both margin and productivity need to be reviewed to determine what effect they might have on cost. The Gilbane Building Cost Index is a complete selling price index. The inflation index shows the percent change each year due to inflationary (or deflationary) cost only.
All Construction Spending Rate of Growth 2013-2015 TABLE 19:Gilbane Building Cost Index 2007-2016
Gilbane Building Cost Index - Inflation Factors Index value set to 2015 = 100 Gilbane Gilbane % growth vs. prior year Forecast Forecast
Average costs of buildings from Q2 2008 through Q4 2010 fell by 13% to 15%. However, normal labor/material indices increased by 4% during that time. Normal indices will not account for all changes in individual material costs, wages, productivity changes and margin fluctuations.
Standard labor and material index tables will not address the inflection points in this unusual time period, nor will standard labor and material inflation factors address productivity or margin fluctuation.
Figure 35, Escalation Growth vs. Actual Margin Cost, illustrates nonresidential building inflation during this unusual period and provides a means to properly account for these unusual occurrences.
In Figure 35, the blue line indicates ENR-BCI actual values through December 2015 and predicted escalation near 2.5% thereafter. The plotted values are three-month moving averages to smooth out the line. The red (thicker) line indicates Contractor Bid Price Movement or Adjusted Margin Cost representative of as-built cost. Current Index is through December 2015 and predicted escalation is 5.5% for 2016.
Construction Economics 2016 Edition 92 GILBANE BUILDING COMPANY
Very low margin cost in mid-2010 reflects contractor bids at low cost to secure a portion of a dramatically reduced amount of available work. Predicted future cost shows long-term cost growth, which accounts for both normal labor/material escalation equal to the escalation outlined above, and a very slow but steady 0.5% per quarter recovery of margins.
All Construction Spending Rate of Growth 2013-2015 FIGURE 35:Escalation Growth vs. Actual Margin Cost 2005-2017
Actual Cost = Margin Adjusted Cost
Dec 2015 = 140
ENR Index 3mo Moving Avg =
Escalation
100.0
105.0
110.0
115.0
120.0
125.0
130.0
135.0
140.0
145.0
150.0
2005
Q1
Q2
Q3
Q4
2006
Q1
Q2
Q3
Q4
2007
Q1
Q2
Q3
Q4
2008
Q1
Q2
Q3
Q4
2009
Q1
Q2
Q3
Q4
2010
Q1
Q2
Q3
Q4
2011
Q1
Q2
Q3
Q4
2012
Q1
Q2
Q3
Q4
2013
Q1
Q2
Q3
Q4
2014
Q1
Q2
Q3
Q4
2015
Q1
Q2
Q3
Q4
2016
Q1
Q2
Q3
Q4
2017
Q1
Inde
x va
lue
Escalation Growth vs Margin Cost Illustration Only
How to Use the Above Graph:
If your project is not previously indexed using ENR-BCI, reference only the Margin index (red line).
1. Pick the date for midpoint of the historical reference project.
2. At that date, draw a vertical line so it passes through both curves. Now pick today’s date.
3. At that date, draw a vertical line so it passes through both curves. Record the ENR Index at the historical reference date and today.
4. Record the Margin Cost Index at the historical reference date and today. Subtract historical ENR index from today’s ENR index. Label that value A. Subtract historical Margin index from today’s Margin index. Label that value B. Pay attention to sign (+ or -).
5. The difference between the movement due to the ENR index and the Margin Cost Index is the needed correction factor. Use the differences from the ENR Index (A) and the Margin Index (B) to develop an adjustment factor for your project. Since baseline is 100, all factors are the same as percentages.
6. B minus A = Margin Adjustment factor. Pay attention to signs (+ or -).
CostAdvisor users can record the Margin Adjustment value determined here into the Similarity Adjustment factor field. Treat all system indexing and future escalation as you would normally.
Construction Economics 2016 Edition 93 GILBANE BUILDING COMPANY
Escalation – What Should You Carry?Escalation is typically thought of as one simple value. An estimator typically prepares a budget in today’s dollars, but then must escalate the total estimate to the midpoint of the project construction schedule. As explained in prior sections, when determining escalation, the value must account for several factors.
Escalation must account for all anticipated differences from today’s cost to expected future cost.
TO MOVE COSTS FROM TODAY’S DOLLARS TO FUTURE DOLLARS, WE MUST ACCOUNT FOR THE CUMULATIVE EFFECT OF:
› Market activity
› Labor wage rate changes
› Productivity changes
› Materials cost changes
› Equipment cost changes
› Margins fluctuations
The following escalation recommendations are based on the previous analysis of anticipated market activity, labor and material cost movement, productivity expectations and anticipated margin movement.
› Looking back at Q4 2014, construction activity growth was expected in most major sectors. Healthcare and infrastructure heavy engineering declined, but manufacturing buildings began to expand rapidly.
› For both 2015 and 2016, the general consensus across several construction economic reports is growth in spending of 8% to 11%.
› Residential construction expanded at a rate of 15% per year for the period 2013 to 2015.
› Nonresidential buildings activity in 2015 will post the second highest year to year percentage gains ever recorded.
› Nonresidential buildings spending will reach 17% growth above 2014.
› In 2015, office construction is expected to register 20% growth for the second year in a row.
› Manufacturing will post a 45% gain in 2015, a percent gain rarely seen in any market.
› The Architectural Billings Index for Institutional building hit an all-time high in June. The institutional sector is the last to recover after a downturn. The institutional ABI has been positive for 13 consecutive months and just reached a new high. This is an indicator that the rate of spending activity will increase 9 to 12 months from now.
Construction Economics 2016 Edition 95 GILBANE BUILDING COMPANY
› Inflationary pressures may push the rate of material cost increases higher. All material cost increases from the manufacturer through the supplier may be passed along to the owner.
› Labor shortages may be significant resulting in higher labor retention costs.
› Growing work volume will have the effect of reducing productivity, driving up labor cost.
› Contractors may increase margins 1% to 2% per year. › Any assumption of low escalation (3%-3.5%) requires that market
activity does not experience strong growth. All signs indicate otherwise.
Historical labor and material index growth is 75% in 20 years. That is 3.75% simple index growth per year or 2.85% compounded inflation cost growth for 20 years. Historical as-sold building cost growth is 89% for 20 years. That is 4.45% simple index growth per year or 3.25% compounded inflation cost growth for the last 20 years. Historical average spending growth is 7% per year (not including 2008 to 2011 when spending declined 35%).
Since the U.S. Census began keeping construction spending records in 1993, it has recorded a rate of spending growth more than 10% per year only twice and only three other years have exceeded 9% per year growth. In 2015, we will have 10% growth. 2014 had 9.6% growth and 2016 is projected to have 9.7% growth.
FOR NONRESIDENTIAL BUILDINGSIn years when nonresidential spending growth exceeded 10%, as-sold cost escalation was 9% to 11%.
Potentially, there may be escalation similar to the growth years of 2004 through 2008 when (for nonresidential buildings) spending grew 53%, and escalation averaged 8% per year for five years. All leading indicators point to continued growth for the next few years.
For each year above, consider your market. If you are in a market area or sector that has expectations of a huge volume of work that may start within a narrow window of time, then market pricing can turn rapidly for you.
TOTAL ESCALATION
2015 4.5 - 6.0%
2016 4.5 - 6.0%
2017 & 2018 4.5 - 6.5%
Construction Economics 2016 Edition 96 GILBANE BUILDING COMPANY
All Construction Spending Rate of Growth 2013-2015 FIGURE 36:Inflation/Escalation Minimum and Potential 2000-2017
-10.0%
-8.0%
-6.0%
-4.0%
-2.0%
0.0%
2.0%
4.0%
6.0%
8.0%
10.0%
2000 2002 2004 2006 2008 2010 2012 2014 2016
minimum and potential range
Construction Inflation (Escalation) Nonresidential Buildings
Figure 36 shows the low and high range of various independent nonresidential buildings construction actual cost indices. In 2015, the range of estimates varied from 2% to 5%. Actual inflation came in at 4%. The plotted line shows the actual resulting inflation. A chart for residential or non-building construction inflation would show much different values.
Construction Economics 2016 Edition 97 GILBANE BUILDING COMPANY
Gilbane, Inc. is a full service construction and real estate development company, composed
of Gilbane Building Company and Gilbane Development Company. The company
(www.gilbaneco.com) is one of the nation’s largest construction and program managers
providing a full slate of facilities related services for clients in education, healthcare,
life sciences, mission critical, corporate, sports and recreation, criminal justice, public and
aviation markets. Gilbane has more than 50 offices worldwide, with its corporate office
located in Providence, Rhode Island.
The information in this report is not specific to any one region. The information is limited
to the United States and does not address international economic conditions.
Author Ed Zarenski, a 42-year construction veteran and a member of the Gilbane team for 35 years, managed multi-million dollar project budgeting, owner capital plan cost
control, value engineering and life cycle cost analysis. As a construction economics
analyst, he compiles economic information and provides data analysis and opinion for
this report.
Questions regarding this report can be addressed to:
Edward R. Zarenski
Construction Economics Analyst Construction Analytics
This report and the materials contained therein are provided as estimates and
projections for what may happen in the future. Information herein is believed to
be reliable but Gilbane does not warrant its completeness or accuracy. Gilbane, its
related business entities and the author make no guarantee that the projections and expectations will reflect actual future market and industry behavior and the information is
used at the reader’s own risk.
Data Sources
Along with countless news articles, these sources are used for data in this report:
› American Institute of Architects – www.aia.org/practicing/economics/index.htm
› American Iron and Steel Institute - steel.org
› Associated Builders and Contractors - abc.org
› Associated General Contractors of America - agc.org
› Bloomberg L.P. Financial News - Bloomberg.com
› Bureau of Labor Statistics - Stats.BLS.gov
› Construction Industry Round Table – cirt.org
› CMD - CMDGroup.com (formerly Reed Construction Data)
› Data Digest – DataDigest
› Dodge Data & Analytics - construction.com/about-us/press
› Economic Cycle Research Institute - businesscycle.com
› Engineering News-Record - ENR.com
› Financial Trend Forecaster - Fintrend.com
› FMI Management Consulting - FMINET.com
› IHS Global Insight - ihs.com
› Institute for Supply Management - ism.ws
› Metal Prices – metalprices.com
› National Association of Home Builders – NAHB.org
› Producer Price Indexes - bls.gov/ppi
› Random Lengths - randomlengths.com
› U.S. Census Bureau - census.gov
Engineering News-Record BCI table reprinted by permission.
Financial Trend Forecaster Moore Inflation Predictor graph reprinted by permission.
U. S. Census Bureau data obtained from public domain.
U. S. Bureau of Labor Statistics data obtained from public domain.
Graphics and tables reprinted by permission may not be reproduced outside this report.
All other figures and tables created by E. Zarenski for Gilbane Building Company.
Permission required to reproduce any part of this report.
Construction Economics 2016 Edition 98 GILBANE BUILDING COMPANY