LETTERSPUBLISHED ONLINE: 7 OCTOBER 2012 | DOI: 10.1038/NCLIMATE1702
Carbon emissions from forest conversion byKalimantan oil palm plantationsKimberly M. Carlson1,2,3*†, Lisa M. Curran1,2,3,4*, Gregory P. Asner5, Alice McDonald Pittman1,2,3,Simon N. Trigg6 and J. Marion Adeney2,3,7
Oil palm supplies >30% of world vegetable oil production1.Plantation expansion is occurring throughout the tropics,predominantly in Indonesia, where forests with heterogeneouscarbon stocks undergo high conversion rates2–4. Quantifying oilpalm’s contribution to global carbon budgets therefore requiresrefined spatio-temporal assessments of land cover convertedto plantations5,6. Here, we report oil palm development acrossKalimantan (538,346 km2) from 1990 to 2010, and projectexpansion to 2020 within government-allocated leases. UsingLandsat satellite analyses to discern multiple land covers,coupled with above- and below-ground carbon accounting,we develop the first high-resolution carbon flux estimatesfrom Kalimantan plantations. From 1990 to 2010, 90% oflands converted to oil palm were forested (47% intact, 22%logged, 21% agroforests). By 2010, 87% of total oil palm area(31,640 km2) occurred on mineral soils, and these plantationscontributed 65–75% of 1990–2010 net oil palm emissions(0.020–0.024 GtC yr−1). Although oil palm expanded 278%from 2000 to 2010, 79% of allocated leases remainedundeveloped. By 2020, full lease development would convert93, 844 km2 (∼90% forested lands, including 41% intactforests). Oil palm would then occupy 34% of lowlands outsideprotected areas. Plantation expansion in Kalimantan aloneis projected to contribute 18–22% (0.12–0.15 GtC yr−1) ofIndonesia’s 2020 CO2-equivalent emissions. Allocated oilpalm leases represent a critical yet undocumented source ofdeforestation and carbon emissions.
Oil palm (Elaeis guineensis) plantations in Sumatra andKalimantan produce∼50% of palm oil worldwide1, and Indonesiaplans to double national palm oil production primarily byexpanding landholdings in Kalimantan and Papua7. In 2010,Indonesian palm oil and palm kernel oil production generated∼US$11.1 billion (ref. 1). Yet, Indonesia ranks among the topnational greenhouse-gas (GHG) emitters, largely from land-basedcarbon emissions including deforestation and forest degradation8.Although fires are the dominant cause of Indonesia’s emissionsduring droughts9, oil palm’s contribution to deforestation andemissions is uncertain. Over 50% of oil palmwas planted from 2000to 2010 (ref. 10), yet automated analysis of remote-sensing productshas proved insufficient to detect young (<10 yr) or small-scale(<200 ha) oil palm agriculture11,12. Recently developed plantationsremain undocumented across mineral soils13, which comprise 88%
1School of Forestry and Environmental Studies, Yale University, 195 Prospect Street, New Haven, Connecticut 06511, USA, 2Woods Institute for theEnvironment, Stanford University, 473 Via Ortega, Stanford, California 94305, USA, 3Department of Anthropology, Stanford University, Main Quad,Building 50, 450 Serra Mall, Stanford, California 94305, USA, 4Santa Fe Institute, 1399 Hyde Park Road, Santa Fe, New Mexico 87501, USA, 5Departmentof Global Ecology, Carnegie Institution for Science, 260 Panama Street, Stanford, California 94305, USA, 6Natural Resources Department, School ofApplied Sciences, Cranfield University, Cranfield, Bedfordshire MK43 0AL, UK, 7American Association for the Advancement of Science, 1200 New YorkAvenue Northwest, Washington DC 20005, USA. †Present address: Institute on the Environment, University of Minnesota, 1954 Buford Avenue, Saint Paul,Minnesota 55108, USA. *e-mail: [email protected]; [email protected].
of Kalimantan’s land area. Accounting for past and potential near-term emissions from plantation expansion is essential to estimatethe contribution of oil palm to global carbon emissions, as well asto assess the potentialmarket value of Indonesia’s forest carbon.
Kalimantan harbours diverse land covers containing highlyvariable carbon stocks. Accurate emissions assessments thereforerequire tracking multiple land cover pathways to oil palm,including transitions from logged lands and agroforests6. Despite∼40% loss of lowland forest (<300m above sea level; a.s.l.)across Kalimantan and Sumatra from 1990 to 2005 (refs 4,14),Indonesia maintains the third most extensive tropical forest amongnations8. Residual intact Kalimantan forests support considerableabove-ground carbon (AGB, tC ha−1; refs 2,6). Yet, since the1980s, ∼80% of Kalimantan forests were under federally managedindustrial timber concessions14,15; this extensive logging reducedcarbon stocks. Mosaics of community-managed agroforests andagricultural fallows may also have relatively high AGB (ref. 16).In addition, Kalimantan contains ∼13% of the world’s tropicalpeatlands17,18, with substantial stores of below-ground carbon.Peat draining and burning for oil palm threaten these peatlandcarbon storage systems19–21.
Here, we quantify oil palm extent across Kalimantan from 1990to 2010, assess land cover types converted to oil palm, and estimatenet carbon emissions (carbon flux) from oil palm agriculture. Oilpalm plantation lease maps, representing government-approvedplantations at several stages of the permitting and developmentprocess, were compiled and compared with our digitized oil palmmaps. Using these allocated leases to constrain future oil palmexpansion, we evaluate outcomes generated from three oil palmdevelopment scenarios, including business-as-usual (BAU) andtwo reduced emissions from deforestation and forest degradation(REDD+) initiatives, from 2010 to 2020.
Across Kalimantan, areas cleared for, or planted with, oil palmwere digitized from Landsat satellite images (∼30m, n= 35 scenes)in 1990, 2000 and 2010 eras (Fig. 1 and Supplementary Figs S1 andS2 and Supplementary Information S1). In 1990, oil palm covered903 km2. From 1990 to 2000, plantations expanded by 746 km2 yr−1to occupy 8,360 km2. Since 2000, clearing rates increased 212%to 2,328 km2 yr−1. By 2010, plantations covered 31,640 km2, with87% on mineral soils and 13% on peatlands, roughly proportionalto Kalimantan’s land area on mineral and peat soils, respectively.Peatland conversion to oil palm increased from 3% in the 1990s
Figure 1 | Planted oil palm, oil palm leases, timber leases and protected areas in Kalimantan. Malaysian Federated States of Sarawak and Sabah (M) andBrunei (B) are dark grey. Mineral soils are distributed among elevation classes <300 m a.s.l. and >300 m a.s.l.; >99% of peat soils are <300 m a.s.l. a, From1990 to 2010, oil palm expanded from 903 km2 to 31,640 km2, occupying 9% of lowlands (<300 m a.s.l) outside of protected areas, distributed amongWest (W; 28%), Central (C; 40%), South (S; 8%) and East (E; 23%) Kalimantan provinces. b, In 2010, 64% of Kalimantan’s lowland area was allocated asfollows: planted oil palm and awarded plantation leases (30%); logging concessions and pulp and paper plantations (Timber Leases, 24%); protectedareas (10%). Residual lands, depicted in white, comprise only 31% of Kalimantan’s total land area.
to 16% in the 2000s. In 2010, oil palm plantations occupied 9% ofKalimantan’s lowlands outside of protected areas.
The median lease area is 127 km2 across all allocated leasepolygons, with several conglomerates holding>1,000 km2 (n= 838polygons, 118,085 km2 total area, 83% on mineral soils, Fig. 2). In2010, 21% of lease area contained oil palm. Over 23% of planted oilpalm occurred outside leases. These anomalies probably result fromincomplete or outdated records provided by government agenciesand lease maps generated without field data. Assuming all awardedleases are converted to oil palmunder BAU, 2010 plantation area in-creases∼300% to occupy 125,484 km2, including 34% of Kaliman-tan’s lowlands outside of protected areas.When logging concessionsand pulp and paper plantations are combined with leases, >54% ofKalimantan’s lowlands are controlled by extractive land-based in-dustries (excludingmining), with another 10% in protected areas.
To determine the land cover types converted to plantations(Supplementary Table S1), we classified 1990- and 2000-era Landsatdata using the Carnegie Landsat Analysis System-lite (CLASlite)with a decision tree algorithm22. From 1990 to 2010, oil palmconverted primarily intact (47%) and logged forests (22%) aswell asagroforests (21%, Fig. 3). Only 10% of plantations were establishedon non-forested lands. Under BAU, all unplanted areas withinallocated oil palm leases are developed by 2020. On the basis of theseawarded leases, oil palm is projected to clear a further 93,844 km2,comprising 90% forested lands (41% intact, 21% logged, 27%agroforest) and 10%non-forests. Over 18%of projected conversionoccurs on peatlands.
We evaluated the contribution of oil palm plantation develop-ment to Kalimantan deforestation by comparing our findings withestimates of 2000–2008 forest loss (∼2,812 km2 yr−1; ref. 3). Byprojecting this mean annual deforestation rate to 2010 and combin-ing our intact and logged forest land covers to approximate the for-est class of ref. 3, we estimate that oil palm plantations were directlyresponsible for∼57%of 2000–2010 deforestation (15,949 km2).
The carbon flux from oil palm agriculture was estimated bycombining land cover conversion results with measures of AGB,emissions from peatland draining and burning, and sequestration
Altitude (m a.s.l.)
50Cum
ulat
ive
prop
orti
on o
f tot
al a
rea
199020002010Allocated
Area (km2)
Freq
uenc
y (n
o. o
f oil
palm
leas
es)
0 100 200 300 400 500 >6000
10
20
30
40
50
60
70
80
90
100 200 300 400 22000.5
0.6
0.7
0.8
0.9
1.0a b
Figure 2 |Distribution of planted and allocated oil palm by altitude andplantation lease area. a, Applying a digital elevation model (90 m) acrossKalimantan (sea level to 2,294 m a.s.l.) indicated that in 2010, 96% ofplanted and 86% of allocated oil palm occurred on lands <100 m a.s.l.Proportions are cumulative, and represent total area occurring within eachelevation class. b, Lease areas were estimated by compiling provincial maps(Supplementary Methods). Across all plantation lease polygons withunique names or no name (n=838), the median area indicated by the reddashed line was∼127 km2 (range 1–1,596 km2).
from oil palm growth (Supplementary Table S2). By assumingthat all AGB was emitted the year of conversion, but calculatingemissions from peatland soils on an annual basis, we employa hybrid annual balance/net committed emissions approach23.Thus, we underestimate emissions from peat draining, becausethese emissions continue as long as peatlands remain dry17,19,21.Many oil palm companies cleared lands with fire in the 1990s(ref. 20) and field observations suggest that present prohibitions onburning to clear peatlands are often unenforced. We therefore runscenarios assuming that fire is applied to either all or none of thesepeatlands during plantation development. We report only carbonflux sourced directly from oil palm development.
Conservatively assuming that peatland soils are not burnedduring oil palm development, from 1990 to 2000, cumulative net
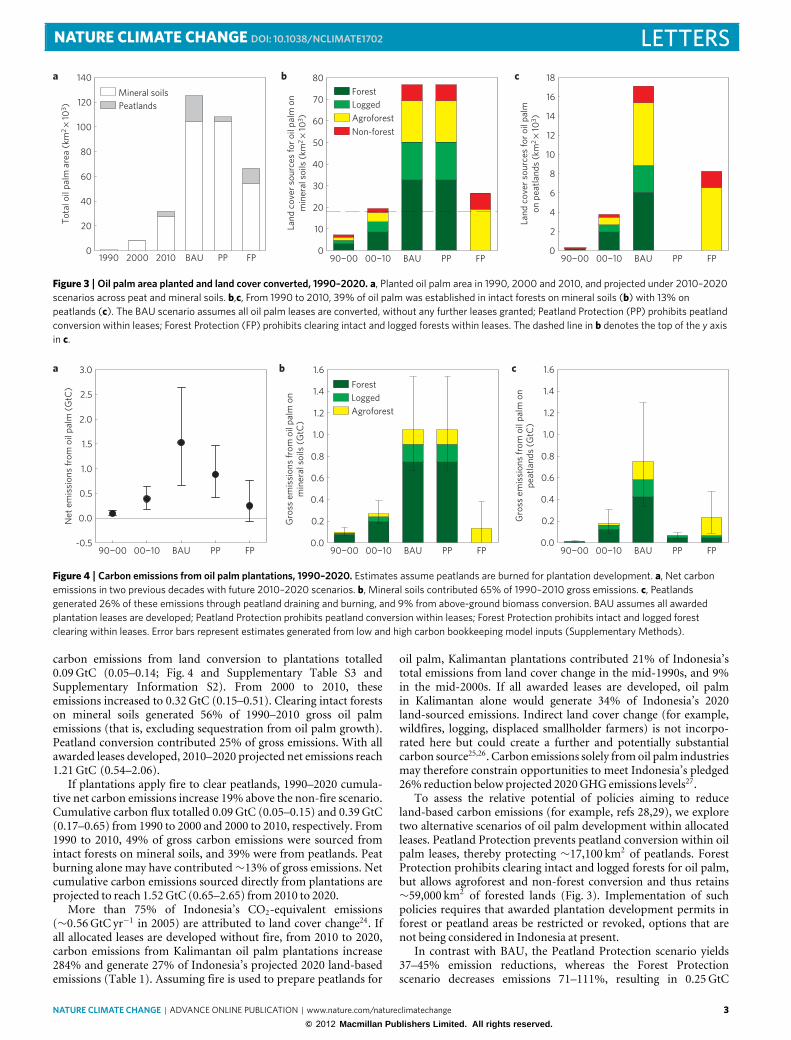
Figure 3 |Oil palm area planted and land cover converted, 1990–2020. a, Planted oil palm area in 1990, 2000 and 2010, and projected under 2010–2020scenarios across peat and mineral soils. b,c, From 1990 to 2010, 39% of oil palm was established in intact forests on mineral soils (b) with 13% onpeatlands (c). The BAU scenario assumes all oil palm leases are converted, without any further leases granted; Peatland Protection (PP) prohibits peatlandconversion within leases; Forest Protection (FP) prohibits clearing intact and logged forests within leases. The dashed line in b denotes the top of the y axisin c.
Net
em
issi
ons
from
oil
palm
(G
tC)
Gro
ss e
mis
sion
s fr
om o
il pa
lm o
n m
iner
al s
oils
(G
tC)
ForestLoggedAgroforest
-0.5
0.0
0.5
1.0
1.5
2.0
2.5
3.0
0.0
0.2
0.4
0.6
0.8
1.0
1.2
1.4
1.6
Gro
ss e
mis
sion
s fr
om o
il pa
lm o
n pe
atla
nds
(GtC
)0.0
0.2
0.4
0.6
0.8
1.0
1.2
1.4
1.6a b c
90¬00 00¬10 BAU PP FP90¬00 00¬10 BAU PP FP90¬00 00¬10 BAU PP FP
Figure 4 | Carbon emissions from oil palm plantations, 1990–2020. Estimates assume peatlands are burned for plantation development. a, Net carbonemissions in two previous decades with future 2010–2020 scenarios. b, Mineral soils contributed 65% of 1990–2010 gross emissions. c, Peatlandsgenerated 26% of these emissions through peatland draining and burning, and 9% from above-ground biomass conversion. BAU assumes all awardedplantation leases are developed; Peatland Protection prohibits peatland conversion within leases; Forest Protection prohibits intact and logged forestclearing within leases. Error bars represent estimates generated from low and high carbon bookkeeping model inputs (Supplementary Methods).
carbon emissions from land conversion to plantations totalled0.09GtC (0.05–0.14; Fig. 4 and Supplementary Table S3 andSupplementary Information S2). From 2000 to 2010, theseemissions increased to 0.32GtC (0.15–0.51). Clearing intact forestson mineral soils generated 56% of 1990–2010 gross oil palmemissions (that is, excluding sequestration from oil palm growth).Peatland conversion contributed 25% of gross emissions. With allawarded leases developed, 2010–2020 projected net emissions reach1.21GtC (0.54–2.06).
If plantations apply fire to clear peatlands, 1990–2020 cumula-tive net carbon emissions increase 19% above the non-fire scenario.Cumulative carbon flux totalled 0.09GtC (0.05–0.15) and 0.39GtC(0.17–0.65) from 1990 to 2000 and 2000 to 2010, respectively. From1990 to 2010, 49% of gross carbon emissions were sourced fromintact forests on mineral soils, and 39% were from peatlands. Peatburning alone may have contributed∼13% of gross emissions. Netcumulative carbon emissions sourced directly from plantations areprojected to reach 1.52GtC (0.65–2.65) from 2010 to 2020.
More than 75% of Indonesia’s CO2-equivalent emissions(∼0.56GtC yr−1 in 2005) are attributed to land cover change24. Ifall allocated leases are developed without fire, from 2010 to 2020,carbon emissions from Kalimantan oil palm plantations increase284% and generate 27% of Indonesia’s projected 2020 land-basedemissions (Table 1). Assuming fire is used to prepare peatlands for
oil palm, Kalimantan plantations contributed 21% of Indonesia’stotal emissions from land cover change in the mid-1990s, and 9%in the mid-2000s. If all awarded leases are developed, oil palmin Kalimantan alone would generate 34% of Indonesia’s 2020land-sourced emissions. Indirect land cover change (for example,wildfires, logging, displaced smallholder farmers) is not incorpo-rated here but could create a further and potentially substantialcarbon source25,26. Carbon emissions solely fromoil palm industriesmay therefore constrain opportunities to meet Indonesia’s pledged26% reduction below projected 2020GHGemissions levels27.
To assess the relative potential of policies aiming to reduceland-based carbon emissions (for example, refs 28,29), we exploretwo alternative scenarios of oil palm development within allocatedleases. Peatland Protection prevents peatland conversion within oilpalm leases, thereby protecting ∼17,100 km2 of peatlands. ForestProtection prohibits clearing intact and logged forests for oil palm,but allows agroforest and non-forest conversion and thus retains∼59,000 km2 of forested lands (Fig. 3). Implementation of suchpolicies requires that awarded plantation development permits inforest or peatland areas be restricted or revoked, options that arenot being considered in Indonesia at present.
In contrast with BAU, the Peatland Protection scenario yields37–45% emission reductions, whereas the Forest Protectionscenario decreases emissions 71–111%, resulting in 0.25GtC
Indonesian carbon emissions, converted from CO2-equivalent GHG emissions, were derived from the First National Communication to the United Nations Framework Convention on Climate Change thatassessed 1994 emissions30 , and Indonesian National Council on Climate Change 2005 estimates and 2020 projections24 . We report net national emissions (Total), and net emissions sourced from landuse/land cover change (LULCC), and compare scenarios assuming fire is applied to all (Fire) or none of the peatlands (No Fire). Low and high estimates, in parentheses, were developed by including lowand high range carbon model inputs (Supplementary Methods). BAU, business-as-usual.
(−0.07–0.77) net emissions from 2010 to 2020 (Table 1). If fire isnot used to clear peatlands, the best-case Forest Protection scenariogenerates 0.12GtC in net carbon sequestration as a result of carbonstored by maturing plantations. These initiatives require protectingforests and peatlands from all proximate causes of land coverchange, especially fires and logging6.
Land management decisions are influenced by the distributionof benefits among diverse actors with asymmetrical influence28.Therefore, land cover outcomes may reflect land use value accruedto dominant agents, rather than net market value. Where REDD+displaces oil palm agriculture, Indonesia’s central governmentreceives REDD+ funds, but forgoes palm oil export taxes.To assess the opportunity costs of implementing REDD+ atthe national level, we compare oil palm export tax revenues(Supplementary Fig. S3 and Table S4) with gross revenuesfrom avoided emissions generated by the Peatland Protectionand Forest Protection scenarios for a 26-year plantation lifecycle. With a 15% palm oil export tax, revenue from oil palmis US$10,000 ha−1. Applying US$10 tCO−12 and assuming noburning for plantation development, avoided emissions revenueis US$6,800 ha−1 or US$7,100 ha−1 in the Forest Protection orPeatland Protection scenarios, respectively. If avoided emissionsassessments incorporate peatland burning, Forest Protectionrevenues total US$8,000 ha−1. Only Peatland Protection benefits(US$13,800 ha−1) exceed export tax revenues fromoil palm.
By providing high-resolution maps of plantations at all stagesof development, we document 288% greater oil palm extent acrossKalimantan than the most recent ∼2000-era estimate12. Althoughour results confirm that oil palm increasingly is established onpeatlands6,13,20, we demonstrate that from 1990 to 2010, mineralsoils received 87% of plantation development and generated65–75% of gross emissions from Kalimantan oil palm. Despiterepresenting <0.5% of Indonesia’s land area, conversion ofintact forests on mineral soils (8,849 km2) contributed ∼6% ofIndonesia’s national land-based 1990–2010 GHG emissions. Undercertainmarket conditions and landmanagement practices, REDD+initiatives aimed at mitigating these emissions may generatenational government revenues similar to oil palm export revenues.
Yet, allocated plantation leases now occupy 32% of lowlandsoutside protected areas. Oil palm companies are not requiredto account for forest loss or carbon emissions generated duringplantation development. Moreover, leases are awarded withoutindependent assessments of land use and carbon, and are notavailable for public review. Carbon emissions from undevelopedleases have therefore remained concealed and excluded fromnational emission projections. Kalimantan’s leased plantation
lands represent a significant near-future source of deforestationand associated carbon emissions. Increased transparency bythe plantation sector is essential and urgently required forinclusion of oil palm agriculture in land management andemissions mitigation efforts.
MethodsLand cover classification and validation. Our land cover classification wasdeveloped from 1990- and 2000-era Landsat 5 Thematic Mapper and Landsat 7Enhanced Thematic Mapper Plus images. To maximize cloud-free coverage, wecompiled satellite data from 1990 to 2000, as well as images ±4 years from thesetarget years. Multiple images per scene in a single era were often included in thedata set, which consisted of 116 Landsat scenes spanning 1988–1994 (n= 52),and 1999–2002 (n= 64). CLASlite software was used to pre-process raw datato reflectance, and to apply a probabilistic spectral un-mixing model yieldingfractional cover, consisting of photosynthetic vegetation, non-photosyntheticvegetation, and soil22. Before classification, cloudy areas and pixels with≥15◦ slopewere masked, and single-era images were mosaicked.
A decision-tree algorithm, originally developed to detect deforestationand disturbance in Peru26, was applied to classify CLASlite mosaics into intactforest, logged forest, agroforest and non-forest land covers. Where we hadground-based validation data and/or very high-resolution IKONOS or Quickbirdimages (∼14,000 km2 coverage), this algorithm was modified to detect land coverunder various atmospheric and geometric conditions as well as across diversevegetation formations.
The 1990- and 2000-era products contained 57% and 62% data, respectively.Pixels containing data in both eras composed 41% of the study area. Althoughno-data regions potentially constrain analysis of transitions among land coverclasses, our data set has ample coverage to evaluate land conversion to oilpalm. Un-masked pixels in 1990 comprise 65% of planted oil palm in 2000,and un-masked pixels in 2000 compose 77% of 2010 planted oil palm and71% of allocated leases.
Land cover validation. We validated the classified data set by randomly selecting400 points from each of the 1990- and 2000-era mosaics (n= 800 points). Pointswere visually classified from raw Landsat data as belonging to one of the fourland cover classes. If a point fell on an edge between two land covers, in a cloudor cloud shadow, or in an oil palm area, it was removed from the data set. Wecalculated overall accuracy (po), and the kappa coefficient (k) from a total of 582validation points (1990: n= 279; 2000: n= 303). The comparison yielded a poof 0.77 and a k of 0.65.
Oil palm identification. Areas cleared for or planted with oil palm in 1990, 2000and 2010 eras were manually digitized from Landsat satellite images. Multipleimage dates before the target year often were required to detect and verify oilpalm development. Clearing included roads through forest if these roads werearranged in distinctive gridded patterns indicating oil palm development. Wherepossible, oil palm detected in Landsat was confirmed using Quickbird, IKONOS orALOS PALSAR imagery.
Land cover change projections. To assess potential future land cover sources foroil palm development in Kalimantan, we projected land cover in un-planted oilpalm leases to 2010. Rates of land cover change from 1990 to 2000 were stratifiedby province and land type. We limited our calculations to un-masked pixels in
NATURE CLIMATE CHANGE DOI: 10.1038/NCLIMATE1702 LETTERSboth 1990- and 2000-era data sets. These gross rates of change were applied to2000-era land cover within un-planted oil palm leases to predict 2010 land coverdistribution within leased areas.
Land cover source analysis. We derived land cover sources for oil palm plantedin 2000 from the 1990-era land cover product, for oil palm in 2010 from the2000-era product, and for planned leases from projected 2010 land cover. Owingto the 10-year interval between the land cover product and oil palm coverage, ouranalysis may overestimate forest area conversion. Yet, the proportion of forestedland cover (intact, logged and agroforest) converted to oil palm across Kalimantan(90%, 1990–2010) was surprisingly consistent with results from a detailed WestKalimantan case study (86%, 1989–2011; ref. 6).
Carbon bookkeeping model and sensitivity analysis. To estimate carbon fluxfrom oil palm, a carbon bookkeeping model accounted for changes in AGB andpeat soil organic carbon. A range of scenarios were evaluated by presenting mean,low, and high carbon flux estimates. To derive these values, we input mean AGBand peatland carbon emissions, as well as low and high values, calculated from95% confidence intervals (oil palm growth equations) or ±1 s.d. (all other carboninputs). Ourmodel is described in detail in the SupplementaryMethods.
Avoided emissions and export tax revenues. Revenues from reduced emissionsin REDD+ scenarios were calculated by coupling avoided emissions with realisticcarbon credit prices. Export tax revenues from crude palm oil and crude palm kerneloil products were estimated for a typical 26-year plantation lifetime. We calculatedexport rates and prices from 2007 to 2009 annual domestic production, exportquantity and export value (Supplementary Table S4). We coupled these estimateswith plausible export tax rates as well as annual fresh fruit bunch yields and oilextraction rates developed from empirical data on Indonesian industrial-scale oilpalm production to generate estimates of oil palm export tax revenue.
Received 30 April 2012; accepted 3 September 2012;published online 7 October 2012
References1. Food and Agriculture Organization of the United Nations FAOSTAT ; available
at: http://faostat.fao.org (FAO, 2012).2. Baccini, A. et al. Estimated carbon dioxide emissions from tropical deforestation
improved by carbon-density maps. Nature Clim. Change 2, 182–185 (2012).3. Broich, M et al. Remotely sensed forest cover loss shows high spatial and
temporal variation across Sumatera and Kalimantan, Indonesia 2000–2008.Environ. Res. Lett. 6, 014010 (2011).
4. Hansen, M. C. et al. Quantifying changes in the rates of forest clearing inIndonesia from 1990 to 2005 using remotely sensed data sets. Environ. Res. Lett.4, 034001 (2009).
5. Gibbs, H. K. et al. Tropical forests were the primary sources of new agriculturalland in the 1980s and 1990s. Proc. Natl Acad. Sci. USA 107, 16732–16737 (2010).
6. Carlson, K. M. et al. Committed carbon emissions, deforestation, andcommunity land conversion from oil palm plantation expansion in WestKalimantan, Indonesia. Proc. Natl Acad. Sci. USA 109, 7559–7564 (2012).
7. United States Department of Agriculture Indonesia: Rising GlobalDemand Fuels Palm Oil Expansion (USDA, 2010); available atwww.pecad.fas.usda.gov/highlights/2010/10/Indonesia.
8. Harris, N. L. et al. Baseline map of carbon emissions from deforestation intropical regions. Science 336, 1573–1576 (2012).
9. Page, S. E. et al. The amount of carbon released from peat and forest fires inIndonesia during 1997. Nature 420, 61–66 (2002).
10. Indonesian Ministry of Agriculture Area and Production by Category ofProducers: Oil Palm, 1967–2010 (Indonesian Ministry of Agriculture, 2010);available at http://ditjenbun.deptan.go.id.
11. Paoli, G. D. et al. Policy perils of ignoring uncertainty in oil palm research.Proc. Natl Acad. Sci. USA 108 E218 (2011).
12. Koh, L. P., Miettinen, J., Liew, S. C. & Ghazoul, J. Remotely sensed evidenceof tropical peatland conversion to oil palm. Proc. Natl Acad. Sci. USA 108,5127–5132 (2011).
13. Miettinen, J. et al. Extent of industrial plantations on Southeast Asianpeatlands in 2010 with analysis of historical expansion and future projections.Glob. Change Biol. (2012).
14. Curran, L. M. et al. Lowland forest loss in protected areas of Indonesian Borneo.Science 303, 1000–1003 (2004).
15. Curran, L. M. & Trigg, S. N. Sustainability science from space: Quantifyingforest disturbance and land use in the Amazon. Proc. Natl Acad. Sci. USA 103,12663–12664 (2006).
16. Lawrence, D. Biomass accumulation after 10–200 years of shifting cultivationin Bornean rain forest. Ecology 86, 26–33 (2005).
17. Page, S. E., Rieley, J. O. & Banks, C. J. Global and regional importance of thetropical peatland carbon pool. Glob. Change Biol. 17, 798–818 (2011).
18. Murdiyarso, D., Dewi, S., Lawrence, D. & Seymour, F. Indonesia’s ForestMoratorium: A Stepping Stone to Better Forest Governance? (CIFOR, 2011).
19. Hooijer, A. et al. Subsidence and carbon loss in drained tropical peatlands.Biogeosciences 9, 1053–1071 (2012).
20. Murdiyarso, D., Hergoualc’h, K. & Verchot, L. V. Opportunities for reducinggreenhouse gas emissions in tropical peatlands. Proc. Natl Acad. Sci. USA 107,19655–19660 (2010).
21. Page, S. E. et al. Review of Peat Surface Greenhouse Gas Emissions from OilPalm Plantations in Southeast Asia (The International Council on CleanTransportation, 2011).
22. Asner, G. P., Knapp, D. E., Balaji, A. & Páez-Acosta, G. Automated mapping oftropical deforestation and forest degradation: CLASlite. J. Appl. Remote Sens. 3,033543 (2009).
23. Fearnside, P. M. Greenhouse gases from deforestation in Brazilian Amazonia:Net committed emissions. Climatic Change 35, 321–360 (1997).
24. Indonesian National Council on Climate Change Indonesia’s Greenhouse GasAbatement Cost Curve (Indonesian National Council on Climate Change,2010).
25. Van der Werf, G. R. et al. CO2 emissions from forest loss. Nature Geosci. 2,737–738 (2009).
26. Oliveira, P. J. C. et al. Land-Use allocation protects the Peruvian Amazon.Science 317, 1233–1236 (2007).
27. Republic of Indonesia Peraturan Presiden No. 61/2011, Presidential Regulationregarding the National Greenhouse Gas Emission Reduction Action Plan(Republic of Indonesia, 2011).
28. Busch, J. et al. Structuring economic incentives to reduce emissionsfrom deforestation within Indonesia. Proc. Natl Acad. Sci. USA 109,1062–1067 (2012).
29. Republic of Indonesia Instruksi Presiden No. 10/2011, Presidential InstructionRegarding Suspension of Granting New Licenses and Improvement of NaturalPrimary Forest and Peatland Governance (Republic of Indonesia, 2011).
30. Indonesian Ministry of Environment Indonesia: The First NationalCommunication on Climate Change Convention (Indonesian Ministry ofEnvironment, 1999).
AcknowledgementsWe thank the Indonesian Ministries of Forestry and of Research and Technology, andProvincial Governments, Plantation Departments, Forestry Departments, StatisticsAgencies and Land Bodies in Central, East, South and West Kalimantan. D. Ratnasari,S. Lansing, G. Paoli, D. Lawrence, A. Ponette-Gonzalez, J. H. Jones, P. Oliveira, H. Gibbs,J. Clark, D. Knapp, B. Soares-Filho, D. Gaveau, T. Gibbs, D. Gilbert, M. Greenleaf,N. Lisnawati, Y. Purwanto, Ruspita, W. I. Suci, A. Rohman, M. Mugiman, D. Astiani,R. Hartono, U. Abdurrahman, D. Firnata, A. Nirwan and R. Wahyudi provided feedbackand fieldwork. L.M.C. acknowledges financial support for this team project fromthe NASA Land Cover/Land-Use Change Program (NNG05GB51G, NNX11AF08G,NNX07AK37H), John D. and Catherine T. MacArthur Foundation, Santa Fe Institute,Stanford University and Yale University. K.M.C. was financially supported by NASA(NNX08AU75H) andNSF (DGE-1122492) graduate fellowships.
Author contributionsL.M.C. conceived and designed the project; G.P.A. provided software and designed theland cover classification algorithm; A.M.P., S.N.T., K.M.C. and J.M.A. conducted spatialassessments; K.M.C., A.M.P. and L.M.C. compiled and analysed data; and K.M.C. andL.M.C. wrote the paper.
Additional informationSupplementary information is available in the online version of the paper. Reprints andpermissions information is available online at www.nature.com/reprints. Correspondenceand requests formaterials should be addressed to K.M.C. or L.M.C.
Competing financial interestsThe authors declare no competing financial interests.