46
MATTHIAS FINKENRATH, JULIAN SMITH AND DENNIS VOLK INFORMATION PAPER CCS RETROFIT Analysis of the Globally Installed Coal-Fired Power Plant Fleet 2012
| Date post: | 27-Apr-2018 |
| Category: |
Documents |
| Upload: | phunghuong |
| View: | 214 times |
| Download: | 0 times |

Matthias FINKENRATH, Julian SMITH and dennis VOLK
INFORMATION PAPER
CCS RETROFIT
Analysis of the Globally Installed Coal-Fired Power Plant Fleet
2012


Matthias FINKENRATH, Julian SMITH and dennis VOLK
CCS RETROFIT
Analysis of the Globally Installed Coal-Fired Power Plant Fleet
This paper is published under the authority of the Sustainable Energy Policy and Technology Directorate and may not reflect the views of individual International Energy Agency (IEA) member or non-member countries.
Data and information is provided for informational purposes only, and the IEA is not liable for any errors in their content. For further information, please contact Dennis Volk at: [email protected]
2012

INTERNATIONAL ENERGY AGENCY
The International Energy Agency (IEA), an autonomous agency, was established in November 1974. Its primary mandate was – and is – two-fold: to promote energy security amongst its member countries through collective response to physical disruptions in oil supply, and provide authoritative
research and analysis on ways to ensure reliable, affordable and clean energy for its 28 member countries and beyond. The IEA carries out a comprehensive programme of energy co-operation among its member countries, each of which is obliged to hold oil stocks equivalent to 90 days of its net imports. The Agency’s aims include the following objectives:
n Secure member countries’ access to reliable and ample supplies of all forms of energy; in particular, through maintaining effective emergency response capabilities in case of oil supply disruptions.
n Promote sustainable energy policies that spur economic growth and environmental protection in a global context – particularly in terms of reducing greenhouse-gas emissions that contribute to climate change.
n Improve transparency of international markets through collection and analysis of energy data.
n Support global collaboration on energy technology to secure future energy supplies and mitigate their environmental impact, including through improved energy
efficiency and development and deployment of low-carbon technologies.
n Find solutions to global energy challenges through engagement and dialogue with non-member countries, industry, international
organisations and other stakeholders. IEA member countries:
Australia Austria
Belgium Canada
Czech RepublicDenmark
Finland France
GermanyGreece
HungaryIreland
ItalyJapan
Korea (Republic of)LuxembourgNetherlandsNew Zealand NorwayPolandPortugalSlovak RepublicSpainSwedenSwitzerland
TurkeyUnited Kingdom
United States
The European Commission also participates in
the work of the IEA.
Please note that this publication is subject to specific restrictions that limit its use and distribution.
The terms and conditions are available online at www.iea.org/about/copyright.asp
© OECD/IEA, 2012International Energy Agency
9 rue de la Fédération 75739 Paris Cedex 15, France
www.iea.org
© OECD/IEA 2012 CCS Retrofit – Analysis of the Globally Installed Coal‐Fired Power Plant Fleet
Page | 3
Table of contents Acknowledgements .......................................................................................................................... 6
Background and motivation ............................................................................................................. 7
Scope of this study ............................................................................................................................ 8
Retrofit assessment criteria ............................................................................................................. 9
Definition of the potential for CCS retrofitting .......................................................................... 9
Key findings from literature ..................................................................................................... 10
Information available from global databases .......................................................................... 11
Limitations and uncertainties ........................................................................................................ 11
Analysis of the globally installed fleet ........................................................................................... 14
Global profile of the installed coal‐fired power plant fleet ..................................................... 14
Countries with the largest CO2 emissions from coal‐fired power generation ........................ 15
Case analyses .................................................................................................................................. 17
Impact of minimum power plant size and age on plant population ....................................... 18
Case 1 (units <30 years old and >100 MW) results on a global level .............................. 18
Case 2 (units <20 years old and >300 MW) results on a global level .............................. 19
Case 3 (units <10 years old and >300 MW) results on a global level .............................. 20
Analysis for major CO2 emitting countries ..................................................................................... 21
China ........................................................................................................................................ 21
General observations from the case analysis .................................................................. 21
Key country‐specific conclusions ..................................................................................... 22
United States of America ......................................................................................................... 22
General observations from the case analysis .................................................................. 23
Key country‐specific conclusions ..................................................................................... 23
India ......................................................................................................................................... 23
General observations from the case analysis .................................................................. 23
Key country‐specific conclusions ..................................................................................... 24
Germany .................................................................................................................................. 25
General observations from the case analysis .................................................................. 25
Key country‐specific conclusions ..................................................................................... 26
Russia ....................................................................................................................................... 26
General observations from the case analysis .................................................................. 26
Key country‐specific conclusions ..................................................................................... 27
Japan ........................................................................................................................................ 27
General observations from the case analysis .................................................................. 27
Key country‐specific conclusions ..................................................................................... 28
CCS Retrofit – Analysis of the Globally Installed Coal‐Fired Power Plant Fleet © OECD/IEA 2012
Page | 4
South Africa ............................................................................................................................. 28
General observations from the case analysis .................................................................. 29
Key country‐specific conclusions ..................................................................................... 29
Australia ................................................................................................................................... 30
General observations from the case analysis .................................................................. 30
Key country‐specific conclusions ..................................................................................... 31
Republic of Korea ..................................................................................................................... 31
General observations from the case analysis .................................................................. 31
Key country‐specific conclusions ..................................................................................... 32
Poland ...................................................................................................................................... 32
General observations from the case analysis .................................................................. 32
Key country‐specific conclusions ..................................................................................... 33
Summary .................................................................................................................................. 33
Analysis of expected new installations .......................................................................................... 35
Summary and conclusions .............................................................................................................. 37
Observations from analysing the globally installed fleet ........................................................ 37
Perspectives on new installations in the coming decades ...................................................... 38
Findings from the country‐level analysis ................................................................................. 39
Key conclusions ....................................................................................................................... 39
Acronyms, abbreviations and units of measure ............................................................................ 41
References ...................................................................................................................................... 42
List of Figures
Figure 1 Definitions of retrofit potential ....................................................................................... 9 Figure 2 WEPP and eGRID data of the installed coal‐fired power plant fleet
in the United States ....................................................................................................... 12 Figure 3 WEPP and BNetzA data of the installed coal‐fired power plant fleet in Germany ....... 13 Figure 4 Total coal‐fired power plant capacity globally, broken down by age and
generation capacity ....................................................................................................... 14 Figure 5 Total coal‐fired power plant capacity globally, broken down by age and
performance level ......................................................................................................... 15 Figure 6 Breakdown of global CO2 emissions from coal/peat through the
production of electricity, heat, and power generation capacity .................................. 16 Figure 7 Installed total coal‐fired power plant capacity in all countries and breakdown
by age and capacity ....................................................................................................... 18 Figure 8 Breakdown of young (<30 years) and large (>100 MW) coal‐fired power plants ......... 18 Figure 9 Installed total coal‐fired power plant capacity in all countries and breakdown
by age and capacity ....................................................................................................... 19 Figure 10 Breakdown of young (<20 years) and large (>300 MW) coal‐fired power plants ......... 19 Figure 11 Installed total coal‐fired power plant capacity in all countries and breakdown
by age and capacity ....................................................................................................... 20
© OECD/IEA 2012 CCS Retrofit – Analysis of the Globally Installed Coal‐Fired Power Plant Fleet
Page | 5
Figure 12 Further breakdown of young (<10 years) and large (>300 MW) coal‐fired power plants ................................................................................................. 20
Figure 13 China: Profile of operating fleet of coal‐fired power plants ......................................... 21 Figure 14 United States of America: Profile of operating fleet of coal‐fired power plants .......... 22 Figure 15 India: Profile of operating fleet of coal‐fired power plants .......................................... 24 Figure 16 Germany: Profile of operating fleet of coal‐fired power plants .................................... 25 Figure 17 Russia: Profile of operating fleet of coal‐fired power plants ........................................ 26 Figure 18 Japan: Profile of operating fleet of coal‐fired power plants ......................................... 28 Figure 19 South Africa: Profile of operating fleet of coal‐fired power plants ............................... 29 Figure 20 Australia: Profile of operating fleet of coal‐fired power plants .................................... 30 Figure 21 Korea: Profile of operating fleet of coal‐fired power plants ......................................... 31 Figure 22 Poland: Profile of operating fleet of coal‐fired power plants ....................................... 33 Figure 23 New (gross) installations of coal‐fired power plants according to the
WEO 2011 New Policies Scenario (GW) ........................................................................ 35
List of Tables
Table 1 Steam conditions of pulverized coal‐fired power plant technologies .......................... 11 Table 2 Countries that account for more than 85% of global CO2 emissions
from coal/peat through the production of electricity and heat ................................... 16 Table 3 Overview on case results ............................................................................................... 34 Table 4 Regional focus of this analysis versus regional breakdown in WEO 2011 .................... 35 Table 5 New (gross) installations of coal‐fired power plants according to the
WEO 2011 New Policies Scenario (GW) ........................................................................ 36 Table 6 Total retirements of coal‐fired power plants according to the
WEO 2011 New Policies Scenario (GW) ........................................................................ 36
CCS Retrofit – Analysis of the Globally Installed Coal‐Fired Power Plant Fleet © OECD/IEA 2012
Page | 6
Acknowledgements The authors of this document would like to thank all the contributors and reviewers for their input and comments.
Significant contributions, valuable comments and feedback were received from within the IEA, including Keith Burnard, Osamu Ito, Dafydd Elis, Marco Baroni and Sean McCoy and from the panel of external reviewers. In that regard, we offer special thanks to Christopher Short from the Global CCS Institute, Colin Henderson from International Energy Agency’s (IEA) Clean Coal Centre, John Davison from the International Energy Greenhouse Gas (IEAGHG) Programme and Ping Zhong from Administrative Centre for China’s Agenda 21 (ACCA 21).
We would also like to thank Bo Diczfalusy, Director of the Sustainable Energy Policy and Technology Directorate, Juho Lipponen, Head of the Carbon Capture and Storage Technology Unit at the IEA, and Lászlo Varró, Head of the Gas, Coal and Power Markets Division, for their valuable advice and support.
Cheryl Haines, Muriel Custodio and Angela Gosmann at the IEA’s Communication and Information Office provided essential support in terms of editing, production and publication.
© OECD/IEA 2012 CCS Retrofit – Analysis of the Globally Installed Coal‐Fired Power Plant Fleet
Page | 7
Background and motivation With more than 1 600 GW of installed generation capacity in 2010 according to IEA analyses the global coal‐fired power plant fleet accounts for more than 8.5 Gigatonnes (Gt) of carbon dioxide (CO2) emissions each year. This represents roughly one‐quarter of the world’s anthropogenic CO2 emissions. Despite ever‐present climate change concerns, coal‐fired power generation is expanding faster than ever: over the last five years, capacity additions experienced record‐growth of more than 350 GW.
Further, energy scenarios by the International Energy Agency (IEA) expect an additional 1 000 GW by 2035. Without further action to mitigate the effects of growing unabated coal‐fired power generation capacity, this represents a massive threat to the global climate. IEA assessments suggest that CCS deployed to the global coal‐fired power plant fleet might contribute to 10% of worldwide energy‐related CO2 emission reductions required to stabilise global warming by 2050 (IEA, 2010a). In order to achieve deep cuts in worldwide CO2 emissions, lowest‐cost scenarios suggest that nearly all new‐build fossil‐fuel power plants need to be equipped with CCS in the coming decades.
In addition, CCS equipment would need to be added to the already installed global fleet of fossil‐fuel power plants. This approach, known as CCS retrofitting, is expected to play an important role in addressing the problem of CO2 emissions from fossil‐fuel power plants that have been already “locked‐in”. The importance for CCS retrofitting is further exacerbated by the significant lifetime of existing power plants and the very large number of plants likely to be built over the coming decades without CO2 emissions abatement.
Modelling results provide estimates of the required overall deployment of CCS retrofit to coal‐fired power plants. In order to meet ambitious emission reduction levels at lowest cost, the IEA Energy Technology Perspectives 2010 (ETP 2010) analysis suggests that CCS retrofit will play an increasingly significant role until 2030. New fossil‐fuel power plants built in the next ten to twenty years should, hence, be designed in a manner that would allow for CCS retrofitting. Until 2050, ETP 2010 projects that 114 GW of coal‐fired capacity would need to be retrofitted with CCS globally, in order to achieve stabilisation of global warming at sustainable levels at lowest costs. This is a significant share relative to the 550 GW of new coal‐fired power plants and 298 GW of new gas‐fired capacity with CCS to be installed globally over the same period (until 2050) in the same scenario. While nearly the entire global coal‐fired power plant fleet will need to be equipped with CCS from the beginning, 16% of the total coal capacity operating with CCS by 2050 will need to be retrofitted power plants.
Retrofitting CCS, is, however, a complex task that requires consideration of many site‐specific aspects. An exact analysis of the potential to retrofit CCS to the global coal‐fired power plant fleet, including all of the many parameters critical towards an assessment of the technical, economic and social viability to retrofit CCS, is not possible due to lack of available data and the diversity of market circumstances. Information from global databases, IEA statistics and the IEA World Energy Outlook 2011 (WEO 2011), however, provides an indication of the present and future size, age and performance profile, as well as the regional distribution of the global coal‐fired power plant fleet. This study presents data from the ten countries which together account for more than 85% of the world’s CO2 emissions from coal‐fired power generation and discusses the percentage of that population of plants that could be particularly attractive for considering CCS retrofit. This study does not assess the potential‐limiting technical, economic and other constraints to arrive at the realistic retrofit potential.
CCS Retrofit – Analysis of the Globally Installed Coal‐Fired Power Plant Fleet © OECD/IEA 2012
Page | 8
Scope of this study A large number of coal‐fired power plants are currently in operation worldwide. No complete set of technical information of individual units of this globally installed fleet exists. However, available databases cover the bulk of these plants in a relatively comprehensive manner. These databases typically include key information related to the size, age, and performance level of the vast majority of the globally installed coal‐fired power plants.
The following analysis is based on IEA statistical information in combination with data from the UDI World Electric Power Plants Data Base (Platts, 2011), referred to henceforth as the WEPP database. Data from the IEA are used in this study for validation of WEPP results. IEA data are typically based on direct submissions by IEA member and non‐member countries, as well as the agency’s own analysis. Submitted data are often aggregated on a country‐wide level.
This study illustrates the size and regional distribution of the globally installed coal‐fired power plant fleet that is potentially relevant for CCS retrofitting. The study draws upon existing research on CCS retrofitting: several studies have estimated the effective potential for retrofitting on a regional level, often based on generic assumptions. While significant progress has been made on understanding the importance of different aspects relevant for assessing CCS retrofitting, the realistic global potential is still unclear. No detailed economic analysis is performed under this study. Instead, a range of selected criteria for coal‐fired power plants is extracted from global databases and combined with fundamental economic considerations in order to provide a realistic estimate of the potential for retrofitting plants with CCS. More specifically, the following analysis illustrates the global and regional distribution – broken down to a generation unit level (or power plant “block” size) – of power generation capacities, performance levels, and plant age.
These criteria represent only a fraction of various technical and non‐technical parameters to be taken into account for assessing the realistic global potential for retrofitting CCS. For example, the analysis covers neither a detailed assessment of the current interest or pace of development of a specific region in deploying CCS, nor the availability and economic viability of required local CO2 transportation and storage. The study is thus not designed to provide an accurate estimate of the actual, realistic global potential for retrofitting CCS on a commercial basis.
However, the study does shed further light on several key aspects that are important for considering the fundamental ability to retrofit CCS, such as:
Relative to the globally installed fleet of coal power generation today, how big is the share of comparatively young power plants that might be particularly attractive for CCS retrofit, and in which countries are they located?
Similarly, how prevalent is the share of comparatively efficient or very large plants and what is their regional distribution?
Based on data from the IEA WEO 2011 publication, in which regions are new coal‐fired power plants likely be located in the coming decades, and how significant will their power generation capacity be, relative to the existing fleet?
This report analyses in greater detail those ten countries that together represent more than 85% of the world’s CO2 emissions from the production of electricity and heat using coal and peat.
To also include likely future developments, data for the present installed fleet are complemented by results for coal power plant deployment (IEA, 2011) that are expected for the coming decades.
© OECD/IEA 2012 CCS Retrofit – Analysis of the Globally Installed Coal‐Fired Power Plant Fleet
Page | 9
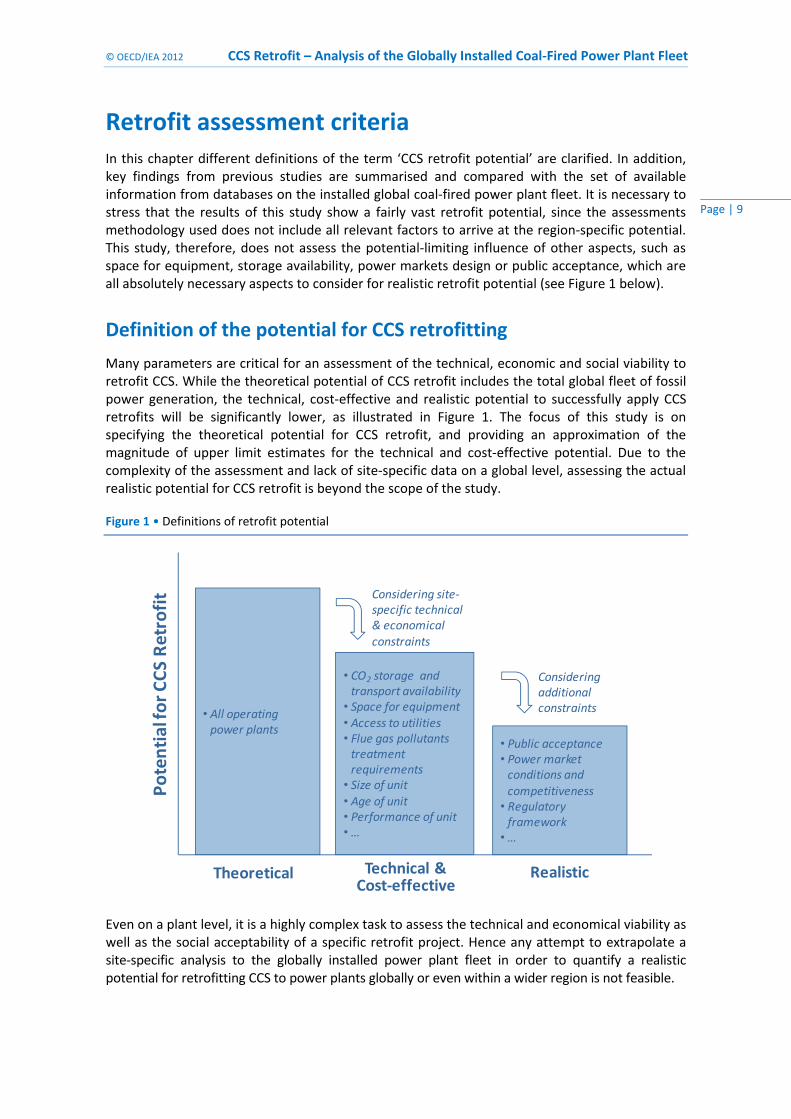
Retrofit assessment criteria In this chapter different definitions of the term ‘CCS retrofit potential’ are clarified. In addition, key findings from previous studies are summarised and compared with the set of available information from databases on the installed global coal‐fired power plant fleet. It is necessary to stress that the results of this study show a fairly vast retrofit potential, since the assessments methodology used does not include all relevant factors to arrive at the region‐specific potential. This study, therefore, does not assess the potential‐limiting influence of other aspects, such as space for equipment, storage availability, power markets design or public acceptance, which are all absolutely necessary aspects to consider for realistic retrofit potential (see Figure 1 below).
Definition of the potential for CCS retrofitting
Many parameters are critical for an assessment of the technical, economic and social viability to retrofit CCS. While the theoretical potential of CCS retrofit includes the total global fleet of fossil power generation, the technical, cost‐effective and realistic potential to successfully apply CCS retrofits will be significantly lower, as illustrated in Figure 1. The focus of this study is on specifying the theoretical potential for CCS retrofit, and providing an approximation of the magnitude of upper limit estimates for the technical and cost‐effective potential. Due to the complexity of the assessment and lack of site‐specific data on a global level, assessing the actual realistic potential for CCS retrofit is beyond the scope of the study.
Figure 1 • Definitions of retrofit potential
Even on a plant level, it is a highly complex task to assess the technical and economical viability as well as the social acceptability of a specific retrofit project. Hence any attempt to extrapolate a site‐specific analysis to the globally installed power plant fleet in order to quantify a realistic potential for retrofitting CCS to power plants globally or even within a wider region is not feasible.
• All operating power plants
• CO2 storage and transport availability
• Space for equipment• Access to utilities• Flue gas pollutants treatment requirements
• Size of unit• Age of unit• Performance of unit• …
• Public acceptance• Power market conditions and
competitiveness• Regulatory framework
• …
Theoretical Technical &Cost‐effective
Realistic
Potential for CCS Retrofit Considering site‐
specific technical & economical constraints
Considering additionalconstraints
CCS Retrofit – Analysis of the Globally Installed Coal‐Fired Power Plant Fleet © OECD/IEA 2012
Page | 10
Key findings from literature
Many publications have analysed CCS retrofitting of coal‐fired power plants, such as the recent comprehensive study by the IEA Greenhouse Gas Implementing Agreement (IEAGHG, 2011). This study provides very useful technical background information and an overview of the related relevant literature that was published over the last years.
Global energy scenarios suggest that CCS retrofit is a necessity for deep CO2 emission cuts, in addition to constructing new power plants with CCS. Most studies, however, agree with conclusions from an earlier assessment by the International Panel on Climate Change (IPCC) in 2005 that states: “Retrofitting existing plants with CO2 capture is expected to lead to higher costs and significantly reduced overall efficiencies than for newly built power plants with capture. The cost disadvantages of retrofitting may be reduced in the case of some relatively new and highly efficient existing plants or where a plant is substantially upgraded or rebuilt” (IPCC, 2005). The same report lists some additional disadvantages of CCS retrofits, depending on the type of the existing power plant, such as:
Potential site‐specific constraints, such as lack of availability of land for the capture equipment;
In comparison to new‐build power plants, reduced remaining plant life of the power plant, if not upgraded or retrofitted. A long plant life would be beneficial for justifying the large expense of installing capture equipment;
Tendency to have low efficiencies and, consequently, a proportionally greater impact on the net output than in high efficiency plants.
In order to minimise site‐specific constraints, it has been proposed that new plants be built “CCS‐ready” to reduce these and other disadvantages apparent when CCS retrofitting an already operational plant. This concept is an important option for not further “locking‐in” CO2 emissions from power plants that will be built in the near future. In terms of the current global coal‐fired power fleet, the number of plants that have been already designed “CCS‐ready” is, however, very low.
Another relatively recent publication underlined the advantages of preferring modern power plants for retrofitting CCS. Summary notes of a workshop on retrofitting CCS held at the Massachusetts Institute of Technology (MIT) in 2009 conclude that: “relatively large (300 MWe or greater), high efficiency coal plants with installed FGD [flue gas desulphurization] and SCR [selective catalytic reduction] capability are the best candidates for CCS retrofit. By contrast, retrofit is not attractive for old, lower efficiency, smaller, subcritical units. Rebuilding or repowering is an option depending on significant CO2 prices being in place.” (MIT, 2009). As a general finding from the workshop, “cost‐effective retrofits for carbon capture are most suitable for newer, larger plants. ‘Nth’ plant CO2 avoidance costs for supercritical plants are significantly lower than those for subcritical plants.” Analysis by EPRI that was presented at the same workshop concludes that “cost‐effective retrofits for carbon capture are most suitable for boilers that are “300 MW or larger and less than about 35 years old.”
The detailed study by IEAGHG from 2011 in general supports the statement that “CCS retrofits to plants with lower efficiencies will tend to have higher generation costs and so are generally less likely to be competitive with new build CCS replacements” (IEAGHG, 2011). Costs of CCS per tonne of CO2 captured are found likely somewhat higher for retrofitted plants. However, the study emphasizes “the strong effect of other site‐specific factors on retrofit generation costs makes a definite minimum efficiency threshold for retrofitting inappropriate”. The study actually identifies a range of conditions under which costs of electricity may even look more favourable
© OECD/IEA 2012 CCS Retrofit – Analysis of the Globally Installed Coal‐Fired Power Plant Fleet
Page | 11
for power plants with retrofitted CCS, compared to new‐build power plants with CCS. For the specific set of parameter assumptions chosen in this study, the threshold lower heating value (LHV) efficiency below which retrofit on coal plants would become unattractive was found to be in the region of 35% (about 33% efficiency in terms of higher heating value (HHV)).
Another detailed study on the potential of CCS retrofitting the currently operating coal‐fired power plant fleet in the United States was performed by the US National Energy Technology Laboratory (NETL, 2011). Parameters used by NETL for screening and singling‐out power plants that are not amenable to CO2 capture retrofit included those that:
are not currently operating;
have a capacity less than 100 MW;
have a 2008 reported heat rate greater than 12500 Btu/kWh (HHV) or about 29% efficiency (LHV);
do not have a defined CO2 repository within 25 miles (40 kilometres).
Information available from global databases
Based on the findings from literature that are summarised above, this study uses data from the WEPP database organised in a way that illustrates the profile of the globally installed coal power fleet in different relevant dimensions. These dimensions include a breakdown in terms of:
Size, which is the nameplate power generation capacity in MW:
up to 100 MW net electric power output,
between 100 and 500 MW net electric power output, broken down in steps of 100,
above 500 MW net electric power output;
Age, which is the year of first operation, grouping the results into 5 year intervals;
Performance level, differentiating between sub‐, super‐ or ultra‐supercritical steam parameters.
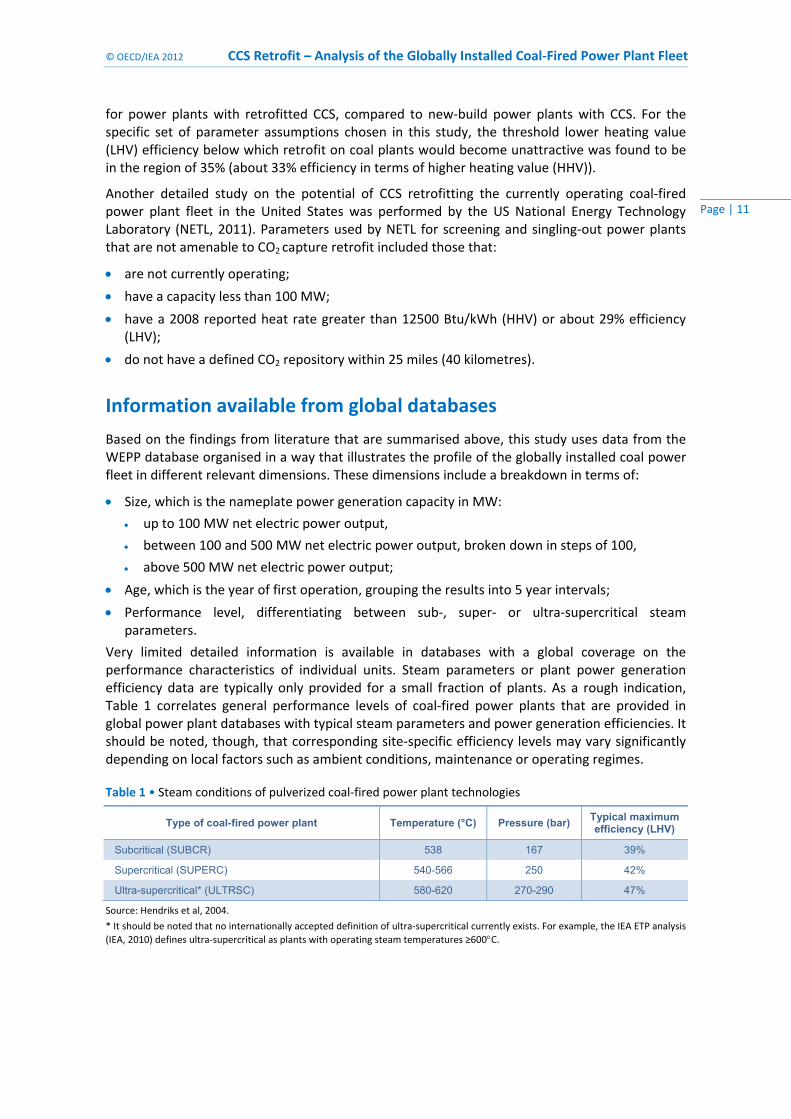
Very limited detailed information is available in databases with a global coverage on the performance characteristics of individual units. Steam parameters or plant power generation efficiency data are typically only provided for a small fraction of plants. As a rough indication, Table 1 correlates general performance levels of coal‐fired power plants that are provided in global power plant databases with typical steam parameters and power generation efficiencies. It should be noted, though, that corresponding site‐specific efficiency levels may vary significantly depending on local factors such as ambient conditions, maintenance or operating regimes.
Table 1 • Steam conditions of pulverized coal‐fired power plant technologies
Type of coal-fired power plant Temperature (°C) Pressure (bar) Typical maximum efficiency (LHV)
Subcritical (SUBCR) 538 167 39%
Supercritical (SUPERC) 540-566 250 42%
Ultra-supercritical* (ULTRSC) 580-620 270-290 47%
Source: Hendriks et al, 2004.
* It should be noted that no internationally accepted definition of ultra‐supercritical currently exists. For example, the IEA ETP analysis
(IEA, 2010) defines ultra‐supercritical as plants with operating steam temperatures ≥600C.
CCS Retrofit – Analysis of the Globally Installed Coal‐Fired Power Plant Fleet © OECD/IEA 2012
Page | 12
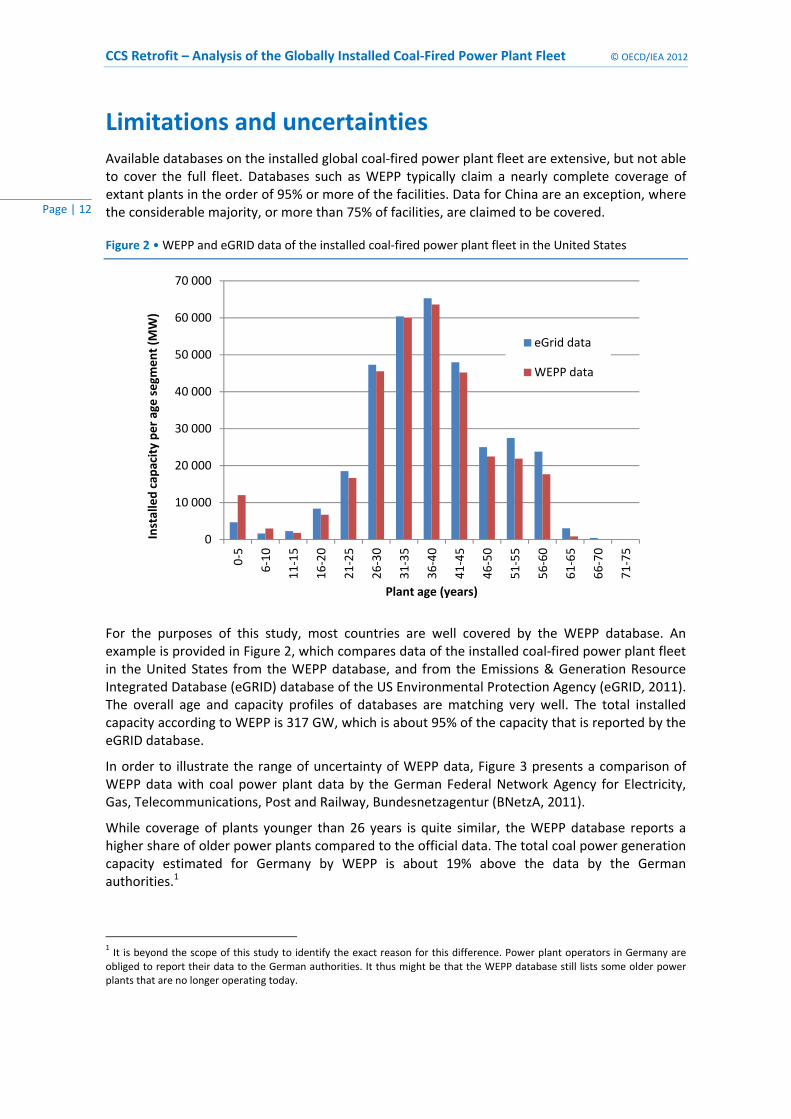
Limitations and uncertainties Available databases on the installed global coal‐fired power plant fleet are extensive, but not able to cover the full fleet. Databases such as WEPP typically claim a nearly complete coverage of extant plants in the order of 95% or more of the facilities. Data for China are an exception, where the considerable majority, or more than 75% of facilities, are claimed to be covered.
Figure 2 • WEPP and eGRID data of the installed coal‐fired power plant fleet in the United States
For the purposes of this study, most countries are well covered by the WEPP database. An example is provided in Figure 2, which compares data of the installed coal‐fired power plant fleet in the United States from the WEPP database, and from the Emissions & Generation Resource Integrated Database (eGRID) database of the US Environmental Protection Agency (eGRID, 2011). The overall age and capacity profiles of databases are matching very well. The total installed capacity according to WEPP is 317 GW, which is about 95% of the capacity that is reported by the eGRID database.
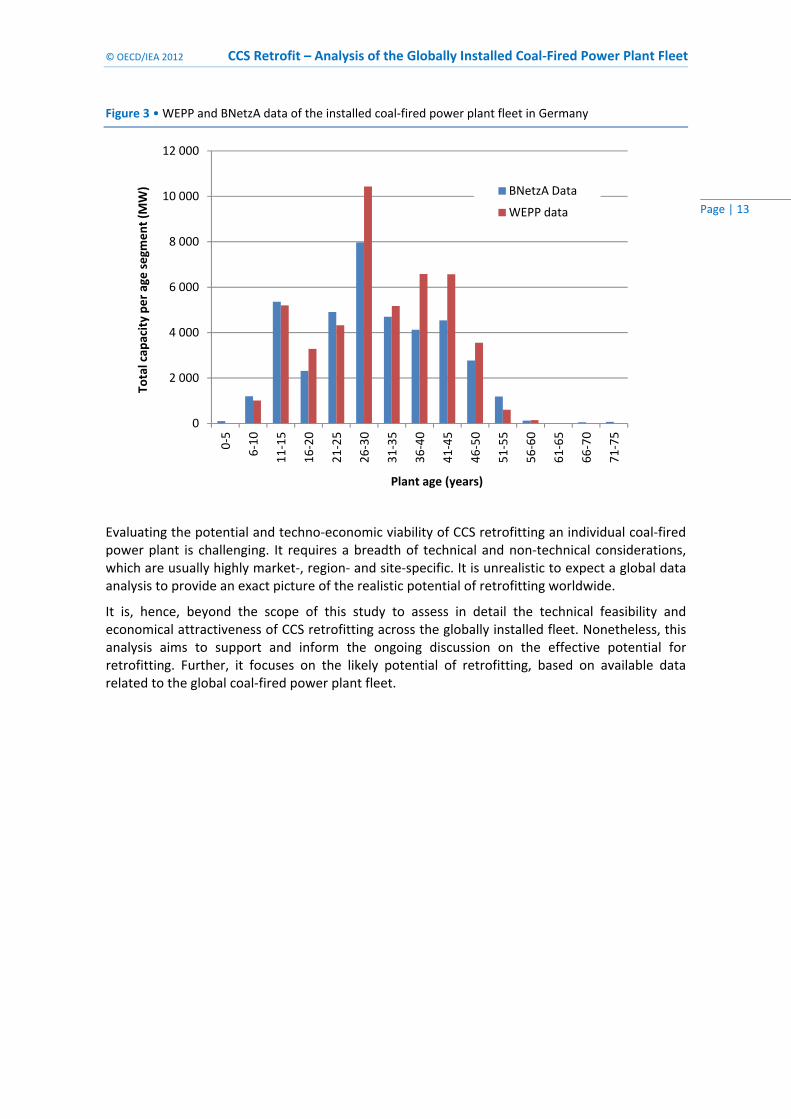
In order to illustrate the range of uncertainty of WEPP data, Figure 3 presents a comparison of WEPP data with coal power plant data by the German Federal Network Agency for Electricity, Gas, Telecommunications, Post and Railway, Bundesnetzagentur (BNetzA, 2011).
While coverage of plants younger than 26 years is quite similar, the WEPP database reports a higher share of older power plants compared to the official data. The total coal power generation capacity estimated for Germany by WEPP is about 19% above the data by the German authorities.1
1 It is beyond the scope of this study to identify the exact reason for this difference. Power plant operators in Germany are obliged to report their data to the German authorities. It thus might be that the WEPP database still lists some older power plants that are no longer operating today.
0
10 000
20 000
30 000
40 000
50 000
60 000
70 000
0‐5
6‐10
11‐15
16‐20
21‐25
26‐30
31‐35
36‐40
41‐45
46‐50
51‐55
56‐60
61‐65
66‐70
71‐75
Installed cap
acity per age segm
ent (M
W)
Plant age (years)
eGrid data
WEPP data
© OECD/IEA 2012 CCS Retrofit – Analysis of the Globally Installed Coal‐Fired Power Plant Fleet
Page | 13
Figure 3 • WEPP and BNetzA data of the installed coal‐fired power plant fleet in Germany
Evaluating the potential and techno‐economic viability of CCS retrofitting an individual coal‐fired power plant is challenging. It requires a breadth of technical and non‐technical considerations, which are usually highly market‐, region‐ and site‐specific. It is unrealistic to expect a global data analysis to provide an exact picture of the realistic potential of retrofitting worldwide.
It is, hence, beyond the scope of this study to assess in detail the technical feasibility and economical attractiveness of CCS retrofitting across the globally installed fleet. Nonetheless, this analysis aims to support and inform the ongoing discussion on the effective potential for retrofitting. Further, it focuses on the likely potential of retrofitting, based on available data related to the global coal‐fired power plant fleet.
0
2 000
4 000
6 000
8 000
10 000
12 000
0‐5
6‐10
11‐15
16‐20
21‐25
26‐30
31‐35
36‐40
41‐45
46‐50
51‐55
56‐60
61‐65
66‐70
71‐75
Total cap
acity per age segm
ent (M
W)
Plant age (years)
BNetzA Data
WEPP data
CCS Retrofit – Analysis of the Globally Installed Coal‐Fired Power Plant Fleet © OECD/IEA 2012
Page | 14
Analysis of the globally installed fleet This chapter presents results of the analysis of the global coal‐fired power plant fleet based on the WEPP database and IEA statistics. All data presented in this study consider only installed coal‐fired power plants currently in operation. Power plants that are either under construction or have been mothballed, retired or shutdown also exist, but are not present in this study. Although data are referred to as power plant data throughout the document, the underlying data are based on individual power generation units (“blocks”).
Global profile of the installed coal‐fired power plant fleet
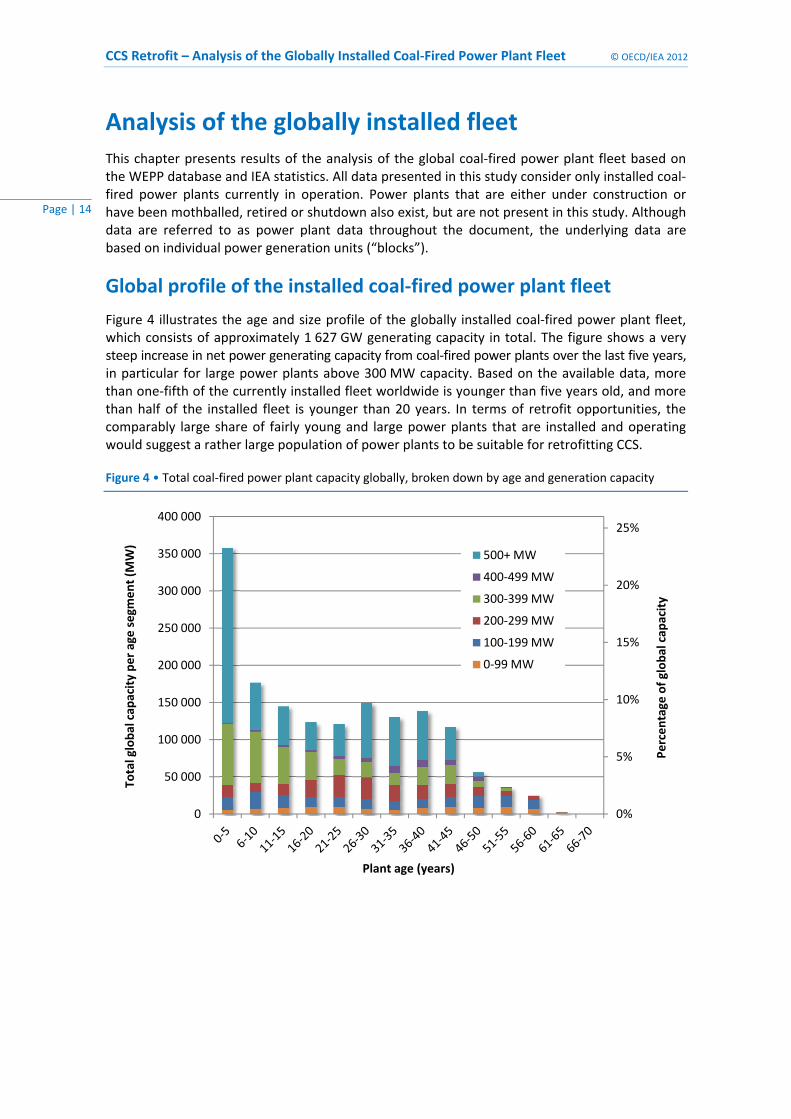
Figure 4 illustrates the age and size profile of the globally installed coal‐fired power plant fleet, which consists of approximately 1 627 GW generating capacity in total. The figure shows a very steep increase in net power generating capacity from coal‐fired power plants over the last five years, in particular for large power plants above 300 MW capacity. Based on the available data, more than one‐fifth of the currently installed fleet worldwide is younger than five years old, and more than half of the installed fleet is younger than 20 years. In terms of retrofit opportunities, the comparably large share of fairly young and large power plants that are installed and operating would suggest a rather large population of power plants to be suitable for retrofitting CCS.
Figure 4 • Total coal‐fired power plant capacity globally, broken down by age and generation capacity
0%
5%
10%
15%
20%
25%
0
50 000
100 000
150 000
200 000
250 000
300 000
350 000
400 000
Percentage
of global cap
acity
Total global cap
acity per age segm
ent (M
W)
Plant age (years)
500+ MW
400‐499 MW
300‐399 MW
200‐299 MW
100‐199 MW
0‐99 MW
© OECD/IEA 2012 CCS Retrofit – Analysis of the Globally Installed Coal‐Fired Power Plant Fleet
Page | 15
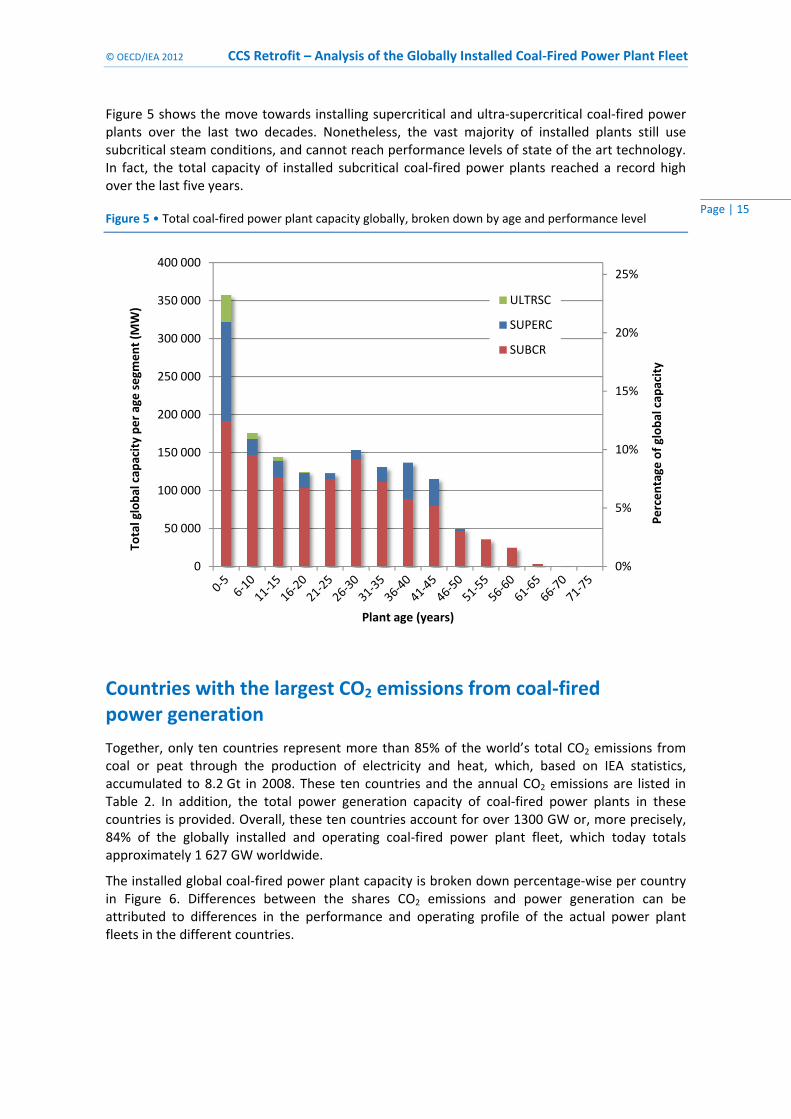
Figure 5 shows the move towards installing supercritical and ultra‐supercritical coal‐fired power plants over the last two decades. Nonetheless, the vast majority of installed plants still use subcritical steam conditions, and cannot reach performance levels of state of the art technology. In fact, the total capacity of installed subcritical coal‐fired power plants reached a record high over the last five years.
Figure 5 • Total coal‐fired power plant capacity globally, broken down by age and performance level
Countries with the largest CO2 emissions from coal‐fired power generation
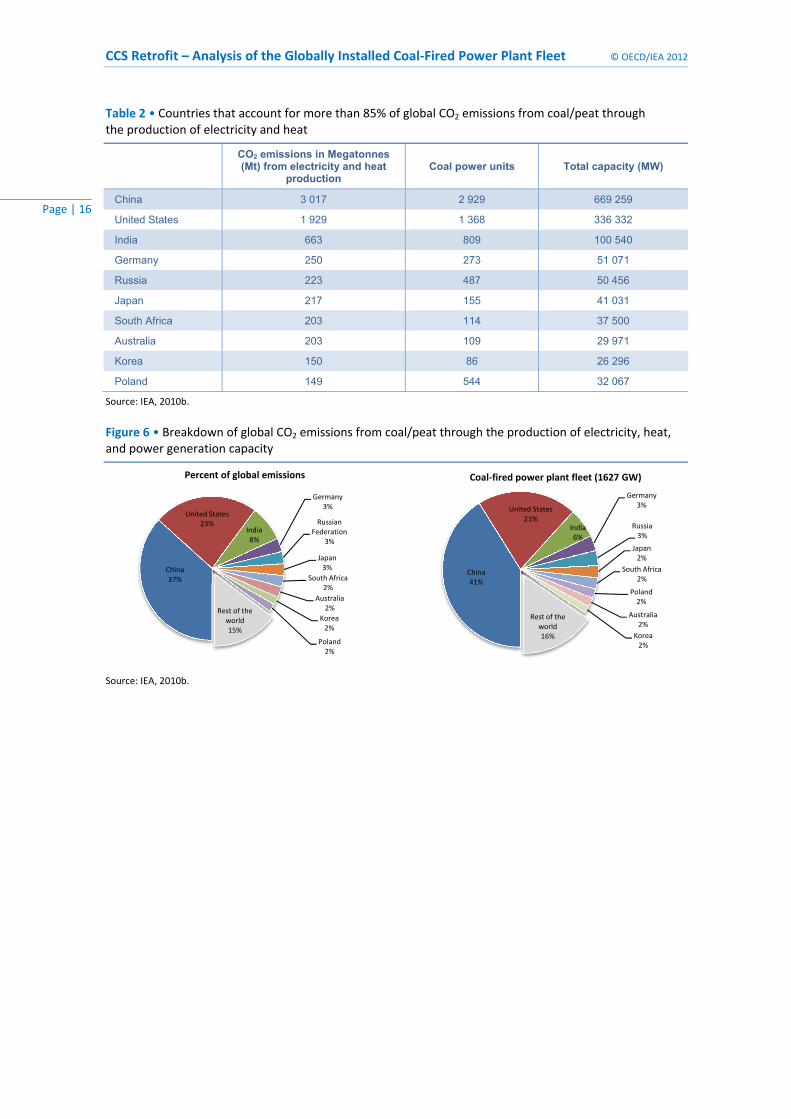
Together, only ten countries represent more than 85% of the world’s total CO2 emissions from coal or peat through the production of electricity and heat, which, based on IEA statistics, accumulated to 8.2 Gt in 2008. These ten countries and the annual CO2 emissions are listed in Table 2. In addition, the total power generation capacity of coal‐fired power plants in these countries is provided. Overall, these ten countries account for over 1300 GW or, more precisely, 84% of the globally installed and operating coal‐fired power plant fleet, which today totals approximately 1 627 GW worldwide.
The installed global coal‐fired power plant capacity is broken down percentage‐wise per country in Figure 6. Differences between the shares CO2 emissions and power generation can be attributed to differences in the performance and operating profile of the actual power plant fleets in the different countries.
0%
5%
10%
15%
20%
25%
0
50 000
100 000
150 000
200 000
250 000
300 000
350 000
400 000
Percentage
of global cap
acity
Total global cap
acity per age segm
ent (M
W)
Plant age (years)
ULTRSC
SUPERC
SUBCR
CCS Retrofit – Analysis of the Globally Installed Coal‐Fired Power Plant Fleet © OECD/IEA 2012
Page | 16
Table 2 • Countries that account for more than 85% of global CO2 emissions from coal/peat through the production of electricity and heat
CO2 emissions in Megatonnes (Mt) from electricity and heat
production Coal power units Total capacity (MW)
China 3 017 2 929 669 259
United States 1 929 1 368 336 332
India 663 809 100 540
Germany 250 273 51 071
Russia 223 487 50 456
Japan 217 155 41 031
South Africa 203 114 37 500
Australia 203 109 29 971
Korea 150 86 26 296
Poland 149 544 32 067
Source: IEA, 2010b.
Figure 6 • Breakdown of global CO2 emissions from coal/peat through the production of electricity, heat, and power generation capacity
Source: IEA, 2010b.
China37%
United States23%
India8%
Germany3%
Russian Federation
3%
Japan3%
South Africa2%
Australia2%
Korea2%
Poland2%
Rest of the world15%
Percent of global emissions
China41%
United States21%
India6%
Germany3%
Russia3%
Japan2%
South Africa2%
Poland2%
Australia2%
Korea2%
Rest of the world16%
Coal‐fired power plant fleet (1627 GW)
© OECD/IEA 2012 CCS Retrofit – Analysis of the Globally Installed Coal‐Fired Power Plant Fleet
Page | 17
Case analyses This study illustrates the potential size of the globally installed coal‐fired power plant fleet that could be most attractive for considering CCS retrofit.
Results for different global case analyses are presented assuming certain minimum requirements related to three dimensions: 1) generating capacity, 2) plant age, and 3) performance level. While these results only indicate quantities of the theoretical potential of CCS retrofitting, they nonetheless provide the reader with an idea of the order of magnitude and potential, while providing guidance on which geographic regions are most attractive for further follow‐up analysis.
For the purpose of this study, three CCS retrofit cases are chosen:
Case 1: Plants considered attractive for CCS retrofit that are younger than 30 years and have a power generation capacity above 100 MW;
Case 2: Plants considered attractive for CCS retrofit that are younger than 20 years and have a power generation capacity above 300 MW;
Case 3: Plants considered attractive for CCS retrofit that are younger than 10 years and have a power generation capacity above 300 MW.
The parameter limits for the three cases are derived from findings from site‐specific studies, as outlined earlier, and should not be construed as having any other legitimacy beyond this. The levels for generating capacity, age, and performance level are best estimates and intended to support the reader’s own judgement on realistic potential for CCS retrofitting.
All cases are based on only two high‐level criteria related to the age and capacity level of the operating coal‐fired power plants covered in the used databases. Any further site‐specific considerations, such as availability of space for retrofit, technical possibility to retrofit, access to cost‐effective, sufficient CO2 transportation and storage infrastructure, economic attractiveness, sufficient legislative support and social acceptance are beyond the scope of this study. These considerations will, however, likely to lead to a significant reduction in the actual potential to realize CCS retrofitting.
Results from previous studies can provide a first impression on how the population of potentially attractive coal‐fired power plants is impacted by considering additional parameters.
For example, a recent study by NETL (NETL, 2011) analysed the population of coal power plants that are attractive for retrofit was reduced by 13% when considering if a potential CO2 sequestration target was within 25 miles (40 km) distance.
In addition, a detailed study of the CCS retrofitting potential in China concluded that – by number of sites above 1 000 MW installed capacity – only 19% appear to have a high retrofit potential (Li, 2010). The potential for 35% of the analysed sites remained uncertain, while 43% of the sites were considered not suitable for CCS retrofitting.
CCS Retrofit – Analysis of the Globally Installed Coal‐Fired Power Plant Fleet © OECD/IEA 2012
Page | 18
Impact of minimum power plant size and age on plant population
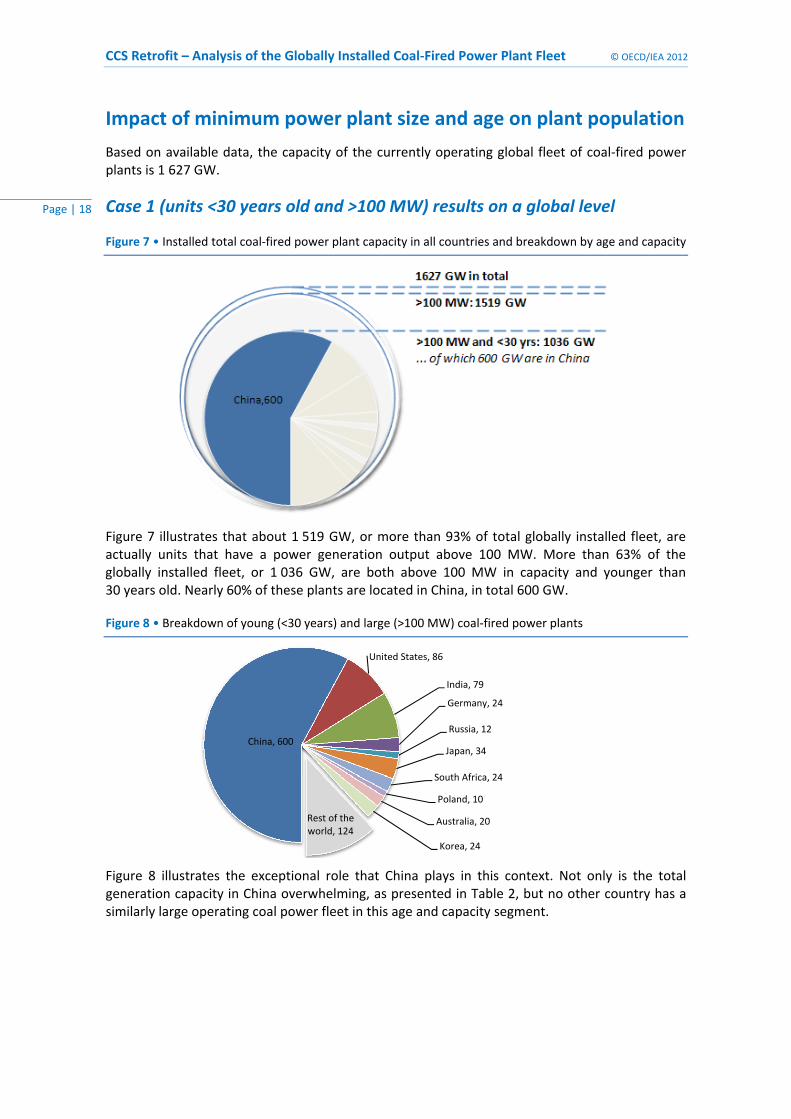
Based on available data, the capacity of the currently operating global fleet of coal‐fired power plants is 1 627 GW.
Case 1 (units <30 years old and >100 MW) results on a global level
Figure 7 • Installed total coal‐fired power plant capacity in all countries and breakdown by age and capacity
Figure 7 illustrates that about 1 519 GW, or more than 93% of total globally installed fleet, are actually units that have a power generation output above 100 MW. More than 63% of the globally installed fleet, or 1 036 GW, are both above 100 MW in capacity and younger than 30 years old. Nearly 60% of these plants are located in China, in total 600 GW.
Figure 8 • Breakdown of young (<30 years) and large (>100 MW) coal‐fired power plants
Figure 8 illustrates the exceptional role that China plays in this context. Not only is the total generation capacity in China overwhelming, as presented in Table 2, but no other country has a similarly large operating coal power fleet in this age and capacity segment.
China, 600
United States, 86
India, 79
Germany, 24
Russia, 12
Japan, 34
South Africa, 24
Poland, 10
Australia, 20
Korea, 24
Rest of the world, 124
© OECD/IEA 2012 CCS Retrofit – Analysis of the Globally Installed Coal‐Fired Power Plant Fleet
Page | 19
Case 2 (units <20 years old and >300 MW) results on a global level
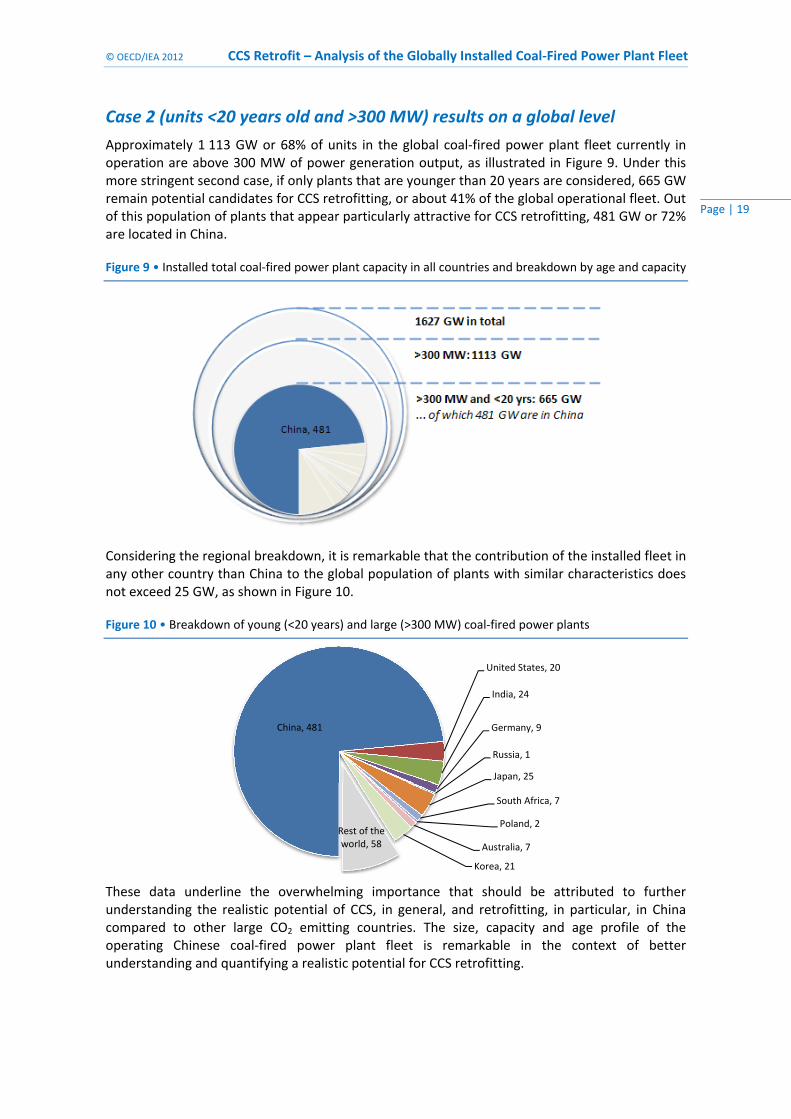
Approximately 1 113 GW or 68% of units in the global coal‐fired power plant fleet currently in operation are above 300 MW of power generation output, as illustrated in Figure 9. Under this more stringent second case, if only plants that are younger than 20 years are considered, 665 GW remain potential candidates for CCS retrofitting, or about 41% of the global operational fleet. Out of this population of plants that appear particularly attractive for CCS retrofitting, 481 GW or 72% are located in China.
Figure 9 • Installed total coal‐fired power plant capacity in all countries and breakdown by age and capacity
Considering the regional breakdown, it is remarkable that the contribution of the installed fleet in any other country than China to the global population of plants with similar characteristics does not exceed 25 GW, as shown in Figure 10.
Figure 10 • Breakdown of young (<20 years) and large (>300 MW) coal‐fired power plants
These data underline the overwhelming importance that should be attributed to further understanding the realistic potential of CCS, in general, and retrofitting, in particular, in China compared to other large CO2 emitting countries. The size, capacity and age profile of the operating Chinese coal‐fired power plant fleet is remarkable in the context of better understanding and quantifying a realistic potential for CCS retrofitting.
China, 481
United States, 20
India, 24
Germany, 9
Russia, 1
Japan, 25
South Africa, 7
Poland, 2
Australia, 7
Korea, 21
Rest of the world, 58
CCS Retrofit – Analysis of the Globally Installed Coal‐Fired Power Plant Fleet © OECD/IEA 2012
Page | 20
Case 3 (units <10 years old and >300 MW) results on a global level
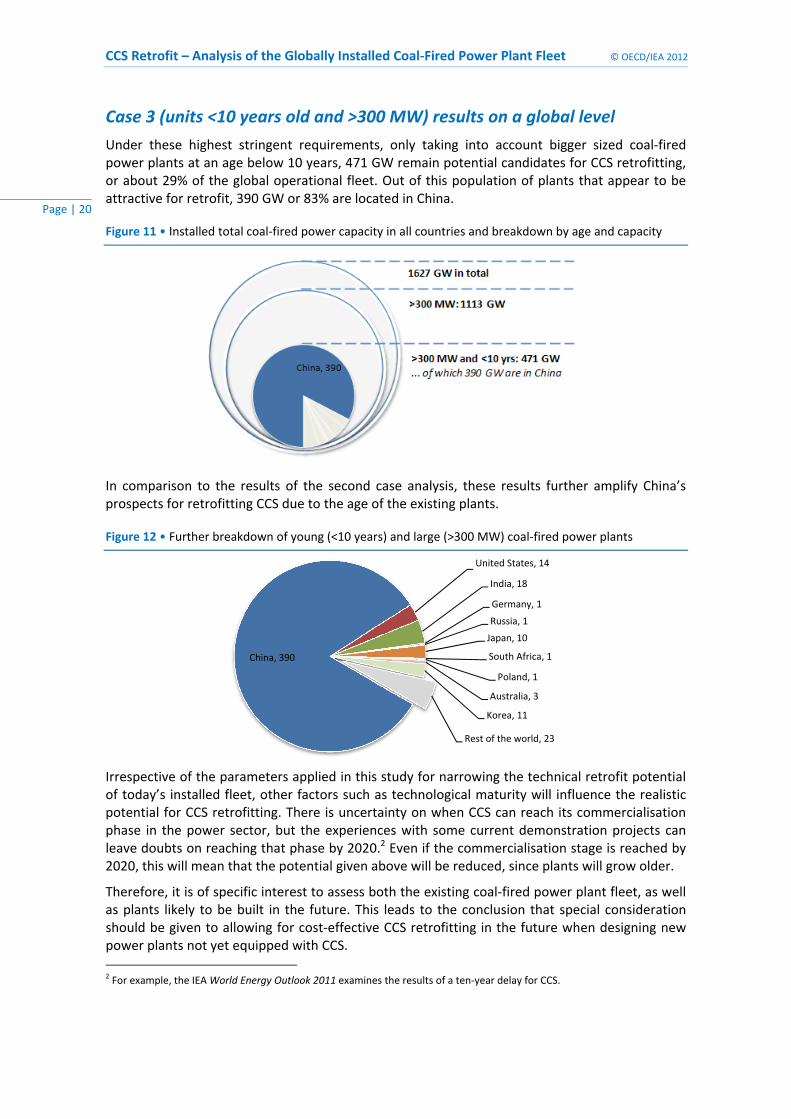
Under these highest stringent requirements, only taking into account bigger sized coal‐fired power plants at an age below 10 years, 471 GW remain potential candidates for CCS retrofitting, or about 29% of the global operational fleet. Out of this population of plants that appear to be attractive for retrofit, 390 GW or 83% are located in China.
Figure 11 • Installed total coal‐fired power capacity in all countries and breakdown by age and capacity
In comparison to the results of the second case analysis, these results further amplify China’s prospects for retrofitting CCS due to the age of the existing plants.
Figure 12 • Further breakdown of young (<10 years) and large (>300 MW) coal‐fired power plants
Irrespective of the parameters applied in this study for narrowing the technical retrofit potential of today’s installed fleet, other factors such as technological maturity will influence the realistic potential for CCS retrofitting. There is uncertainty on when CCS can reach its commercialisation phase in the power sector, but the experiences with some current demonstration projects can leave doubts on reaching that phase by 2020.2 Even if the commercialisation stage is reached by 2020, this will mean that the potential given above will be reduced, since plants will grow older.
Therefore, it is of specific interest to assess both the existing coal‐fired power plant fleet, as well as plants likely to be built in the future. This leads to the conclusion that special consideration should be given to allowing for cost‐effective CCS retrofitting in the future when designing new power plants not yet equipped with CCS. 2 For example, the IEA World Energy Outlook 2011 examines the results of a ten‐year delay for CCS.
China, 390
United States, 14
India, 18
Germany, 1
Russia, 1
Japan, 10
South Africa, 1
Poland, 1
Australia, 3
Korea, 11
Rest of the world, 23
© OECD/IEA 2012 CCS Retrofit – Analysis of the Globally Installed Coal‐Fired Power Plant Fleet
Page | 21
Analysis for major CO2 emitting countries This chapter presents a more detailed breakdown of the operating coal‐fired power plant fleet in those ten countries that account for more than 85% of the world’s CO2 emissions from coal power generation.
China
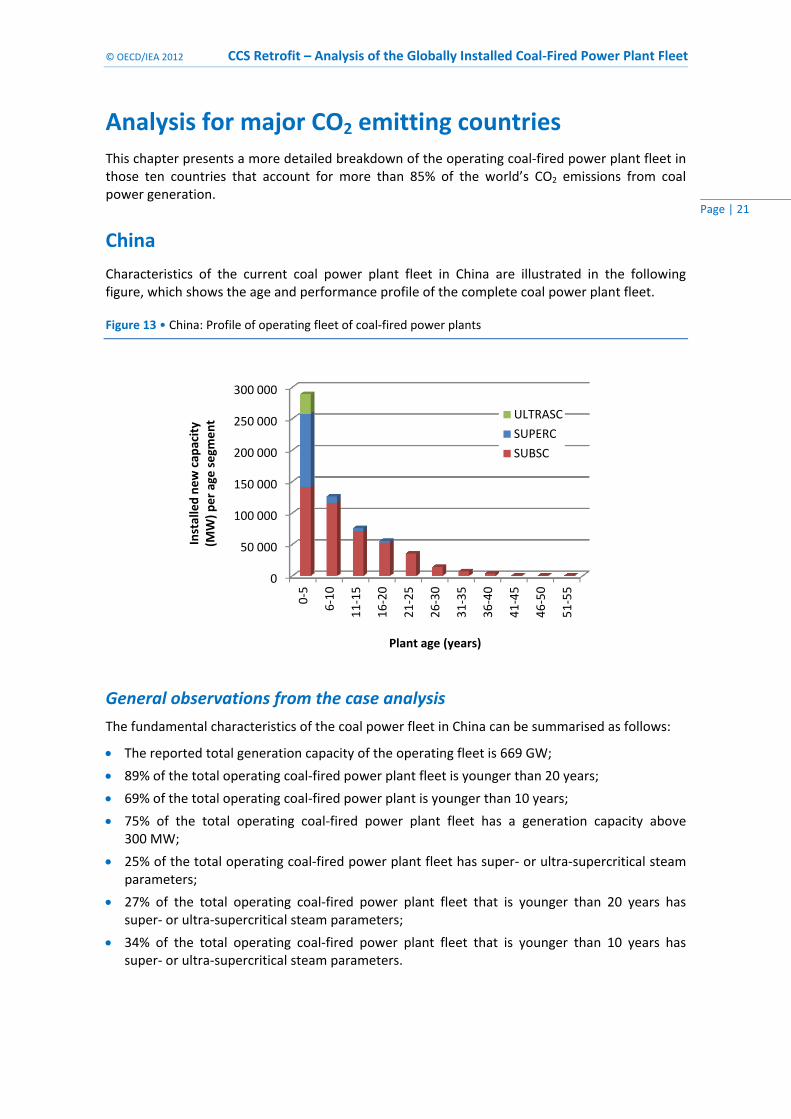
Characteristics of the current coal power plant fleet in China are illustrated in the following figure, which shows the age and performance profile of the complete coal power plant fleet.
Figure 13 • China: Profile of operating fleet of coal‐fired power plants
General observations from the case analysis
The fundamental characteristics of the coal power fleet in China can be summarised as follows:
The reported total generation capacity of the operating fleet is 669 GW;
89% of the total operating coal‐fired power plant fleet is younger than 20 years;
69% of the total operating coal‐fired power plant is younger than 10 years;
75% of the total operating coal‐fired power plant fleet has a generation capacity above 300 MW;
25% of the total operating coal‐fired power plant fleet has super‐ or ultra‐supercritical steam parameters;
27% of the total operating coal‐fired power plant fleet that is younger than 20 years has super‐ or ultra‐supercritical steam parameters;
34% of the total operating coal‐fired power plant fleet that is younger than 10 years has super‐ or ultra‐supercritical steam parameters.
0
50 000
100 000
150 000
200 000
250 000
300 000
0‐5
6‐10
11‐15
16‐20
21‐25
26‐30
31‐35
36‐40
41‐45
46‐50
51‐55
Installed new cap
acity
(MW) per age segm
ent
Plant age (years)
ULTRASC
SUPERC
SUBSC
CCS Retrofit – Analysis of the Globally Installed Coal‐Fired Power Plant Fleet © OECD/IEA 2012
Page | 22
Case 1 (power plants younger than 30 years and above 100 MW capacity): 90% of the total operating coal‐fired power plant fleet, or 600 GW;
Case 2 (power plants younger than 20 years and above 300 MW capacity): 72% of the total operating coal‐fired power plant fleet, or 481 GW;
Case 3 (power plants younger than 10 years and above 300 MW capacity): 58% of the total operating coal‐fired power plant fleet, or 390 GW.
Key country‐specific conclusions
China has clearly the largest coal‐fired power plant fleet installed in a single country. In addition, among the ten countries with the largest coal‐fired power generation capacity worldwide, China has by far the youngest fleet currently in operation. It is to be noted however that, of the 293 GW plant capacity installed over the last five years, almost 50% employed subcritical steam conditions.
Considering the large total operating capacity, the high average capacity of single units and the young age profile of the Chinese coal power fleet, it has by far the largest population of coal power generation units that should be considered attractive for CCS retrofitting.
Given the relatively recent, very steep, increase in capacity additions of coal‐fired power plants in China, it is incumbent on policy makers to analyse and consider the need to design new power plants CCS‐ready and, hence, avoid the future lock‐in of CO2 emissions.
United States of America
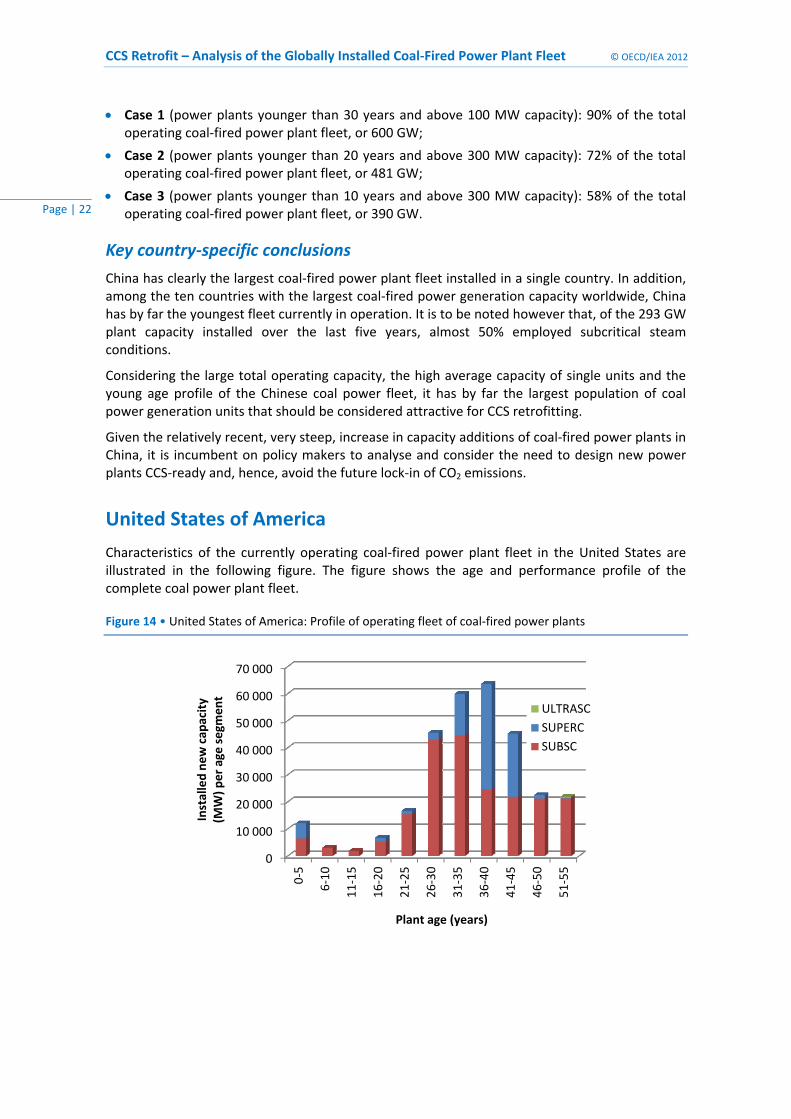
Characteristics of the currently operating coal‐fired power plant fleet in the United States are illustrated in the following figure. The figure shows the age and performance profile of the complete coal power plant fleet.
Figure 14 • United States of America: Profile of operating fleet of coal‐fired power plants
0
10 000
20 000
30 000
40 000
50 000
60 000
70 000
0‐5
6‐10
11‐15
16‐20
21‐25
26‐30
31‐35
36‐40
41‐45
46‐50
51‐55
Installed new cap
acity
(MW) per age segm
ent
Plant age (years)
ULTRASC
SUPERC
SUBSC
© OECD/IEA 2012 CCS Retrofit – Analysis of the Globally Installed Coal‐Fired Power Plant Fleet
Page | 23
General observations from the case analysis
The fundamental characteristics of the coal power fleet in the United States can be summarised as follows:
The reported total generation capacity of the operating coal‐fired power plant fleet is 336 GW;
8% of the total operating coal‐fired power plant fleet is younger than 20 years;
5% of the total operating coal‐fired power plant fleet is younger than 10 years;
74% of the total operating coal‐fired power plant fleet has a generation capacity above 300 MW;
27% of the total operating coal‐fired power plant fleet has super‐ or ultra‐supercritical steam parameters;
27% of the total operating coal‐fired power plant fleet that is younger than 20 years has super‐ or ultra‐supercritical steam parameters;
36% of the total operating coal‐fired power plant fleet that is younger than 10 years has super‐ or ultra‐supercritical steam parameters.
Case 1 (power plants younger than 30 years and above 100 MW capacity): 25% of the total operating coal‐fired power plant fleet, or 86 GW;
Case 2 (power plants younger than 20 years and above 300 MW capacity): 6% of the total operating coal‐fired power plant fleet, or 20 GW;
Case 3 (power plants younger than 10 years and above 300 MW capacity): 4% of the total operating coal‐fired power plant fleet, or 14 GW.
Key country‐specific conclusions
The coal‐fired power plant fleet in the United States is the second largest installed in a single country. Among the ten countries with the largest coal power generation capacity worldwide, the United States has the lowest share of power plants that are younger than 20 years old. The share of power generation units with a capacity above 300 MW is however comparatively high.3
India
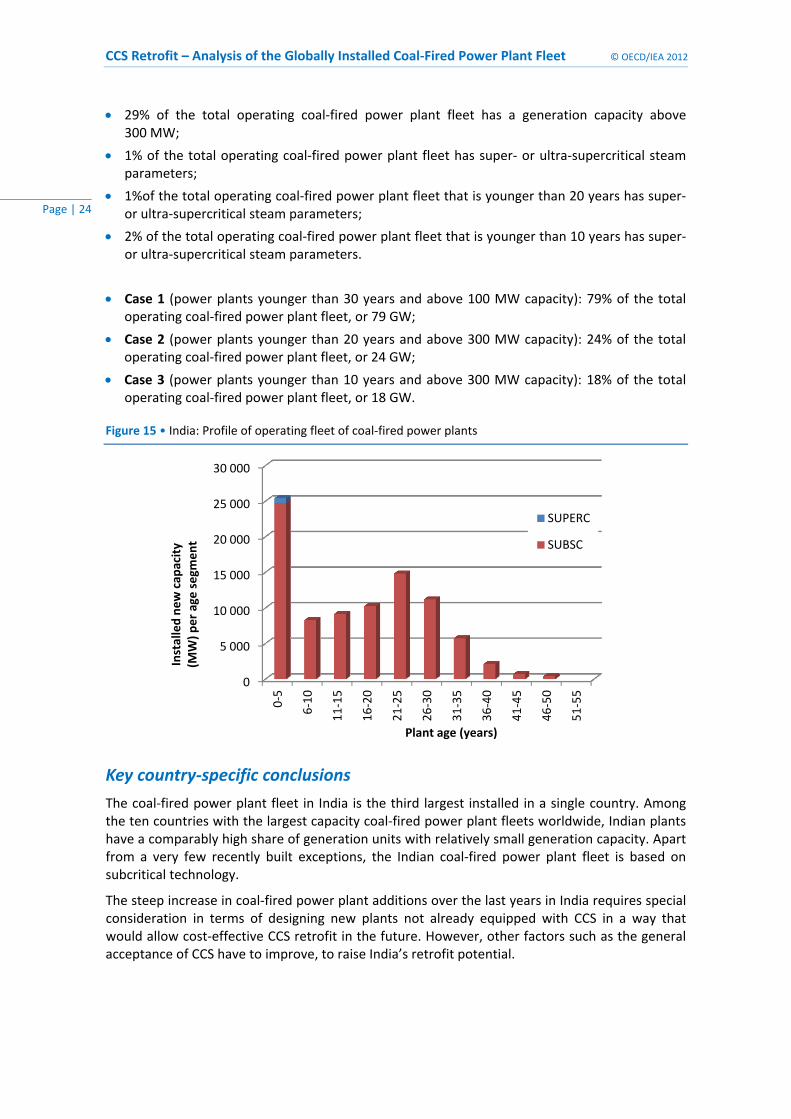
Characteristics of the currently operating coal power plant fleet in India are illustrated in the Figure 15 below. The figure shows the age and performance profile of the complete coal power plant fleet.
General observations from the case analysis
The fundamental characteristics of the coal power fleet in India can be summarised as follows:
The total operating coal‐fired power plant fleet has 101 GW of generation capacity;
57% of the total operating coal‐fired power plant fleet is younger than 20 years;
37% of the total operating coal‐fired power plant fleet is younger than 10 years; 3 The small share of very old ultra‐supercritical power plants in the United States represents likely the very first units of this technology that were under development at that time (a similar phenomenon can be found for Russia).
CCS Retrofit – Analysis of the Globally Installed Coal‐Fired Power Plant Fleet © OECD/IEA 2012
Page | 24
29% of the total operating coal‐fired power plant fleet has a generation capacity above 300 MW;
1% of the total operating coal‐fired power plant fleet has super‐ or ultra‐supercritical steam parameters;
1%of the total operating coal‐fired power plant fleet that is younger than 20 years has super‐ or ultra‐supercritical steam parameters;
2% of the total operating coal‐fired power plant fleet that is younger than 10 years has super‐ or ultra‐supercritical steam parameters.
Case 1 (power plants younger than 30 years and above 100 MW capacity): 79% of the total operating coal‐fired power plant fleet, or 79 GW;
Case 2 (power plants younger than 20 years and above 300 MW capacity): 24% of the total operating coal‐fired power plant fleet, or 24 GW;
Case 3 (power plants younger than 10 years and above 300 MW capacity): 18% of the total operating coal‐fired power plant fleet, or 18 GW.
Figure 15 • India: Profile of operating fleet of coal‐fired power plants
Key country‐specific conclusions
The coal‐fired power plant fleet in India is the third largest installed in a single country. Among the ten countries with the largest capacity coal‐fired power plant fleets worldwide, Indian plants have a comparably high share of generation units with relatively small generation capacity. Apart from a very few recently built exceptions, the Indian coal‐fired power plant fleet is based on subcritical technology.
The steep increase in coal‐fired power plant additions over the last years in India requires special consideration in terms of designing new plants not already equipped with CCS in a way that would allow cost‐effective CCS retrofit in the future. However, other factors such as the general acceptance of CCS have to improve, to raise India’s retrofit potential.
0
5 000
10 000
15 000
20 000
25 000
30 000
0‐5
6‐10
11‐15
16‐20
21‐25
26‐30
31‐35
36‐40
41‐45
46‐50
51‐55
Installed new cap
acity
(MW) per age segm
ent
Plant age (years)
SUPERC
SUBSC
© OECD/IEA 2012 CCS Retrofit – Analysis of the Globally Installed Coal‐Fired Power Plant Fleet
Page | 25
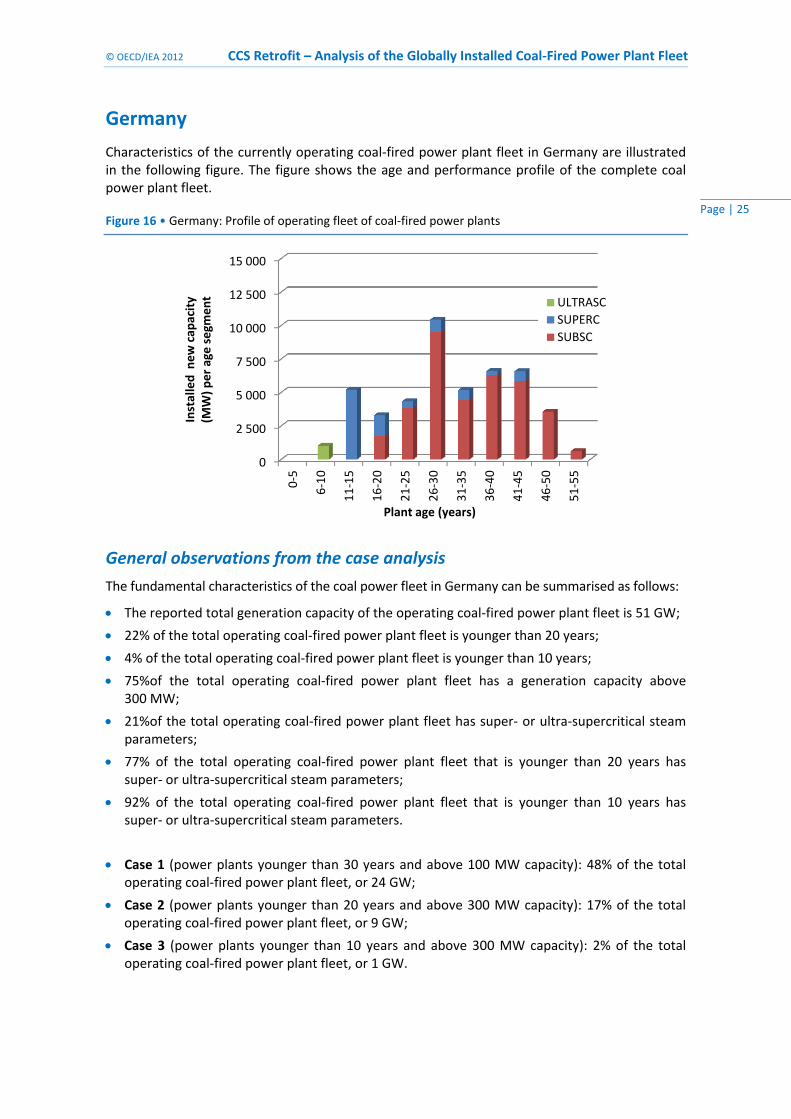
Germany
Characteristics of the currently operating coal‐fired power plant fleet in Germany are illustrated in the following figure. The figure shows the age and performance profile of the complete coal power plant fleet.
Figure 16 • Germany: Profile of operating fleet of coal‐fired power plants
General observations from the case analysis
The fundamental characteristics of the coal power fleet in Germany can be summarised as follows:
The reported total generation capacity of the operating coal‐fired power plant fleet is 51 GW;
22% of the total operating coal‐fired power plant fleet is younger than 20 years;
4% of the total operating coal‐fired power plant fleet is younger than 10 years;
75%of the total operating coal‐fired power plant fleet has a generation capacity above 300 MW;
21%of the total operating coal‐fired power plant fleet has super‐ or ultra‐supercritical steam parameters;
77% of the total operating coal‐fired power plant fleet that is younger than 20 years has super‐ or ultra‐supercritical steam parameters;
92% of the total operating coal‐fired power plant fleet that is younger than 10 years has super‐ or ultra‐supercritical steam parameters.
Case 1 (power plants younger than 30 years and above 100 MW capacity): 48% of the total operating coal‐fired power plant fleet, or 24 GW;
Case 2 (power plants younger than 20 years and above 300 MW capacity): 17% of the total operating coal‐fired power plant fleet, or 9 GW;
Case 3 (power plants younger than 10 years and above 300 MW capacity): 2% of the total operating coal‐fired power plant fleet, or 1 GW.
0
2 500
5 000
7 500
10 000
12 500
15 000
0‐5
6‐10
11‐15
16‐20
21‐25
26‐30
31‐35
36‐40
41‐45
46‐50
51‐55
Installed new cap
acity
(MW) per age segm
ent
Plant age (years)
ULTRASC
SUPERC
SUBSC
CCS Retrofit – Analysis of the Globally Installed Coal‐Fired Power Plant Fleet © OECD/IEA 2012
Page | 26
Key country‐specific conclusions
The fleet in Germany is the fourth largest coal‐fired power plant fleet installed in a single country. Based on WEPP data, four out of five of the coal‐fired power plants currently in operation in Germany are older than 20 years.4 Germany has a fairly high share of large coal‐fired power plant units.
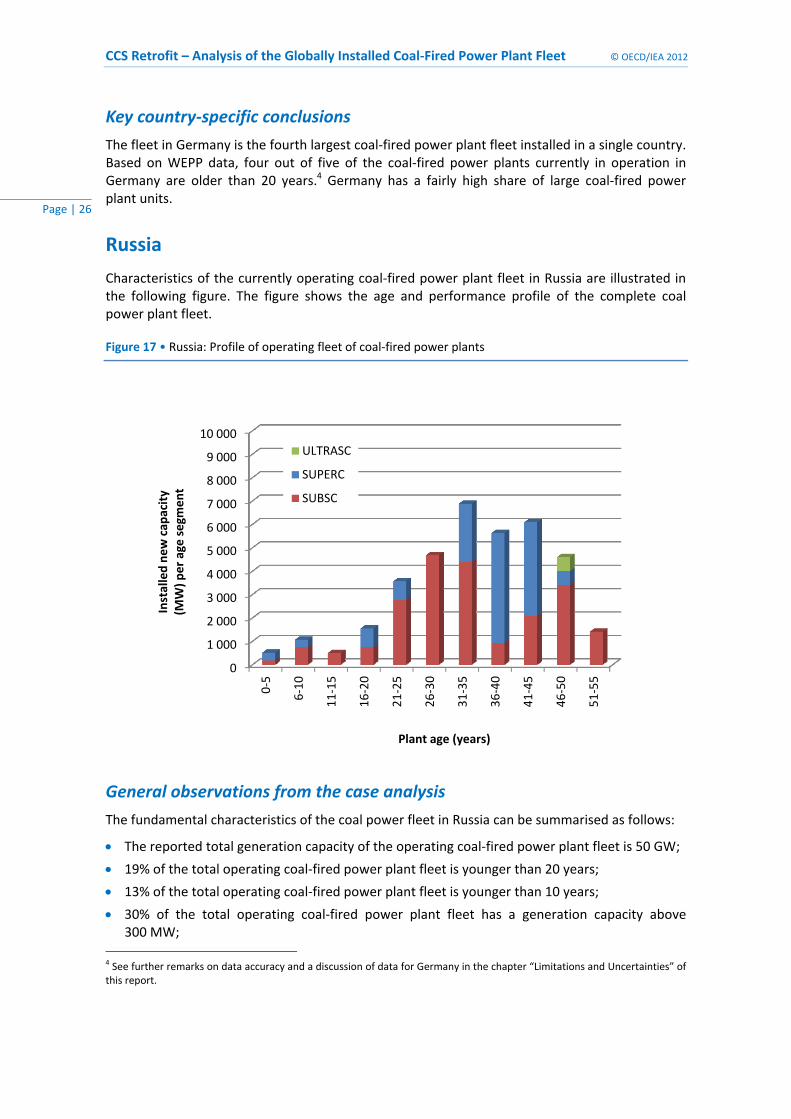
Russia
Characteristics of the currently operating coal‐fired power plant fleet in Russia are illustrated in the following figure. The figure shows the age and performance profile of the complete coal power plant fleet.
Figure 17 • Russia: Profile of operating fleet of coal‐fired power plants
General observations from the case analysis
The fundamental characteristics of the coal power fleet in Russia can be summarised as follows:
The reported total generation capacity of the operating coal‐fired power plant fleet is 50 GW;
19% of the total operating coal‐fired power plant fleet is younger than 20 years;
13% of the total operating coal‐fired power plant fleet is younger than 10 years;
30% of the total operating coal‐fired power plant fleet has a generation capacity above 300 MW;
4 See further remarks on data accuracy and a discussion of data for Germany in the chapter “Limitations and Uncertainties” of this report.
0
1 000
2 000
3 000
4 000
5 000
6 000
7 000
8 000
9 000
10 000
0‐5
6‐10
11‐15
16‐20
21‐25
26‐30
31‐35
36‐40
41‐45
46‐50
51‐55
Installed new cap
acity
(MW) per age segm
ent
Plant age (years)
ULTRASC
SUPERC
SUBSC
© OECD/IEA 2012 CCS Retrofit – Analysis of the Globally Installed Coal‐Fired Power Plant Fleet
Page | 27
29% of the total operating coal‐fired power plant fleet has super‐ or ultra‐supercritical steam parameters;
32% of the total operating coal‐fired power plant fleet that is younger than 20 years has super‐ or ultra‐supercritical steam parameters;
37% of the total operating coal‐fired power plant fleet that is younger than 10 years has super‐ or ultra‐supercritical steam parameters.
Case 1 (power plants younger than 30 years and above 100 MW capacity): 24% of the total operating coal‐fired power plant fleet, or 12 GW;
Case 2 (power plants younger than 20 years and above 300 MW capacity): 3% of the total operating coal‐fired power plant fleet, or 1.4 GW;
Case 3 (power plants younger than 10 years and above 300 MW capacity): 1% of the total operating coal‐fired power plant fleet, or 1 GW.
Key country‐specific conclusions
Russia has the fifth largest coal‐fired power plant fleet installed in a single country. Among the ten countries with the largest coal‐fired power generation worldwide, Russia is one of the countries with the lowest share of power plants that are younger than 20 years, and the lowest share of power plants that larger than 300 MW capacity.5
Japan
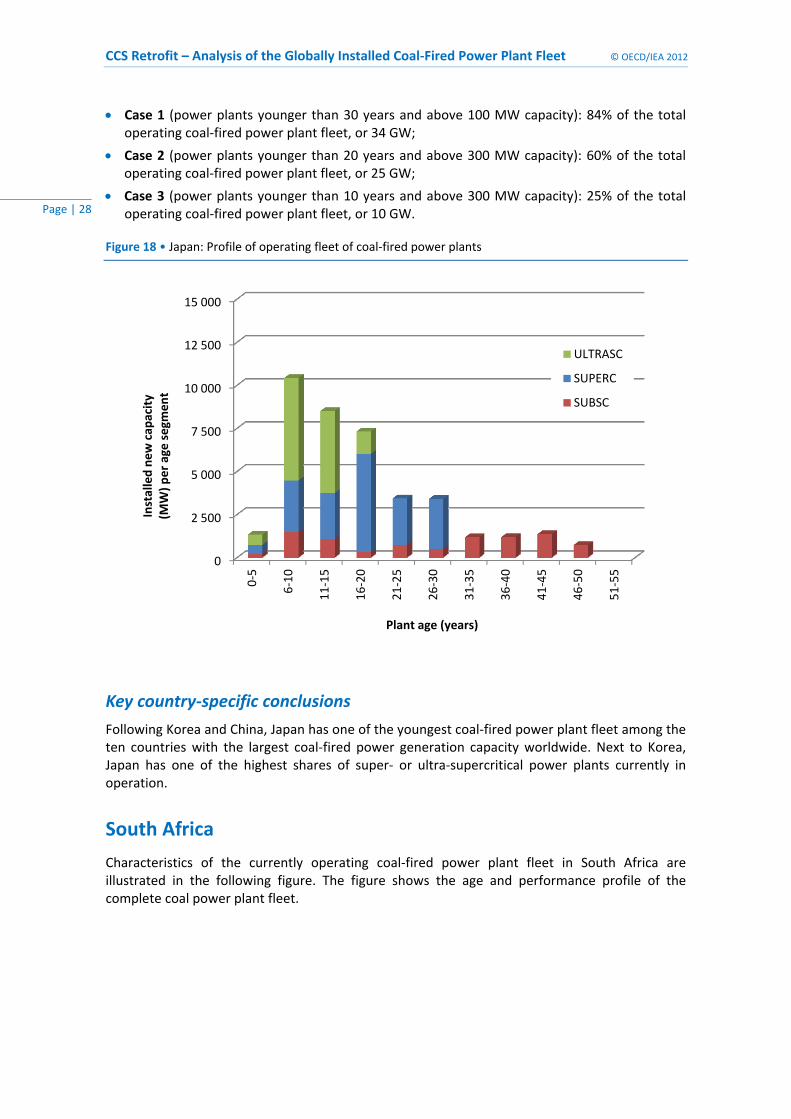
Characteristics of the currently operating coal‐fired power plant fleet in Japan are illustrated in the Figure 18 below. The figure shows the age and performance profile of the complete coal power plant fleet.
General observations from the case analysis
The fundamental characteristics of the coal power fleet in Japan can be summarised as follows:
The reported total generation capacity of the operating coal‐fired power plant fleet is 41 GW;
70% of the total operating coal‐fired power plant fleet is younger than 20 years;
30% of the total operating coal‐fired power plant fleet is younger than 10 years;
77% of the total operating coal‐fired power plant fleet has a generation capacity above 300 MW;
73% of the total operating coal‐fired power plant fleet has super‐ or ultra‐supercritical steam parameters;
86% of the total operating coal‐fired power plant fleet that is younger than 20 years has super‐ or ultra‐supercritical steam parameters;
83% of the total operating coal‐fired power plant fleet that is younger than 10 years has super‐ or ultra‐supercritical steam parameters.
5 The small share of very old ultra‐supercritical power plants in Russia represents likely the very first units of this technology that were under development at that time (a similar phenomenon can be found for the United States).
CCS Retrofit – Analysis of the Globally Installed Coal‐Fired Power Plant Fleet © OECD/IEA 2012
Page | 28
Case 1 (power plants younger than 30 years and above 100 MW capacity): 84% of the total operating coal‐fired power plant fleet, or 34 GW;
Case 2 (power plants younger than 20 years and above 300 MW capacity): 60% of the total operating coal‐fired power plant fleet, or 25 GW;
Case 3 (power plants younger than 10 years and above 300 MW capacity): 25% of the total operating coal‐fired power plant fleet, or 10 GW.
Figure 18 • Japan: Profile of operating fleet of coal‐fired power plants
Key country‐specific conclusions
Following Korea and China, Japan has one of the youngest coal‐fired power plant fleet among the ten countries with the largest coal‐fired power generation capacity worldwide. Next to Korea, Japan has one of the highest shares of super‐ or ultra‐supercritical power plants currently in operation.
South Africa
Characteristics of the currently operating coal‐fired power plant fleet in South Africa are illustrated in the following figure. The figure shows the age and performance profile of the complete coal power plant fleet.
0
2 500
5 000
7 500
10 000
12 500
15 000
0‐5
6‐10
11‐15
16‐20
21‐25
26‐30
31‐35
36‐40
41‐45
46‐50
51‐55
Installed new cap
acity
(MW) per age segm
ent
Plant age (years)
ULTRASC
SUPERC
SUBSC
© OECD/IEA 2012 CCS Retrofit – Analysis of the Globally Installed Coal‐Fired Power Plant Fleet
Page | 29
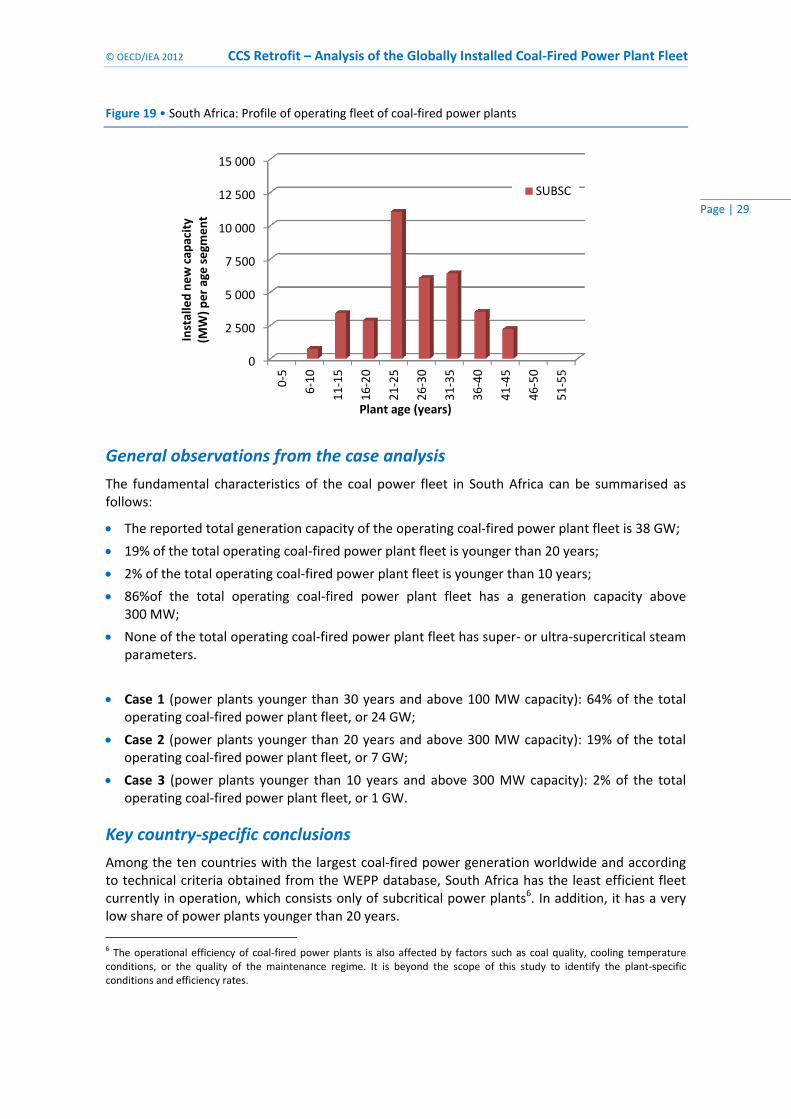
Figure 19 • South Africa: Profile of operating fleet of coal‐fired power plants
General observations from the case analysis
The fundamental characteristics of the coal power fleet in South Africa can be summarised as follows:
The reported total generation capacity of the operating coal‐fired power plant fleet is 38 GW;
19% of the total operating coal‐fired power plant fleet is younger than 20 years;
2% of the total operating coal‐fired power plant fleet is younger than 10 years;
86%of the total operating coal‐fired power plant fleet has a generation capacity above 300 MW;
None of the total operating coal‐fired power plant fleet has super‐ or ultra‐supercritical steam parameters.
Case 1 (power plants younger than 30 years and above 100 MW capacity): 64% of the total operating coal‐fired power plant fleet, or 24 GW;
Case 2 (power plants younger than 20 years and above 300 MW capacity): 19% of the total operating coal‐fired power plant fleet, or 7 GW;
Case 3 (power plants younger than 10 years and above 300 MW capacity): 2% of the total operating coal‐fired power plant fleet, or 1 GW.
Key country‐specific conclusions
Among the ten countries with the largest coal‐fired power generation worldwide and according to technical criteria obtained from the WEPP database, South Africa has the least efficient fleet currently in operation, which consists only of subcritical power plants6. In addition, it has a very low share of power plants younger than 20 years.
6 The operational efficiency of coal‐fired power plants is also affected by factors such as coal quality, cooling temperature conditions, or the quality of the maintenance regime. It is beyond the scope of this study to identify the plant‐specific conditions and efficiency rates.
0
2 500
5 000
7 500
10 000
12 500
15 000
0‐5
6‐10
11‐15
16‐20
21‐25
26‐30
31‐35
36‐40
41‐45
46‐50
51‐55
Installed new cap
acity
(MW) per age segm
ent
Plant age (years)
SUBSC
CCS Retrofit – Analysis of the Globally Installed Coal‐Fired Power Plant Fleet © OECD/IEA 2012
Page | 30
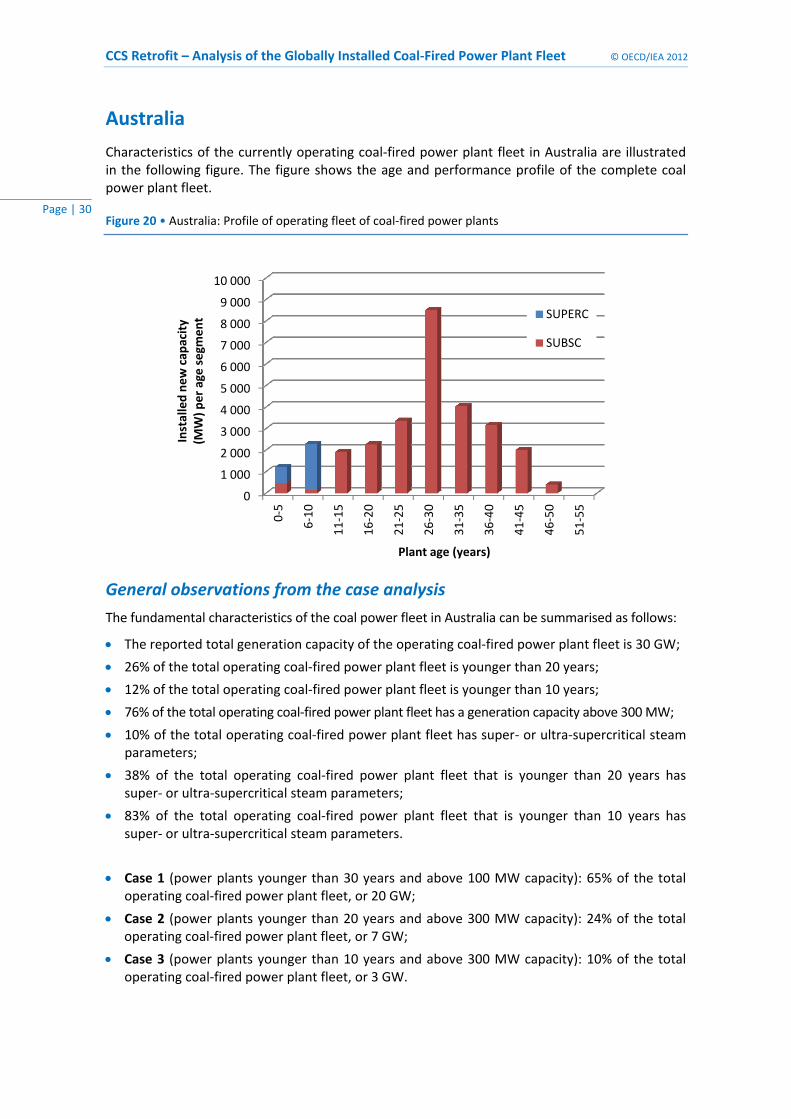
Australia
Characteristics of the currently operating coal‐fired power plant fleet in Australia are illustrated in the following figure. The figure shows the age and performance profile of the complete coal power plant fleet.
Figure 20 • Australia: Profile of operating fleet of coal‐fired power plants
General observations from the case analysis
The fundamental characteristics of the coal power fleet in Australia can be summarised as follows:
The reported total generation capacity of the operating coal‐fired power plant fleet is 30 GW;
26% of the total operating coal‐fired power plant fleet is younger than 20 years;
12% of the total operating coal‐fired power plant fleet is younger than 10 years;
76% of the total operating coal‐fired power plant fleet has a generation capacity above 300 MW;
10% of the total operating coal‐fired power plant fleet has super‐ or ultra‐supercritical steam parameters;
38% of the total operating coal‐fired power plant fleet that is younger than 20 years has super‐ or ultra‐supercritical steam parameters;
83% of the total operating coal‐fired power plant fleet that is younger than 10 years has super‐ or ultra‐supercritical steam parameters.
Case 1 (power plants younger than 30 years and above 100 MW capacity): 65% of the total operating coal‐fired power plant fleet, or 20 GW;
Case 2 (power plants younger than 20 years and above 300 MW capacity): 24% of the total operating coal‐fired power plant fleet, or 7 GW;
Case 3 (power plants younger than 10 years and above 300 MW capacity): 10% of the total operating coal‐fired power plant fleet, or 3 GW.
0
1 000
2 000
3 000
4 000
5 000
6 000
7 000
8 000
9 000
10 0000‐5
6‐10
11‐15
16‐20
21‐25
26‐30
31‐35
36‐40
41‐45
46‐50
51‐55
Installed new cap
acity
(MW) per age segm
ent
Plant age (years)
SUPERC
SUBSC
© OECD/IEA 2012 CCS Retrofit – Analysis of the Globally Installed Coal‐Fired Power Plant Fleet
Page | 31
Key country‐specific conclusions
Among the ten countries with the largest coal‐fired power generation worldwide, Australia is among the four countries with the lowest share of super‐ or ultra‐supercritical power generation in the installed fleet currently in operation. In addition, the fraction of power plants younger than 20 years is comparably low.
Republic of Korea
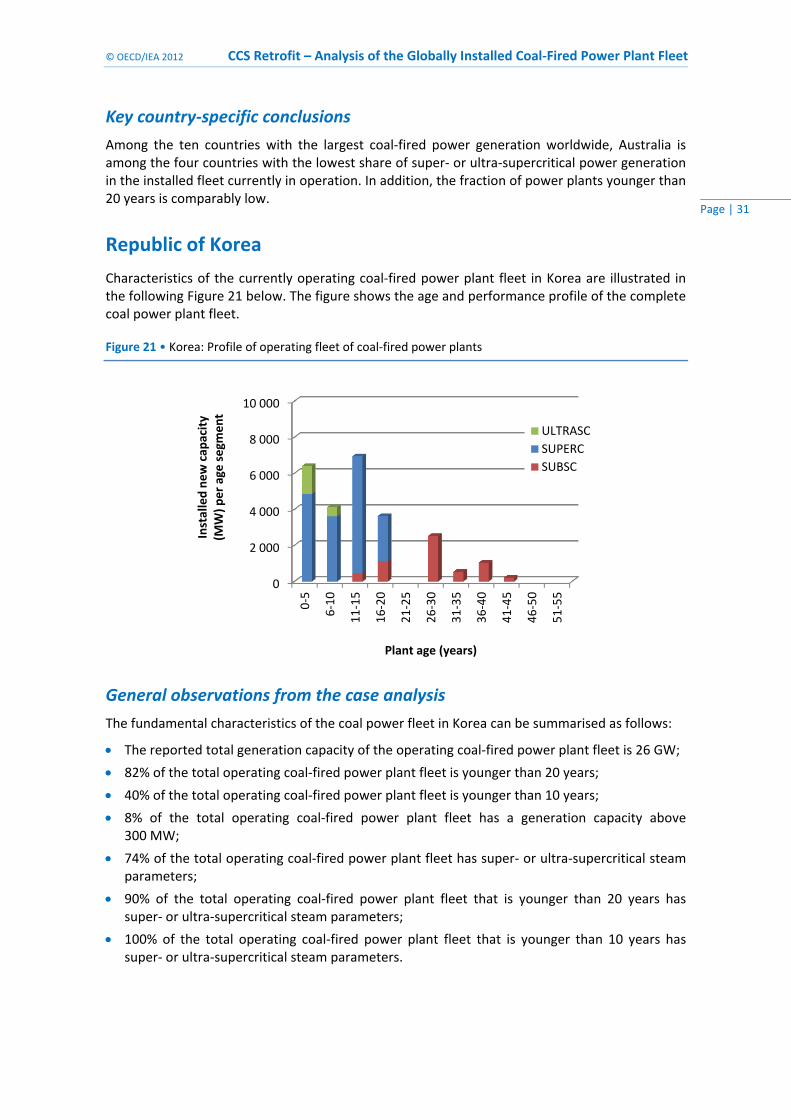
Characteristics of the currently operating coal‐fired power plant fleet in Korea are illustrated in the following Figure 21 below. The figure shows the age and performance profile of the complete coal power plant fleet.
Figure 21 • Korea: Profile of operating fleet of coal‐fired power plants
General observations from the case analysis
The fundamental characteristics of the coal power fleet in Korea can be summarised as follows:
The reported total generation capacity of the operating coal‐fired power plant fleet is 26 GW;
82% of the total operating coal‐fired power plant fleet is younger than 20 years;
40% of the total operating coal‐fired power plant fleet is younger than 10 years;
8% of the total operating coal‐fired power plant fleet has a generation capacity above 300 MW;
74% of the total operating coal‐fired power plant fleet has super‐ or ultra‐supercritical steam parameters;
90% of the total operating coal‐fired power plant fleet that is younger than 20 years has super‐ or ultra‐supercritical steam parameters;
100% of the total operating coal‐fired power plant fleet that is younger than 10 years has super‐ or ultra‐supercritical steam parameters.
0
2 000
4 000
6 000
8 000
10 000
0‐5
6‐10
11‐15
16‐20
21‐25
26‐30
31‐35
36‐40
41‐45
46‐50
51‐55
Installed new cap
acity
(MW) per age segm
ent
Plant age (years)
ULTRASC
SUPERC
SUBSC
CCS Retrofit – Analysis of the Globally Installed Coal‐Fired Power Plant Fleet © OECD/IEA 2012
Page | 32
Case 1 (power plants younger than 30 years and above 100 MW capacity): 90% of the total operating coal‐fired power plant fleet, or 24 GW;
Case 2 (power plants younger than 20 years and above 300 MW capacity): 78% of the total operating coal‐fired power plant fleet, or 21 GW;
Case 3 (power plants younger than 10 years and above 300 MW capacity): 40% of the total operating coal‐fired power plant fleet, or 11 GW.
Key country‐specific conclusions
Among the ten countries with the largest coal‐fired power generation worldwide, the fleet in Korea has one of the largest shares of super‐ or ultra‐supercritical coal power generation in a single country. In addition, it is among the three countries with the youngest installed fleet and the largest share of large generation units that is currently operating.
The steep increase in addition to coal‐fired power plant over the last 20 years in Korea requires special consideration in terms of designing new power plants that are not already equipped with CCS in a way that would allow for cost‐effective CCS retrofitting in the future.
Poland
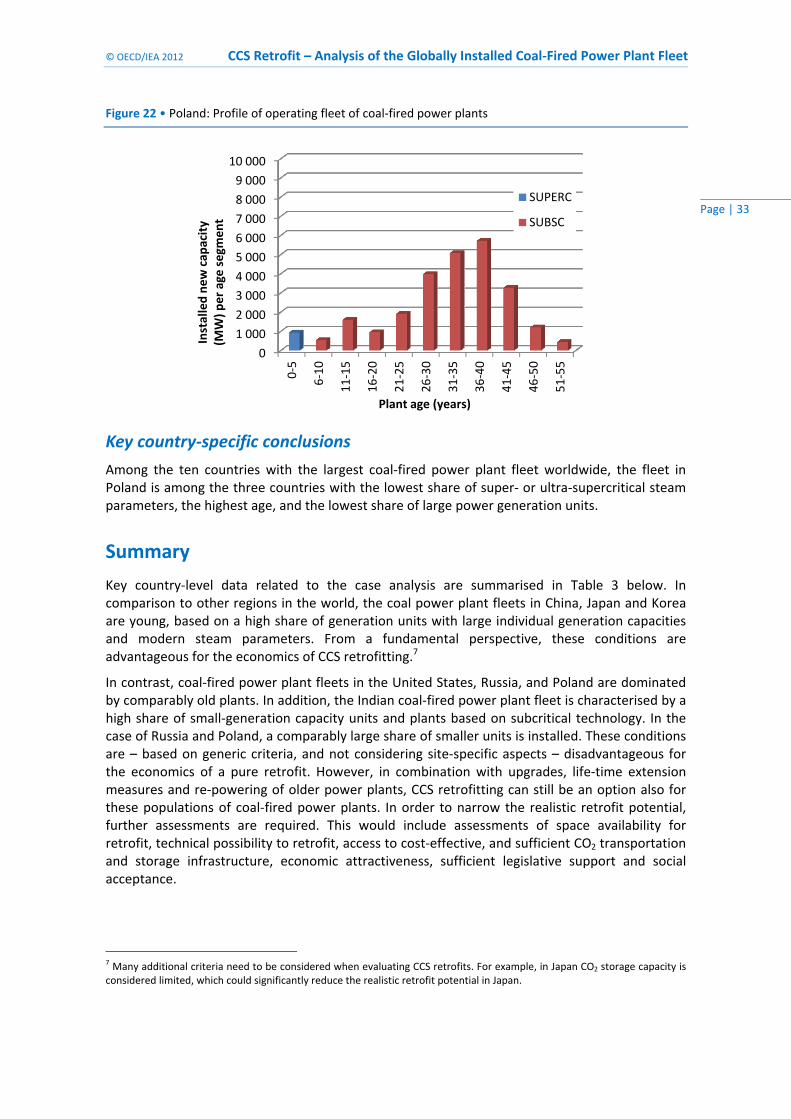
Characteristics of the currently operating coal‐fired power plant fleet in Poland are illustrated in the following Figure 22 below. The figure shows the age and performance profile of the complete coal power plant fleet.
General observations from the case analysis
The fundamental characteristics of the coal power fleet in Poland can be summarised as follows:
The reported total generation capacity of the operating coal‐fired power plant fleet is 32 GW;
16% of the total operating coal‐fired power plant fleet is younger than 20 years;
6% of the total operating coal‐fired power plant fleet is younger than 10 years;
25% of the total operating coal‐fired power plant fleet has a generation capacity above 300 MW;
3% of the total operating coal‐fired power plant fleet has super‐ or ultra‐supercritical steam parameters;
18% of the total operating coal‐fired power plant fleet that is younger than 20 years has super‐ or ultra‐supercritical steam parameters;
53% of the total operating coal‐fired power plant fleet that is younger than 10 years has super‐ or ultra‐supercritical steam parameters.
Case 1 (power plants younger than 30 years and above 100 MW capacity): 31% of the total operating coal‐fired power plant fleet, or 10 GW;
Case 2 (power plants younger than 20 years and above 300 MW capacity): 8% of the total operating coal‐fired power plant fleet, or 2.4 GW;
Case 3 (power plants younger than 10 years and above 300 MW capacity): 3% of the total operating coal‐fired power plant fleet, or 1 GW.
© OECD/IEA 2012 CCS Retrofit – Analysis of the Globally Installed Coal‐Fired Power Plant Fleet
Page | 33
Figure 22 • Poland: Profile of operating fleet of coal‐fired power plants
Key country‐specific conclusions
Among the ten countries with the largest coal‐fired power plant fleet worldwide, the fleet in Poland is among the three countries with the lowest share of super‐ or ultra‐supercritical steam parameters, the highest age, and the lowest share of large power generation units.
Summary
Key country‐level data related to the case analysis are summarised in Table 3 below. In comparison to other regions in the world, the coal power plant fleets in China, Japan and Korea are young, based on a high share of generation units with large individual generation capacities and modern steam parameters. From a fundamental perspective, these conditions are advantageous for the economics of CCS retrofitting.7
In contrast, coal‐fired power plant fleets in the United States, Russia, and Poland are dominated by comparably old plants. In addition, the Indian coal‐fired power plant fleet is characterised by a high share of small‐generation capacity units and plants based on subcritical technology. In the case of Russia and Poland, a comparably large share of smaller units is installed. These conditions are – based on generic criteria, and not considering site‐specific aspects – disadvantageous for the economics of a pure retrofit. However, in combination with upgrades, life‐time extension measures and re‐powering of older power plants, CCS retrofitting can still be an option also for these populations of coal‐fired power plants. In order to narrow the realistic retrofit potential, further assessments are required. This would include assessments of space availability for retrofit, technical possibility to retrofit, access to cost‐effective, and sufficient CO2 transportation and storage infrastructure, economic attractiveness, sufficient legislative support and social acceptance.
7 Many additional criteria need to be considered when evaluating CCS retrofits. For example, in Japan CO2 storage capacity is considered limited, which could significantly reduce the realistic retrofit potential in Japan.
0
1 000
2 000
3 000
4 000
5 000
6 000
7 000
8 000
9 000
10 000
0‐5
6‐10
11‐15
16‐20
21‐25
26‐30
31‐35
36‐40
41‐45
46‐50
51‐55
Installed new cap
acity
(MW) per age segm
ent
Plant age (years)
SUPERC
SUBSC
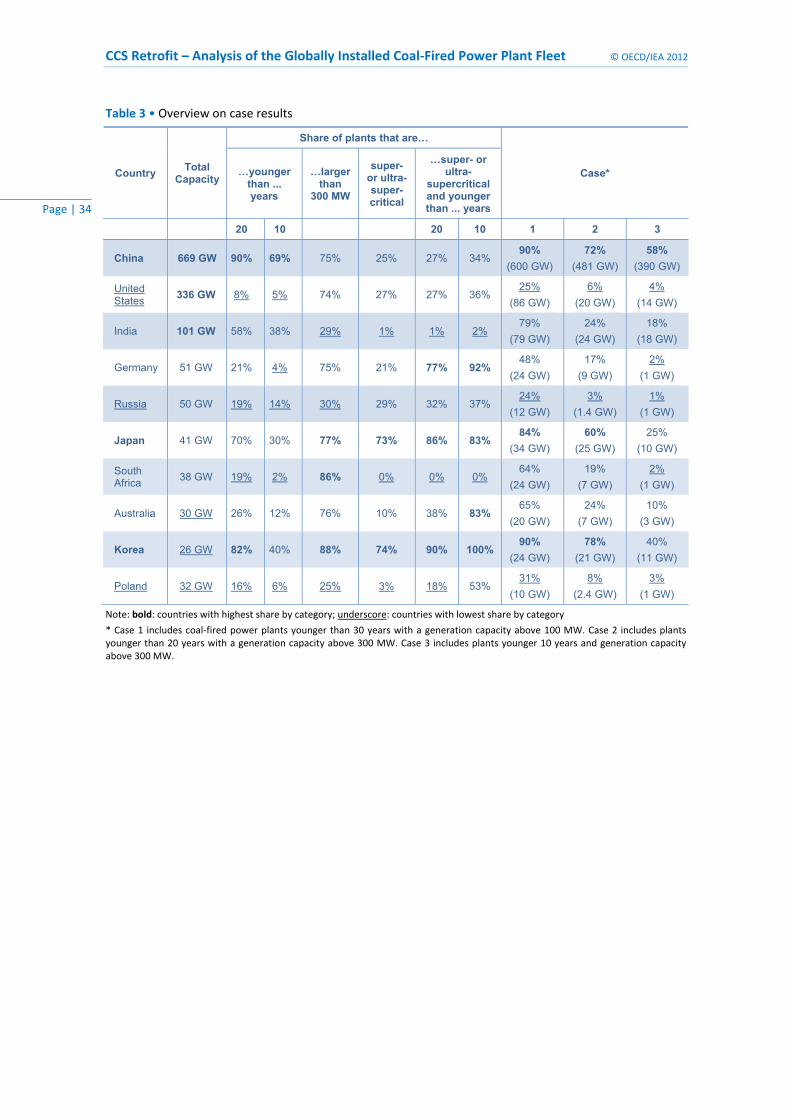
CCS Retrofit – Analysis of the Globally Installed Coal‐Fired Power Plant Fleet © OECD/IEA 2012
Page | 34
Table 3 • Overview on case results
Country Total
Capacity
Share of plants that are…
Case* …younger than ... years
…larger than
300 MW
super-or ultra-super-critical
…super- or ultra-
supercritical and younger than ... years
20 10 20 10 1 2 3
China 669 GW 90% 69% 75% 25% 27% 34% 90%
(600 GW)
72%
(481 GW)
58%
(390 GW)
United States
336 GW 8% 5% 74% 27% 27% 36% 25%
(86 GW)
6%
(20 GW)
4%
(14 GW)
India 101 GW 58% 38% 29% 1% 1% 2% 79%
(79 GW)
24%
(24 GW)
18%
(18 GW)
Germany 51 GW 21% 4% 75% 21% 77% 92% 48%
(24 GW)
17%
(9 GW)
2%
(1 GW)
Russia 50 GW 19% 14% 30% 29% 32% 37% 24%
(12 GW)
3%
(1.4 GW)
1%
(1 GW)
Japan 41 GW 70% 30% 77% 73% 86% 83% 84%
(34 GW)
60%
(25 GW)
25%
(10 GW)
South Africa
38 GW 19% 2% 86% 0% 0% 0% 64%
(24 GW)
19%
(7 GW)
2%
(1 GW)
Australia 30 GW 26% 12% 76% 10% 38% 83% 65%
(20 GW)
24%
(7 GW)
10%
(3 GW)
Korea 26 GW 82% 40% 88% 74% 90% 100% 90%
(24 GW)
78%
(21 GW)
40%
(11 GW)
Poland 32 GW 16% 6% 25% 3% 18% 53% 31%
(10 GW)
8%
(2.4 GW)
3%
(1 GW)
Note: bold: countries with highest share by category; underscore: countries with lowest share by category
* Case 1 includes coal‐fired power plants younger than 30 years with a generation capacity above 100 MW. Case 2 includes plants younger than 20 years with a generation capacity above 300 MW. Case 3 includes plants younger 10 years and generation capacity above 300 MW.
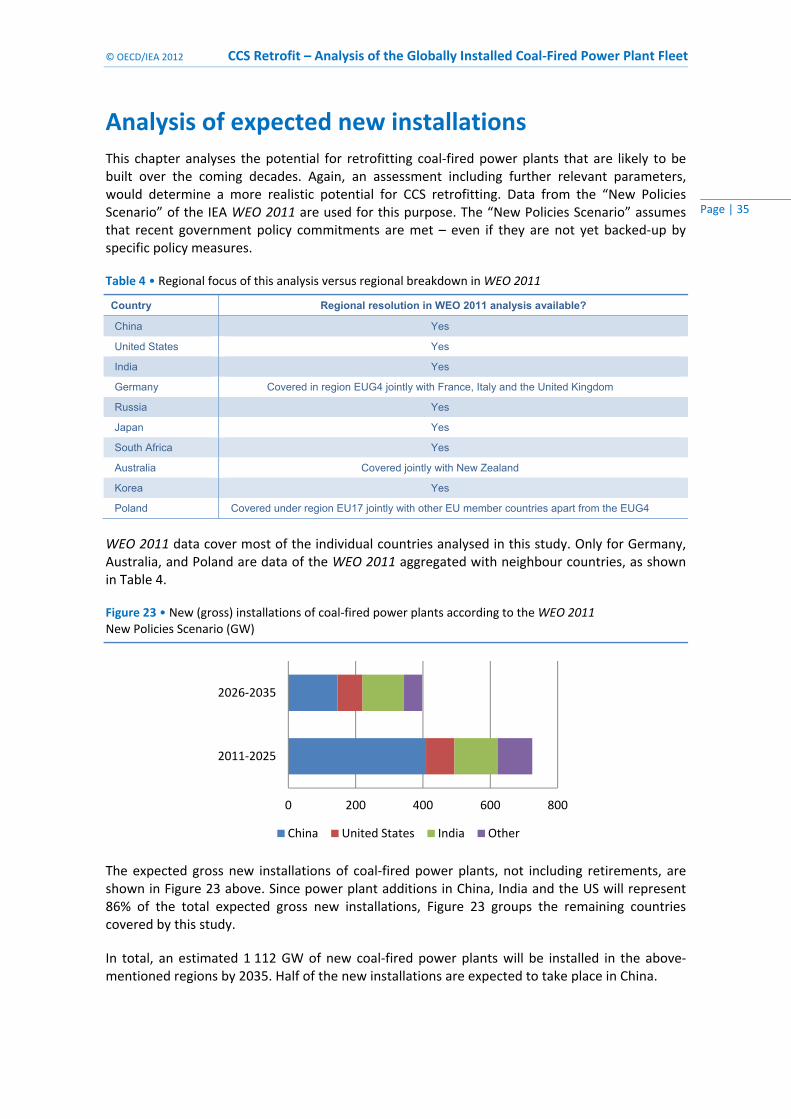
© OECD/IEA 2012 CCS Retrofit – Analysis of the Globally Installed Coal‐Fired Power Plant Fleet
Page | 35
Analysis of expected new installations This chapter analyses the potential for retrofitting coal‐fired power plants that are likely to be built over the coming decades. Again, an assessment including further relevant parameters, would determine a more realistic potential for CCS retrofitting. Data from the “New Policies Scenario” of the IEA WEO 2011 are used for this purpose. The “New Policies Scenario” assumes that recent government policy commitments are met – even if they are not yet backed‐up by specific policy measures.
Table 4 • Regional focus of this analysis versus regional breakdown in WEO 2011
Country Regional resolution in WEO 2011 analysis available?
China Yes
United States Yes
India Yes
Germany Covered in region EUG4 jointly with France, Italy and the United Kingdom
Russia Yes
Japan Yes
South Africa Yes
Australia Covered jointly with New Zealand
Korea Yes
Poland Covered under region EU17 jointly with other EU member countries apart from the EUG4
WEO 2011 data cover most of the individual countries analysed in this study. Only for Germany, Australia, and Poland are data of the WEO 2011 aggregated with neighbour countries, as shown in Table 4.
Figure 23 • New (gross) installations of coal‐fired power plants according to the WEO 2011 New Policies Scenario (GW)
The expected gross new installations of coal‐fired power plants, not including retirements, are shown in Figure 23 above. Since power plant additions in China, India and the US will represent 86% of the total expected gross new installations, Figure 23 groups the remaining countries covered by this study.
In total, an estimated 1 112 GW of new coal‐fired power plants will be installed in the above‐mentioned regions by 2035. Half of the new installations are expected to take place in China.
0 200 400 600 800
2011‐2025
2026‐2035
China United States India Other
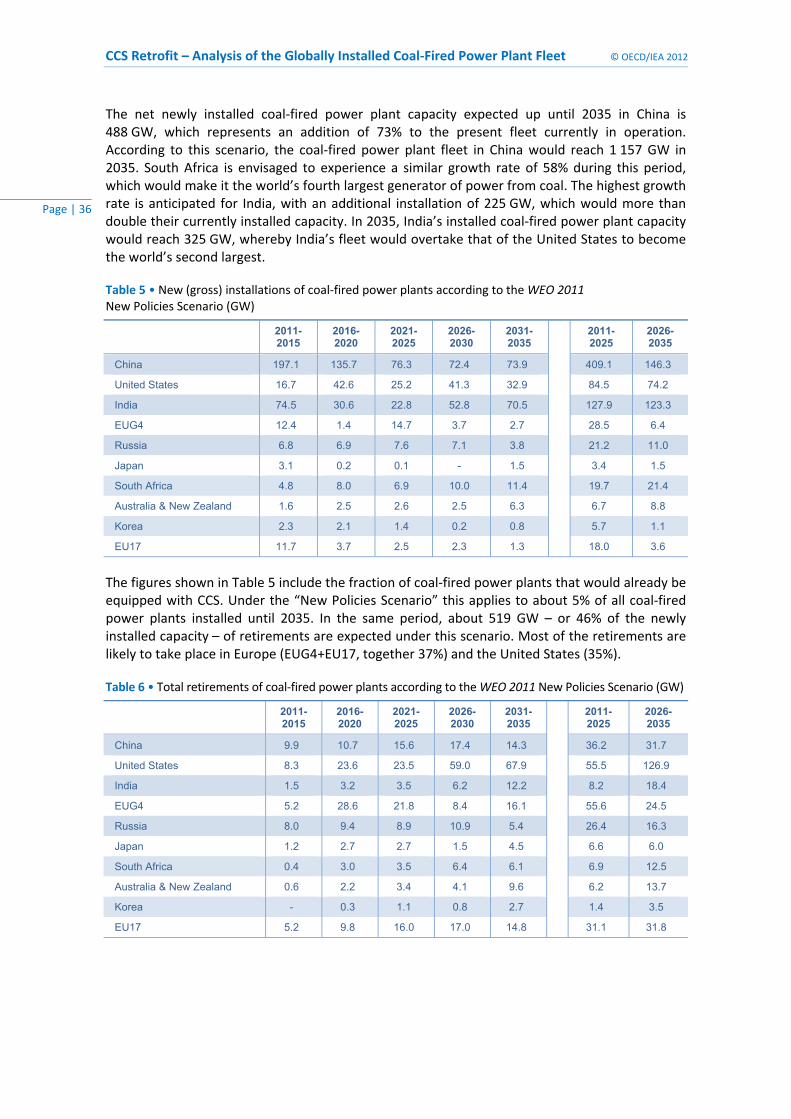
CCS Retrofit – Analysis of the Globally Installed Coal‐Fired Power Plant Fleet © OECD/IEA 2012
Page | 36
The net newly installed coal‐fired power plant capacity expected up until 2035 in China is 488 GW, which represents an addition of 73% to the present fleet currently in operation. According to this scenario, the coal‐fired power plant fleet in China would reach 1 157 GW in 2035. South Africa is envisaged to experience a similar growth rate of 58% during this period, which would make it the world’s fourth largest generator of power from coal. The highest growth rate is anticipated for India, with an additional installation of 225 GW, which would more than double their currently installed capacity. In 2035, India’s installed coal‐fired power plant capacity would reach 325 GW, whereby India’s fleet would overtake that of the United States to become the world’s second largest.
Table 5 • New (gross) installations of coal‐fired power plants according to the WEO 2011 New Policies Scenario (GW)
2011-2015
2016-2020
2021-2025
2026-2030
2031-2035
2011-2025
2026-2035
China 197.1 135.7 76.3 72.4 73.9 409.1 146.3
United States 16.7 42.6 25.2 41.3 32.9 84.5 74.2
India 74.5 30.6 22.8 52.8 70.5 127.9 123.3
EUG4 12.4 1.4 14.7 3.7 2.7 28.5 6.4
Russia 6.8 6.9 7.6 7.1 3.8 21.2 11.0
Japan 3.1 0.2 0.1 - 1.5 3.4 1.5
South Africa 4.8 8.0 6.9 10.0 11.4 19.7 21.4
Australia & New Zealand 1.6 2.5 2.6 2.5 6.3 6.7 8.8
Korea 2.3 2.1 1.4 0.2 0.8 5.7 1.1
EU17 11.7 3.7 2.5 2.3 1.3 18.0 3.6
The figures shown in Table 5 include the fraction of coal‐fired power plants that would already be equipped with CCS. Under the “New Policies Scenario” this applies to about 5% of all coal‐fired power plants installed until 2035. In the same period, about 519 GW – or 46% of the newly installed capacity – of retirements are expected under this scenario. Most of the retirements are likely to take place in Europe (EUG4+EU17, together 37%) and the United States (35%).
Table 6 • Total retirements of coal‐fired power plants according to the WEO 2011 New Policies Scenario (GW)
2011-2015
2016-2020
2021-2025
2026-2030
2031-2035
2011-2025
2026-2035
China 9.9 10.7 15.6 17.4 14.3 36.2 31.7
United States 8.3 23.6 23.5 59.0 67.9 55.5 126.9
India 1.5 3.2 3.5 6.2 12.2 8.2 18.4
EUG4 5.2 28.6 21.8 8.4 16.1 55.6 24.5
Russia 8.0 9.4 8.9 10.9 5.4 26.4 16.3
Japan 1.2 2.7 2.7 1.5 4.5 6.6 6.0
South Africa 0.4 3.0 3.5 6.4 6.1 6.9 12.5
Australia & New Zealand 0.6 2.2 3.4 4.1 9.6 6.2 13.7
Korea - 0.3 1.1 0.8 2.7 1.4 3.5
EU17 5.2 9.8 16.0 17.0 14.8 31.1 31.8
© OECD/IEA 2012 CCS Retrofit – Analysis of the Globally Installed Coal‐Fired Power Plant Fleet
Page | 37
Summary and conclusions In order to achieve deep cuts in global CO2 emissions, IEA energy scenarios suggest that a significant share of the coal‐fired power plants installed over the last few decades and to be installed in the coming decades will need to be CCS retrofitted.
Retrofitting a power plant with CCS is a complex task that requires consideration of many site‐specific aspects. Given this complexity and the huge population of units currently in operation worldwide, available information from energy scenarios or global power plant databases are insufficient to provide an in‐depth analysis, of which a fraction of coal‐fired power plants could realistically be technically and economically retrofitted. Taking into account further factors is likely to significantly narrow the realistic potential for CCS retrofitting.
Nonetheless, this study sheds further light on key aspects important for understanding the ability to retrofit. Based on available information from the WEPP database and IEA internal statistics the study discusses the size, regional distribution and characteristics of the globally installed coal‐fired fleet of power generation today. It quantifies the share of comparably young, efficient and large power plants in the current fleet. It provides an important first cut of those coal‐fired power plants that would be considered particularly attractive for CCS retrofitting. These findings are complemented by projections from the IEA WEO 2011 on future coal power plant installations.
Observations from analysing the globally installed fleet
The total generating capacity of the fleet of global coal‐fired power generation units currently in operation exceeds 1 600 GW. Annual installation of new coal‐fired power plant generation capacity has increased substantially over the last two decades. This has culminated in a record‐high of more than 350 GW of newly installed plants over the last five years, which is almost double the installation rate seen in the previous five‐year period.
Recently, more coal‐fired power plants with capacities in excess of 300 MW have been commissioned. Some 665 GW, or about 40% of today’s global fleet comprises units larger than 300 MW. More than one‐fifth of the presently installed coal‐fired power plant fleet is younger than five years old, and more than 50% have been installed over the last 20 years. In terms of opportunities, a significant share of young, larger operating power plant suggests a rather sizeable population may be attractive for retrofitting CCS.
A strong trend towards installing super‐ and ultra‐supercritical power plants has been detected over the past two decades. Nonetheless, the vast majority of installed coal‐fired power plants still operate under subcritical steam conditions, and, therefore, do not reach performance levels of state of the art power generation technology. In fact, the total capacity of new subcritical power plants has reached a record high due to additional installations over the last five years.
Ten countries represent all together more than 85% of the world’s total CO2 emissions from production of electricity and heat using coal and peat – in total about 8.5 Gt of CO2 are emitted from China, the United States, India, Germany, Russia, Japan, South Africa, Australia, Korea and Poland. These countries also represent 84% of the global operating coal‐fired power generation capacity.
This study investigated the profile of the existing fleet according to three case analyses to estimate the order of magnitude of power plants that have age, size or performance characteristics that may be attractive for CCS retrofitting. The complexity of retrofit assessments
CCS Retrofit – Analysis of the Globally Installed Coal‐Fired Power Plant Fleet © OECD/IEA 2012
Page | 38
has required that generalisations be made. The criteria selected, however, provide an illustration of the magnitude of power plants especially attractive for further site‐specific in‐depth analysis. Assessments that include further relevant parameters would gradually lead to a more realistic retrofit potential, as described in Figure 1.
In the first case, only plants out of the globally installed fleet are considered to be attractive for CCS retrofitting that are younger than 30 years and have a power generation capacity above 100 MW. More than 60% of the globally installed fleet, or about 1 000 GW, meet these criteria. Nearly 60% of these plants are located in China.
The second case only considers coal power plants of the globally installed fleet that are younger than 20 years and have a power generation capacity above 300 MW. This applies to 665 GW generation capacity, or about 40% of the globally installed fleet. Out of this population of plants, 481 GW or 72% are located in China.
The third goes beyond case two, by reducing plant age to ten years while maintaining the 300 MW capacity threshold. This results in 471 GW of existing generation capacity, or about 29% of the globally installed fleet. Out of this population of plants, 390 GW or 83% are located in China.
The above mentioned data describe the profile of the present fleet and the magnitude of a specifically attractive fraction of the current population of plants, but not necessarily the realistic potential for CCS retrofitting. The relevance of China to this discussion is clear. More detailed regional studies (Li, 2010) on the retrofit potential in China concluded that – by number of sites above 1 GW installed capacity – about one‐fifth of the sites appear to be very attractive for CCS retrofitting.
Perspectives on new installations in the coming decades
An estimated 1 000 GW or more of new coal‐fired power plants are due for construction in the above‐mentioned regions until 2035. Half of the new installations are expected to take place in China alone. The net capacity of newly installed coal‐fired power plants, which accounts for retirements of older plants, expected for China is nearly 500 GW. This represents 73% of the present Chinese fleet. According to this scenario, China would reach more than 1 100 GW of installed coal power in 2035. South Africa would experience a similar growth rate during this period, which would make the country the fourth largest generator of power from coal. The highest growth rate is anticipated for India, with an additional installation of 225 GW, which is more than double the current installed capacity. By 2035 India would have overtaken the United States in coal‐fired power generation capacity. In the same period, retirements of about 500 GW of capacity are expected, primarily in Europe and the United States. Since CCS retrofitting technologies are not currently available on a commercial basis, the age of today’s installed and assessed coal plant fleet is only a first starting point. Thus with each passing year, the existing plant fleet grows older. While the retrofit potential of the existing fleet shrinks, the interest on future plants and their potential for CCS retrofitting increases.
It is critical for governments to incentivise the construction of new installations in a way that would allow for economic retrofit of CCS at a later stage, if CCS is not added at the time of original construction. This is particularly vital in order to avoid a future lock‐in of high amounts of CO2 emissions over the long operating lifetimes of coal power plants, which would otherwise come with the expected global capacity additions.
© OECD/IEA 2012 CCS Retrofit – Analysis of the Globally Installed Coal‐Fired Power Plant Fleet
Page | 39
Findings from the country‐level analysis
Data underline the significant role that China has in this context – the total generation capacity in China is indeed very high and could exceed 1 100 GW in 2035. In addition, no other country has an operating coal‐fired power generation fleet that is as young or has as many higher capacity units: nearly three‐quarters of all units are less than 20 years old and larger than 300 MW. Further, these units represent one‐third of the total installed coal‐fired power plant fleet worldwide. This underlines the importance that should be attributed to further understanding the realistic potential of CCS retrofitting particularly in China. The recent increase in coal‐fired power plant additions in China, which reached a record‐growth over the last five years, would ideally have included design aspects that would allow cost‐effective retrofit of CCS in the future.
Japan and Korea also deserve special attention for CCS retrofitting, since their coal‐fired power plant fleets also are rather young and based on many units with large capacities and modern steam parameters.
While the United States has the second largest coal‐fired power plant fleet next to China, its age profile is markedly different: among the ten countries with the largest coal power generation capacity, the United States has the lowest share of power plants that are younger than 20 years. These are challenging characteristics for retrofitting CCS, unless combined with upgrades and lifetime extensions. Of the relatively‐small proportion of young plants in the US, however, many are larger than 300 GW, which is advantageous from a retrofit perspective.
India is the third largest coal power producer today. The Indian fleet is characterised by a comparably high share of units with relatively small generation capacity, which is disadvantageous from a CCS retrofitting point of view. Over the last ten years, however, India experienced a steep increase in coal power plant additions. India is likely to face dramatic net additions of more than two times the capacity of the present coal fleet by 2035, which would make it the third largest coal power producer worldwide. With that anticipated growth rate for the coming years, it will be important to design these power plants – if not already equipped with CCS from the beginning – in a way that would allow future CCS retrofitting. However, country specifics such as public acceptance may have a negative effect on the development of the potential. The potential for CO2 storage in India will also need to be further analysed.
Key conclusions
Main conclusions and recommendations from the study can be summarised as follows:
Managing CO2 emissions from existing and new coal‐fired power generation will be essential for climate change mitigation at least cost, given increasing CO2 emission levels and an expanding global coal‐fired power generation fleet.
Based on data available, a significant share of the current coal power fleet can be considered attractive for CCS retrofitting.
Ten countries account for more than 85% of the global CO2 emissions from coal‐fired power generation, though the profiles of their national fleets are very different.
The coal fleet in China, Japan and Korea is young, based on a high share of generation units with large individual generation capacities and on modern steam parameters. From a fundamental and technical perspective, these fleets should be considered very advantageous for CCS retrofitting.
CCS Retrofit – Analysis of the Globally Installed Coal‐Fired Power Plant Fleet © OECD/IEA 2012
Page | 40
From this technology‐driven assessment only Asia, the United States and Europe will play a key role in the context of retrofit considerations over the coming decades:
A significant fraction of the coal power plant fleets in the United States and Europe is relatively old. Net capacity retirements will likely dominate both regions. Given the size of their existing fleet, both regions will need to carefully assess the viability of retrofitting to improve plant performance while simultaneously adding CCS.
India will likely face dramatic new net capacity additions until 2035 that would then make it the second largest coal power producer worldwide. The current fleet is characterised by a high share of small units with low performance, which will make it important to further raise efficiency standards. However, other factors, such as the general acceptance of CCS as part of the energy mix, have to improve in order to raise India’s retrofit potential.
The fleets in Japan and Korea are young, large and modern plants, but limitations to the potential for CCS can be influenced by other factors, such as storage availability.
The size of the current coal‐fired power plant fleet in China and expected growth rates suggest that management of related CO2 emissions will be of utmost importance for meeting climate targets. Nearly three‐quarters of operating coal‐fired power plants in China are comparably young and large, and hence potentially attractive for CCS retrofitting. Studies indicate one‐fifth of these plants could be very attractive for retrofitting, but significant uncertainties remain. Given the size and profile of the Chinese fleet, further analysis, including site‐specific assessments8 as a first step, would provide more details on the technical and economic potential. This would also help to eliminate uncertainties and limitations due to data accuracy.
Following these technical assessments further examinations on region‐specific and market‐specific factors9 should be conducted together with or by the relevant countries. On closer examination of these factors, the potential for retrofit would approach a more realistic level, as indicated in Figure 1 in this study. This would also enable the establishment of appropriate policies to activate realistic potential.
To avoid a future lock‐in of significant amounts of CO2 emissions, all new plants should be equipped with CCS. If that is not the case, it is particularly vital to consider building new coal‐fired power plants in a way that would allow economic CCS retrofitting at a later stage.
8 Such as the availability of space for retrofit, technical possibility to retrofit. 9 Such as the access to cost‐effective and sufficient CO2 transportation and storage infrastructure, economic attractiveness,
sufficient legislative support and social acceptance.
© OECD/IEA 2012 CCS Retrofit – Analysis of the Globally Installed Coal‐Fired Power Plant Fleet
Page | 41
Acronyms, abbreviations and units of measure BNetzA Bundesnetzagentur Btu/kWh British thermal units per kilowatt hour CCS Carbon Capture and Storage CO2 Carbon dioxide eGrid Emissions & Generation Resource Integrated Database ETP Energy Technology Perspectives IEA International Energy Agency IEAGHG International Energy Agency Greenhouse Gas Programme IPCC International Panel on Climate Change Gt Gigatonnes GW Gigawatt HHV Higher heating value km kilometre LHV Lower heating value MIT Massachusetts Institute of Technology Mt Megatonnes MW Megawatt NETL US National Energy Technology Laboratory SUBCR Subcritical SUPERC Supercritical ULTRSC Ultra‐supercritical WEO World Energy Outlook WEPP World Electric Power Plants Data Base
CCS Retrofit – Analysis of the Globally Installed Coal‐Fired Power Plant Fleet © OECD/IEA 2012
Page | 42
References BNetzA (2011), Kraftwerksliste der Bundesnetzagentur – Stand: 14.11.2011,
http://www.bundesnetzagentur.de/cln_1912/DE/Sachgebiete/ElektrizitaetGas/Sonderthemen/Kraftwerksliste/VeroeffKraftwerksliste_node.html;jsessionid=757816698ACFD8CAF2CDEF7B8826C6BE.
eGRID (2010), eGRID2010 Version 1.1, www.epa.gov/cleanenergy/energy‐resources/egrid/ index.html.
Specker, S. et al. (2009), “The Potential Growing Role of Post‐Combustion CO2 Capture Retrofits in Early Commercial Applications of CCS to Coal‐Fired Power Plants”, paper presented at MIT Coal Retrofit Symposium, Cambridge, MA, 23 March, http://web.mit.edu/mitei/docs/reports/specker-retrofits.pdf.
Hendriks, C. et al. (2004), “Power and Heat Production: Plant Developments and Grid Losses”, Ecofys, Utrecht, Netherlands.
International Energy Agency (IEA) (2010a), Energy Technology Perspectives 2010, OECD/IEA, Paris.
IEA (2010b), CO2 Emissions from Fuel Combustion, OECD/IEA, Paris.
IEA (2011), World Energy Outlook 2011, OECD/IEA, Paris.
International Energy Agency Greenhouse Gas Programme (IEAGHG) (2011), “Retrofitting CO2 Capture to Existing Power Plants”, IEAGHG Technical Report 2011/02, IEAGHG, Gloucester, UK, www.ieaghg.org/index.php?/2009120981/technical‐evaluations.html.
Li, J. (2010) “Options for Introducing CO2 Capture and Capture Readiness for Coal‐fired Power Plants in China“, PhD Thesis, Imperial College London, UK.
MIT (Michigan Institute of Technology) (2009), “Retrofitting of Coal‐Fired Power Plants for CO2 Emissions Reductions”, MIT Energy Initiative Symposium, MIT, Cambridge, MA, http://web.mit.edu/mitei/docs/reports/meeting‐report.pdf.
NETL (National Energy Technology Laboratory) (2011), “Coal‐Fired Power Plants in the United States: Examination of the Costs of Retrofitting with CO2 Capture Technology”, DOE (Department of Energy) /NETL, Pittsburgh, www.netl.doe.gov/energy‐analyses/pubs/GIS_CCS_retrofit.pdf.
Platts (2010), World Electric Power Plants Data Base (WEPP), Platts, New York.

International Energy Agency • 9 rue de la Fédération • 75739 Paris Cedex 15, France
Buy IEA publications online:
www.iea.org/books
PDF versions available at 20% discount
Books published before January 2011
- except statistics publications -
are freely available in pdf
Onlinebookshop
Tel: +33 (0)1 40 57 66 90
E-mail: [email protected]

9 rue de la Fédération 75739 Paris Cedex 15
www.iea.org


