March 2018 Issue 57 • Scale up of integrated management of acute malnutrition in Afghanistan • Health systems strengthening in Somalia • Treating acute malnutrition in older people in Ethiopia • Resilient farming in Bangladesh • Integrating nutrition and agriculture in Zimbabwe • School feeding in Malawi • Programme monitoring in unstable populations: UNHCR experiences
Transcript
March 2018 Issue 57
• Scale up of integrated management of acute
malnutrition in Afghanistan
• Health systems strengthening in Somalia
• Treating acute malnutrition in older people in Ethiopia
• Resilient farming in Bangladesh
• Integrating nutrition and agriculture in Zimbabwe
1 EditorialField Articles3 Extending support through CMAM to older people in Ethiopia
7 Resilient farming in Satkhira, Bangladesh
31 Operational factors in the integration of nutrition into agriculture and livelihoods programmes in Zimbabwe
35 Enhancing infant and young child feeding in emergency preparedness and response in East Africa: capacity mapping in Kenya, Somalia and South Sudan
48 Scale-up of IMAM services in Afghanistan
53 Monitoring and evaluation of programmes in unstable populations: Experiences with the UNHCR Global SENS Database
85 How do low-cost, home-grown school-feeding programmes work? Lessons learned from Malawi
89 Health systems strengthening in fragile contexts: A partnership model in South West State, Somalia
Research11 WASH-nutrition barriers and potential solutions in Cambodia
12 Effectiveness of food supplements in increasing fat-free tissueaccretion in children with moderate acute malnutrition in Burkina Faso
14 Effects of nutrition interventions during pregnancy on low birth weight
15 Thiamine content of F-75 for complicated severe acute malnutrition: time for a change?
17 Consumption of iron-rich foods among adolescent girls in Nepal: Identifying behavioural determinants
19 Nutrition-sensitive agriculture: What have we learned and where do we go from here?
21 Exploring multi-sector programming at district level in Senegal, Nepal and Kenya
23 Children concurrently wasted and stunted: A meta‐analysis of prevalence data of children 6–59 months from 84 countries
25 Humanitarian-development nexus: nutrition policy and programming in Kenya
27 Community management of uncomplicated malnourished infants under six months old: barriers to national policy change
29 Shock-responsive social protection systems research
Action Against Hunger Research forNutrition conference, 201758 Editorial
59 Key findings from the Click-MUAC Project
61 Evaluation of mobile application to support the treatment of acutely malnourished children in Wajir county, Kenya
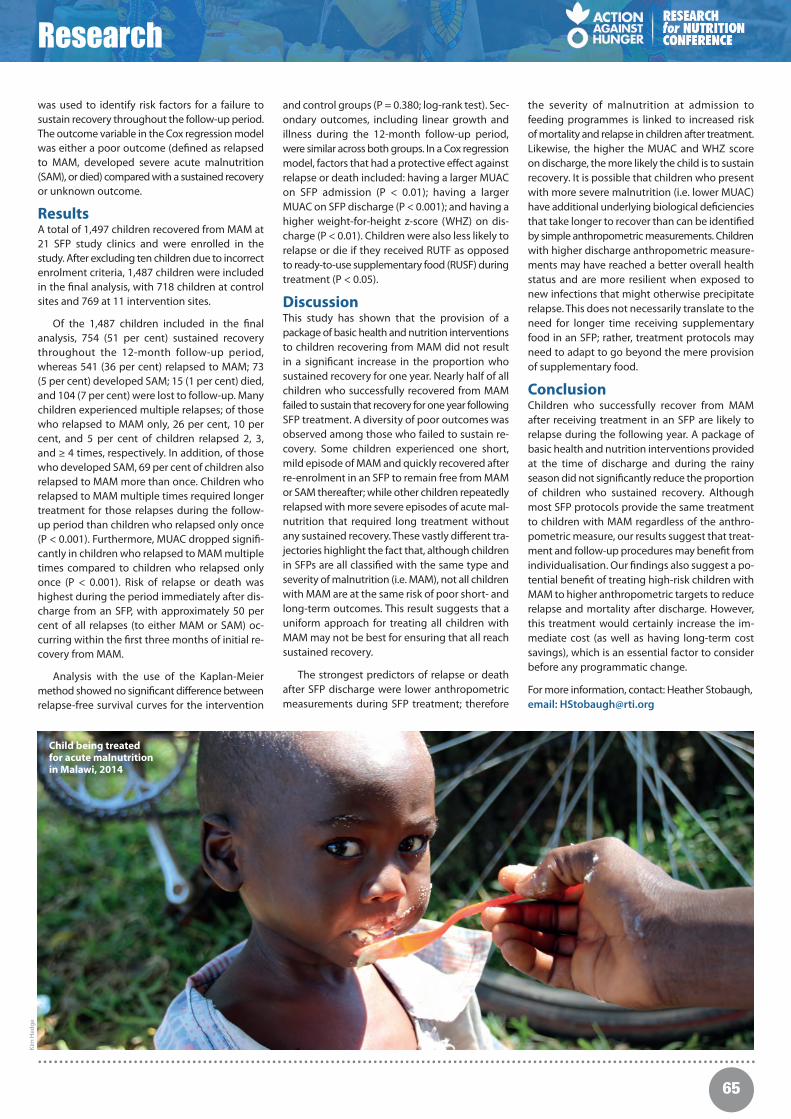
64 Relapse after treatment for moderate acute malnutrition: Risk factors and interventions to prevent it
66 Development of a SAM photo diagnosis app
68 Improving child nutrition and development through community-based child care centres (CBCCs) in Malawi
70 Short and long-term droughts, food security and child mortality in Ethiopia: Can sub-national surveys tell us more about the success of mitigation efforts?
73 TreatFOOD study in Burkina Faso
74 How to improve the engagement of communities in research?
75 How to overcome data management challenges in research in crisis contexts
77 Death of children with SAM diagnosed by WHZ or MUAC: Who are we missing?
81 Postscript
News39 Joint IAEA-WHO-UNICEF workshop on biological pathways to
better understand the double burden of malnutrition
40 Improving nutrition surveys: New developments and changes at UNHCR
41 New online training: Accelerating Behavior Change in Nutrition-Sensitive Agriculture from the SPRING project
42 Management of At risk Mothers and Infants (MAMI) meeting
43 Wasting and Stunting Technical Interest Group (WaSt TIG) meeting
44 en-net update
45 Famine in Somalia: Competing Imperatives, Collective Failures, 2011-12
Views46 Getting on the same page: Reaching across disciplinary
boundaries to improve nutrition
Evaluation82 Impact evaluation of the Lebanon multipurpose cash
assistance programme
83 Impact evaluation of a DFID programme to accelerate improved nutrition for the extreme poor in Bangladesh
In this issue of Field Exchange we are delightedto feature, for the second year running, aspecial section that shares key outputs ofAction Against Hunger’s Research for Nutrition
Conference held in November 2016. Introducedin an editorial note by Myriam Assefa and StephanieStern, we summarise eight research articles basedon conference presentations. Topics include re-lapsing severe acute malnutrition (SAM), photodiagnosis of SAM and innovative approaches toMUAC assessment. The write-up includes captureof panel discussions on overcoming research datamanagement challenges in crisis contexts andhow to improve the engagement of communitiesin research. The attendance and engagement ofthis conference reflects the appetite for discoursebetween researchers and programmers – 130people attended the conference, while the callfor abstracts generated 57 submissions.
This issue once again contains numerous ar-ticles on nutrition-sensitive and multi-sector pro-gramming. A field article by Anne-Marie Mayer,Rose Ndolo and Jane Keylock describes lessonsfrom World Vision’s experiences of implementingthe ENTERPRIZE project in Zimbabwe. This large,multi-sector, multi-partner project aims to improvefood and nutrition security through coordinatedactivities primarily across agriculture, finance andhealth sectors. Findings to date reinforce thevalue of articulating a theory of change and es-tablishing a monitoring framework based on this,with input from programme stakeholders, com-munities, government and the private sector. Un-intended consequences also need to be captured;in this instance, it was determined that targetingfarmers with the greatest capacity for increasingagricultural productivity could exclude the poorestand most vulnerable, making nutrition objectiveselusive. The authors assert a need for practicalguidance to help implement and assess multi-sector programmes under operational conditionsand that further case studies would help informsuch guidance.
This issue also includes a summary of an up-dated review of the linkages and evidence of im-pact of programmes aimed at enhancing agri-culture, women’s empowerment and nutrition.Markets and women’s empowerment were foundto be the most important factors that modify theimpacts of agriculture on nutrition outcomes. Aswith many reviews, the conclusion was a needfor more research; in this case, into sustainability,scale-up and cost-effectiveness of nutrition-sen-sitive agriculture programmes. Another articledescribes an impact evaluation of UK Departmentfor International Development (DFID)-funded in-tegrated livelihoods and nutrition programmesin Bangladesh. Here, no significant impact oninfant and young child feeding, dietary diversityor child nutritional status was found.
Another article summarises the findings of asynthesis paper based on three case studies ofmulti-sector nutrition programming in Nepal,Kenya and Senegal. These case studies were con-ducted by ENN as part of the DFID-funded Tech-nical Assistance for Nutrition (TAN) programmefor the Scaling Up Nutrition (SUN) Movement.The case studies focused on programme imple-mentation and enabling factors at sub-nationallevel. The synthesis describes the type of nutri-tion-sensitive and multi-sector activities takingplace and the degree to which these are embed-ded in government systems and processes. Thesecase studies are the first in a series that ENN willbe conducting over the remaining two years ofthe TAN programme. The synthesis is therefore aworking document, but early findings suggestlimited modifications to programming, despitenational-level policies and structures geared to-wards supporting multi-sector nutrition program-ming. There is also a distinct lack of monitoringand evaluation, which is a critical gap if multi-sector nutrition programming is to be rolled outfurther in SUN countries and beyond.
Given the demand for more experiences onwhat works and what doesn’t, ongoing imple-mentation challenges and the potential to learnfrom each other, ENN is launching a new thematicarea on en-net in mid-April 2018 on multi-sectornutrition programming. We welcome questions(and responses) from those with experience andinterest in multi-sector nutrition programmingacross a range of sectors. Questions might relateto programme design, coordination of sector ac-tivities, monitoring and evaluation, and evidenceof impact. We are particularly interested in expe-riences from countries that might be describedas fragile and conflict-affected.
Health system strengthening in fragile contextsis an ambitious and some may consider an ‘unat-tainable’ goal where programming delivery isheavily dependent on UN agencies, non-govern-mental organisations (NGOs) and external funding.An article by World Vision describes an innovativemodel of partnership for the delivery of healthand nutrition services directly through the Ministryof Health (MoH) for Southwest State in Somalia.Governed by a partnership framework and over-
seen by task forces, it has focused on strengtheningthe key pillars of the health system, addressingnot only technical capacity, but leadership andmanagement, with annual performance review.The MoH has demonstrated significant progressthrough this support. A key outstanding challengeis dependence on short-term/emergency funding;the authors highlight the critical need for donorsto provide multi-year funding streams for healthsystems strengthening in fragile contexts.
Progress on scale-up of acute malnutritiontreatment is examined in depth in an article fromAfghanistan. The Ministry of Public Health andUNICEF in Afghanistan chart the evolution of in-tegrated management of acute malnutrition(IMAM) scale up between 2003-2017 largelythrough a government lens. By 2017, the IMAMprogramme had been scaled up to all 34 provinces,with approximately 78 per cent of districts havingat least one component of the programme. Barrieranalysis continues to inform ongoing activities,such as integration of ready-to-use therapeuticfood (RUTF) into existing supply mechanisms,capacity development of community health work-ers in screening, and securing provision for IMAMwithin longer-term projects and funding mecha-nisms. However, scale up of MAM treatment hasnot kept pace with that of SAM; SAM treatmenttargets for 2016 were 40 per cent of the SAMburden and were exceeded (47.5 per cent), whilea 30 per cent target for MAM was not met (26per cent coverage achieved).
Current strategy and plans are ambitious: 2020targets include increasing coverage of acute mal-nutrition treatment to 80 per cent of malnourishedchildren under five years of age. Integration oftreatment services in the Basic Package of HealthServices (BPHS) and Essential Package of HospitalServices is considered the means to sustainablescale-up.
While supplementary feeding programmes(SFPs) have been the default MAM response formany years, new and potentially more effectiveapproaches, such as combining protocols treatingSAM and MAM within the same programme, arebeing researched and in some cases enteringmainstream programming. Multiple actors are
Mun
yara
dzi T
. Nko
mo
/ Wor
ld V
isio
n Zi
mba
bwe
A Care Group lead mother facilitates a session formothers with children under 2 years, Zimbabwe, 2016
currently involved in MAM management, rangingfrom national government to UN agencies, withevolving mandates and approaches. Researchersare also focusing on different approaches, includingbehaviour change communication (BCC), newproduct formulations and nutrition-sensitive in-terventions. The discourse and practices aroundMAM treatment are intensifying and evolvingand ENN is keen to help capture these develop-ments. We plan to produce a special edition ofField Exchange on MAM prevention and treatmentat the end of 2018 and are calling on our readersto write up programme experiences and researchon this topic. More details are given below.
Older people remain under the radar in nu-trition response, with few agencies programmingspecifically for this demographic. Given thatAfrica has one of the most rapidly increasingpopulations of older people, the need for nutri-tion-oriented programming for this cohort isgrowing. An article by Kidist Negash Weldey-ohannis of Help Age International (HAI) describesan eight-month nutrition (CMAM), water, sanita-tion and hygiene and livelihoods interventionprogramme in Ethiopia to target older people inseveral districts.
This was prompted by district assessments thatfound global acute malnutrition prevalence of10.5-15 per cent and a SAM rate of 1-1.1 per centamong older people. Programming was well in-tentioned but had limitations. Lack of RUTF suppliesto treat this older caseload meant supplementaryfood rations had to be used instead through aparallel programme as WFP had no capacity toabsorb an older caseload into its existing SFP.
In Ethiopia, there are no national guidelineson acute malnutrition management for this agegroup, data are not included in regular facilityreporting and older people are not routinely in-cluded in needs assessments. Resource con-straints generally limited integration with existingservices. The authors appeal for greater advocacy,capacity development and resource allocationby donors to meet the humanitarian needs ofthis neglected group. Given the current shortfallsin overall humanitarian resourcing to addressthe burden of child undernutrition, this ‘call forsupport’ does beg the question: how this canbe achieved? Absence of national guidelines isno surprise, given there is no international guid-ance on acute malnutrition in older people.Whose responsibility is this?
Finally, several research articles featured inthis issue highlight gaps, lack of knowledge and
blind spots in our sector. One paper presents anestimate of the prevalence and burden of childrenaged 6-59 months concurrently wasted and stunt-ed for 84 countries. These children are at evengreater mortality risk than those with SAM. Pooledprevalence was three per cent (0-8 per cent), cor-responding to nearly six million children concur-rently wasted and stunted – and is likely to be anunderestimate since it is based on cross-sectionaldata that does not capture incidence.
An article by Myatt et al takes a fresh look atroutine, cross-sectional survey data gathered byUNHCR over a number of years. It is argued thatbaseline and end line data comparisons fail tocapture the dynamic nature of programming be-tween these timepoints. Refugee populations inparticular are notoriously “unstable”, with campspopulations often in a state of dynamic flux. Thiscan confound survey results; e.g. those leavingmay be in a better nutritional state than thosearriving. The authors propose a new procedureusing single-survey data to try and account forthis population flux; more work is needed to testand develop new approaches.
Another article raises concerns over inadequatethiamine provision to critically ill inpatient SAMcases using current treatment protocols whichmay be contributing to significant morbidity andmortality outcomes; refeeding in those with bor-derline thiamine reserves can precipitate acutethiamine deficiency, which impacts survival andhas longer-term neurological consequences. Theauthors call for a reformulation of F75 and sup-plementation of breastfeeding mothers of com-plicated SAM infants under six months of age.
When it comes to acute malnutrition in infantsless than six months old, low birth weight infants(LBW) are getting renewed attention. They featurein a recent systematic review that examinedimpact of nutrition-specific and nutrition-sensitiveinterventions to reduce LBW incidence. Six inter-ventions were associated with a decreased riskof LBW: oral supplementation with vitamin A,low-dose calcium, zinc, multiple micronutrients;nutritional education; and provision of preventiveantimalarial drugs. An important research needis to distinguish impact of such interventions inwomen who are undernourished; only three ofthe 23 identified studies did such sub-analysis.
LBW infants were also a key discussion pointin a meeting of the Management of At riskMothers and Infants (MAMI) Interest Group, sum-marised in this issue. Researchers are examiningvulnerability of LBW infants and how this con-
tributes to the burden of acute malnutrition andmortality in both young infants and older children.Emerging findings suggest that LBW infants aremore likely to be identified as wasted and stuntedat birth and at six months; that elevated risk ofmortality persists beyond early infancy; and thatbeing LBW carries mortality risk that cannot bewholly accounted for by low weight. In otherwords, being born small is even worse than justbeing small.
Discussion at the MAMI Interest Group meetinghighlighted the limitations, as much as the po-tential, of nutrition interventions for this agegroup. Anthropometric indicators remain poorproxies for nutrition risk and do not exclusivelycapture it. Even labelling these infants as ‘acutelymalnourished’ carries the risk of inappropriateintervention and may discourage wider ownership(for example, by the health sector) if those iden-tified as high risk are seen as a ‘nutrition’ problem.The evidence gap for case definition is stark,albeit improving.
As a nutrition sector, we took ownership andled the way on CMAM, making enormous progressin scaling up effective treatment. However, therehas been a cost to locating CMAM within nutritionservices rather than health as we struggle to in-tegrate treatment of acute malnutrition withinhealth systems and structures.
Furthermore, our focus on treatment hasmeant prevention has largely been ignored. In-tervention approaches have been dominated byproduct delivery, especially when it comes tomoderate acute malnutrition. MAMI offers – andneeds – a fresh approach to identify and managehigh-risk groups led by health, as well as nutrition,experts from the outset, with prevention as aguiding principle. The MAMI Group has a richmix of nutrition, paediatric and mental healthprogrammers and researchers who are aimingto do just this. A critical next step, reflected inthe conclusions of the meeting, is a call for supportto ‘up the game’ and develop a Global MAMI Net-work with country-level research – robust ran-domised control trials and implementation re-search – at the heart of a shared agenda thatrapidly informs policy and practice.
I conclude with a reminder to get thinkingand writing about MAM treatment and preventionprogramming and research.
Happy reading,Marie McGrath, Co-editor Field Exchange
ENN is planning a special edition of Field Exchange on MAMprogramming. We are seeking articles that feature current and newprogramming and research approaches to prevent and treat MAM.This includes nutrition-specific programmes and multi-sector andnutrition-sensitive programming that includes MAM prevention ortreatment as an outcome. We especially welcome articles fromgovernment.
Submit your article ideas to the Field Exchange editors – send us aparagraph outlining the programming experience/research and keylearning points and share any relevant publications/reports.
Share this call with your colleagues and counterparts ingovernment.
More guidance on writing for Field Exchange and the support wecan provide is available at:https://www.ennonline.net/fex/writeforusThe deadline for finalised content to feature in the edition is 1November 2018.
Contact for submissions or further questions: Chloe Angood, FieldExchange sub-editor, [email protected]
Special edition of Field Exchange on MAM programming – call for articles
Field Articles..................................................
By Kidist Negash Weldeyohannis
Kidist Negash Weldeyohannisis a Regional Health andNutrition ProgrammeManager for HelpAgeInternational, Africa region,with a special focus onhumanitarian programming
and response. She has previously worked withUNICEF and CARE in related fields and has aMasters in Public Health.
The author acknowledges the United NationsOffice for the Coordination of HumanitarianAffairs Humanitarian Response Fund (UNOCHA-HRF) for financing the project described here, aswell as Dr Luca Saraceno and Dr JumaKhudonazarov for reviewing this article andproviding constructive feedback.
Location: EthiopiaWhat we know: Africa has one of the most rapidly increasing populationsof older people. There is a lack of national data on socioeconomicconditions and disease burden of older people in developing countries.
What this article adds: In 2016 a rapid assessment by HelpAgeInternational identified high prevalence of global acute malnutrition(GAM) among older people in two drought-prone zones of Ethiopia (10 to15 per cent). In response, HelpAge International intervened with anutrition, water, sanitation and hygiene and livelihood intervention.Community-based management of acute malnutrition was limited to use ofsupplementary food in this age group due to ready-to-use therapeutic foodshortfalls, health worker resistance and lack of relevant national guidelines.Complicated cases were referred to government services for treatment; aproportion received free care. External end-of-project evaluation waspositive in terms of reported improvement in wellbeing, health conditionsand weight gain (not quantitatively assessed). One quarter (26 per cent) ofrespondents were receiving relief food aid and 28 per cent were enrolled inthe productive safety net programme. Challenges included lack of nationalguidelines on acute malnutrition management, data on older people notincluded in regular facility reporting, and older people not routinelyincluded in needs assessments. Advocacy, capacity-building among localand international agencies to include and manage the older-age caseloadand greater investment by donors are needed.
Situation of older people inEthiopiaAfrica has one of the most rapidly increasingpopulations of older people. Despite theimpact of HIV/AIDS and other communicablediseases on life expectancy across the continent,people are living longer than ever before andthe proportion of older people in Africa hasincreased almost fivefold. Over 40 millionolder people aged 60 years and over live inAfrica; three million of whom are over 80years of age. By 2050 the population of olderpeople in Africa is projected to increase to204 million.
Due to limited availability of age-disag-gregated data, it is difficult to provide detailedanalysis of the socioeconomic conditions ofolder people in Ethiopia. However, the 2007Central Statistics Agency (CSA) census reportindicated that 3,565,161 (about 4.8 per cent)of the total population are 60 years old andabove (CSA, 2012). Of these, about 532,093(14.9 per cent) live in urban settings, whilethe rest (85.1 per cent) live in rural areas,which follows a similar pattern to the wholepopulation. e total number of older peopleis predicted to reach 5.3 million by 2020(CSA, 2012).
Like many other developing countries,older people in Ethiopia are vulnerable topoverty, food insecurity, malnutrition, limitedaccess to social and health services, and
limited options for livelihoods diversificationand security, regardless where they live (Hel-pAge, 2013). Furthermore, many older peoplerequire double protection in that they requirecare and protection themselves and at thesame time support children, grandchildrenand ageing spouses.
ere is also global evidence of a large in-crease in the burden of non-communicablediseases (NCDs) among older people in lowand middle-income countries, including car-diovascular diseases, hypertension, stroke,diabetes and dementia. In Ethiopia there iscurrently no countrywide research that showsthe effect of NCDs on the health of olderpeople, although the HelpAge study in 2012found that 75 per cent of older people surveyedwere suffering from one or more NCDs and,of these, only 75 per cent were receiving med-ical care (HelpAge, 2013). e shortage ornon-existence of people trained in geriatricsand the management of NCDs, the depriori-tising of older people for essential services,unaffordable healthcare costs and distancefrom health facilities all present major health-care problems for older people in Ethiopia(HelpAge, 2013).
Adequate food and nutritional intake arecritical for maintaining good health and area key determinant of people’s ability to surviveand recover from stresses and shocks in dis-aster-prone areas of developing countries.
Older people have specific needs in relation totheir general food intake, micronutrient re-quirements and palatability of food (See figure1). is makes them particularly vulnerable todisruptions in food security in times of crisis.In droughts and food shortage situations, wherethe price of food is generally high, older people,who are oen among the poorest, are frequentlyunable to afford enough food for themselvesand their families. Furthermore, in cases of foodinsecurity, older people may choose to give theirration to younger members of their family.
In addition to the worst impact of food inse-curity, various (physical, sensory and cognitive)negatively affect older people’s food intake andincrease their vulnerability to malnutrition. erisk factors underpinning undernutrition amongolder people are multiple and interconnected(see Figure 1). According to the 2013 vulnerabilityassessment among older people conducted by
HelpAge International in the Oromia, Amharaand Southern Nations and Nationalities Region(SNNPR) regions of Ethiopia, the percentage ofolder people with impairments ranged from31.8 per cent in Oromia to 54.2 per cent inAmhara regions (HelpAge and EEPNA, 2013).Common forms of impairments reported werevisual, physical weakness, mobility and hearing,which are highly related to poor production ca-pacity, less income, poor food intake and mal-nutrition (see Table 1).
Despite the growing body of evidence relatedto older people’s challenges in meeting their nu-tritional needs in emergencies, there are veryfew nutrition-specific interventions targetingolder people in humanitarian situations, in contrastto pregnant and lactating women (PLW) andchildren under five years old, for whom intensiveand targeted nutrition assistance is well-establishedpractice. e lack of nutrition programmes tailored
to older people also contrasts with basic human-itarian principles affirming that everyone has theright to humanitarian assistance which is impartialand non-discriminatory.
HelpAge assessments andresponseHelpAge conducted two rapid health and nu-trition assessments in Adami Tulu Jido Kom-bolcha woreda1 of East Shewa zone (2016) andTeltele woreda of Borena zone (2017). Both in-dicated very high levels of acute malnutritionamong older people, including a “serious” globalacute malnutrition (GAM) rate in Adami TuluJido Kombolcha of 10.5 per cent and a “crucial”GAM rate in Teltele of 15 per cent. e AdamiTulu Jido Kombolcha assessment was conductedin a belg-producing area2 following the failureof the Meher harvest, which explains to someextent the high level of malnutrition (althoughno baseline data are available to compare withother seasons). e assessments were based onthe rapid assessment method for older people(RAM-OP) which was developed in 2013 byHelpAge in collaboration with Brixton Healthand Valid International. It is not recommendedto assess bilateral pitting oedema in older peopleas oedema may be present due to other commonhealth conditions in this age bracket. Table 2summarises the findings of both assessments.
Results of the 2016 assessment were used toadvocate with donors for support to improvethe conditions of older people in this area andmeet their urgent needs. e United NationsOffice for the Coordination of HumanitarianAffairs-Humanitarian Response Fund (UN-OCHA-HRF) subsequently funded a project toprovide life-saving support to older people foreight months between April and December2016, implemented by HelpAge Ethiopia in fourworedas of Oromia region (Adami Tullu JidoKombolcha,Girar Jarso, Ziway Dugda and Abote).e project was implemented as a multi-sectorresponse, integrating nutrition with water, san-itation and hygiene (WASH) and livelihood in-terventions, where the nutrition component wasimplemented only in Adami Tulu Jido Kombolcha
Field Article
Impairment Oromia (%) Amhara (%) SNNPR (%)
Urban Rural Total Urban Rural Total Urban Rural Total
Respondents with some formof impairment
26.2 43.1 31.8 56.4 50.7 54.2 39.7 42.9 41
Visual 14.6 33.3 20.8 33.3 29.4 31.9 22.4 35.7 28
Weakness 10.7 13.7 11.7 42.1 32.4 38.5 19 16.7 18
Hearing 6.8 17.6 10.4 10.5 5.9 8.8 10.3 19 14
Psychological 0 0 0 5.3 8.8 6.6 0 0 0
Mobility 5.8 3.9 5.2 8.8 23.5 14.3 6.9 4.8 6
Table 1 Impairment among older people per region in Ethiopia, 2013
1 The woreda is the third tier of administrative division of Ethiopia. Woredas are further subdivided into kebeles or wards.
2 Belg is one of two rainy seasons per year (the shorter seasonbetween February and April), followed by the main meher rainy season from May to September.
and Girar Jarso woredas. While these two woredasbenefited from nutrition, WASH and livelihood,the rest were targeted for WASH only. Majoractivities undertaken under each sector:1. Nutrition: Community mobilisation and
screening, identification of acutely mal-nourished older people, referral of cases, provision of supplementary food, follow-upand referral of SAM cases to health facilitiesfor further medical support.
2. WASH: Rehabilitation of 15 water schemes that benefited 35,834 individuals, training of 124 WASH committees who manage the water points, promotion of hygiene and sanitation.
3. Livelihoods: Provision of seeds and agricultural tools for 9,118 households (wheat, maize and teff3), training of agricultural extension agents and facilitation of follow-up and support in cultivating the seeds. As a vulnerable group, all older people identified as malnourished have benefitted from the seed support.
Project activities andachievements e project areas are among the most drought-prone woredas in Ethiopia, where agriculturalproduction regularly suffers from erratic rainfalland periods of drought. As a result, communitiesare highly vulnerable to food insecurity andother disasters. In January 2016 both woredastargeted for the nutrition support were categorisedby the NDRMC/ENCU4 as hotspot priority one,following widespread El Niño-induced drought,which affected mainly the central highland partof six regional states during 2015 and 2016.
HelpAge implemented the nutrition com-ponent of the project using the community-based management of acute malnutrition(CMAM) approach, commonly used for thetreatment of children and PLW with acute mal-nutrition. is is in line with HelpAge guidelines,based on experience with Médecins Sans Fron-tières in South Sudan, which recommend im-plementation of all four components of CMAM:community mobilisation; targeted supplementaryfeeding for treatment of moderate acute mal-nutrition (MAM); outpatient therapeutic pro-gramme (OTP) for treatment of SAM withoutcomplications (using ready-to-use supplementaryfood (RUTF)); and stabilisation centres (SCs)(using therapeutic milks) for treatment of SAMwith complications. In practice it was not possibleto implement the full CMAM guidelines due tosupply shortages, resistance of some healthworkers and the lack of a national guideline;RUTF was not supplied by the regional healthbureau to support this project, so only supple-mentary food was given for the treatment ofMAM and SAM.
e activities were implemented throughtwo local partners: Ri Valley Children andWomen Development Organisation (RCWDO)and Sewasew Genet Children Development Or-ganisation (SGCDO). Before the start of theproject HelpAge trained 54 health workers(nurses and health officers), health extensionworkers (HEWs) and partners on basic principlesof malnutrition among older people, includingrisk factors, diagnosis, treatment, follow-up andprevention of acute malnutrition. e HelpAgeguideline for emergency nutrition response forolder people was used to conduct the training(HelpAge, 2011). Practical demonstrations weregiven on how to use mid upper arm circumfer-ence (MUAC) tapes and how to screen for ad-mission to SAM and MAM treatment pro-grammes. As this was a new approach, 15 com-munity health workers (CHWs) were also re-cruited and trained to lead and support theHEWs.
Intensive community mobilisation was con-ducted as part of the intervention by the projectteam, with the support of government at woredaand community levels in the two districts (HEWs,development agents and community manage-ment). Following mobilisation, people aged 60years and above were screened for acute mal-nutrition by the HEWs with the support ofproject staff, using simple colour-coded MUACtapes (see Table 3 for classification).
Due to funding constraints it was not possibleto cover the whole of both woredas, only selectedkebeles. ese were selected in consultationwith woreda officials and community leaderson the basis of the worst effect observed of thedrought. As the HEWs and CHWs were used toidentify and refer older people, it was assumedthat maximum coverage could be achieved, al-though no coverage survey was undertaken toprovide evidence of this.
Identified cases of SAM and MAM were pro-vided with a ration card for the receipt of sup-plementary food through a targeted supple-mentary feeding programme (TSFP) establishedby the project. A monthly ration comprised6.5kg of corn soya blend (CSB), 1 litre of vegetableoil and 1.5 kg of haricot beans. is was providedfor three to four months. is basket of supple-mentary food provided 1,186 kcal and 41.8g ofprotein per person per day. is interventionwas the first of its kind in both woredas andamong the first emergency nutrition responsesin the country to consider older people as avulnerable target group.
e World Food Programme (WFP) ran aconcurrent SFP in both target woredas, as withall priority one woredas; however, this was onlytargeted to children and PLW. It was not possibleto procure supplementary food from WFP forolder people within this programme due to sig-nificant funding constraints; therefore HelpAgeran a parallel programme, using food procuredin country. Discussion is ongoing with WFPand the Nutrition Cluster for future streamliningof programmes if the funding situation allows.
During the seven-month project period, sup-plementary food was provided to 1,898 olderpeople (965 of whom were older women) in thetwo districts. Of these, 1,733 were identified asMAM. e remaining 165 were older peoplewith SAM. Since the project had no resourcesfor supplies for the management of SAM or ca-pacity to treat associated medical conditions,SAM cases were provided with a supplementaryration and referred to government facilities forfurther treatment. rough continued discussionand collaboration with the health office at thedistrict level, it was possible for 29 cases ofSAM with other medical conditions to receivefree medical care in the health centre of AdamiTulu Jido Kombolcha woreda, in addition to re-
Field Article
Classification MUAC (mm)
Severe malnutrition MUAC <185
Moderate malnutrition 210 ≥ MUAC ≥185
No malnutrition MUAC ≥210
Table 3 MUAC cut-offs for olderpeople used in the TSFP
Source: HelpAge guideline on nutrition intervention for olderpeople in emergencies (2013)
3 An annual species of lovegrass native to Ethiopia and Eritrearaised for its edible seeds and a staple ingredient of the Ethiopian diet.
4 The Government’s National Disaster Risk Management Coordination Commission (NDRMCC) and the UNICEF-supported Emergency Nutrition Coordination Unit (ENCU).
ceiving supplementary food from the project.No information on associated medical conditionsor follow-up data was available for these referrals.e remaining SAM cases received supplemen-tary food only.
MUAC of each beneficiary was measuredmonthly by HEWs and CHWs to determinewhether discharge criteria were met. However,reliable data were not recorded and therefore itis not possible to know how many beneficiariesreached the discharge criteria within what time-frame. Data collection is an area that will beimproved in the future.
e Government of Ethiopia, WFP and de-velopment partners assist chronically food-in-secure people through transfers of food andcash during food-deficit periods under the Pro-ductive Safety Net Programme (PSNP). ereis provision within this strategy for unconditionalinclusion of older people in food-insecure house-holds. However, no analysis was made of howmany of the project’s beneficiaries were in receiptof PSNP support, although during the finalproject evaluation it was reported that 26 percent of respondents were receiving relief foodaid and 28 per cent were enrolled in the PSNP.HelpAge plans to focus on advocacy for accessto the PSNP by older people in the future.
Feedback from partners andbeneficiaries An external final project evaluation was con-ducted in February 2017. A total of 390 house-holds of older people were selected from thetargeted beneficiaries using proportion-to-pop-ulation size (PPS) sampling technique aer se-lecting 50 per cent of the targeted communitiespurposively. A desk review of relevant documentscomplemented seven focus group discussions(FGDs) with project beneficiaries and 26 keyinformant interviews (KIIs).
Beneficiaries, local officials and stakeholdersstated that the project contributed to a reductionin suffering and the prevention of life-threateningconditions among older people, particularly re-lated to critical food insecurity. Older peoplereported they felt valued in the communitywhen their nutritional needs were addressed,which was not the case during previous emer-gencies. Although quantitative evidence wasgathered on recovery from malnutrition, olderpeople reported that they had regained sufficientstrength to perform their day-to-day activities.
Reported positive impact on the wellbeing ofolder people included improved physical conditionand health status, such as weight gain, increasedstrength and greater ability to move from placeto place. According to the household survey, 45.6per cent of respondents reported improvementsin their health conditions; 26.9 per cent reportedimprovements in their physical conditions; suchas weight gain and increased strength; and 23.1per cent reported that their health status wasmaintained. Eight-two per cent of older people(321/390) surveyed felt the TSFP was very im-portant and relevant to their situation, while anadditional 16 per cent reported it as important.
Challenges and lessons learnedPoor attention and priority are given to olderpeople compared to children and women inemergency situations, particularly in terms of alack of life-saving interventions. While lack ofresources is the main constraint, there is alsolimited evidence of the vulnerability of olderpeople and the impact of addressing their needson household wellbeing. ere is also poor vis-ibility; older people are rarely included in na-tional-level needs assessments.
ere is no nationally adopted guideline inEthiopia for management of acute malnutritionamong older people and no mandate to includeolder people in screening for acute malnutrition.is contributes to resistance of donors andpartners to include older people as a vulnerablegroup.
Although the needs in the project area weregreat, available resources for the project werelimited, so it was only possible to implementthe project in parts of the target woredas (focusingon hotspot kebeles).
Data collection and reporting of this activitywas not included in regular health facility re-porting tools; this greatly affected the qualityand availability of data required to calculateimportant performance indicators such as curerate, default rate and death rate of enrolled ben-eficiaries. is issue will be mitigated in futureprograming by developing a strong monitoringand evaluation system to be rolled out at thebeginning of the project. Opportunities to inte-grate this into the existing Health ManagementInformation System (HMIS) are being explored.
Engagement of and creating awareness amongdecision-makers on the magnitude and seri-ousness of malnutrition among older peoplehas been crucial to the success of the programme.In Adami Tulu Jido Kombolcha woreda a decisionwas taken by the woreda administration andhealth office to use the available resources andadmit SAM cases for medical treatment, eventhough this was not specifically budgeted for.
It has also been observed that CMAM iswell integrated and resourced within governmentsystems in Ethiopia. e increase in caseloadthat would result from prioritising older peopleas a vulnerable group in nutrition emergenciescould be absorbed at community-level (assumingfood supplies are available); however resourcesmay be lacking to treat SAM cases with medicalcomplications (diabetes, high blood pressureand cardiovascular disease are common under-lying conditions) due to the lack of availabilityof therapeutic supplies. Discussion with theMinistry of Health (MoH), ENCU and UNICEFis underway to make the required resourcesavailable.
RecommendationsOlder people should be prioritised for supportin all humanitarian nutrition interventions,given their vulnerability to malnutrition, theirimportant role in the community and on thebasis of humanitarian principles.
Field ArticleAdvocacy and capacity-building work is
needed among local and international humani-tarian agencies to work towards the inclusionof older people in routine screening for acutemalnutrition and treatment programmes foracute malnutrition, and to encourage the use ofage and gender-disaggregated data to improvemonitoring for this age group.
National guidelines on the management ofacute malnutrition in Ethiopia must be revisedurgently to ensure that older people are includedin all aspects from assessment to service delivery.HelpAge has developed a guideline on emergencynutrition interventions for older people, whichcan be easily adapted to the local context ofEthiopia.
Nutritional guidelines for food distributionsuitable for older people must be integratedinto all health planning and response plans.
Health management information system(HMIS) data should be disaggregated by ageand sex and key indicators for older people in-cluded. Alongside this, HelpAge will developstrong monitoring and evaluation systems toenhance learning and improve performance offuture projects.
e needs of older people should be routinelyincluded in all four components of CMAM pro-tocols and programmes in Ethiopia, includingcommunity mobilisation, supplementary feedingprogramme, outpatient therapeutic programmeand stabilisation centre. Discussions with theMoH and ENCU have already begun to this effect.
Within the health care system, conditionsand needs common to older people should beintegrated into patient triage, clinical evaluation,treatment, the emergency medical response sys-tem and specialty care for SAM cases. Resourcesmust be mobilised to support the inpatient treat-ment of older people with SAM with medicalcomplications. Greater investment is needed bydonors to achieve this.
ReferencesBorrel 2001, Addressing the nutritional needs of olderpeople in emergency situations in Africa: Ideas for action.HelpAge International, Africa Regional DevelopmentCentre, Nairobi.
CSA 2012. 2007 population and housing census ofEthiopia. Central Statistical Authority, April 2012, AddisAbaba.
HelpAge 2011. Nutrition interventions for older people inemergencies: HelpAge Guidelines. Available from:file:///C:/Users/Chloe/Downloads/GuidelineNutrition.pdf
HelpAge 2013. The state of health and ageing in Ethiopia:A survey of health needs and challenges of serviceprovisions. HelpAge International Ethiopia, Addis Ababa.
HelpAge 2013a. Nutrition interventions for older peoplein emergencies.
HelpAge and EEPNA (2013) Vulnerability of older peoplein Ethiopia: The case of Oromia, Amhara and SNNPRegional States. HelpAge International Ethiopia, AddisAbaba.
HelpAge 2016. Rapid nutrition and needs assessment ofolder people in Adami Tulu Jido Kombolcha Woredas ofEast Shewa Zone, Oromia region, Ethiopia. February 2016.
EmmanuelleMaisonnave is theInstitutional KnowledgeBuilding Officer atSolidaritésInternational, where shefacilitates lesson
learning within the organisation.
Julie Mayans is FoodSecurity and LivelihoodAdvisor at SolidaritésInternational. She hasbeen working in thisfield for over ten years.Her job involves
providing technical support and capacity-building to field teams and producingtechnical guidelines.
The authors would like to acknowledgeSolidarités International’s team inBangladesh for its support in reviewing thecase study on which this article is based.
Location: BangladeshWhat we know: Bangladesh is the sixth-worst extreme weather-affected country inthe world, which negatively impacts agriculture, the main economic activity.
What this article adds: In 2016 Solidarités International (SI) supported vulnerablefarmers in Satkhira district to improve farming and livelihood resilience anddisaster-risk reduction activities, in close collaboration with the Ministry ofAgriculture (MoA). This involved supporting access to improved and resistant seeds;improving agricultural practices (better adapted to the micro-climate and soils); anddeveloping integrated farming (dual-crop system). SI teams elaborated businessplans with beneficiary farmers and distributed cash grants for sustainable farmingenterprises. A qualitative project review found diversification of agriculture activity(reduced monoculture), more resilient crop production, greater income generation(cash crops), greater yield per land area, increased awareness and practice ofsustainable farming activities and more diverse food access by households. Workingwith MoA agriculture extension workers is key to sustainable success.Transformation of agricultural products (e.g. mat making) provides importantincome-generating opportunities. Resilient seed banks may have a role inemergencies. Active communication with farmers is key to keeping them updatedon current farming techniques.
Resilientfarming inSatkhira,Bangladesh
A man shows some of the snake gourds he has producedwith support from the programme, Satkhira, 2016
Prince Naymuzzaman Khan
ContextAccording to the Global Climate Risk Index2017, Bangladesh is the sixth-worst extremeweather-affected country. e frequency andintensity of climatic events such as floods,droughts and cyclones have escalated, aggravatedby climate variability and change. Bangladeshis located in the largest river delta in the worldand is heavily reliant on the natural tide systemfor its prominent agricultural sector, particularlyin the southwest coastal region. With the impactof climatic changes and human activity, thecountry is experiencing dramatic environmentaldecline, making the region extremely vulnerableto hazards and natural disasters.
Satkhira is a district in southwest Bangladeshlocated on the bank of the Arpangachhia River.In the 1960s the government constructed a net-work of polders, embankments and drainagechannels in the coastal regions as defence againstwater intrusion and to increase agricultural pro-duction. Poor maintenance of sluice gates, designflaws and the gradual sedimentation of thecanals have contributed to serious waterloggingin the Satkhira region. During the monsoonexcessive rainfalls inundate the land and inade-quate drainage prolongs flooding. Great areasof land remain waterlogged for several weeksand sometimes even months (20 per cent of theland was severely affected by waterlogging in2015). is is aggravated by cyclones and sub-sequent storm surges and severe droughts. Highwater salinity also adds to the problem, causedby saltwater shrimp farming that requires largebodies of salt water; saltwater shrimping hasoccurred increasingly further inland since the1980s, sometimes using canals constructed bythe government, thereby blocking drainage andcausing more waterlogging. All these issuesgreatly affect the quality of the soil and threatencrop production.
Agriculture is the main economic activity inBangladesh, providing employment to over 45per cent of the population (Bangladesh Bureauof Statistics, 2015). Satkhira district is characterisedby smallholder subsistence agriculture, based ona saline wet rice ecosystem. Farmers generallyonly cultivate Aman rice, a type of monsoon-de-pendent rice sown in June/July and harvested inDecember/January. e rest of the year, farmerseither leave their land fallow due to salinity prob-lems or they cultivate fish and/or vegetables.Households own on average between 33 and 50decimals of land (less than 0.2 hectares). is isinsufficient for many farmers, who lease otherfields to extend their cultivation capabilities. Dueto the pressures described, small farmers livingin the coastal belt struggle to generate a decentstandard of living from their agricultural activitiesand are compelled to adapt their practices.
Intervention for resilientagricultural livelihoodsSolidarités International (SI) implemented dis-aster-risk reduction (DRR) activities in Satkhiradistrict between 2010 and 2016. It supportedcommunities to identify the impacts of the mainhazards and local capacities to face them, andto collaborate on ways they could reduce thesevulnerabilities. Based on risk-reduction actionplans (RRAPs) developed with communities atthe upazila (sub-district) and ward levels, it wasdetermined that specific support should be givento farmers to launch resilient farming and liveli-hoods activities, with the aim of mitigating theimpact of hazards and disasters and reducingtheir vulnerability. e aim of two projects im-plemented in Assasuni upazila1 , Satkhira district(the first in 2015; the second in 2016) was to
1 Specifically, these two projects were implemented in: Dhandia and Nagarghata unions in Tala upazila in 2015 and Borodal and Khajra unions in Assasuni upazila in 2016.
help the most vulnerable households cover theirbasic needs, while simultaneously laying thefoundations for sustainable and long-term liveli-hood recovery, thereby bridging short-term andlong-term humanitarian assistance. SI workedto enhance existing agriculture-based livelihoodsby promoting adaptation strategies and mitigationand preparedness techniques to reduce core vul-nerabilities. e intention was to encourage aproactive rather than reactive approach to enablecommunities to build on their own capacities tocope with disasters, should they strike.
ree components of the programme con-tributed to improved resilient farming: supportingaccess to improved and resistant seeds; improvingagricultural practices; and developing integratedfarming, each described in more detail below.ese activities were implemented in close col-laboration with two Agricultural Extension Offi-cers (AEOs) commissioned by the Ministry ofAgriculture (MoA) to work with agriculturalresearch institutions and disseminate new tech-
nologies, inputs and techniques at field level.e project was implemented in Assasuni andTala upazilas: Borodal, Dhandia, Khajra andNagarghata unions. A total of 390 farmers weresupported to develop integrated farming and1,000 households received a grant to buy seedsand equipment. SI’s team was made up of ateam leader and ten community mobilisers.
Supporting access to improved andresistant seedsTo secure food supply in Bangladesh, the devel-opment and use of high quality seeds that canadapt to certain unfavourable conditions (suchas waterlogging and salinity) is essential. Researchinstitutes, such as the Bangladesh Rice ResearchInstitute and Bangladesh Institute of NuclearAgriculture, are continuously creating new va-rieties of stress-tolerant seeds. However, small,isolated farmers are rarely aware of the charac-teristics of the new varieties and which ones areusable on their land and lack access to markets.SI encouraged the use of improved seeds andfacilitated access to them2 by providing cash tovulnerable farmers. Together with AEOs and SIcommunity mobilisers, beneficiaries identifiedthe stress-tolerant crops that could easily andefficiently be grown on their land.
Introducing sustainable agriculturalpracticesResilient farming entails using agricultural prac-tices that are better adapted and more sustainableto the pedo-climatic context (the specific mi-croclimate soils). Overall, farmers in Assasuniupazila were ignorant of new techniques andpractices that would enable them to cope betterwith worsening hazards such as salinity andwaterlogging. e project aimed to improvefarm management by using methods and tech-niques transferred to farmers by AEOs to suittheir specific environment. Examples includethe use of good quality seeds to improve germi-nation rates and yields; better soil preparationand sowing (line sowing; bed and furrow systemto enhance irrigation efficiency and reduce salin-ity; dosage of manure to fertilise the soil beforesowing; integrated farming; land preparation);timely irrigation and drainage (such as alternatewetting and drying technology to allow theleaching of the salts and mulching); use of naturalfertilisers and pest management, and land man-agement techniques in saline conditions.
Developing integrated farmingSingle crop farming is a risky enterprise, especiallyin a context of high hazard vulnerability andlow resilience capacity. Crops were also neededthat could provide a continuous and balancedsupply of food and income. Integrated farming,which is the combination of two or more farmingand livestock enterprises in a complementaryor supplementary way on a single plot of land,enables the optimisation of resources and landand consequently a maximum production perunit area. is technique is particularly adaptedto the coastal belt of Bangladesh; specifically, adual-crop system was found to be most suitedto Assasuni upazila. is involves integratedfresh water aquaculture (fresh water white fish
and prawns, which do not have the same negativeenvironmental impact as the salt water shrimppreviously farmed), alongside stress-resilientagriculture (paddy and vegetables, such as varioustypes of gourd, pumpkin, beet, spinach, cucumberand potato), with different enterprises accordingto the cropping season. In rice-fish-vegetablefarming, the paddy field is le open to encouragethe fish to enter and swim around the paddy.When water levels drop, the fish stay in theditches surrounding the rice field. e pond isused to water the vegetables growing on thesurrounding dykes (described in Table 1).
Demonstration plots were created to serveas venues to teach technologies and to demon-strate differences between traditional and ‘mod-ern’ techniques. ese aroused local interestand contributed to the acceptance and uptakeof these new techniques and seeds. Beneficiarieswith plots on their land were tasked with sharinginformation with non-beneficiaries to encouragedissemination further. No support was given toaccess markets as it was felt that sufficientdemand for the produce already existed.
Implementation SI teams elaborated business plans with benefi-ciary farmers and distributed grants for sus-tainable farming enterprises. A typical plan forthe distribution and use of a grant is describedin Table 2.
Impact of the interventionDirect observations and individual interviews,as well as analysis of logbooks kept by beneficiarieson the yields of their crops, revealed that theintervention contributed to securing the liveli-hoods of vulnerable farmers and their familiesin the target area. More specifically, the activitiesenabled the following results:
e spread of risks through thediversification of resilient sources ofincomeA key feature of livelihood resilience is to spreadthe risks of shocks and seasonality across severalsources of income. In preparing this project re-view, the authors were unable to assess concreteimpacts of risk-spreading, as no major climaticevent or disaster occurred. However, the efficiencyof diversification as a risk-reduction strategy isevident and has been demonstrated in numerousstudies (Gil et al, 2017). If one source of incomefails, the others can compensate, enabling thehousehold to cope. e project worked to reachthis objective in different ways.
First, diversification limited monoculturepaddy. Farmers were immediately encouragedto multiply the number of crops cultivated ontheir land. Vegetables grown included tomato,eggplant, pumpkin, various types of gourd, okra,long yard bean, water spinach, Indian spinachand amaranth. Secondly, better knowledge andaccess to improved seeds ensured more resilientsources of income. e T-Aman paddy varietiespromoted during the trainings are more resistant
2 SI prohibits the use of genetically modified organisms; theseeds were checked and validated before being distributed.
Box 1 List of criteria to identifyvulnerable farmers
• Village vulnerable to disasters• Household severely affected by
waterlogging in the past few years• High level of loss of livelihood and slow or
no recovery and/or coping strategies• Low level and irregular source of income
(less than 5,000 BDT per month)• Ownership of less than 0.5 acres of land• No access to adequate food sources• Socially vulnerable households (women and
elderly headed households; households withyoung children, disabled persons, pregnant women or sick persons).
to waterlogging and salinity and are higher-yielding. e average yield of hybrid seeds suchas BR-10 and BRRI dhan 49 is 5.5 tons perhectare, compared to 2.07 tons for traditionalJamaibabu rice. Similarly, cultivating salt-resistantvegetables throughout the year enabled betteryields and consequently bigger regular surplusesto sell on the markets. irdly, the spread ofrisks was further intensified by some farmersthrough the cultivation of resilient cash cropswith a potential added value. Examples of cashcrops cultivated were mele (a type of reed thatoriginates from the Sunbardan mangrove forestlocated along the Bay of Bengal which growswell in brackish water (water that has moresalinity than fresh water but less than sea water)and can survive in medium salinity level (EC 4to 8 ds/m) saline land and water) and/or jute,both highly profitable plants. In the case ofmele, farmers were supported to process it andtransform it into mats to generate added valueand more revenue. Mat weaving can be donethroughout the year, especially during the rainyseason, when other farming activities slow down.See Table 3 (seasonal calendar).
Interviews with farmers showed that thesethree components generated greater and moreregular incomes from several sources (see Box
1 for a selection of case studies). e averageincome per beneficiary implementing integratedfarming was 122,068 BDT, compared to 61,363BDT the previous year at the same period. reequarters (74 per cent) of beneficiaries said theyhad improved their income compared to theprevious year. Expanding the portfolio of farmingand non-farming activities increases farmers’ability to buffer a shock affecting one activity.Coupled with the use of more resistant varietiesof rice and vegetables, the diversity of cropsand products ensures that revenues are moresustainable and resilient.
Increased awareness of theimportance of sustainable farmingpractices
Natural resources in the coastal belt arefragile and must therefore be exploited in a sus-tainable and reasoned way to ensure that farmerscan maintain their rural-based livelihoods nowand in the future. e resilient farming inter-ventions were designed with sustainability inmind and the trainings promoted environmen-tally friendly principles. Integrated farming is aviable, low-cost, low-risk and sustainable activitythat enhances natural biological processes andlessens the degradation of soil quality, withmaximum output for minimum input. It is
better than rice monoculture in terms of resourceutilisation, diversity and productivity. e op-timisation of the land also contributes to reducingsalinity levels; when the land is le fallow, thesoil moisture evaporates and this consequentlyincreases the concentration of salts.
Moreover, natural fertiliser and pesticidetechniques were promoted during the trainings,including the use of organic compost or cowdung, bird perching, sex pheromone traps, netsto capture bugs, light traps, neem leaves andmanual control of insects. Farmers also learnedhow to mitigate the consequences of hazards bypreparing and managing their fields more care-fully. Example feedback from participants is in-cluded in Box 3.
e reduction of food insecurity andimprovement of dietse diversification of crops and increase in pro-duction have had nutritional benefits and haveprovided an important solution to food insecurityin Satkhira district. Regular increased crop pro-duction enables continuous access to food andcrop diversification provides a broader range offood items, such as grains, vegetables and fish,which leads to a more diverse diet. Interviewswith beneficiary farmers confirm this (see Box4). Moreover, because they could consume largerquantities of products from their farm, householdsreduced the share of food expenditures in theirbudget. No data on dietary diversity, food securityor household expenditure were available forthis period to provide evidence for this.
Lessons learned e process of writing this article enabled the au-thors to reflect on this programme and take stockof the intervention in Satkhira district regardingresilient farming practices to improve livelihoods.Several lessons were learned and recommendationsmade to improve future interventions:
Working in close collaboration with the AEOin charge of implementing the MoA’s directiveswas important to the success of the programme,especially regarding technical capacity-buildingand the long-term communication betweenagricultural state authorities and farmers. isrelationship can also facilitate the developmentof markets for transformed products and ofnew marketing channels.
Access to inputs must be carefully plannedto ensure sustainability; farmers must be trainedon seed storage and on ‘home-made’, simplepreventive and curative pest and disease treat-ments. Resilient seed banks can also play a keyrole in case of an emergency (if crops are de-stroyed by a flood, for instance) and must beimplemented closely with the local authoritiesand the MoA.
Demonstration plots were a veryefficient and effective method topromote good practices.e transformation of agricultural productsshould be considered to further spread the risksof crop failure and to generate more income byadding value to the raw product.
Box 2 Case studies of diversification of sources of income
Nirod and his wife Sobita-Rani expanded their mele production with part of the grant they received. In2015 they grew some mele on their 0.33 acres of owned land. In 2016 they rented 0.66 acres of land toaugment the production, making almost 60,000 BDT (over 600 €) from two harvests of mele. Almosthalf this income is from selling raw mele; the other half is from mat weaving.
Chanchala and her husband cultivated 480 kg of BR-11 Aman rice on 1.2 acres of land in 2015. In 2016they started integrated farming and changed to BR-10 and BRRI dhan49; they yielded 780 kg on thesame surface area.
Before 2015 Parimal produced rice and some fish separately for a total of 69,300 BDT (almost 700 €).With the help of the project, he started producing vegetables on the dykes surrounding his pond andpaddy field; he obtained 4,590kg of cucumbers, eggplants, papaya, beans, tomatoes, bananas, okra,Indian spinach and bitter gourd. He sold 3,860kg at different periods of the year for a total of 80,950BDT (800 €).
Box 3 Feedback from participants
“We had no idea about salinity management before. Now we know how to grow in saline conditions. Forexample, we cultivate very frequently so the salt doesn’t come out. If we let the land to rest, it will be moresaline.”
“The training we received helped us to improve the management of our land so we can have better yieldswithout damaging it. Now we transplant the rice in rows. We are able to manage weeds and we use organicpesticides. We have increased our visits to the fields and we monitor the crops more frequently, so we havebetter control of our fields. We also use cow dung as a fertiliser for rice. This has doubled our production –before we made four to five sacks of rice per year, now we make 11 to 12 sacks.”
Box 4 Feedback from participants
“Before, we could only take two meals a day and we were sometimes hungry. But since we started growingvegetables, we can eat three meals a day and we don’t have to spend so much money of food.”
“Integrated farming provides vegetables, rice and fish and in enough quantities for us to eat well and to sellsurpluses.”
Sharing information and communicationwith farmers is of prime importance in such acontext, where farmers need to continuallyrenew their techniques to adapt to changingand aggravating hazards and disasters.
SI hopes to conduct a follow-up impact as-sessment in 2018/19; however, lack of fundinghas meant continuation of this programme bySI was not possible. More broadly, funds for re-silience and livelihoods programming have di-minished, fuelled by the response to the currentRohingya crisis, which has been prioritised andis dominating agency response.
Conclusionse agricultural activities described here directly
addressed the livelihood vulnerabilities of Satkhi-ra’s disaster-affected communities. Marginalfarmers were assisted in the adoption of resilientfarming techniques and acquired reflexes andpractices to reduce risks associated with sea-sonality and to be more autonomous and resilient.e improved seeds that were promulgated canbe used for several seasons and the incomecreated should enable farmers to renew theirseed stock, buy or rent equipment and take onlabourers for land preparation.
is type of intervention is very valuable ina context of high-salinity and waterlogging.However, it must be noted that the consequencesof climate change and the occurrences of hazardsand disasters are very likely to worsen in the
coming decades. If the frequency and intensityof these disasters increase beyond what resilientpractices and varieties can bring as a solution,other non-farming livelihood options must beconsidered. According to researchers fromKhulna University (Zahangir and Salauddin,2015), stress-tolerant varieties have limitations:they might adapt to more adverse conditions,but the yields will be reduced and incomes willconsequently decrease. How long will resilientfarming therefore be a sustainable solution tosecuring the livelihoods of the vulnerable farmersof coastal Bangladesh?
A detailed case study of the experience de-scribed in this article is available. Better farm-ing practices for resilient livelihoods in salineand flood-prone Bangladesh. e experience ofSOLIDARITÉS INTERNATIONAL in Satkhiradistrict. May 2017. www.solidarites.org/wp-content/uploads/2017/06/Better-farming-practices-for-resilient-livelihoods-in-saline-and-flood-prone-Bangladesh-1.pdf
ReferencesBangladesh Bureau of Statistics, Ministry of Planning,2015.
Gil JDB et al. (2017) The resilience of integrated agriculturalsystems to climate change. Wiley Inderdisciplinary Reviews:Climate Change, vol. 8, no. 4, doi:10/1002/wcc.461.
Zahangir H and Salauddin S. Impact of adaptive agricultureand aquaculture in waterlogged and saline areas ofBangladesh: a case study on Satkhira district. Khulna:Khulna University, 2015.
Jan Feb Mar Apr May Jun Jul Aug Sept Oct Nov Dec
Season Rabi – winter Kharif 1 – dry season Kharif 2 –monsoon Rabi – winter
Food situation severefood gap
food gap food sufficiency severe food gap very severe food gap severefood gap
What we know: Low coverage of improved water, sanitation and hygiene (WASH) is recognised asan important contributor to the burden of undernutrition in Cambodia.
What this article adds: A recent study investigated barriers to WASH and nutrition integration inCambodia and identified opportunities to address them. Barriers included lack of technical guid-ance on integration, siloed governance and funding mechanisms, limited knowledge among per-sonnel outside specialities, donor-driven programme design and lack of clear leadership. ere is arisk that efforts to promote WASH-nutrition integration remain theoretical without moving to im-plementation. Stakeholders described several successful implementation strategies for integratedprogrammes. Cross-sector steering architecture is essential. Recommendations are made to addressbarriers and support routine implementation of integrated work.
1 Burnet Institute (2016) Final report: Study on WASH-nutritionbarriers and potential solutions. 10 August 2016.
Research .................................................................
Globally, it is estimated that half ofthe burden of child undernutritionis attributable to poor sanitationand hygiene (Prüss-Üstün and Cor-
valán, 2006). However, many water, sanitationand hygiene (WASH) programmes do not recog-nise their potential effect on nutrition, whilemany nutrition initiatives do not include WASH.In Cambodia nutrition and WASH outcomesremain poor by regional standards. One third(32 per cent) of children under five years oldare stunted and one quarter (24 per cent) areunderweight, while 43 per cent of the populationdo not have access to improved sanitation and35 per cent use a non-improved source of drink-ing water during the dry season (CambodiaDHS, 2014). Low coverage of improved WASHis recognised as an important contributor tothe burden of undernutrition in Cambodia(RESULTS UK, 2014) and integrated program-ming is an emerging priority for both governmentand development partners.
e purpose of this research was to supportfuture efforts to integrate WASH and nutritionin Cambodia by considering what barriers cur-
rently exist to integration and identifying op-portunities to address and overcome them. Astakeholder consultation was conducted withkey informants whose work relates to nutritionand/or WASH. Forty representatives from gov-ernment agencies, development partners andcivil society were interviewed, including national,provincial and district-level staff.
In terms of knowledge and learning, stakeholdersreported a growing evidence base to support in-tegration of WASH and nutrition and increasedawareness of global and local evidence. Meetings,trainings and workshops provide forums for learn-ing but are insufficient to foster progress towardsintegration, particularly at sub-national level. Spe-cific technical guidance on integration is needed.Priorities identified included the appointment offocal points on WASH and nutrition and the gen-eration of local evidence for linkages.
e policy environment is siloed. While thereare some strategies that draw together policiesacross multiple sectors, there is no single policythat relates to both WASH and nutrition. Apolicy framework that is supportive of integration
is needed, including a cross-sector strategy thatoutlines how existing WASH and nutrition poli-cies contribute to integrated efforts to improvenutrition outcomes. is should be backed upby action plans, supportive institutional arrange-ments and funding.
Effective collaboration requires clear leadership,with mandated leadership responsibilities withinexisting institutions. Currently, roles and re-sponsibilities are not clearly allocated acrosssectors or agencies. It is therefore unclear whois responsible for leading on specific aspects ofWASH, nutrition, or WASH-nutrition integration.While individual leaders can work across siloedinstitutions, this is challenging and thereforeinstitutional arrangements are needed that canconnect silos. As a first priority, national leadersshould provide clear leadership and guidanceto sub-national agencies. Coordination mecha-nisms should also be strengthened, with theclear allocation of leadership roles and respon-sibilities and the buy-in of high-level leaders.
Summary of research1
A boy draws water in a home-grown school feedingprogramme in Siemp Reap Province, Cambodia, 2016
In terms of governance, vertical governmentimplementation and funding structures for WASHand separate structures for nutrition are verywell established. It is therefore oen not feasibleto coordinate integration at sub-national level.A national-level coordination mechanism isneeded to negotiate an overarching strategy forintegration and agree which ministries will takeon which responsibilities. Opportunities shouldalso be explored to strengthen existing mecha-nisms that support development partner align-ment and consider how to streamline reportingfor government and development partners.
Funding for nutrition and WASH is limitedand there is concern that integration will increasecompetition for funds. is leads to territorialismabout sector mandates and discourages partic-ipation in cross-sector work. Stakeholders alsocommented that public and donor funding isusually siloed, whereas merged funding enablesintegrated work. Advocacy is needed to theMinistry of Economy and Finance for increasedbudget allocations for both nutrition and WASH,as well as to donors for increased mergedfunding opportunities.
Lack of personnel was identified as a majorconstraint to integration. Many people havelimited knowledge or interest in activities outsidetheir sector. It may be effective to bring togethermulti-sector teams of people with deep technical
expertise in one area, as well as to have institu-tionalised focal points, rather than championswho are more personality-driven. Stakeholdersreported strong emotional responses to inte-gration – including both fear of change andopenness to change – which can be expected toinfluence the success of integration efforts.Working relationships across sectors (withinand between organisations) must be cultivatedand supported and integration must be promotedin ways that reassure people of their responsi-bilities and mitigate territorialism.
For programmes implemented by civil society,programme design is driven by the prioritiesof the donor, which often relate to achievingpre-determined outputs rather than focusingon the achievement of broader outcomes. Stake-holders reported several suggestions for inte-grated design, including co-location; behaviourchange campaigns that include both WASHand nutrition messages; changes to supply-side WASH programmes; and delivery throughthe private sector. An integrated theory ofchange or causal framework would supportintegrated programme design. As a priority,current evidence should be used, including lo-cally generated evidence, during limited win-dows of opportunity in the design phase toensure that programmes are as up-to-date aspossible. There is a risk that efforts to promoteWASH-nutrition integration remain theoretical
without moving to implementation. Cross-sector steering architecture that is institution-alised rather than project-driven is essentialto support routine implementation of integratedwork. Stakeholders described several successfulimplementation strategies for integrated pro-grammes, including a single contract, shareddelivery platform and an integrated design thatis implemented in a segmented way.
In terms of monitoring, evaluation and re-porting, stakeholders are accountable to whatthey report on. is can discourage integrationwhere reporting lines are siloed and the currentinstitutional context promotes parallel, ratherthan joint, monitoring. Monitoring and evalu-ation provide an important opportunity to gen-erate local evidence through special studies.An integrated theory of change or causal frame-work is needed that includes the contributionof WASH to nutrition.
ReferencesCambodia Demographic and Health Survey 2014. PhnomPenh, Cambodia: National Institute of Statistics, Ministryof Planning and Directorate General for Health, Ministry ofHealth, 2015.
Prüss-Üstün A, Corvalán C (2006). Preventing diseasethrough healthy environments: Towards an estimate of theenvironmental burden of disease. Geneva: World HealthOrganization, 2006.
RESULTS UK. Undernutrition in the land of rice. London:RESULTS UK, 2014.
Effectiveness of food supplements in increasingfat-free tissue accretion in children with moderateacute malnutrition in Burkina Faso
Location: Burkina Faso
What we know: ere is no consensus on the effectiveness of lipid-nutrient supple-ment (LNS) compared to corn-soy blend (CSB) in the treatment of moderate acutemalnutrition (MAM), or on the role of key factors like milk and soy.
What this article adds: A randomised trial of 1,609 children aged 6-23 months withMAM conducted in Burkina Faso investigated the effectiveness of (a) matrix (i.e. LNSor CSB); (b) soy quality (i.e. soy isolate (SI) or dehulled soy (DS)); and (c) percentageof total protein from dry skimmed milk, in increasing fat-free tissue accretion. Com-pared to children who received CSB, fat-free mass index (FFMI) accretion increased inthose who received LNS. SI did not increase FFMI compared to DS, irrespective ofmatrix. Having 20 per cent milk protein was associated with greater FFMI accretionthan having no milk protein; this difference was not significant (p = 0.055), and therewas no effect of 50 per cent milk. LNS compared to CSB resulted in 128g (95% CI 67,190; p<0.01) greater weight gain if both contained SI, but there was no difference be-tween LNS and CSB if both contained DS. e study found that children mainlygained fat-free tissue when rehabilitated. LNS yields more fat-free tissue and higherrecovery rates than CSB. LNSs with DS may be improved by shiing to SI.
BackgroundModerate acute malnutrition (MAM) is widespreadamong children in low-income countries, affecting 33million children at any time (Black et al, 2013) and is arisk factor for morbidity, severe acute malnutrition(SAM) and death. ere is limited evidence to informrecommendations on the composition of supplementaryfoods to treat children with MAM. Supplementary foodsfor malnourished children are based on a matrix ofeither corn-soy blend (CSB) or lipid-based nutrient sup-plement (LNS). ere are substantial differences betweenthe two product types in nutritional composition, cost,how they are consumed and logistics needed for delivery.A key source of protein in CSB is soy; this is oendehulled soy (DS), which contains higher levels of anti-
Summary of research1
1 Fabiansen C, Yame ´ogo CW, Iuel-Brockdorf A-S, Cichon B, Rytter MJH, Kurpad A et al. (2017) Effectiveness of food supplements in increasing fat-free tissue accretion in children with moderate acute malnutrition: A randomised 2×2× 3 factorial trial in Burkina Faso. PLoS Med 14(9): e1002387.https://doi.org/10.1371/journal.pmed.1002387
nutrients (compounds impairing absorption ofminerals) compared to more expensive soy isolate(SI). e first LNS product (ready-to-use thera-peutic food) was developed to treat SAM andwas based on the nutritional composition of thetherapeutic milk F-100, containing high amountsof dairy products and no soy. More recently, arange of LNS products, some containing soy, hasbeen developed for treatment of MAM. e in-clusion of dry skimmed milk (DSM) in supple-ments improves the amino acid profile, providesminerals with high bioavailability and reducesthe content of anti-nutrients when it replacesvegetable protein sources, but also increases costs.ere is concern that children receiving LNSmight accumulate too much fat tissue.
Trials assessing the effects of supplements typ-ically use weight gain or nutritional recovery (i.e.weight-for-height z-score (WHZ) or mid-upperarm circumference (MUAC) above specific cut-offs) as the primary outcome and do not considerbody composition; however, inadequate accretionof fat-free tissue (i.e. muscle, organ tissue and
bone) impairs body function and health. e aimof this study was to investigate the effectivenessof matrix, soy quality and percentage of totalprotein from DSM in the treatment of MAM inincreasing fat-free mass (FFM) accretion.
MethodsBetween 9 September 2013 and 29 August 2014,a randomised 2×2×3 factorial trial recruited chil-dren aged 6 to 23 months with MAM in BurkinaFaso. e intervention comprised 12 weeks offood supplementation providing 500 kcal/day asLNS or CSB, each containing SI or DS; and 0, 20or 50 per cent of protein from milk. FFM was as-sessed by deuterium dilution technique. By di-viding FFM by length squared, the primary out-come was expressed independent of length asFFM index (FFMI) accretion over 12 weeks.Other outcomes comprised recovery rate andadditional anthropometric measures.
FindingsOf 1,609 children, four died, 61 were lost to fol-low-up and 119 were transferred out due to sup-
plementation being switched to non-experimentalproducts. No children developed allergic reaction.At inclusion, 95 per cent were breastfed, mean(SD) weight was 6.91 kg (0.93), with 83.5 percent (5.5) FFM. In the whole cohort, weight in-creased 0.90 kg (95% CI 0.88, 0.93; p<0.01) com-prising 93.5% (95% CI 89.5, 97.3) FFM. Comparedto children who received CSB, FFMI accretionincreased by 0.083 kg/m2 (95% CI 0.003, 0.163; p= 0.042) in those who received LNS. SI did notincrease FFMI compared to DS (mean difference0.038 kg/m2; 95% CI −0.041, 0.118; p = 0.35), ir-respective of matrix. Having 20 per cent milkprotein was associated with 0.097 kg/m2 (95%CI−0.002, 0.196) greater FFMI accretion thanhaving 0 per cent milk protein, although thisdifference was not significant (p = 0.055) andthere was no effect of 50 per cent milk protein(0.049 kg/m2; 95% CI−0.047, 0.146; p = 0.32).ere was no effect modification by season, ad-mission criteria, baseline FFMI, stunting, in-flammation or breastfeeding (p >0.05). Over the12-week supplementation period, LNS comparedto CSB resulted in 128 g (95% CI 67, 190; p<0.01)greater weight gain if both contained SI, butthere was no difference between LNS and CSB ifboth contained DS (mean difference 22 g; 95%CI−40, 84; p = 0.49) (interaction p = 0.017). Ac-cordingly, SI compared to DS increased weightby 89 g (95% CI 27, 150; p = 0.005) whencombined with LNS, but not when combinedwith CSB.
Overall, the recovery rate was seven per centhigher for LNS versus CSB (69 per cent versus62 per cent; p= 0.002), and the non-responserate was six per cent per cent lower (24 per centversus 30 per cent; p= 0.007); there was no differ-ence in development of SAM (7.3 per cent versus8.7 per cent; p= 0.31). ere were no significantdifferences between DS and SI with respect torecovery rate, non-response rate and risk of SAM.Likewise, there were no significant differencesbetween 0, 20 and 50 per cent milk protein in re-covery rate, non-response rate and risk of SAM.
A limitation of this and other food supple-mentation trials is that it is not possible to collectreliable data on individual adherence.
ConclusionsBased on this study, children with MAM mainlygain fat-free tissue when rehabilitated. Childrengiven LNS did not put on excessive fat and LNSyielded more fat-free tissue and higher recoveryrates than CSB. Results also show that currentLNSs with DS may be improved by shiing to SI.e role of milk relative to soy merits further re-search. ese findings support a wider use ofLNS in the treatment of children with MAM.e authors conclude that a switch to LNS wouldlead to greater gain of fat-free tissue and recoveryand would benefit millions of children.
ReferencesBlack RE, Victora CG, Walker SP, Bhutta ZA, Christian P, deOnis M et al. Maternal and child undernutrition andoverweight in low-income and middle-income countries.Lancet. 2013; 382:427–51. https:// doi.org/10.1016/S0140-6736(13)60937-X PMID: 23746772
A woman and her child enrolled in a targeted supplementaryfeeding programme in Damdégou, Burkina Faso, 2012
What we know: Low birth weight (LBW) is a major underlying cause of infant mortality and childhood mor-bidity; LBW is greatly affected by poor maternal nutrition and health.
What this article adds: A systematic review investigated evidence of effective nutrition-specific and nutrition-sensitive interventions during pregnancy for the outcome of LBW. A total of 23 systematic reviews were in-cluded, comprising 34 comparisons. Six interventions were associated with a decreased risk of LBW: oral sup-plementation with (1) vitamin A, (2) low-dose calcium, (3) zinc, (4) multiple micronutrients (MMN); nutri-tional education; and provision of preventive antimalarial drugs. MMN and balanced protein/energy supple-mentation had a positive effect on small-for-gestational age (SGA), while high protein supplementation in-creased the risk of SGA. High-dose calcium, zinc or long-chain n-3 fatty acid supplementation and nutrition-al education decreased the risk of preterm birth (PTB). Only three reviews performed sub-group analysis toevaluate the effect of interventions for women with different nutrition status. ere is a need to further ex-plore the evidence of nutrition-specific and nutrition-sensitive interventions to reduce LBW and to comparethe results in different populations, including distinguishing interventions between women who are under-nourished versus those who are adequately nourished versus those who are overweight/obese.
Low birth weight (LBW) is a major publichealth problem. Globally, approximately16 per cent of infants are born weighingless than 2,500 g, which represents more
than 22 million LBW babies per year (UNICEF,2017). Over 95 per cent of these infants are bornin low-income and middle-income countries. eWorld Health Organization (WHO) defines LBWas weight at birth less than 250 g, irrespective ofthe gestational age of the infant. LBW is a majorunderlying cause of infant mortality and childhoodmorbidity (Lawn et al, 2005). Additionally, thereis a clear association between LBW and increasedrisk for many diseases later in life, such as metabolicsyndrome, diabetes mellitus type 2, cardiovasculardiseases, hypertension and cancer (Reyes andManalich, 2005). Poor maternal nutritional statusis one of several contributing factors to LBW.Early nutrition-sensitive and nutrition-specificinterventions starting before or during pregnancyhave the potential to prevent LBW and decreasethe risks for adverse health outcomes of LBW in-fants. A systematic review was undertaken of theevidence for nutrition-specific and nutrition-sen-sitive interventions to reduce the risk of LBWand/or its components (preterm birth (PTB) andsmall-for gestational age (SGA)).
MethodsA comprehensive literature search was conductedin MEDLINE, EMBASE, CINAHL and the
Cochrane Database of Systematic Reviews (Sep-tember 2015). Systematic reviews of randomisedcontrolled trials (RCTs) focusing on nutritionalinterventions before and during pregnancy toreduce LBW and its components were eligiblefor inclusion. e methodological quality of theincluded reviews was measured using A Meas-urement Tool to Assess Reviews (AMSTAR),which uses 11 distinct questions to evaluate themethods used in the systematic reviews. eprimary outcome was LBW, defined as weightat birth less than 2,50 g, regardless of the gesta-tional age of the infant. Secondary outcomesincluded very low birth weight (VLBW) (lessthan 1,50 g), extremely low birth weight (ELBW)(less than 1,00 g), SGA (birth weight below thetenth percentile of gestational age), intrauterinegrowth restriction (IUGR) and PTB (less than37 weeks of gestation).
Results A total of 23 systematic reviews were includedcomprising 34 comparisons. Sixteen reviewswere of high methodological quality, six of mod-erate and only one review of low quality. Six in-terventions were associated with a decreasedrisk of LBW: oral supplementation with (1)vitamin A, (2) low-dose calcium, (3) zinc, (4)multiple micronutrients (MMN); nutritional ed-ucation; and provision of preventive antimalarialdrugs. MMN and balanced protein/energy sup-
plementation had a positive effect on SGA, whilehigh protein supplementation increased the riskof SGA. High-dose calcium, zinc or long-chainn-3 fatty acid supplementation and nutritionaleducation decreased the risk of PTB.
Vitamin A supplementation with other mi-cronutrients (iron + folate) compared with mi-cronutrient supplementation without vitamin Ahad a positive effect and reduced the risk ofLBW by 33 per cent. However, these findingsare from a study involving only HIV-positivewomen and, when comparing vitamin A sup-plementation alone versus placebo or no treat-ment, a reduction of LBW could not be observed.Other single-vitamin supplementations duringpregnancy did not show any benefits for pregnancyoutcomes such as LBW, PTB, SGA or IUGR.
In relation to mineral supplementation duringpregnancy, calcium and zinc were effective inimproving maternal and infant outcomes. Calciumsupplementation during pregnancy for preventinghypertensive disorders and related problems ledto 80 per cent reduction of LBW for women re-ceiving low-dose calcium (less than 1g per day).High-dose calcium (at least 1g/day) supplemen-
1 da Silva Lopes K, Ota E, Shakya P et al. Effects of nutrition interventions during pregnancy on low birth weight: an overview of systematic reviews. BMJ Glob Health 2017;2:e000389. doi:10.1136/ bmjgh-2017-000389
Research
Effects of nutritioninterventions duringpregnancy on lowbirth weightSummary of research1
tation during pregnancy reduced the risk of PTBby 24 per cent (high GRADE quality) but had noeffect on LBW. Zinc supplementation resulted ina 61 per cent reduction in LBW in one review fo-cusing on pregnancy outcomes in adolescentpregnancy. is result is in contrast, however, toa Cochrane review evaluating zinc supplementationduring pregnancy, which did not find a reductionof LBW rates but demonstrated that the inter-vention reduced the risk of PTB by 14 per cent(moderate GRADE quality). All included reviewson MMN supplementation demonstrated a positiveeffect on the risk of LBW (reduction ranged from10 per cent to 14 per cent) and SGA (reductionranged from 10 per cent to 17 per cent).
Another review concluded that protein andenergy supplementations contribute to an overallimprovement of women’s nutritional status andthereby decrease the risk of adverse pregnancyoutcomes. In this review, balanced protein/energysupplementation significantly reduced the riskof SGA by 21 per cent (moderate GRADE quality).On the other hand, high protein supplementationcompared with low or no protein supplementationwas associated with a 58 per cent increased riskof SGA (moderate GRADE quality), which in-dicates that high protein supplementation alonemight be potentially harmful for pregnant women(details on what constituted high/low proteinwas not provided in the review).
A review investigating the effect of marine n-3 fatty acids on the prevention of PTB and preterm
labour found a 39 per cent reduction of PTB butno effect on LBW. Although there was a beneficialeffect, the review concluded that general recom-mendations could not be given based on theirfinding due to the limited number of includedstudies and conflicting results from other studies.
Nutritional education appeared highly effectivein reducing the risk of LBW (96 per cent) andPTB (54 per cent, low GRADE quality); however,the evidence was derived from only three studies(one in Bangladesh, one in a rural area in Greeceand one in low-income African-American womenin the USA). Findings suggest that this inter-vention may be especially beneficial for under-nourished pregnant women, but results must beinterpreted with caution due to the limitedquality of included trials.
Pregnancy increases the risk of malaria in-fection and malaria infection is likewise associatedwith an increased risk of LBW. Consistently, twoincluded reviews show that successful preventionof malaria infection using antimalarial drugsduring pregnancy significantly reduced the in-cidence of LBW by 27 per cent.
Only three reviews performed sub-groupanalysis to evaluate the effect of interventions forwomen with different nutrition status. For example,MMN supplementation significantly reduced therisk of PTB for women with lower body massindex (BMI) but not among those with higherBMI. Further research should address nutritionalinterventions in various populations.
ConclusionImproving women’s nutritional status positivelyaffected LBW, SGA and PTB. Based on currentevidence, especially MMN supplementation andpreventive antimalarial drugs during pregnancymay be considered for policy and practice. How-ever, for most interventions, evidence was derivedfrom a small number of trials and/or participants.Furthermore, types of participants were not re-stricted to maternal nutrition status, even thoughit seems reasonable to suggest that the effect of anutritional intervention depends on this. Furtherresearch is needed to address nutritional inter-ventions in various populations (undernourishedversus adequately nourished versusoverweight/obese women). ere is a need tofurther explore the evidence of nutrition-specificand nutrition-sensitive interventions to reachthe WHO goal of a 30 per cent reduction in theglobal rate of LBW by 2025.
ReferencesLawn JE, Cousens S, Zupan J. Lancet Neonatal SurvivalSteering Team. 4 million neonatal deaths: when? where?why? Lancet 2005;365:891–900.www.ncbi.nlm.nih.gov/pubmed/15752534
Reyes L, Manalich R. Long-term consequences of low birthweight. Kidney Int 2005;68:S107–S111.
UNICEF 2017. United Nations Children’s Fund.Undernourishment in the womb can lead to diminishedpotential and predispose infants to early death 2014. www.data. unicef.org/ nutrition/low- birthweight. html(accessed 29 Jun 2017).
Location: Global
What we know: Complicated cases of severe acute malnutrition (SAM) are usually severely illwith comorbidities.
What this article adds: Complicated cases of SAM are likely to have low or borderline thi-amine reserves that can be rapidly depleted during refeeding. is precipitates acute thiaminedeficiency, which can have acute and long-term consequences in critically ill children. F-75thiamine content does not provide therapeutic dosage at typical volumes consumed to meetcurrent refeeding recommendations. Infants under six months of age with SAM managedwith breastmilk or diluted F100 or F75 are at greater risk of developing thiamine deficiency;breastfeeding mothers rarely receiving thiamine supplements. e authors propose that F-75is reformulated based on recommendations to administer 200 times the recommended dailyintake thiamine dose in the first few days of refeeding (up to 100 mg of thiamine /1,000 kcal;(7.5 mg/100 mL)) for early refeeding, almost 90 times more than the current F-75 content.Further studies are warranted to validate this ratio. For breastfed infants under six months oldwho do not receive F-75, both mothers and infants should be supplemented with thiamineduring the acute phase and throughout the breastfeeding period.
Severe acute malnutrition (SAM) is a life-threatening condition requiring urgenttreatment, with an under-five case-fatalityrate of around 15 per cent (Fergusson,
2009). Since community-based management ofacute malnutrition (CMAM) has become thestandard of care, the clinical profile of severeacutely malnourished patients admitted to hos-pitals or inpatient therapeutic feeding centres(TFCs) has changed. ese patients are usuallyvery ill and oen present with several comor-bidities, such as shock, sepsis and pneumonia.Refeeding syndrome is a potentially fatal com-
1 Hiffler L, Adamolekun B, Fischer PR and Fattal-Vavleski A. (2017). Thiamine content of F-75 therapeutic milk for complicated severe acute malnutrition: time for a change? Ann. N.Y. Acad. Sci., 1404: 20–26. doi:10.1111/nyas.13458 http://onlinelibrary.wiley.com/doi/10.1111/nyas.13458/full
Thiamine content of F-75 for complicatedsevere acute malnutrition:time for a change? Summary of research1
plication of patient mismanagement and can bemisinterpreted as cardiac failure, pneumonia orsepsis. It is characterised by electrolyte imbalancescaused by intracellular shis secondary to refeed-ing-induced insulin secretion (e.g. hypophos-phatemia, hypokalemia and hypomagnesemia).Insulin production and the resulting increase inglucose utilisation and thiamine body require-ments may also lead to thiamine deficiency.Complicated severe acute malnutrition (SAM)patients are at risk of thiamine insufficiency(Hailemariam et al, 1985) and critically ill patientshave higher thiamine requirements. e authorsof this article propose that the thiamine contentof F-75, the therapeutic milk formula used inthe early stabilisation phase of refeeding inpatients with SAM, now seems insufficient andtherefore F-75 should be reformulated.
Conditions and risk factorsleading to thiamine deficiencyin malnutritioniamine deficiency principally affects vulnerablechildren in communities where dietary habitsrely on refined processed cereals or tubers, suchas rice, wheat and cassava; notably in southeastAsia, Africa and the Americas. Reduced intestinalabsorptive capacity during environmental en-teropathy and malnutrition may lead to thiamineinsufficiency (sub-clinical low vitamin B1 levels).Gut microbiota is affected in malnourished chil-dren, which might further affect thiamine-uptake capacity. During critical illness there isa mismatch between cellular thiamine availabilityand the increased endogenous metabolic demandsbrought on by illness, which can trigger clinicalthiamine deficiency (thiamine insufficiency withclinical signs/and or low thiamine levels wellbelow reference values) in patients with pre-ex-isting insufficiency. iamine insufficiency orthiamine deficiency may be present in childrenwith SAM for these reasons. Rapid initiation ofnutritional rehabilitation during refeeding in-creases intracellular thiamine turnover, which,in a context of pre-existing low whole-body thi-amine stores, can precipitate the onset of truethiamine deficiency and may contribute to themortality of hospitalised SAM patients.
Consequences of thiaminedeficiency in critically illpatientsIntensive care patients with thiamine deficiencymay experience worse outcomes than other crit-ically ill patients. Recent evidence suggests thatthiamine administration to thiamine-deficient
adults with septic shock may significantly increasesurvival rate (Donnino et al, 2016). e follow-up of the survivors group of an outbreak of acutethiamine deficiency in Israel in 2003, secondaryto consumption of a thiamine-deficient soya-based infant formula, demonstrated long-termneurological consequences in the survivors group(Fattal-Valevski et al, 2005). is was especiallysignificant on the children’s language development,but they could also present years later with psy-chomotor impairment and seizures. ese datahighlight the importance of early interventionwhen thiamine deficiency is suspected to limitlong-term consequences. It also suggests encour-aging the use of pharmacological doses of thiaminein critically ill and severely malnourished childrenat high risk of thiamine deficiency.
Thiamine in F-75 milkTwo therapeutic preparations are used in thetreatment of patients with SAM: F-75 (75 kcal/100mL) in the initial stabilisation phase and F-100(100 kcal/100 mL) in the transitional and reha-bilitation phase. A 600-mL sachet of therapeuticmilk contains on average 0.5 mg of thiamine(1.1 mg/1,000 kcal, 0.083 mg/100 ml).
For the prevention of refeeding syndrome,the Cape Town Paediatric Interest Group andthe Sydney Children’s Hospital suggest the ad-ministration of 1-2 mg/kg of thiamine dailyduring the first week of SAM treatment. However,according to recently published recommendationsfor refeeding syndrome for children (Pulcinic etal, 2016), thiamine should be administered in adose of 50-100 mg intravenously or 100-300 mgorally during the first three days of refeeding; ata typical intake for a 10kg child, these childrenwould require 50 to180 times more thiaminethan they would currently receive based on F-75(over six months) or diluted F100/ breastmilk(under six months)2. is is similar to thethiamine dosage recommended during the firstfew days of refeeding in adults by Stanga et al(2008), which is 200 times higher than the rec-ommended daily intake (RDI) of thiamine inthe adult population (200–300 mg). However,high-dose thiamine at initiation of treatment isnot the current practice in humanitarian settings.Since it has been shown that children with com-plicated SAM have borderline thiamine stores,even a very cautious introduction of feedingsmay induce thiamine deficiency in the absenceof a considerable thiamine supplementation.
e average daily intake of thiamine from F-75/F-100 is 1-2 mg at most; one to four timesthe RDI for this paediatric group. is is even
more significant in infants under six months ofage with SAM, who are at greater risk of devel-oping thiamine deficiency. ese infants do notreceive RUTF or F-100 but only breastmilk ordiluted F-100 or F-75, while their breastfeedingmothers rarely receive thiamine supplements.
RecommendationsConsidering its exclusive use for in-hospitalmanagement of critically ill or complicated SAMpatients, the authors propose that reformulationof F-75 is warranted to supply a sufficientlyhigh dose of daily thiamine. e authors endorsethe recommendations to administer 200 timesthe RDI thiamine dose in the first few days ofrefeeding, which would translate to a pharma-cological dose of thiamine of up to 100 mg ofthiamine /1,000 kcal (7.5 mg/100 mL) for earlyrefeeding; this is almost 90 times more than thecurrent F-75 content of thiamine. Further studiesare warranted to validate the recommended thi-amine/caloric ratio of 100 mg/ 1,000 kcal as op-posed to the current 1.1 mg/1,000 kcal. iaminehas an outstandingly clean safety profile to date,with no upper dose limit, which should encourageclinicians to consider using it.
An alternative option would be to maintainthe current F-75 thiamine content and treat thecomplicated SAM patients systematically withoral or intravenous thiamine according to clinicalindications. However, for operational reasons,it would be reasonable to reserve thiaminetablets and vials for the treatment of clinicalthiamine deficiency or as a metabolic resuscitatorin non-SAM critically ill patients. In low-resourcesettings, which rely heavily on humanitarianaid, F-75 would be an optimal vehicle for highthiamine doses to prevent refeeding complicationsin SAM patients.
Finally, for both breastfeeding mothers andinfants under six months old who are malnour-ished, the diet should be supplemented withthiamine in the acute phase and throughoutthe breastfeeding period.
ReferencesDonnino MW, Andersen LW, Chase M et al. 2016.Randomized, double-blind, placebo-controlled trial ofthiamine as a metabolic resuscitator in septic shock: a pilotstudy. Crit. Care Med. 44: 360–367.
Fattal-Valevski A, Kesler A, Sela B-A et al. 2005. Outbreakof life-threatening thiamine deficiency in infants in Israelcaused by a defective soy-based formula. Pediatrics 115:e233–e238.
Fergusson P and Tomkins A. 2009. HIV prevalence andmortality among children undergoing treatment for severeacute malnutrition in sub-Saharan Africa: a systematicreview and meta-analysis. Trans. R. Soc. Trop. Med. Hyg. 103:541–548.
Hailemariam B, Landman JP and Jackson AA. 1985.Thiamin status in normal and malnourished children inJamaica. Br. J. Nutr. 53: 477–483.
Pulcini CD, Zettle S and Srinath A. 2016. Refeedingsyndrome. Pediatr. Rev. 37: 516–523.
Stanga Z, Brunner A, Leuenberger M et al. 2008. Nutritionin clinical practice – the refeeding syndrome: illustrativecases and guidelines for prevention and treatment. Eur. J.Clin. Nutr. 62: 687–694.
2 Recommended daily intake (RDI) for children is: 0-6m: 0.2mg; 6m-1y: 0.3mg; 1-3y: 0.5mg; 4-8y: 0.6mg.
A child is treated at severeacute malnutrition treatment
Introductione World Health Organization (WHO) estimatesthat 29 per cent of all women of reproductiveage and 38 per cent of pregnant women worldwideare anaemic, half of whom have iron-deficiencyanaemia (WHO, 2011). In Nepal, 41 per cent ofwomen aged 15 to 49 years and nearly half of allpregnant women suffer from anaemia (NDHS,2016). Adolescent girls are particularly vulnerableto anaemia due to menstrual blood loss, the de-mands of pubertal growth, vulnerability to in-fection and worm infestation, and reliance oniron-poor, staple crop-based diets (WHO, 2011a).An estimated 43 per cent of adolescent girls(aged 15-19 years) are anaemic in Nepal (NDHS,2016), with prior studies conducted in Nepal
1 The USAID-funded Suaahara II Good Nutrition Program aimsto improve health and nutrition among women and childrenin 40 out of 77 districts of Nepal. Suaahara II is supporting Government of Nepal in expanding the adolescents’ iron supplementation programme and improving health and nutrition behaviors among adolescents through capacity
building, school health programme, media mobilisation, monitoring and research.
Consumption of iron-rich foods among adolescentgirls in Nepal: Identifying behavioural determinantsBy Ajay Acharya, Pooja Pandey Rana, Bhim Kumari Pun and Basant Thapa
Ajay Acharya is a Family Planning Specialist for the USAID-fundedSuaahara II programme1. He holds a Masters of Public Health fromHebrew University of Jerusalem and has over five years’ experiencein nutrition, health quality improvement, family planning, healthsystem strengthening and maternal and child health.
Basant Thapa is a Family Planning Advisorfor the Suaahara II programme. He hasover 25 years’ experience in public healthin different organisations.
Bhim Kumari Pun is a Senior Integrated Nutrition ProgrammeManager for the Suaahara II programme. She has 25 years ofexperience in nutrition, newborn and child health andcommunity-based approaches and holds a Masters of PublicHealth from Hebrew University of Jerusalem, Israel.
Pooja Pandey Rana is Deputy Chief Partyfor the Suaahara II programme and hasalmost 20 years’ experience in multi-sectornutrition programming in Nepal.
The authors acknowledge Suaahara II/USAID for overall researchsupport. They also acknowledge Kenda Cunningham, Senior TechnicalAdvisor for Suaahara II, for her review, guidance and support in thedevelopment of this paper and Suaahara II district office in Kapilvastu,Nepal’s District Health Office in Kapilvastu, and Suaahara II field
Location: NepalWhat we know: ere are very high rates of iron-deficiency anaemia among adolescentgirls in Nepal, which has negative health consequences, particularly during adolescentpregnancy.
What this article adds: A 2017 study in Nepal investigated barriers and enablers of iron-rich food consumption among teenage girls in Kapilvastu, a terai (plains district) of Nepal.Ninety-four adolescent girls (mean age 15 years) were interviewed using a semi-structuredquestionnaire; participants were assigned to either a ‘doer’ (n=46), or a ‘non-doer’ (n=48)group, based on 24-hour recall of eating or not eating iron-rich foods. Most girls in bothgroups (91 per cent of doers and 92 per cent of non-doers) perceived that a main facilitatorfor the consumption of iron-rich foods was the availability of green leafy vegetables athome. Half of non-doers perceived that the lack of availability of iron-rich foods at homemakes it more difficult to consume iron-rich food, significantly more than non-doers. Sig-nificantly more non-doers than doers (p=0.002) perceived family income to be important(although only 19 per cent reported this). ere were significant differences in perceptionsbetween doers and non-doers regarding advantages of eating iron-rich foods (physicalgrowth and development, source of energy and protection from disease). Both groupswould benefit from nutrition education to address misconceptions. Parental support inconsuming iron-rich foods, particularly from mothers, was perceived as important in bothgroups, suggesting that other household members, especially mothers, should be includedin nutrition education programmes.
supervisors for support in data collection and field work. The authorswould also like to thank Shalini Suresh, Femila Sapkota, Subash Yogiand Indra Dhoj Kshetri for their support in conceptualising the analysis,draft writing and field work.
and India showing even higher prevalence inthis age group (50 per cent to 90 per cent). Irondeficiency in adolescents is associated withlowered attentiveness, memory, school perform-ance, school attendance and learning retention;stunted physical growth; delayed onset of menar-che; increased morbidity from infection; and re-duced physical capacity and work performance(WHO, 2011a). Anaemia during pregnancy in-creases the risk of fetal mortality and morbidity;low birth weight (LBW); and overall infant mor-tality, the risk of which is increased further inadolescent pregnancy (WHO, 2011a).
Adequate iron consumption in young girlscan improve cognitive performance and ironstores for later pregnancies (WHO, 2016). e
Ministry of Health (MoH) in Nepal recently in-troduced a weekly iron and folic acid (IFA) dis-tribution programme to adolescent girls in 12of its 77 districts. Nutrition education canimprove compliance in such programmes andeducation on diet and the importance of con-sumption of iron-rich foods can complementsupplementation. To inform this, it is importantto identify behavioural determinants (barriersand enablers) among those who consume iron-rich foods (‘doers’) and those who do not (‘non-doers’) within this age group. is study inves-tigates barriers and enablers of iron-rich foodconsumption among doer and non-doer ado-lescent girls in Nepal to provide this valuableinformation to policy makers, planners and im-plementers of such programmes.
MethodsCross-sectional data were collected in Januaryand February 2017 from one terai district (Kapil-vastu) in Nepal. A questionnaire was developedusing standard guidelines (Kittle, 2013) and trans-lated into Nepali. Sixteen data collectors weretrained for two days on its use. Enumerators werealso given a set of food cards each (pictorial cardsdisplaying local iron-rich foods) to aid interviews.Kapilvastu was selected because of its rich cultural,linguistic and ethnic/caste diversity. e districthas a population of almost half a million, includingmore than 100,000 adolescents, of whom about50 per cent are females (CBS Nepal, 2011). Multi-stage sampling was used and eight different com-munities were selected for data collection, basedon geographical location (north, south, east and
Not likely at all 26 (57%) 15 (31%) 25% 2.86 2.55 0.012
3. Divine will: Do you think that God approves of you eating iron-rich foods each day?
Yes 29 (63%) 23 (48%) 15% 1.85 1.75 0.102
Maybe 2 (4%) 7 (15%) 10% 0.27 0.29 0.090
No 15 (33%) 18 (33%) 5% 0.81 0.82 0.390
4. Culture: Are there any cultural rules/ taboos against eating iron-rich foods each day?
Yes 8 (17%) 6 (13%) 5% 1.47 1.41 0.354
Maybe 5 (11%) 4 (8%) 3% 1.34 1.3 0.473
No 33 (72%) 38 (79%) 7% 0.67 0.7 0.275
Table 2 Three most common responses per group
west) and participants were recruited voluntarily. In Kapilvastu,one municipality and seven village development committees(VDCs) were selected. Within selected VDCs and municipalities,eighteen wards (the smallest geographical unit in Nepal) wereselected for study inclusion.
Each enumerator collected data from three respondentsper day in the adolescents’ own homes. e first participantwas purposively selected by the female community healthvolunteer (FCHV) and the others were recruited by the first(snowball sampling). During the interview participants wereassigned to one of two groups, doer or non-doer. A doerwas defined as an adolescent girl who reported having eateniron-rich foods in the 24 hours prior to the interview. Anon-doer was defined as an adolescent girl who reportednot having eaten any iron-rich foods in the 24 hours priorto the interview. Data were collected from all 94 adolescentgirls approached for interview (46 doers and 48 non-doers)through face-to-face, in-depth, semi-structured interviews.
Each interview lasted up to 30 minutes; results wererecorded on paper and coded the same day. To ensure con-sistency of reporting, coding took place in groups of enu-merators through group discussion. Responses were compiledand analysed on an Excel barrier analysis tabulation sheetand in SPSS version 23.0.
Resultse analysis identified key factors that explain the differencesbetween adolescents who consumed iron rich-foods on theprevious day and those who did not. e mean age of re-spondents was 15 years and respondents ate three times onthe previous day on average. Tables 1 and 2 provide summaryinformation for the barrier and facilitator constructs generatedfrom the data. Important findings were: • A high proportion of doers (91 per cent) and non-doers
(92 per cent) perceived that access to green leafy vegeta-bles at home would make it easier for them to consume iron-rich foods; significantly more non-doers than doersperceived that greater family income would make it easier to consume iron-rich foods (p=0.002, 19 per centdifference), although the actual number of non-doers reporting this was low (19 per cent).
• Half of non-doers perceived that the lack of availability of iron-rich foods at home makes it more difficult to consume iron-rich food (significantly more than non-doers; p=0.042, 20 per cent difference).
• ere were significant differences between the two groups in their perceptions of the advantages of eating iron-rich foods. Doers were 3.9 times more likely than non-doers to believe that physical growth and develop-ment were a benefit (p=0.002, 27 per cent difference); non-doers were more likely than doers to report source of energy (p=0.001, 34 per cent difference) and protec-tion from disease (p=0.003, 28 per cent difference) as positive benefits. Girls in both groups commonly cited “general good health” as an advantage (63 per cent of doers and 67 per cent of non-doers).
• In terms of perceived negative consequences from eatingiron-rich foods, doers were more than twice as likely to say that there are no disadvantages (p=0.040, 18 per cent difference) and almost half of girls in both groups perceived diarrhoea and vomiting to be a negative consequence.
• ere was strong agreement within and between groupsof there being parental support for the consumption of iron-rich foods, with a particular emphasis on the positive role of mothers.
• A high proportion of girls in both groups perceived thatanaemia would be a serious health problem (52 per cent
Women discussing iron rich orange fleshedsweet potato with a community healthvolunteer, Prasiddha, 2017
Suaa
hara
II/P
rasi
ddha
of doers and 69 per cent of non-doers). • Doers were twice as likely as non-doers to
say it is unlikely that they would become anaemic if they eat iron-rich foods (p=0.012,25per cent difference).
• A high proportion of both doers (63 per cent) and non-doers (48 per cent) believed that God would approve of them eating iron-rich foods (although doers were more likelyto report this, the difference was not statistically significant) and mostrespondents in both groups reported that there were no cultural taboos against consuming iron-rich foods.
Discussion and conclusion e results of this study show that a main per-ceived facilitator for the consumption of iron-rich foods among adolescent girls in Nepal isthe availability of green leafy vegetables at home.is suggests behavioural change interventions
should target households and, in particular,members with influence over foods purchasedand consumed. In terms of household income,non-doers were more likely to cite low incomeas the reason for there being less green leafyvegetables at home, although the actual pro-portion reporting this was low. A 2014 adolescentnutrition survey in Nepal (Aryal et al, 2014)found no difference in anaemia prevalence byfamily monthly income, which suggests thatthis may not be as important as food choice.
e perceived positive consequences have asignificant impact on nutritional behaviour(Beydoun and Wang, 2008); hence nutritioneducation is important. Results from this studyshow that there is great opportunity to educateadolescent girls on nutrition to emphasise thepositive benefits of consuming iron-rich foods,address misconceptions about the disadvantagesof consuming these types of food, and draw
linkages between iron-rich foods and anaemia.is seems to be important for both groups,particularly for non-doers. is study is aninitial step in filling gaps in understanding theinfluences on the dietary practices of adolescentgirls in Nepal; additional research is needed,particularly in other parts of the country. istype of research is crucial for designing policiesand programmes to improve the consumptionof nutritious foods, such as iron-rich foods, andultimately to improve the health and nutritionalstatus of this population.
For more information, contact: Ajay Acharya,email: [email protected]
ReferencesAryal K, Mehta R, Chalise B et al. Adolescent NutritionSurvey in Nepal, 2014. Nepal Heal Res Counc. 2016.
Beydoun MA, Wang Y. How do socio-economic status,perceived economic barriers and nutritional benefits affectquality of dietary intake among US adults? Eur J Clin Nutr.2008;62(3):303-313. doi:10.1038/sj.ejcn.1602700.
CBS Nepal 2011. National Population and Housing Census2011(National Report). Gov Nepal, Natl Plan Comm SecrCent Bu reau Stat. 2012;1:1-278. http://cbs.gov.np/?p=2017
Kittle BL. A Practical Guide to Conducting a Barrier Analysis.2013:1-186. www.coregroup.org/storage/barrier/Practical_Guide_to_Conducting_a_Barrier_Analysis_Oct_2013.pdf
NDHS 2016. Ministry of Health Nepal. Nepal Demographicand Health Survey 2016 Key Indicators. 2016:68.https://dhsprogram.com/pubs/pdf/PR88/PR88.pdf
WHO 2011. World Health Organization. The GlobalPrevalence of Anaemia in 2011. WHO Rep. 2011:48.doi:10.1017/S1368980008002401.
WHO (2011a). World Health Organization. Prevention ofiron deficiency anaemia in adolescents: role of weekly ironand folic acid supplementation.
WHO 2016. Guideline: Daily iron supplementation in adultwomen and adolescent girls. Geneva: World HealthOrganization; 2016.
Location: GlobalWhat we know: Agriculture has strong potential to improve nutrition outcomes throughimproving food availability and access and through enhancing household food security,dietary quality, income and women’s empowerment.
What this article adds: A review was undertaken of 45 papers summarising empirical ev-idence (since 2014) including findings from impact evaluations of a variety of nutrition-sensitive agriculture (NSA) programmes and observational studies that document link-ages between agriculture, women’s empowerment and nutrition. Results show that NSAprogrammes improve a variety of diet and nutrition outcomes in mothers and children.e review found marked improvements in recent studies in design, quality and rigour.To improve outcomes, NSA programmes should include health behaviour change com-munication (BCC); interventions to empower women; actions to improve health and wa-ter, sanitation and hygiene (WASH); and provide micronutrient-fortified products. Con-textual, cultural, economic and food environment factors modify the impacts of agricul-ture on nutrition outcomes, with markets and women’s empowerment being among themost important. More research is needed into sustainability, scale-up and cost-effective-ness of NSA programmes and understanding their role in, contributions to, and interac-tions with markets, the food environment and local and national food systems.
Nutrition-sensitive agriculture: What have welearned and where do we go from here?
Agrowing number of governments, donoragencies and development organisationsare committed to supporting nutrition-sensitive agriculture (NSA) to achieve de-
velopment goals. Although consensus exists on path-ways via which agriculture may influence nutrition-related outcomes, empirical evidence on agriculture’scontribution to nutrition and how it can be enhancedremains weak. is paper reviews recent empiricalevidence (since 2014), including findings from impactevaluations and observational studies that documentlinkages between agriculture, women’s empowermentand nutrition, as well as pathways, mechanisms andcontextual factors that affect where and how agriculturemay improve nutrition outcomes.
1 Marie T. Ruel, Agnes R. Quisumbing, Mysbah Balagamwala 2017. Nutrition-Sensitive Agriculture: What Have We Learned and Where Do We Go from Here? IFPRI Discussion paper.
Methods e search strategy was restricted to articlesand papers published in English since a summaryof evidence reviews by Ruel and Alderman in2013 that document results of impact evaluationsand observational studies of the linkages betweenagriculture, women’s empowerment and nutrition.Aer removing duplicates, the total number ofpapers found was 6,664. Aer screening theirtitles and abstracts using agreed inclusion andexclusion criteria, 43 papers remained. Additionalarticles were added based on knowledge of theauthors and health experts, leaving a final totalof 45 articles. Papers were included that studiedthe impact of the following agricultural pro-grammes: biofortification, homestead produc-tion/home gardening, irrigation, value chains,livestock and agricultural extension; and theimpact on the following nutrition outcomes:anthropometry, infant and young child feeding(IYCF) knowledge and practices, anaemia/haemo-globin; dietary diversity (DD), macronutrientintake and micronutrient intake.
Results Interventions studies Impact evaluations were reviewed that usedmostly experimental or quasi-experimental designs.A variety of programmes were included, all ofwhich focused on promoting production diversityand increasing access to nutritious foods such asbiofortified staple crops, nutrient-rich vegetablesand fruits, and animal-source foods.
e most consistent finding was the positiveimpact of these studies on household and childDD and on the consumption of animal-sourcefoods or fruits and vegetables. Positive impactson micronutrient intakes were also found instudies that measured dietary intake through a24-hour recall in diverse settings and through avariety of programme models, including bio-fortified, vitamin A-rich, orange-flesh sweet po-tato (OSP), gender-sensitive enhanced homesteadfood production (EHFP), livestock and dairyvalue chain programmes, and a fruit and vegetablesolar market garden (SMG) irrigation pro-gramme. Overall, these programmes were highlysuccessful in meeting their production and con-sumption goals and, more specifically, in achiev-ing their main objective of improving householdand individual access to nutrient-rich foods.
A new set of studies also documented evidenceof the impacts of EHFP (with chickens) on child
haemoglobin (Hb) and anaemia in Burkina Faso(Olney et al, 2015) and Nepal (Osei et al, 2017).In Burkina Faso, a group that received a two-year EHFP programme with behaviour changecommunication (BCC) delivered by a healthcommittee member saw significant increases inchild haemoglobin levels (Hb) (+0.7g/dL) andreductions in anaemia (-14.6ppts) in children3.0-5.9 months of age, compared with a control.Other studies also produced evidence that agri-cultural programmes could be effective platformsto deliver micronutrient-fortified products tar-geted to young children. Of the six studies thatmeasured child anthropometry, however, nonefound an impact on stunting and impacts onwasting were small or marginally significant.
Overall, the new studies have expanded thebreadth of agricultural programmes studied andthe set of nutrition outcomes measured in children.New studies also started to document some ofthe untapped potential of agriculture to improvewomen’s nutritional status, especially in countrieswhere maternal undernutrition is a critical problem(Burkina Faso, Nepal and Zambia).
e range of effects on production and con-sumption varied between studies, but in generalimpacts on maternal and child DD, food intake,micronutrient status and weight-specific nutri-tional status indicators were modest. For stunting,the lack of impacts may be explained at least inpart by the relatively short duration of mostprogrammes (one to two and a half years) andthe wide age range targeted by many, whichwas oen well beyond the first two years of life,when the greatest benefits on child growth fromnutrition interventions can be expected.
Several new studies specifically documentedimpacts along the project-specific hypothesisedpathways, strengthening the plausibility ofimpacts on maternal and child diets and nutri-tional status outcomes. e review also foundmarked improvements in recent studies both inprogramme design and in the quality and rigourof impact evaluations.
Observational studies e second set of studies reviewed were obser-vational studies that document associations be-tween agricultural practices and nutrition out-comes. An exceptionally large number of suchstudies have been published in the past threeyears; many focusing on the importance of pro-duction diversity for household, maternal and
child diets. e main takeaway from this literatureis that production diversity and livestock own-ership are consistently associated with householdand child DD and increased intake of essentialmicronutrients. Livestock ownership is alsospecifically associated with greater animal-sourcefood intake (especially milk in young children).Evidence of associations with health and nutri-tional status outcomes is still limited, but milkintake (in households that own livestock) ispositively associated with child linear growth.
A second takeaway from this literature is thatassociations between production and consumptiondiversity were modified by contextual factors,the most important being market access. Othercontextual, socioeconomic and food environmentfactors were also identified as important effectmodifiers of the associations between production,consumption and nutritional status. e qualityof the association studies varied but was alsogenerally better than that of earlier studies, withgreater attention paid to using appropriate sta-tistical modelling tools, controlling for potentiallyconfounding factors, using robustness checks asneeded and focusing on appropriate age groupsfor nutritional status indicators.
ConclusionsFindings show that NSA programmes improve avariety of diet and nutrition outcomes in bothmothers and children, especially when they includenutrition and health BCC and interventions toempower women. Greater benefits for child nu-trition are achieved when programmes incorporateactions to improve health, WASH and providemicronutrient-fortified products. Findings suggestthat NSA programmes should focus on improvingaccess to and consumption of high-quality dietsfor all household members, rather than on reducingchildhood stunting. A variety of contextual,cultural, economic and food environment factorsalso modify the impacts of agriculture on nutritionoutcomes, with markets and women’s empower-ment being among the most important. Researchpriorities include documenting the sustainability,scale-up opportunities and challenges, and cost-effectiveness of NSA programmes and under-standing their role in, contributions to, and inter-actions with markets, the food environment andlocal and national food systems.
ReferencesOlney DK, Pedehombga A, Ruel MT and Dillon A. 2015. A2-year integrated agriculture and nutrition and healthbehavior change communication program targeted towomen in Burkina Faso reduces anemia, wasting, anddiarrhea in children 3-12.9 months of age at baseline: acluster-randomized controlled trial. Journal of Nutrition 145(6): 1317–1324. doi:10.3945/jn.114.203539.1.
Osei A, Pandey P, Nielsen J, Pries A, Spiro D, Davis D, QuinnV and Haselow N. 2017. Combining Home Garden, Poultry,and Nutrition Education Program Targeted to Families withYoung Children Improved Anemia among Children andAnemia and Underweight among Nonpregnant Women inNepal. Food and Nutrition Bulletin 38:49–64.doi:10.1177/0379572116676427.
Ruel MT and Alderman H. 2013. Nutrition-sensitiveinterventions and programmes: how can they help toaccelerate progress in improving maternal and childnutrition? Lancet 382:536–551. doi:10.1016/S0140-6736(13)60843-0
By Tui Swinnen, Jeremy Shoham and Carmel Dolan,with input from Charulatha Banerjee, LillianKaranja-Odhiambo and Ambarka Youssoufane
This work was carried out as part of ENN’s workunder the Technical Assistance for Nutrition (TAN)programme funded with UK Aid from the UKGovernment. ENN acknowledges all people whospoke to our team in Senegal, Kenya and Nepalduring the field work to produce these three casestudies for generously sharing their experience andinsights with us. We would also like to thank themany reviewers who gave valuable feedback ondrafts of this work.
Background ENN has published a series of case studieson multi-sector nutrition programming atthe sub-national level as part of its KnowledgeManagement (KM) work under the UK De-partment of International Development(DFID)-funded TAN programme (supportinglearning within the Scaling Up Nutrition(SUN) Movement). ENN’s objective was toconstruct detailed descriptions from sub-national and implementation levels of howsectors are working together to implementprogrammes and how new programme ap-proaches fit within existing institutional ar-chitecture. For practitioners and policymakersworking in nutrition, limited evidence anddocumentation is available on how nutri-tion-sensitive (see Box 1) and multi-sectorprogrammes are being operationalised andhow these interact with existing institutionalarchitecture and structures at the sub-nationallevel. Documentation has oen centredaround national policies, strategies andframeworks and guidance available is stillfairly generic and ‘top down’. is series ofcase studies aims to help fill this gap by pro-viding important lessons learned to helpshape future approaches and practice.
is work comprises three country casestudies from selected ‘high achieving’ SUNcountries with a strong track record in cham-pioning and improving undernutrition: Kenya,Nepal and Senegal. e case studies are basedon fieldwork and interviews conducted byENN’s Regional KM specialist team in late2017. In each country, two districts (or coun-ties) were selected to explore in detail howinstitutional change and commitments at thenational level have translated into new typesof programmatic approaches at the imple-mentation level, as well as how concepts ofmulti-sectorality and nutrition sensitivity arebeing understood and operationalised. Withineach focus district a specific multi-sectorprogramme was examined. In Kenya, focusdistricts were Homa Bay and Makueni (withsome field work also in Busia); the focusprogramme was the United States Agencyfor International Development (USAID)-funded agri-nutrition programme AcceleratedValue Chain Development (AVCD). In Nepal,the district of Jumla was selected from thewestern mountains region and Kapilavastufrom the Terai, with a focus on the govern-ment-led Multi Sectoral Nutrition Plan(MSNP) phase 1. In Senegal, focus districts
Tui Swinnen is the GlobalKnowledge ManagementCoordinator for ENN.
Jeremy Shoham is an ENNTechnical Director, co-editor ofField Exchange, and co-lead onENN’s knowledge managementsupport to the SUN Movement.
Carmel Dolan is an ENN TechnicalDirector, co-editor of the ENNpublication Nutrition Exchange,and co-lead on ENN’s knowledgemanagement support to theScaling Up Nutrition (SUN)Movement.
Charulatha Banerjee is AsiaRegional Knowledge ManagementSpecialist for ENN.
Lillian Karanja-Odhiambo is EastAfrica Regional KnowledgeManagement Specialist for ENN.
Ambarka Youssoufane is West andCentral Africa Regional KnowledgeManagement Specialist for ENN.
The case studies and synthesis identify five types of programme or adaptations that can render anintervention increasingly sensitive to nutrition:• Multiple sectors converge on nutritionally vulnerable households or demographic groups to
offer programmes services; e.g. targeting of services to first 1,000 days households.• Multiple sectors converge at the level of village or commune believed to be vulnerable to
undernutrition; e.g. agriculture and health workers use the same list of target beneficiaries to deliver complementary agriculture and nutrition inputs within the same village commune.
• Nutrition messaging is incorporated into the work and activities of other sectors; e.g. education curricula changes to include nutrition components, nutrition behaviour-change communication(BCC) within a social protection programme.
• Nutrition-sensitive sectors change or add inputs into programmes; e.g. replacing poultry with milk-producing animals, introducing seeds for fortified crops, changes in hardware.
• Nutrition-specific platforms utilised to introduce nutrition-sensitive messaging from other sectors; e.g. food and personal hygiene, need for dietary diversity, etc.
Box 1 Making programmes nutrition-sensitive
Exploring multi-sectorprogramming atdistrict level inSenegal, Nepaland Kenya
Location: Kenya, Somalia, NepalWhat we know: ere is a shi towards devolved governance in many countries; therehas been little examination of its impact on multi-sector nutrition programming.
What this article adds: A series of three country case studies and accompanyingsynthesis by ENN describe how multi-sector programme implementation at sub-national level in three ‘high achieving’ SUN countries. In each country, two districtswere explored in depth, and within each, a specific multi-sector programme examined.e studies find that devolution is changing the nutrition landscape, with implicationsfor programmes, policies and funding arrangements. Coordination guidance is gearedtowards national level; sub-national coordination is challenging and has evolved in away that is “loose”, “unstructured” and “opportunistic. ere is a lack of robust data onhousehold’s receipt of comprehensive sector support. None of the programmesexamined collected data on the additional cost of implementing multi-sector nutritionsector programming and have not yet developed robust monitoring systems able todemonstrate their nutrition impact. ere are diverse understandings of what‘nutrition sensitivity’ means among the many stakeholders consulted.
were Matam in the north east, bordering the Sa-hara desert, and Kédougou in the south east,with a main focus on the multi-sector PINKKproject in Kédougou and the (now complete)Yaajeende project in Matam. e range of focusdistricts reflects the significant diversity thatexists within these countries in terms of patternsof malnutrition, socioeconomic status of thepopulation and ecological zones. is providedinsights into how national infrastructure, plansand approaches are adapted to different regions.
A synthesis document shares key findings andobservations on the realities of multi-sector pro-gramming based on the three case studies. Emerg-ing changes to practice are discussed, as are chal-lenges and opportunities that sub-national-levelstakeholders are experiencing. Key findings fromthe synthesis are summarised in box 1.
DevolutionHigh-level commitments around stunting andwasting reduction, along with other improve-ments in nutrition, must take account of districts’or counties’ plans, capacities and resources. eshi towards devolved governance in manycountries means that careful analysis is necessaryto understand how this may positively or nega-tively impact the drive towards multi-sector nu-trition programming. Little or no work has beenconducted on the impact of devolution on mul-ti-sector nutrition programming to date.
e case study countries are at differingstages of decentralisation or devolution, but inall three the trend is towards the decentralisationof power, with budgeting, coordination and im-plementation increasingly being decided sub-nationally. is is changing the nutrition land-scape and has implications for the design offuture national programmes, policies and fundingarrangements.
Although understanding of the impact ofdevolution on multi-sector nutrition program-ming in the three case study countries waslargely impressionistic, a few issues are note-worthy. In Kenya, there was a strong sense thatdevolution has facilitated multi-sector engage-ment at sub-national level as there is less bu-reaucracy. In Nepal, the impression was thatdecentralisation will create new opportunities,but also significant challenges, especially withrespect to resourcing and capacity. ere is alsoa frustration that, while data produced throughmonitoring of national nutrition efforts at thesub-national level is being collected centrally,there is scarcely any feedback from nationallevel. In Senegal, there was a strong sense thatnational-level nutrition policies and frameworksneed to be regionalised and more embedded insector policies to allow more context-appropriateinterventions.
Devolution impacts programme implemen-tation capacity, flexibility of programming andthe underpinning institutional architecture.rough devolution, sector or ministerial headsat the national level have less control over ex-penditure, what is prioritised and how sectors
work together on the ground in nutrition. Adap-tation is needed to ensure that guidance andsupport can still be provided to the districts inthe form of policy guidance, capacity buildingand aligning actions around national goals andtargets. is is an important area for futuredocumentation and enquiry.
Coordination Coordination between sectors is critical toenable multi-sector action. However, availableguidance on how to coordinate multi-sectorprogramming is mainly generic and ‘high level’,outlining the need for a set of enabling factors;e.g. a Common Results Framework attached toa national plan, a ‘multi-sector platform’, and ahigh-level representative of government officeconvening on nutrition. is form of guidanceis mainly geared towards the national level andis not easily transferable to sub-national insti-tutional and administrative arrangements. Fur-thermore, institutional architecture and coor-dination processes, especially at sub-nationallevel, are highly context-specific and, in manycountries, evolving towards devolution. As aresult, it is difficult and may be unwise to gen-eralise about the optimal processes for enhancedsub-national, multi-sector coordination.
e case studies clearly show coordinationto be a key challenge in the implementation ofmulti-sector programmes across multiple levels.Some challenges observed include limited in-centives to coordinate with other sectors at thesub-national level, limited financial resourcesto effect district-level coordination, and the ex-istence of multiple parallel coordination meetingsfor nutrition and related sectors. New multi-sector approaches to nutrition have been intro-duced at the programmatic level, requiring inputfrom multiple sectors, but the structures andinstitutions in place have not yet evolved toenable this.
As a result of these challenges a type of co-ordination has evolved in all three countries atsub-national, operational level variously describedas “loose”, “unstructured” and “opportunistic”.
In Nepal, part way through the implementa-tion of the first phase of the national MSNP, aTechnical Support Unit (TSU) was introducedin each programme district to better coordinatethe seven implementing ministries. To date, theTSUs have been a ‘game changer’ in the way theMSNP works, facilitating routine meetings be-tween the sectors and carrying out other crucialtasks that previously had no ‘institutional home’,such as creating activity plans, tracking progressagainst set targets and sending quarterly reportsand monitoring data to central level. A non-governmental organisation (NGO), HERD, sec-onded staff to each TSU. In the Kenya casestudy, the important role of development partnersin helping to coordinate sector activities wasalso highlighted.
DeliveryA primary consideration in the case studies wasthe extent to which programmes have enabled
more comprehensive sector support for householdmembers and what lessons there are for futureprogramming design and scale-up. It is commonlyunderstood that households who receive a com-prehensive package of services that simultaneouslyaddress the underlying causes of malnutritionhave better outcomes, but what this looks like‘on the ground’ is still not well documented.None of the case study programmes collectedrobust data on the proportion of households inthe intervention area in receipt of multi-sector/multiple interventions. is informationis critical for convergence and targeting of mul-ti-sector programming and therefore needs fur-ther attention and enquiry. Smaller-scale pro-grammes seem to be able to deliver a ‘completepackage’ to target households, but the extent towhich this sometimes resource-intensive approachcan be implemented by government and at scaleis another issue requiring attention.
Cost and resourcesNone of the case study country programmescollected data on the (additional) cost of im-plementing multi-sector nutrition sector pro-gramming. is is complex, requiring precisedefinition or categorisation of what activitiesor processes are, or contribute to, nutrition-sensitive, multi-sector programming; e.g. sub-stituting milking animals for poultry, addingnutrition messaging to a sector interventionand targeting particular households. Withoutthis information, it is difficult to assess thecost-effectiveness of multi-sector nutrition pro-gramming; or indeed, what funds need to bemade available by government and developmentpartners to enable programming. In Nepal,there were reports from both MSNP study re-gions that money made available for sectorswas not adequate to implement real change toprogramming and MSNP-specific funding wasdwarfed by the larger sector-specific spend. Atbest, the small sums of money made availableby government simply reminded sectors to con-sider the nutrition sensitivity of their work.
Monitoring and evaluation(M&E)e programmes studied have not yet developedrobust monitoring systems able to demonstratethe nutrition impact of multi-sector interventions,although in the case of Nepal, evaluation ofMSNP I identified this as a substantial gap andplans have been made to monitor impact onnutrition and other outcomes in the next phase.In Senegal, the programme in Matam (Yaajeende)conducted baseline, mid-term and end-termevaluations, which included nutrition impactassessments. (So far these have demonstratedonly limited impact on nutrition indicators).
Given the nature of the changes broughtabout by multi-sector programming (mainlychanges in targeting or convergence, BCC andproject inputs), there is a pressing need andsubstantial opportunity to demonstrate effec-tiveness and impact of the interventions.
ree key points are made based on the find-ings from the case studies. Firstly, effecting and
enabling multi-sector programming is consid-erably more difficult than has perhaps been re-alised. Effort and changes required to enablemulti-sector programming must therefore bematched by proven benefit (on nutrition), makingM&E a critical area for focus in future pro-grammes. Secondly, the type of changes to pro-gramming that can occur in a multi-sector ap-proach (with the exception of targeting andconvergence) have not yet been proven to impactnutrition. For example, the evidence base fornutrition-sensitive agriculture and water, sani-tation and hygiene (WASH) is not strong andthe evidence around BCC is also inconclusive.irdly, there are hitherto unique opportunitiesfor measuring impact of a multi-sector approach,given the momentum for it in many countries,yet these opportunities are not currently beingcapitalised upon. e gradual rollout of the pro-grammes in Kenya and Nepal offers the perfect
opportunity to conduct research with controlor comparison groups.
Understanding nutritionsensitivityIt was clear from interviews conducted thatthere are diverse understandings of what ‘nutritionsensitivity’ means among the many stakeholdersconsulted. In some cases, stakeholders saw theirwork or the work of their sector as ‘already sen-sitive to nutrition’, i.e. contributing to food pro-duction, and did not necessarily understand theneed to tailor or adapt programmes or changethe way in which they are measured. is suggeststhat, while many stakeholders appeared to un-derstand the need for a multi-sector approachto tackle undernutrition, fewer understood nu-trition-sensitivity or the impact pathways thatlead to undernutrition. e multi-sector approachwas articulated by some stakeholders as simply
requiring that every sector ‘does its bit’ for nu-trition, largely through business-as-usual, ratherthan tailoring or adapting approaches or theway that programmes are measured.
is series is the first in what ENN hopeswill be several rounds of this kind of documen-tation carried out under this project. By focusingon documentation at the sub-national level, itis hoped that a richer understanding of multi-sector practice and programming will emergeto inform and improve future practice, pro-gramme design and implementation.
All three case studies and the synthesis reportare available for download online at: www.ennonline.net/ourwork/knowledgem-anagement/sunkm
The pooled 84 country prevalence esti-mate for children 6–59 months of ageexperiencing either wasting or stuntingwas found to be 38.9%, 95% CI [38.7,
39.0]. is means that only 61.1%, 95% CI [61.0,61.3], of children in the 84 countries escapeboth conditions.
e estimated prevalences from this analysiswere calculated to correspond to nearly 6 millionchildren concurrently wasted and stunted in the84 countries. e authors note that given the
transitory nature of wasting in particular, wherea child can experience several episodes of wastingduring a set period, using cross‐sectional datainsufficiently estimates the actual prevalence(Garenne et al., 2009). is means that the aboveis likely to be an underestimate of the true burdenof children experiencing these two deficits con-currently. See figure 1. For a graphical represen-tation of the results by country.
Reducing the prevalence of children who arewasted and stunted are global priorities. Wasting
and stunting are oen present in the same geo-graphical populations (Victora, 1992) and it isrecognised that children can be stunted and wastedat the same time, ‘concurrently wasted and stunted’(IFPRI 2015). ough the relationship betweenthese manifestations of undernutrition at the levelof the individual child and the mechanisms leadingto this state of “concurrence” are poorly understood(Angood et al 2016), evidence suggests thatchildren with both deficits are at a greatly elevatedrisk of mortality (McDonald et al., 2013).
This paper highlights the issue that despitethe above, there are no global estimates of theprevalence and burden of concurrence (UNICEFet al., 2016). It is in fact rarely reported, thoughthe data required to estimate concurrence isreadily available in national surveys (Saaka &Galaa, 2016). The authors note that reportingon global figures for the prevalence of differentnutritional deficits separately, underestimatesthe true proportion of the global populationaffected by nutritional deficits as a whole and,ignores this critical proportion of children af-fected by multiple deficits who may requireadditional nutritional support.
Summary of research1
Location: GlobalWhat we know: Wasting and stunting are oen present in the same geographical populationsand can exist concurrently in the same children, increasing risk of mortality; the burden ofconcurrence is currently not known.
What this article adds: is study provides the first multiple country estimates of theprevalence and burden of children aged 6–59 months concurrently wasted and stunted usingdata from Demographic and Health Surveys (DHS) and Multi‐indicator Cluster Surveys(MICS). In this study the pooled prevalence of children concurrently wasted and stunted in84 countries was found to be 3.0%, 95% CI [2.97, 3.06], varying from 0% in Montenegro to8.0%, 95% CI [7.2, 8.9], in Niger. Nine countries had a concurrence prevalence >5%, thesuggested threshold for concern and intensification of identification and treatment efforts.Prevalence of concurrence was highest in the 12 to 24 month age group 4.2%, 95% CI [4.1,4.3], and significantly higher among boys 3.54%, 95% CI [3.47, 3.61], compared to girls;2.46%, 95% CI [2.41, 2.52] and higher in fragile and conflict‐affected states 3.6%, 95% CI [3.5,3.6], compared to stable countries 2.24%, 95% CI [2.18, 2.30]. Results indicate a need tosystematically report on this condition within country and global monitoring systems.
1 Khara, T., Mwangome, M., Ngari, M. and Dolan, C. (2017) Children concurrently wasted and stunted: A meta-analysis of prevalence data of children 6-59 months from 84 countries. Maternal and child nutrition, September 2017. DOI: 10.1111/mcn.12516
Children concurrently wasted and stunted:A meta‐analysis of prevalence data ofchildren 6–59 months from 84 countries
e analysis presented in the paper aims to ad-dress this gap by providing the first multiple countryestimates of the prevalence and burden of childrenaged 6–59 months concurrently wasted and stuntedusing data from Demographic and Health Surveys(DHS) and Multi‐indicator Cluster Surveys (MICS).e aim was to approach a global estimate thoughsufficiently recent data (last 10yrs) was availablefor just 84 countries. For countries with more thanone dataset available the most recent dataset waschosen. Country‐specific estimates were calculatedand pooled using the random‐effects meta‐analysisto yield the 84 country estimates (Hamza, Reitsma,& Stijnen, 2008). Burden by country was calculatedusing country population figures from the globaljoint estimates database (UNICEF et al 2016). eanalysis also explored age, sex, regional, and con-textual differences, and estimated of the proportionof children affected by either of these conditions(wasted or stunted).
e pooled prevalence of children concurrentlywasted and stunted in the 84 countries wasfound to be 3.0%, 95% CI [2.97, 3.06]. e preva-lence of concurrence varied across countriesfrom 0% in Montenegro to 8.0%, 95% CI [7.2,8.9], in Niger. Nine countries had a concurrenceprevalence greater than 5%. Six from sub‐SaharanAfrica (Niger, Burundi, Djibouti, Chad, Sudan,and South Sudan) and three from Asia(Timor‐Leste, Yemen, and India). e authorsnote that a country prevalence of >5% severe
wasting would warrant concern and intensificationof efforts to identify and treat children. oughconcurrence is associated with similar mortalityrisks, its prevalence is not monitored, and casesare not routinely identified, therefore, no specificaction can be taken.
e estimated prevalences from this analysiswere calculated to correspond to nearly 6 millionchildren concurrently wasted and stunted in the84 countries. e authors note that given thetransitory nature of wasting in particular, wherea child can experience several episodes of wastingduring a set period, using cross‐sectional datainsufficiently estimates the actual prevalence(Garenne et al., 2009). is means that the aboveis likely to be an underestimate of the true burdenof children experiencing these two deficits con-currently. See figure 1. For a graphical represen-tation of the results by country.
Prevalence of concurrence was found to behighest in the 12‐ to 24‐month age group 4.2%,95% CI [4.1, 4.3], and was significantly higheramong boys 3.54%, 95% CI [3.47, 3.61], comparedto girls; 2.46%, 95% CI [2.41, 2.52]. Fragile andconflict‐affected states reported significantlyhigher concurrence 3.6%, 95% CI [3.5, 3.6],than those defined as stable 2.24%, 95% CI[2.18, 2.30]. The authors note that these patternsmirror higher prevalences of wasting and stuntingwhen analysed separately. Particularly in the
case of the pattern of heightened nutritionalvulnerability of boys, the data suggests thatfurther investigation is needed.
The pooled 84 country prevalence estimatefor children 6–59 months of age experiencingeither wasting or stunting was found to be38.9%, 95% CI [38.7, 39.0]. This means thatonly 61.1%, 95% CI [61.0, 61.3], of children inthe 84 countries escape both conditions. Theauthors note that this is a very stark metric forunderstanding the extent of undernutrition inthese countries and refer to country disaggre-gated data from this analysis that was reportedin the Global Nutrition Report 2016, in whichit can be seen that in a number of countries(Benin, Djibouti, Yemen, Niger, Chad,Guinea‐Bissau, Ethiopia, Congo DRC, Burundiand Somalia, India, Pakistan, and Laos), overhalf the population of children is sufferingfrom one of these deficits (IFPRI, 2016).
Given the high risk of mortality associatedwith concurrence, the authors conclude thatthe levels of prevalence and burden reportedin their analysis, indicate that there is a need tosystematically report on this condition withincountry and global monitoring systems and,for researchers programmers and policy makersto prioritise investigation into the extent towhich these children are being reached throughexisting programmes.
ReferencesAngood, C., Khara, T., Dolan, C., Berkley, J. A., & WaSt TIG.(2016). Research priorities on the relationship betweenwasting and stunting. PloS One , 11(5). e0153221.https://doi.org/10.1371/journal.pone.0153221
Funding clause:This study is made possible by the generous support ofthe American people through the United States Agencyfor International Development (USAID) through the grantENN AID-OFDA-G-15-00190 and through an Irish AidGrant number 2016/RESNUT/001/ENN: the ideas,opinions and comments therein are entirely theresponsibility of its author(s) and do not necessarilyrepresent or reflect the view of USAID or the UnitedStates Government or Irish Aid policy.
Garenne, M., Willie, D., Maire, B., Fontaine, O., Eeckels, R.,Briend, A., & Van den Broeck, J. (2009). Incidence andduration of severe wasting in two African populations.Public Health Nutr, 12(11), 1974-1982.doi:10.1017/S1368980009004972
WFP nutrition activity at Kutupalongcamp in Ukhiya, Cox’ Bazar
WFP/Saikat M
ojumder
Hamza, T. H., Reitsma, J. B., & Stijnen, T. (2008). Meta-analysis of diagnostic studies: a comparison of randomintercept, normal-normal, and binomial-normal bivariatesummary ROC approaches. Med Decis Making, 28(5), 639-649. doi:10.1177/0272989X08323917IFPRI. (2015). Global Nutrition Report 2015: Actions andAccountability to Advance Nutrition & SustainableDevelopment. Panel 2.1 Extent of wasting and stunting inthe same children. Washington, DC
IFPRI. (2016). Global Nutrition Report 2016: From Promiseto Impact: Ending Malnutrition by 2030. Retrieved fromWashington, DC
McDonald, C. M., Olofin, I., Flaxman, S., Fawzi, W. W.,Spiegelman, D., Caulfield, L. Ezzati, M, Danaei, G., for theNutrition Impact Model Study. (2013). The effect ofmultiple anthropometric deficits on child mortality: meta-analysis of individual data in 10 prospective studies fromdeveloping countries. Am J Clin Nutr, 97(4), 896-901.doi:10.3945/ajcn.112.047639
Saaka, M., & Galaa, S. Z. (2016). Relationships betweenWasting and Stunting and Their Concurrent Occurrence inGhanaian Preschool Children. J Nutr Metab, 2016,4654920. doi:10.1155/2016/4654920
UNICEF, WHO, & Group, W. B. (2016). Levels and Trends inChild Malnutrition. WHO/UNICEF/World Bank Group Jointestimates. Retrieved fromhttp://www.who.int/nutgrowthdb/jme_brochure2016.pdf?ua=1
Victora, C. G. (1992). The association between wasting andstunting: An international perspective. The Journal ofNutrition , 122(5), 1105–1110.
Humanitarian-developmentnexus: nutrition policy andprogramming in Kenya By Carmel Dolan and Jeremy Shoham
Carmel Dolan is an ENNTechnical Director, co-editor of the ENNpublication NutritionExchange, and co-leadon ENN’s knowledge
management support to the Scaling UpNutrition (SUN) Movement.
Among the ten commitments in theGrand Bargain that were articulatedduring the World Humanitarian Sum-mit in Istanbul in 2016, was “the
need to strengthen linkages between humanitarianand development programming”. e consensuson this has grown with the realisation that anestimated 70 to 80 per cent of humanitarianprogrammes take place in protracted emergencies,where short-term humanitarian programmingis inappropriate. Taking up this mantle, theUnited Nations Office for Coordinating Human-itarian Affairs developed the New Way of Working(NWW) framework, which is predicated on fourpillars: joined up analysis of acute and long-term needs; joint humanitarian and developmentpartner planning with collective outcomes; jointleadership and coordination, building on op-portunities and comparative advantage; and fi-nancing modalities to support collective outcomes.Organisations like the World Food Programme
(WFP) are now shiing their programming fromshort-term emergency response plans to a countrystrategy model with longer-term financing win-dows of three to five years and the inclusion ofchildhood stunting reduction as a declared goal.e Global Nutrition Cluster (GNC) is also turn-ing its attention to an integrated model of pro-gramming, whereby integration is not just pro-moted between the clusters/sectors but also withlonger-term government and civil society struc-tures and capacity strengthening.
ENN aims to capture humanitarian devel-opment nexus (HDN)-related experiences inthe coming years and disseminate examples ofwhat is working. is article summarises themain findings of the first of several plannedcase studies. Research was carried out during ashort visit to Kenya in 2017 using a nutrition-specific and nutrition-sensitive programmingand policy lens and includes a brief case exampleof Wajir county.
Nutrition policy in Kenya Kenya’s economy is growing; it has a 2030 de-velopment vision to reach middle-income countrystatus and its humanitarian system architecturehas largely been overtaken by greater governmentinvestment in resilience building, social protectionprogrammes and early response systems.
Kenya is on track to meet many of the WorldHealth Assembly (WHA) nutrition targets, at-tributed to its success in scaling up high-impactnutrition interventions (HINIs) over the pastdecade. A key element of this is the integratedmanagement of acute malnutrition (IMAM),which has been increasingly integrated into thehealth system. In addition, a surge model allowsfor the scaling up of treatment in a number ofthe vulnerable arid and semi-arid lands (ASAL)in response to crisis. In recent years, the Gov-ernment of Kenya (GoK) has established socialprotection programmes (SPPs), including theHunger Safety Net Programme (HSNP) in fourASAL counties (65 per cent GoK-funded) anda cash transfer (CT) programme for up to half amillion people. ere are also GoK-funded SPPsfor the elderly, severely disabled, and orphansand vulnerable children, as well as an asset-cre-ation CT programme implemented by the WFP.
Resilience programming has become a majorcomponent of Kenya’s national Mid-Term De-velopment Plan (MTDP) and is a key pillar ofthe Ending Drought Emergencies (EDE) frame-work. Central to the EDE is the strengtheningof systems that allow earlier responses to threatsbefore a full-scale emergency arises, includingdiversification of livelihoods in the ASAL countiesand risk anticipation. is has largely replacedthe need for more traditional humanitarian re-sponse in Kenya. e National Drought Man-agement Authority (NDMA), which rolls out
Location: KenyaWhat we know: ere is global commitment to strengthen the linkages betweenhumanitarian and development programming.
What this article adds: A recent ENN field-based case study in Kenya examined experiencesof the humanitarian development nexus (HDN) through a nutrition-specific and nutrition-sensitive programming and policy lens. Kenya is on track to meet World Health Assemblynutrition targets, largely due to successful scale-up of high-impact nutrition interventions,particularly integrated management of acute malnutrition and a surge model for treatmentin Kenya’s arid and semi-arid counties. Improved risk reduction and quicker, more effectiveresponse evidenced in the 2016/17 drought response are attributable to nationalgovernment growth; stronger government leadership; the Ending Drought Emergencyframework; devolution; strengthened health systems; and scalable social protection systemsfor the most vulnerable. Ongoing challenges include limited community mobilisation in the‘surge’ model; variation in multi-sector collective outcomes and prioritysetting/contingency planning at devolved level; weak influence of nutrition in shaping high-level frameworks, design of social protection programmes; and tensions betweennutrition-specific and nutrition-sensitive investments. e Scaling Up Nutrition Movementhas not yet given rise to a multi-sector platform that gains nutrition leverage and visibility.Action is needed at global level to ensure nutrition joins the discourse around HDN.
1 Shoham J and Dolan C. (2017) Case study of the humanitariandevelopment nexus in Kenya.
Jona
h Kl
ein
Jeremy Shoham is anENN Technical Director,co-editor of FieldExchange, and co-leadon ENN’s knowledgemanagement support
to the SUN Movement.
This article provides a summary of a detailed case study carried out during a field visitto Kenya by ENN1. ENN would like to acknowledge Irish Aid for funding this work andthank all those interviewed for their time.
the EDE, straddles humanitarian and develop-ment programming and is devolved to the 23ASAL counties. Nutrition is a cross-cutting con-cern and stunting is one of the key indicatorsfor monitoring EDE progress. Within govern-ment, the mandate for nutrition policy devel-opment, planning and coordination resides withthe nutrition unit of the Ministry of Health(MoH). In spite of the excellent work done bythe unit over many years, it maintains a somewhatmarginalised position within government. Amulti-sector nutrition platform (MSNP) is lack-ing; therefore cross-sector coordination of nu-trition-specific and nutrition-sensitive program-ming is limited.
Drought response e response to the 2011 drought that affectedlarge parts of Kenya, particularly the 23 ASALcounties, was characterised as late, poorly co-ordinated, with low levels of government in-vestment and leadership, little attention todrought resilience building, and high levels ofboth acute malnutrition and child mortality. Incontrast, the response to the ongoing 2016/17drought started earlier and was more appropriate;the current drought has seen high levels ofglobal acute malnutrition (GAM) but lowermortality. is is possibly to do with lower levelsof severe acute malnutrition (SAM) due to scale-up of the integrated management of acute mal-nutrition (IMAM) and greater resilience to foodinsecurity this time around. In general, the2016/17 drought has demonstrated progress inhow Kenya’s systems have become orientated toreduce risk and respond more quickly and effec-tively to crisis. Several factors have contributedto this and, taken together, have enabled a con-siderable degree of strengthened humanitarianand development linkages. Specifically, the fol-lowing enabling factors have been identified:1. National economic growth Kenya is now
classified as a lower middle-income country(LMIC).
2. Strong government leadership for the crisis response, with humanitarian partners providing gap filling rather than first-line response and development partners’ invest-ments aligned with national risk-reduction priorities.
3. Devolution of government since 2012. In a context of fully devolved government, the role of local government has provided a freedom to manage budgets directly and
determine county-level priorities. 4. e elaboration and initial implementation
of the EDE framework to achieve greater sector and humanitarian-development system linkages.
5. Strengthened health systems and establish-ment of a surge capacity model for the earlytreatment of wasting.
6. Establishment of scalable social protection systems for the most vulnerable (including the HSNP).
Ongoing challenges Despite Kenya’s substantial progress towards asignificantly integrated humanitarian and de-velopment capacity, many challenges still needaddressing. Aer many decades of reliance onhumanitarian food aid as the main modusoperandi in the crisis-prone northern ASALcounties, there has been a shi away from thisapproach in recent years. is has perhaps pre-maturely reduced the capacity to deliver foodaid, before there is sufficient resilience, risk re-duction and development in crisis-prone counties.e IMAM surge programme in Kenya is inmany ways an ideal type of programme for re-source-poor and vulnerable populations indrought-risk counties; however, community mo-bilisation and outreach achieved during the‘surge’ process has not been maintained. Giventhat SAM coverage levels in Kenya are low, thisis a lost opportunity.
Sub-nationally, devolved county structuresare a critical enabler to ensure pre-crisis planning,early response and response based on communityfelt needs. is responsibility has resulted instrengthened local capacity, which obviates theneed to wait for a national response or for hu-manitarian partners to access external funding.To date, counties oen don’t have agreed multi-sector collective outcomes and do not all prioritiserisk reduction and/or ensure adequate use ofearly-response contingency funds.
e necessary architecture for HDN is akinto the enablers required for nutrition-specificand nutrition-sensitive scale-up, albeit at ahigher level (EDE is enshrined in law). Bothhave a multi-faceted lens and objectives linkeddirectly to development/economic targets, aswell as to mitigation (prevention), early response(such as mass screening to prevent death fromsevere acute malnutrition) and surge systems(treatment).
In Kenya, nutrition is still not adequatelypositioned to influence the shape of high-levelframeworks, the design of SPPs, CTs and resilienceprogramming, or to advocate for the targetingof the nutritionally vulnerable at the individual,household or geographic levels. Nutrition interms of the HDN in Kenya is largely limited toimplementation of nutrition-specific interven-tions; i.e. response built on strengthened gov-ernment systems through high-HINIs and theintegrated management of acute malnutrition(IMAM) are not yet resourced to full scale. isis evidenced by the high levels of acute malnu-trition in the current ASAL crisis.
e declaration of an emergency brings inmore human and financial resources for nutri-tion-specific surge activities, but typically theseare not sustained by subsequent sector/devel-opment efforts. Whether nutrition-specific in-vestments build resilience is debateable, althoughHINIs seem to have an (undefined/non-evi-denced) role in Kenya’s progress in reachingsome WHA targets.
ere is a general tension between the levelsof nutrition-specific and nutrition-sensitive in-vestments in Kenya, which in turn reflects anunresolved divide (despite progress) betweenthe humanitarian and development sectors. isplays out in terms of the differing/competingobjectives and design considerations, whichoen ignore nutrition, and in terms of widelydiffering target populations. Current levels ofinvestment for the nutrition-sensitive sectorsin the ASALs cannot reach levels of coverageand geographical convergence needed to see apopulation level impact on nutrition.
Nutrition in Kenya is not yet an influenceror driver of change, although this is not becauseof a lack of effort on the part of the nutritionsector. is is a key risk for nutrition generallyand in the context of a rapidly evolving HDNagenda, as well as the growth in cash-relatedand social protection programming. Becausenutrition in Kenya is marginalised, HDN, SPPand CT-related objectives at best view nutritionas an outcome indicator (for example; stuntingin the case of the Kenya EDE), as opposed to akey design and targeting consideration.
Nutrition is being le behind in the HDNdiscourse and this is one area that globalnutrition leadership must influence; if onehoped-for outcome of HDN is a lowering ofthe incidence and prevalence of child wastingand stunting, then even greater efforts areneeded to get nutrition expertise at the table ofthe HDN ‘movers and shakers’ at global andcountry level. In countries like Kenya, a high-er-level forum which can influence other sectorsacross humanitarian and development approach-es (such as the HSNP) is needed. e ScalingUp Nutrition (SUN) Movement has not yetgiven rise to a multi-sector platform to gainnutrition leverage and visibility.
For more information, contact: JeremyShoham, email: [email protected]
BackgroundGlobally, 8.5 million infants under six monthsold (infants < 6m) are estimated to be acutelymalnourished, of whom 3.8 million are severelymalnourished (Kerac et al, 2011). Until recently,policy guidance centred on inpatient managementonly, limiting coverage, accessibility and type ofintervention availability and not reflecting thespectrum of need and severity amongst this pop-ulation of at-risk mothers and infants (ENN,2010). Recognising this, the latest WHO guidanceon SAM treatment (WHO, 2013) now distin-guishes between complicated and uncomplicatedsevere acute malnutrition (SAM) among infants<6months and recommends the latter be treatedin outpatient care (WHO, 2013). However, positiveglobal policy development has not yet been re-flected at country level; a recent review of 48 na-tional SAM/CMAM (community-based man-agement of acute malnutrition) guidelines foundthat inpatient care still dominates for this agegroup; none recommend outpatient case man-agement (McGrath, 2016).While translating in-
ternational recommendations to national guide-lines takes time, countries who have revised theirnational SAM guidelines since 2013 have notmade a provision for community-based man-agement of this age group. ere are indicationsthat additional barriers may prevent nationalpolicymakers from aligning guidance with WHO.
is study aimed to understand the issuesand challenges involved in making a nationalpolicy shi from inpatient-only care to outpatientmanagement for uncomplicated, malnourishedinfants < 6m.
Processree case studies were conducted on Yemen,Malawi and Vietnam, where nationalCMAM/IMAM (integrated management of acutemalnutrition) guidelines were recently revisedbut the 2013 WHO recommendation of managinguncomplicated SAM infants <6m as outpatientswas not adopted. Countries were selected whereoutpatient management of uncomplicated mal-nourished infants <6m was considered as part of
the guidelines review process, but where it wasdecided against including this recommendation.
Sampling was purposive and done to saturation.Twelve key informants were interviewed; five forYemen, five for Malawi and two for Vietnam.Key informants represented a variety of stake-holders involved in the guidelines developmentprocess, including representatives from Ministryof Health (MoH) (n=1); UNICEF, other UnitedNations (UN) organisations, and WHO (n=4); alocal non-governmental organisation (NGO)(n=1); academia (n=1); a service provider (n=1);and people with a technical support role to theMoH (n=4). Only two key informants were in-terviewed for Vietnam due to non-responsivenessand a language barrier. Interviews were conductedby phone or Skype. One phone interview wascompleted with written answers due to weak in-ternet connection and one interview was submittedin writing for the convenience of the key informant.Key informants reviewed interview transcriptsto ensure views had been accurately captured;five out of 12 key informants did so.
ematic analysis was carried out to identifythe main barriers and issues that policy-makersface in adopting the WHO guidelines on thetreatment of the <6m age group with uncompli-cated SAM. Each interview was coded and themeswere formed from codes.
Key findingsAll three countries implement preventive andinpatient activities for infants < 6m, but not out-patient care. In all countries investigated, com-munity-based management provision was pro-posed for inclusion in the guidelines by a personin a technical support role to the MoH. Aerdiscussions among stakeholders and/or a technicalcommittee with the MoH, outpatient treatmentfor uncomplicated infants <6m was not endorsed.In all cases, exclusion was based on a majorityconsensus. Barriers identified have been groupedunder technical, political, operational and epi-demiological barriers.
Technical barriersere was reluctance to distinguish between com-
Location: Yemen, Malawi and Vietnam
What we know: WHO 2013 guidance on SAM treatment recommends community-basedmanagement for uncomplicated cases in infants under six months old (infants < 6m); this hasnot been adopted in country-level policy.
What this article adds: A small, qualitative study examined barriers to including community-based management of acute malnutrition in infants < 6m in recent national guidance up-dates in Yemen, Malawi and Vietnam. Identified barriers include low awareness of currentWHO recommendations; lack of practical anthropometric indicators for community assess-ment and means to monitor infants closely; weak country-level evidence on interventions,including cost-effectiveness; concerns regarding caseload, health worker capacity, skillsetneeded and risks of outpatient care; and lack of simple management protocols and tools.Lack of systematic screening for infants < 6m means potential caseload and spectrum of casetypes in different settings are unknown; policy makers (oen clinicians) are informed by ex-periences managing inpatient complex cases. ese gaps led to country-based consensus notto include community-based management as an option; external expert technical input andadvocacy were not sufficient to bring policy change. Country-level evidence (robust re-search) to address context-specific questions is critical for international guidance uptake andto further inform both global and country-level policy updates. Community-friendly an-thropometric indicators are needed to help identify at risk infants.
Community management of uncomplicatedmalnourished infants under six months old: barriers to national policy change By Sonja Read and Marie McGrath
Sonja Read is a public health nutritionist and was lead researcher(ENN consultant) on the project.
Marie McGrath is ENN Technical Director and coordinates theManagement of At risk Mothers and Infants under six months (MAMI)special interest group, an interagency/individual community ofpractice to improve policy, programming and research on MAMI.
The authors extend thanks to Professor Marko Kerac of LondonSchool of Hygiene and Tropical Medicine for his help inconceptualising and directing this work, to all at country level whotook time to share their experiences with us, and to Irish Aid, whofunded the review through ENN.
plicated and uncomplicated SAM cases in thisage group, especially in Yemen and Vietnam.Many considered all severely malnourished infants< 6m to be complicated cases who need closemonitoring and whose condition may quicklydeteriorate. It was oen mentioned that casesusually have comorbidities that require inpatientcare and are challenging to manage even in in-patient settings.
Lack of appropriate diagnostic criteria andtools to identify, manage and follow up infantsin the community was cited in all three countriesas a major barrier to outpatient treatment. Lackof official mid-upper arm circumference (MUAC)cut-offs and the impracticability of weight-for-length measurement (current WHO recommen-dation for anthropometric assessment of this agegroup) make identifying infants in the communitydifficult. Likewise, there is no straightforwardmethod to closely monitor the condition of infantsin the community by health workers in order toevaluate how the child’s condition changes andidentify when they should be referred to inpatientcare. Some key informants suggested MUACmight make identifying infants easier. In Malawithe importance of looking at wider causes ofmalnutrition in SAM infants was also emphasised,while expressing difficulties for CHWs to do this.
As outpatient management of infants <6mconsists largely of breastfeeding support, it wasregarded by many as a preventive measure thatis already covered by general infant and youngchild feeding (IYCF) activities. In Yemen thisgenerated debate as to whether what is perceivedas ‘prevention’ should be part of a treatmentguideline; this was a major barrier to policychange. Some voiced that a severely malnourishedinfant indicates failure of community-based pre-vention and breastfeeding support and thereforewarrants inpatient treatment.
All countries, especially Yemen, raised questionson what constitutes ‘treatment’; to be given some-thing substantial – beyond feeding support -–was expected. is in turn raised fears that ex-pectation of product-driven ‘treatment’ wouldundermine exclusive breastfeeding (EBF). elack of a tangible, ready-to-use therapeutic food(RUTF)-like intervention for infants < 6m madedecision-makers hesitant to implement commu-nity-based care for this age group: “Because theyare still young, we can’t give RUTF, so we run outof options – there’s not much to give them to go
home.” (Malawi) and: “[Infants <6m] should beadmitted to hospital because there’s no treatmentfor [SAM] children under six months[in the com-munity]” (Vietnam). e inappropriateness/im-practicality of using milk-based products in com-munities was also raised.
Non-breastfed cases were considered an es-pecially challenging group to cater for; both forhygienic reasons (milk feeds are considered in-patient interventions) and because giving productsinstead of breastmilk is seen as a threat to EBF,the core message of community health workersfor that age group.
All countries called for more evidence on theeffectiveness of community-based managementof uncomplicated infants < 6m, particularly na-tional evidence. Lack of implementation protocolswas a significant barrier; in Malawi this was amajor reason for the MoH not to include outpatienttreatment for infants. Even key informants whowere familiar with the C-MAMI tool1 suggestedthat a barrier to implementation was lack of aclear protocol to follow. A tested approach totreating infants < 6m and success stories wouldfacilitate policy uptake of C-MAMI.
For many stakeholders in the guidelines reviewprocess, outpatient care for infants <6m was anew concept and there was a general lack of in-depth knowledge about how infants <6m couldbe identified, managed and monitored in thecommunity; several key informants posed thisquestion in the interview, asking about the C-MAMI tool (ENN and LSHTM, 2015) and theWHO recommendation on SAM infants <6m.Technical support staff in two countries wereposed questions by the MoH regarding case man-agement that they could not answer: “People keptasking how this can work in the local context andwe didn’t have answers, so if we don’t have answers,we can’t have it in the guidelines” (Malawi).
Political barriersSeveral key informants emphasised the need forguidelines to be practical, with an easily followedprotocol. In all countries, MoH cut down substan-tially from the dra guidelines in general; infant<6m community management was typically removedas seen as complicated and “confusing” (Yemen).Not all key informants were aware of the WHOguidance regarding outpatient treatment of infants.Implementing outpatient treatment did not receivewide support and it was a consensus in eachcountry that outpatient treatment for infants wouldnot be included. In one country, the MoH’s con-sultative committee comprised of clinicians whostrongly preferred admission to inpatient care.
Implementing infant <6m outpatient care wasalso not a priority/difficult to achieve given othermore pressing issues. In Yemen ongoing conflictmeant the priority for guidance was on CMAMdelivery in the emergency response; in Vietnam,attention has been on integration of treatmentin the national health system. In both countries,inpatient treatment for infants <6m was includedfor the first time in the latest revision.
Language may have hindered adoption; whatmaterials there are currently are English-only.
Operational barriersIn all countries the capacity of community healthworkers (CHWs) and/or community volunteers,on whom screening and management of SAMinfants in the community would depend, wasidentified as a major barrier to implementingoutpatient care. Low level of education coupledwith the degree of responsibility that this servicewould entail was not considered appropriate.Key informants hesitated to give CHWs respon-sibilities such as determining whether an infant<6m should receive inpatient or outpatient care,especially with the current diagnostic tools avail-able; at what point a child is referred to a facilityif their condition deteriorates; and supporting aSAM child with breastfeeding (since “breastfeedingpromotion has already failed at that point”). Re-ferral for inpatient care was deemed the easiestaction for CHWs.
e appropriateness of current outpatienttherapeutic programme (OTP) models to carefor infants < 6months was questioned in termsof monitoring children, providing milk feeds inthe community and lack of functioning referrallines if the infant’s condition deteriorates. ereis no strong alternative to inpatient treatment:“We thought that [treating SAM kids as inpatients]is obvious unless maybe our communities are reallyequipped.” (Malawi).
Epidemiological barriersEpidemiological barriers featured more promi-nently in Vietnam, where SAM in infants <6mhas not been observed and is not regarded as aburden. Some key informants from other countriesmentioned that malnutrition in this age group israrer. Lack of easy diagnostics, for its part, makesit more difficult to establish a burden of disease.
Discussion In each country, several factors contributed tothe fact that community-based management ofacute malnutrition in infants <6m has not beenadopted by national policy-makers. Barriers are‘ideological’ – such as no recognition of uncom-plicated and complicated SAM in infants, ‘practical’– accepting that some infants could be treated asoutpatients but implementation is difficult, and‘personal’ – guideline-development stakeholdersdraw on personal experience with caseload man-agement which influences decision-making, es-pecially in the context of lack of national evidence.Many felt there wasn’t enough MAMI expertiseat national level.
Many perceive C-MAMI as already coveredby preventive IYCF activities and those whom itfails require inpatient care. Many consider SAMinfants as complicated with concurrent illness;this may reflect the caseload they have experienceof, rather than the spectrum of potential caseloadsince there is no systematic screening of all
1 Both identification and management of acute malnutrition in infants <6m are outlined in the C-MAMI tool which was developed under the leadership of ENN and London School of Hygiene and Tropical Medicine and modelled on the IMCIapproach as a first step to catalyse programme development. This is undergoing pilot and development through field implementation but requires intervention trials to determine effectiveness.
infants. Little is known of the profile of thosemalnourished infants who are currently not de-tected in communities in different contexts.
Management of the uncomplicated cases groupsits between preventive activities and inpatienttreatment and touches on IYCF, health andCMAM/IMAM; this multi-sectorality likely fuelsuncertainty regarding where community-basedmanagement for this age group belongs and whoshould drive it.
ere is currently no community-friendly an-thropometric indicator to help identify acutelymalnourished infants in communities, especiallythose at highest risk. Appropriate tools are alsoneeded to track infants and refer them to inpatientcare if their condition gets worse.
C-MAMI is not perceived as an easy inter-vention. Indeed, without knowing the burden,who benefits from C-MAMI, and with existingpreventive activities for infants, compounded byuncertainties related to outpatient management,referral by CHWs to inpatient care is consideredthe safest option for country stakeholders. Non-breastfed infants in the community remain aspecial concern.
In all countries we investigated, C-MAMI wasproposed for inclusion by some “champion” butwas not sufficient to effect policy change. Knowl-edge of WHO guidelines’ recommendations forinfants <6m was not widespread or were notconsidered applicable to the context.
Introducing C-MAMI has training implications;lack of outpatient and staff capacity to addressthe needs of SAM infants and questions regardingcapability and workload of CHWs to ‘step up’ onMAMI were major barriers across all countries.
Conclusions andrecommendationsere are significant and understandable barriersto national policy change to accommodate com-munity-based management of acute malnutritionin infants < 6m; some political but many practical.Barriers should not be interpreted as a sign thatMAMI is not relevant at country level; a recentglobal research prioritisation by No Wasted Livesidentified management of acute malnutrition ininfants < 6m as the third top priority researchquestion needed to inform scale-up2. Country-level research to investigate local burden, caseprofile (complicated, uncomplicated) and answercontext-specific questions on feasible, cost-effectiveinterventions are necessary. Where MAMI is lo-cated – in nutrition or health, in treatment orprevention – requires further scrutiny and willlikely vary by setting; ‘whatever works here’should be the guiding principle. To date, small-scale pilots on implementation of the C-MAMItool have relied on models that rely on significantNGO support; plans are underway for imple-mentation research in government settings. How-ever, robust randomised trials in multiple settingswith government collaboration are critical to in-form both national and international policy up-
dates and protocol development. Internationalpolicy development must be accompanied bydissemination that includes translation. ere isan urgency to identify community-friendly an-thropometric indicators to help identify at-riskinfants in the community.
ReferencesENN 2010. ENN, CIHD, ACF. MAMI Project. TechnicalReview: Current evidence, policies, practices andprogramme outcomes. Jan 2010.
ENN and LSHTM (2015). C-MAMI Tool, Version 1 (2015).www.ennonline.net/c-mami
Kerac et al 2011. Kerac M, Blencowe H, Grijalva-Eternod C,McGrath M, Shoham J, Cole TJ, et al. Prevalence of wastingamong under 6-month-old infants in developing countriesand implications of new case definitions using WHO growthstandards: a secondary data analysis. Arch Dis Child.2011;96(11):1008–13.
McGrath 2016. McGrath M. Updated review of nationalguidelines on MAMI: Key findings. In: MAMI InterestGroup Meeting. London, UK; 2016.5. ENN, LSHTM. C-MAMItool. Version 1. [Internet] Available at:www.ennonline.net/c-mami. [viewed 7 December 2017].Review of 46 guidelines presented at meetingsubsequently updated to 48 guidelines. Pendingpublication submission.
WHO 2013. World Health Organization. Guideline:Updates on the management of severe acute malnutritionin infants and children. Geneva; 2013.
2 Prioritising acute malnutrition research: preliminary results of a CHNRI survey. Field Exchange 55, July 2017. p68. www.ennonline.net/fex/55/acutemalnutchnrisurveyprelim
Location: Global
What we know: Cash is increasingly used in humanitarian response; there islimited evidence on the potential for government social protection schemes torespond to ‘shocks’.
What this article adds: Research was carried out including six country casestudies, a literature review and global consultations to explore the potential rolefor long-term social protection systems in response to large-scale shocks. estudy found different options for shock-responsive adaptation (tweaking de-sign/piggybacking existing programmes; expanding existing programmes (top-ping up support to beneficiaries or adding beneficiaries); or aligning with hu-manitarian systems. Context-specific considerations during programme designinclude the level of political will; regulations; government capacity; financingand conflict. Operational considerations include carrying out effective needs as-sessments; deciding on appropriate transfer values and distribution modes; andgood communication with beneficiaries and non-beneficiaries. Collaborationbetween social protection, disaster risk management and humanitarian actors isimportant at all levels; there are examples in the case studies of different coordi-nation bodies, but much more coordination is needed. e authors make 12recommendations to policy-makers and programmers.
The Shock-Responsive Social Protection Systems studyis a UK Department for International Development(DFID)- funded research programme (2015 to 2018)led by Oxford Policy Management (OPM), in a con-
sortium with Overseas Development Institute (ODI), CashLearning Partnership (CaLP) and INASP. Its aim is to strengthenthe evidence base on when and how social protection systemscan better respond to shocks in low-income countries andfragile and conflict-affected states (FCAS) in order to minimisenegative shock impacts and reduce the need for separate hu-manitarian responses. e study aimed to explore the potentialrole for long-term social protection systems in the response tolarge-scale shocks, either before or aer the crisis occurs, andopportunities for coordination/integration of humanitarianinterventions, disaster risk management (DRM) and socialprotection. Six case studies were undertaken (Pakistan, Philip-pines, Mozambique, Lesotho, Mali and the Sahel region), aswell as a literature review and a series of consultations globally.
1 O'Brien C, Scott Z, Smith G, Barca V, Kardan A, Holmes R, Watson C and Congrave J. (2018), Shock-Responsive Social Protection Systems Research: Synthesis Report. Oxford Policy Management, Oxford, UK.
Shock-responsive social protectionsystems research Summary of research1
1. Strengthening routine social protection is worthwhile in its own right for building resilience.
2. Vulnerability and needs assessments are needed to decide if social protection is a suitable vehicle for addressing a shock.
3. Interventions are likely to work better if planned in advance, through early decision-making, active planning and early delivery of support.
4. Mature social protection contexts have more options in a crisis.
5. Shock-responsive social protection will never meet the needs of all households who need assistance, so coordination with other interventions is essential.
6. Measuring success requires the identification of appropriate indicators that can be compared across humanitarian and social protection responses and that cover outcomes and impacts, not just inputs and outputs.
Box 1Key principles for shock-responsive social protection
For policy-makers: 1. Don’t overlook the value of strengthening
routine social protection in reducing the negative consequences of shocks.
2. Consider how to increase the ability of social protection programmes and delivery systems to withstand the shock themselves and to continue to function in a crisis.
3. In relation to particular shocks or types of shock, analyse systematically whether and howsocial protection can best contribute to a response.
4. Increase ex-ante (forecast-based) planning and action.
5. Develop guidance on shock response through social protection (e.g. roles and responsibilities,protocols for accessing data, etc.).
6. Build strategic collaboration across sectors: it does not happen organically.
7. Pay close attention to adverse impacts.
For programme implementers:8. Take into account that many social protection
programmes can become more shock-responsive with simple design tweaks.
9. Ensure that finances are available to facilitate the adaptation of programmes and systems. Robust processes need to be in place for anticipating and releasing funds.
10. Consider capacity constraints to avoid a negative impact on the underlying social protection programme or system (e.g. by overburdening staff).
11. Promote coordination between individual interventions within the wider emergency response where appropriate.
12. More monitoring and evaluation information on the efficiency and effectiveness of shock-responsive social protection is required to understand whether they provide a better alternative than other responses.
Box 2Recommendations for shock-responsive social protection
A woman holds an electronicfood card in Akçakale camp,
Sanliurfa Province, Turkey, 2018
WFP
/ Den
iz A
kkus
e research focused on social assistance, in-cluding cash and in-kind transfers, school feedingprogrammes, public works programmes andfood subsidy. is synthesis report consolidatesthe evidence and lessons learned.
Shock-responsive adaptation may occurthrough design tweaks to an existing programme,by piggybacking on another programme, verticalexpansion (topping up support to beneficiaries),horizontal expansion (temporarily extendingsupport to new households) or by alignment ofsocial protection with humanitarian systems.Key principles for preparing an effective shockresponse are described in Box 1.
Contextual factors thatinfluence the design of shock-responsive programmes e policy-making context will affect programmedesign, including the level of political will/open-ness to preparedness activities at governmentlevel. Opinions vary between countries onwhether social protection programmes shouldbe embedded into law (some felt that a legalbasis assured programme longevity; others feltit introduced rigidity and limited flexibility).Government capacity is also important; all coun-tries studied had some (although this was oenstretched even without a shock) and some coun-tries had little prospect of surge capacity incrisis. In these contexts, non-government actorsare likely to be a key part of the human-resourcecapability in shock response for the long term.In order to embed a ‘shock-responsive’ elementinto a long-term, government-led social pro-tection programme or system, it is necessary tounderstand many aspects of its financing. Gov-ernments studied could identify resources forshock response in many sectors (such as agri-culture or health); however, in some cases robustprocesses were lacking for anticipating the sizeof funding requirements. A separate challengeis how to mobilise resources so that contingencyfunds are not discovered to be lacking whenthey are needed. It is likely that a combinationof funding sources, topped up by humanitarianappeals where required, will be appropriate.Options available to governments may includecontingency funds, disaster insurance and con-tingent credit lines, although all options havelimitations as well as benefits. Conflict was iden-tified as an important factor that can increase
the need for shock-responsive social protection,but also undermine the capacity for response.
Operational factors in theimplementation of shock-responsive social protection A key operational factor to consider is the assess-ment of need for shock-responsive social protection.ere is likely to be overlap between beneficiariestargeted for social protection and those targetedby humanitarian and DRM actors and thereforeoverlap in the most appropriate form of needs as-sessment. Another important consideration (prefer-ably during preparedness planning) is the appro-priate value of transfers. is will depend on whatneeds to be covered (basic survival or rebuildinglivelihoods); trade-offs between scale, sufficiencyand political support; and support provided byother agencies. Appropriate modes of transfermust be identified (manual versus digital distri-bution), depending on context and disruptionscaused by the shock. Experiences in Pakistan,Lesotho and the Philippines highlight the need tocommunicate with beneficiaries and non-benefi-ciaries to ensure that social protection programmesare well understood by communities, includingwho is targeted and why.
How humanitarian, DRM andsocial protection systems canbest work together Collaboration among social protection, DRMand humanitarian actors may be strengthenedby promoting common understanding of thedifferent fields and their complementarity andby improving policy engagement and coordi-nation of programmes and delivery systems.is should happen at all levels (not just national).In many countries, collaboration is currentlylimited. Examples were found of coordinationgroups that combined government, donor andnon-governmental agencies, including forumsfor data collection and analysis (such as theCadre Harmonisé in the Sahel); technical workinggroups on specific themes (e.g. cash workinggroups); groups that manage disaster response(e.g. the District Disaster Management Teamsin Lesotho, humanitarian clusters, or the UNHumanitarian Country Teams); alliances foradvocacy and policy coordination; temporarycommittees; and periodic conferences.
e authors present 12 recommendations, de-scribed in Box 2.
Anne-Marie Mayer works as aconsultant for programmes at theinterface of agriculture andnutrition. She has a PhD inInternational Nutrition withEpidemiology and Soil Sciencefrom Cornell University and has
worked for non-governmental organisations, academiaand international organisations on nutrition-sensitiveagriculture for the past 20 years.
Rose Ndolo is Senior NutritionProgramme Adviser for WorldVision UK, providing technicalsupport to country programmes todesign and implement multi-sectornutrition programmes. She hasover 14 years’ experience in
nutrition programming and policy influence at nationaland international levels.
Jane Keylock is a nutrition andfood security specialist and partnerat NutritionWorks. She providestechnical assistance and supportfor multi-sector policy andprogramming to governmentministries, United Nations agencies
and civil society organisations in Africa and Asia.
Operationalfactors in theintegration ofnutrition intoagriculture andlivelihoodsprogrammes inZimbabwe
A participant of theWorld Vision Zimbabwe
nutrition programme,Zimbabwe, 2016
Dexter Hati/ World Vision Zimbabwe
Location: Zimbabwe What we know: Nutrition-sensitive agriculture has emerged as a newapproach with guiding principles on programme design; however, littleguidance currently exists on the operationalisation of such programmes.
What this article adds: A case study by consultants working for WorldVision UK was undertaken as a learning exercise for World Vision, partnersand a wider audience of practitioners, researchers and decision-makers. Itshows that there are many opportunities and challenges to design,implement and assess multi-sector programmes for nutrition. Establishingclear objectives, a theory of change and a monitoring framework involvingnot only programme stakeholders but communities, government and theprivate sector are important. Multi-sector programmes are challenging dueto their traditionally separate sectors. A good approach is to coordinate at alllevels, understand the context, assess assumptions, agree objectives, beparticipative, harmonise training materials and give attention to anyunintended consequences. A fully mainstreamed gender component isessential to optimise the pathways from agriculture to nutrition. Targetingfarmers with the greatest capacity for increasing agricultural productivitycould exclude the poorest and most vulnerable, making nutrition objectiveselusive. A practical guide to implement and assess multi-sector programmesfor nutrition under the real constraints experienced by the implementers isneeded and further case studies would help achieve this.
IntroductionWhile the current guidance on nutrition-sensitive programming is useful for designand evaluation (FAO, 2013; SPRING, 2014),the implementation of multi-sector pro-grammes has not been so well described.is research seeks to understand morefully issues related to the implementationof nutrition-sensitive agriculture and liveli-hoods programmes using a case study ofthe Ensuring Nutrition, Transforming andEmpowering Rural Farmers and PromotingResilience in Zimbabwe (ENTERPRIZE)project. e conceptual pathways betweenagriculture and nutrition (SPRING, 2014)and guiding principles for the design ofagriculture programmes for nutrition (FAO,2013) were used in the design of the EN-TERPRIZE programme.
ENTERPRIZE is a multi-sector projectin Mashonaland Central Province in Zim-babwe led by World Vision Zimbabwe(WVZ). It is one of three sub-projects ofthe Agricultural Productivity and Nutrition(APN) component managed by the Foodand Agriculture Organization of the UnitedNations (FAO). e APN is one of threecomponents of the Livelihoods and FoodSecurity Programme (LFSP) funded by theUK Department for International Devel-opment (DFID). It also includes the marketdevelopment (MD) component led by Pal-ladium (an international advisory and man-agement company) and the monitoring, re-porting and evaluation (MR&E) component
led by Coffey (who provide internationaldevelopment assistance services).
ENTERPRIZE aims to benefit 25,500farmers directly and 75,650 households in-directly by improving food and nutritionsecurity through coordinated activities pri-marily across agriculture, finance and healthsectors. It is a complex project with linksacross many sectors and partnerships cov-ering government, non-governmental or-ganisations (NGOs), financial institutionsand the private sector. Figure 1 shows theoriginal theory of change (ToC) for EN-TERPRIZE. e total budget for the projectto date is US$5.3 million over the 40-monthcourse of the project.
Nutrition in ENTERPRIZE includes ‘nu-trition-specific’ and ‘nutrition-sensitive’ ac-tions. Nutrition-specific activities includebehaviour change communication (BCC),such as the promotion of infant and youngchild feeding (IYCF); improved hygiene;health-seeking behaviours and cookingdemonstrations. Nutrition-sensitive activitiesinclude value chains of nutrient-dense foods;a gender empowerment strategy; supportfor diversified crop production; promotionof biofortified crops; farmer trainings; andpromotion of post-harvest management,processing and preservation methods. e
1 DFNSC multi-sector committee is designed to coordi-nate government nutrition activities at district level. It includes agriculture, livestock, health, environmental health, youth affairs, community development and social services.
Field Articles.....................................................
project supports the District Food and NutritionSecurity Committee1 (DFNSC) and ward-levelcommittees. Targeting varied for different com-ponents. Nutrition-specific actions were targetedfor the first 1,000 days (pregnant and lactatingwomen (PLW)) via care groups, irrespective ofsocio-economic classification. Nutrition-sensitiveactions targeted middle-income farmers usingFarmer Groups, in line with LFSP targetingguidelines.
An ENTERPRIZE-specific log frame was de-veloped from the broader APN LFSP log frame.e following nutrition-relevant indicators wereincluded: prevalence of households with moderateor severe hunger (based on the household hungerscale (HHS)); household dietary diversity (basedon the household food consumption score (HFCS)and minimum acceptable diet (MAD)); proportionof households purchasing nutritious foods (in-cluding biofortified products); proportion ofhouseholds producing diverse nutritious foods(including biofortified crops); and proportion ofhouseholds practicing positive nutrition behaviours
(including diversified consumption, exclusivebreastfeeding and improved water, sanitation andhygiene (WASH)). Measures of nutritional status(wasting and stunting) were not included.
Methodse case study seeks to address the gap in evidenceon operational factors in the implementation ofnutrition-sensitive agriculture and livelihoodsprogrammes. e case study was carried outfrom October 2016 to January 2017, in the secondyear of the project. Interview questions were de-signed to address the focal question:
“In seeking to make agriculture and livelihoodprogrammes nutrition-sensitive, what are the op-erational opportunities and challenges that pro-grammes face? What lessons can be drawn frompractical experience?”
A literature review was conducted on multi-sector programming for nutrition to draw lessonsfrom previous experiences. Key factors identifiedrelating to the success of programmes were:adoption of a shared vocabulary and agenda;design and plan for deep engagement with com-munities and governments; a portfolio approachfor nutrition to maximise nutritional outcomes;clear guidance from the design stage for holdingactors accountable for planned coordinationand collaboration efforts; a system of robusttechnical assistance to ensure quality imple-mentation; and establishment of a stronger en-vironment for collaboration, learning and adap-tation (various sources, including SPRING andFeed the Future 2016). ese factors were usedas a basis for the assessment of ENTERPRIZE.
Interviews were conducted in Harare withWVZ, ENTERPRIZE and APN national partners.is was followed by visits to Guruve and Mount
Darwin Districts, for three days each, where 16group discussions were conducted with DistrictENTERPRIZE teams, DFNSCs, Internal, Savingsand Lending (ISAL) groups, community healthand agriculture extension workers, care groupsand farmer groups. e report reflects the situ-ation at the time of the study.
ere were limitations to the method. Somekey partners were not interviewed, includingprivate sector partners (value chain actors), DFIDZimbabwe (LFSP donor), Palladium (MD lead),Coffey (MR&E lead) and HarvestPlus (responsiblefor biofortification promotion). e assessmenttherefore missed out on valuable opinions inkey areas, including value chains and MR&E.Another limitation was that the interview sitesand respondents were not selected at randombut chosen by the project and therefore their se-lection may have introduced bias. ere wasalso a tendency towards positive responses, pos-sibly related to the expectations of beneficiaries.
FindingsAssessment of need and context: Several surveyswere carried out during the start-up phase of theproject, including a contextual analysis; baselinesurvey; knowledge, attitude and practices (KAP)survey; barrier analysis to fine-tune behaviourchange communication (BCC) activities; and agender analysis to develop the gender strategy.ese studies guided the design of ENTERPRIZE.Analyses on socio-economic differences in mal-nutrition were not conducted but would havefurther informed the targeting criteria.
Development of a theory of change (ToC): epathways from programme activities to improvednutrition were not included in the original ToCdiagram but were drawn out during meetingswith project partners during the assessment(see Figure 2). e ToCs presented in projectdocuments did not describe clearly the ways inwhich project activities could impact nutritionoutcomes. e potential for nutrition impactwould be improved if these pathways had beenmonitored to understand and respond to changesduring project implementation. Nutrition wasa substantive outcome with clear approachesand intervention for PLW and young children,but the impact pathways for other componentswere not drawn up during project design.
e gender pathways are strong in this projectand Gender Action Learning System (GALS)(see Box 1) is a key component that facilitatesthe other pathways. e GALS component hassupported other programme activities, such asthe rollout of trainings. As women have greaterinfluence in their communities, men seem morewilling to take on a broader range of tasks thanbefore. Respondents’ testimonials also suggestthat GALS has had a strong positive impact onnutrition through women’s power to influencehousehold decisions around food and nutrition.
e assessment revealed that value chain ac-tivities within the programme were designed toincrease income, rather than produce affordable,nutritious food for local or distant consumption.is may limit the impact of the programme on
PROFITABILITYInclusive Financial Services
Marketing SkillsMarket Information
Farmer OrganisationPrivate Sector Engagement and Linkages
Box 1 Gender Action LearningSystem (GALS)
GALS is a participatory facilitation process ledby trained local facilitators and replicatedthrough community-based, trained ‘champions’.It comprises a series of tools that enablehousehold members to negotiate their needsand interests and find innovative, gender-equitable solutions. GALS begins with dialogueat farming-family level on resource and labourplanning, family visioning, identification ofpreferred value chains, mapping the market,and analysis of key production and marketingconstraints and opportunities.
NUTRITION QUALITYSocial behaviour change for nutrition
and health practices; Awareness and demand
for nutritious diverse foods
Environmentally Sustainable, Climate
ResilientNUTRITION QUALITY
Farmer-Centred, demand driven Extension;
Institutional support for conservation and
climate adaptation
Gender action;learning; local
value chaindevelopment
Processing,Value addition
enterprisesResilient,
food and nutritionsecure farming
families
Availability ofnutritious foods.
post-harvest; Bio-Fortification, Food
chain safety,Promotion
More Equitable
Participation &
Decision makingMore Equitable
Labour and Time
MoreEquitable &
access tocontrol ofresources
Figure 1 ENTERPRIZE original theory of change (ToC)
nutrition outcomes. Although the criteria forselection of value chain crops included thosethat are nutritious, including biofortified maizeand beans, more work needs to be done beyondproduction to enhance the nutrition sensitivityof the entire value chain. Improving water avail-ability for agriculture or health was not includedin the design of the project; this proved to be animportant limitation of the project in the contextof the drought that was occurring in Zimbabweat the time of the assessment.
e project supports the production andmarketing of diverse foods, but a key questionis what food is available and affordable to thepoor (farmers or non-farmers) in practice. Itwould be helpful if the project explored someof the links between production and consumption(who produces what and who consumes what).Assumptions in the project log frame have notbeen assessed and could affect successful nutritionoutcomes, such as ‘access to nutrition foodsfrom markets’, ‘no serious or macro-economicinstability’ and ‘no severe or prolonged drought’.
Targeting: Nutrition-specific activities are ap-propriately targeted to the first 1,000 days (PLWand children under two years of age), irrespectiveof socio-economic classification. However, farm-ers groups targeted middle-income farmers withcapacity to increase productivity and not thepoorest or better-off. Whilst the review identifiedthat poorer and more well-off farmers also ac-cessed support, omitting the poorest and mostvulnerable from targeted activities is a key lim-itation of the programme that reduces the po-tential to improve nutrition.
Integration or co-location and coordination:In the initial years before the DFNSC was up andrunning, challenges in the coordination of trainingsand other community activities were common,leading to conflict between farmer and care groupactivities. As the committee has evolved, therehave been positive changes in this respect.
ENTERPRIZE activities are co-located atdistrict-level (the same districts are included inall activities). Within wards, however, the samehouseholds are not necessarily targeted for allactivities. e district ENTERPRIZE teams arealso located together under one roof, making
coordination easier. Other initiatives such aslearning visits to other LFSP projects have helpedcross-sector communication. e Healthy Harvest2
training manual naturally integrates agricultureand nutrition ‘from farm to fork’ and DFNSCnutrition training helps build understanding ofthe pathways between agriculture and nutrition.However, there have been coordination chal-lenges, such as a lack of clear strategy and re-sources for DFNSCs and different priorities andtargets for each sector. Also, agriculture extensionhas insufficient resources for nutrition trainingin practice.
Training, capacity-building and behaviourchange communication activities: e projectis delivered through government structures andit supported the establishment of the DFNSCin its initial training and ongoing meetings;WVZ participates in the DFNSC as an NGOmember. e DFNSC and WVZ work togetheron community trainings and monitoring activitiesand the DFNSC is involved in training ward ex-tension staff who are frontline facilitators atfield-level.
Nutrition training is delivered through caregroups, with training cascading to reach the‘first 1000 days’ target group. ere is also somenutrition material covered in training to agri-culture extension workers using the HealthyHarvest manual. e DFNSC has received somenutrition training but the level of staffing fornutrition is probably not adequate for the scopeof work to deliver the full nutrition components.In future, the project would benefit from ashared curriculum on nutrition across sectors.
Implementation: e project has been adaptedwell to the context and implemented accordingto timeframes and targets, even during thesevere drought in 2016. Several factors enabledsuccessful implementation, including supportivegovernment policies, a strong focus on gender,effective cascade training models including prac-tical demonstrations and tailored BCC messages,and strong human resources. However, therehave been several challenges related to imple-mentation, including:
Resource and co-ordination issues around training:ere have been limited resources for training
and sometimes poor communication betweenthe different government and NGO partnersinvolved.
Lack of cross-learning across training models:Training materials related to the Healthy Harvestmanual are not available in easy-to-use formatsfor the cascade training. ere is no plan to rollout the training with a different message eachmonth and barriers to practice have not been ad-equately determined. It would be helpful for theagriculture extension department to learn fromthe care group BCC rollout in these respects.
Insufficient inputs: ere appears to be a chronicshortage of seeds for crops other than maize.Even the biofortified seeds supplied by theproject had initial supply problems. Other seedsof naturally nutritious grains such as pulses,small grains and vegetables also have supplyproblems. is, a lack of inputs and lack ofwater affects farmers’ ability to plant the cropssuggested in the training.
Price issues: Commodity groups are not gettinggood prices from buyers and buyers dictate theprice. Farmers reported that prices in the marketare low for produce which then affects thefarmers’ motivation to grow these crops.
Challenges for agricultural diversification: Duringthe 2015/16 drought, agriculture was challenged;diversification became difficult as farmers con-centrated on staple production. Agricultural di-versification has also been challenged by nationalmaize supporting policies (such as provision ofmaize seeds and other inputs).
MR&E: ere is considerable effort to collectthe required data by ENTERPRIZE and gov-ernment partners, through extension staff, com-munity promoters, lead mothers and lead farmers.However, the project is complex and moreroutine quantitative data is collected than canbe analysed; there is also limited qualitativeroutine monitoring. ere is an accountabilitysystem in place for beneficiaries to receive in-formation on the project and provide feedbackon services, but this is not structured for nutrition
National economic growth
Food production
National nutrition profile
Hou
seho
ld a
sset
s an
d liv
elih
oods
Agric
ultu
real
live
lihoo
ds
Food prices
Processing& storage
Agriculturalincome
Women’sempowerment
Foodexpenditure
Non-foodexpenditure
Foodaccess
Healthcare
Caring capacity& practices
Female energyexpenditure
Healthstatus
Childnutrition
outcomes
Key components of the enabling environment:• Food market environment• Natural resources• health, water, and sanitation• Nutrition/health knowledge and norms
Mothersnutrition
outcomes
Diet
Figure 2 Conceptual pathway from agriculture to nutrition
2 An FAO nutrition training manual for community workers ongood nutrition and the growing, processing and preparationof healthy food.
monitoring purposes. e dissemination of thefindings of the considerable MR&E effort tocommunities is also underdeveloped.
Impacts on nutrition: At baseline, chronic mal-nutrition (stunting) was 26.8% and global acutemalnutrition (GAM) in 6-59 months childrenwas 3.2% (DHS 2015). It was not consideredappropriate to include stunting as an impactindicator, given the short duration of the project.Wasting not considered as an indicator, whichhas since been identified as a missed opportunityand something to consider in future phases ofthis and other programmes. Communities re-ported several positive knowledge and behav-ioural changes related to nutrition; for example,use of new food groups for children’s porridge;support for women to prioritise food for youngchildren; improved nutrition and hygiene knowl-edge; and improved conservation agriculturepractices. Importantly, women reported thatfeeding practices had improved because con-servation agriculture saves time and heavy work-load. Respondents reported many challengesrelated to the drought which have an impact onnutrition, particularly the lack of water, reducedagricultural production, reduced income fromsales and lack of agricultural diversification.
Unintended nutritional consequences: Potentialunintended consequences related to nutritionhave not been fully explored by ENTERPRIZE.ese could include the production of highlyprocessed foods through the value chain, con-tributing to the ‘double burden’ of malnutritionand chronic disease; nutritious foods sold ratherthan consumed at home; and exclusion of thepoorest farmers, which could leave them relativelyworse off compared to others.
Scaling up and sustainability: e ENTERPRIZEproject is contributing to the Scaling Up NutritionMovement (SUN) by supporting the DFNSC,contributing to MR&E systems and tacklinggender inequities. Some agricultural approachesused in the project, such as conservation agri-culture and climate-smart agriculture, will beenvironmentally sustainable compared to thehigh-input, high-tillage, mono-crop alternatives;however, an alternative to herbicides is neededto prevent contamination of crops and possibleexposure of farmers to health risks. Whetherthe committee will be able to continue the jointplanning, coordination and monitoring activitieswithout external project support remains anopen question.
roughout the project the governmentfaced financial constraints to adequately financeagricultural and nutrition extension. It is there-fore unlikely that the government will take upthe entire package of interventions in this pro-gramme in the immediate future. Further fund-ing for this programme would help to consolidatethe gains made while the enabling publicsector/government environment improves. Ef-forts have been made to work with governmentministries at district and national levels duringimplementation and learning and best practiceshave been shared with government stakeholdersat national learning events. ere is willingnessat the district government level to take upproject activities aer transition, once financesallow. Policy at national level has also been in-fluenced by the programme, particularly in thesupport of small grains and biofortification andnational subsidies to promote conservationagriculture.
Discussion and lessons learnedLessons learned from the ENTERPRIZE casestudy are described in Box 2.
Conclusionse effort to introduce ‘nutrition-sensitivity’into existing and new programmes is crucial toaddress the urgent and widespread problemsof malnutrition globally. ENTERPRIZE hasmade considerable efforts to integrate nutritioninto its ENTERPRIZE project; however, internaland external challenges remain. Since thisreview, ENTERPRIZE has responded to lessonslearned to improve nutrition sensitivity by ex-panding targeting of nutrition and diet messagingto groups beyond PLW to include neighbour-hood women, men’s forums and extended familymembers. Reach has been improved to themost vulnerable villages with high levels ofmalnutrition through community-level foodfairs in those villages. Agriculture training hasbeen extended to nutrition care groups, healthtechnicians and village health workers on agron-omy practices for biofortified, vitamin A-richmaize and iron-rich beans, post-harvest man-agement, food storage and preservation tech-niques. Care groups and farmers have also beentrained in the Healthy Harvest agriculturemodule to increase their skills on diversifiedfood production, and care groups have beensupported to set up household micro-gardensand continue to manage community nutritiongardens to promote inclusive production. Inaddition, all 1,530 lead crop farmers have beentrained on key nutrition messages, harvest andpost-harvest handling procedures, value additionand processing.
To strengthen monitoring practices, theproject has implemented quarterly monitoringof DFNSC activities, monthly monitoring ofuptake of agriculture and nutrition services andpractices through focus group discussions withbeneficiary communities, and monthly account-ability monitoring and feedback with farmerhouseholds. Further case studies and an imple-mentation guide would help move this workforward.
e full report is available from World Vision: www.worldvision.org.uk/files/2315/1024/1152/IntegratingNutritionwithAgricultureCaseS-tudy.pdf
ReferencesDHS (2015). Zimbabwe Demographic and Health Survey,2015.
FAO (2013). Synthesis of guiding principles on agricultureprogramming for nutrition.
SPRING (2014). Understanding and Applying PrimaryPathways and Principles. Improving Nutrition throughAgriculture Technical Brief Series. Arlington, VA:USAID/Strengthening Partnerships, Results, andInnovations in Nutrition Globally (SPRING) Project.
SPRING and Feed the Future (2016). Multi-SectoralCoordination and Collaboration of the Feed the FuturePortfolio – A Bangladesh Case Study.
Box 2 Learning points from the ENTERPRIZE case study
• Guidelines: Develop a practical guide for the design, implementation and assessment of nutrition-sensitive programmes, to complement existing guidelines.
• Partnerships: Form early partnerships with district government, community and the private sector to establish ownership and understand complementarities and trade-offs.
• Assessing needs and context: Assess the environmental, social, political, cultural, economic and nutrition contexts and groups affected by malnutrition, based on existing data where possible.
• Theory of change (ToC), programme design and targeting: Test the design assumptions through monitoring and surveys and use resultsto revise ToC, activities and approaches; involve the community and partners in ToC developmentto verify assumptions and open new possibilities; explore the full potential of value chains (and even ‘value webs’ to analyse the whole food system); integrate and fully fund a safety net component; ensure the poorest groupsparticipate in farmers groups, value chains, subsistence production and income-generatingactivities; include a gender component (such as GALS); target the right groups (first 1,000 days for nutrition-specific activities and a wider group for nutrition-sensitive activities, ensuring the poorest are included).
• Implementation and coordination: Allow for a longer implementation period than would be necessary for single-sector programmes; plan for integration and coordination at project design; target barriers to behaviour change specific to the community; ensure funding is flexible to allow adaption to observed changes.
• Training and capacity-building activities:Include nutrition expertise from the earliest design stage; train all groups involved using a multi-sector curriculum and materials (livelihoods, agriculture, nutrition and health); develop communication, coordination and integrated data management skills within the programme.
• Monitoring and evaluation (M&E): Link the ToC to M&E plans; involve beneficiaries in participatory monitoring; monitor data to consider the effect of the programme on the poor and extreme poor; include a coordinationprocess level indicator; include a mechanism to recognise and mitigate unintended consequences (open ended questions).
• Sustainability: Support government structures to build sustainability; build social accountability through extension work, safety nets, climate smart approaches and sustainable agriculture, all underpinned by engagement of communities.
菀菀
Field Article
By Patrick Codjia, Marjorie Volege, MinhTram Le, Alison Donnelly, Fatmata FatimaSesay, Joseph Victor Senesie and Laura Kiige
Patrick Codjia is a Nutrition Specialistworking for UNICEF Eastern andSouthern Africa Regional Office, based inKenya. Prior to this he worked forUNICEF in Malawi, Democratic Republicof Congo (DRC) and Botswana on bothdevelopment and emergency nutrition
programmes and in nutrition programming and research inEastern DRC, Burkina Faso, Canada and France.
Marjorie Volege is a Nutrition Specialistwith UNICEF Eastern and SouthernAfrica Regional Office. She has over tenyears’ experience in emergency nutritionand development programming withUNICEF and other organisations.
Minh Tram Le is a HumanitarianNutrition Adviser for Save the ChildrenEastern and Southern Africa RegionalOffice with ten years’ experience withSave the Children and otherorganisations in the West Balkan region,Central and South Asia (Pakistan,Afghanistan, India) and West Africa.
Alison Donnelly is an independentNutrition Specialist and was theHumanitarian Nutrition Advisor for Savethe Children East and Southern Regionaloffice between 2013 and 2016. Alisonhas over ten years’ experience inhumanitarian and developmentprogramming in Africa and Asia.
Fatmata Fatima Sesay is a NutritionSpecialist for UNICEF Somalia. She hasover ten years’ experience in nutritionand public health programing in bothemergency and development contextswith UNICEF and other organisations.
Joseph Victor Senesie is a NutritionSpecialist with UNICEF based in Juba,South Sudan. Prior to this he worked as aNutrition Specialist in the UNICEF SierraLeone Country Office, with World VisionInternational for 12 years, and withMerlin in Liberia.
Laura Kiige is a Nutrition Specialist withUNICEF Kenya, supporting maternalinfant and young child nutrition. Laurapreviously worked for the Ministry ofHealth Kenya, including as theprogramme manager for infant andyoung child nutrition.
Enhancing infant and young child feeding inemergency preparedness and response in East Africa:capacity mapping in Kenya, Somalia and South Sudan
A counsellor advisesmothers on IYCF at a health
centre in the Protection ofCivilians (PoC) site, Western
Bahr el Ghazal, SouthSudan, 2017
Phil Hatcher-Moore/ UNICEF
Location: Kenya, Somalia and South Sudan What we know: There is increasing demand to address infant and youngchild feeding (IYCF) needs during emergencies in Eastern and SouthernAfrica regions.
What this article adds: UNICEF and Save the Children Regional Officesfor Eastern and Southern Africa undertook a regional capacity mappingon infant and young child feeding (IYCF) in Kenya, Somalia and SouthSudan to provide a regional overview, identify capacity gaps and informcountry (government and partners) action. It involved a desk review(literature, key informant interviews) and country-level workshops tovalidate results. An assessment tool was developed comprised of sixpillars (policy, human resources, coordination, information/knowledgemanagement, programme delivery and financing) and markers to analyseIYCF and infant and young child feeding in emergencies (IYCF-E)country capacity. Common gaps included weak policy provision andlegislative frameworks for IYCF-E, significant capacity gaps(coordination, staff skillset), limited assessment/information systems thatinclude IYCF-E, limited integration of IYCF beyond health and nutrition,and lack of funding. Country-specific findings will inform country-levelIYCF-E improvement strategies and actions and the nationalgovernment, national Nutrition Cluster and other partners will trackprogress of the implementation of action points with technical guidancefrom UNICEF/ Save the Children regional offices. In 2018, the capacitymapping will be extended to other countries in the region, based onprevious lessons learned.
Backgrounde Horn of Africa continues to facechallenges resulting in nutrition emer-gencies that greatly affect young childrenand their families. Key triggers are foodinsecurity, conflicts, disease outbreaksand climate change, among others. Inthese contexts, the risks of illnesses, acutemalnutrition and mortality among youngchildren are augmented; protection andsupport of recommended feeding practicesis a critical safeguard but oen falls shortin practice. A review by Save the Childrenin 2012 found that infant and young child(IYCF) interventions were not delivered
at scale during acute or protracted emer-gencies globally. Key bottlenecks to thescale-up of IYCF in emergencies (IYCF-E) included limited technical capacitieson IYCF-E, insufficient preparedness foremergencies, lack of national coordinatingbodies, funding constraints and low pri-oritisation. ese also reflect the regionalexperiences of UNICEF and Save theChildren in Eastern and Southern Africa,where more emphasis is placed on thetreatment of severe and moderate acutemalnutrition despite increasing demandfor IYCF-E expertise in countries facingchronic and acute emergencies.
To address these barriers, Save the Childrenand UNICEF Regional Offices, under a regionalframework of collaboration, agreed to focus onIYCF-E as a core priority and specifically to un-dertake an IYCF-E regional capacity mappingexercise. e objectives were to provide a regionaloverview on IYCF-E, identify key capacities,bottlenecks and gaps, and inform governmentsabout their current IYCF-E capacity needs.
Methodologye capacity mapping assessment took place intwo phases: phase 1 – assessment and validationand phase 2 – validation.
e assessment phase (phase 1) comprisedof a desk review and interviews with key in-formants on IYCF-E preparedness and response,including the identification of key gaps, bottle-necks and good practices in Kenya, Somaliaand South Sudan. e situations in the threecountries varied and included large-scale nutritiondevelopment programmes combined with lo-calised emergencies (Kenya) and longer-termhumanitarian crises (South Sudan and Somalia).e desk review served to define relevant pro-grammatic areas for effective IYCF-E. It appraisednon-governmental organisation (NGO) pro-gramme internal and external evaluation reportsand national policies, strategies and action plansrelating to IYCF and IYCF-E. Key informantinterviews (KIIs) targeted personnel from hu-manitarian organisations, government, UnitedNations (UN) agencies and donors. Based onthe analysis, six pillars were identified to analyse
the IYCF/IYCF-E capacities of a country (seeTable 1). Indicators and programme markersinspired by the desk review on IYCF wereselected for each pillar and a scoring systemwas developed to rank each country pillar andoverall IYCF-E capacity. e adopted scoringsystem was 0 to 5 (5 being the highest) and re-sponses were presented in a graphical manner.Each country’s score represents its performancein a particular IYCF action area. e totalpossible score was 145 (policy and plans=50,human resource=20; coordination=15; informationsystem=15; programme delivery 25; budgetingand financing=20). e percentage score foreach action area was calculated and scores fromeach action area were combined to create anoverall country score.
e first phase was conducted mainly in thefirst quarter of 2016. Assessment results of thisphase were presented to the IYCF/IYCF-E coun-terparts from government, the UN and civil so-ciety in each country. Initial scores were reviewedand, when needed, stakeholders explained therationale scoring. is phase was made possiblethanks to the generous support of DFID toUNICEF ESARO.
e second phase involved the validation ofresults through stakeholder consultation incountry-level workshops, supported by theGlobal Technical Rapid Response Team finan-cially supported by the Office of US ForeignDisaster Assistance (OFDA). Final scores werevalidated by a wider range of stakeholders during
validation workshops held within each countryin 2017 (Kenya; Hargeisa and Mogadishu inSomalia; and South Sudan). Some of these finalscores were revisited again by the participants.Stakeholders were based on a purposive sample,with efforts made to cover as wide a range ofpartners as possible. is included the IYCFFocal Points from the Ministries of Health forKenya, South Sudan and Somalia, as well as thenutrition and health professionals overseeingIYCF programmes integrated into nutrition andhealth. Boxes 1 to 3 provide an overview ofcountry findings and validated scores.
Results of the regional analysise results of the capacity mapping assessmentvalidated by each country, displayed in Figure1, show that all the countries had some mecha-nisms in place for IYCF, such as: • Availability of national IYCF guidelines and
programmes (and in some cases IYCF-E guidelines);
• A joint statement or legislation on the Codeof Marketing of Breast-Milk Substitutes (BMS Code)1;
• Availability of IYCF training packages, or a mechanism to conduct trainings initiated by governments or partners;
• Use of multiple communication channels for IYCF messages;
• Participation in global events like the World Breastfeeding Week;
• Availability of some form of monitoring and evaluation framework (although reporting did not always include IYCF);
• An active Nutrition Cluster or coordinationmechanism.
Key findings by pillar are summarised in figure 1.
IYCF/IYCF-E policy levelIYCF policy provides the general frameworkfor implementation of IYCF activities in ‘nor-mal’ times, while an IYCF/IYCF-E policy in-corporates implementation of IYCF in emer-gency contexts. Key areas assessed were: • Availability of IYCF/IYCF-E policy/strategy
/guideline developed;• Availability of legislation on IYCF with
specific consideration of emergencies;• Recent (within last five years) guidelines to
plan, implement and evaluate IYCF/IYCF-Eactivities;
• A contingency plan developed to promote, protect and support exclusive breastfeedingand appropriate complementary feeding andto minimise the risk of artificial feeding (withspecific reference to the BMS Code); and
• Institutional roles for implementing IYCF/ IYCF-E programmes are clearly defined and operationalised.
In all three countries, IYCF/IYCF-E programmeswere developed as ‘national programmes’ man-aged by the Ministry of Health (MoH) in col-laboration with UNICEF, oen driven by globaland regional priorities. Kenya and Somalia had
IYCF strategies and policies in place (standaloneor integrated); while South Sudan was usingthe UNICEF community IYCF package to rollout IYCF trainings nationwide (South Sudanhas since developed and disseminated the countryIYCF strategy). In Kenya, the full BMS Code islegislated; for Somalia and South Sudan thereare no legal measures as yet2. e assessment re-vealed that more attention was needed to improveknowledge and dissemination of the BMS Codeand reporting of Code violations by the imple-menting agencies in all countries.
Based on the analysis, the rating on the avail-ability of a legal framework supporting IYCF-Ewas 40 per cent (20 per cent for South Sudan,40 per cent for Somalia and 60 per cent forKenya). In Kenya, IYCF-E is included underthe 2013 operational guidelines, in addition tospecific guidance for the promotion and supportof infant and young child nutrition in emer-gencies. In Somalia and South Sudan, a specificIYCF-E section was not developed within thenational IYCF national strategy and policy atthe time of the first phase assessment.
Human resources capacity for IYCF-EAdequate and supportive supervision by a
staff knowledgeable on IYCF-E was missing inall countries. Essential materials for IYCF-E as-sessments such as standard questionnaires andorientation packages were also lacking, and staffwere not adequately resourced to implementIYCF-E programmes such as counselling, com-munity support groups and community educationand care for pregnant and lactating women(PLW), especially during emergencies. Specificexpertise on IYCF-E, such as on social marketing,community empowerment, advocacy and com-munication for development in humanitariansettings, were assessed as limited in the threecountries.
Coordination and communicationmechanisms on IYCF/IYCF-E Capacities varied within the three countries,but all needed to improve national multi-sectorialcoordination and collaboration across sectorsand coordination between agencies at the earlyonset of an emergency and during needs as-sessment. South Sudan was the furthest alongin having a multi-sectorial IYCF action planand an IYCF-E steering committee. Somaliahad several coordination mechanisms mainlythrough the Somalia Nutrition Cluster. In Kenya,effective IYCF and emergency nutrition coor-dination mechanisms were established withinthe MoH structure and under their leadershipand support; excellent collaboration among allthe partners was reported. IYCF strategies forKenya and Somalia were developed by the gov-ernment in partnerships with UN agencies andthe non-governmental sector. At the time ofthe assessment, the South Sudan Governmentwas developing its IYCF strategy with the supportof UNICEF and the Nutrition Cluster partners.
2 Marketing of BMS: National implementation of the international code. Status Report 2016.
Box 1 IYCF-E capacity mapping assessment results Kenya
Kenya has put in place mechanisms to support IYCF-Ethat include having a supportive and legal frameworkfor nutrition, enhanced coordination mechanisms,information systems and a funding mechanism forIYCF-related activities (directly or indirectly). Aftervalidation, the total score for Kenya was 60 per cent,with gaps in information and knowledge management,
human resources, budgeting and financing. Overall, theparticipants in the validation felt the IYCF-E capacitymapping assessment results accurately reflected thesituation in the country. Participant feedbackindicated that some of the indicators were overrated(human resources and information systems);validated scores below reflect these changes.
A strong (nutrition cluster) coordination mechanismis in place to support service delivery. While policiesand systems have been strengthened, gaps remainin implementation, follow-up and engagement of allstakeholders. The total score for Somalia was 39 percent after validation. The major constraints identifiedwere on service delivery, relating to budgetallocation and the high dependency of the country
on external funding; weak IYCF-E coordinationbetween the Nutrition Cluster and otherstakeholders; inadequate implementation of policiesand strategies due to government structures notbeing fully functional at district and communitylevel; and limited operational capacity bygovernment for policy implementation andenforcement.
Policy and plans on IYCF/IYCF-E
Human resourcescapacity on
nutrition
Communication and Co-ordination
mechanismsInitial Score Validated Score
Information system/Knowledge
management
Programme delivery
Budgeting andfinancing
70%
60%
50%
40%
30%
20%
10%
0%
40% 40%
25%
40%
60%
47%53%53%
40%44%
30%
40%
Box 3 IYCF-E capacity mapping assessment results South Sudan
Capacity for implementation of IYCF-E activities islimited in South Sudan. With support from partners,the government has put in place some mechanismsto support implementation of activities. Key to noteis the development to the IYCF strategic plan whichhas incorporated IYCF-E. Some of the key successesin South Sudan are availability of a coordinationmechanism, integration of IYCF-E in the RapidResponse Mechanism and available funding forIYCF. The total score for South Sudan was 41 percent after validation. Health and nutrition humanresources were the main barriers identified and
were characterised by: lack of clear job descriptionsand targets; insufficient and irregular paidcompensation; lack of supportive supervision andquality control mechanisms at all levels; lack of basicinformation about numbers, composition andgeographical distribution of health providers in theprivate sector; insufficient coordination of humanresource development across different parts of thehealth system; limited continuing educationalopportunities and professional development; andpoor recruitment and weak retention capacity ofstates and counties.
IYCF-E information system andknowledge management is area was rated average in all three countries.While integration of IYCF into health systemsin Kenya began in 2007, there is limited reportingof maternal and infant and young child nutrition(MIYCN) national indicators in district nutritionsurveillance and surveys. In Somalia, to supporthumanitarian nutrition information systems,the Nutrition Cluster has created an AssessmentInformation Management Working Group(AIMWG) to provide guidance on assessmentplanning, design and implementation, and val-idation of assessments and surveys includingIYCF. In South Sudan, routine Health MonitoringInformation System (HMIS) that includes IYCFindicators is largely non-operational. To addressthis gap, a new overall information system hasbeen developed by the Nutrition Cluster NutritionInformation Working Group (NIWG) for emer-gency nutrition site-level programme data andinformation; this includes IYCF-E.
IYCF promotion, counselling andsupport programmes is appeared to be active in all three countriesassessed. Activities include revitalisation andadoption of mother and child-friendly relatedpolicies and guidelines; individual and com-munity-level IYCF counselling, establishmentof mother and baby-friendly spaces; bottle ex-change programmes (where feeding bottles areexchanged for cups); and distribution of ready-to-use foods (RUFs) for children and women.Complementary feeding support involves pro-motion, counselling and linkage to other sectors;no robust programmes for complementary feed-ing were identified in any of the countries. Al-though all three countries had some form ofexisting IYCF programming in stable times,scale-up of these programmes during crisis wasrare and ad hoc, mainly due to limited funding,competing priorities and limited expertise tomanage this.
IYCF budgeting and financingWhile there is government leadership on IYCFin Kenya and South Sudan, none of the countrieshad independent government financing specificfor IYCF programming. e main sources offunding for IYCF and IYCF-E activities are fromthe UN agencies, donors and agencies’ ownfunding. Funding is a major constraint for all
implementing IYCF-E programmes and is rarelyprovided for standalone IYCF-E activities. IYCF-E is not considered ‘life-saving’, so it is not pri-oritised or sustained for long-term activities(including preparedness). IYCF-E funding isalso oen cut first in case of budget constraints.While nutrition funding has increased in allthree counties, funding for IYCF/IYCF-E pro-gramming has not.
Common gaps across countriesCommon gaps for the three countries were:• Lack of inclusion of IYCF-E in national
policies and training curriculums: IYCF policies or strategies are in place in many ofthese countries, but do not encompass an emergency section, which would delay the inclusion of IYCF in any emergency response;
• Limited dissemination of national policies, legislation on the BMS Code, etc. In coun-tries where these strategies exist, the dissemination of such documents to the humanitarian community is limited and therefore not in use or endorsed;
• Limited integration of IYCF-E with other sectors; very limited knowledge about IYCFby sectors other than Health and Nutrition;
• Inability of NGO and health workers to differentiate IYCF and IYCF-E, leading to confusion on the IYCF priorities in emergencies;
• No or limited monitoring of BMS Code violations;
• Limited budget allocation to IYCF-E programming;
• Lack of awareness of IYCF-E indicators to be included in assessments;
• No system for data collection and moni-toring specifically for IYCF-E;
• IYCF-E is oen not prioritised in cluster or coordination meetings.
e main reasons identified for not undertak-ing IYCF-E activities were:• IYCF is not considered a life-saving inter-
vention during emergencies and is not prioritised by non-technical staff;
• Competing priorities, poor sensitisation across agencies and lack of clear IYCF-E policy;
• Limited funding for IYCF-E programming; • Context constraints including insecurity,
poor access and lack of government leader-ship or guidance on IYCF-E;
• Insufficient human resources or expertise in local and international staff members and the absence of technical staff on the ground;
• Capacity gaps among partners, governmentfacilities and field teams.
Conclusions and next stepse results of the IYCF-E capacity mapping as-sessment reflect a need to pinpoint IYCF actionsand strategies in the East Africa region to specifi-cally address fundamental gaps in policy, capacity,coordination, information management, pro-gramming and financing. Understanding andcohesion across development and humanitarianactors and sectors needs considerable improve-ment. In East and Southern Africa, UNICEFand Save the Children are important partnersfor IYCF-E and work closely with governmentsand NGOs; they are positioned as importantand influential stakeholders in this area. Gov-ernments, donors, NGOs, breastfeeding associ-ations and other stakeholders have critical rolesto play in advocating for and mainstreamingIYCF-E across sectors and in emergency responseand mobilising resources.
UNICEF and Save the Children RegionalOffices jointly developed the IYCF-E capacitymapping assessment tool. e capacity mappingexercise demonstrated the value of gatheringhealth and nutrition professionals to agree col-laboratively on the current gaps and status ofthe IYCF-E implementation in a specific countryand agree on a common action plan involvingall key stakeholders and agencies. e next stepfor each country is to use the findings of the ca-pacity mapping to develop IYCF-E improvementstrategies and actions targeting the main issuesand barriers identified, as well as tracking progressmade. Additional technical support to countriesmay be required, by UNICEF, Save the Childrenand other nutrition agencies at national levelwith critical involvement from the governmentand national Nutrition Clusters.
e capacity-assessment process can be usedin other countries in Eastern and SouthernAfrica region by any partner to foster the devel-opment of a specific action plan for better inte-gration of IYCF during emergencies by govern-ments and the humanitarian community.
UNICEF and Save the Children RegionalOffices will revise the assessment tool based onlearnings from the validation process and capacitymapping will be extended to other countries inthe region in 2018.
ReferencesSave the Children (2012) Infant and Young Child Feeding inemergencies: Why are we not delivering at scale? A review ofglobal gaps, challenges and way forward. Save theChildren UK.
Women and young childrenattend a health education sessionat a UNICEF-supported outpatienttherapeutic feeding clinic, Baidoa,Bay Region, Somalia, 2018
Joint IAEA-WHO-UNICEF workshop onbiological pathways to better understandthe double burden of malnutrition
While stunting and wasting arestill important public healthproblems in low and middle-income countries, rapid nutrition
and epidemiologic transitions have led to in-creased rates of obesity and associated non-communicable diseases (NCDs). is doubleburden of malnutrition exists at national, house-hold and individual levels. ere is need for in-tegrated nutrition actions – the “double-dutyactions for nutrition”1 – tailored to addressseveral forms of malnutrition. Isotope techniquescan complement routine methods by accuratelymeasuring body fatness and breastfeeding prac-tices. erefore, the International Atomic EnergyAgency (IAEA) jointly with the World HealthOrganization (WHO) and the United NationsChildren’s Fund (UNICEF) organised a workshopon the analysis of biological pathways to betterunderstand the double burden of malnutritionand to inform action planning.
Fiy participants from United Nations (UN)Organisations (WHO, UNICEF, IAEA and theFood and Agricultural Organization (FAO)),academia, policy, ministries of health and non-governmental organisations (NGOs) met in Vi-enna from 3-5 October 2017 to discuss thedouble burden of malnutrition, its epidemiology,the biological pathways that drive it and howpolicy and interventions can be framed toaddress the phenomenon. e role of nucleartechniques in understanding the biological path-ways and in assessing the impact of interventionswas emphasised.
e main target areas for interventions wereidentified as baby-friendly initiatives2 (e.g. inhospitals), promotion of healthy feeding andphysical activity in pre-school and school envi-ronments, supporting healthy living and breast-feeding at workplaces, and engaging with foodsectors to promote healthier options. Stable iso-tope techniques will become increasingly im-portant in providing accurate evidence to enablethe design and evaluation of such interventions,especially those related to infant and youngchild feeding (IYCF), physical activity and bodycomposition, and the evaluation of diet quality.e workshop focused on bridging from biologyto context-relevant interventions and consider-ations for policy.
Workshop participants agreed that, althoughthe biological mechanisms contributing to thedouble burden of malnutrition are not yet fullyunderstood, sufficient evidence is available toimplement interventions addressing the problem.Participants identified knowledge gaps to beaddressed in order to improve the understandingof the multiple factors contributing to the doubleburden of malnutrition and ensure effectivedouble-duty actions. ese include: to improveunderstanding of the biological pathways linkingearly nutrition to later risk of NCDs; communicatebiological evidence in plain language to ensuresuccessful translation and integration into nu-trition interventions; and to integrate multiplesectors (e.g. health, agricultural, environmental,education and trade) in nutrition actions andpolicies to respond to the complex causes of thedouble burden of malnutrition. Finally, it wasemphasised that current assessment methodsare not adequately addressing the double burden
of malnutrition, either at individual or at popu-lation level.
IAEA, in cooperation with WHO andUNICEF, will organise an International Sym-posium on Understanding the Double Burdenof Malnutrition for Effective Interventions inVienna 10-13 December 2018 to provide scien-tists, public health professionals, implementersand policy-makers an opportunity to share ex-periences and develop action plans to fight mal-nutrition in all its forms. Abstract submissionis open until 23 April 2018.
1 Double-duty actions include interventions, programmes and policies that have the potential to simultaneously reduce the risk or burden of both undernutrition and overweight, obesity or diet-related NCDs. www.who.int/nutrition/publications/double-duty-actions-nutrition-policybrief/en
2 www.unicef.org.uk/babyfriendly/
Participants at the IAEA-WHO-UNICEFjoint workshop in Vienna
Improvingnutritionsurveys: Newdevelopmentsand changesat UNHCRBy Timo Luege, Caroline Wilkinsonand Maeve de France
Timo Luege is anindependent,humanitariancommunications andadvocacy consultantbased in Berlin,Germany. Timo has
experience working for non-governmentalorganisations (NGOs), United Nations (UN)and the Red Cross Red Crescent Movementboth at headquarters and in the field. Timoworks regularly for CartONG1.
Caroline Wilkinson isthe Senior NutritionOfficer for the UnitedNations HighCommission forRefugees (UNHCR) andwas fully involved in the
development of the SENS and theintroduction of mobile data collection inUNHCR SENS surveys. She previouslyworked for 14 years with Action Contre laFaim (ACF) in several countries andheadquarters in Paris.
Maeve de France hasbeen an InformationManagement ProjectManager for CartONGfor three years. Prior tothis she worked for fiveyears in the private
sector as a geographical informationmanagement project manager.
Over the last two years, the numberof people facing crisis-level food in-security has grown from 80 millionto 135 million (FSIN, 2017). At the
same time, many humanitarian organisationsproviding food and nutrition services (in kindor cash-based) are struggling with ever-increasingfunding gaps, which have repeatedly forcedthem to cut back assistance.
Given that aid organisations need to reachmore people on decreased budgets, it is evermore important that the money is spent as effi-ciently as possible. Surveys and assessments arean essential part of ensuring that sparse fundsgo to the most urgent crises and that in eachcrisis the most vulnerable are prioritised.
UNHCR’s Standardised Expanded NutritionSurvey (SENS), described in Box 1, is based onthe Standardised Monitoring and Assessmentof Relief and Transitions (SMART) methodologyand provides valuable data to identify urgentneeds, and changes in needs, in refugee contexts.Over the last five years the number of SENS sur-veys has risen from 63 in 2012 to 109 in 2016.
But every survey is only as good as the datait captures. Since 2011 UNHCR and its imple-menting partner for mobile data collection(MDC), CartONG, have been using MDC toincrease data quality. As part of that collaboration,the percentage of SENS surveys that use MDChas grown from 32 per cent in 2013 to 95 percent in 2016.
Most recently, UNHCR and CartONG havefocused on three areas to further increase thequality of SENS for all humanitarian organisationsthat are using it.
1) Making SENS trainings lessburdensomeGathering anthropometric data is labour-intensive.A typical survey team consists of four to sixpeople who must carry scales and height boards,take measurements and record data. ere aremany opportunities for mistakes to creep in,particularly when getting information from chil-dren or infants. To reduce the likelihood of data-capture errors, UNHCR and partners train allenumerators rigorously. is involves a five-daytraining that includes, among other things, whatis known as the standardisation test. Conductinga standardisation test for anthropometric measuresis a fundamental part of the training, since it
allows objective assessment of the precision andaccuracy of the measurements made by the enu-merators, their strengths and weaknesses.
During the standardisation test, up to 20enumerators measure ten children, usually agedbetween 18 and 59 months. Each measurementis repeated twice by each enumerator for eachchild, with a time interval between both roundsof measurements. Collecting all measurementstakes between half a day and a full day, which isexhausting and tiring for both the survey teamand the children. At the end of the day themeasurements are compared with reference datacollected by the trainer and that information isused to determine which enumerators are capableof which role, or whether some enumeratorsneed additional training prior to the start of thesurvey. Until now, the facilitator has manuallyentered the captured data into a spreadsheet atthe end of the day, a process that took a consid-erable amount of time and was a potential sourceof data input errors.
While UNHCR has used smartphones to cap-ture SENS data for many years, prior to 2016they had not been used for the standardisationtests that are part of the enumerators’ training.e main advantages of using smartphones forthe standardisation tests are that data entry ismuch faster; there are fewer data entry errors;and it is harder for trainees to “cheat” during thetraining; for example, by manually copying datathat has been captured earlier (see Figure 1).While this process still has some technical chal-lenges that need to be resolved, the technicalimplementation has already improved significantlyfrom Jordan in 2016 to Burundi in 2017. UNHCRand CartONG are confident that the remainingtechnical issues can be ironed out in 2018 andthat full support for MBC for the SENS surveystandardisation tests can be made available soon.
1 CartONG, a long-time partner of UNHCR, is a French non-profit organisation committed to furthering the use of mapping, mobile data collection and information manage-ment in emergency relief and development programmes.
A child's height being measuredby SENS trainees
News
Figure 1 Screenshot of astandardisation testusing a smartphone
A SENS report includes information on thefollowing data:
• Levels of malnutrition and key health indicatorsin children
• Levels of anaemia in children and women• Feeding practices of infants and young children• Access to food at the household level• Access to safe drinking water, toilets and
hygiene practices at the household level• Access to and use of mosquito nets at the
2) Monitoring and verifying thesampling strategy throughgeolocationA typical SENS survey takes between 30 and 45minutes per household, so most teams can onlytalk to between 12 and 17 families per day. Par-ticularly in large refugee camps, this meansrelying on random sampling to ensure that thedata are representative. In some cases, with mul-tiple teams working in different parts of a campor town, it can be difficult for the survey managerand supervisors to monitor progress of theteams and to ensure that the sampling method-ology is being followed by all team members.By setting the smartphones to collect global po-sitioning system (GPS) data, together with thesurvey data, supervisors can see precisely whichhouses were visited and whether this was inline with the agreed sampling strategy. In addition,supervisors can see whether teams have takenunusually long or were uncharacteristically fastwhen collecting data in specific locations, eitherof which might indicate data quality issues.
3) Putting SENS on the mapWhile most nutrition experts feel very com-fortable reading long tables with rows of data,this information is not always easy to convey todonors or to use in reports for non-experts.Maps can help make technical data more easilyconsumable for a wider audience. e new SENSmapper is a free, browser-based data viewerthat can quickly show the distribution of SENSdata on a map, including indicators for nutrition,safe drinking water and mosquito net coverageand where there are gaps.
While it is generally accepted that malnutritionis not geographically clustered, these maps cannevertheless be useful advocacy tools. Possible
examples include showing that malnutritionlevels are very different for new arrivals comparedto refugees who have had access to food andservices in a camp over a longer period. Similarly,a map could highlight areas of a camp whererefugees have insecticide-treated nets but arenot using them.
e free SENS mapper has just been publishedand can be accessed through the UNHCR mapportal (http://maps.unhcr.org/apps/mdc_mapper/sens/index.html). e SENS mapper can easily
create visualisations like those displayed in Figure1 if SENS data is captured with smartphones.
References FSIN 2017. Food Security Information Network (FSIN)Global report on Food Crises 2017.www.fao.org/fileadmin/user_upload/newsroom/docs/20170328_Full%20Report_Global%20Report%20on%20Food%20Crises_v1.pdf Retrieved: 4 Dec 2017.
Red dots represent households with at least one anaemic child; green dots represent households with no anaemic children.
Figure 2 Screenshot of the free SENS mapper
News
New online training: Acceleratingbehaviour change in nutrition-sensitiveagriculture from the SPRING project
e Accelerating Behavior Change in Nutri-tion-Sensitive Agriculture online training is aone to two-day course for people who designand implement agriculture projects. It providesparticipants with knowledge and skills to helpagriculture projects become more nutrition-sensitive, maximising the contribution of agri-culture to nutrition in family, farm, market andcommunity systems. Participants practice ap-plying proven behaviour-change approaches to
identify context-appropriate, nutrition-sensitiveagricultural practices and to focus project re-sources effectively on increasing their use.
By the end of this training, participants will:• Understand agriculture’s role in improving
nutrition;• Use guiding questions to assess which
agricultural practices are most likely to contribute to nutrition in the project context;
• Know how to use behaviour-change methods to engage people, prioritise practices, reduce barriers to improved practices and create enabling physical and
market environments for them; and• Establish a commitment to developing a
behaviour-change strategy for current and future work.e interactive course guides participants
through narrated slides, quizzes, exercises, hand-outs, videos and links to helpful resources. Ifyou have any difficulty accessing the course,encounter any problems or have any feedback,please email us at [email protected]
To access the course, go to: www.spring-nu-trition.org/publications/training-materials/ac-celerating-behavior-change-nutrition-sensitive-agriculture
Management of At risk Mothersand Infants (MAMI) meeting
Aone-day meeting of the Managementof At risk Mothers and Infants(MAMI)1 Special Interest Group (SIG)took place in London on 17 January
2018. e meeting was hosted by ENN in collab-oration with the London School of Hygiene andTropical Medicine (LSHTM) and Save the Childrenand funded by ENN (with Irish Aid funding)and Save the Children.
e aim of the meeting was to identify syner-gies, opportunities, priorities and next steps tohelp develop the evidence base on MAMI, buildingon the 2016 meeting of this interest group (seewww.ennonline.net/mamimeetingreport). emeeting was also informed by the proceedingsof a one-day shared meeting with the ENN-ledWasting & Stunting Technical Interest Group(WaSt TIG) that took place the day before theMAMI gathering.
e meeting was opened by Marie McGrathENN with a reminder of the call for actions pre-sented at the shared MAMI/WaSt meeting on16 January:• Support to develop a global MAMI Network,
a coordinated network for capture and learning(research and operational experience); a visionwas outlined that requires financing.
• Robust evidence (in the form of randomised controlled trials is now needed to complementthe strong operational research that is ongoing.
• e need to scale up. Lessons can be learnt from the CMAM scale-up process; pilots are critical, informed by country agendas.
• A greater MAMI voice (advocacy).
A morning of presentations directly spoke topriority areas worked on since 2016 and informedfour aernoon working groups.
Sharing experiences and researchNatasha Lelijveld (ENN consultant/ACF/ LSHTM)shared the results of a systematic review by ENN,LSHTM and CHAIN of anthropometric and clin-ical methods for detecting severe acute malnu-trition (SAM) in infants under six months (infants<6m) (see www.ennonline.net/mamicasedetec-tionreview and www.ennonline.net//fex/55/meth-odstodetectcases). e authors propose the useof mid-upper arm circumference (MUAC) andweight-for-age z-score (WAZ) alongside simple,clinical indicators and identification of kwashiorkoras the standard indicators for this age group.Infants born small or preterm should have thesame anthropometric indicators of admissiondue to their heightened risk of mortality.
Tim Campion-Smith (ENN consultant, Uni-versity of Oxford, KEMRI-Wellcome) presentedfindings from a review of non-feeding interven-tions (micronutrient supplementation, deworming,antibiotics, maternal supplementation) undertakenby ENN, LSHTM and KEMRI-Wellcome. Scantdirect evidence and weak evidence overall meantclear recommendations to inform programmerscould not be made. Next steps were identified ina dedicated aernoon working group.
Jay Berkley (KEMRI-Wellcome) presentedpreliminary findings of a secondary data analysisof a cohort of 1,103 infants from birth to 12months in Burkina Faso by ENN, LSHTM, KEM-RI-Wellcome and others. e analysis aims toidentify the anthropometric indicator that bestidentifies infants at highest risk of death; if MUACmeasured at birth can be used as a marker ofrisk (like low birth weight (LBW)); and if LBWinfluences the interpretation of anthropometry.Babies were born more wasted than stunted (30%wasted; 10% stunted; 17% underweight). Twen-ty-one per cent of babies were LBW. MUAC <9cm measured at birth identifies infants at highrisk of death. Measuring MUAC at one month ofage and severe underweight (WAZ <-3) showsgood predictability for mortality (WAZ <-3). Re-sults are due for publication in mid-2018.
Mary Lung’aho and Louise Day (Save theChildren consultants/Nutrition, Policy and Prac-tice) shared preliminary results of an evaluationof the C-MAMI tool (www.ennonline.net/c-mami) in Bangladesh and Ethiopia. Findings willbe used to develop an updated version of thetool, available mid-2018.
Katie Beck (Partners in Health) presented theresults of a study to examine outcomes of pretermand LBW infants discharged between 2011 and2013 from neonatal units in Rwanda. One tothree years later, of 86 children with median age22.5 months, 47% had feeding difficulties and40% reported signs of anaemia; 79% were stunted,9% wasted and 38% underweight. e RwandaMinistry of Health has since established paediatricdevelopmental clinics (PDCs) in 2014, with sup-port from Partners in Health and UNICEF, toprovide integrated clinical, nutritional, social anddevelopmental services to infants born with peri-natal complications. is service provision wasupdated in 2017 to include more nutrition coun-selling and interventions and an adapted C-MAMI tool; this work is ongoing.
Nicki Connell (Save the Children) shared ex-periences from two strands of MAMI work inBangladesh. First, Save the Children is pilotingthe C-MAMI tool in Barisal, Bangladesh untilNovember 2018. Intervention and control clusters(two distinct sub-districts in Bangladesh) havebeen established, using the tool in interventionclusters and existing Ministry of Health protocolsin controls. In addition, Save the Children is pi-loting the C-MAMI tool in the Rohingya responsein Bangladesh. Funded by UNICEF and withUNHCR support, a camp-based, broad, multi-sector approach has been established betweensectors which includes Food Security, Nutrition(encompassing blanket supplementary feedingprogrammes, infant and young child feeding,water, sanitation, and hygiene (WASH)) and Health.
Martha Mwangome (KEMRI-Wellcome,Kenya) shared interim findings of a clinical trialto explore the role of breastfeeding support inrecovery of malnourished infants <6m . Resultsso far show that a strategy to use peer supporters
to support breastfeeding in an inpatient settingis acceptable and effective to re-establish exclusivebreastfeeding. On average, infants receiving breast-feeding support gained weight and MUAC aerdischarge but this was not sufficient to improveWAZ and weight-for-length z-scores (WLZ); in-fants discharged aer meeting WHO exclusivebreastfeeding discharge criteria may have improvedgrowth aer discharge.
Collective thinking e meeting divided into four working groups toexamine policy, programming and research informedby the morning’s presentations and to agree onpriority next steps for MAMI. Groups reconvenedin plenary to share their conclusions, discuss eacharea and agree on priorities and next steps.
Group one examined what anthropometric indicatorsshould be used in programming and research toidentify nutritionally vulnerable infants. MUACand WAZ were agreed as anthropometric indicatorsof choice to identify at-risk infants; further analysisis needed to identify MUAC thresholds. ere isgood potential to build the evidence gap on thresh-olds and caseload through analysis of existing datasets. Further primary research should test non-an-thropometric discharge criteria; in infants <6m,health and feeding criteria are key determinantsrather than anthropometric status. Research shouldinclude follow up of discharged infants <6m.
Group two examined how to address gaps aroundMAMI programming faced by implementing agen-cies in the immediate and longer term. Actions toaddress immediate gaps include a call for a globalUN/cluster joint statement of MAMI and devel-opment of an inter-agency forum/mechanism toshare learning, experiences and resources. Longerterm, buy-in from wider coordination structuresto ensure assessment of this age group and in-clusion in emergency response and external ad-vocacy, including donors, is needed.
Group three examined key questions, interventionsand outcomes to assess MAMI. e key researchquestion to answer is where does a MAMI inter-vention ‘sit’ (e.g. health, CMAM programme)and how does the delivery platform of a MAMIpackage vary by context? Research should test abroader package of interventions to examine theeffectiveness/added value of each component forspecific target groups; test refinements to the C-MAMI tool; test discharge criteria; demonstrateeffectiveness and cost-effectiveness; and examinedelivery mechanisms and continuum of care.e primary outcome should be growth; mortalitywould be ideal, but likely not feasible. Researchshould be conducted in different geographiesand contexts, including emergencies.
Group four discussed findings of the non-feedingreview in more depth and examined means toachieve consensus on recommendations for pro-grammers. Discussion points included: the im-portance of context when examining evidence;antibiotics and resistance; community versus in-patient treatment; and questions on case fatalityin infants < 6m. e group identified the needfor urgent research on prioritised questions andthe need for policy (WHO) and political (to in-1 Formerly “management of acute malnutrition in infants
under 6 months”, the term “MAMI” has been updated to reflect evolution in thinking and scope of the initiative.
fluence donors) advocacy on critical gaps thatcurrently ‘paralyse’ programmers. It was agreedthat a Delphi consultation process could be usedto secure consensus.
Reflections and conclusions rough plenary discussion, priority next stepswere identified: actions the MAMI SIG can un-dertake; actions that involve collaboration withthe WaST TIG; and actions deemed a prioritybut beyond current capacity of the MAMI SIGto take forward. Specific actions were themedaround further examination of existing datasetsto provide more evidence; next steps for the C-MAMI tool; advocacy; and opportunities for
joint analysis with the WaST TIG. Plenary voicedthat the move to discussion of ‘failure to thrive’in this age group, rather than ‘acute malnutrition’is welcome. WHO should take the lead in clarifyinglanguage/terminology.
Implementation research needs to be conductedwith rigour, be systematic and seek to avoid lossto follow-up. A short window of opportunity existsfor MAMI to conduct research within the contextof programmes and recruit control populations;an opportunity that must be seized. Care must betaken as there are risks as well as benefits of iden-tifying at-risk infants, depending on what inter-vention is prompted. An appeal was made from
ENN for funders to step up and help move theMAMI collective work to achieve the vision of aMAMI global network.
e meeting was closed by Nicki Connell,who reinforced the value of the MAMI SIG col-lective as a group that challenges the status quo,brings ideas and is not afraid to discuss andquestion them.
e full meeting report can be downloaded here:www.ennonline.net/mamimeetingreport2018
e meeting report for the MAMI-WaSt meet-ing can be found here: https://www.ennon-line.net/mamiwastmeetingjanuary2018
On the 15th of January 2018 the Wastingand Stunting (WaSt) Technical InterestGroup (TIG) held their third face-to-face meeting at Trinity College,
Oxford. is group of 30 experts1 in child growth,nutrition, and epidemiology, was formed in January2014 to guide the ENN’s WaSt project2 (fundedby USAID/OFDA and Irish Aid). A separation inthe nutrition sector in the conceptualisation ofchild wasting and stunting over recent decades,along the humanitarian/development divide, hasresulted in the evolution of separate policy, pro-grammes, research and funding for these twomanifestations of undernutrition. e WaSt TIGcoordinated by the ENN have been working overthe last four years to improve our understandingof the relationship between wasting and stuntingto find out if this separation is justified.
Having published a research prioritisation in2016 (Angood et al, 2016) the WaSt TIG havesubsequently, prompted by a limited funding base,available datasets and enthusiasm of its members,focused on mining existing data to answer someof these priority questions. e meeting broughttogether the members of the group to presentand discuss analyses on the relationship betweenwasting and stunting carried out over the lasttwo years on existing data by TIG members; agreeupon the policy, programme and research impli-cations of the findings of these analysis; and definefuture priorities for the WaSt TIG.
Carmel Dolan (ENN) opened the meeting,thanking participants for their ongoing enthusiasticengagement over the last four years, welcomingnew members, and recapping on the work of theWaSt TIG during that time.
Tanya Khara (ENN) presented a meta-analysisof prevalence and burden of children concurrentlywasted and stunted (weight-for-height z score(WHZ) <-2 AND height-for-age z score (HAZ)<-2, or concurrent WaSt) in 84 countries fromMICS/DHS3 datasets. is analysis, published inOctober 2017 (Khara et al, 2018), was born outof concern for the apparent high risk of death as-
sociated with multiple anthropometric deficitsand the lack of reporting on the overlap betweenwasting and stunting, despite the data being avail-able routinely. Key findings presented included:• Concurrent WaSt ranged from 0-8% (in
children aged 6-59 months); with nine countries >5%.
• Pooled prevalence was 3.0% (95% CI 2.97 to 3.06) signifying a burden of approximately six million children (6-59 months) in the 84 countries.
• Concurrent WaSt was highest in the 12‐24 months age group and more common in boys.
It was emphasised that this analysis is not aglobal one as national data from the last 10 yearswas only available for 84 countries. e work hashad influence however, with the WHO/UNICEF2016 Joint Estimates report recognising that wedon’t know the level of concurrence globally,www.who.int/nutgrowthdb/estimates.4
Mark Myatt (Brixton Health) presented analysisof 2,426 cross sectional surveys conducted between1992 and 2015 of almost 1.8 million children in51 countries. e key finding of this analysis, al-ready submitted for publication, was confirmedby modelling using the WHO growth standardsthemselves - it is impossible to be WHZ <-2 zscore AND HAZ <-2 z score and not be weight-for-age (WAZ) <-2 z score. is means that thehighly elevated risk of death for children con-currently wasted, stunted and underweight (hazardratio of 12.3 compared to children with no an-thropometric deficits) found in analysis of 10mortality cohorts (McDonald et al, 2013), is ac-tually the mortality risk for children concurrentlywasted and stunted.
Additional findings of this analysis were:• In most countries for which we have data,
stunting and wasting are associated with each other; wasted children are more likely to be stunted (than non-wasted children) and stunted children more likely to be wasted(than non-stunted children).
• Children with concurrent WaSt are more
wasted than children who are wasted only and more stunted than children who are stunted only.
• Concurrent WaSt is more prevalent in younger children, and in boys.
• Children who are both stunted and wasted can be detected with excellent sensitivity andvery good specificity using WAZ and with acceptable sensitivity and specificity using MUAC.
Further analysis was also presented and discussedexploring the relationship between being bothwasted and stunted and mortality. This partic-ularly explored whether it is all or a subset ofchildren with concurrent WaSt that were mostat risk of mortality and what indices/case-defi-nitions would be most appropriate to identifythose cases at most risk of dying who may needto be treated within community based manage-ment of acute malnutrition (CMAM) pro-grammes. Preliminary findings from analysisof longitudinal data from Niakhar in Senegalcomprising 5,144 children who were followedwithout treatment was presented and issuessuch as factoring age into the analysis and thecaseload implications of looking at WAZ as ameans of identifying high risk children withconcurrent WaSt were discussed.
Sophie Moore (Medical Research Council(MRC) Unit, e Gambia at the London Schoolof Hygiene and Tropical Medicine & Departmentof Women and Children’s Health, King’s CollegeLondon, London) and Simon Schoenbuchner(MRC Elsie Widdowson Laboratory, Cambridge)presented analysis of MRC cohort data from e
2 https://www.ennonline.net/ourwork/reviews/wastingstunting3 Multiple Indicator Cluster Survey/Demographic and Health
Survey4 A postscript to this is that since the meeting UNICEF has
published online figures for the prevalence of children concurrently wasted and stunted (‘overlapping malnutritionestimates’) for all the national surveys in its database.
Gambia, which retrospectively examined infantand child (birth to two years of age) nutritionalstatus from three long-standing MRC surveillancevillages (1976-2012). Key findings included:• Season of birth is a predictor of growth
patterns; children who are born at the start of the annual wet season fail to thrive in the early post-natal months.
• Children who are wasted in the wet season, even if they recover weight in the dry season,are more likely to be wasted again in the next wet season.
• At the peak prevalence, 10% of boys were concurrently wasted and stunted, compared to 5% of girls.
• Current wasted status increases a child’s oddsof being stunted in three months’ time by a factor of 3.2; current stunted status increasesthe odds of the child being wasted in three months’ time by a factor of 1.5.
e important implications of these analyses forprogrammes and policy were discussed at lengthby the WaSt TIG, also considering other analysisof data from children during and aer treatmentfor severe acute malnutrition (SAM) presentedat the meeting by Sheila Isanaka (Harvard) andJay Berkley (KEMRI), and in light of current ini-tiatives within the nutrition sector. e WaStTIG decided to produce two briefing documents,one focused on policy and the other on programmeimplications for wide circulation, followed by aLancet views piece which will propose a bold re-framing of how we understand wasting and stunt-ing. e group also agreed to meet remotely todiscuss other specific priority pieces of follow-up work in 2018 which may include seeking per-mission to access additional mortality cohortsfor similar analysis and further exploration ofthe heightened male vulnerability demonstratedin analysis conducted so far.
For additional information about the ENN’sWaSt project and the WaSt TIG, please contact:Tanya Khara, email: [email protected]
ReferencesAngood C, Khara T, Dolan C, Berkley JA, WaSt TechnicalInterest Group (2016) Research Priorities on the Relationshipbetween Wasting and Stunting. PLoS ONE 11(5): e0153221.https://doi.org/10.1371/journal.pone.0153221
Khara T, Mwangowe M, Ngari M, Dolan C. 2018. Childrenconcurrently wasted and stunted: A meta-analysis ofprevalence data of children 6–59 months from 84countries. Mater Child Nutr. 2018;14:e12516. Firstpublished September 2017. https://onlinelibrary.wiley.com/doi/full/10.1111/mcn.12516
McDonald, CM., I. Olofin, S. Flaxman, W. W. Fawzi, D.Spiegelman, L. E. Caulfield, R. E. Black, M. Ezzati, and G.Danaei. 2013. The Effect of Multiple AnthropometricDeficits on Child Mortality: Meta-Analysis of IndividualData in 10 Prospective Studies from DevelopingCountries. American Journal of Clinical Nutrition 97 (4):896–901. doi:10.3945/ajcn.112.047639
By Tamsin Walters, en-net moderator
en-netupdate
Over the past three months, 37 ques-tions have been posted on en-net,generating 59 responses. e forumareas for Prevention and management
of moderate acute malnutrition and Assessmentgenerated most discussions. Twenty-six vacancyannouncements have been posted, which haveaccumulated 8,474 views on the website.
An interesting discussion arose from whatseemed a relatively straightforward question inthe Prevention and management of severe acutemalnutrition area. e question was asked, in ahealth facility where there are both severe acutemalnutrition (SAM) and moderate acute mal-nutrition (MAM) services, under which criteriashould we classify discharge of an admitted SAMcase who reaches the anthropometric criteria fortransfer to MAM? Should such a case be dischargedas “cured” to provide data on the SAM cure rate,or as “transferred to SFP-MAM”, which wouldresult in a zero SAM cure rate?
Contributors to the discussion suggested var-ious ways to approach this. Reference was madeby the en-net technical moderator to a paper byMaust et al (2018) reporting on integrated pro-gramming in Sierra Leone, which examined twodifferent protocols: ‘standard’ management and‘integrated’ management.
In standard management, a child is transferredfrom an outpatient therapeutic programme (OTP)to a supplementary feeding programme (SFP)with a mid-upper arm circumference (MUAC)>11.5cm or weight-for-height Z-score (WHZ) >-3, being considered as “discharge cured”. echild is later discharged “cured” from SFP with aMUAC of >12.5cm or WHZ >-2. is approachis used where there are two different treatmentprogrammes in different locations.
is approach is potentially problematic be-cause the use of MUAC >11.5cm/WHZ >-3 asstandalone criteria has not been shown to besafe for discharge, so categorising a child as“cured” using just these anthropometric markers(unless combined with some other criteria suchas a minimum stay + absence of oedema + clinicalwellness, etc.) represents a risk and is not supportedby existing evidence. Moreover, the intention inthe programmes, although they are separate, isto continue treatment in SFP aer OTP and assuch the child is not truly discharged from treat-ment until cure is obtained in SFP.
In the integrated protocol, a child receivesgraduated treatment depending on whether theyare SAM or MAM and recovery for MAM +SAM is reported together and compared againstsphere standards. In this model, the same healthfacility conducts the full treatment.
ere are potential difficulties with reportingin the integrated scenario when using Sphere stan-dards because the acceptable mortality rates forOTP and SFP are different, which may cause prob-lems if there is a mortality rate greater than threeper cent in OTP. Combined reporting is oneoption; another is reporting the negative outcomesfor the OTP and SFP components separately.
Using either approach, the criterion of “trans-ferred to SFP” would be considered a successfuloutcome for OTP, though it is not the same as“cured” and should not be reported as such. Achild cannot be cured twice from one episode ofacute malnutrition, so reporting needs to considerthe community-based management of acute mal-nutrition (CMAM) programme as a whole (andsee recovery as a continuum), rather than con-sidering each component as a different programme.e narrative that accompanies programme mon-itoring data can clarify this in reporting and inthis way a combined recovery rate could be re-ported for OTP and SFP.
In summary, reporting depends on havingclarity in terms of the nature and design of theprogramme and the purposes of reporting (e.g.to donors or to national databases). ere are
many ideas on how to report and protocols aimingfor standardisation, but there is a need to thinkclearly about what we are actually reporting on.
If the aim is for graduated programmes wherea child with SAM is treated as MAM when theirMUAC reaches >11.5cm or WHZ >-3, then astep change is needed in the way we report. Al-though the concept of reporting recovery forOTP and SFP combined is controversial, it moreclosely resembles the reality of the intended con-tinuum of care. Reporting negative outcomesseparately (for OTP and SFP) also has validity,since the factors for default, death and non-re-sponse may be different for each phase of thegraduated treatment. is is clearly seen whenwe have “early” or “late” defaulters in OTP fordifferent reasons, for example.
is discussion also raised a caution to ensurethat a child originally identified as SAM for treat-ment should be considered a “recovering SAM”case when their condition improves, rather thanbeing reclassified as an “SFP-MAM” case. Changingthe classification of a SAM child to MAM on thebasis of anthropometric cut-offs achieved overlooksthe child’s history of profound physiological com-promise. Likewise, any discharge criterion shouldalso ensure a focus on physiological recovery.
To read more or join this discussion, go towww.en-net.org/question/3185.aspx
To join any discussion on en-net, share your ex-perience or post a question, visit www.en-net.org.uk or www.fr.en-net.org
Contributions Sameh Al-Awlaqi, Tammam Ali MohammedAhmed, Paul Binns and Dr Narendra Patil.
ReferencesMaust A, Koroma AS, Abla C, Molokwu N, Ryan KN, Singh Land Manary MY. Severe and Moderate Acute MalnutritionCan Be Successfully Managed with an Integrated Protocolin Sierra Leone. Journal of Nutrition September 30, 2015.American Society for Nutrition. https://publichealth.wustl.edu/wp-content/uploads/2014/08/NnekaPubJN.pdf
News
Famine in Somalia:Competing Imperatives, Collective Failures, 2011-12
Referencesde Waal A. Famine Crimes: Politics and the disaster reliefindustry in Africa, London, James Currey Press, 1997.
de Waal A. Mass Starvation: The history and future offamine, Cambridge, Polity Press, 2018.
Oxfam and Save the Children. Dangerous Delay: The Costof Late Response to Early Warnings in the 2011 Drought inthe Horn of Africa, Joint Agency Briefing Paper, Oxfam andSave the Children, January 2012.
F amine in Somalia: Competing Impera-tives, Collective Failures 2011-12 is anincisive, well-researched book whoseimplications reach far beyond famine
and Somalia. A 21st-century Famine Crimes(de Waal, 1997), Maxwell and Majid take theirreaders into the murky world that creates famine.ey expose the politics and examine the complexmixture of decisions and events that tippedcrisis into a famine, costing the lives of an esti-mated 260,000 men, women and children. Faminein Somalia reminds us that famine is neitherinevitable, nor solely the result of environmentaldegradation and drought. It is the outcome ofprocesses, precipitated by human agency; whetherdue to the decisions and actions taken by AlShabaab and the Transitional Federal Government(TGF) or inaction – as in the case of the inter-national community. In our globalised, hyper-connected world there may be “no excuse forfamine” (p.15), but it remains horrifically com-mon. If it was Somalia yesterday, it is distressingimages from Yemen and Syria that dominatethe news today. Tragically, as the Deyr rains failand donors prevaricate, it is depressingly likelyto be Somalia again tomorrow. Even in ourcomfortable, western economies malnutritionand deprivation stalk those who have little voice.Famine is alive and well; in this pressing book,Maxwell and Majid explain why.
As one of only 58 known cases of faminesince 1870 (de Waal, 2018), the Somali famineof 2011-12 stands out as an important casestudy thanks to the plethora of information andearly-warning data available2. Despite amplewarnings, field agencies and donors failed toagree on what this information was telling themand how they should react. e hesitancy ofdonors and agencies, aggravated by internalcompetition and concerns over delivering hu-manitarian assistance in a context like Somalia,and directives linked to the ‘War on Terror’, ledto a “dangerous delay” in response (Oxfam andSave the Children, 2012) with tragic conse-quences. Yet the international and humanitariancommunity was not acting in a vacuum, asMaxwell and Majid’s perceptive analysis of “com-
peting imperatives” makes clear. As relevant asFamine in Somalia is to both famine and Somalistudies, the book’s implications extend far beyondits subject and geographic area. It should beobligatory reading for anyone working in crisisor in crisis-prone areas, whether academic,diplomat, policy-maker or practitioner. Moreover,its accessible style and the authors’ unusual in-clusion of Somali narratives speaks to an evenbroader audience.
For a practitioner, and one involved in the2011-12 response, Famine in Somalia makesuncomfortable reading, but Maxwell and Majidare unusual aid academics, and their extensivepractitioner experience pervades the book. eirnuanced, compassionate critique sidesteps theissue that affects similar academic analyses –valid criticism, but few actionable (or feasible)suggestions for change. If in the last chapter(chapter 10: Preventing Famine: An UnfinishedAgenda) the authors offer high-level suggestionsfor a “way out” (p.192), in chapters 5 and 6 theysensitively use Somali narratives to illustratehow elements missed by current assessmentpractices – the impact of historic exclusions,people’s networks of support and rural/urbanlinkages – skew our understanding of ‘vulnera-bility’ and ‘resilience’ in such contexts. Like somuch in the book, the elements that emergefrom the experiences of ordinary Somali house-holders are not exclusive to Somalia or famine.Rather, they reflect common elements of dailylife in crisis, from experiences of living withconflict in eastern Congo, to refugee and mi-gration narratives. Capturing these elementsand mapping the institutions and mechanismsthat order people’s daily lives would not onlygive practitioners a better understanding ofwhat constitutes ‘vulnerability’ and ‘resilience’in crisis, but could also identify alternate waysto channels assistance – particularly pertinentin areas which require remote working.
More than a simple milestone in famine lit-erature and Somali studies, Famine in Somaliamakes a strong empirical case for rethinkinghow we ‘look at’ crisis, from proposing an over-
arching framework for contextual analysis, tosuggesting how we might re-evaluate local as-sessment practices. Furthermore, it challengesthe humanitarian community to reconsider howwe currently understand ‘vulnerability’ and ‘re-silience’ in such circumstances.
It is a pressing book, with an important mes-sage. Yet, by focusing on Somalia, its title failsto reflect its scope. More appropriate wouldhave been Competing Imperatives, CollectiveFailures, Famine in Somalia: 2011-12. Faminein Somalia may be a case study of famine, butthe competing imperatives and complex mix ofcollective failures it describes are commonfeatures of crisis-escalation worldwide. It is com-peting imperatives and collective failures thatare behind the current situation in Yemen andover 30 years of conflict in eastern Congo andwhich, tragically, despite books such as this,risk causing a repeat of yet another famine inSomalia in the not-so-distant future.
e editors invite Field Exchange (FEX) readersto submit reviews of books that are relevant tothe FEX audience. Please contact Chloe Angoodwith your ideas at [email protected]
1 From Analysis to Practice – Famine in Somalia: Competing Imperatives, Collective Failures, 2011-12 by Daniel Maxwell and Nisar Majid. London: C. Hurst & Company, 2016. v + 269 pp. Maps. Illustrations. £22.00 ISBN 978-1-84904575-9
2 Note de Waal defines famine as a food security crisis with a death toll of over 100,000. This is different to the Integrated Food Security Phase Classification (IPC), whose thresholds are designed to capture the beginning to famine and whereall three outcomes of mortality must be evident – in particular, CDR > 2/10,000/day; wasting GAM > 30%, and food consumption (near complete Food Consumption gap for >20% of the population) for an area to be classified famine-prone. See www.ipcinfo.org/ipcinfo-detail-forms/ipcinfso-resource-detail0/en/c/178965/
Solange Fontana is a DPhil candidate inInternational Development at the University ofOxford. Prior to returning to academia, sheworked as a humanitarian field practitioner,where she was interested in the intersection oflivelihoods and protection. During the 2011-12famine in Somalia and crisis in the Horn, shewas regional emergency food security advisorfor a large international charity.
Lidan Du is a public health nutritionist with a PhD ininternational nutrition from Cornell University and over 15years’ experience in international nutrition research. She joinedHelen Keller International in 2013 as the Research Advisor ofthe Food Security and Nutrition team of the SPRING project.
Heather Danton is an agriculture and food security expert. Sheis the Director for Food Security and Nutrition at John Snow,Inc., where she leads efforts to improve linkages betweenagriculture and nutrition on the SPRING project. She has 30years’ experience of working in food security and livelihoods inAsia, Africa and Latin America, including as the Senior Directorof Food Security and Livelihoods for Save the ChildrenFederation.
The multi-sector nature of the globalmalnutrition problem has been madewidely known since the publicationof UNICEF’s Conceptual Framework
of Malnutrition (UNICEF, 1990). Nutrition hassince been elevated in policy agendas; it is oneof the three high-level objectives of the USGovernment’s Global Food Security Strategybeing implemented through the Feed the Futureinitiative and features prominently in the Sus-tainable Development Goals (SDGs) (SDG 2particularly). In fact, nutrition is related to allSDGs (Webb, 2014).
In our work on USAID’s multi-sector nutri-tion project, Strengthening Partnerships, Results,and Innovations in Nutrition Globally (SPRING),our key task is to build evidence and provideassistance to help countries deliver better nu-tritional results from agriculture and economicdevelopment initiatives supported by the GlobalFood Security Strategy. Agriculture is one areathat offers opportunities for nutrition-sensitiveinterventions (Ruel and Alderman, 2013). How-ever, existing evidence has yet to prove theimpact of nutrition-sensitive agriculture pro-grammes on reducing child stunting, a com-monly used nutrition indicator (Webb andKennedy, 2014).
Researchers at the International Food PolicyResearch Institute (IFPRI) reviewed and high-lighted results from nutrition-sensitive agricultureprogrammes implemented and reported on since2014 and identified several knowledge gaps andresearch priorities (Ruel et al, 2018). roughthe programmes that SPRING has been sup-
porting, we have repeatedly observed two ofthe issues that Ruel et al pointed out in their re-view. One is the failure to explicitly considerpathways linking agricultural (inputs) to nutrition(outcomes) in programme and research design.e other is the lack or inappropriate use ofmetrics to demonstrate links between agricultureand nutrition.
At SPRING we recommend that agricultureand economic growth projects mandated tocontribute to nutrition adopt an explicit pro-gramme impact pathway to inform their moni-toring systems to both define and track progresstoward realistic nutritional outcomes. However,such a recommendation does not necessarilytranslate easily with sector specialists, even whenintentions toward multi-sector coordination andcollaboration are desired and required.
Why is working across sectorsso hard?One of the keynote speakers at the Agri-Chain& Sustainable Development conference in Mont-pellier, France in December 2016 shared herperspectives on the challenges of multi-sectorintegration and how a better mutual under-standing could help the agriculture and nutritionsectors to work better together. She proposedfour key directions of opportunity and change:inter-sectorality; inter-disciplinarity; trans-dis-ciplinarity; and partnered research. Her key ar-gument under inter-disciplinarity pointed tothe need to overcome barriers in languages,concepts, assumptions and styles of workingacross different disciplinary backgrounds.
is inter-disciplinarity argument led us toreflect on our own experiences and observationsworking across disciplines and sectors. Our de-liberations centred on the technical characteristicsthat are so deeply entrenched in the respectivedisciplines of agriculture and nutrition – fromtraining to application of knowledge to thediffering ways in which we work. We agree thatthese difficulties are related to some of the fun-damental differences in our paradigms. Wecompiled a list (Table 1) to help articulate thegaps in our shared vision and objectives; tocome up with solutions and strategies to closethese gaps; and explore where and how we canapply our comparative advantages to strengthencollaboration.
is paper discusses some of the challengesposed by disciplinary paradigms that oenhinder technical staff from working effectivelyin a multi-sector fashion. It is also importantto note that while the silos created by disciplinaryimperatives may ensure a high level of technicalrigor and oen respond to funding prioritiesof donors or governments, similar challengesof sector silos also permeate government anddonor institutions; yet the households and in-dividuals that our programmes work with rarelyperceive themselves as living in sector or disci-plinary siloes.
How do we solve this dilemma? We offer afew thoughts below, based on our work withmostly large-scale value chain and market systemsdevelopment projects. We welcome inputs fromother experts and practitioners to enrich thisdiscussion (see contacts at the end).
1. In addition to responding to the demand ofend markets which may be located far fromareas of production, the selection of nutrient- rich value chains for agricultural investments should also take into account –and attempt to mitigate – known nutritionaldeficiencies prevalent among smallholder producer households. Value-chain assess-ments conducted for economic growth activities should include an understanding of nutritional needs so that programmes can measure the extent to which growers and their families are able to receive some nutritional benefits from the production.
2. An explicit nutrition-sensitive agriculture programme theory of change is needed in the design, implementation, monitoring and evaluation of agricultural value-chain projects to generate much-needed evidence.Quantitative and qualitative data should be collected to narrow in on the key facilitatingand inhibiting factors that are at play along the multiple agriculture-to-nutrition pathways (Herforth and Harris, 2014).
3. Efforts are needed to better understand andrespect differences in programme appro- aches, priorities and paradigms; establish a common language to communicate across disciplines; and develop consensus on how disciplines complement each other in multi-sector programing, especially at governmentand donor levels. is will begin to break down the inter-disciplinary barriers that prevent multi-sector programming from
being truly effective and to facilitate policy, planning and funding that will support sustained outcomes for nutrition.
4. Special efforts must be made to check the many (oen unchecked) assumptions alongeach and every step of the agriculture-to-nutrition pathways so that they are clearly spelled out in programme theories.
SPRING is developing a training resource packageand guidance (to be released in May 2018) thatwill serve as tools for implementers to improvemulti-sector programme design and maximiseresults for nutrition – stay tuned!
For more information or to contribute to thisdiscussion, contact: [email protected],[email protected] or post a questionon en-net, www.en-net.org
ReferencesHerforth A and Harris J. (2014). Understanding andApplying Primary Pathways and Principles. Brief #1.Improving Nutrition through Agriculture Technical BriefSeries. Arlington, VA: USAID/Strengthening Partnerships,Results and Innovations in Nutrition Globally (SPRING)Project.
Ruel MT and Alderman H. (2013). Nutrition-sensitiveinterventions and programmes: how can they help toaccelerate progress in improving maternal and childnutrition? The Lancet, 382(9891), 536–551.https://doi.org/10.1016/S0140-6736(13)60843-0.
Ruel, M. T., Quisumbing, A. R., & Balagamwala, M. (2018).Nutrition-sensitive agriculture: What have we learned sofar? Global Food Security.
Agriculture Nutrition
Goal • Food availability, income for market system actors andcommodity competitiveness
• Investments often focus on only a small number of (oftenstaple) crops
• Diversity, moderation and balance in diets• Investments often focus on feeding and dietary practices
and facility and community-based services
Narrative for nutrition Productivity growth will drive up income and take care ofnutrition
Food security, care and hygiene and sanitation will ensuresound dietary intake and health
Measurement • Indicators built on averages with relatively low accuracylevel
• Aim to measure change in economic status• Data often extrapolated and taken from farm land and
agro-businesses• Key measures: Yields, gross margin, incremental sales and
technologies adopted, etc.
• Indicators require high level of accuracy• Aim to measure changes in physiological status• Data collected at individual and household level• Key measures: Anthropometric, biological, clinical and dietary
indicators
Target beneficiaries Tend to be smallholder farmers able to take some risk Tend to be the most vulnerable rural households
Development approach • Economic rationality (Pelletier, 2001)• Facilitate large-scale value-chain promotion • Could harm existing farm market systems• High demand on natural and productive resources
• Technical and social rationalities• Adapt established nutrition practices to local contexts • Could be in conflict with cultural norms• High demand on human resources
Assessment approach Less emphasis on processes and delivery mechanisms infavour of market components and value-chain actor roles
Greater emphasis on processes, delivery and implementationscience
Behaviour-change mode Demand driven: Present information and let people makechoices
Supply driven: Emphasis on proactive messaging and behaviourchange
Gender implications Tend to engage men but increasing emphasis on women’sempowerment
Tend to engage women but engagement with other caregiversis increasing
Self-perception of linkageto the other sector
• Primary responsibility is to increase food production andsales
• Developing interest in the nutritional value of home-grown and purchased foods for household consumption
• Good nutrition cannot be sustained without consistentsupply of nutritious foods and resources to access otherservices and products.
• Developing attention to how demand influences supply
https://doi.org/10.1016/J.GFS.2018.01.002Pelletier DL (2001). Research and policy directions. InSemba RD and Bloem MW. (Eds.). Nutrition and Health inDeveloping Countries. Totowa, NJ: Humana Press.
UNICEF (1990). Strategy For Improved Nutrition OfChildren And Women In Developing Countries (A UNICEFPolicy Review). New York, N.Y., USA.
Webb P. (2014). Nutrition and the Post-2015 SustainableDevelopment Goals (A Policy Brief ). Geneva, Switzerland:United Nations System – Standing Committee on Nutrition.
Webb P and Kennedy E. (2014). Impacts of agriculture onnutrition: nature of the evidence and research gaps. Foodand Nutrition Bulletin, 35(1), 126–132.
WFP
/Mar
co F
ratt
ini
Views
Table 1 Disciplinary differences between agriculture and nutrition practitioners/researchers
菀菀
Field Article
By Ahmad Nawid Qarizada, PiyaliMustaphi, Jecinter Akinyi Oketchand Shafiqullah Safi
Ahmad Nawid Qarizada is aNutrition Specialist for UNICEFAfghanistan. He is a medicaldoctor with a post-graduatediploma in nutrition, a Master’sdegree in public health andover seven years’ experience
working in public health nutrition with government,United Nations agencies and international non-governmental organisations.
Piyali Mustaphi is the Chief ofNutrition for UNICEFAfghanistan. Has over 25 years’experience in humanitarian anddevelopment nutritionprogrammes, including 20years’ experience with UNICEF
in South Asia, Africa and the Middle East.
Jecinter Akinyi Oketch is aNutrition Specialist for UNICEFAfghanistan with over 15 years’experience in the managementof nutrition programmes indevelopment and humanitariancontexts at national and
international levels in Africa and South Asia.
Shafiqulla Safi is an IntegratedManagement of AcuteMalnutrition Senior Officer withthe Ministry of Public Health ofAfghanistan. He is a medicaldoctor with a post-graduatediploma in public nutrition and
has over nine years’ experience working in publichealth and nutrition with national and internationalnon-governmental organisations.
The findings, interpretations and conclusions in thisarticle are those of the authors and do notnecessarily represent an official position by UNICEF.
Scale-up ofIMAM servicesin Afghanistan
An eight-month old child eatsRUTF, Indragandi Hospital,Kabul, Afghanistan 2016 Kh
aliq
yar/
UN
ICEF
Location: Afghanistan What we know: While there has been progress on stunting reduction inAfghanistan, the prevalence and caseload of acute malnutrition remain high.
What this article adds: Since 2003, the Government of Afghanistan hasprovided strategic direction on public health nutrition. Current strategy andplans include 2020 targets to increase coverage of acute malnutrition (80 percent target) through nutrition and health interventions. Integration oftreatment services in the Basic Package of Health Services (BPHS) andEssential Package of Hospital Services is considered the means to sustainablescale-up. In 2015 and 2016, an action plan to scale up integrated managementof acute malnutrition (IMAM) across the country was implemented. By 2017,the IMAM programme was scaled up in all 34 provinces and nearly 78 percent of districts had at least one component of the IMAM programme.Overall programme performance exceeded Sphere standards, with someprovincial exceptions. Bottleneck analyses in 2015 and 2017 identified goodprogress but ongoing challenges, including ready-to-use therapeutic food(RUTF) stockouts, low outpatient department integration in BPHS andinadequate community health worker training on screening. Actions toaddress these bottlenecks and monitoring continue. Other plans underway tosupport quality scale-up include: integration of routine RUTF supplyprovision within longer-term projects and funding mechanisms;comprehensive capacity building by Ministry of Public Health with technicalsupport from UNICEF, World Health Organization and World FoodProgramme; further scale-up in high-burden, low-coverage provinces; andIMAM integration into mobile teams in hard-to-reach areas.
BackgroundAfghanistan has one of the world’s highestrates of child mortality, with 55 childrenunder five (U5) dying for every 1,000 livebirths (DHS, 2015); a major risk factor inthis is malnutrition. Despite improvementsin some nutrition indicators over the lastdecade, such as a reduction in stunting preva-lence from 60.5 per cent in 2004 to 40.9 percent in 2013, global acute malnutrition (GAM)has risen (from 8.7 per cent to 9.5 per centover the same period) (NNPS, 2013). ereis significant variation between provinces inrates of stunting (ranging from 24.3 per centin Ghazni to 70.8 per cent in Farah) andwasting (ranging from 3.7 per cent in Faryabto 21.6 per cent in Uruzgan). In 2013, eightprovinces had wasting prevalence above the15 per cent World Health Organization(WHO) emergency threshold.
More recent surveys based on weight-for-height z-scores (WHZ) show continuedhigh rates of acute malnutrition. In Farahprovince in 2017, prevalence of GAM andsevere acute malnutrition (SAM) among chil-dren U5 was 10.8 per cent and 1.2 per centrespectively (SMART survey, 2017) and, inKandahar, was 8.3 percent and 1.3 percentrespectively (SMART survey, 2017). Child-hood illness (in particular diarrhoea andacute respiratory infections) and underlyingpoor sanitation and environmental conditionsremain key drivers of acute malnutrition inthe country, as well as sub-optimal breast-
feeding and complementary feeding practicesamong infants and young children. In 2013,only 58.4 per cent of infants under six monthswere exclusively breastfed and 41.3 per centof infants age 6-8 months were being givensolid, semi-solid or so foods (MoPH, 2013).
Nutritional risks and vulnerabilities amongyoung children and pregnant and lactatingwomen (PLW) have been exacerbated byconflict-driven displacements that have dis-rupted livelihoods. In 2017, conflict spreadparticularly to the north, northeast, and eastof the country, with nearly 150,000 peoplenewly displaced as a result (FEWSNET, 2017).Increased conflict has also reduced humani-tarian access, including to life-saving andpreventative nutrition services, lowering pro-gramme coverage and sustaining high levelsof acute malnutrition in internally displacedpersons (IDP) camps and conflict-affectedprovinces. According to the United NationsHigh Commission for Refugees and the In-ternational Organization for Migration, anestimated 32,593 documented and 218,218undocumented people returned toAfghanistan from Pakistan and Iran duringthe first half of 2017, oen returning to con-texts with widespread conflict and displace-ment and limited livelihoods opportunities.Children and PLW in this population are athigher risk of malnutrition. For this reason,the nutritional needs of returnee and refugeepopulation groups are a priority for theAfghanistan Nutrition Cluster.
National Nutrition Strategy inAfghanistanWhen the Public Nutrition Department (PND)was established in 2003, the first National NutritionPolicy and Strategy (NNPS) for Afghanistan wasdeveloped for the period 2003 to 2006 to guidethe nutrition-related work of the Ministry ofPublic Health (MoPH). is document adopteda public nutrition approach, based on the UNICEFconceptual framework of malnutrition. To addresssubsequent priorities and challenges, the NNPSwas revised for the period 2009 to 2013. Eightstrategic priorities were proposed, which werelater integrated into the MoPH Strategic Planfor 2011-2015 (see Box 1).
e Government of the Islamic Republic ofAfghanistan (GoIRA) has expressed its com-mitment to enhancing food and nutrition securityfor the Afghan people in several policies, strategiesand programmes and in the signing of severalinternational covenants. In 2012, the GoIRA de-veloped the Afghanistan Food Security and Nu-trition Agenda (AFSEN). Its objectives were toassure the availability of sufficient food for allAfghans; improve economic and physical accessto food, especially by vulnerable and food insecurepopulation groups; ensure stable food supplyover time and in disaster situations; and promotebetter diets and adequate food utilisation, par-ticularly among women and children.
In 2015, the NNPS was updated in line withthis for the period 2015 to 2020, with intermediateresults around increased access to nutritionservices and products; improved nutrition be-haviours and practices; improved quality of nu-trition services and products; and a strengthenedsocial, regulatory and political environment fornutrition. Significant attention is given in thisstrategy to improving coverage of acute malnu-trition services. Included as a key indicatorunder the first intermediate result is “increasedaccess to and availability of nutrition servicesand products”, with a treatment coverage targetfor children U5 with acute malnutrition of 80per cent in 2020, compared to 34 per cent atbaseline in 2015.
Strategic approach to acutemalnutrition management inAfghanistane GoIRA strategy to achieve 80 per cent cov-erage by 2020 is to ensure a continuum of carethrough the implementation of complementaryhealth and nutrition interventions. ePND/MoPH is also strengthening the imple-mentation of public nutrition within a BasicPackage of Health Services (BPHS) and an Es-sential Package of Hospital Services (EPHS) byencouraging and supporting innovations in nu-trition-specific services; developing necessaryguidelines, standard operating procedures andjob aids for BPHS/EPHS staff; and providingtechnical support through training, regular as-sessments, monitoring, supportive supervisionand mentoring.
Box 1 Strategic priorities for the Afghanistan National Nutrition Policy and Strategy,2009-2013
1. To advocate for and increase awareness of healthy eating among the general population;2. To reduce the prevalence of major micronutrient deficiency disorders, in particular iron, folic acid,
iodine, vitamin A and zinc, throughout the country and prevent possible outbreaks of vitamin C deficiency illnesses such as scurvy;
3. To strengthen case management and increase access to quality therapeutic feeding and care at health facility and community levels;
4. To ensure that all commercial and home-produced foods are safe for consumption;5. To monitor the nutritional situation in Afghanistan and strengthen the monitoring and evaluation
of nutrition strategies and programmes to inform development planning and emergency responses;6. To ensure that responses to treat and prevent moderate acute, severe acute and chronic
malnutrition are timely and appropriate and that increases in moderate acute malnutrition (MAM) and SAM are effectively managed;
7. To increase the percentage of child caregivers adopting appropriate IYCF practices; and8. To strengthen in-country capacity to assess the nutrition situation and design, implement, monitor
and evaluate public nutrition interventions.
Figure 1 Priority provinces for IMAM scale-up in Afghanistan in 2016
AFGHANISTAN - WFP and UNICEF IMAM planning for 2016
2016 IMAM Provincial level Planning
2016 IMAM District level Planning
Provinces PriorityPriority 1Priority 2Priority 3
2016 IMAM planning agreed between WFP and UNICEF1) In the 1st priority: 17 Provinces with SAM >3%. In these provinces it was agreed that both UNICEFand WFP should work together in all accessible districts in the same facilities using the same partners.
2) In the 2nd priority: 7 provinces with Food Insecurity >33% or Poor Food Consumption Score >20%(UNICEF and WFP should work together in all accessible districts in the same facilities using the samepartners).
3) In the 3rd priority: 10 provinces where MAM and SAM rates are not particularly high, UNICEF canimplement SAM treatment but it will not be matched with MAM treatment at this moment.
2016 targeted Districts PlanPriority 1 - Districts (based on accessibility)Priority 2 - Districts (based on accessibility)Priority 3 - Districts with SAM onlyDistricts without IMAM program
wards a multi-sector approach through the AF-SEN 2012 and the MoPH is promoting a multi-sector approach to tackling malnutrition by en-couraging cooperation across government sectorsto strengthen the effectiveness of the nationalnutrition strategy. Support has been given tothe MoPH from Ministry of Agriculture, Irri-gation and Livestock (MAIL), Ministry of Labour,Social Affairs, Martyrs and Disabled (MoL-SAMD), Ministry of Rural Rehabilitation De-velopment (MRRD), and Ministry of Education(MoE). Key multi-sector initiatives implementedso far include: reviewing school and literacycourse curricula to effectively integrate practicalnutrition skills; strengthening partnerships be-tween health service providers (such as non-governmental organisations (NGOs) that supportBPHS implementation) and stakeholders; ad-vocating for the production, processing andstorage of diverse foods; responding to localnutritional requirements; implementation ofCommunity Led Total Sanitation (CLTS); anddocumenting lessons learned to improve com-munity-based nutrition promotion and informfuture scale-up (NNPS, 2009).
Evolution of integratedmanagement of acutemalnutrition (IMAM) inAfghanistanAn international NGO launched the first pro-gramme for acute malnutrition management inAfghanistan in 1996, based on diverse guidelinesand treatment protocols. Aer the establishmentof the PND in 2003, with the support of UNICEFand WHO, the MoPH developed its own treat-ment guidelines adapted from WHO guidelinesfor management of acute malnutrition. In 2008,the PND introduced community-based thera-peutic care (CTC), which was designed to addressthe limitations of previous nutrition programmemodels and maximise coverage and access tonutrition services. National nutrition guidelinesand protocols were then revised accordingly.CTC was replaced two years later with commu-nity-based management of acute malnutrition(CMAM), which was integrated into the nationalhealth system. CMAM surpassed the limitationsof CTC through full integration into all aspectsof nutritional programming. e initiative in-
cluded: education and nutrition outreach, man-agement of MAM, outpatient treatment for chil-dren with SAM with a good appetite and withoutmedical complications, and inpatient treatmentfor children with SAM and medical complicationsand/or no appetite.
Integration of acute malnutritionmanagement into governmenthealth services systemAlthough the vision of CMAM was to integratemalnutrition management within the nationalhealth system, in practice it was implementedwith support from the Nutrition Cluster as anemergency response mechanism. In order toaddress needs at all levels and develop a sus-tainable programme model, the MoPH decidedto scale up management of acute malnutritionthrough the BPHS and EPHS and, in doing so,redirect its focus from ‘emergency’ to ‘develop-ment’. Pilots in Takhar, Badakhshan, Balkh andHerat provinces indicated the need for a com-prehensive and integrated guideline with cleardefinitions to help health workers at differentlevels to detect and manage acute malnutritionproperly. erefore, in January 2014, MoPH en-dorsed the IMAM national guidelines developedby UNICEF and MoPH to fully implement thisprogramme (MoPH/PND, 2014). e IMAMguidelines covered the detection of acute mal-nutrition at different levels of the health system;treatment of acute malnutrition through out-patient and inpatient departments; counsellingof mothers and caretakers; and assessing/man-aging the main causes of malnutrition (includingmicronutrient deficiencies, suboptimal infantand young child feeding (IYCF) and poor home-based caring practices).
Since 2014, the IMAM approach has beenimplemented harmoniously throughout thecountry by government, public health institutionsand BPHS and EPHS implementing partnersand has enabled the scale-up and strengtheningof nutrition programming. Sustainability of theprogramme has been ensured by support fromregular development funds and resources. Duringemergencies, Nutrition Cluster resources havebeen mobilised and innovative approaches em-ployed to increase coverage and improve thequality of services to reach those in additionalneed (MoPH, 2012).
IMAM scale-up plan and priorityprovinces PND/MoPH and nutrition partners includingUNICEF, WHO, World Food Programme (WFP)and the Nutrition Cluster develop an annualstrategic action plan for IMAM scale-up at nationallevel and in 34 priority provinces. In 2016,priorities were as follows (see also Figure 1):1. Priority 1: 17 provinces with SAM > 3 per
cent to receive collaborative support of UNICEF and WFP in all accessible districtsto provide SAM and MAM services concur-rently through all accessible government health facilities.
2. Priority 2: Seven provinces with food insecurity >(33 per cent) or poor food consumption score (>20 per cent) to receive collaborative support of UNICEF and WFP in all accessible districts to provide SAM and MAM services concur-rently through all accessible government health facilities (same as priority one, but using different selection criteria).
3. Priority 3: Ten provinces where MAM and SAM prevalence is not particularly high; UNICEF can implement SAM services only(no support required from WFP).
In 2016, the IMAM programme aimed toreach 40 per cent of the SAM burden (171,770SAM cases out of 423,520 national burden ofSAM in children 0 to 59 months old) and 30per cent of the MAM burden (254,743 MAMcases out of the national 764,021 MAM burdenin children 6 to 59 months old). Actual num-bers reached in 2016 were 201,470 SAM cases(above the target) and 199,018 MAM cases.PND/MoPH and nutrition partners will needto work together in all priority districts to fillservice gaps in the future.
Analysis of coverage andperformance of IMAM inAfghanistane IMAM programme was scaled up in all 34priority provinces and nearly 78 per cent(313/399) of the districts had at least one com-ponent of the IMAM programme by 2017. In-patient SAM (IPD-SAM) management servicesexpanded to 63 per cent (92/147) of regional,provincial and districts hospitals (RH, PH &DH) or 178 health facilities by 2017. Outpatient
2014 - May 2015 - May 2016 - May
IPD-SAM OPD-SAM OPD-MAM
2017 - May
900
800
700
600
500
400
300
200
100
0
Figure 2 Progress in scaling up IMAM sites in Afghanistan2014 to 2017
Jan Feb Mar
IPD SAM OPD SAM
Apr May Jun
25000
20000
15000
10000
5000
0
Figure 3 Trend of newly admitted cases to SAM managementservices, Afghanistan, January to October 2017
SAM (OPD-SAM) management services werescaled up and operational in 1,028 sites in 34provinces, covering 50 per cent per cent(855/1,999) of comprehensive, basic and sub-health centres (CHC, BHC and SHC) and 63per cent (92/147) of RH, PH and DH. In termsof the outpatient management of MAM (OPD-MAM), services were scaled up and operationalin 631 sites in 26 provinces, covering 30 percent (563/1,836) of comprehensive, basic andsub-health centres and 47 per cent (68/147) ofRH, PH and DH. In 2017 nearly 53 per cent(546/1028) of health facilities had both MAMand SAM complements of the IMAM operatingtogether. Figure 2 shows the growth in IMAMservices from 2014 to 2017.
From January to June 2017, admissions ofOPD-SAM ranged from 10,431 to 21,505 cases.Admissions of IPD-SAM were in the range of1,020 to 1,897. e IMAM programme reportingrate ranged from 70 to 95 per cent for OPD-SAM and from 70 to 85 per cent for IPD-SAMservices (see Figure 3). e overall SAM pro-gramme performance status was above Spherestandards during this same period (>75 percent recovery rate); however, recovery and de-faulter rates were below Sphere Standards forthe management of SAM (i.e. <75 per cent re-covered and >15 per cent defaulted) in sixprovinces (Badghis, Faryab, Kabul, Sarepul,Uruzgan and Wardak) for OPD/IPD SAM man-agement services (see Figure 4).
Figure 4Chart of cure rate and defaulter rate by province,Afghanistan, January to June, 2017
Supply RUFT Humanresources
(clinicians)
Humanresources
(CHS)
Geographicaccess
OPD-SAM
Outreach Initialutilisation
Continuousutilisation
Quality/Effective
2015 2017
90.0%
80.0%
70.0%
60.0%
50.0%
40.0%
30.0%
20.0%
10.0%
0.0%
Figure 5SAM BNA results showing percentage score forpotential bottlenecks for 2015 and 2017
60.5%64.1%
34.8%
61.9%
36.5%
78.5%
38.0% 40.6%
50.7%
66.4%
34.5%
53.8%
33.1%
48.6%
24.7%
47.1%
1 The Community-based Nutrition Package (CBNP) is a practical, comprehensive, minimum service delivered at community level as an adjunct to health facility services thataims to provide a robust delivery platform for sustainable, high-impact nutrition interventions with the BPHS package.
Performance monitoringframework for IMAM inAfghanistanTo scale up the IMAM programme efficientlyin Afghanistan, it was crucial to identify andaddress the bottlenecks that hinder the accessto and effective coverage of the programme andexplore root causes and solutions to overcomethem. Direct coverage assessment of the IMAMprogramme was initiated in late 2014; sincethen coverage assessments have been undertakenin targeted provinces. Bottleneck analysis (BNA)for improving access and enhancing coverageof IMAM was introduced in 2015 for performancemonitoring. e results of the national SAMBNA analysis for 2015 and 2017 are shown inFigure 5. Similar analysis was done for each ofthe six regions (results available on request).
Overall, comparison of the BNA analysis in2015 and 2017 shows a significant improvementin the quality of SAM/ IMAM programming,particularly in the areas of human resourcesand quality/effective coverage of services. ehighly significant improvement in human re-sources capacity can be explained by UNICEFand WHO countrywide trainings that took placefollowing the 2015 BNA (explained in moredetail below). However, many shortcomings re-main, as follows.
e 2017 analysis revealed that only 64.1per cent of OPD-SAM management sites didnot encounter stockouts of ready-to-use thera-peutic foods (RUTF) (far below the good per-formance threshold of ≥ 80 per cent); stockmanagement training and inclusion of RUTFin the essential drugs list were identified as im-portant solutions.
In terms of geographic access, only 40.6 percent of BPHS health facilities were providingOPD-SAM management services at the time ofassessment; better mapping for scale-up andmonitoring of IMAM expansion are needed atprovincial levels.
For outreach, 66.4 per cent of communityhealth workers (CHWs) were trained on mid-upper arm circumference (MUAC) screening;to improve on this, advocacy for more trainingis needed for CHWs in the new Community-based Nutrition Package (CBNP)1. Better per-formance monitoring is also required.
Only 53.8 per cent of SAM children wereadmitted for SAM treatment (initial utilisation);this low score is due to low prioritisation of thecommunity component of IMAM, resulting inpoor early case identification and referral; thiswill be strengthened in future through coun-try-wide implementation of the CBNP.
Only 48.6 per cent of SAM children wereadmitted and continued treatment (continuousutilisation) (five per cent of cases discontinuedtreatment); to improve on this, nutrition staffmust be hired in each health facility, nutritionrecording tools must be simplified and moretraining must be given to CHWs. e recoveryrate for children with SAM was 47.1 per cent(and defaulter rate over six per cent); the as-sessment identified supportive supervision andquality of recording and documentation as keyareas for improvement to improve the qualityof SAM management services.
Overall, the 2017 BNA revealed that IMAMprogramme implementation in Afghanistan im-proved, with positive changes in all areas sincethe 2015 assessment. However, a detailed oper-ational plan for IMAM scale-up is needed basedon these findings to ensure equitable scale-upwith a clear road map towards its successful ac-complishment, as well as the provision of thenecessary support at provincial level. Findingsof the BNA must be shared with all partnersand donors to ensure incorporation of identifiedactions in national and provisional-level plansto reduce bottlenecks. Particular attention mustbe paid by the PND to addressing the gap in thecommunity component of IMAM and to workingwith the Nutrition Cluster to explore how thiscomponent can be monitored. Similar attentionmust be paid by PND and UNICEF to improvingquality supply-chain management to save costsand improve IMAM scale-up. Future BNAs canbe improved through greater participation ofnutrition partners and donors; integration ofthe BNA into routine IMAM monitoring withthe inclusion of BNA indicators in the IMAMdatabase; and the integration of other nutritioncomponents into the BNA exercise.
A child's height measurement is takenin a SAM delivery site in Mazar City ofBalkh province, Afghanistan, 2017
Way forwardTracking and monitoring progressAs identified in the NNPS for 2015-2020, ad-dressing acute malnutrition is one of theMoPH/PND current priorities. Continued track-ing of progress through IMAM monitoring isessential to meet the targets set in this plan andto be most effective, BNA monitoring must beintegrated within it. Furthermore, the upgradingof the national nutrition reporting databasefrom offline to online mode is in the final stages;this will support the timely submission of qualityperformance reports from the field-level andimprove the feedback mechanism.
Nutrition Counsellors - new cadre tosupport skilled nutrition counsellingat health facility levelFurther strengthening the BPHS/EPHS systemis the primary way to achieve sustainable IMAMservices. UNICEF is advocating to the MoPH/PNDto further strengthen the nutrition package toaddress all forms of malnutrition, within routineprogramming. As a result of such advocacy, nu-trition counsellors are currently being hired forevery health centre in 18 provinces, with primaryresponsibilities identified around maternal nu-trition and IYCF counselling, growth monitoring,anthropometric assessment, nutrition education,facility tracking and monthly reporting.
Integration of nutrition supplies andcapacity building into SystemEnhancement for Health Actions inTransition (SEHAT)It is planned that nutrition supplies, equipmentprocurement and distributions, as well as capacitybuilding, are carefully integrated into the SEHATproject (a fund, supported by the World Bank,US Agency for International Development (US-AID) and European Union to support BPHSand PHS service delivery) and receive sustainabledevelopment funding. At the end of 2017,UNICEF is advocating to include RUTF suppliesfor routine SAM treatment without complicationsunder this project, while additional emergency-related supplies will continue to be procuredthrough emergency funding. Other suppliesprocured by UNICEF and WFP are still not in-cluded in the SEHAT.
Comprehensive capacity buildingapproache 2015, the BNA revealed human resourcesto be a key bottleneck for the delivery of qualityIMAM services at scale. In response, UNICEFhas provided support to the government andimplementing NGOs through trainings on nu-trition standard operating procedures (SOP),with a significant focus on IMAM, and by part-nering with WHO to provide trainings on in-patient management of acute malnutritionacross the country. is explains the major im-provement in human resource capacity revealedin the 2017 BNA.
Further improvements are expected as a resultof the introduction of the CBNP to strength thecommunity component of nutrition interventionsincluding IMAM, and the revision of the IMAM
package (including the operational guidelinesand training package) by the MoPH with thetechnical support of UNICEF. In addition, sup-portive monitoring and supervision has beenstrengthened through the use of MoPH staff atdifferent levels, UNICEF field office staff, andthird-party monitors (TPMs), as well as a networkof nutrition “extenders” (one per province) whotriangulate data received from TPMs; data isused to support improvements in programmedevelopment and planning, implementation,monitoring and programme management.
Scale up to high burden, lowcoverage provincesIn 2016 UNICEF supported the government toscale up SAM treatment coverage in three of thepriority one provinces with high burdens of SAM:Wardak, with SAM burden of 26,271 childrenand only coverage of 3.1 per cent (12 OPD-SAMsites), Paktia with SAM burden of 25,505 childrenand coverage of 18.6 per cent (25 OPD-SAMsites) and Lagman with SAM burden of 11,411children and coverage of 27.3 per cent (26 OPD-SAM sites). Activities have included the estab-lishment of additional OPD-SAM sites, capacitybuilding at district and facility levels, implemen-tation of “days for active screening only” byCHWs, performance-based incentives for CHWsand improvements in screening and referrals (in-cluding use of a new tracking tool by CHWs).e results from this pilot scale-up will be usedto inform further scaling up of SAM treatmentin high burden-low coverage areas throughoutthe country. MoPH/PND and UNICEF are cur-rently supporting BPHS partners working inthese three provinces to implement the scale-upplan. In addition, and based on the BNA analysis,a discussion has started on the scaling up ofOPD-SAM in three more provinces (Parwan,Kapisa, and Panjsher) through similar activities.
Scale-up of IMAM through mobilehealth and nutrition teamsIMAM services in Afghanistan are hampered bylack of access to remote health facilities. In orderto improve coverage of IMAM services UNICEFand the Nutrition Cluster supported governmentto develop guidelines for the integration ofnutrition into mobile health teams in order toimprove access to IMAM services in hard toreach areas. With the support of UNICEF and
nutrition cluster, four integrated mobile healthand nutrition teams established in four districtsof Faryab province and eight integrated teamsestablished in eight districts of Kandahar provinces.
Conclusionse MoPH has done an excellent job of developingan essential nutrition policy, strategies and guide-lines according to guiding principles that promotecomprehensive, equitable and sustainable carefor those in need, based on the global evidencebase. Evidence shows that IMAM services havegradually scaled up and improved in Afghanistan.In total, 236,121 acutely malnourished childrenwere provided with life-saving treatment servicesin 2014, followed by 315,890 in 2015, 400,488 in2016 and 457,000 in 2017. Significant improve-ments can be seen in the quality of IMAMservices implemented and in scale-up and inte-gration into the routine health system. Moresupportive supervision and mentoring are neededin the health system to maintain quality and tocomplete the integration of RUTF in the MoPHessential drug list. A formative evaluation of theIMAM approach is also needed to gather evidenceon results, lessons learned and good practicesand shared widely to inform future policy andprogramming to improve the treatment of acutemalnutrition. Efforts are also needed to furtherstrengthen the health system in Afghanistan sothat acute malnutrition can be addressed as partof the routine health service, with capacity toscale up in response to emergencies. is mustbecome embedded in the contingency planningof development strategies, policies and practices.
For more information, contact: Ahmad NawidQarizada, email: [email protected]
ReferencesAfghanistan Food Security and Nutrition Agenda (AFSeN),2012.Afghanistan National Nutrition Survey (NNS), 2013.Basic Package of Health Services, 2010.Bottleneck Analysis (BNA), 2015 and 2017.Demographic Health Survey (DHS) for Afghanistan, 2015.Essential Package of Hospital Services, 2005.FEWSNET, 2017.MoPH Strategy 2011 to 2015 and 2016 to 2020.National Nutrition Database 2014 to 2017.National Nutrition Strategy 2009 to 2013 and 2015 to 2020.SMART Surveys, 2017.
A health worker examinesa child at an outreach clinicsupported by UNICEF inNangarhar province,Afghanistan, 2017
By Melody Tondeur, Caroline Wilkinson,Valerie Gatchell, Tanya Khara and Mark Myatt
Mélody Tondeur is a former UNHCRconsultant who now works with theCanadian Partnership for Women andChildren's Health. She is a researcherand public health nutritionist,specialised in micronutrientmalnutrition and emergency nutrition
assessments with much field work experience in Africa.
Caroline Wilkinson is the SeniorNutrition Officer for the United NationsHigh Commission for Refugees (UNHCR)in Geneva and was fully involved in thedevelopment of the SENS and theintroduction of mobile data collectionin UNHCR SENS surveys. She previously
worked for 14 years with Action Contre la Faim (ACF) inseveral countries and headquarters in Paris.
Valerie Gatchell is the Senior Nutritionand Food Security Officer for UNHCR inGeneva. She has 15 years’ experienceworking in nutrition programming withnon-governmental organisations (NGOs)and United Nations (UN) agencies inboth field and headquarter offices.
Tanya Khara is a public healthnutritionist and currently one of thetechnical directors at ENN. She has 20years of experience in nutritionprogramming in emergency anddevelopment contexts, and operationalresearch with a number of NGOs, Valid
International, UNICEF and the UK Department forInternational Development (DFID).
Mark Myatt is a ConsultantEpidemiologist and Senior ResearchFellow at the Division of Opthalmology,Institute of Opthalmology, UniversityCollege London. His areas of expertiseinclude infectious disease, nutrition andsurvey design.
This analysis of the UNHCR SENS database was madepossible by funding from the UK Department forInternational Development (DFID).
The UNHCR data used in this article is part of the UNHCRPublic Health Dataset. UNHCR does not warrant in any waythe accuracy of the data or information reproduced from thedata provided by them and may not be held liable for anyloss caused by reliance on the accuracy or reliability thereof.
Monitoring andevaluation ofprogrammes in unstablepopulations:Experiences withthe UNHCR GlobalSENS Database
Location: Global What we know: Monitoring and evaluation of nutrition programmes,including those for refugee populations, is routinely based on repeatedcross-sectional surveys, comparing baseline and endline data onoutcomes and process indicators.
What this article adds: In 2016 a formal analysis of the United NationsHigh Commission for Refugees (UNHCR) database of StandardisedExpanded Nutrition Surveys (SENS) revealed shortcomings in thecurrent approach. Current analyses are based on before and after cross-sectional surveys that assume that the populations surveyed are stable(births and deaths in balance and low migration). However, refugeepopulations are characterised by instability (due to new and temporaryarrivals and exits) and therefore reduced prevalence and increasedcoverage cannot necessarily be attributed to programme change. Newanalytical approaches are needed that take instability into account.Analysis of time-series data that shows long-term trends andexceptions is ideal, but data are required over long periods withregularly spaced points (usually not possible in SENS surveys). A newprocedure is proposed that involves fitting a LOWESS curve to thepoint estimates of indicator values (based on raw data; e.g. mid-upperarm circumference and weight-for-height z-score) using data providedby a single survey that compares values of individuals exposed and notexposed to an intervention. Visual analyses (box plots) and statisticalanalyses (Kruskal Wallis rank-summary test) are performed tointerpret results. This approach still has limitations and more work isneeded to test this method and develop new approaches.
BackgroundUNHCR and its partners have been col-lecting data on the health and nutritionstatus of refugees and related populationsand nutrition programme coverage formany years. e method most frequentlyused is repeated cross-sectional surveysthat follow the SMART model. e surveydesign is known as the Standardised Ex-panded Nutrition Survey (SENS) method.is is an expanded SMART survey thatcollects data for many indicators in areasincluding acute and chronic malnutrition;
anaemia; diarrhoea; vitamin A supple-mentation; immunisation; infant andyoung child feeding (IYCF); food security;water, sanitation and hygiene (WASH);and long-lasting insecticidal bednets1.
SENS surveys are used for needs as-sessment (prevalence indicators) andmonitoring and evaluation (prevalenceand coverage indicators). An effort tosystematically collect survey reports and
1 Details of the set of indicators entered into the UNHCR Global SENS Database at headquarters are available on request.
Table 1 The SENS survey database
Item Detail Number of surveys
Surveys Africa Region 570
Asia Region 71
Middle East & North Africa Region 47
Population Refugees 661
Refugees (unregistered) 4
Host community 21
Mixed refugees and host community 2
Context Protracted (≥ 3 years) 512
Non-protracted (< 3 years) 108
Emergency 60
Other/not specified 8
Dates Earliest year 1,997
Latest year 2,016
Countries* Number of countries 38
. . . . . . . . . . . . . . . . . . . . . . . . . . . . . . . . . . . . . . . . . . . . . . . . . . . . . . . . . . . . . . . . . . . . . . . . . . . .* This is for location of camps, not countries of origin of the camp populations
survey design and approaches to data analysis.is article describes some of the findings fromthe analysis, which suggest that traditional as-sumptions on monitoring and evaluation inrefugee settings may need to be reviewed.
A common model ofmonitoring and evaluationMonitoring and evaluation (M&E) of pro-grammes is commonly based on repeated cross-sectional surveys which collect and report onoutcome indicators (such as the prevalence of
wasting) and process indicators (such as theperiod coverage of vitamin A supplementation).Seasonal effects are minimised by using surveysundertaken at the same time each year. Biasesare kept constant by using the same design ofsurvey, case definitions and data-handling meth-ods for all surveys.
e simplest approach to monitor impact isto have baseline and endline surveys taken at thesame time each year to control for seasonaleffects (see Figure 1).
Impact is evaluated as the change (i.e. thedifference) in prevalence between baseline andendline:
impact=endline prevalence-baseline prevalence
For programmes running over many years,surveys of the same design are taken at thesame time of year for each year that the pro-gramme runs (see Figure 2). Impact can beevaluated in a similar manner as with baselineand endline surveys:
impact=prevalence at tn – prevalence at tn-1
at each year, or as:
impact=prevalence at tfinal – prevalence at t0
for the entire duration of programme. issort of data may also be treated as a time series,as displayed in Figure 3 which shows the preva-lence of stuntedness in four Algerian refugeecamps between 1997 and 2012.
e same approach can be applied to processmonitoring (such as the monitoring of pro-gramme coverage); the difference being that theaim is to see coverage increasing over time andreaching and remaining above a critical minimumcoverage standard, such as the SPHERE standards(www.sphereproject.org).
is approach to programme M&E makessome strong assumptions about the populationin which a programme is being delivered, in-cluding that the population remains stable duringthe review period. In a stable or steady statepopulation birth rates and death rates will beroughly in balance and there will be low levelsof migration into and out of the programmearea (see Figure 4). If these conditions are metthen observed reductions in prevalence and ob-served increases in coverage may be attributedto programme activities.
However, a steady state population cannotbe relied on in a refugee context and the M&Eapproaches outlined above may yield misleadingresults. Instability may be due to new arrivals(see Figure 5) who increase the size of the pop-ulation, may put pressure on services, and maydegrade programme performance. ere mayalso be increased prevalence and reduced cov-erage. Arrivals may also be more at risk thanthe rest of the population and may arrive inpoor health, which will increase prevalence.Figure 6 shows the prevalence of global acutemalnutrition (GAM), defined as WHZ <-2and/or oedema, in the Dadaab-Dagahaley refugee
Box 1 The procedure used to work with short, irregular and sparse data
We analysed reported results (i.e. indicator values with 95% confidence limits) from the SENS summarydatabase rather than raw survey data.
The earliest data point in the SENS summary database is in 1997. Time data (t) was recoded to month ofdata collection starting from January 1997:
t = (year-1997) × 12 + month number
For a single location you would use time from the first M&E survey.
Indicator estimates and their associated confidence limits were expressed as proportions. The samplingdistributions of each indicator at each data point were recreated from the indicator estimate (p) andthe associated upper and lower 95% confidence limits (UCL and LCL). Variance was estimated as:
Variance =
The effective sample size (n) was then estimated as:
neffective =
This procedure addressed the issues of missing and unadjusted (i.e. for design effects) sample sizes.Adjustment for design effects was desirable because cluster samples often have smaller effectivesample sizes than the number of children who are sampled.
The sampling distribution for each indicator at each time point was recreated as:
Binomial (neffective, p)
The recreated sampling distributions were resampled a large number (r = 9,999) of times. A matrix (M1)with r rows (where r is the number of resampled replicates used) and one column for each time pointwas produced. For example:
A LOWESS smoother with span = 1 (i.e. all data) and three ‘robustifying’ iterations were applied to eachrow of the matrix M1 to yield a second matrix (M2). The cells of this second matrix hold the LOWESSsmoothed values for each row in matrix M1. For example:
The trend line consisted of per time-point estimates calculated as summaries of the columns of matrixM2. The central trend was calculated as the median of each column of matrix M2 and 95% confidencelimits for the central trend calculated as the 2.5th and 97.5th percentiles of each column of matrix M2.
The LOWESS smoother is described in Box 2.
UCL – LCL 2
2 x 1.96 ( )
p(1 – p)Variance‖ ‖
row t=138 t=154 t=165 t=176 t=192 t=214 t=227
1 0.138 0.206 0.131 0.147 0.194 0.117 0.147
2 0.154 0.207 0.116 0.136 0.194 0.122 0.118
3 0.130 0.198 0.120 0.140 0.142 0.111 0.132
4 0.162 0.193 0.139 0.138 0.183 0.172 0.106
⋮
9999 0.162 0.184 0.109 0.121 0.197 0.111 0.155
row t=138 t=154 t=165 t=176 t=192 t=214 t=227
1 0.152 0.156 0.159 0.161 0.152 0.144 0.138
2 0.160 0.156 0.154 0.152 0.141 0.129 0.122
3 0.128 0.130 0.132 0.133 0.131 0.128 0.125
4 0.166 0.163 0.162 0.162 0.156 0.144 0.136
⋮
9999 0.160 0.154 0.151 0.148 0.142 0.144 0.144
survey datasets for storage in a central repositorystarted in 2009. By 2016 the global SENS databasecomprised of 688 survey reports and correspon-ding survey datasets covering populations inprotracted crises (≥ 3 years), non-protractedcrises (< 3 years), and emergency situations in38 countries in the Africa, Asia and the MiddleEast and North Africa regions (see Table 1). eSENS database has been extensively used for adhoc analyses. In 2016 a formal analysis of theavailable datasets was conducted for the firsttime to review country trends and inform future
camp in northern Kenya between 2007 and2015. It shows how prevalence in a relativelystable population can be disrupted by newarrivals. e long-term trend was quickly re-es-tablished but this can only be seen in hindsight.
Instability may also be due to exits (seeFigure 7), which have the immediate effect ofdecreasing the size of the population and otherdifficult-to-predict effects (such as a positiveeffect on coverage as pressure on services is re-duced), or a negative effect on prevalence if themost at-risk and those in poor health remain.In refugee settings, large numbers of exits areoen accompanied by restructuring of services,which can lead to short-term reductions or fail-ures in coverage. In the Damak refugee campsin Nepal, for example, resettlement of refugeesfrom seven camps led to the camp populationdropping from 117,282 to about 23,059 between2005 and 2014 and five of the original sevencamps being closed (see Figure 8). Reports, sur-veys and key informant interviews indicate thatthe resettlement programme substantiallychanged camp dynamics and camp managementbecame more challenging; those who were re-settled more quickly had higher socioeconomicstatus than those remaining in the camps andhouseholds with children with health compli-cations were slower to resettle. is may partiallyexplain some of the observed deteriorations inindicator values. Resettlements and populationmovement due to camp closures and mergersappear to have led to considerable year-to-year
variability in key indicators, including the preva-lence of GAM (see Figure 9).
Instability may also be due to a combinationof new arrivals and exits (see Figure 10) leadingto a considerable turnover in population. Figure11 shows the number of refugees and asylumseekers by county of origin for the Kakumarefugee camp in northwest Kenya between 2004and 2017. Depending on the condition of arrivalsand exits and the effect of fluctuations in thepopulation on service delivery, this ‘churn’ candrive shis in indicators away from long-termtrends. Arrivals will oen be in a poorer statethan the existing camp population and/or exits;prevalence indicators will tend to go up andcoverage indicators down. Despite this, the campmanagement and its partners in the Kakumacamp appear to have controlled prevalence, aswell as achieving and sustaining high levels ofprogramme coverage. Figure 12 shows the preva-lence of GAM, defined as WHZ < -2 and/oroedema, and the six-month period coverage ofvitamin A supplementation in the Kakuma campin northwest Kenya between 1997 and 2015.
An additional source of instability is temporaryexits and returns, the consequences of whichcan be difficult to predict (see Figure 13). Incases where exits are household members leavingthe camp to seek work with income accruing tothe household in the camp, the effect will probablybe to improve the condition of a portion of thecamp population, which may be reflected in
Box 2 The LOWESS smoother
LOWESS (locally weighted scatterplot smoothing)* is a form of regression analysis that draws a smoothline through a time-series plot or scatter plot to help identify trends or relationships between variables.The method copes well when noisy, irregular and sparse data make it difficult to discern a trend. Theplot below shows how well LOWESS can identify a trend in data generated using a mathematicalfunction (shown as ‘true fit’) that was then made noisy and irregular:
LOWESS is a non-parametric method for fitting a smooth curve to data points. A parametric methodassumes that the data fits a given function. This can lead to fitting a curve or a line that misrepresentsthe data (as is the case with the ‘straight line fit’ in the plot shown above). Non-parametric smootherslike LOWESS try to find the curve of best fit without assuming the data must fit a particular function.In many cases, non-parametric smoothers are a good choice. This can be seen in the plot shown above.
* Many data-analysis systems provide functions to perform LOWESS smoothing. In some systems (e.g. SPSS) it is called ‘LOESS’. Microsoft Excel can doLOWESS smoothing using the XLSTAT add-in or the Peltier Tech Charts for Excel add-in. A free Excel add-in is also available. The RobustFit utility fromthe University of St. Andrews provides LOWESS smoothing. The Dataplot package from the US National Institute for Science and Technology alsoprovides LOWESS smoothing. The analyses in this article were performed using the R language and environment for statistical computing.
Figure 1 A simple baseline/endlineevaluation
Figure 2 Evaluation over several years
yearly impact = prevalence at tn – prevalence at tn-1
total impact = prevalence at tfinal-prevalence at t0(both are types of baseline/endline analysis)
Figure 3 Prevalence of stuntedness infour Algerian refugee camps(1997-2012)*
* Stuntedness defined as HAZ < -2 using WHO growthstandards
impact = endline prevalence – baseline prevalence
Figure 4 Diagrammaticrepresentation of a stableor steady state population
positive changes to outcome indicators. In othercases exits may have returned home but subse-quently return to the camp, having fled worseningsecurity. In this case there may be negativechanges to outcome indicators. It is known thattemporary exits and returns occur in all, oralmost all, refugee camps. e numbers involvedare, however, extremely difficult to monitor.
In examining the SENS database it was orig-inally thought the baseline/endline model wouldapply. It became clear during data analysis andinterpretation that, due to population instability,this model would not always apply. AlternativeM&E strategies were needed.
Monitoring and evaluationstrategiese use of contextual information related tothe nature of instability in the camp populationswas first considered to help interpret results.However, it is oen difficult to find a completeor near-complete set of useful information dueto data not always being routinely collected andreported, data not being shared between partners,and some data being very difficult to collect(e.g. exits may be hidden to maintain access torations and other benefits).
e analysis of data as a time series wasfound to be useful as it allowed the identificationof long-term trends and their exceptions (asseen in Figures 6 and 12). However, this approachdoes not work with a single survey or a pair ofsurveys and large numbers (i.e. 20 or more sur-veys) are usually required. Few programmeslast for 20 years or can provide 20 years ofannual data (only one location out of 248 in theSENS database had over 20 data points), whichmakes this impossible to achieve.
Standard methods for the analysis of trendsin times series assume regularly spaced datapoints, which was not always achieved in surveysin the UNHCR database. For example, in onesetting (Ouri Cassoni in Chad) data were availablefrom surveys conducted in July-August 2008,November 2009, October-December 2010, Sep-tember-November 2011, January-March 2013,November 2014 and December 2015. e datapoints in this example are about 16, 12, 11, 16,21, and 13 months apart and there is no datafrom 2012.
Standard methods for the analysis of trendsin times series also do not tolerate ‘sparse data’(i.e. data with missing values) very well, but inthe SENS database the scope of surveys oenchanged over time, with some indicators beingreported on an irregular basis.
e problems of shortness (i.e. few datapoints), irregularity and sparseness oen occurredtogether. is limited the type of analysis thatcould be performed. Even a simple decompositionof a time series into, for example, trend, seasonaland noise (random) components using movingaverage models would not have been possible2.
Given the limitations with the data, a non-standard data analysis procedure was used. is
is described in Box 1 and Box 2. is procedureaddresses issues with the SENS summary database(e.g. actual rather than effective sample sizesbeing reported) and provided 95 per cent confi-dence limits for trend lines. A very much simplerbut still useful analysis could be performed byfitting a LOWESS (locally weighted scatterplotsmoothing) curve just to the point estimates ofindicator values (see Figure 14). LOWESS canwork with short, irregular and sparse time series,but is of little use when there are very few (i.e. ≤5) data points. Another approach was tested thatuses only the data provided by a single SENSsurvey. e approach assumes that interventions/programmes are evidence-based and very likelyto have impact on the health of covered individualsand, if delivered with high coverage, will haveimpact on the population.
Effectiveness was examined by looking atindicator values in individuals exposed and notexposed to an intervention. Using binary outcomeindicators as the starting point, prevalence ratioswere calculated:
Prevalence Ratio =
If the prevalence ratio (PR) is below one,there may be a positive effect on the outcome(i.e. the intervention is associated with reducedprevalence). If PR = 1, the intervention is notassociated with the outcome. If PR >1, theremay be a negative effect on the outcome (i.e.the intervention is associated with increasedprevalence). ere are problems with this ap-proach. When prevalence is low (as is likely tobe the case with severe acute malnutrition(SAM), severe anaemia and other severe condi-tions), there will be very few cases of the conditionof interest. When coverage is high, there arewill be few persons not exposed to the inter-vention. Low prevalence and high coverage to-gether or singly reduce the statistical power ofthe analysis.
To overcome these problems the raw data(e.g. MUAC, WHZ) used to create the binary in-dicators were used. is approach provides morestatistical power because the raw measurementscontain more information than the binary indi-cators created from them. e problem of smallnumbers of cases was removed and the problemof small numbers in unexposed (i.e. not covered)groups due to high coverage reduced.
A combination of visual analyses (using boxplots) and statistical analyses (using the Kruskal-Wallis rank-sum test) was used. Figure 15 showsan annotated box plot of haemoglobin (Hb, ing/dL) by vitamin A supplementation status froma SENS survey undertaken in Cox’s Bazaar inBangladesh in March 2012. It is clear thatchildren covered by the vitamin A supplemen-tation programme tended to have higher Hbthan children not covered by the vitamin Asupplementation programme. e Kruskal-Wallis rank-sum test is a non-parametric, one-
Figure 6 Prevalence of GAM inDadaab-Dagahaley refugeecamp (2007-2015)*
* GAM defined as WHZ < -2 and/or oedema
Figure 5 Diagrammaticrepresentation ofinstability due to arrivals
Figure 7 Diagrammaticrepresentation ofinstability due to exits
Figure 8 Population of Damakrefugee camps in Nepal(2005-2014)
(Prevalence in covered persons)(Prevalence in persons not covered)
2 The use of moving averages with more regular time series is covered in the FANTA SQUEAC/SLEAC technical reference: www.fantaproject.org/monitoring-and-evaluation/squeac-sleac
way analysis of variance that makes no assump-tions (i.e. of normality and equal variance) aboutthe distribution of data in the two groups. Forthe data shown in Figure 15, the median Hbwas 11.5g/dL in the covered group (i.e. thosereported as having received vitamin A supple-mentation in the previous six months) and10.9g/dL in the not-covered group (p < 0.0001).
Both analyses suggest that the vitamin Asupplementation programme was having a pos-itive effect on Hb and the prevalence of anaemia.e coverage of vitamin A supplementation was91.3% (95% CI = 85.7% - 96.9%). It can be con-cluded, therefore, that the vitamin A programmewas being delivered with high coverage and waslikely having a positive impact on Hb and theprevalence of anaemia, although progress wasstill to be made.
is was a useful approach but is not withoutproblems. In settings with poor and/or patchycoverage the observed effect may be due to cov-erage being achieved in better-off groups of thepopulation. e approach is also still susceptibleto instability in camp populations. A negativefinding such as deworming being associatedwith lower MUAC, for example, may be due toproper attention being paid to deworming newarrivals and less attention being paid to de-worming existing camp residents.
Common sense needs to be applied whenusing this approach with targeted interventions.For example, an analysis of MUAC or WHZ bycoverage of a targeted supplementary or thera-
Figure 9 Prevalence of GAM in Damakrefugee camps in Nepal(2005-2014)*
* GAM defined as WHZ < -2 and/or oedema
Figure 10 Diagrammaticrepresentation of instabilitydue to arrivals and exits
Figure 11Number of refugees andasylum seekers by countyof origin for the Kakumarefugee camp in northwestKenya (2004-2017) Figure 12 Prevalence of GAM by WHZ and the six-month period coverage of vitamin
A supplementation in the Kakuma camp in northwest Kenya (1997-2015)*
Figure 13 Instability due to arrivals,exits and temporary exitsand returns
Figure 14 Example of a simpleLOWESS plot Figure 15 Box plot of haemoglobin by
Vitamin A supplementation
peutic feeding programme is expected to showpoorer anthropometric status in covered casessince these children are selected because theyhave low MUAC or low WHZ (or are at risk ofdeveloping low MUAC or low WHZ). is isnot an issue with interventions that target specificage groups since these programmes are ‘blanket’programmes for the target age groups. Analysesshould, however, be limited to members of thetarget age groups.
ConclusionsAnalysis of the SENS survey database was notas straightforward as originally envisaged. esimple baseline/endline analysis was not alwaysappropriate due to instability in refugee popu-lations and can, in unstable populations, yieldmisleading results. As a result, public healthand nutrition interventions in refugee settingsmay be having a positive impact while prevalenceremains high. A stubbornly high prevalence ofGAM does not always mean that public healthand nutrition programmes are failing but maybe due to one or more forms of population in-stability. Examining and reporting individualeffectiveness, as in the analysis relating to Figure15, may prove useful in such settings.
In this study, simple analytical approacheshave been devised that can be applied to theanalysis of data from refugee situations to avoidproblems described. Work is needed to furtherexamine these issues and test, develop or replacethese methods, which are likely to have broadapplicability.
* GAM defined as WHZ < -2 and/or oedema
Stephanie Stern leads the Action Against HungerKnowledge LAB project. She previously worked at theStrategy and Analysis Department of Save theChildren International and was a research fellow atIRIS, the French think tank on international relationsand strategic affairs.
Myriam Ait-Aissa is currently Head of Research andAnalyses at Action Against Hunger – France (Actioncontre la Faim). She has been involved for over fifteenyears in many multi-sectoral research programmesaiming at improving the treatment and the preventionof undernutrition.
By Miriam Ait-Aissa and Stephanie Stern
T he fight against undernutrition is a pro-tracted struggle. Although some very pos-itive initiatives have been launched in re-cent years to tackle undernutrition world-
wide, the global context is ever more challengingdue to political conflicts, famines and disastersprecipitated by climate change, leading to large-scale and often protracted humanitarian crises.While wasting and stunting are declining globally,both remain high; 155 million children are currentlyestimated to be stunted and 52 million wasted.Levels of hunger are also on the rise, with 815million people reported to have suffered fromhunger in 2017; 38 million more than the numberreported in 2015 (FAO, 2017).
It therefore remains crucial for governmentsand the humanitarian community worldwide toidentify and roll out effective, scalable interventionsto tackle undernutrition. Due to the increasingcomplexity of different contexts, more analysis isrequired to truly identify the context-specific rootsof undernutrition to better inform programming.We need to identify effective and scalable preventiveinterventions, as well as figure how to provide ac-cessible, adequate care to undernourished children.Critically, health and other government systemsmust be strengthened in order to improve reachand ensure long-term sustainability.
Building the evidence base is critical to informscale-up and mobilise the necessary resources;quality research is needed to identify effectivesolutions, demanded in a Lancet call for a strongerevidence base and research in humanitarian con-texts (Lancet, 2017). Sharing best practices andlessons learned among practitioners working inthe nutrition and health sectors, along with en-gagement of stakeholders from other relevantsectors, is a vitally important part of this process.
Action Against Hunger launched the Researchfor Nutrition conference in November 2016 (FEX,2017) with the aim of enhancing knowledge ofthe latest available evidence on the identification
of effective interventions to treat and preventundernutrition. Based on its success, a secondconference took place in November 2017 in thePavillon de l’Eau in Paris. A call for abstracts gen-erated 57 submissions; 17 were selected for oralpresentation and 15 for poster presentation. Atotal of 28 high-level speakers participated inthe conference, either presenting their work orto share lessons on specific topics during paneldiscussions. One hundred and thirty individualsattended the conference, representing 66 organ-isations. Nineteen individuals represented nationalor international institutions and donors; 82 s at-tended from operational agencies (humanitarianorganisations), 31 from academic organisationsand seven from private-sector bodies.
The oral presentations comprised a rich arrayof research around the key topics of undernutritionand mortality; diagnosis and treatment of un-dernutrition; effects of multi-sector interventionson nutrition and health; and effects of commu-nity-based initiatives to prevent undernutrition.The research agenda on acute malnutrition definedby No Wasted Lives (www.nowastedlives.org) wasalso presented. For the session on undernutritionand mortality, a meta-analysis of operational sur-veys to examine the relationship between droughtand child mortality in Ethiopia was presented,followed by an analysis of associated mortalityrisk of in-treatment children by mid-upper armcircumference (MUAC) and/or weight-for-heightz-score (WHZ). Research on the diagnosis of un-dernutrition included a presentation on newMUAC measurement devices. This was comple-mented by an ‘Innovation Lab’ session in whichemerging research on three innovative ways ofmeasuring nutritional outcomes was presented:the SAM photo diagnosis app, the Body BioelectricImpedence Analysis (BIA) and the leptin test.
Nutrition security is a complex issue that requirescoordinated efforts from different sectors, especiallyin emergency settings. Three presentations shared
results and discussion from interventions aimedat assessing the effects of preventive interventionson nutrition and health outcomes.
The first panel discussion focused on the topic“How to overcome data management challengesin research in crisis contexts”. The second, entitled“How to improve the engagement of communitiesin research,” was dedicated to uptake of researchby communities. Both sessions produced livelyand interesting discussion that engaged the au-dience in debate. The conference evaluation con-firmed that participants appreciated the level ofexchange.
We are delighted to collaborate with ENNagain to share outputs from the meeting. Sum-maries of presented research are included in thisedition of Field Exchange, with links to videorecordings where available. In some cases, peerreview publication is pending so findings couldnot be published in this issue; these will be sum-marised in future Field Exchange issues.
The 2017 Research for Nutrition conferenceagain proved highly successful, providing a valu-able forum for exchange between researchersand programmers; we look forward to facilitatinganother in 2018.
Links to posters, presentation videos and inter-views are available at: www.ennonline.net/re-searchfornutritionconference2017
For general information about the conference,visit: http://research-for-nutrition-confer-ence.org/ or #R4NUT
ReferencesFAO, 2017
FEX 54. Field Exchange 54, February 2017.www.ennonline.net//fex/54/acfspecialsection
Lancet, 2017. Evidence on public health interventions inhumanitarian crises. The Lancet 2017.www.thelancet.com/journals/lancet/ article/PIIS0140-6736(16)30768-1/abstract
By Angeline Grant, Zvia Shwirtz, James Njiru,André Briend and Mark Myatt
Angeline Grant is SeniorNutrition and HealthAdvisor at ActionAgainst Hunger US.Angeline has previouslyworked in the areas ofnutrition assessment,
nutrition programme implementation,nutrition cluster coordination and nutrition-sensitive programming in West Africa, EastAfrica, the Middle East and South East Asia.
Zvia Shwirtz currentlyworks as the ResearchUptake TechnicalAdvisor for ActionAgainst Hunger US,working closely withcolleagues to ensure
that evidence and results produced fromresearch projects are effectivelycommunicated to key stakeholders in policyand practice and used to inform decision-making.
James Njiru is Researchand LearningCoordinator at ActionAgainst Hunger KenyaMission. James has over12 years’ experience innutrition programming
in policy formulation, project/programmedesign and management, MIYCN, healthsystem strengthening and advocacy.
André Briend, a MedicalDoctor with a PhD innutrition from ParisUniversity, with over 30years of experience inresearch in pediatricnutrition in developing
countries. Currently he is Adjunct Professorat the University of Tampere, Department forInternational Health, Finland, and AffiliatedProfessor, Department of Nutrition, Exerciseand Sports, Faculty of Science, University ofCopenhagen, Denmark.
Mark Myatt is aConsultantEpidemiologist andSenior Research Fellowat the Division ofOpthalmology, Instituteof Opthalmology,
University College London. His areas ofexpertise include infectious disease,nutrition and survey design.
BackgroundRegular screening for acute malnutrition at com-munity level is key to improving the coverageof acute malnutrition treatment. Frequent screen-ing can also enhance early detection, whichcan potentially lead to shorter treatment times,leading in turn to reduced programme costs(Sadler et al, 2017; Puett et al, 2013). The meas-urement of mid-upper arm circumference (MUAC)is the most common form of anthropometricscreening used at community level to detectacute malnutrition. Until recently, this has pri-marily been carried out by community healthworkers (CHWs) or community-based volunteers.However, emerging evidence (Alé et al, 2016;Blackwell et al, 2015) points to the importantrole that mothers and other caregivers can alsoplay in this process by screening their own chil-dren for acute malnutrition.
Building on this recent evidence, ActionAgainst Hunger (AAH) set out to develop a setof three prototype Click-MUAC devices to supportthe mother/family MUAC approach and to testthem in an operational setting. The idea was tosimplify and standardise the measurement ofMUAC to increase the sensitivity and specificity2
of mother and caregiver classifications of acutemalnutrition.
Study objectives The primary aim of the study was to describeand compare the performance, in terms of agree-ment, of the three Click-MUAC devices againsta gold standard3 for the classification of nutri-tional status. A secondary aim was to determinethe difference in agreement among mothers/caregivers using the Click-MUAC devices andmothers/caregivers using a MUAC insertion tape.
MethodsThe study team developed three Click-MUACdevices with the help of plastics specialists,using a plastic printing injection process (seeFigure 1). The study also used a universal design,colour-banded MUAC insertion tape (“uniMUAC”),designed and produced by a consortium ofnon-governmental organisations (NGOs) andacademics led by Médecins Sans Frontières(MSF) (see Figure 2). The study was designed asa prospective, non-randomised, non-blinded,clinical diagnostic trial to describe and comparethe performance of the devices. It was imple-mented in Isiolo County, Kenya, from September2016 to January 2017. Mothers/caregivers andclinic staff used the Click-MUAC devices andthe uniMUAC insertion tape to classify the nu-tritional status of the child and these classificationswere compared to a gold standard measurementtaken by the study team.
Key findingsAn article describing the results of the Click-MUAC study in full is currently pending publi-cation (Grant et al.). In summary, the study wassuccessful in describing and comparing the per-formance of the devices. A total of 1,040 childrenwere assessed over the course of the study andthe minimum sample sizes (n=115) were reached
Location: Kenya
What we know: Mid-upper arm circumference (MUAC) is increasingly used forcommunity screening to detect acute malnutrition; screening by mothers isbeing explored.
What this article adds: A study in Kenya by Action Against Hunger describedthe performance of three Click-MUAC devices measured against a gold standard(study team measurements) for classification of nutritional status.Mothers/caregivers and clinic staff demonstrated good sensitivity and excellentspecificity using the Click-MUAC tapes and the uniMUAC tape. The uniMUACtape performed best for both mothers/caregivers and clinic staff (sensitivity andspecificity); one-to-one instruction and recent improvements in design mayhave helped. Action Against Hunger is now piloting a simplified version of theuniMUAC tape for mothers/caregivers in Isiolo County.
1 Presentation at the Action Against Hunger Research for Nutrition Conference, Pavillon de L’Eau, 13th November, 2017.
2 In this study sensitivity was defined as the ability of a device to correctly detect patients with the condition (SAM or MAM); specificity was defined as the ability of a device to correctly detect patients without the condition (SAM or MAM).
3 The gold standard for this study was the mean of three MUAC measurements taken by the study team with a universal MUAC tape (“uniMUAC”).
for all categories (MUAC ≥125mm; 115mm ≤MUAC < 125mm; and MUAC < 115mm).
Mothers/caregivers using the Click-MUAC de-vices demonstrated good sensitivity and excellentspecificity in the classification of severe acutemalnutrition (SAM) using all four devices andglobal acute malnutrition (GAM), comprising bothSAM and MAM (only possible using Click-MUACdevice three and the uniMUAC tape). This was
also the case for clinic staff. The results, notablyfor sensitivity, are higher here than in previouslyreported mother-MUAC studies. The Click-MUACdevice that enabled the classification of bothSAM and MAM (prototype three) was the bestperforming Click-MUAC device.
However, the most surprising aspect of thestudy was the fact that, while the Click-MUACdevices performed well, the device that performed
best was the uniMUAC tape and the differencein performance was statistically significant. Bothmothers/caregivers and clinic staff showed ex-cellent results for sensitivity and specificity in theclassification of acute malnutrition (GAM andSAM) using the uniMUAC tape.
Conclusion and next stepsThe results of this study indicate that, althoughthe Click-MUAC devices performed well, theuniMUAC insertion tape performed best for moth-ers and caregivers in classifying the nutritionalstatus of their own children. It is thought thatcertain new design features of the uniMUAC tape(see Figure 2) may have helped to improve itssensitivity for the classification of acute malnu-trition. It is also thought that some design issues(concerns with skin-pinching for Click-MUAC de-vices one and two and unwieldiness for Click-MUAC device three) may have contributed to re-ducing the sensitivity of the Click-MUAC devicescompared to the uniMUAC tape.
The results for sensitivity for the classificationof acute malnutrition by mothers/caregivers arehigher than in previously reported studies for alldevices (both Click-MUAC and uniMUAC). Thismay be due to the method of demonstration ofthe devices, which was a one-on-one demon-stration to the mother/caregiver by the studyteam, whereas previous studies used mass demon-stration techniques. Previous studies also usedconventional MUAC tapes, whereas this studyused a uniMUAC tape with an improved design;this may also have contributed to the increase inthe sensitivity of the classifications.
Overall, the findings from the Click-MUAC proj-ect help to bolster the evidence that mothersand caregivers can indeed understand MUACmeasurement and perform measurements withgood sensitivity and specificity. All devices per-formed well; however the uniMUAC tape performedbest and – crucially – can be manufactured morecheaply. AAH strongly supports the mother/familyMUAC approach and is now involved in piloting asimplified version of the uniMUAC tape for moth-ers/caregivers (see Figure 3) in an operationalpilot in Isiolo County. Data collection on this stageof the Click-MUAC project is ongoing with the in-tention of examining the uptake of the approachby mothers/caregivers, its potential impact onadmissions and the level of buy-in from the localhealth system and authorities.
For more information, contact: Angeline Grant,email: [email protected] findings can be found at this link:http://bit.ly/2EP5sis
1115 mm only
* Devices 1 and 2 have an internal circumference of 115 mm. Device 3 has an internal circumference of either 115 mm or125 mm depending on how the device is latched
2115 mm only
3115 mm and 125 mm
Figure 1 The three Click-MUAC prototypes used in the study*
Figure 2 Features of the universal design MUAC insertion tape used in the study
Figure 3 Simplified version of the uniMUAC tape
ReferencesAlé F, Phelan K, Issa H, Defourny I, Le Duc G, Harczi G,Issaley K, Sayadi S, Ousmane N, Yahaya I, Myatt M,Briend A, Allafort-Duverger T, Shepherd S, Blackwell N.Mothers screening for malnutrition by mid-upper armcircumference is non-inferior to community healthworkers: results from a large-scale pragmatic trial inrural Niger. Arch Public Health. 2016; 74(1):38
Blackwell N, Myatt M, Allafort-Duverger T, Balogoun A,Ibrahim A, Briend A. Mothers Understand it And Can
do it (MUAC): A comparison of mothers andcommunity health workers determining mid-upperarm circumference in 103 children aged from 6months to 5 years. Arch of Public Health 2015; 73(1):26
Grant A, Njiru J, Okoth E, Awino I, Briend A, Murage S,Abdirahman S, Myatt M. Comparing performance ofmothers using simplified mid-upper armcircumference (MUAC) classification devices with animproved MUAC insertion tape in Isiolo County,Kenya; Pending publication.
Puett C, Coates J, Alderman H, Sadler K. Quality of carefor severe acute malnutrition delivered by communityhealth workers in southern Bangladesh. Matern ChildNutr. 2013; 9:130-42.
Sadler K, Puett C, Mothabbir G, Myatt M, 2011.Community Case Management of Severe AcuteMalnutrition in Southern Bangladesh. Tufts University,1-48. Accessed from: http://fic.tufts.edu/publication-item/community-case-management-of-severe-acute-malnutrition-in-southern-bangladesh/ 4 May 2017
Evaluation of mobile application to support the treatmentof acutely malnourished children in Wajir county, Kenya Summary of presentation1
By Emily Keane, Natalie Roschnik, Joanne Chui, Ibrahim Ahmed Osman and Hassan Mohamed Osman
Emily Keane is a Nutrition Advisorwith Save the Children, withparticular focus on supportingprogrammes delivering thecommunity-based management ofacute malnutrition. Emily hasworked for ten years supporting
nutrition and health programmes in Africa and Asia.
Natalie Roschnik is Senior NutritionAdvisor with Save the Children UK’sProgramme Policy and QualityDepartment, leading a team ofadvisors to support UK-fundeddevelopment nutrition programmesin Africa and Asia. Natalie has
worked with Save the Children for nearly 20 years,supporting school health and nutrition research andprogrammes in Africa and Asia.
Joanne Chui has worked onnutrition programming in Kenyaand is a registered dietitian. Sheholds an MSc in Nutrition for GlobalHealth and a BSc in Dietetics.
Ibrahim Ahmed Osman is a ClinicalNutritionist with a BSc in nutritionand dietetics with informationtechnology from Maseno University,Kenya. He currently works with Savethe Children International asReproductive Maternal and
Newborn Health Officer in Wajir field office, Kenya.
Hassan Mohamed Osman is AreaProgramme Manager with Save theChildren, managing bothhumanitarian and developmentprogrammes in Kenya. Hassan is acommunity health expert andmanagement consultant, having
worked in the humanitarian and development field for11 years. Hassan is a registered public health nurse with aBSc in community health and development.
The mobile health application development and pilotingwas made possible thanks to the financial support of theOffice of U.S. Foreign Disaster Assistance (OFDA). Theproject would not have been successful without thesupport and contribution of the Kenyan Ministry ofHealth and County Health Department in Wajir, WorldVision (WV), Save the Children (SC) country office staffand participating health workers, community volunteersand caregivers. The project would like to thank the UKDepartment for International Development (DFID) andthe Transform Nutrition Research Consortium for fundingthe mobile health application evaluation and research.
Location: Kenya
What we know: Integrated management of acute malnutrition (IMAM)is a proven approach to identify and treat acute malnutrition; howeverits effectiveness is limited if treatment protocols are not followed anddata is unreliable.
What this article adds: A mobile health application (app) developedto help health workers deliver IMAM services was evaluated in 40health facilities in Wajir, Kenya, over one year. The study found that theapp reduced the number of reporting errors by 25 per cent; providedcaseload and treatment data to decision-makers within 1.3 days ofcollection; increased the accuracy and reliability of treatment outcomedata; and improved health workers’ adherence to the IMAM treatmentprotocol. The study found that effectiveness is dependent on healthworkers being well trained and having adequate time to manage casesand ongoing software support. Next steps to address challengesinclude simplification of protocols, working closer with Ministry ofHealth (MoH) on data management and exploring scale-up linked toexisting health services.
BackgroundWorld Vision and Dimagi (an internationaltechnology development organisation)developed a mobile health app in 2013 tosupport the integrated management ofacute malnutrition (IMAM). The applicationaimed to guide health workers throughIMAM protocols and provide accurate andtimely data for district health managersto respond to changes in caseloads andtreatment outcomes, manage suppliesand inform national statistics. The app waspiloted in Chad, Kenya, Mali, Niger andAfghanistan between 2014 and 2016 byWorld Vision, International Medical Corps(IMC) and Save the Children (SC) (Frank etal, 2017). In January 2015 SC, throughTransform Nutrition, launched a study toevaluate the impact of the IMAM app onthe quality of IMAM treatment and datain 40 health facilities in Wajir, Kenya, in-cluding remote locations.
How the IMAM app worksThe IMAM app is used on tablets or mobilephones and provides health workers withsimple, step-by-step guidance on the as-sessment, treatment or referral of childrenvisiting the IMAM programme. The app isbuilt on the open source CommCare plat-form, which uses a touch swiping functionto take health workers through IMAM
steps. It reminds them of the treatmentprotocol, counselling messages and returndates and calculates z-scores and numbersof ready-to-use therapeutic food (RUTF)sachets needed. It also records each child’sinformation, making child follow-up anddefaulter tracing easier. Data are regularlyuploaded to the ‘cloud’, which enables theprovision of live and accurate data forcounty-level management.
MethodsForty health facilities from three sub-coun-ties in Wajir were selected and randomlyallocated to the intervention and controlgroups (See Figure 1). The 20 interventionfacilities received a tablet with the IMAMapp and 31 health workers from these fa-cilities were trained over three days to usethe tablet. Routine child-level IMAM dataduring the one year prior to the studywere collected retrospectively from paperregisters in all 40 facilities (N=1,200) to es-timate accuracy of reporting and similaritybetween the intervention and controlgroups. After the app was introduced, thesame paper register data was collectedfrom the 20 control health facilities (N=903)and compared with the equivalent data
1 Presentation at the Action Against Hunger Research for Nutrition Conference, Pavillon de L’Eau, 13th November, 2017.
generated by the app in the 20 intervention fa-cilities (N=668) over the same one-year period.Direct observations of health workers providingIMAM services were carried out in both groupsover three months to assess adherence to IMAMprotocols.
Preliminary resultsThe app reduced data errorsOnly 73 per cent of data from the 20 controlhealth facility registers was usable (from the in-tervention period). The rest was either missing,unreadable or implausible. Exit data in particularwas lacking; only 46 per cent of exit data and 37per cent of data on exit outcome was usable. Bycontrast, 100 per cent of patient data from the20 intervention health facilities via the IMAM appwas usable and available. There were no missingor unreadable data because the app identifiedgaps and errors and prompted the health workersto correct and complete them while they wereassessing the child.
The app provided ‘live’ data to decision-makersIn the control facilties using a paper-based system,it took several weeks for data on child treatmentto be available to decision-makers. At the end ofeach month, health workers compiled summaryreports of aggregated data from individual treat-ment data from the registers and physically sentthe report to the sub-county office, where dataofficers entered the data into the national onlineHealth Management Information System (HMIS).It typically takes 40 days from the compilation ofmonthly reports to data becoming available. Itwas also common for reports and data to be lostin the transfer process. When the data was enteredinto the HMIS it could be accessed and viewed atsub-county, county and national-level manage-ment teams.
App data took on average 1.3 days (0.4 – 9days) to become available in the HMIS. Whenhealth workers saw a patient, data were collected
and stored on the local memory of the tablet inreal time. When the tablet had access to the in-ternet these data were then automatically syncedand uploaded onto the cloud server, where thedata could immediately be viewed by manage-ment teams at all levels. The variation in time fordata to be uploaded between health facilities re-flects variations in internet signal strength betweenlocations.
The app improves adherence to theIMAM protocolNinety-nine per cent of MUAC measurementsobserved in the intervention group were con-ducted correctly, compared with 84 per cent inthe control group. MUAC measurement errors inboth groups included misplacing the MUAC tapealong the arm, lifting the arm while measuringand pulling the tape too tight or too loose, whichcan lead to misdiagnosis. The app has visualprompts and instructions to remind the healthworker how to take measurements accurately,which helped to reduce errors.
Across the 18 recommended medical checksthat should be performed to identify other healthproblems, 40 per cent of tests were carried out inthe intervention group compared to 11 per centin the control group. Only 13 per cent of childrenobserved in the control facilities underwent anappetite test compared to 39 per cent in the in-tervention facilities. Although the app increasedthe likelihood that IMAM steps are followed,many protocols were still not carried out in theintervention group, despite the app promptinghealth workers to do so. Focus group discussionswith health workers showed that time constraintswere the main reason for skipping medical checks,as well having no dedicated space within healthfacilities to conduct the appetite test in privacy(desired by many caregivers).
Cure rates may be overestimated in thepaper-based systemAs the individual child data from the registershad many issues with missing and unusable data,
Figure 1 Description of the mobile app intervention
40 health facilities
Child treatment data from registersPhotographed and entered (N=1,200)
20 InterventionIMAM App
20 ControlPaper based
Child data from AppCommCare (N=668)
Child data registersPhotographed (N=903)
IMAM observations(N=97)
IMAM observations(N=104)
Pre
Inte
rven
tion
Nov
201
4 –
Oct
201
5
Inte
rven
tion
Nov
201
5 –
Oct
201
6
Figure 2Proportion of children cured, defaulted, died or not cured when they exitedthe IMAM programme
Paper based App
Cured Death Defaulter Not cured Referral
Research
The IMAM mobile phone app for healthworkers, Wajir County, Kenya, 2017
data that were entered into the district HMISfrom aggregated summary reports were analysedand compared to data obtained from the app.Reports from the 40 study facilities prior to tabletsbeing introduced stated 95 per cent cure rates,suggesting that the majority of children whowere admitted to the IMAM programme werecured. The app data, however, tells a very differentstory. In the 20 intervention facilities, only 56 percent of children were cured and 42 per cent haddefaulted compared to 84 per cent and 5 percent respectively in the control facilities over thesame period (See Figure 2).
Defaulters are often linked to operationalissues such as RUTF stockouts at the health facilityor long distances between home and healthfacility, which reduce caregivers’ willingness andability to attend the IMAM service. Baseline as-sessment showed no significant difference be-tween intervention and control facilities in thesefactors. The vast difference in cure rates suggeststherefore that cure rates may be over-reportedby health workers using the paper-based system.Assessment of individual treatment data fromthe registers showed that health workers rarelyclassified children as defaulters, even if it appearedthat they had missed three consecutive visits.This may be because the quality of individualtreatment data was very difficult to interpret,given that so much data were missing and thelack of consistency in how data were recorded. Itis also very difficult to summarise data from indi-vidual treatment records into monthly summaryreports, which may also contribute to errors inthe reporting of defaulters.
Many children were misdiagnosed in thepaper-based systemA reanalysis of height, weight and MUAC meas-urements found that weight-for-height Z-score(WHZ) is the most complex method for healthworkers in assessing a child, as it relies on thehealth worker first correctly measuring the child’sheight and weight and then identifying the WHZfrom a three-way table. A reanalysis of all WHZscores from the raw weight and height data inthe paper registers found that 28 per cent ofWHZ scores were incorrectly calculated in controlfacilities. A reanalysis of children’s admissionweight, height and MUAC data found that 17 percent of children were wrongly admitted to theIMAM treatment programme (they were not se-verely malnourished).
The mobile app automatically calculates theWHZ score based on the entered height andweight of the child, therefore reducing errors inthe classification of WHZ and eliminating incorrectadmissions. Data using the app were found tobe 99.3 per cent accurate (with the small numberof errors being due to issues with app functionalityearly on, which were later corrected).
Operational challengesEven when using the app, health workers continueto miss key IMAM steps, particularly relating tothe medical checks and appetite test. This is be-cause the treatment protocol takes time andhealth workers working in remote, low-resourcehealth facilities with high caseloads are forced totake shortcuts.
The effectiveness of the app relies on healthworkers being properly trained and supportedand the app functioning well. This requires ongoingsupport from software developers for softwareimprovements and bug fixing. In instances whereissues with bugs were discovered but not quicklyresolved, it impacted on health workers’ motivationand willingness to use the tablet and app. Dueto the rapid turnover and movement of healthworkers between health facilities, ongoing re-fresher training and supportive supervision duringfield visits were essential.
ConclusionsThe paper-based systems did not provide reliabledata in good time to allow decision-makers torespond to surges in caseloads and address op-erational challenges. The IMAM mobile app im-proved adherence to the IMAM protocol in inter-vention facilities and provided real-time, accuratedata to decision-makers.
The IMAM app has the potential to dramaticallyimprove the speed of response to surges in case-loads, identify and resolve operational bottlenecks,and improve coverage, quality of care and treat-ment effectiveness. However, its effectiveness isdependent on health workers being well trainedand having adequate time to manage cases, andongoing software support being available to en-sure that the app functions properly.
Next stepsA range of next steps are currently being exploredfor use of the mobile app, pending further funding,including: • Simplification of protocol: the experience of
implementing the research showed opera-tional challenges for health workers workingin busy clinics with high caseloads to deliver the treatment protocol in its entirety and to a high quality, pointing towards the need forsimplifications in the treatment protocol.
• Expansion of the app to other services, or linkages to other mHealth solutions: as the management of acute malnutrition is a service that is increasingly integrated into health systems, there are opportunities to add or link IMAM app components to other mHealth solutions for other services that health workers deliver; such as integrated management of childhood illness, antenatal care and postnatal care.
• Enhanced use of data by decision-makers: there are opportunities to work more closelywith the ministry of health staff to analyse and respond to the data that is available in ‘real time’, particularly responding with resources (staff and supplies) to surges in caseloads, especially in drought/emergency contexts.
• Scale up within the health system: there are a number of outstanding operational and research questions relating to scaling up mHealth interventions within a health systemthat need to be answered, including: costingand cost effectiveness of the intervention; how to link data directly into the national reporting system (without the need for additional data entry); linkages with an expanded set of services; and data protectionand cyber security issues.
A video of the mobile app can be downloadedfrom http://bit.ly/2Gsqzbq
ReferencesFrank T, Keane E, Roschnik N, Emary C, O’Leary Mand Snyder L. (2017). Developing a mobile healthapp to manage acute malnutrition: a five-country ex-perience. Field Exchange 54, February 2017. p7.www.ennonline.net/fex/54/mobilehealthapp
Research
Edw
ard
Aho
noba
dha/
Save
the
Child
ren
Edw
ard
Aho
noba
dha/
Save
the
Child
ren
A health worker screening a child formalnutrition, using the IMAM mobileapp, Wajir County, Kenya, 2017
Ibrahim, a nutrition clinicalofficer, attends to mothersduring a nutrition clinic atDambas Dispensary, WajirCounty, Kenya, 2017
Relapse after treatment for moderate acute malnutrition:Risk factors and interventions to prevent itSummary of presentation1 based on published research2
By Heather Stobaugh and Mark Manary
Dr Heather Stobaugh has a PhD inFood Policy and Applied Nutrition andworks in global nutrition research atRTI International. She has experienceworking as a consultant and technicaladvisor for development andemergency nutrition programmes
around the world and conducting rigorous research,clinical trials and operational research with WashingtonUniversity in St. Louis and Tufts University.
Dr Mark J Manary was one of the firstchampions of ready-to-usetherapeutic food (RUTF) for use in thecommunity-based management ofacute malnutrition (CMAM). The scopeof his work includes developing andintroducing novel foods, active
prevention schemes and gut microbiota and metabolomein kwashiorkor and marasmus, and devotes several monthseach year to overseeing clinical and translational studies inMalawi, Sierra Leone and Ghana.
This research was supported by a sub-award funded byFamily Health International under cooperative agreement/grant AID-OAA-A-12-0005, which was funded by theUnited States Agency for International Development.
Research
BackgroundChildren with moderate acute malnutrition (MAM)are generally treated with a supplementary foodfor several weeks in a community-based supple-mentary feeding programme (SFP) until they aredischarged as recovered after achieving an an-thropometric threshold. Little is known aboutpost-discharge and longer-term health and nu-trition outcomes. This study assessed whether apackage of simple and affordable health and nu-trition interventions, added after achieving an-thropometric criteria for nutritional recovery fromMAM, could improve the proportion of childrenwho sustained recovery for one year after treat-ment. This cohort was also used to explore factorsrelated to sustained recovery, which remains anelusive but important goal in SFPs.
MethodsThis study was a cluster-randomised, controlled,clinical effectiveness trial conducted in southernMalawi. Children aged 6-62 months3 were enrolledfrom 21 SFPs at the time of recovery from MAM(mid upper arm circumference (MUAC) ≥ 12.5cm). Upon enrolment the control group receivednutrition counselling, which consisted of messagesregarding optimal complementary feeding, care-
giver recognition of common childhood illnessesand appropriate health-seeking behaviours. Thetreatment group received the same counsellingplus a package of five additional interventions,including: 1) 40 g/d of a lipid-based nutrient sup-plement (LNS) for eight weeks after SFP discharge;2) a single dose of deworming medication (al-bendazole) at SFP discharge; 3) a 14-day courseof zinc supplementation starting at the time ofSFP discharge; 4) an insecticide-treated bed netat SFP discharge; and 5) sulfadoxine-pyrimethamine for malaria chemoprophylaxisonce a month for three months during the rainyseason. These interventions have all individuallybeen proven safe, effective and affordable in thiscontext for improving the overall health of children.
Informed consent was obtained from all care-givers. Upon enrolment, anthropometric meas-urements were taken and information on demo-graphic characteristics, health history and house-hold food insecurity was collected. Children werefollowed for one year and reassessed at follow-up visits at one, three, six and 12 months post-SFP discharge. Additional monthly visits werescheduled during the height of the rainy season(December through February), when malaria pro-
Location: Malawi
What we know: Little is known on post-discharge outcomes ofchildren treated for moderate acute malnutrition (MAM).
What this article adds: A cluster-randomised controlled trial inSouthern Malawi assessed whether a package of five health andnutrition interventions helped sustain recovery for one year afterMAM treatment. A total of 1,497 children who recovered from MAMat 21 supplementary feeding programme (SFP) study clinics wereenrolled. The treatment group received counselling (as per control)and on discharge were given eight weeks of lipid-based nutrientsupplement (LNS), albendazole, 14 weeks of zinc supplementation,an insecticide-treated bed net and malaria chemoprophylaxis duringthe rainy season. Fifty-one per cent sustained recovery for one year.Many children experienced multiple relapses and relapsed cases tooklonger to recover on admission. Half of all relapses occurred withinthree months of discharge. There was no significant differencebetween relapse-free survival curves for the intervention and controlgroups; linear growth and illness patterns were also similar for both.The strongest predictors of relapse or death after SFP discharge werelower anthropometric measurements during SFP treatment. Findingssuggest not all MAM children carry the same risk; programmingimplications need further examination.
1 Presentation at the Action Against Hunger Research for Nutrition Conference, Pavillon de L’Eau, 13th November, 2017. A video of the presentation can be found here: https://youtu.be/pawPaxhhIZo
2 Stobaugh HC, Bollinger LB, Adams SE, Crocker AH, Grise JB, Kennedy JA, Thakwalakwa C, Maleta KM, Dietzen DJ, ManaryMJ, et al. Effect of a package of health and nutrition services on sustained recovery in children after moderate acute malnutrition and factors related to sustaining recovery: a cluster-randomized trial. Am J Clin Nutr 2017;106(2):657-66.
3 Children were enrolled into SFP at 6-59 months. If a child was 59 months upon SFP enrolment and received treatmentfor 12 weeks, s/he could be 62 months old at discharge, which was the time of study enrolment; therefore the enrolment criteria for age was 6-62 months old.
phylaxis was also provided at the interventionsites. Caregivers were also encouraged to returnto the clinic at any time they perceived their chil-dren’s health or nutritional status to worsen. Theprimary outcome was the proportion of childrenwho sustained recovery, which was defined asmaintaining a MUAC ≥ 12.5 cm without bipedaloedema at all follow-up visits during the 12months after initial recovery from MAM.
Relapse-free survival curves were developedwith the use of the Kaplan-Meier method andwere compared using the log-rank test. A Coxproportional model for a multivariate analysis
was used to identify risk factors for a failure tosustain recovery throughout the follow-up period.The outcome variable in the Cox regression modelwas either a poor outcome (defined as relapsedto MAM, developed severe acute malnutrition(SAM), or died) compared with a sustained recoveryor unknown outcome.
ResultsA total of 1,497 children recovered from MAM at21 SFP study clinics and were enrolled in thestudy. After excluding ten children due to incorrectenrolment criteria, 1,487 children were includedin the final analysis, with 718 children at controlsites and 769 at 11 intervention sites.
Of the 1,487 children included in the finalanalysis, 754 (51 per cent) sustained recoverythroughout the 12-month follow-up period,whereas 541 (36 per cent) relapsed to MAM; 73(5 per cent) developed SAM; 15 (1 per cent) died,and 104 (7 per cent) were lost to follow-up. Manychildren experienced multiple relapses; of thosewho relapsed to MAM only, 26 per cent, 10 percent, and 5 per cent of children relapsed 2, 3,and ≥ 4 times, respectively. In addition, of thosewho developed SAM, 69 per cent of children alsorelapsed to MAM more than once. Children whorelapsed to MAM multiple times required longertreatment for those relapses during the follow-up period than children who relapsed only once(P < 0.001). Furthermore, MUAC dropped signifi-cantly in children who relapsed to MAM multipletimes compared to children who relapsed onlyonce (P < 0.001). Risk of relapse or death washighest during the period immediately after dis-charge from an SFP, with approximately 50 percent of all relapses (to either MAM or SAM) oc-curring within the first three months of initial re-covery from MAM.
Analysis with the use of the Kaplan-Meiermethod showed no significant difference betweenrelapse-free survival curves for the intervention
and control groups (P = 0.380; log-rank test). Sec-ondary outcomes, including linear growth andillness during the 12-month follow-up period,were similar across both groups. In a Cox regressionmodel, factors that had a protective effect againstrelapse or death included: having a larger MUACon SFP admission (P < 0.01); having a largerMUAC on SFP discharge (P < 0.001); and having ahigher weight-for-height z-score (WHZ) on dis-charge (P < 0.01). Children were also less likely torelapse or die if they received RUTF as opposedto ready-to-use supplementary food (RUSF) duringtreatment (P < 0.05).
DiscussionThis study has shown that the provision of apackage of basic health and nutrition interventionsto children recovering from MAM did not resultin a significant increase in the proportion whosustained recovery for one year. Nearly half of allchildren who successfully recovered from MAMfailed to sustain that recovery for one year followingSFP treatment. A diversity of poor outcomes wasobserved among those who failed to sustain re-covery. Some children experienced one short,mild episode of MAM and quickly recovered afterre-enrolment in an SFP to remain free from MAMor SAM thereafter; while other children repeatedlyrelapsed with more severe episodes of acute mal-nutrition that required long treatment withoutany sustained recovery. These vastly different tra-jectories highlight the fact that, although childrenin SFPs are all classified with the same type andseverity of malnutrition (i.e. MAM), not all childrenwith MAM are at the same risk of poor short- andlong-term outcomes. This result suggests that auniform approach for treating all children withMAM may not be best for ensuring that all reachsustained recovery.
The strongest predictors of relapse or deathafter SFP discharge were lower anthropometricmeasurements during SFP treatment; therefore
the severity of malnutrition at admission tofeeding programmes is linked to increased riskof mortality and relapse in children after treatment.Likewise, the higher the MUAC and WHZ scoreon discharge, the more likely the child is to sustainrecovery. It is possible that children who presentwith more severe malnutrition (i.e. lower MUAC)have additional underlying biological deficienciesthat take longer to recover than can be identifiedby simple anthropometric measurements. Childrenwith higher discharge anthropometric measure-ments may have reached a better overall healthstatus and are more resilient when exposed tonew infections that might otherwise precipitaterelapse. This does not necessarily translate to theneed for longer time receiving supplementaryfood in an SFP; rather, treatment protocols mayneed to adapt to go beyond the mere provisionof supplementary food.
ConclusionChildren who successfully recover from MAMafter receiving treatment in an SFP are likely torelapse during the following year. A package ofbasic health and nutrition interventions providedat the time of discharge and during the rainyseason did not significantly reduce the proportionof children who sustained recovery. Althoughmost SFP protocols provide the same treatmentto children with MAM regardless of the anthro-pometric measure, our results suggest that treat-ment and follow-up procedures may benefit fromindividualisation. Our findings also suggest a po-tential benefit of treating high-risk children withMAM to higher anthropometric targets to reducerelapse and mortality after discharge. However,this treatment would certainly increase the im-mediate cost (as well as having long-term costsavings), which is an essential factor to considerbefore any programmatic change.
For more information, contact: Heather Stobaugh,email: [email protected]
ResearchKi
m H
edge
Child being treatedfor acute malnutritionin Malawi, 2014
Development of a SAM photo diagnosis appSummary of presentation1
By Laura Medialdea Marcos, Iván Molina Allende and Antonio Vargas Brizuela
Research
Laura MedialdeaMarcos is PrincipalResearcher for theSAM PhotoDiagnosis projectfor Action AgainstHunger Spain. She
is a PhD candidate in the application ofgeometric morphometric techniques tophysical anthropology.
Iván Molina Allendeis the projectmanager for theSAM PhotoDiagnosis projectfor Action AgainstHunger Spain. He
has experience in research andevaluations for developmentcooperation projects.
Antonio VargasBrizuela is HeadSenior NutritionAdvisor at ActionAgainst HungerSpain. Antonio is amedical doctor
specialising in public health and tropicalmedicine with over 17 years ofexperience as a general practitioner andhealth adviser, many of them indevelopment projects in Latin Americaand Africa.
Cayetana Bazaco, Alejandra Cubilloand Roberto Pedrero are assistantresearchers for the SAM Photo DiagnosisApp project in the TechnicalDepartment, Action Against HungerFoundation, Spain, and also co-authorsof this article.
The authors would like to acknowledgeall of the children and families whoparticipated in this study, as well asAction Against Hunger colleagues, fieldteams and everyone in Dakar, Matamand Louga offices. The authors alsoacknowledge their academic partners:EPINUT and HUMLOG from UniversidadComplutense, Madrid, Spain andUniversité Cheik Anta Diop, Dakar,Senegal; Ministry of Health in Senegaland regional health authorities and staffin Matam region. Finally, the authorsacknowledge the support of their donor,Children’s Investment Fund Foundation.
Location: Senegal
What we know: There are limitations to anthropometric identification ofsevere acute malnutrition (SAM) in children.
What this article adds: Geometric morphometric (GM) techniques have beenused to develop an Android mobile app prototype to diagnose SAM, basedon photos of body parts. The method was validated based on 150 healthySpanish children. A sample of 150 normal weight and 150 Senegalesechildren with SAM (weight-for-height and MUAC-for-age <-3 z score) wasused to quantify morphological differences. The project found significantmorphometric differences between Spanish individuals according to their ageand sex (p <0.0001); two ‘shapes’ have been identified coinciding with growthpeak. Diagnosis of SAM was 93 per cent based on whole body and 100 percent based on body parts. Further modifications to the app have beenundertaken to improve functionality. Further work includes increasing samplesizes to test the approach, technological advances to improve automateddiagnostics and user friendliness, and ultimately integration within routineheath systems (as ehealth tools).
BackgroundThe SAM photo diagnosis app is an innovationthat responds to the need to improve screening,diagnosis and treatment of severe acute malnu-trition (SAM). Anthropometric indicators currentlyused to diagnose SAM have limitations at popu-lation level. Weight-for-height z-score (WHZ) cal-culation requires well trained health staff and ac-curately calibrated equipment in good condition.Mid upper arm circumference (MUAC) is easierto use by non-health professionals and requiressimpler and cheaper equipment; however intra-observor error is an issue. Therefore, measurementerrors are quite likely to take place in SAMscreening and diagnosis (Corsi et al, 2017; Mar-rodán et al, 2013; WHO, 2006). In the last decadethere has been a huge technical advance in thefield of geometric morphometric (GM) techniques(Slice, 2005; Zelditch, 2004), which has openedup more research into the study of the morpho-metric variations among biological forms. GMtechniques consist of a collection of tools capableof registering the shape of objects for visualisationand quantification of the differences betweenthem. This approach offers a new, innovative op-portunity to assess SAM in children.
The potential The study of the variation in body shape of childrenunder five years of age had not previously beenexplored with GM techniques. This area is of interestnot only for the diagnosis of SAM but also (amongother uses) for the study of child growth and itsrelationship to a wide range of factors, such as en-
1 Presentation at the Action Against Hunger Research for Nutrition Conference, Pavillon de L’Eau, 13th November, 2017.
vironmental, genetic and sociocultural influences.In addition, work is ongoing to involve the com-munity as active agents in the prevention and di-agnosis of SAM. The usability and adaptability oftools to support this, suited to local socioculturalrealities and sensitive to local contexts and sus-tainability issues, are highly relevant.
The innovationThe project hypothesised that GM techniquesare able to identify shape differences betweenchildren of normal weight (NOR) and those withSAM (aged 6-59 months). The main objective ofthe project was to design a prototype for an An-droid mobile application (app) which, based onGM techniques, could be validated as an effectiveand reliable technique for in situ diagnosis ofSAM by photographing parts of the body. Thedevelopment of this tool could help to increasethe diagnostic coverage of SAM and therebystrengthen community-based management ofacute malnutrition (CMAM) programming at alllevels (from health facility to community level)and for a variety of users, such as national healthworkers, humanitarian workers and academics.
Methods A sample of 150 healthy NOR children (percentile(p)30-p70 WHZ and/or MUAC for age) between 6and 59 months of age of Spanish origin was usedto validate the methodology designed to record
and assess the morphological changes of thebody by age and sex. Subsequently, a sample ofchildren between 6 and 59 months of age ofSenegalese origin was sub-divided into 150healthy NOR children and 150 SAM children with-out complications and used to quantify the mor-phometric differences of this population accordingto their nutritional status. SAM cases fulfilledboth WHZ and MUAC criteria (WHZ and z-scoreMUAC for age <-3): children with both deficitswere chosen to visualise and quantify morpho-metric differences among extreme morphologies.Information about the present study was providedto participating children’s families, who signedan agreement form for both participation and ac-ceptance of privacy policies concerning data man-agement. Photographs in anterior view wererecorded for each participant in controlled con-ditions, photographing the same predeterminedbody regions (extremities and trunk) in the sameposition for each child, with the child wearingunderwear. Although not possible in the prototype,the final app will automatically extract bodycontour and destroy the real images after the di-agnosis is made, as the contour alone is enoughto assess nutritional status. This will provide animportant level of child protection. The next stepwas to develop a classifier to allow an effectivediagnosis. Finally, a prototype of an Android appwas designed.
ResultsOur results show significant morphometric differ-ences between Spanish individuals according totheir age and sex (p <0.0001). Two highly differ-entiated shapes corresponding to the children
under and over 24 months were visualised, coin-ciding with the particular growth peak of thechild. When diagnosing SAM, an accuracy of SAMdiagnosis above 93 per cent in the Senegalesepopulation was obtained when studying thewhole body, increasing to 100 per cent whenanalysing parts of the body separately. An appprototype which replicates the experiment carriedout has already been developed. This prototypepermits the systematic registration of photographsas well as image processing and application of adiagnostic algorithm. A methodology to codeindividuals has also been included. Such a method-ology will allow sending and receiving datathrough the app as well as data storage in a webservice. An auxiliary desktop app was also devel-oped to manage and configure the mobile appfor the generation of templates and for imageprocessing obtained from digital photographs(made through regular camera shots by thirdparties) for future research.
Future steps Future steps include scientific, technological andhuman-centred design approaches. Concerningthe scientific approach, the work will focus on in-creasing sample sizes to improve diagnostic ac-curacy, investigation of morphological variabilityof SAM among populations, and exploration andstudy of different malnutrition profiles (includingWHZ only, MUAC only and stunting). Technologicaladvances will include deep learning and machinelearning methods (an artificial intelligence thatallows the device to learn and improve the accu-racy of the diagnostic functionality as the samplesize grows) to automate image registration, pro-
cessing and classification (where aspects of di-agnosis that currently require manual interventionfrom the user will be automated, such as identifi-cation of landmarks on the child’s body). Finally,once the app is functional, it will be upgradedwith a user-centred design, with interactive anddidactic functionalities, to enable adaptation tospecific contexts and allow integration into routinehealth systems as an ehealth (digital health) tool.
A video about the SAM photo diagnosis app canbe found here: http://bit.ly/2HDbvZk
ReferencesCorsi DJ, Perkins JM, Subramanian SV. 2017. Childanthropometry data quality from Demographic andHealth Surveys, Multiple Indicator Cluster Surveys, andNational Nutrition Surveys in the West Central Africaregion: are we comparing apples and oranges? GlobalHealth Action;10(1):1328185.
Marrodán MD, Cabañas MD, Gómez A, González-Montero de Espinosa M, López-Ejeda N,Martínez-Álvarez JR, et al. 2013. Technical errors ofmeasurement in the diagnosis of child malnutrition:data from ACF interventions between 2001 and 2010.Nutr Clin Diet Hosp.;33(2):7–15.
Slice DE. 2005. Modern Morphometrics in PhysicalAnthropology. Developments in Primatology. New York:Kluwer Academic/Plenum Publishers.Suny Stony Brook. http://life.bio.sunysb.edu/morph/
Zelditch M. 2004. Geometric Morphometrics forBiologists: A Primer. Amsterdam; Boston: ElsevierAcademic Press.
WHO. Multicentre Growth Reference Study Group.2006. Reliability of anthropometric measurements in theWHO Multicentre Growth Reference Study. ActaPaediatrica 2006; Suppl 450: 38-46.
Improving child nutritionand development throughcommunity-based child carecentres (CBCCs) in MalawiSummary of presentation1
By Aisha Twalibu, Natalie Roschnik, Aulo Gelli, Mangani Katundu, GeorgeChidalengwa, Peter Phiri and Helen Moestue
Aisha Twalibu is a Research Coordinatorfor the Nutrition Embedding EvaluationProject (NEEP) at Save the ChildrenMalawi. She has been working in globalhealth, education and developmentinitiatives including child nutrition,early childhood development, food
security and livelihoods for the past five years.
Natalie Roschnik is Senior NutritionAdvisor with Save the Children UK inthe Programme Policy and QualityDepartment, leading a team ofadvisors to support UK-fundeddevelopment nutrition programmes inAfrica and Asia. Natalie has been
working with Save the Children for nearly 20 years,supporting school health and nutrition research andprogrammes in Africa and Asia.
Aulo Gelli is a Research Fellow in thepoverty, health and nutrition divisionof the International Food PolicyResearch Institute. He has a BSc inphysics from Imperial College London,an MSc in neural networks from KingsCollege London, an MA in development
economics from the University of Rome and a DPhil innutritional epidemiology from Imperial College.
Dr Mangani Katundu is the Dean ofResearch and Senior Lecturer in Foodand Nutrition at University of MalawiChancellor College, where he hasworked for the past 17 years. In thistime he has also conductedconsultancies for the Government of
Malawi and the World Bank. He has a PhD in Food Securityfrom the University of KwaZulu-Natal.
George Chidalengwa is a SeniorMonitoring, Evaluation, Accountabilityand Leaning Manager for Education atSave the Children Malawi. He has led onseveral studies in the education andnutrition sectors and has co-authoredseveral sexual and reproductive health
books, some of which are being used in Malawian schools.
Peter Phiri is the Early Childhood Careand Development (ECCD) Manager inthe Education Department of Save theChildren International. He has overseven years’ experience managingECCD programmes with Save theChildren and 14 years’ experience in
development work with international non-governmentalorganisations.
Helen Moestue is a School Health andNutrition Advisor for Save the ChildrenUSA, based in Oslo, supporting nutrition-sensitive education projects. She has anMSc and PhD from the London School ofHygiene and Tropical Medicine and hasworked for UNICEF and other agencies
on integrated health and protection projects.
This research was funded by the PATH-led and UKDepartment for International Development (DFID)-fundedNutrition Embedding Evaluation Program (NEEP), with co-funding from the International Food Policy ResearchInstitute (IFPRI) and Save the Children. The research wasconducted by IFPRI, University of Malawi ChancellorCollege, Wadonda Consultants and Save the Children. Theauthors would also like to thank all the national, districtand community partners, particularly the Ministry ofGender, Children, Disability and Social Welfare; theMinistry of Agriculture, Irrigation and Water Development;the Department of HIV/AIDs and Nutrition under theMinistry of Health; and the 60 NEEP communities.
Location: Malawi
What we know: Linking nutrition, agriculture and education may benefitchild nutrition and development.
What this article adds: Community-based childcare centres (CBCCs) arecommunity-managed rural pre-schools serving 45 per cent of the childpopulation. Provision of mid-morning porridge is a key incentive to attend.Save the Children and University of Malawi Chancellor College developeda nutrition and agriculture training programme for CBCCs to overcomeidentified challenges to CBBC food provision. Support included provisionof seeds and chicks, demonstration gardens, formation of village savingsand loans (VSL) groups to help households start small businesses,purchase supplies and for emergency use, and development of nutritiousrecipes for CBBC and household use. An IFPRI-led cluster randomised trialevaluated the impact of the programme at one year. Preliminary findingsinclude improved caregiver knowledge of nutrition, household andindividual dietary diversity; improved diversity of agricultural production;improved pre-school meal quality and frequency; improved dietary intakeof both pre-schoolers (children aged 3-6 years) and their younger siblings(children aged 6-4 months); and a protective effect on height-for-age z-scores of children aged 6-24 months. Sector divides were not a barrier atcommunity level.
BackgroundCommunity-based childcare centres (CBCCs)are rural pre-schools managed by the com-munity to provide a safe and stimulatinglearning environment to children aged threeto six years and better prepare them forschool. There are around 12,000 CBCCs inMalawi, serving approximately 45 per centof the pre-school population. A key momentin the CBCC day is mid-morning porridge,which is prepared by parents with food con-tributions from the community. If porridgeis not provided, children tend to stay athome and eventually the CBCC closes. Amapping exercise of 690 CBCCs in fourdistricts conducted by the World Bank in2011, which involved visiting each CBCC,found that half the CBCCs were closed. Themain reason cited for closure was lack offood (Newman, McConnell and Foster, 2014).CBCC closure is a particular problem duringthe lean season when food insecurity is high.
However, separate research conductedby Save the Children in 110 CBCCs in 2014
found that some communities were stillable to provide food for the CBCCs all yearround, against all odds. Community capacityand commitment, leadership, organisationand communication between the CBCCand community were key to CBCC successin acquiring and providing meals. The re-search also found that, with basic training,communities could prepare more nutritiousmeals in the pre-schools (rather than basicmaize porridge) and that these meals werethen replicated at the household level, po-tentially benefitting other household mem-bers, including younger siblings (Katundu,2014).
The interventionBuilding on the findings and experiencesdescribed above, Save the Children andUniversity of Malawi Chancellor College de-veloped a nutrition and agriculture trainingprogramme for CBCCs. In it CBCCs were
1 Presentation at the Action Against Hunger Research for Nutrition Conference, Pavillon de L’Eau, 13th November, 2017.
used as a platform for training and practising newrecipes and agricultural techniques to be replicatedat household and community levels. The pro-gramme drew together the (WALA) programme(funded by USAID Food For Peace), the CBCCswraparound programme (funded by the ConradN Hilton Foundation) and the Malawi recipe bookand guide for agricultural production practices (aGovernment of Malawi publication). National anddistrict-level partners representing early childhooddevelopment (ECD), nutrition and agriculture pro-vided input to the programme. The interventionhad an agriculture and a nutrition component,described below.
Agriculture componentTwo three-day agricultural production trainingswere conducted in each CBCC community bytrained Agriculture Extension Development Officers(AEDOs) prior to planting times (December andAugust) and targeting parents, CBCC managementcommittee representatives, lead farmers and com-munity agents (community focal points for theproject). The training focused on land preparation;selection of nutritious crops (local orange maize,orange-flesh sweet potatoes, soya beans, pigeonpeas, cowpeas, groundnuts, green leafy vegetables,carrots, spinach and tomatoes); production tech-niques; pest and disease management; manuremaking and application; harvesting; storage; andprocessing. The CBCC garden was used as a demon-stration site and a place to try new agriculturalproduction techniques and learn ways to utilisethe foods. The trained household members (mostlywomen caregivers) worked in the garden withregular support from AEDOs. Households andCBCCs received crop and vegetable seeds andsweet potato vines. They were also trained inchicken production and each CBCC and householdreceived 30 chicks and ten chicks respectively toboost production (and consumption) of animal-source foods.
Village savings and loans (VSL) groups wereformed to help households save and access funds
to start small businesses, purchase supplies forthe CBCC and use in case of emergency. The VSLgroups were also used to discuss business man-agement and nutrition. Farmers were subsequentlyorganised into groups to increase their bargainingpower when purchasing inputs, such as seedsand fertilizer, and to sell their produce.
Nutrition componentNutrition training was conducted by AEDOs andgovernment nutrition assistants trained by Uni-versity of Malawi Chancellor College targeted CBCCmanagement committee members, CBCC caregivers(teachers), lead farmers and parents. The trainingfocused on essential nutrition and hygiene practices;nutritious food selection in different seasons; foodstorage, preservation and preparation; CBCC mealplanning; and adaptation for the household andyounger children. Trainings combined theory andpractice, including recipe presentations and prepa-ration in small groups, and discussions of theirnutritional value and alternatives when certainfoods are unavailable. Since parents take turnspreparing CBCC meals, parents continued to practisenew recipes at the CBCC, which could then bereplicated at home, receiving ongoing supportfrom community agents. Box 1 describes therecipes promoted. The most popular ones takenup in the CBCCs were the enriched porridges (withgroundnut, vegetable and fish powder) and sweetpotato doughnuts. The others were mainly takenup at household level.
The evaluationWith funding from the PATH led, DFID-fundedNEEP programme, IFPRI and Save the Children, acluster randomised trial was set up to evaluatethe impact of the CBCC nutrition and agricultureintervention on pre-school meals (frequency andquality), household production and diets and thenutritional status and development of pre-schoolchildren and their younger siblings. The evaluationwas led by IFPRI in partnership with University ofMalawi Chancellor College and Save the Children.
The study was conducted in 60 rural commu-nities with CBCCs supported by Save the Children’sECD programme in Zomba district. The evaluationcombined quantitative and qualitative methodswith two rounds of surveys timed one year apart,including child, caregiver, household, communityand CBCC-level data collection. The 60 commu-nities were randomly assigned to the intervention(described above) or a control group. The evalu-ation targeted all children aged 0-6 years in the60 selected communities and their parents. Theprimary reference group was children aged 3-6years at baseline; the secondary reference groupwas their younger siblings aged 6-24 months atbaseline. Study outcomes included individual di-etary intake and dietary diversity scores, householdfood production (quantity and diversity), anthro-pometry and child development. A total of 1,200households were surveyed (20 per community).The study protocol has been published and canbe consulted for further details (Gelli et al, 2017).A follow-up survey was conducted at the end of2017 to examine longer-term trends and is cur-rently under analysis.
Preliminary findings Preliminary results (in press) found that, withinone year of implementation, the intervention im-proved caregiver knowledge of nutrition, householdand individual dietary diversity, diversity of agri-cultural production, and pre-school meal qualityand frequency. It also improved dietary intake ofboth the pre-schoolers (3-6 year-olds) and theiryounger siblings (aged 6-24 months), driven by ahigher frequency of consumption of nuts, pulses,fruit and vegetables. Most surprisingly, the inter-vention had a protective effect on height-for-agez-scores of children aged 6-24 months, preventingthe steady decline observed in the control group.
Lessons learnedThis project showed that community pre-schoolscan provide an effective platform for behaviourchange and scaling up nutrition and agriculturalpractices. CBCCs are highly valued by the communitybecause they provide childcare and prepare youngchildren for school. Since food insecurity is one ofthe main underlying barriers to CBCC success, in-tegrating agriculture and nutrition capacity-buildingactivities within the CBCC helps address multipleproblems (food insecurity, malnutrition and de-velopmental delays) at the same time, supportingthe goals of three sectors that tend to work inparallel (education, nutrition and agriculture). Unlikeprimary schools, CBCCs are small (around 40-50children per centre) and entirely community-man-aged. The community therefore has the mandateand incentive to find solutions and, in most cases,has a system in place to provide daily meals tochildren in the CBCCs. This intervention is simplybuilding the capacity of the community to improvewhat it is doing already. The strong communityand parent engagement and ownership meansthe benefits trickle down to the household andyounger siblings and promote long-term sustain-ability. Although working across sectors comeswith several challenges, particularly around coor-dination of a large number of stakeholders withdifferent agendas, we have found that the sectordivides are predominantly at national or programmelevel, not at community level.
A three-minute video of the intervention isavailable at https://vimeo.com/219710521A short blog about the intervention can be readat: http://bit.ly/2uqLPY7
ReferencesGelli, A et al. (2017). Improving child nutrition anddevelopment through community-based childcarecentres in Malawi – the NEEP-IE study: study protocol fora randomised controlled trial. Trials. 2017 Jun19;18(1):284. doi: 10.1186/s13063-017-2003-7.
Katundu MC (2014). Hilton Wraparound ProjectEvaluation Report. Save the Children, 2014. Journal ofEarly Childhood, Springer, 2014
Newman MJ, McConnell C, Foster K (2014). From EarlyChildhood Development Policy to Sustainability: TheFragility of Community-Based Childcare Services inMalawi. IJEC (2014) 46: 81.https://doi.org/10.1007/s13158-014-0101-1
Research
Box 1 New recipes promoted in theCBCC programme
Parents were trained to prepare a wide range ofmeals using locally available products, which werethen prepared in the CBCCs and in the households,including:
• Porridges: maize or rice porridge enriched with groundnut powder, dry fish powder, dry vegetables, mango, soya, millet, beans, carrot and oil.
• Legume snacks: pigeon pea sausage, cassava kidos (boiled cassava dipped in eggs and vegetables and fried), soya coffee, sweet potatodoughnuts, peanut butter and soya snacks.
• Vegetable snacks: pumpkin-leaf meatballs (made with pumpkin leaves, salt and eggs), orange-flesh sweet potato juice, sweet potato leaf juice, dried vegetables (for preservation), pumpkin leaves and amaranthus in groundnut powder and sweet potato leaf snack.
• Fish products: dry fish with groundnut powder, dry fish with tomato and onion.
• Fruit products: pawpaw, guava and lemon juice, pawpaw relish (unripe pawpaw cooked with groundnut powder, tomato and onion) and banana bread.
Tefera Darge Delbiso is a ResearchAssociate with the Center forResearch on the Epidemiology ofDisasters (CRED). He has amultidisciplinary background,broad and progressive workexperience in research, teaching
and consultancy, and an extensive record ofpublication in reputable journals.
Chiara Altare holds a PhD and anMSc in Public Health from theUniversity of Louvain, Belgium. Shehas ten years’ experience in researchand evaluation in developmentand humanitarian settings and iscurrently working as Impact
Assessment Advisor for Action Contre la Faim, Paris.
Jose Manuel Rodriguez-Llanes is adisaster and conflictepidemiologist. He obtained hisPhD from the CRED, LouvainSchool of Public Health, Belgium.He is currently a scientific officer at the European Commission Joint
Research Centre, where he investigates themeasurement and drivers of resilience to food andnutrition security in disaster and conflict settings.
Shannon Doocy is an AssociateProfessor with the Johns HopkinsCenter for Refugee and DisasterResponse. She has worked innumerous countries incollaboration with United Nationsagencies, governments and non-
government organisations, and has publishedextensively on the impact of natural disasters andconflict on public health in emergencies.
Professor Debarati Guha-Sapir isthe Director of the CRED and aProfessor at Université catholiquede Louvain. She has been involvedin field research and training inemergency and humanitarianissues for more than 30 years.
The authors would like to thank all agencies thatconducted the surveys and shared their reports withthe Complex Emergency Database team, FEWS NET forproviding the food security data, and Global DroughtMonitor for the drought data. This research wassupported by the Association pour l’Epidemiologie deDésastres, Université catholique de Louvain and FondNational de Recherche Scientifique.
Short and long-term droughts, food security and childmortality in Ethiopia: Can sub-national surveys tell usmore about the success of mitigation efforts?Summary of presentation1
By Tefera Darge Delbiso, Chiara Altare, Jose Manuel Rodriguez-Llanes, Shannon Doocy and Debarati Guha-Sapir
Location: Ethiopia
What we know: There is a lack of global and country-specific evidenceon the health impacts of climate change, especially drought, and theimpact of programmes to mitigate public health and nutritionconsequences.
What this article adds: Recurrent droughts now pose anunprecedented threat in Ethiopia; more than 80 per cent of thepopulation is dependent on subsistence and rain-fed agriculture. Theeffects of drought on child mortality in Ethiopia between 2009 and2014 were explored using 88 small-scale, complex emergency database(CE-DAT) mortality surveys (55,219 children) and Famine Early WarningSystems Network (FEWS NET) data, coupled with intensity of droughtexposure. Most of the surveys were in highly populated regions; 95 percent were stressed/crisis-level food security. The under-five death rate(U5DR) was lower than emergency threshold and baseline threshold forsub-Saharan Africa. This is consistent with general positive childmortality trends in Ethiopia but may be an underestimate due toinaccessibility of some crisis-affected areas. There was no associationbetween U5DR and both short and long-term droughts. Areas withminimal food insecurity had higher U5DRs than stressed areas; the lattermay attract more support. Child mortality was associated withprevalence of wasting that remained high (>10%) in crisis-affectedareas. The findings reflect important progress in drought resilience;further targeted interventions are needed.
Background The health impact of droughts is intuitive,although indirect and complex. Droughthas been associated with excess mortalityand can cause nutrition and health problems,aggravate chronic diseases, reduce cropand livestock production, contribute to in-flation of food prices and trigger drought-induced migration. The severity of its effectsdepends on socioeconomic conditions, in-frastructure development, stability and thegeneral environment, which directly influ-ence the resilience capacity of the population(Stanke et al, 2013).
Drought mitigation efforts have im-proved enormously over the last fewdecades; however, in recent times, the fre-quency of droughts and their impacts haveincreased in Ethiopia, with incidents nowoccurring annually in some parts of thecountry. The majority of the population inEthiopia is also highly vulnerable, as morethan 80 per cent of people are dependent
on subsistence and rain-fed agriculture;the 2015-2016 El Niño induced-droughtscaused a drop in agricultural yield of up to80 per cent in some areas. Consequently,recurrent droughts now pose an unprece-dented threat in Ethiopia.
Rigorous synthesis of empirical data onthe health impacts of climate change ingeneral and droughts in particular arelacking in Ethiopia and elsewhere in theworld. This, in turn, creates an evidencevacuum in terms of evaluating the impactof ongoing programmes to reduce thepublic health impact of droughts and guideeffective adaptation strategies. To addressthis research gap and provide a sound quan-titative synthesis, the effects of drought onchild mortality in Ethiopia between 2009and 2014 were explored, considering real-time data on the intensity of drought ex-posure.
1 Presentation at the ACF Research for Nutrition Conference, Pavillon de L’Eau, 13th November, 2017.
Methods Under-five death, nutrition and vaccinationdata: A total of 88 sub-national (small-scale)mortality surveys were extracted from the Com-plex Emergency Database (CE-DAT) (Altare andGuha-Sapir, 2014). The surveys were conductedbetween January 2009 and December 2014by humanitarian agencies operating in Ethiopia.Surveys were selected based on the followingcriteria: 1) conducted in permanent residentpopulations; 2) used probability sampling meth-ods; 3) based on a three-month recall period;and 4) the under-five death rate (U5DR) and/orsample size was provided or could be estimated.
The following indicators were extracted: U5DR;prevalence of child wasting, measles antigen-containing vaccines (MCV) coverage; surveycoverage area of the woreda (the third tier ofregional administration); and survey monthand year.
Drought exposure data: The standardised pre-cipitation evapotranspiration index (SPEI) wasused. This is an improved index to identifythe spatial and temporal extent of droughtexposure and its intensity. The SPEI is calculatedfor different timescales (for example; one,three, six and 12 months), considering thecombined effect of precipitation and temper-
ature. The different timescales are important for as-sessment of drought effects on child mortality aseffects are likely to vary with the frequency and durationof droughts. Thus, in this study, the three-month and12-month SPEIs were used to identify the short andlong-term droughts, respectively. The SPEI data wasdownloaded from the Global Drought Monitor andcategorised into: no drought (SPEI > 0); mild drought(−1 < SPEI ≤ 0); moderate drought (−1.5 < SPEI ≤ −1);and severe-to-extreme drought (severe drought here-after) (SPEI ≤ −1.5).
Food security and livelihood zones data: Food securityand livelihood zones data were obtained from theFamine Early Warning Systems Network (FEWS NET),which provides evidence-based analysis on earlywarning and food insecurity. FEWS NET uses the Inte-grated Food Security Phase Classification (IPC), a set oftools and procedures that identify and classify theseverity of food insecurity. The IPC classifies areas withfood insecurity into five phases: minimal, stressed,crisis, emergency and famine. The drought, food securityand livelihood zone data were then matched with aCE-DAT survey of a given area using global positioningsystem (GPS) coordinates.
Statistical analysis: The datasets were merged acrossspace and time and a random-effects meta-analysis wasundertaken to summarise survey results and explore het-erogeneity across independently conducted but method-ologically similar small-scale surveys. Variability wasexplored across the survey estimates using the between-survey variance statistic. To explain the variability, meta-analyses were performed on sub-groups based on sur-vey-specific contextual moderators (drought exposurelevels, food insecurity and livelihood zones). A meta-re-gression analysis was subsequently undertaken, adjusting
Subgroups No. of surveys Sampled children U5DR (95% CrI)
Short-term drought
No drought 38 23077 0.293 (0.206 0.401)
Mild 28 17995 0.323 (0.214 0.460)
Moderate 10 6681 0.308 (0.160 0.551)
Severe 12 7466 0.403 (0.231 0.667)
Heterogeneity: τ2 = 0.41; 95% Crl:0.19-0.78
Long-term drought
No drought 29 18276 0.324 (0.224 0.451)
Mild 25 15451 0.204 (0.129 0.307)
Moderate 18 10565 0.471 (0.307 0.696)
Severe 16 10927 0.380 (0.237 0.577)
Heterogeneity: τ2 = 0.34; 95% Crl:0.14-0.67
Livelihood zone
Cropping 65 39720 0.319 (0.243 0.406)
Agropastoral 19 13149 0.290 (0.182 0.443)
Pastoral 4 2350 0.500 (0.200 1.149)
Heterogeneity: τ2 = 0.39; 95% Crl:0.19-0.74
Food insecurity
Minimal 4 2406 0.722 (0.317 1.458)
Stressed 37 23295 0.287 (0.205 0.388)
Crisis 40 24660 0.338 (0.246 0.446)
Heterogeneity: τ2 = 0.29; 95% Crl:0.09-0.64
Overall 88 55219 0.323 (0.254 0.397)
Heterogeneity: τ2 = 0.38; 95% Crl:0.17-0.71
Figure 1Pooled U5DR and 95% CrI’s, stratified by short- and long-term droughtexposure, food insecurity and livelihood zones from 88 small-scalemortality surveys from Ethiopia, 2009–2014.
Table 1 Results from Bayesian Poisson meta-regression models of small-scalemortality surveys from Ethiopia,2009-2014.
Moderators Model 1 Model 2
PosteriorDRR
95% CrI PosteriorDRR
95% CrI
Drought exposure
No drought Ref
Mild drought 0.97 0.61; 1.54 0.76 0.44; 1.28
Moderatedrought
1.37 0.69; 2.63 1.62 0.98; 2.71
Severe drought 1.27 0.73; 2.26 1.2 0.71; 2.01
Food insecurity
Minimal 2.36 1.05; 5.02 2.36 1.09; 4.68
Stressed Ref
Crisis 1.08 0.72; 1.63 1.14 0.77; 1.69
Livelihood zones
Cropping 1.04 0.62; 1.74 1.1 0.67; 1.82
Agropastoral Ref
Pastoral 1.25 0.45; 3.45 1.66 0.64; 4.39
Prevalence ofwasting
1.09 1.04; 1.14 1.07 1.03; 1.12
MCV coverage 1.00 0.99; 1.01 1.00 0.99; 1.01
Heterogeneity: (95% CrI)
0.19 (0.01; 0.54) 0.13 (0.01; 0.44)
DRR: Death rate ratio
Camels and cattle being led inthe drought-stricken SomaliRegion of Ethiopia, 2017
WFP
/Pet
er S
mer
don
I I
I I
I I
I I
I I
I I
I I
I I
I I
I I
I I
I I
I I
I I
I I
0.000 0.500 1.000 1.500Under-five death rate (U5DR)
for additional moderators, prevalence of wastingand MCV coverage. A fifth of included surveys hadzero counts for U5DR, leading to undefined varianceestimates. To circumvent this problem, the Poissonregression model was used for meta-analysis in aBayesian framework.
Results and discussionOverall, 55,219 children under five years old werecovered in the 88 surveys included in the meta-analysis. The surveys covered seven of the 11 ad-ministrative regions in Ethiopia. Most of thesurveys were from the three highly populatedregions of the country: Oromia (38, 43.2%); Amhara(22, 25.0%); and the Southern Nations, Nationalitiesand People (18, 20.5%). More than half the surveys(50, 56.8% and 59, 67.0%) were conducted inareas affected by mild-to-severe drought in theshort and long-term, respectively. The overwhelm-ing majority of the surveys (84, 95%) were con-ducted in areas suffering from stressed or crisis-level food insecurity. Sixty-five (73.8%) were con-ducted in cropping areas (See Figure 1).
Results of the pooled analysis showed that theU5DR during the study period of 0.323/10,000/day(95% credible interval (CrI): 0.254-0.397) (seeFigure 1) is lower than both the emergencythreshold death rate of 2.1/10,000/day and thebaseline threshold of 1.07 for sub-Saharan Africa.This result is consistent with the fact that Ethiopia,in general, has shown great improvement in re-ducing child mortality and successfully achievedthe millennium development goal (MDG) threeyears ahead of the 2015 deadline. The resultmay also reflect the positive contribution of hu-manitarian agencies in supporting national pro-grammes to improve health, thereby reducingmortality. However, possible underestimation ofmortality due to inaccessibility of some of thecrises-affected areas and exclusion of non-per-manent residents (such as refugees) should notbe ruled out. Emergency thresholds may also
need to be reviewed as current thresholds dateback to 1997, when the Sphere project (Human-itarian Charter and Minimum Standard in DisasterResponse) was launched.Results from the sub-group meta-analysis andmeta-regression show no association betweenU5DR and both short and long-term droughtsduring the study period (See Table 1). This canbe partially explained by the resilience capacityEthiopia has developed to deal with droughtsand food shortages. This has involved the strength-ening in recent years of weather forecasting andearly warning systems; increased timeliness andpredictability of relief assistance; rollout of thenational productive safety net programme (PSNP),which minimises vulnerability to food insecurityamong chronically food-insecure households infamine-prone areas; and road network develop-ment over the last decade, which has helpedfarmers to access markets and helped reliefproviders to access remote villages.
Results also show that areas with minimal foodinsecurity had higher U5DRs than areas reportingstressed food insecurity (See Table 1). It may bethat these areas do not attract the support ofgovernment and aid agencies and therefore donot receive the assistance that contributes to theimprovement of child survival, such as healthcare,food assistance and other relief commodities.
Results also confirmed the well-documented find-ing that child mortality increases with increasedprevalence of wasting (See Table 1). Despite thedeclining trend, the prevalence of wasting in cri-sis-affected areas in Ethiopia remains high, atmore than 10% (Delbiso et al, 2017). Targeted in-terventions are therefore needed to improvechild nutrition, thereby boosting child survival.
Model 1 investigates the effect of short-termdroughts on child mortality. Model 2 investigatesthe effect of long-term droughts on child mortality;both are adjusted for survey-specific moderators
(food insecurity, livelihood zones, prevalence ofwasting and MCV coverage).
ConclusionsThe estimated pooled U5DR was below both theemergency and the baseline threshold for sub-Saharan Africa. This reflects the huge progressthat has been made in reducing child mortalityin Ethiopia, but may also indicate important sub-populations not represented in the data (non-permanent residents, inaccessible crisis areas)and the need to review and update existingemergency mortality thresholds. The study alsofound that, within the surveyed population, bothshort and long-term drought exposures were notassociated with U5DR; however, minimal foodinsecurity was associated with elevated U5DR.This is consistent with earlier findings that mod-erate drought-affected areas presented elevatedwasting prevalence (Delbiso et al, 2017) and in-dicates that these areas should not be overlookedby intervention programmes, particularly theEthiopia PSNP. The results of this study reflectthe enormous progress made in Ethiopia in de-veloping drought resilience and show that furthertargeted interventions are crucial to reduce theprevalence of acute malnutrition in order tofurther reduce the U5DR.
For more information, contact: Tefera Darge Del-biso, email: [email protected]
ReferencesAltare C and Guha-Sapir D. The Complex EmergencyDatabase: A Global Repository of Small-Scale Surveys onNutrition, Health and Mortality. PLoS One, vol. 9, no. 10,p. e109022, 2014.
Delbiso TD, Rodriguez-Llanes JM, Donneau A-F,Speybroeck N and Guha-Sapir D. Drought, conflict andchildren’s undernutrition in Ethiopia 2000–2013: a meta-analysis. Bull World Heal. Organ, vol. 95, pp. 94–102, 2017.
Stanke C, Kerac M, Prudhomme C, Medlock J andMurray V. Health Effects of Drought: a Systematic Reviewof the Evidence. PLoS Currents Disasters, pp. 1–38, 2013.
TreatFOOD study in Burkina FasoSummary of presentation1 of published research2
By Susan Shepherd
Dr Susan Shepherd isDirector of Clinicaland OperationalResearch for ALIMA.
The TreatFOOD study was conductedin Burkina Faso from 2013-2015 byALIMA and the University of Copen-hagen with support from the World
Food Programme (WFP), DANIDA, EuropeanCivil Protection and Humanitarian Aid Opera-tions (ECHO), Médecins Sans Frontières (MSF)and the Arvid Nilssons Fond. e main objectiveof the study was to assess the effectiveness of athree-month supplementation with newly de-veloped food supplements for the managementof children aged 6-23 months with moderateacute malnutrition (MAM) in Burkina Faso. Asof 2017, ten publications have resulted from thestudy. Highlights of key results were presented,including most recently published findings.
MethodChildren with MAM were treated with lipid-basednutrient supplement (LNS) or corn-soy blend(CSB). Investigators assessed the effectiveness of(a) matrix (LNS or CSB); (b) soy quality (soy isolate)(SI) or de-hulled soy (DS); and (c) percentage oftotal protein from dry skimmed milk (0 per cent,20 per cent, or 50 per cent), in increasing fat-freetissue accretion. Primary outcome was the effecton accrual of fat-free (lean body) mass; secondaryoutcomes included linear growth, recovery rate,physical activity, motor milestones, morbidity,food supplement acceptability, haemoglobin con-centration, serum acute phase proteins, IGF-1,serum ferritin, essential fatty acid concentrationsand thymus size.
Between 9 September 2013 and 29 August29 2014, a randomised 2 × 2 × 3 factorial trial re-cruited children aged 6 to 23 months with MAM(defined by mid-upper arm circumference (MUAC)≥115 mm and < 125 mm and/or weight-for-height z-score (WHZ) ≥-3 and < -2) in BurkinaFaso. The intervention comprised 12 weeks offood supplementation providing 500 kcal/day asLNS or CSB, each containing SI or DS, and 0 percent, 20 per cent or 50 per cent of protein frommilk. Fat-free mass (FFM) was assessed by deutriumdilution technique. By dividing FFM by lengthsquared, the primary outcome was expressed in-
dependent of length as FFM index (FFMI) accretionover 12 weeks.
FindingsOf the 1,609 children recruited into the study,four died, 61 were lost to follow-up and 119 weretransferred out due to supplementation beingswitched to non-experimental products3. No chil-dren developed allergic reaction. At inclusion,95 per cent were breastfed and mean (SD) weightwas 6.91 kg (0.93), with 83.5 per cent (5.5) FFM.In the whole cohort, weight increased 0.90 kg(95 per cent confidence interval (CI) 0.88, 0.93; p< 0.01) comprising 93.5 per cent (95 per cent CI89.5, 97.3) FFM. Compared to children who receivedCSB, FFMI accretion was increased by 0.083 kg/m2(95 per cent CI 0.003, 0.163; p = 0.042) in thosewho received LNS. In contrast, SI did not increaseFFMI compared to DS (mean difference 0.038kg/m2; 95 per cent CI −0.041, 0.118; p = 0.35), ir-respective of matrix. There was no effect modifi-cation by season, admission criteria, baselineFFMI, stunting, inflammation, or breastfeeding(p > 0.05). LNS compared to CSB resulted in 128g(95 per cent CI 67, 190; p < 0.01) greater weightgain if both contained SI, but there was no differ-ence between LNS and CSB if both contained DS(mean difference 22g; 95 per cent CI −40, 84; p =0.49) (interaction p = 0.017). Accordingly, SI com-pared to DS increased weight by 89g (95 percent CI 27, 150; p = 0.005) when combined withLNS, but not when combined with CSB.
A limitation of this and other food supple-mentation trials is that it is not possible to collectreliable data on individual adherence. In addition,the study was under-powered in terms of de-tecting any statistically significant difference inmilk content.
Conclusion and reflectionsIn this study, children with MAM mainly gainedFFM when rehabilitated. LNS yielded more fat-free tissue and higher recovery rates than CSB.Moreover, current LNS formulation with DS maybe improved by shifting to SI. The role of milk rel-ative to soy merits further research.
The overall findings of the TREATFood studysupport a wider use of LNS in the treatment ofchildren with MAM. A switch to LNS would leadto greater gain of fat-free tissue and recoveryand would benefit millions of children.
Another study by the same group found ahigh degree of morbidity in this population, withnearly 90 per cent of children manifesting clinical
signs of illness and/or elevated biomarkers of in-flammation (i.e. C-reactive protein and α-glyco-protein) (Cichon et al, 2016).
An additional two analyses from the samestudy found that children less than 67cm in lengthwith MAM by MUAC only (i.e. MUAC ≥115 mmand < 125 mm but WHZ ≥-2) had similar ponderalgrowth rates (Fabiansen, 2016) and did not gainexcessive fat during supplementation when com-pared to children ≥67 cm in length with MAM byMUAC only (paper in submission). Currently, pro-tocols for management of acute malnutrition inmany African countries (including Cameroon,Central African Republic, Chad, Guinea, IvoryCoast, Mali, Mauritania, Senegal and Togo) instructhealth personnel to measure MUAC only ofchildren aged 6-59 months with length ≥67 cmwhen assessing eligibility for MAM or severeacute malnutrition (SAM) treatment programmes.In Ethiopia, admission by MUAC alone for SAMtreatment is restricted to children with lengths>65 cm. These analyses provide strong evidencethat the use of length as a criterion for measuringMUAC of children aged 6-59 months should bediscontinued in policy and practice.
For more information, contact: Kevin Phelan,email: [email protected]
ReferencesCichon B, Fabiansen C, Yaméogo CW, Rytter MJH, RitzC, Briend A, Christensen VB, Michaelsen KF, OummaniR, Filteau S, Ashorn P, Shepherd S and Friis H. Childrenwith moderate acute malnutrition have inflammationnot explained by maternal reports of illness and clinicalsymptoms: A cross-sectional study in Burkina Faso. BMCNutr. 2016;2:57. Previously summarised in FieldExchange 54, February 2017, p.66, available at:https://www.ennonline.net//fex/54/inflammationmambfaso
Fabiansen C, Phelan KP, Cichon B, Ritz C, Briend A,Michaelsen KF, Friis H, Shepherd S. Short children witha low midupper arm circumference respond to foodsupplementation: an observational study from BurkinaFaso. Am J Clin Nutr. 2016 Feb;103(2):415-21. doi:10.3945/ajcn.115.124644. Epub 2016 Jan 6.
Research
1 Presentation at the ACF Research for Nutrition Conference, Pavillon de L’Eau, 13th November, 2017.
2 Fabiansen C, Yaméogo CW, Iuel-Brockdorf A-S, et al. Effectiveness of food supplements in increasing fat-free tissue accretion in children with moderate acute malnutrition: A randomised 2 × 2 × 3 factorial trial in Burkina Faso. Tumwine JK, ed. PLoS Medicine. 2017;14(9):e1002387.doi:10.1371/ journal.pmed.1002387.
3 17 children were supplemented with Plumpy’Sup due to unconfirmed suspicion of salmonella contamination of theirexperimental supplement, while 102 children deteriorating into severe acute malnutrition (SAM) were switched to therapeutic foods.
How to improve the engagement of communities in research? Summary of panel discussion1
Alice Obrecht of ALNAP moderated this session. Panellists were Gwen Luc of Action AgainstHunger (AAH) Link Nutrition Causal Analysis (NCA) project, Lillian Omutoko of the University ofNairobi and Stephen Kodish of the World Food Programme (WFP), who were asked to talk abouttheir area of work and how they had engaged communities in research.
Gwen Luc described the approach of Link NCA,which is a participatory method of assessing thecauses of malnutrition in a community and facil-itating agreement on which ones to prioritise.Researchers meet to examine available evidenceon the prevalence of malnutrition and the rangeof underlying causes. Communities decide whetherthe causes identified represent priority problemsfor them and hold discussions with the researchersto reach agreement on how they can be addressed.The methodology can be adapted to differentcontexts; the aim is to use existing data to betterunderstand the mechanisms that lead to malnu-trition. There is a focus on risk factors identifiedby the community: what the community considersto be its main problems and the central risks un-derlying malnutrition. Community action plansare developed which identify problems, solutionsand what is needed to put them into action inthe prevailing situation. Social behaviour-changecommunication (SBCC) approaches are used toexamine how to address the problems identified.
Lillian Omutoko spoke about HIV/AIDS re-search and vaccine development in three Africancountries with high prevalence and infectionrates: Uganda, Kenya and South Africa. In eachcountry vulnerable populations were fully engagedin the research. Each situation involved margin-alised and highly vulnerable people in environ-ments where there were a high number of deaths.Research was dependent on communities to theextent that HIV vaccine development would nothave been possible without community engage-ment. Communities were involved in recruitmentof trial participants as well as ongoing outreachthroughout the research period. The project pro-vided leadership development to train communityleaders in research development with the aim ofavoiding the exploitation of communities and toencourage ownership of the trials and the findings.
In urban, informal settlements of Nairobi therewere various forms of engagement with com-munities. The research protocol required estab-lishment of community advisory boards to guideresearchers on managing expectations of com-
munities and how to pursue community entryand engagement. Communities were trained andsupported, based on their needs, which couldeither be community-driven or research-driven.
Stephen Kodish described how WFP movedfrom food aid to specialised foods and at thatpoint recognised an increased need to concentrateon demand as well as supply. He illustrated anexample from Kakuma refugee camp where amicronutrient powder (MNP) distribution achievedjust 30 per cent uptake by the target population.This highlighted the importance of involvingcommunities and developing culturally appropriatemessaging, which entailed more in-depth con-sultation and research in communities than theorganisation had previously contemplated. Criticalto this approach was taking the findings of thequalitative and ethnographic studies back to thecommunity to check them before finalising theconclusions. Sometimes this validation exerciseresulted in a change to the final conclusions.
Some common themes emerged from theexperiences shared in terms of the need to workflexibly and openly with communities and toprepare to be genuinely community-led wherenecessary.
Complementarity of researchers andcommunities in working towards effective solutionsThe Link NCA model seeks to ensure that researchfindings are taken up by the community andtherefore has an emphasis on agreeing practicaland effective solutions. For example, in a NigerLink NCA, the impact of women’s workload washighlighted as one of the multi-sector causes ofmalnutrition. Researchers sought to sensitise menand women and encourage men to assist womenwith household chores, such as collecting water.Women identified that carts were the solution;men would not carry water on their heads forfear of being laughed at, but they could collectwater with a cart. This example highlights that itis essential to identify not just technical solutionsbut approaches that are also culturally acceptable
1 Panel discussion at the ACF Research for Nutrition Conference, Pavillon de L’Eau, 13th November, 2017.
and feasible. In this case, the complementaritybetween the technicians/experts and the com-munity led to an effective solution.
Combining formal and informal approachesBoth formal and informal approaches are requiredwhen working with communities. For example,the HIV/AIDS researchers promoted the estab-lishment of advisory boards in each communitythey worked in. Approaches to setting up theseboards were contextual and often informal. Forexample, in South Africa pre-existing women’sgroups formed the advisory boards. This helpedwith retention of board members and enabledstrong outreach as the women’s groups hadalready established access to vulnerable house-holds in the community. In Uganda, football anddrama were employed for sensitisation and dis-semination of research. In Kenya, groups withhigher prevalence of HIV, such as lakeside fishingcommunities, were the focus for community en-gagement and SBCC. Defining which communityapproach is best is a context-driven decision.
Methodological challenges when working with communitiesThere was discussion about how to mix quantitativedata with ‘something of value’ from the communityand how to ensure rigour in qualitative approachesto obtain data that represent some ‘truth’. Thereare established rigorous methods to carry outsocial, qualitative work and analytical methodsare available. However, much participatory workis unpublished and therefore may be less availableto those seeking reference to robust studies. Meas-uring the impact of community engagement is achallenge and innovative partnerships are neededbetween researchers and communities to developa successful approach.
A difference of power exists between a com-munity and researchers and there are also powerdifferentials within the community. To reach themost vulnerable in a community is often no easytask and there is a need to establish models toguide engagement of communities. Exampleswere given of work in Niger and Chad wherewomen were not used to giving their opinions.Community entry to carry out research is noteasily achieved; it requires contact people andthe authority to find the people in the communitythat you need to work with.
Who is the community? Who is asking thequestions? The researchers are frequently theones defining the issues and the research priorities.An example was shared of an evaluation of acash-transfer programme in northern Kenya. Non-governmental organisations (NGOs) and localgovernment were invited to identify communitygroups, after which the evaluators met with eightcommunity groups. They listened to them to un-derstand their context before posing any questions
How to overcome datamanagement challenges inresearch in crisis contexts Summary of panel discussion1
This session was moderated by EvaLeidman, of Centers for Disease Control andPrevention (CDC). Presentations were givenby Mary Hodges of Helen KellerInternational (HKI), Karine Le Roch ofAction Against Hunger (AAH) and OlegBilukha of CDC. Each presenter sharedresearch they had undertaken, challengesexperienced and results achieved.
Karine Le Roch (AAH) spoke about the follow-up of severely acutely malnourished childrenproject (FUSAM), a psychosocial intervention inchildren aged 6-24 months in Saptari, Nepal.
Action Against Hunger conducted a randomisedcontrolled trial (RCT) to assess the effectivenessof the addition of psychosocial support in an out-patient therapeutic programme (OTP). OTP siteswere randomly assigned as either interventionsites (n=6) or control sites (n=6). The study wasconducted in partnership with the Governmentof Nepal Ministry of Health (MoH), Child HealthDivision, Saptari District Public Health Office andthe International Centre for Diarrhoeal DiseaseResearch, Bangladesh (icddr’b) and supported byUK Aid, PATH, R2HC, Elrha and Wellcome Trust.
The study experienced significant challengesdue to the 2015 earthquake, insecurity in 2015and 2016 and floods in 2016. Although the originalplan had been to monitor the study closely withreal-time data capture and analysis, staff evacua-tions led to reliance on remote project manage-ment and loss of good visibility and qualitycontrol. Significant difficulties ensued in super-vising record-keeping and physically extractingthe data booklets from each site for analysis, aswell as accessing homes for data collection dueto floods and curfews.
In addition to these unexpected events, therewas slow integration of psychosocial servicesinto the healthcare system due to unfamiliaritywith the approach and lack of recognition of thesupport required. Study sites were spread geo-graphically, which created challenges in reachingbeneficiaries and exacerbated pre-existing lowtreatment compliance, largely attributed to con-flicting beliefs within the community.
Significant differences were found in child de-velopment scores between the group that receivedboth psychosocial and nutritional support andthe control group that had received only nutritionalsupport. However, these differences were nolonger significant at 11 months post-intervention
and they never reached the level of children inthe non-SAM group.
Mary Hodges (HKI) reported on a project to im-plement Essential Nutrition Actions (ENA) at thesix-month point of contact for children at clinicsbefore and during the Ebola crisis in Sierra Leone.The project was initiated prior to the Ebola out-break in response to a government request toadapt the mass vitamin A supplementation (VAS)campaign conducted twice a year to a routineservice at the six-month contact point (6MCP).
HKI established three groups to test three differ-ent approaches: 1. VAS integrated within expanded programme
on immunisation (EPI) (at six months).2. VAS integrated within EPI plus preparation of
complementary food with the mother’s participation and then feeding of her infant by spoon.
3. As group two plus routine ‘quality’ confid-ential one-to-one counselling on family planning (FP) (provided in a private room with a dedicated health worker) and provisionof short-term FP commodities as appropriateor referral for long-term provision.
The results showed that routine VAS at 6-8 monthswas 60 per cent, 72 per cent and 75 per cent in thethree groups respectively; 96 per cent of childrenachieved full vaccination status at six months inall three groups. In Group 3, 62 per cent of mothersreceived routine counselling on family planningat the 6MCP. Of these, 70 per cent accepted familyplanning commodities, helping to fill the ‘contra-ceptive gap’. It was evident that the 6MCP forroutine VAS enabled mothers to access routinefamily planning and boosted VAS coverage.
1 Panel discussion at the ACF Research for Nutrition Conference,Pavillon de L’Eau, 13th November, 2017. A video of the paneldiscussion can be found here: https://youtu.be/UVigavl8MM0
and asked them to rank the issues of importanceto them. This revealed that the evaluators hadoverlooked discrimination in the community (oforphans and single mothers) and issues were pre-sented that they had not previously considered.
Does all research require community engagement?While opinions differed over whether all researchrequires community engagement, it was notedthat ‘community’ may be represented at differentlevels and government or local authority repre-sentatives might be good places to start. However,engagement should start at the design phaseand continue all the way until feedback of analysisand findings is given to the community; this finalpart is too often left out. In some of the Ugandaand Kenya HIV studies participants complainedthat they were being treated as ‘guinea pigs’. Alack of trust between the researchers and thecommunity resulted in the research having tostop. This highlights that the community needs
to perceive the benefits of the work for its membersand that their willingness to take part is critical.
From research to programme designIt was noted that the Link NCA tools are also ap-plicable to operations and can be used for com-munity consultation to assist in understandingcontexts and adapting programmes accordingly.The tools facilitate a process of looking togetherwith communities for solutions and developingcommunity action plans adapted to the context.More visible results have been noted in pro-grammes that have invested in a higher level ofcommunity engagement to develop culturallysensitive approaches. However, time availablefor assessment of the situation is one factor thatoften restricts effective use of this methodology.
The social dynamics of poverty need to be un-derstood to enable design of appropriate pro-grammes, which means talking to the communityand understanding population dynamics. For ex-
ample, in many communities, a discussion withmothers quickly reveals that fathers and/or moth-ers-in-law are the ones who make the decisions.Programmes focusing on discussion and counsellingsolely with mothers are therefore liable to havelimited success. People living in poverty oftenhave a social network to draw on, which meritsthorough understanding. Simple questions suchas, ‘Who can you go to if you need food tonight?’can help tease these out. Knowledge and beliefsof the target community also need to be well un-derstood; for example, during the Ebola emergencymany people did not understand viruses enoughto value the protection of hand-washing.
ConclusionThis rich and varied sharing of experiences con-cluded with a strong affirmation of the value ofengaging communities in research and a recog-nition of the need to continue to enhance currentpractices and seek innovative methodologies toimprove the quality of that collaboration.
In response, HKI scaled up this integrated ap-proach and trained health workers from 11 outof 14 districts before Ebola broke out. Of 74people trained in Kailahun district at the beginningof the Ebola outbreak, 16 died of the diseasewithin six weeks.
HKI continued to support and monitor servicesthroughout the emergency. It found that, of theclinics that had fully integrated the 6MCP, attendancefell significantly less during the Ebola crisis in inte-grated clinics (39 per cent) than in non-integratedclinics (59 per cent). The main reasons underlyingthis were the benefits perceived by mothers inpreparing a complementary food to feed their in-fants, and, in terms of family planning, preventingpregnancy at a time when maternity services werescarce and pregnancy was regarded as risky.
Since then HKI has been scaling up the 6MCPwith the Ministry of Health to 340 of 1,281 healthfacilities nationwide and has plans and fundingto complete the scale-up and expand to a 6MCPwithin four years.
Oleg Bilukha from CDC talked about conductingnutrition surveys in difficult places. UNICEF oftencoordinates surveys but has a focus on childrenand women. He posed several questions, includingwhat happens when the elderly are the mostvulnerable or when wasting prevalence is low?He also observed how infant and young childfeeding (IYCF) activities are often the ‘knee-jerk’reaction in response.
Recently in the Ukraine, the Nutrition Clustercarried out three investigations that requiredmodification of cluster survey methods:
1. An IYCF survey among displaced women living outside the conflict zone
This survey focused on women with childrenunder two years of age. Participants were difficultto find. Lists of women were sought that includedaddresses or telephone numbers, and methodsto update the lists explored, to ensure that theywere representative for selection for the study.Some women were registered with the govern-ment, but the government was not willing toshare data; others were registered with non-gov-ernmental organisations (NGOs)/United Nations(UN) agency programmes. There was an anticipatedchallenge of potential high non-response. Duringthe survey, 20 per cent non-response/telephonenumber not working was recorded; some women
had left the area, while others were afraid tomeet. The surveyors adopted a protocol of callingthree times before moving on to the next nameon the list and used a quota sample, continuingdown the list until the sample size was achieved.
2. A representative survey of older people (over 60 years of age) in the conflict zone
The team recorded anthropometry (weight, MUAC,arm demi-span), diet diversity and food frequency,as well as chronic disease, access to medicines,disability and mental health. The team membersfollowed cluster survey methodology as the avail-able population data were reliable and there waslittle displacement at that time. Electoral precinctdata enabled specification of boundaries andhouseholds. Three random start points were iden-tified in each cluster and interviewers went fromthese points to select houses randomly. Approx-imately 40 to 50 per cent of households includedolder people; however around 50 per cent ofhouseholds did not answer the door, while othersrefused to participate.
3. A survey of pregnant women living in areas around the conflict frontline, to include anaemia assessment
The main challenge with a survey of pregnantwomen is that they represent a small percentageof the population. It would require 15 to 20household visits to find one pregnant woman,so a household visit methodology is not conducivefor this type of study. The study was thereforedesigned around antenatal clinics. In Ukraine awoman is obliged to register as early as possiblein pregnancy and attend for regular, compulsorycheck-ups, IYCF interventions, nutritional statusassessment and access to humanitarian assistance.The survey team randomly selected clinics anddays and surveyed all women who attended toachieve a semi-representative sample. Workingthrough clinics also enabled them to use the lasthaemoglobin test result from the clinic data toassess anaemia, rather than collecting samplesfirst-hand with a haemocue.
What would you do differently?The panel was asked to reflect further on theirresearch, what they might have done differentlyand what advice they would give to others whenapproaching research in crisis environments.
Karine acknowledged that they probablywouldn’t have conducted an RCT if they had
known all the challenges in advance. This is adifficult study design in any context, but extremelyso in insecure situations. Anticipating some ofthe potential obstacles and preparing a ‘plan B’for the study design might have enabled themto adapt the design according to the contextualfactors and constraints.
Mary noted that if they had increased thesample size of their study, they could have com-pared the three different groups in terms ofgrowth of children and other outcomes. Theirstudy was narrowly focused on one outcome,but with additional funds it could have furnishedfurther interesting data on nutrition.
Oleg noted that when conducting surveys,the concern is often non-response and achievingsample size. It is important to try to anticipatethese things from the start. For example, for thechallenge of absenteeism, it is useful to considerwhich days of the week are market days, whichhours people are working in the field and whenare the peak agricultural working seasons to es-tablish when people will be at home. Refusalsare high in Ukraine, so this factor could be antic-ipated in that context and the survey designadapted accordingly. One way to assess the situ-ation prior to embarking on a survey is to conducta rapid test in advance; for example, call 50 to100 people on the list and work out the non-re-sponse rate, or pre-test the survey instrumentsin the field to find out how many people refuseto participate. There are two types of bias of con-cern in surveys: measurement and selection.Measurement bias is often a manifestation ofteam quality and can be addressed early throughsupervision if one team is identifying more mal-nutrition than others. Where there is selectionbias, it should be recognised and qualified in thetext of the report. However, care should be takennot to exaggerate the relevance of bias. For ex-ample, wealth quintiles may not display hugedifferences in wasting; the data of the ‘middle-ground’ (e.g. clinic visitors) are useful and oftenreasonably representative.
ConclusionAll three presenters spoke about challenges facedwhen conducting research in unpredictable en-vironments. A commonality between these re-flections is the necessity of thorough preparedness,including scenario-building in advance to try toanticipate as many challenges and risks as possible.While some of these can be predicted (such asthe high non-response rate/refusal to participatecharacteristic of populations in Ukraine and theabsenteeism related to seasonal events or labourschedules), not all challenges can be foreseen, aswas the case in the Ebola outbreak in SierraLeone and staff evacuation due to insecurity inNepal. Study designs therefore require flexibilityto adapt where necessary and feasible, a ‘plan B’if possible and researchers need to maintainregular communication with donors/funders andstakeholders of the study, including the commu-nities in which they are operating. This will facilitateanticipation and adaptation to ensure that usefuland quality results can be obtained.
Mothers prepare maize, from thecommunity garden, to make nutritiousmeals for the children attending aSave the Children supportedpreschool in Zomba district, Malawi
Death of children with SAM diagnosed by WHZ orMUAC: Who are we missing? Summary of presentation1
By Michael H. Golden and Emmanuel Grellety
Michael Golden is aretired professor ofmedicine with 45years’ experience ofstudying all aspectsof malnutrition.
Location: Global
What we know: Both weight-for-height z-score (WHZ)and mid-upper arm circumference (MUAC) arerecommended to identify severely malnourishedchildren for treatment. MUAC has distinct advantagesfor community-level screening; however severalcountries have gone further to instigate MUAC-onlyadmissions for treatment.
What this article adds: A recent review examined theconsequences of excluding children with severe acutemalnutrition (SAM) identified using WHZ fromadmission to treatment programmes. Analysis ofindividual data from 14,935 children admitted to arange of treatment programmes over 22 years and aliterature review examined case fatality rates (CFR)with different indicators and caseload. Simpson’sparadox (mathematical coupling) results in reversal ofsignificance that affects interpretation of the relativemortality rates of WHZ and MUAC. The analysissuggests that children with SAM identified by WHZ <-3Z and admitted for treatment have as high a risk ofdeath as children in treatment with MUAC <115mm.Review of 21 datasets that compared WHZ and MUACmortality rates show problems with interpretation ofthe reported CFRs; inconsistencies greatly limitanalysis, comparability and interpretation. Caseload isa more important determinant of the number of SAM-related child deaths than the relative CFR to giveSAM-attributable deaths. Where most of the childrenare identified as SAM using WHZ rather than MUAC, itis estimated that fewer than half of all SAM-relateddeaths will be identified using a MUAC-onlyprogramme. Strong advocacy for the use of MUAC tomaximise coverage of treatment programmes hasdeveloped into MUAC-only programmes that areinadequately evidenced on the consequences ofexcluding WHZ cases. Urgent research is needed todevelop simple methods to identify children with lowWHZ at community level.
Emmanuel Grellety has spenthis whole working life withhumanitarian organisationsin many roles. He is now anepidemiologist working withEpicentre and is completinghis PhD.
We would like to thank Action Against Hunger forthe opportunity to present this extended abstractto the R4NUT conference, to the editors of ENN andthe reviewers of our submitted papers for veryhelpful comments on initial submissions, and tothe agencies that provided patient data for ourempirical study.
IntroductionAbout 19 million children are estimatedto have severe wasting, of whom abouthalf to one million die each year (Blacket al, 2013). These estimates were madeusing only weight-for-height z-score(WHZ) as the diagnostic criterion. Asdeaths related to a low mid-upper armcircumference (MUAC) were not takeninto consideration, the actual numberof deaths is much higher. This is because,of all the children with severe acutemalnutrition (SAM), only about 16.5 percent have both a WHZ (<-3Z) and aMUAC (<115mm) below the WorldHealth Organization (WHO) defined cri-teria for SAM; the remainder have SAMby either WHZ (45 per cent) or MUAC(39 per cent), but not both criteria (Grel-lety and Golden, 2016); the degree ofoverlap varies greatly by context. Basedon these figures, a MUAC-only pro-gramme would identify 55 per cent ofall SAM children and a WHZ-only pro-gramme 61 per cent. Although the risksof death may differ from place to placeand time to time, the actual number ofSAM related deaths depends on the rel-ative number of children fulfilling eachcriterion in the community, as well asthe case fatality rates (CFR); that is, boththe relative caseloads and mortality riskscombine to give the total number ofdeaths occurring due to SAM.
Because of its simplicity, ease of useand cheapness, absolute MUAC hasbeen readily taken up to screen for chil-dren with SAM in the community. WHOguidelines recommend the use of MUAC(and examination for bilateral pittingoedema) in children 6-59 months ofage at community level for early identi-fication and referral of children with
SAM for full assessment at a treatmentcentre (admission is then by MUAC orWHZ). However, many agencies and sev-eral national governments (e.g. Nigeria,South Sudan, Bangladesh) have gonefurther and ceased attempting to identifyand treat any children with SAM diag-nosed by WHZ. They have based thisupon repeated advocacy for MUAC-onlyprogrammes, justified by its simplicity,and reports purporting to show a uni-versally higher mortality risk for SAMidentified by MUAC (SAM-muac) thanSAM identified by WHZ (SAM-whz). Thelatter is based largely upon statisticalcomparison of ROC curves and the con-clusion that children with SAM diagnosedby WHZ, but not by MUAC, are at lowerrisk of death (en-net, 2015a; en-net,2015b; Briend et al, 2016). Our seriousconcerns regarding the consequencesof excluding SAM-whz children fromadmission to treatment programmesprompted this review, where we examinethe relative mortality rates from a largenumber of SAM children; appraise theliterature with consideration of the sta-tistics and methods used; and analysethe numbers of deaths likely to be missedif a MUAC-only policy were to be uni-versally adopted.
MethodsWe obtained individual data from 14,935children treated in inpatient facilities(IPF), 45,364 treated in outpatient treat-ment programmes (OTP) and 16,588 pa-tients initially admitted to supplementaryfeeding programmes (SFPs) as moderatelymalnourished but who, with the change
1 Presentation at the ACF Research for Nutrition Conference, Pavillon de L’Eau, 13th November, 2017. A video of the presentation can be found here: https://youtu.be/yIWjGG_S5YU
in diagnostic cut-off points and standards, wouldnow be reclassified as SAM. WHO 2006 criteriaand the presence or absence of oedema wereused to divide the children into seven groups,depending upon the various combinations of di-agnostic criteria (see footnote to Table 1 for ex-planation of six groups, plus kwashiorkor notshown). We conducted an exhaustive search ofthe literature to identify reports of children diag-nosed by WHZ or MUAC with the respective mor-tality rates. The papers were reviewed. We analysedthe effect of caseload using published prevalencedata and CFRs derived from our empirical data,the literature data and theoretical simulations.
ResultsEmpirical dataTable 1 shows the CFR of all the patients withSAM by diagnostic category. The CFR was higherfor those with marasmic SAM admitted with onlya low WHZ than for those with only a low MUAC.The children who had both diagnostic criteriahad a significantly higher CFR. When the childrenfulfilling both criteria are included in each of thediagnostic groups, the relative CFR of childrenadmitted by WHZ vs MUAC is reversed, so that itnow appears that MUAC-associated mortality ishigher than with WHZ. This is an example ofSimpson’s paradox (see illustration in Table 2),caused in this case by mathematical coupling(Tu et al, Archie Jr, 1981). Oedematous children
who had a low WHZ had a much higher CFR thanthose with a low MUAC; all CFRs were higher forSAM children with oedema than without oedema.Although the relative mortality was not quite re-versed when the children with both anthropo-metric deficits were considered, the differencewas considerably ameliorated.
When all the children’s data are consideredtogether, WHZ-related death rate was higher thanMUAC-related deaths; those who had both deficitshad about twice the CFR as those with a singleanthropometric deficit. When those with both alow WHZ and a low MUAC were included in theWHZ and MUAC data, the relative CFR is reversed.This demonstrates that inclusion of children withboth deficits into both the WHZ and the MUACgroup results in erroneous interpretation of therelative mortality rates.
Literature reviewWe retrieved 21 datasets that compared WHZand MUAC mortality rates. Table 3 shows theproblems with the interpretation of the reportedCFRs. Statistically, to get reliable results, the ex-pected deaths in each group should be at leastfive. The reports marked in brown had insufficientdeaths to make analyses of individual studies re-liable. Most of the “brown” studies had manymore children fulfilling the “both” category; asshown with the empirical data this also makes
the analyses reported by the authors subject tomathematical coupling and are thus unreliable.The reports marked in pink each suffer from thesame criticism by including individual childrenwith both SAM by WHZ and MUAC criteria intothe MUAC and WHZ groups; the analyses aretherefore flawed. Children fulfilling both criteriawould be identified with all screening strategiesand not excluded from treatment. The papersmarked in blue included oedematous children inthe analysis; as oedema greatly increases themortality risk, this confounding further increasesthe unreliability of the reports. The purple columnsindicate the papers which used obsolete standards.This affects the CFR because more stringentcriteria include more severely affected childrenin the cohort resulting in a higher CFR; less strin-gent criteria have the opposite effect, so that alower CFR is expected when less severely affectedchildren are considered to have SAM.
Figure 1 shows how the criteria used for WHZhave changed. For example, where Centers forDisease Control and Prevention (CDC) 2000 criteria2
are used, one expects a lower CFR than if WHO cri-teria are used. Similarly, where a MUAC cut-off of<110mm is used instead of the WHO recommendedcriterion of <115mm, a higher CFR is expected.There are three reports that use the same data.
Sub-groups Total Dead CFR Comparisons p# # %
MUAC v WHZ without oedemaM-muac 7,191 56 0.78 muac v whz 0.000 M-whz 16,530 332 2.01 muac v both 0.000 M-both 40,307 2,000 4.96 whz v both 0.000
MUAC v WHZ with and without oedemaM+K-muac 8,860 174 1.96 muac v whz 0.000 M+K-whz 17,618 501 2.84 muac v both 0.000 M+K-both 44,524 2,576 5.79 whz v both 00.000
WHZ refers to children with WHZ <-3Z and MUAC>115mm, MUAC refers to children with WHZ >-3Zand MUAC <115mm. “Both” refers to children with both a MUAC < 115mm and WHZ <-3Z. Theprefix “M” denotes marasmic children; prefix “K” denotes oedematous malnutrition (marasmickwashiorkor). “M+K” indicates children with either marasmus or oedema. The prefix “All” indicatesall the children who would be diagnosed with a MUAC-only programme; thus, “All-muac” isdefined as M-muac + M-both (or K-muac + K-both) and “All-whz” is defined as M-whz + M-both(or K-whz + K-both).
Two variables, X and Y, are shown with various CFRs and caseloads. When subjects with both deficitsare added to X and Y, the apparent CFR of X is ameliorated (A), reversed (B), or inappropriately shownto be superior (C); despite this, the total numbers of deaths that will be identified if X is used as thediagnostic parameter is always much less than with Y. Mathematical coupling always occurs where“one variable directly or indirectly contains the whole or part of another, and the two variables areanalysed using standard statistical techniques.” (Archie Jr, 1981)
Table 1 CFR of SAM children by diagnostic category andcombinations
Total dead CFR CFR X deaths Y deaths
# # % X/Y % %
Scenario A
X 500 0 0.0
Y 1500 30 0.2 0.0
Both X & Y 500 30 0.6
Total 2,500 60 2.4
All-X 1,000 30 0.3 50
All- Y 2,000 60 0.3 1.0 100
Scenario B
X 500 6 1.2
Y 1500 30 0.2 0.6
Both X & Y 500 30 0.6
Total 2,500 66 2.6
All- X 1,000 36 3.6 55
All- Y 2,000 60 0.3 1.2 91
Scenario C
X 500 10 0.2
Y 1500 30 0.2 1.0
Both X & Y 500 30 0.6
Total 2,500 70 2.8
All- X 1,000 40 0.4 57
All- Y 2,000 60 0.3 1.3 86
Table 2An illustration of the effect of mathematical couplingto create Simpson’s paradox
Report 16 has data for deaths with MUAC <115mmand National Center for Health Statistics (NCHS)criteria which shows a much higher CFR with WHZ;in report 17 the MUAC criterion has been reducedto the more stringent MUAC <110mm and theless stringent CDC 2000 criteria for WHZ, resultingin a reversal of the interpretation of the data sothat MUAC now appears to have a much highermortality rate. Report nine used WHO criteria andthere is a non-significant higher mortality in the
WHZ group. Reports that do not use the currentstandards cannot be appropriately interpretedand can give a biased impression when appliedfor identification of children by WHO standards.
The green columns did not include childrenin the usual age range. Two of the studies hadextremely short average observation periods (<4days), which raises the question of verificationbias and confounding by acute illness unrelatedto malnutrition (e.g. convulsions).
The papers are sufficiently problematic thatthey cannot be used to guide policy decisions.Statistical analysis is limited as outlined and mosthave included oedematous children, have toofew events, used obsolete standards or had acombination of these defects, which makes themindividually inadequate evidence on which topromote MUAC-only programmes. The resultsare in broad agreement with the empirical data.It is concluded that children with SAM by MUAC-
50 55 60 65 70 75 80 85
Wei
ght (
Kg)
Height (cm)
10
9
8
7
6
5
4
3
2
Figure 1The cut-off points for weight-for-height usingdifferent reference criteria
No Dataset dead dead dead both kwash diag diag Age time MUAC WHZ Both MUAC:WHZ
MUAC WHZ Both incl incl MUAC (mm) WHZ Range (m) d CFR CFR CFR χ2
21 Girum 2017 IPF both incl <70% ng ng 13 d 14.80 20.00 ns
Table 3 An overview of the literature comparing WHZ and MUAC SAM deaths
References are available on request from the authors. Brown = <5 expected events; pink = both MUAC and WHZ included; blue = oedematous malnutrition included; purple = obsolete standards; green = not 6-59 months age range; orange = low observation period; CFR = case fatality rate; ng = not given; IPF = inpatient facility; com = community; OTP = outpatient therapeutic programme
WHO WFH -3Z
CDC2000 -3Z
NCHS WFH 70%
NCHS WFH -3Z
A child's MUAC is measured in anutritional centre in Kalonda,Kasai Region, DRC, 2017
alone and WHZ-alone have about the same mortality risk andthat children with both deficits have approximately double therisk. The risks – low MUAC, low WHZ and oedema - appear to beadditive; they are not proxies for the same defect. Children witha WHZ <-3Z cannot be described as healthy or less at risk ofdeath than children with a MUAC <115mm.
Effect of caseloadIf there are 100 children with SAM by WHZ with a CFR of 10 percent and 50 children with SAM by MUAC with a CFR of 20 percent then, even though the CFR of the MUAC children is doublethe WHZ CFR, children from each group will have ten SAM-related deaths. As the relative caseload varies widely fromcountry to country, it is a more important determinant of thenumber of SAM-related child deaths than the relative CFR. Wehave taken the relative caseloads from Grellety and Golden(2016) and estimated the proportion of all SAM deaths thatwould be identified and admitted to a MUAC-only programme.We examine the effect of various estimates of CFR for childrenwith a WHZ <-3Z and MUAC <115mm, using 1) theoretical con-sideration where the CFR is half, the same or double that of thealternative diagnosis and those with both deficits having thesum of the CFRs; and 2) the CFRs derived from the empiricaldata and the published reports. The results are shown in Table4. The most likely scenario is given in theoretical simulation B,where the two defects have the same CFR and those with bothdefects have double the risk of death.
In the countries where most of the children are identified asSAM using WHZ rather than MUAC, most estimates indicatethat fewer than half of all SAM-related deaths will be identifiedin children admitted using a MUAC-only programme, and inmost countries only 75 per cent of deaths will be potentiallyaverted if WHZ ceases to be used to identify SAM children.
DiscussionOur analysis shows that children with SAM identified by WHZ <-3Z and admitted for treatment are at high risk of death; at leastas high as those with a low MUAC. In our opinion, the mostpressing research needed is to develop simple methods toidentify children with a low WHZ in the community, so thatthese children can be screened and treated. Some innovativemethods, based upon photographic technology, are on thehorizon and need to be properly funded. At the moment, thesechildren are being neglected and do not feature in MUAC-related statistics such as ‘coverage’ surveys. To deny that thesechildren are in need of treatment is unethical and in many coun-tries, MUAC-only programmes should not be implemented.
How have we got to this position? It appears to be due toseveral factors. First, failure to appreciate the effects of mathe-matical coupling and other confounders that are often severeenough to create a reversal of significance (Tu et al, 2008) – socalled Simpson’s, Lord’s and reversal paradoxes – that result inerroneous conclusions. Second, an exclusive focus on the relativerisk of death without consideration of caseload; the relative CFRis not as important as the absolute or relative numbers of SAMdeaths. Third, the strong advocacy for the use of MUAC tomaximise coverage of treatment programmes has developedinto MUAC-only programmes, despite little evidence on theconsequences of not admitting low WHZ in different contexts;and lastly, perhaps, due to confirmation bias (Kahneman, 2011;Haselton et al, 2009).
If we assume that there is about an equal mortality for WHZand MUAC-diagnosed SAM, and that those with both deficitshave twice the mortality, then it is possible to estimate thenumbers of SAM-related deaths that would be missed globally
Data Theoretical Empirical Literature reports A B C All 1-6 7-10
Table 5Estimation of the possible global deaths from SAM that wouldbe missed using a MUAC-only programme
All-WHZ is the range of global deaths estimated in the Lancet series based on analysis of the numbers of childrenwith SAM by WHZ <-3Z. To this is added the MUAC-only deaths based on the ratios found in Grellety and Golden(2016), using an equal mortality risk for WHZ <-3Z and MUAC <115mm and twice the mortality risk for childrenwith both deficits.
if MUAC-only programmes were to be imple-mented universally. The results are shown in Table5. Such a policy would result in between 300,000and 600,000 SAM deaths occurring in childreneach year who have no possibility of being treated.This is a very large number of children andsuggests that much more analysis should be un-dertaken in each context before recommendingMUAC-only policies.
This in no way should be construed as an attackon the widespread use of MUAC as an independentdiagnostic criterion and its merits in enablingscreening and increasing treatment coverage atcommunity level; our review reflects that it doesnot capture a considerable caseload of childrenwho are at risk in different contexts. It is an absoluteresearch priority to develop simple methods ofidentifying those children at equally high risk whoare currently omitted from MUAC-only programmes.
ReferencesArchie Jr JP. Mathematic coupling of data: a commonsource of error. Annals of surgery 1981; 193(3): 296.
Black RE, Victora CG, Walker SP, Bhutta ZA, Christian P,Onis M. Maternal and child undernutrition andoverweight in low-income and middle-income countries.Lancet 2013; 382.
Briend A, Alvarez J L, Avril N, Bahwere P, Bailey J,Berkley J A, Binns P, Blackwell N, Dale N, Deconinck H.Low mid-upper arm circumference identifies childrenwith a high risk of death who should be the prioritytarget for treatment. BMC Nutrition 2016; 2(1): 63.
en-net 2015a. Only MUAC for admission and discharge?Emergency Nutrition Network. www.en-net.org/question/1915.aspx
en-net 2015b. WFH versus MUAC. Emergency NutritionNetwork. www.en-net.org/question/1922.aspx
Grellety E, Golden MH. Weight-for-height and mid-upper-arm circumference should be used independentlyto diagnose acute malnutrition: policy implications.BMC Nutrition 2016; 2(1): 10.
Haselton MG, Bryant GA, Wilke A, Frederick DA,Galperin A, Frankenhuis WE, Moore T. Adaptiverationality: An evolutionary perspective on cognitivebias. Social Cognition 2009; 27(5): 733-763.
Kahneman D. Thinking, fast and slow. Macmillan, 2011.
Tu YK, Gunnell D, Gilthorpe MS. Simpson’s paradox,Lord’s paradox and Suppression Effects are the samephenomenon – the reversal paradox. Emerging Themesin Epidemiology 2008; 5(1): 2.
Tu YK, Maddick IH, Griffiths GS, Gilthorpe MS.Mathematical coupling can undermine the statisticalassessment of clinical research: illustration from thetreatment of guided tissue regeneration. Journal ofDentistry 32(2): 133-142.
WHO (2006). WHO child growth standards and theidentification of severe acute malnutrition in infants andchildren A Joint Statement by the World HealthOrganization and the United Nations Children’s Fund.
This is an extended abstract of three papers under peerreview, where the details are described in full. Whenthese papers are published they will be againhighlighted in Field Exchange.
In reviewing this article, the ENN editors posedseveral questions to Mike and Emmanuel tohelp our interpretation and understanding ofthe analysis. Both have kindly agreed to share
their feedback. Our questions related to: represen-tativeness of the empirical data analysed regardingextrapolation of risks of SAM-associated deathsidentified by different indicators in the communityat large; historical evolution of programme effec-tiveness with improvements in programming overthe period during which the data were collected;and impact of admission criteria on the profile ofchildren captured in the dataset (eds).
We have found an ascertainment bias in allthe patient studies, including our own, and mostof the community cohorts. This is demonstratedby the relative number of children with bothMUAC and WHZ deficits (which we call SAM-both) in the subjects analysed and in represen-tative community surveys. Children with SAM-both are more severely malnourished than mostof those in the community, but often dominatepatient cohorts; hence in-patient and communitycohorts are different. We separated SAM-muacand SAM-whz from SAM-both to ameliorate orremove this bias., By eliminating the SAM-bothchildren from the comparison, it is likely thatSAM-muac and SAM-whz are much more repre-sentative of the situation in the community thanwould have been the case if we had simply takenall SAM cases together. Because of this we hadto eliminate the majority of the children to havea fair comparison of the relative mortality rates.This also removes any bias from the mix of ad-missions to each facility (i.e. if they were mainlydiagnosed by MUAC or WHZ) and makes thisconsideration irrelevant to the analysis and results.Oedematous children also have to be analysedas a separate group as this is a major confounder.
It is often tacitly assumed that SAM in thecommunity is a fixed reference with which thepatients should then be compared, but this is notthe case. SAM in the community changes quitemarkedly with season, food security, economy,violence, epidemics, etc. If the whole communityis deteriorating, then the SAM cases that are ad-mitted will be in a worse state and vice versa.
The question we asked is not whether the chil-dren directly reflect SAM in the community, butwhether children with different degrees of severityof SAM who are diagnosed with either SAM-muacor SAM-whz have a different mortality risk. Wewere not attempting to compare SAM childrenwith non-SAM children, as many studies havedone, but only to compare SAM-muac with SAM-whz; these are quite different questions and requirea different study design. Each child with SAM-both could, of course, be counted as both SAM-muac and as SAM-whz – to get a fair comparisonof the difference in mortality between the two cri-teria, they cannot be compared with themselvesand appear in both groups being compared!
There are other biases inherent in all suchstudies. To address the co-morbidity bias, weseparated the children into those treated in IPFs,OTPs and SFCs on the basis that the severity andco-morbidity would be IPF > OTP > SFC. We thenlooked to see if the risk of death with SAM-whzvs SAM-muac was different in the groups withdifferent degrees of co-morbidity. Of course, thecase fatality rates were much higher in the IPFthan SFC (and SFC may be the same as the com-munity), but the risk of death was not differentbetween those with SAM-whz and SAM-muac inthe three modes of treatment; if anything, it washigher in the SAM-whz. The children in each in-dividual facility/programme of course got thesame treatment – it was not different in the SAM-whz and the SAM-muac children, so that thiscould not account for any difference in mortalityrisk. Comparison of the IPF, OTP and SFC children
also addresses any difference due to the ways ofidentification of the SAM children and any selectionbias that this causes. But there remain potentialco-morbidity biases remain when illness affectspredominantly different age groups; for example,birth weight, congenital abnormality, HIV and TBare other obvious confounders. Again, this islikely to be different in the three modes of treat-ment, but the extent of any difference by modeof treatment and their effect on the analysis isnot known.
The biggest problem is perhaps verificationbias. We do not know how many of the defaultingchildren died. This is a particular problem withOTP and SFC since the reported death rate isalways a minimum death rate as absent childrencould be alive or dead. Defaulting, transfer ofsick children, lost records, lost to follow-up, missingvariables, measurement errors, etc. affect all thestudies – including the community studies – andneed to be taken into account when judging thereliability of the data. We looked to see if therewas a difference in degree of this lost data betweenSAM-muac and SAM-whz. There were minor differ-ences that were inconsistent between SAM-muacand SAM-whz, but not in our opinion sufficientto bias the comparison of mortality from childrenwith MUAC <115mm and WHZ <-3Z. Adding thedefaulters to our data does not make a differenceto the results that SAM-whz has, in our datasets,a higher mortality risk than SAM-muac. Whenwe used various mortality risks (with SAM-muaceither more or less than SAM-whz mortality) withcommunity-based ratios of SAM-muac to SAM-whz with SAM-both factored in, we find a largepercentage of deaths would occur in childrenexcluded from treatment using a MUAC-only pro-gramme, so any bias in our empirical data doesnot alter this conclusion.
Impact evaluation of theLebanon multipurposecash assistanceprogrammeSummary of evaluation1
Location: LebanonWhat we know: Cash assistance is increasingly used in humanitarian response tocomplement in-kind assistance.
What this article adds: Multipurpose cash assistance (MCA) was used in Lebanonto support 20,000 refugee households in 2015, facilitated by the Lebanon CashConsortium (LCC). This study evaluated the impact of MCA at a six-month midlineon measures of food security, health, hygiene and housing by comparing householdsthat received cash versus similar households that did not. Findings showed that totalmonthly expenditures were on average 21 per cent higher in beneficiary comparedto non-beneficiary households (32 per cent higher on foods). LCC beneficiariesresorted less frequently to borrowing food or sending household members to eatelsewhere to meet consumption needs and were less reliant on debt for paying rent.Overall, LCC beneficiaries were found to be four times happier than non-beneficiaries, felt eight times more secure and had five times the sense of trust in thehost community. Beneficiaries were, however, under greater stress over financialissues (possibly due to a sense of precariousness and dependency on cash aid). Theauthors conclude that, in the absence of more durable alternatives for displacedSyrians, the LCC MCA continues to be a necessary and appropriate aid modality tohelp refugees meet their basic needs according to their household’s priorities.
Introduction Over one million Syrians now live in Lebanon asrefugees due to the crisis in Syria. Multipurposecash assistance (MCA) has been used extensivelyin the Lebanese context to meet refugees’ basicneeds, ranging from food, shelter, health and hy-giene, and other items according to their spendingpriorities. e Lebanon Cash Consortium (LCC)brings together six international non-governmentalorganisations (NGOs), including Save the Children(consortium lead), the International Rescue Com-mittee (monitoring, evaluation and research lead),Solidarités International, CARE, ACTED, andWorld Vision International. e mandate of theconsortium is to provide MCA to economicallyvulnerable Syrian households, whose eligibilityis determined based on the inter-agency proxymeans test (PMT) score that seeks to measureeconomic vulnerability. During 2015, 20,000households had been assisted with MCA out of25,000 that were found eligible. e remaining5,000 were not enrolled in the MCA programme,
reportedly due to lack of funding. is studyaimed to measure the impact of the MCA deliveredby LCC at a six-month midline of assistance onseveral proxies of physical and material wellbeing,encompassing food security, health, hygiene andhousing.
Methodology e study used a quasi-experimental design –regression discontinuity design (RDD) – to com-pare indicators of the physical and material well-being of households that received cash assistanceversus households who did not. e RDD canestablish the causal effect of an interventionwithout having to randomise those who willreceive cash assistance or not, which is consideredunethical in humanitarian programmes. In thisRDD study, the intervention and control house-holds were chosen in proximity of the PMT cut-off point. Hence, they are supposedly similarfrom a socio-economic and demographic per-spective, as if randomly chosen; the only assumeddifference is in the receipt of cash assistance. e
1 Lebanon Cash Consortium (LCC) Impact Evaluation of the Multipurpose Cash Assistance Programme, January 26, 2016.
study compared a group of 247 recipient and261 non-recipient households. Most households(76 per cent recipient and 77 per cent non-recip-ient) were male-headed, with an average age of39 years old. Households in the two groups werevery similar, except that non-recipient householdspossessed a greater variety of basic householdassets, were smaller in size and received a loweramount of cash assistance from sources otherthan the LCC.
FindingsOverall, findings show that LCC cash aid increasesrefugees’ consumption of living essentials, in-cluding food and gas for cooking. eir totalmonthly expenditures, which includes food, water,health, hygiene and other consumables, are onaverage 21 per cent higher than those of non-beneficiaries. In particular, LCC beneficiariesspend around 32 per cent more on food and 12per cent more on gas for cooking compared tonon-beneficiary households. Regarding food,LCC beneficiaries have a higher intake of dairyproducts and lower engagement in several copingstrategies related to a previous lack of money tobuy food. ey resort less frequently to borrowingfood and to sending household members to eatelsewhere to meet food needs.
LCC beneficiaries are also better off becausethey are less reliant on debt for paying their rent.Non-beneficiary households are 1.8 times morelikely than beneficiary households to borrowmoney to rent the place where they live.
LCC cash transfers make households’economies ‘healthier’; in fact, recipients are morelikely to count on work as their main source ofincome, as opposed to negative and unsustainablecoping strategies, such as debt, remittances, gisand sale of assets or food.
Overall, LCC beneficiaries were found to befour times happier than non-beneficiaries due tobeing able to meet their household’s basic needs.However, they are also under greater stress dueto financial issues, which may be a consequence
A child living in the Adams Informal TentedSettlement in Bar Alias, Bekaa Valley, Lebanon, 2017
of the sense of precariousness and dependencyon cash aid and awareness that assistance maybe discontinued. From a social cohesion per-spective, LCC beneficiaries feel eight times moresecure compared to non-beneficiaries. In addition,LCC cash assistance appears to increase theirsense of trust in the community hosting themfivefold.
e central question of this study was: did theLCC MCA programme help recipients in achievinghigher levels of physical and material wellbeing?e study findings show multiple positive outcomesof the programme, which is consistent with otherrandomised control trial and RDD studies onMCA; this supports the generalisation of these
findings. On the other hand, the size of the effectcannot be generalised beyond this PMT bandwidth,or for other amounts of MCA.
e authors cite two major methodologicallimitations of this study. Information collectedat baseline and midline was self-reported, henceof limited accuracy and reliability. In addition,the two groups were not entirely similar, whichviolates a core RDD assumption; although theanalysis addressed this issue, some degree of biasshould be expected.
The authors conclude that, in the absenceof more durable alternatives for Syrians in dis-placement (such as access to income-generation
opportunities) and despite the variety in assis-tance, the LCC MCA continues to be a necessaryand appropriate aid modality for helping refugeesin meeting their basic needs, in accordancewith households’ priorities. In fact, MCA isparticularly effective in addressing access barriersin situations where markets are functioningand products are more ‘elastic’ to demand in-crease, such as food items. In markets charac-terised by availability issues, MCA alone is noteffective. Specific interventions are neededwhich are aimed at strengthening services andexpanding delivery capacity and outreach inorder not to create disparities in the status ofaffected peoples.
Impact evaluation of a DFID programme toaccelerate improved nutrition for theextreme poor in Bangladesh Summary of evaluation1
Location: BangladeshWhat we know: There is little evidence of the impact of integrated livelihoods andnutrition programmes.
What this article adds: An evaluation measured the nutrition impact of adding anutrition-specific intervention, focusing on infant and young child feeding (IYCF)behaviour change communication (BCC); micronutrient supplementation; anddeworming via community nutrition workers (CNWs), into three existinglivelihoods programmes among the extreme poor in Bangladesh (2013-2015).Quantitative and qualitative baseline and endline data were used to comparelivelihoods plus nutrition (L+N) and livelihoods-only (L) interventions. There waslimited impact of L+N on mother/caregiver knowledge of and attitudes towardsIYCF, but large and significant positive change in knowledge of and attitudestowards iron consumption and supplementation. There were no significant impactson breastfeeding practices, child dietary diversity, meal frequency or consumption offood from animal sources, but some significant positive impact on complementaryfeeding practices and significant positive change in consumption of iron-rich andiron-fortified foods. No impact was found on child nutritional status (measured byheight-for-age z-score and weight-for-height z-score). Impact may be improved infuture through greater intensity and adaptability of CNW counselling (focusing oncontext-specific problem solving), multiple channels of BCC and empowerment ofmothers to have greater control over their time and practices.
1 Nisbett N, Longhurst R, Barnett I, Feruglio F, Gordon J, Hoddinott J et al. (2016) MQSUN Report: Impact evaluation of the DFID Programme to accelerate improved nutrition for the extreme poor in Bangladesh: Final Report.
BackgroundAlthough child undernutrition in Bangladeshhas fallen over the last two decades, its prevalenceremains high, affecting around one third ofinfants aged two and under, with the highestburden in extremely poor households concen-trated in remote and climate-vulnerable partsof the country. Sub-optimal infant and youngchild feeding practices (IYCF) have been iden-tified as a key driver for undernutrition in thisage group. e UK Department for InternationalDevelopment (DFID) aimed to improve nutritionoutcomes for young children, pregnant and lac-tating women (PLW) and adolescent girls through
the integration of nutrition-specific interventionsinto three existing livelihoods programmes forextremely poor households in Bangladesh (de-scribed in Box 1). ere is currently little researchthat directly assesses the impact of integratedlivelihoods and nutrition programmes comparedto livelihoods support alone. To help fill thisgap, DFID commissioned a mixed-method eval-uation to assess the impact of all three integratedprogrammes on nutritional status.
All three programmes introduced a set ofcomplementary, nutrition-specific interventionsfrom 2013 to 2015 targeting all PLW, adolescent
girls and children under five years of age. Com-ponents delivered via community nutrition work-ers (CNWs) were behaviour change communi-cation (BCC) during monthly household visitsand community-level discussions; micronutrientsupplementation (micronutrient powders forchildren aged 7-23 months and iron and folicacid (IFA) supplements for PLW and adolescentgirls); and deworming (for children age 12 to 60months and adolescent girls).
Methods e evaluation used quantitative and qualitativemethods to assess the impact of the combinednutrition-specific and livelihoods interventions(L+N) across the three programmes on knowl-edge and practices of mothers and caregiversand the nutritional status of children under twoyears old, compared to existing livelihoods in-terventions with no nutrition component (Lonly) (describing the nutrition intervention as‘N’ and no intervention as ‘control’). e quan-titative evaluation was undertaken at baseline(2013) and endline (2015) and qualitative eval-uations were carried out at the beginning of2014 and end of 2015.
Results Mother’s knowledge and attitudesand IYCF e impact of L+N on caregiver IYCF knowledgeand attitude was limited, except for iron, wherethere was a large and highly statistically significantpositive change in knowledge of and attitudesto iron consumption and iron supplementation(about 8-9 percentage point increases in CLP
Chars2 Livelihood Programme (CLP) aims toimprove the livelihoods and food security ofextremely poor and vulnerable char dwellersthrough infrastructure improvement, transferof productive assets (cows and goats) andshort-term social protection (cash stipends).The CLP delivered assets to approximately312,000 people between 2010 and 2016.
Economic Empowerment of the Poorest (EEP)Concern supports one million extremely poorpeople in rural and urban areas via non-governmental organisations (NGOs) throughinput support and technology transfer forlivelihoods (including guidance on cropping,livestock, fishing, bamboo working, smallbusiness and tailoring); capacity-building(through self-help groups, community-basedorganisations (CBOs) and links with localgovernment); support for innovation; and linksto markets and/or value chains.
Urban Partnership for Poverty Reduction (UPPR)aims to improve the livelihoods of three millionextremely poor people living in urban areasthrough creation of community developmentcommittees (CDCs), which then propose theirchoice of livelihood support from a package ofinterventions (such as habitat and settlementimprovement, improving incomes and assets,support for urban food production, smallbusiness management, support for education,community banking and enhancing socialdevelopment and protection).
Box 1 Description of the three DFID-supported livelihoods programmes
2 “Chars”, which are home to over five million people in Bangladesh, are riverine sand and silt landmasses that are highly vulnerable to sudden and forceful flooding as well as erosion and loss of land, which makes living in them hazardous and insecure.
and EEP Concern). Regarding appropriate breast-feeding and complementary feeding practices,there was modest scope for improvement sincematernal knowledge was already relatively highfor both groups at the outset. ere was a lackof awareness of the dangers of not followingrecommended practices and the importance offollowing optimal IYCF practices in special cir-cumstances (such as aer a caesarean section).
Nutrition practices ere were no significant impacts on breastfeedingpractices in any of the three programmes, althoughin UPPR there were borderline significant positiveeffects on exclusive breastfeeding and predominantbreastfeeding. In EEP Concern, where introductionof water and other liquids before the age of sixmonths was most common, adding the N inter-ventions caused a significant reduction in thesepractices (reducing giving water and other liquidsto infants under six months old by 11 percentagepoints and 12 percentage points respectively).
L+N resulted in significant positive behaviourchange in iron intake; across the CLP and UPPRprogrammes there were significant increases inthe consumption of iron-rich and iron-fortifiedfoods (13 percentage points and 12 percentagepoints respectively) and a borderline significantincrease of 12 percentage points in EEP Concern.
None of the programmes had significant im-pacts on dietary diversity (DD) of the child,meal frequency, or consumption of food fromanimal sources.
Barriers to behaviour change included lackof financial resources, lack of time to preparerecommended foods, fear of food wastage,household taste and wider social food prefer-ences, limited influence of mothers on householddecision-making, and deeply rooted, context-specific IYCF beliefs. In terms of women’s status,results showed that the nutrition componentdid not have an additional impact on women’sinvolvement in spending decisions within thehousehold over and above the livelihoods com-ponent (discussed below). However, qualitativedata suggests that including mothers-in-law(the main decision-makers in child feeding andfood choices) in nutrition counselling may havehad some positive impact on decisions madeabout child feeding care practices.
Overall, results suggest that investing morein the CNWs does have the potential to achievegreater improvements in certain individual be-haviours. However, practices only changed whenthere was no requirement for significant in-vestment of new time or resources by mothersand other caregivers.
Child nutritional status e core measure of child nutritional statusused was height-for-age z-score (HAZ), on theassumption that large changes in IYCF practicesover a prolonged period or in a mother’s dietduring pregnancy could reduce levels of stunting.is was an ambitious goal over a two-year pe-riod. e endline survey included children aged6-24 months, all of whom would have been ex-posed to the N interventions throughout theircritical first 1,000 days (including prenatallyfor most). Results showed no significant impacton HAZ, weight-for-height z-score (WHZ),stunting prevalence or wasting prevalence. It isnot known if mother’s knowledge and use ofiron supplements had any impact on child ironstatus, as this was not measured. is may beexplained by the infrequent contact with CNWs,with little time during visits to discuss importantnutrition messages, particularly for comple-mentary feeding.
Given the importance of complementaryfeeding and the inclusion of animal-sourcefoods in the diet for linear growth, it is not sur-prising that there were no significant impactson anthropometry via this pathway. ere wasalso limited evidence for alternative potentialpathways for anthropometry impacts via, forexample, reductions in open defecation.
Awareness of undernutrition improvedamong beneficiaries in the L+N programmes,with people being more conscious of the signsand ill effects of undernutrition; however, un-dernutrition was still perceived as ‘normal’ andpreventing and addressing it did not become apriority for poor households.
Impact of the livelihoodsinterventions Only qualitative data were available for CLPand EEP Concern programmes due to a lack ofappropriate control groups. e overall perceivedbenefits of participating in these two programmes
(L versus no intervention) were substantial, al-though perceived direct economic benefits wererelatively small in some cases. Additional incomewas used to improve overall living standardsand pay off debts. In the UPPR programme itwas difficult to attribute changes to the pro-gramme itself, as households also received awide range of benefits from other NGOs. SomeUPPR-beneficiary households described howthey used programme support to transformtheir assets, diversify their income and improvetheir overall economic wellbeing. Others usedUPPR grants to start a business or renovatetheir house but did not report experiencingany long-term economic improvements.
Quantitative results in the UPPR programmeshowed no significant impacts on either householdDD or mothers’ BMI in either L or L+N. erewere also no meaningful impacts on practicesrelated to breastfeeding or the introduction ofother liquids and solids and the L componentsalone had no impact on complementary feeding.On access to sanitary latrines, there were no sta-tistically significant impacts from either L orL+N. In terms of women’s status, there was nosignificant impact from L-only or L+N on theproportion of mothers reporting that they par-ticipate either solely or jointly in decision-makingon household expenditure (including on foodand health), and no significant impact on theproportion of mothers reporting that they nowcontrolled funds needed to purchase items them-selves. ere was, however, a small but statisticallysignificant increase in women having a voice indecisions regarding where they could go alone.ere were no significant impacts on anthropo-metric outcomes from L or L+N interventions.In the UPPR programme it appears that L+Nhouseholds could not readily act on the advicethey had been given by CNWs, because they didnot have the funds or resources to do so.
Conclusion and recommendations Results of the evaluation are sobering due to thelack of improvement in child anthropometry andthe sparse improvements in IYCF knowledgeand practices. However, the results give a clearpicture of the barriers and enablers to successfulprogress along the impact pathway, which mayinform future design and implementation.
e authors recommend greater intensity andadaptability of CNW practice to deliver realchange (including a focus on context-appropriateproblem solving), multiple channels of BCC and,to ensure that the most beneficial IYCF practicesare adopted, a revised L+N intervention that si-multaneously delivers this improved BCC, along-side measures to empower mothers (includinggreater control over their time and practices andchanges in wider community norms and beliefsaround IYCF and mothers’ control).
Devon Jaffe-Urell is a Research Fellowwith Save the Children and a recentgraduate of the London School ofHygiene and Tropical Medicine (LSHTM)with a MSc in Nutrition for Global Health.She previously worked with Save theChildren in Rwanda, Haiti and Laos.
Bernard Chigaya is a communitydevelopment specialist with experiencecapacity building with communities andin data collection, analysis, transcribingand report writing.
Alexander Kamesu Mwangonde is theSchool Health and Nutrition Coordinatorfor Save the Children Malawi. He hassubstantial in country health; water,sanitation and hygiene (WASH) andcommunity maternal and child healthprogrammes in Malawi.
Victor Kadzinje works for Save theChildren Malawi, coordinating a malariacontrol programme and has greatexperience in health systemsstrengthening, delivery and communitymobilisation.
Paul Nguluwe works for Save the ChildrenMalawi on malaria control in schools, earlychildhood development and nutrition.Paul has a broad knowledge andexperience in implementing Rights BasedApproaches (RBA) with emphasis on issuesof gender diversity and human rights.
Edward Joy is a Research Fellow inNutrition and Sustainability at LSHTM. Hisresearch focuses on micronutrientdynamics in agricultural and food systemsin countries including Ethiopia andMalawi.
Helen Moestue is a School Health andNutrition Advisor for Save the ChildrenUS, based in Oslo, supporting projectsusing schools and pre-schools as nutritionplatforms. She has an MSc and PhD fromLSHTM and previously worked for UNICEFand other agencies on integrated healthand protection projects for children.
By Devon Jaffe-Urell, Bernard Chigaya, Alexander Mwangonde, Victor Kadzinje, Paul Nguluwe, Edward Joy and Helen Moestue
Location: Malawi What we know: School meal provision is a common mechanism to tryto reduce malnutrition rates in children while improve schoolattendance rates.
What this article adds: In collaboration with Malawi’s Ministry ofEducation, Science and Technology and Ministry of Agriculture, Savethe Children has piloted a home-grown school-feeding programme inprimary schools in southern Malawi since 2015. Currently operationalin 17 schools, a community garden provides crops that are prepared bymothers/volunteers and managed by head teachers/parent committees.A small qualitative study perceived costs and benefits of the approach,as well as the feasibility, acceptability and potential sustainability of theprogramme. The intervention was well received; key informants/focusgroups reported positive impacts on child hunger and school attendancewhen meals were available. However, general food insecurity anddrought negatively affected garden outputs and school attendance.Operational challenges that impacted delivery included challengessecuring land for gardens, delayed seeds supply, inadequatecooking/feeding equipment, inconsistent training of school committeesand poor nutritional quality of school meals. Availability of maizeporridge varied in practice (ranging from approximately six weeks tothree months rather than all year round) and placed considerabledemands on mothers to prepare. Wider learning by Save the Children isunderway with other experienced partners in Malawi to examine thefeasibility, acceptability and potential sustainability of this approach.
Save the Children Malawi
Context Malawi has one of the highest rates ofchronic malnutrition in the world, ranking73 out of 104 countries on the GlobalHunger Index, with 37 per cent of childrenaged six to 59 months moderately or se-verely stunted. e Government of Malawihas recently emphasised school meal pro-vision as an important mechanism forboth reducing malnutrition rates in chil-dren and improving school attendancerates. In particular, home-grown school-feeding programmes (HGSF), which utiliselocally produced and purchased foods to
link agricultural production with schoolmeal provision, simultaneously supportseveral of Malawi’s national targets fornutrition, food security, education andchild development.
School-feeding programmes are cur-rently implemented in Malawi across allregions, with the World Food Programme(WFP) and GIZ as the most prominentactors in the HGSF approach. Growingevidence in country suggests that school-feeding programmes can reduce the preva-lence of both stunting and underweightin primary school children, while im-
Learners at Mpata primary school eatingporridge during break time, 2017
How do low-cost,home-grownschool-feedingprogrammes work?Lessons learnedfrom Malawi
Field Articles.....................................................
proving school attendance rates across all gradesand reducing food insecurity. However, recentclimactic shocks across Malawi, most notablydrought conditions, have dramatically affectedagricultural production; as a result, 6.7 millionpeople across the country required humanitarianassistance in 2016-17. Effective methods mustbe identified to mitigate the effects of theseshocks and build the resilience of the poorestMalawians to withstand inevitable climatic shocksin future.
The Home-Grown SchoolFeeding programme Historye Government of Malawi has emphasised theprovision of school meals to learners, particularlyvia approaches that ensure local communityparticipation in the production, delivery andpreparation of school meals. In 2009, the Ministryof Education, Science and Technology (MoEST)– along with the Ministries of Health (MoH)and Agriculture (MoA) – established the De-partment of School Health and Nutrition(DSHN). e ministries also launched a jointNational School Health and Nutrition StrategicPlan and guidelines for its implementationthrough to 2018.
Recently, the Government of Malawi coor-dinated and integrated various social supportprogrammes through the new Malawi NationalSocial Support Programme II (MNSSP II),which includes the school meals programme.As the custodian of School Health and Nutrition(SHN) policy, the MoEST oversees all HGSFactivities, while the MoA and MoH providetechnical expertise on farming and nutrition,respectively. As a member of the SHN NationalTechnical Working Group, Save the Children(SC) has collaborated on the development ofthe MNSSP II; guidelines around best practicesare currently under development. At the districtlevel, SC has been collaborating with the DSHNand other departments since beginning its widersponsorship-funded SHN programming inZomba in 2008.
Initially introduced in 13 primary schoolsin Zomba District in 2013/14 and as part of anintegrated SHN programme, SC’s HGSF approachhas now been scaled up to operate in 17 schools,benefiting approximately 8,600 children. In col-laboration with the three ministries, SC aims tocontinue scaling up the HGSF programme withinits impact area. SC and the ministries will thenexplore the potential of advocating for the scale-up of HGSF in schools nationwide.
Programme approachSC works directly with school personnel re-sponsible for management of the HGSF pro-gramme – namely the head teacher of eachschool and parent/teacher committees – to pro-vide financial assistance on training, supervisionand monitoring. Garden inputs are provided bythe MoA; inputs typically include maize seedsto provide the staple porridge, plus either soyaor pigeon pea seeds to bolster the meals’ nutri-tional profile.
e programme centres on a communitygarden located on or around each school’scampus. Fertile land is identified by the schoolsthemselves and is either rented from or donatedby local communities. Under the oversight ofhead teachers, delegated school staff andparent/teacher committees, crops are grown andharvested communally, stored until the leanseason, and finally prepared as the mid-daymeal for students by community volunteers. Ofnote, student participation in the managementof school gardens varies by school; some schoolsutilise the gardens as a staging ground for lessonsand practical sessions on agriculture and health,while others do not.
Study methodologyIn collaboration with the London School of Hy-giene and Tropical Medicine (LSHTM), SC un-dertook a small qualitative study in 2017 to ex-plore the perceived costs and benefits of the ap-proach, its feasibility, acceptability and potentialsustainability. is sponsorship-funded studywas undertaken to contribute to SC’s efforts tobuild evidence on effective programming forchildren. Nine of the 17 pilot schools wereselected to participate in the study through amix of purposive and random sampling toensure representation of all seven districts acrossZomba. Study participants included male andfemale students, community and parent com-mittee members engaged in the programmeand head teachers. In total, nine focus groupdiscussions and nine key informant interviewswere conducted across all sample schools. Ad-ditionally, observations were made at each schoolto assess garden location and size, and kitchen,latrine and crop storage facilities. Interviewswere also conducted with local experts in HGSF,including representatives from the governmentand non-governmental organisation sectors.ematic analysis was performed to identifykey themes; results have been shared and validatedwith partners at district and national level.
FindingsAlthough the primary objective of the studywas an analysis of beneficiaries’ perspectives onthe HGSF programme, school visits included
Field Article
Theme Sub-theme Details
Duration 13 pilot schools
4 additional schools
3 years in HGSF programme
1 year in HGSF programme
Location Southern Malawi 7 zones across Zomba District
Inputs Seeds
Fertiliser
Provided annually by MoA duringgrowing season
Outputs Meals per week
Meal content
Averaged 3 times per week for 3 monthsduring lean season Averaged 3 times perweek for 3 months during lean season
Maize porridge only at 4 out of 9 schoolsMaize porridge + soya/pigeon pea
supplement at 5 out of 9 schools
Beneficiaries Student enrolment 8,012 students at time of data collection
Table 1Summary of the HGSF programme funded by Save the Children inSouthern Malawi
qualitative data collection through observationsand direct conversations with head teachers. Assummarised in Table 1, operational activities atthe sample schools varied. Of the nine schoolsassessed, three had gardens located on campus,while five rented land from local communitiesand one received community land by donation.Identifying viable land for a garden is the re-sponsibility of school staff and parent/teachercommittees; however, beneficiaries cited landissues as a key challenge of the programme asnew land oen had to be identified each yeardue to community politics and land scarcity re-sulting from overpopulation in the region. No-tably, liaising with community chiefs was iden-tified as a critical component of the programme’ssustainability in order to garner buy-in andgenerate community support.
Inputs from the MoA, distributed via SC,included fertiliser and maize seeds, the quantityof which was determined by school size. For in-stance, a school of approximately 800 studentsreceived a one-time delivery of 100kg of fertiliserand 10kg of maize seeds. Pigeon peas or soyaseeds were also included in farm inputs; thetype of supplemental crop varied by year, basedon the Ministry’s selection.
Crop outputs Although inputs were generally quite uniformacross sample schools, crop output generatedby the school gardens varied widely and werehugely affected by the droughts and floods ofrecent years. Outputs from the 2016-17 harvestaveraged 23 bags of maize per school, rangingfrom three to 49 bags. During the 2015-2016season characterised by drought, outputs rangedfrom just one to seven bags of maize per school.Production from the supplemental seeds wasminimal, with five of nine schools harvestingone to two bags of either pigeon peas or soya.As such, school meals generated by the HGSFprogramme consisted of maize-based porridgesupplemented with peas or soya for these fiveschools only.
Meal provision Insufficient garden outputs resulted in fewer mealsprovided than projected, cited as a critical challenge
of the HGSF programme by most beneficiariesinterviewed. Although meals were provided duringthe lean season in an effort to lessen critical foodinsecurity among communities in the region,schools were able to provide meals for a maximumof four months per year and a minimum of justone week. Outside the HGSF programme, nomeals were provided at any of the sample schools.Issues related to school committee organisationand management of the programme contributedto the challenge of consistent meal distribution,as did school capacity for operating the programmethroughout the year. Garden management andmeal preparation are performed by communityvolunteers, the majority of whom are women. Arecent government mandate to serve all schoolmeals prior to the first class of the day exacerbatedthe time burden associated with the programmeas volunteers had to neglect home duties in orderto arrive on campus early in the morning toprepare the porridge.
TrainingTo bolster school capacity and community own-ership of the HGSF programme, SC aimed toprovide annual training for each school on op-erations, garden management and meal prepa-ration techniques. Based on self-report, somerespondents had never received training, whileothers were trained more than once a year.However, several challenges were noted here:firstly, some recipients may have confused SClearning/observational visits with provision oftraining; secondly, trainings did not alwaystarget all committee members at a given schooldue to funding constraints; and thirdly, turnoveramong committee members meant replacementstended to miss the annual training. Given thehigh turnover of school staff and committeemembers in charge of the programme, morefrequent trainings were cited by beneficiaries asan area for improvement. Furthermore, trainingswere noted to be lacking in proper hygienepractices, modern agricultural techniques tohelp sustain drought conditions and porridgepreparation in mass quantity.
Kitchens By programme design, schools erected kitchenson their own; however, only four of the nine
sample schools had an established kitchen areaat the time of evaluation. Committee membersand students contributed kitchenware items tothe programme, including pots and cups. Studentsidentified this as a key challenge as bringingcups from home was not possible for many;others experienced negative reactions from par-ents when cups were lost, broken or stolen.
Programme successes Increased school attendance/reducedabsenteeism Overall, the HGSF programme was receivedpositively by beneficiaries and other stakeholdersalike. Most participants cited increased schoolenrolment as the primary success of the HGSFprogramme, noting enhanced student perform-ance as a benefit of efforts to reduce hunger.Head teachers universally noted improved ab-senteeism following implementation of the pro-gramme, with attendance rates fluctuating inaccordance with meal provision. Introductionof the HGSF approach generated enthusiasmamong community members, primarily due toits impact on school attendance. Several membersof various parent/teacher committees notedlonger-term results of the programme; as onePTA leader stated, “We were very excited tohear that the school feeding programme wasbeing introduced here. is helped us drawback the children who went into early marriages,to bring them back to school.”
at said, absenteeism was seen by informantsto increase in line with at-home food insecurity,thereby reducing positive impacts associatedwith the HGSF programme. During the 2015-16 drought, lower crop yields were experiencedat both home and school gardens. Beneficiariesnoted reduced attendance rates during this timeas students felt too hungry to attend school orsought jobs as far reaching as Mozambique andSouth Africa. Evidently, the positive effect onabsenteeism was conditional upon a minimumdegree of food security in the beneficiary house-holds. Nonetheless, the provision of school mealswas oen cited as playing a role in reducingfood insecurity at home by ensuring that onemeal was consumed outside the household. Lim-ited parental contribution to the programme
A head teacher at Milola primaryschool admiries a maize crop inthe school garden, 2017
Save the Children Malaw
i
and reliance on food aid were also highlightedas key consequences of volatile weather patterns.
Community sensitisation Of nine key informant interviews with headteachers, six cited community sensitisation as amethod of improving knowledge of and partic-ipation in the programme. Direct engagementof village chiefs in the programme was noted asa key driver of the programme’s success. esefindings are supported by other studies conductedacross sub-Saharan Africa by the World FoodProgramme (WFP), the Partnership for ChildDevelopment and others; sensitisation campaignsto support community involvement and devel-opment have supported HGSF interventions asa tool in transitioning to nationally-ownedschool-feeding programmes. Building commu-nity-level capacity has been recognised as criticalto strengthening community ownership, whichsustainably improves HGSF service provision.
Programme challenges Study participants cited two key weaknesses ofthe current approach: insufficient farm inputs,namely seeds, resulting in reduced garden outputs(i.e. maize production), and poor nutritionalquality of school meals. Related to this, unstableweather patterns were noted by beneficiariesand experts alike as an external threat to theprogramme’s success. Parent and committeemembers felt that their inadequate knowledgebase regarding more sustainable, modern agri-cultural practices inhibited their ability to manageand operate the programme to its full potential.Furthermore, consistent and reliable access toland on which to operate school gardens wascited as a major challenge and clear barrier tothe sustainability of the programme.
On a broader scale, differing priorities ofthe three government ministries involved in theprogramme created a challenge for the coordi-nation of HGSF implementation. e MoA isinclined to serve the general community ratherthan a specific focus on schools; in contrast, theMoEST’s mandate is directed towards improvingeducation outcomes over health.
Insufficient farm inputs e untimely delivery of farm inputs in syncwith the growing season was routinely cited asa barrier to community participation in theprogramme, further reducing the potential forexpected production. Specifically, head teachersand committee members at six of nine schoolsexperienced delays in the delivery of seedsand/or fertiliser; late delivery coincided withthe onset of the rainy season, which subsequentlydamaged crops. SC’s role in programme imple-mentation was limited to mobilisation of schoolsand communities to initiate and manage theprogramme, with farm inputs selected and pro-vided by the MoA. However, beneficiaries’ neg-ative experience of the quantity, diversity andtiming of input delivery was attributed to SC,not to the government. is knowledge gappoints to insufficient training of beneficiariesor deficiencies in programme implementationsince, per design, the HGSF approach is intended
to be community-owned and managed. us,receipt of farm inputs – primarily maize seedsin this case – is critical to the functionality andlongevity of the programme.
Insufficient land Challenges in acquiring and sustaining sufficientland for gardens was referenced by beneficiariesat all nine schools. Per programme design, gar-dens are intended to be located on campus;however, six of nine schools currently rent landfrom local communities. Barriers to successfulgarden management and production includedthe of seedlings and crops, change in rentalagreements and distance from school and com-munity. As highlighted by a member of theMoEST, acquisition of permanent land is a keychallenge: “In Zomba to be specific, there areissues to do with land for the schools. At times,they identify a piece of land this year wherethey can pay and rent, and the next year theowner says, ‘No, I would like to do whatever Iwant with this land; go find another piece’.”
Time burden School staff and committees alike noted thetime burden associated with managing and op-erating the HGSF programme. In particular, fe-male community volunteers tasked with preparingthe daily porridge were challenged by managingthe time required at school with their own tasksat home. Although notably supportive of theprogramme, some volunteers interviewed high-lighted the time associated with managing foodpreparation as a critical challenge. For instance,insufficient kitchen pots and utensils requiredvolunteers to take turns preparing porridge asstocks were not enough to feed a full studentpopulation.
Poor nutritional quality of schoolmeals Most beneficiaries found the maize-based por-ridge provided to be of poor nutritional quality;many interviewed felt that improving the pro-gramme’s impact would require more nutrient-rich meals. School committee members cited
lack of training as a barrier to the provision ofmore nutritious meals: “ose who prepare theporridge ... need to be trained on how to makea hygienic and nutritious porridge.”
Lessons learnedSC’s HGSF approach is a low-cost model withthe potential to be a sustainable method of re-ducing food insecurity and improving educa-tional outcomes. While no cost analysis hasbeen conducted to date, key financial and op-portunity costs include training for SC, volun-teers’ time for communities, and seeds and fer-tiliser for government (the latter is already in-cluded in the national budget).
However, as detailed, several operationalchallenges were identified. Based on the find-ings outlined here, considerations for scale-upor future programmes include the need formore frequent trainings to educate communi-ties on programme management and execu-tion, provide nutrition education and enhancelocal-level stakeholder collaboration. Efforts toimprove nutritional quality of porridge shouldalso be considered, which should inform farminputs selected for distribution to school gar-dens. In addition, the number of farm inputsshould match enrolment and be delivered intime with the planting/harvest cycle. At astrategic level, successful programme imple-mentation and scale-up require enhanced andstreamlined collaboration among partners –including government ministries – from theplanning stage.
Going forward, a task force comprising allpartners will be established to determine nextsteps for the HGSF programme, including po-tential adaptations of the current approach tostrengthen nutrition education, utilise morediverse seeds selection as farm inputs and, po-tentially, a narrower focus on schools with themost capacity to adopt the programme. As SCawaits feedback from the Government, con-crete plans for future research are not yet un-derway; however, a larger quantitative study is
necessary to assess the nutritional impact ofthe programme.
Criteria for successAs an agriculture-based, community-led pro-gramme, the HGSF approach is reliant on cer-tain conditions to be successful. As unpackedby this study and experienced by other organi-sations engaged in HGSF approaches in theMalawi context – principally GIZ – these crite-ria include: • School access to land for garden and ade
quate water source, both for irrigation and drinking;
• Engaged head teacher, school staff and community members, including community chiefs;
• Integration into existing national strategies and social protection systems addressing hunger and malnutrition; and
• Ability to complement existing basic health interventions, including sanitation facilitiesand hygiene approaches.
Conclusion ese findings illustrate that SC’s HGSF ap-proach is well received by beneficiaries andcan reduce absenteeism in primary schools.is low-cost, community-based approach ispotentially replicable and sustainable. Howev-er, continuation and scale-up of the interven-tion may be inhibited by poor coordinationamong stakeholders, insufficient capacity ofsome communities to manage the programmeand the impact of volatile weather patterns oncrop production. SC is continuing to examinethe evidence generated by this study andreaching out to partners and other experi-enced organisations – including WFP and GIZ– to share and learn from best practices. Ad-dressing these challenges will be critical to theacceptability, sustainability and expansion ofthe HGSF programme across Zomba and else-where in Malawi.
Kevin Mackey is theProgramme Developmentand Quality AssuranceDirector for World VisionSomalia, where he hasheld a number ofoperational, programmatic
and quality assurance roles over the last tenyears. Prior to this he participated in thedesign, implementation and monitoring ofprojects across the entire spectrum ofhumanitarian response.
Sirya Ezekiel Kiptum is theHealth and NutritionSector Lead for WorldVision Somalia. He is apublic health specialistwith over 15 years’experience of managing
health and nutrition programmes indevelopment and fragile contexts, including inKenya, Uganda, South Sudan, Ethiopia andSomalia.
Health systemsstrengtheningin fragilecontexts: Apartnershipmodel in SouthWest State,Somalia
Location: Somalia What we know: Delivery of health services by the Ministry of Health (MoH) inSomalia is heavily dependent on international and local non-governmentalorganisations and United Nations agencies.
What this article adds: In 2015 World Vision (WV), funded by Global Affairs Canada,implemented a new, two-year model of partnership for the delivery of health andnutrition services directly through the MoH for South West State (SWS). This focusedon strengthening human resources for health; health financing and resourcemobilisation; governance and leadership (management); supplies of medical products;and quality service delivery. A WV/MoH-SWS memorandum of understanding(MoU) guided the process and government capacity, categorised within a WVpartnership framework. A task force oversaw developments. The single-donor pilotproject created 54 new staff positions in the MoH-SWS; this has grown to 233 staffwith multiple donors and expanded facility/health post/mobile clinic coverage. Keysuccess factors included building community trust in government-led services,strengthened medical supplies management, development of a capacity-developmentplan with regular mentoring and follow-up that included financial systems andcontrols, and support to the regional health service. The MoH has demonstratedsignificant progress and signs of leadership through this support; external resourcesand capacity are still needed to meet health and nutrition needs. Emergency, short-term funding continues to dominate; longer-term (development) funding streams areneeded to sustain health systems strengthening in fragile contexts.
Background Since the collapse of the Siad Barre-led govern-ment over 25 years ago, the health sector in So-malia has faced almost total collapse. us,health services are delivered predominantlythrough local non-governmental organisations(LNGOs), supported by international non-gov-ernmental organisations (INGOs) and UnitedNations (UN) agencies, with the Ministry ofHealth (MoH) providing leadership and strategicdirection to local health facilities. However, theMoH is very weak in most states/districts in So-malia and non-existent in Al Shabaab-controlledareas due to lack of access.
Since 2006 World Vision (WV) has supportedthe development of the National TuberculosisProgramme (NTP), helping it deliver on its man-date to develop policy and monitor tuberculosisprogramming in Somaliland, Puntland andsouthern Somalia. Drawing on lessons learnedfrom such capacity-development efforts withgov¬ernment entities and other civil societyactors, WV expanded the scope of its partneringefforts in 2011, putting in place policies and op-erational structures and developing methodologiesto deepen engagement with LNGO partners insouthern Somalia. e emerging governance en-vironment created opportunities to leverage thisexperience to modify the existing LNGO part-nering approach to work with the nascent MoHfor South West State (SWS). In May 2015 WV,with the support of the humanitarian fund ofGlobal Affairs Canada (GAC), undertook a one-year pilot of a new model of partnership for thedelivery of health and nutrition services directlythrough the MoH – the first time this approachhad been used in the state. Funding from theGAC was then renewed annually, based on per-formance. e partnership focused on strength-
ening the following pillars of the health system:human resource for health; health financing andresource mobilisation; governance and leadership(management); supplies of medical products;and quality service delivery. is article describesthe model of partnership, noting key lessonslearned in the process.
Partnering processWV’s previous partnering experience showedthat concentrating only on sector-specific capac-ity-building was not sufficient to develop com-petent, professional organisations. Rather, aholistic approach is required to professionaliseall levels of an institution. WV’s approach topartnership aims to tailor specific capacity-building plans to the strengths and weakness¬esof implementing partners. It is not a ‘one-size-fits-all approach’, but an interactive, flexibleprocess that relies on field-based expatriate tech-nical staff developing mentoring relationshipswith partners and heavy emphasis on ‘on-the-job’ experiential learning. e emphasis on de-livering non-specified health services ensuresthat the partnership is practical and flexible,modifying project designs/budgets to addressemergent challenges that arise.
WV approached the MoH-SWS about estab-lishing a memorandum of understanding (MoU)that would guide a partnership process forstrengthened health service delivery. e nascentMoH-SWS was labelled “emergent” as per theWV partner categorisation system1 as it lackedsystems and processes. Emergent status meantthat the MoH-SWS was only allowed to directlymanage a small quantity of financial resources.However, emergent status also ensured close
Field Article
1 The development stages of WV partnerships are categorisedas: (1) embryonic; (2) emerging or nascent; (3) growing; (4) well developed; (5) mature.
technical support would be provided to increasecapacity across a range of skillsets, including fi-nancial, administrative and human resourcemanagement. At the time the MoH-SWS hadonly three staff: the Minister of Health, theDeputy Minister of Health and the DirectorGeneral of Health. WV and MoH-SWS co-created the MoU, drawing on MoUs WV hadwith other state entities in Somalia. e MoUdelineated the different roles and responsibilitiesin key areas of partnership, including: financialsupport; supplies provision (phar-maceuticalsand medical equipment); recruitment of staff(human resource for health); and technicalsupport (capacity development).
Building trustAer 25 years of civil conflict, communitieswere not accustomed to the government un-dertaking health service provision and weresuspicious of the capacity of the state to provideunbiased health services. WV brokered meetingsbetween community management committeesand the MoH-SWS to help foster mutual trust.e initial meetings were tense; however, astransparent processes were negotiated for theallocation of duties and resources, the facility-level management committees warmed to theidea of the state as a viable actor in the provisionof health services.
Human resourcese pilot project created 54 new staff positionswithin the MoH-SWS with two-year fundingunder the GAC grant via WV Somalia (one-year pilot funding plus one-year scale-up). WVintroduced the MoH-SWS management to keystandards and norms, encouraging the use ofWorld Health Organization (WHO) recommen-dations, current UNICEF practices and the Es-sential Package of Health Services (EPHS) guide-lines as a means of developing an aligned healthand nutrition management structure. Oncestaffing structures were finalised, incentive ratesfor skilled, semi-skilled and non-skilled facili-ty-level staff members were agreed2. WV, MoH-SWS and the facility-level health committee‘task forces’ (tasked with overseeing developmentwithin their local area) agreed to a managementstructure, respectful of the local managementcommittees’ desire to take an active role in theday-to-day running of the facility. e communitymanagement committee leadership role was fur-
ther recognised by allowing the committee toforward applications from qualified communitymembers, who were immediately shortlisted forthe recruitment process. It was agreed that non-skilled staff members were to be recruited directlyby the local facility-level health committee taskforce, while skilled and semi-skilled staff wouldbe recruited through a rigorous and transparentprocess. Non-skilled staff categories includedguards, community health workers (CHWs)and mobilisers and cleaners. e negotiatedarrangement promoted buy-in from suspiciouscommunity management committees, who werefearful of losing control of their communityasset, and ensured that the most important roles– mainly the skilled and semi-skilled staff mem-bers – would be recruited through a competitiverecruitment process.
With the advice of key government officialsand guidance from the WV Human Resource Department, the team defined a recruitmentprocess. e Governor of Bay Region and DistrictCommissioner of Baidoa were enlisted to helpmanage community expectations and offer adviceon how to create a transparent process whichwas acceptable to the community. Skilled andsemi-skilled employment was rare; thus com-petition for such positions was high and pressureon MoH-SWS government officials from otherpowerful community stakeholders to favourcandidates was strongly felt. Over 436 applicationswere received for the 54 positions.
As well as supporting recruitment, WV de-veloped a payroll system and payment mechanismby which facility-level staff members received adirect transfer from WV either to their personalaccount or directly to them through mobilemoney transfer at the end of each month, fol-lowing accurate submission of timesheets bythe MoH-SWS. Developing these shared processeshelped to mentor the MoH-SWS on the impor-tance of accounting for staff working hours,promoting both upwards accountability to donorsand downwards accountability to the communitymanagement task force committees.
Facilities, supplies andequipmente MoH-SWS was encouraged to adopt WHOminimum standards for the supply of maternalchild health (MCH) facilities, including a listof standard supplies and drugs. WV took re-
2 Incentive rates varied per cadre and qualification: CHWs $50,cleaners and guards $200, auxiliary nurses and nutrition assistants $300, qualified nurses and midwives $480, PHC supervisor $600 (all monthly).
sponsibility for procurement of the medicalsupplies and equipment for the project to ensureall drugs were procured from certified suppliers.e MoH should work with the certified sup-pliers to ensure quality of drugs procured andprevent substandard counterfeit drugs. Standardoperating procedures (SOPs) were establishedto deal with requisitions, reorder levels andrelevant documentation and accountability onconsumption/utilisation of consumables. WVtechnical staff also provided training to thenew-hire facility-level MoH-SWS staff memberson the utilisation of medical equipment.
Health and nutrition technicalsupportWV and the MoH-SWS agreed on a capacity-development plan anchored in regular structuredworkshops followed by close mentoring and on-the-job training. Although many of the new-hirestaff members had previous health sector expe-rience, gaps became apparent and tailored capacitydevelopment to tackle areas of weakness was de-veloped for specific facilities and teams. One ex-ample was the Core Infection Prevention andControl (IPC) standards, which was a new conceptfor many staff. A formal workshop was held inwhich the process was outlined and staff memberswere trained on facility-level procedures. etraining was so well received that teams imme-diately requested an autoclave to sterilise deliveryequipment to reduce cross-infection. Savingswere reallocated within the project to purchasethe equipment to support staff members’ desireto improve practice at the facility level. Staff wereencouraged that trainings and their follow-uprequest could result in actions by the MoH-SWSto improve the quality of their work. is helpedenhance the perception of the MoH-SWS as aresponsive management mechanism. Technicaltrainings were provided on integrated managementof childhood illness (IMCI), integrated communitycase management (iCCM), communicable diseasemanagement, basic emergency obstetric andneonatal care (BEmONC), integrated managementof acute malnutrition (IMAM), health facilitycommodity supply and supportive supervision.e MoH-SWS Director General and WV’s Healthand Nutrition Technical Specialist, along withother senior staff, provided technical support tothe field-based teams, including regular jointsupportive supervision, during which clinic staffwere supported in identifying solutions to thegaps, needs and challenges. Particular challengesidentified were the lack of supplies of therapeuticfoods, sharing of therapeutic foods due to lack offood at home, poor access to hard-to-reach villagesand nutrition services, and general access andinsecurity challenges.
Finance, administration andsupply chain technical supportPrior to the pilot project the MoH-SWS hadvery little experience in internal financial controlsand even less in developing accountability mech-
anisms. WV’s Finance and Support Service Man-ager provided hands-on support to co-createpayroll and procurement documentation andprocedures with the MoH-SWS. Sample formatsfor purchase requisition forms, local purchaseorders, goods received notes and request letterswere provided to MoH-SWS to help staff developtheir own documentation. Guidance was providedon how to develop simple contracts for vehiclehire and develop and manage logbooks, andcreate labour distribution reports and timesheetsfor newly hired facility-level staff members.
e mentorship approach used for financeand support services in the pilot was viewed as agreat success. It was not only a powerful riskmanagement mechanism, allowing expatriatestaff members to quickly identify capacity gaps,but the trust built through close association al-lowed field-level teams to co-create solutions.For example, aer the first quarter of the pilotphase, it became apparent that the three-personMoH could not manage the level of technicalrigor and attention to detail required to meetstringent financial accountability standards. Inresponse, budget was reallocated to fund theposition of Administration Officer in the MoH-SWS, creating a dedicated focal point to dealwith all administrative and financial issues andsomeone whom WV’s technical specialist couldmentor and support. e inclusion of the Ad-ministration Officer enhanced the capacity ofthe MoH-SWS to manage donor resources,thereby increasing the amount of financial re-sources directly managed by the Ministry (detailedfinancial information is not available from theMinistry). MoH-SWS professionalism improvedand financial systems were established that werealigned with international accounting practices.
Support to regional healthstructureWhile the initial phase focused on support forfacility-level implementation, it became apparentthat the district health system needed to bestrengthened to support all health actors inBaidoa district. Experience during the pilot phase
identified that the District Medical Officer forHealth role was too wide-ranging, covering issuesof health and nutrition and water, sanitationand hygiene (WASH), and was not able to provideadequate support to primary healthcare facilitiesand outreach teams. Aer reviewing the provi-sional district structure, WV and MoH-SWSagreed to allocate funding to support a new Pri-mary Health Care (PHC) Supervisor role. PHCSupervisors monitor and provide training atfacility level to MCH staff members. In addition,a gap in information management was identified.While the MoH had terms of references (ToRs)for information management roles, these roleswere vacant due to lack of funds. In response,budget allocation was made (from the GACfund, via WV Somalia) and staff were recruited.ese new positions decreased the workload ofthe Director General, allowing him to addressother more strategic issues related to the man-agement of the MoH. At facility level, TeamLeaders were assigned additional core responsi-bilities, including decision-making on activityplanning, resupply, reorders, mobile airtime pur-chase and referral of patients.
Expanded partnershipe initial one-year partnership with MoH-SWS has since been scaled up (also with GACfunding, as well as resources from the Office forUnited States Disaster Assistance (OFDA) inyear two) from two health facilities, two mobilesteams and 54 new staff to eight health facilities,26 internally displaced persons (IDP) camp-level health posts and four mobile clinics pro-viding basic health and nutrition services toIDP, returnees and host community members.A total of 233 MoH staff are now employedacross the state, a dramatic increase from theinitial three in 2015. GAC funds are channelledto the MoH via WV Somalia to pay salarieseach month, based on timesheets submitted. Inaddition, MoH and WV leveraged this partner-ship to scale up and respond to recent acutewater diarrhoea/cholera response. District rapidresponse teams (RRTs) were deployed to respondquickly to rumours, investigate and mount an
Field Article
Wor
ld V
isio
n So
mal
ia
SWS Health Management Team, 2017
aggressive cholera response, providing curativeservices, referral of severe cases to the choleratreatment centres/cholera treatment units andcommunity mobilisation – and with good results,as cholera was contained in most SWS areas.Following the initial partnership with WV, MoH-SWS has used the MoU format to sign partnershipagreements with four other LNGOs and otherINGOs have leveraged the strengthened MoH-SWS to achieve their emergency response ob-jectives, especially in inaccessible areas.
Conclusion and the wayforwardTo build a sustainable health sector, government,NGOs and private actors must have the resourcesand capacity to fulfill their respective roles. Ourlong-term vision is of an agile, robust MoHtaking a leading role, supported by partners. Tobuild this capacity, WV employs a holistic ap-proach, focusing not only on the technical ca-pacity of sector entities to deliver, but also ontheir governance and management capability.rough this partnership, MoH-SWS gainedpractical experience managing health facilities,was exposed to international best practice andstrengthened its capacity to professionally monitorother health actors, enhancing quality controlfor the health system. A recent WV capacity as-sessment resulted in the partnership with theMoH being categorised as ‘growing’; the hopeis that in a few years the partnership will reach‘maturity’. e MoH now chairs the cluster meet-ings, demonstrating good leadership. Much ofthe success of the past two years can be attributedto the recruitment process, which helped buildthe credibility of the MoH-SWS and resulted inqualified and experienced staff being recruitedto the MCH facilities and mobile teams.
Finally, the partnership approach createdconditions in which trust can be fostered betweenthe community and the state. For the state-building project to be a success in Somalia, stateinstitutions must have know-how and be per-ceived as credible in the eyes of the communitiesto which they are accountable to exercise theirmandates effectively. is approach has not onlysucceeded in bringing much-needed health serv-ices to vulnerable communities but has bolsteredthe reputation of the state as a credible, repre-sentative actor in the provision of basic services.e Government of Somalia still has very limitedresources, which are mainly used to support se-curity, so external actors will have a role to playfor some time; however, due to this pilot andscale-up, other actors are now willing to fundthe MoH directly (including Save the ChildrenInternational, the International Organizationon Migration, Italian Cooperation and UNICEF).Funding avenues in Somalia remain dependenton short-term (nine to 12 months) and emergencyresponses; further advocacy to donors that pro-vide longer (development) funding streams withinterest in health systems strengthening in fragilecontexts, like SWS institutions, is required.
For more information, contact: Ezekiel Sirya,email: [email protected]
The Field Exchange editors conductedan interview with William Moore, Ex-ecutive Director of e Eleanor CrookFoundation (ECF), for this issue’s
agency profile slot.
William has been with the Foundation forthree and a half years. Before he joined ECF, heworked for the Millennium Campaign in therun-up to the launch of the Sustainable Devel-opment Goals (SDGs). Perhaps it isn’t surprisingthat William is serving as ECF’s Executive Di-rector (ED), given that his grandmother isEleanor Crook. e story of William’s appoint-ment goes something like this.
Just before Christmas 2014, he got a callfrom his grandmother saying that ECF had justhad a pleasant surprise from their finance de-partment: they had US$1 million to give awaybefore year’s end. She wanted to use it to helpimprove nutrition among Syrian refugees andwondered if William knew which organisationswere doing the most effective humanitarianwork in response to the Syrian crisis. is US$1million donation was a turning point for ECF:it was suddenly clear that they were no longer asmall, family foundation giving out modestgrants, mostly in the form of unrestricted gis,to a circle of entities they already knew.
On the back of this experience, Eleanor andWilliam talked about new systems that neededto be put in place to strengthen their grant-making process and to begin monitoring andevaluating the now much larger grants thatEleanor’s Foundation was making. William wasasked to come on board at this point to help putthis new infrastructure in. Fast forward a fewyears and ECF now has team members based inNorth Carolina and Washington, with a newlyappointed Technical Director based in the UK.
Eleanor set up the Foundation in 1997. It al-ways had a focus on global hunger issues, which
had been her concern since the 1980s, volun-teering for the Church World Service and otherinternational non-governmental organisations(NGOs); her first exposure to famine was the1984 Ethiopia famine. Her husband had alsospent time in Ethiopia during one of the famines.Eleanor was particularly angry seeing mothersunable to feed their infants and powerless tostop them dying. is anger translated into apassion to do something about global hunger.
When William joined the Foundation, hecame with a specific vision. He believed thatECF needed a targeted focus and to take “smartrisks”, filling obvious gaps by investing in areasthat governments and business are unable orunwilling to invest in. His experience workingin the SDG community meant he was awarethat the nutrition sector needed more investment.Given hunger was an issue close to Eleanor’sheart, he knew that nutrition was going to be agood fit. At the same time, ECF was “no Gates”in terms of size and therefore needed to definea clear area of investment focus.
Aer a lengthy period of consultation withvarious actors in the nutrition community,William/ECF arrived at a strategy and approachwhich they hoped would enable them to becomea leader in the sector. ECF wants a dual focuson nutrition research and nutrition advocacy,as these seem to be the areas where investmentis most needed. In many respects, advocacy andresearch are two sides of the same coin. Goodadvocacy needs to be rooted in real evidencebut at the same time rigorous evidence won’tnecessarily be ‘picked up’ by decision-makers.ere are many examples of promising inter-ventions not being adopted. You need advocacyand, as part of that, creative approaches to dis-semination and financing.
e Foundation’s endowment and disburse-ments have been on a rapid growth trajectoryin recent years and Eleanor intends to provide
the organisation’s endowment with the resourcesit needs to operate in perpetuity. Global nutritionis now ECF’s sole focus. Overseeing all theproject portfolios are William, two nutritionistswith considerable research and implementationexperience, a former Obama appointee at theUnited States Agency for International Devel-opment (USAID), a recent graduate from theLyndon B. Johnson School of Public Affairs atthe University of Texas at Austin, and a SeniorAdvocacy Advisor who runs a prominent con-sulting firm based in Washington, DC.
ECF has a clear research strategy and approach,partnering with NGOs and universities to conductimplementation research through its RISE (Re-search, Innovate, Scale, Establish) for Nutritiongrant programme. It funds rigorous implemen-tation research to identify solutions to currentimplementation challenges on the ground usingexisting delivery mechanisms that can impactnutrition at scale. is involves testing discreteimprovements to existing programmes.
One example is research through InternationalRescue Committee (IRC) in South Sudan, whichis testing a new, simplified set of tools and algo-rithm for diagnosing and treating uncomplicated
severe acute malnutrition at community levelthat is suitable for low-literacy community healthworkers (CHWs). e approach needs to workwithin a weakly supported health system wherethere is little CHW training. e first study ap-pears to be very successful (early experiencesfeatured in a 2016 Field Exchange article ) andhas therefore progressed to a phase 2 ECF in-vestment, involving piloting in three additionalcountries through four implementing partners.e objective of this phase is to ensure that theapproach is generalisable in multiple contexts.
e South Sudan work is typical of the ECFresearch approach. It starts with a three to four-year research project with a budget of approxi-mately US$1.2-1.5 million to test the conceptand to see if it can work in one setting. If phase1 has been successful, the next step (phase 2) isto test it in several other settings, with the over-sight of new strategic partners. If successful inmultiple contexts, phase 3 will involve advocacyand collaborative financing for scale-up. ECF isuniquely positioned due to its strong relationshipswith government and other private funders.
Several other research projects are currentlyin phase 1. In Uganda, Food for the Hungry isconducting a study looking at the linkages be-tween maternal depression and child stuntingand testing the effectiveness of an interpersonaltherapy group (IPT-G) approach to depressiontreatment through weekly group therapy. Hor-rifying experiences that mothers have facedemerge here but, encouragingly, testing this ap-proach has reduced the prevalence of depressionin low-income settings. e hypothesis is that,by reducing depression, mothers will have im-proved functionality and improved infant andyoung child feeding practices.
ECF is also funding two randomised controltrials (RCTs) in Tanzania. Helen Keller Inter-national (HKI) is examining the impact andcost effectiveness of interpersonal messaging,SMS messaging and a combination of the twoon health and nutrition. is multi-armed studyinvolves public-private partnership and uses aninterpersonal messaging approach that Tanzaniais currently in the process of scaling up nationally.A second RCT in Tanzania working with ProjectConcern International (PCI) is examining new
models for encouraging more male engagementand investment in child health and its impacton nutrition and early child development.
Evidence generated from this portfolio of re-search will drive a targeted advocacy agenda(phase 3); ECF is moving towards phase 3 forthe community-based diagnosis and treatmenttool tested by IRC, working closely with USAID,the UK Department for International Develop-ment (DFID), No Wasted Lives (NWL) and IRC.
ECF has a Foundation Request for Applica-tions (RFA) to guide applications from potentialgrantees (invitation-only application process).is sets out the ECF approach to research andemphasises strong monitoring and evaluation,multi-sector approaches to improve nutritionand the need to think about scale at every phaseof programme design. e organisation is alsodeveloping specific theories and frameworks onscale-up and sustainability. is work shouldbe out later this year.
William has strong views about sustainabilityof interventions. He is critical of the internationaldevelopment sector for not addressing this issueproperly and singles out donors, believing theyneed to step up and drive change. He arguesthat they should be able to do this not only byevaluating success based on surveys on the lastday of programming – the typical approach –but by also building in follow-up several yearsaer implementation (which gives a more ac-curate picture); William is of the firm convictionthat many post hoc evaluations of current nu-trition programming would not make greatreading.
With regard to how funders are discussingways to work together; he believes the imple-mentation community do a better job of coor-dination and alignment than the funding com-munity. In reality it is quite difficult to co-fund,since the incentives are simply not there. Hisexperience is that, when there is disagreementor misalignment, the immediate solution seemsto be for funders to go their separate ways.Having said that, there are successful efforts:ECF is currently working closely with Gates,Hilton, Child Relief International (CRI), Vitol,Open Road Alliance and other funders.
He singles out NWL as a great example ofhow funding could/should be arranged. econsortium is set up to drive research on wastingand the best ways to scale up effective program-ming and policy. As well as attracting newfunders, it has real promise in getting bilateraldonors to open their global health envelopes tosmall sets of relevant interventions.
We had an interesting exchange about someof the tensions between funders and grantees.ECF, in common with some other funders, likesto “get its hands dirty” and see projects close up;however this can be threatening to some imple-menting partners. It can be a delicate dancewhere, as a funder, one has to respect partnerwishes. It is a never-ending process of buildingstrong relationships and cultivating trust. It isimportant that organisations can hear criticismbut, at the same time, “tell us we may be wrong”.e personalities of those overseeing projectscan be critical here. is reflects why ECF seeks“kindred spirits” when it comes to support.
William is also concerned about the so-calledadvocacy and research nexus and how, in hisview, there is a profound disconnect betweenthe two communities. As he moves between thetwo worlds in ECF, he finds that they rarely talkabout the same things, even though they areworking on the same issues.
As with all agency profile interviews, weasked William how he would characterise ECFand what makes it different from other founda-tions. His comments are best summarised bysaying ECF is a ‘family’ foundation with a tightfocus on filling targeted gaps and identifyingpractical solutions. He also points out that ECFis relatively flexible and can issue grants withless bureaucratic hurdles than many largerdonors. Quite oen, it provides seed fundingup front to get initiatives off the ground.
We finished off the interview by askingWilliam what he thinks may have changed overthe last 20 years in the nutrition world. His firstthought is that there wasn’t as much of a nutrition‘sector’ 20 years ago as there is now, with farmore coordination and alignment. His secondthought is that there is a rather insular perspectiveamong many nutrition staff and agencies andthere is a need for a more multi-sector vision.(He recounts a conversation he recently hadwith someone in the agriculture sector whosaid that the nutrition crowd are a bit annoyingand act like a secret cult of the holy grail.)
William would like to extend the challengeto the Field Exchange readership that JessicaFanzo laid down at the recent Global NutritionReport meeting. It goes something like this: “Atsome point this year, I challenge you as a nutri-tionist to attend at least one gathering whereyou are the only nutrition person in the room.Ask other sectors not what they can do for nu-trition, but rather what can nutrition do to helpyour sector”.
A succinct call to action to end a refreshingand engaging discussion.
Participants of the ACF Research for Nutrition Conference, Pavillon de LíEau, 13th November, 2017
Share pictures of you reading wherever you are in the world - we will tweetthem and a selection will be published in the print edition. Send [email protected]
Jeremy Shoham andMarie McGrath areField ExchangeCo-Editors andTechnical Directors.
Orna O’ Reilly designsand produces all ofENN’s publications.
Azaria Morgan is SUNProject Assistant,based in London.
Chloe Angood isField Exchangesub-editor.
Charulatha Banerjee is ENNs RegionalKnowledgeManagement Specialistfor Asia, based in India.
Clara Ramsay is theENN’s Finance Assistant,based in Oxford.
Lillian Karanja-Odhiambois ENN’s RegionalKnowledge ManagementSpecialist for East andSouthern Africa, based inKenya.
Ambarka Youssoufaneis ENNs RegionalKnowledgeManagement Specialistfor West Africa, basedin Senegal.
Peter Tevret is ENN’sSenior Finance Manager, based in Oxford.
About ENNENN is a UK registered charity, international in reach, focused on supporting populations at high risk ofmalnutrition. ENN aims to enhance the effectiveness of nutrition policy and programming byimproving knowledge, stimulating learning, building evidence, and providing support andencouragement to practitioners and decision-makers involved in nutrition and related interventions.
ENN is both a core team of experienced and academically able nutritionists and a wider network ofnutrition practitioners, academics and decision-makers who share their knowledge and experience anduse ENN’s products to inform policies, guidance and programmes in the contexts where they work.
ENN implements activities according to three major workstreams:Workstream 1: Experience sharing, knowledge management and learning. This includes ENN’s coreproducts: , Nutrition Exchange and en-net, as well as embedded knowledge management within twokey global nutrition fora (the Scaling Up Nutrition Movement (SUN) and the Global Nutrition Cluster(GNC)).
Workstream 2: Information and evidence on under-researched nutrition issues. This comprises ENN’sresearch and review work on filling gaps in the evidence base for improved nutrition policy andprogramming.
Workstream 3: Discussion, cooperation and agreement. This includes a range of activities fordiscussing and building agreement and consensus on key nutrition issues. It includes ENN’sparticipation in and hosting of meetings, its activities as facilitator of the IFE Core Group and itsparticipation in the development of training materials and guidance, including normative guidance.
ENNs activities are governed by a five year strategy (2016-2020), visit www.ennonline.net
Contributors for this issue:
Front coverChildren playing games together at aSave the Children supported preschool inZomba District, Malawi, 2017; JonathanHyams/Save the Children
Judith Fitzgerald,is the ENN OfficeManager basedin Oxford.
Mary Murray is Administrative Assistant at ENN,based in Oxford.
Tui Swinnen is ENN’sGlobal KnowledgeManagement Coordinator (SUNMovement).
Ahmad Nawid QarizadaAisha TwalibuAjay AcharyaAlexander MwangondeAlison DonnellyAmbarka YoussoufaneAndré Briend Angeline Grant Anne-Marie MayerAntonio Vargas BrizuelaAulo GelliBasant ThapaBernard ChigayaBhim Kumari Pun Carmel Dolan Caroline Wilkinson Charulatha BanerjeeChiara AltareDebarati Guha-SapirDevon Jaffe-UrellEdward Joy Emily Keane Emmanuel GrelletyEmmanuelle Maisonnave Fatmata Fatima SesayGeorge ChidalengwaHassan Mohamed OsmanHeather DantonHeather Stobaugh Helen MoestueIbrahim Ahmed Osman Iván Molina Allende James NjiruJane KeylockJecinter Akinyi Oketch Jeremy ShohamJoanne Chui Jose Manuel Rodriguez-LlanesJoseph Victor Senesie
Thanks to all who contributed or helpedsource pictures for this issue.
DesignOrna O’Reilly/Big Cheese Design.com
WebsiteOxford Web Apps
The Emergency Nutrition Network (ENN) is a registered charity in the UK (charity registration no:1115156) and a company limited by guarantee and not having a share capital in the UK (companyregistration no: 4889844). Registered address: 32, Leopold Street, Oxford, OX4 1TW, UK. ENN Directors/Trustees: Marie McGrath, Jeremy Shoham, Bruce Laurence, Nigel Milway, Victoria Lack and Anna Taylor.