46
Overview of Census 2011
| Date post: | 13-Sep-2014 |
| Category: |
Education |
| View: | 6,683 times |
| Download: | 7 times |
Overview of Census 2011
Census
A census is the procedure of systematically acquiring and recording information about the members of a given population. It is a regularly occurring and official count of a particular population.
The term is used mostly in connection with national population and housing censuses; other common censuses include agriculture, business, and traffic censuses.
04/07/23 2
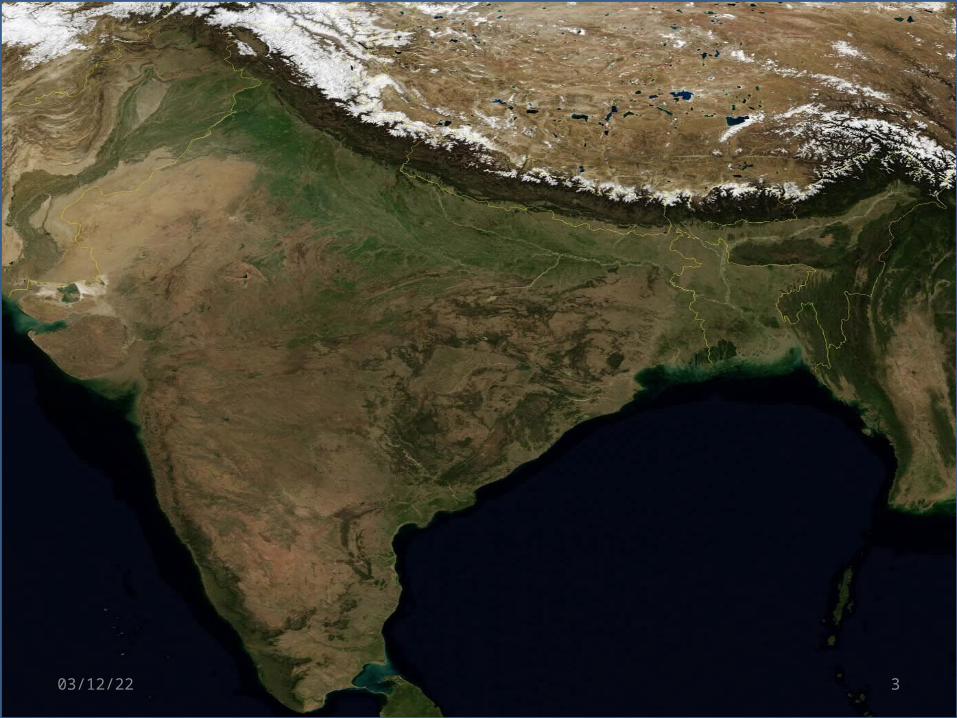
Census in India
The first census in India in modern times was conducted in 1872.
Population census has been carried out every 10 years.
The census is carried out by the office of the Registrar General and Census Commissioner of India, Delhi, an office in the Ministry of Home Affairs, Government of India, under the 1948 Census of India Act.
04/07/23 3
CENSUSThe 15th Indian National
census was conducted in two phases, house listing and population enumeration.
The Census covered 640 districts, 5767 tehsils, 7742 towns and more than 6 lac villages. 2.7 million officials visited households in 7,935 towns and 6,40,867 villages, classifying the population according to gender, religion, education and occupation.
04/07/23 4
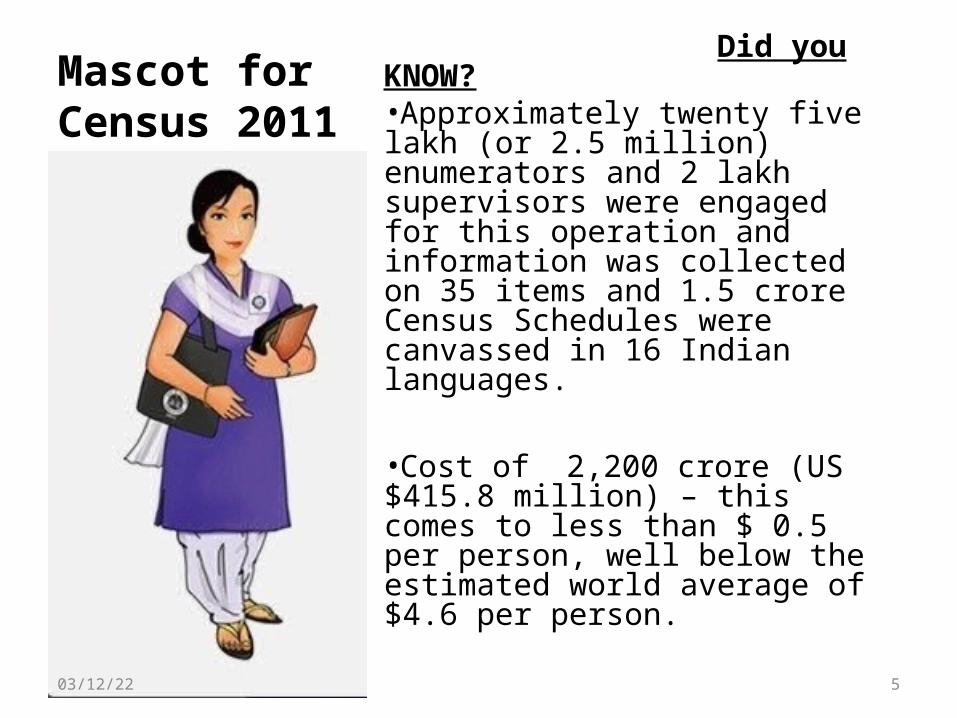
Mascot for Census 2011
Did you KNOW?•Approximately twenty five lakh (or 2.5 million) enumerators and 2 lakh supervisors were engaged for this operation and information was collected on 35 items and 1.5 crore Census Schedules were canvassed in 16 Indian languages.
•Cost of 2,200 crore (US $415.8 million) – this comes to less than $ 0.5 per person, well below the estimated world average of $4.6 per person.
04/07/23 5
Two stages of Census
•Houselisting •Population Enumeration
04/07/23 6
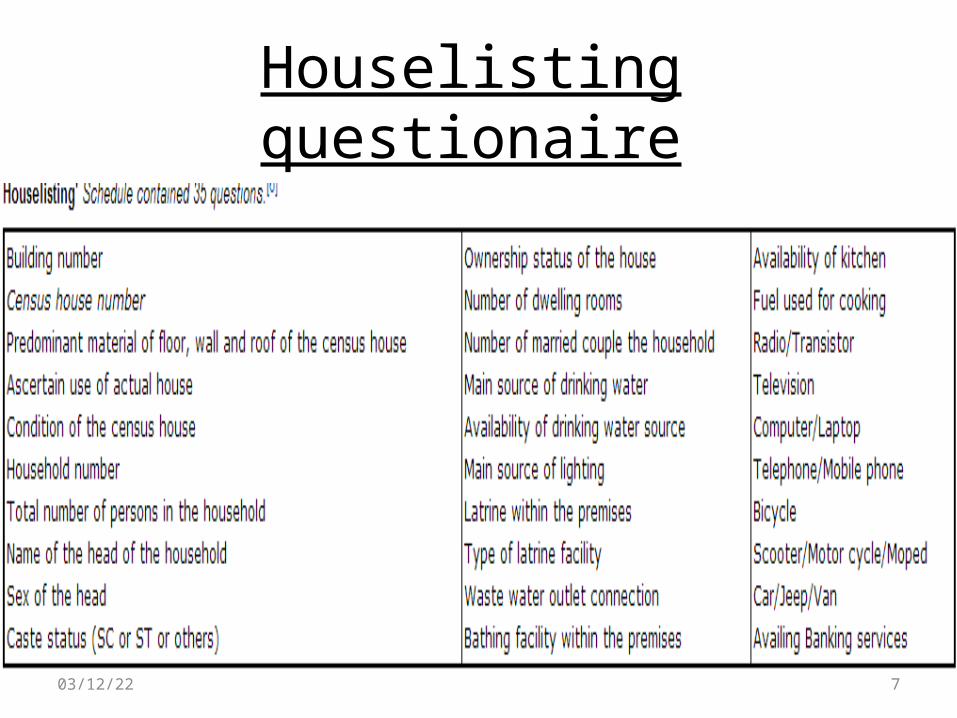
Houselisting questionaire
04/07/23 7

Population enumeration
04/07/23 8

POPULATION COMPARISON
2021
2011
2001 The population of India has increased by more than 181 million during the decade 2001-2011.This addition is slightly lower than the population of Brazil, the fifth most populous country in the world !!
04/07/23 9

India as compared to the worldThe gap between India, the country with the second largest population in the world and China, the country with the largest population in the world has narrowed from 238 million in 2001 to nearly 131 million in 2011. On the other hand, the gap between India and the United States of America, which has the third largest population, has now widened to about 902 million from 741 million in 2001.
04/07/23 10

A point that is striking is that while India accounts for a meagre 2.4 percent of the world surface area, it supports and sustains a whopping 17.5 percent of the world population.Density of population ( per sq km ) is 382.
Population Density
04/07/23 11

The world population grew at an annual rate of 1.23 percent during 2000-2010. China registered a much lower annual growth rate of population (0.53 percent) during 2000-2010, as compared to India (1.64 percent during 2001-2011). India will overtake china by 2030 and have 18% of the worlds population.
Growth Rate
04/07/23 12

State wise break-up Uttar Pradesh continues to be the most populous State in the country with 200 million people , which is more than the population of Brazil, the fifth most populous country in the world. The combined population of Uttar Pradesh and Maharashtra (the second most populous State), at 312 million, is substantially greater than the population of USA, the third most populous country of the world.
04/07/23 13

State wise population 2001
04/07/23 14
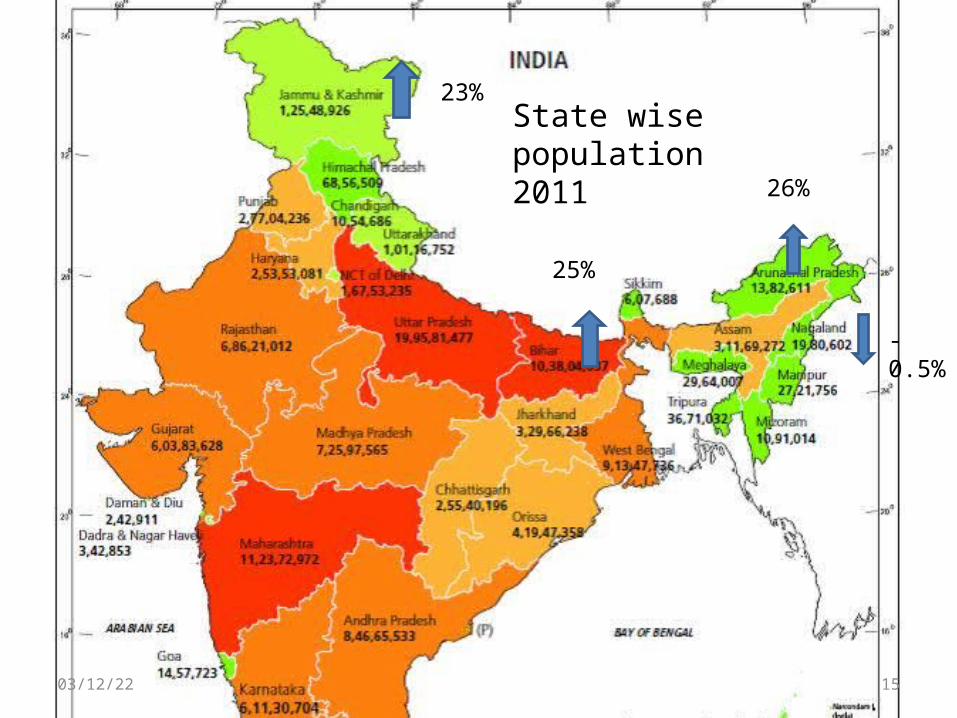
State wise population 2011
23%
25%
26%
-0.5%
04/07/23 15

It is significant that the percentage decadal growth during 2001-2011 has registered the sharpest decline since independence. It declined from 23. 87 percent for 1981-1991 to 21.54 percent for the period 1991-2001, a decrease of 2.33 percentage point. For 2001-2011, this decadal growth has become 17.64 percent, a further decrease of 3.90 percentage points
Decadal Growth
04/07/23 16
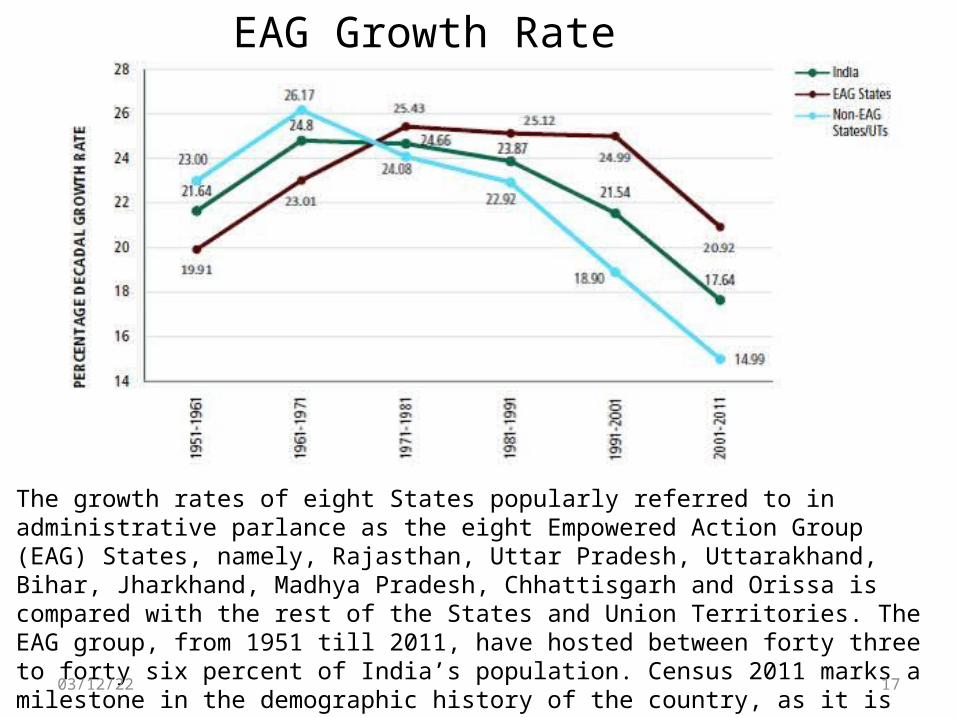
The growth rates of eight States popularly referred to in administrative parlance as the eight Empowered Action Group (EAG) States, namely, Rajasthan, Uttar Pradesh, Uttarakhand, Bihar, Jharkhand, Madhya Pradesh, Chhattisgarh and Orissa is compared with the rest of the States and Union Territories. The EAG group, from 1951 till 2011, have hosted between forty three to forty six percent of India’s population. Census 2011 marks a milestone in the demographic history of the country, as it is perhaps for the first time, there is a significant fall in growth rate of population in the EAG States after decades of stagnation
EAG Growth Rate
04/07/23 17
The phenomenon of low growth have started to spread beyond the boundaries of the Southern States during 2001-11, where in addition to Andhra Pradesh, Tamil Nadu and
Karnataka in the South, Himachal Pradesh and Punjab in the North, West Bengal and Orissa in the East, and Maharashtra in
the West have registered a growth rate between eleven to sixteen percent in 2001-2011 over the previous decade.
The Provisional Population Totals of Census 2001 predicted this: “It is also obvious that in the contiguous four major South Indian States fertility decline appears to have well
established, stretching to neighbouring Maharashtra on the west and Orissa and West Bengal in the east, whereas in
other regions it is rather scattered.”
Importance of Gender Statistics• Equality between women and men is a matter of human
rights and a condition for social justice and is also a necessary and fundamental prerequisite for equality, development and peace”
• Gender composition reflects natality, mortality and migration character of a given population. Distribution pattern of male and female in a population affects relative roles and economic relationships. There are different tools to measure gender equity in a population. Sex ratio is one such widely used tool for cross sectional analysis to measure gender balance. Sex ratio is defined in the Census of India as the number of females per 1,000 males in the population.
04/07/23 19
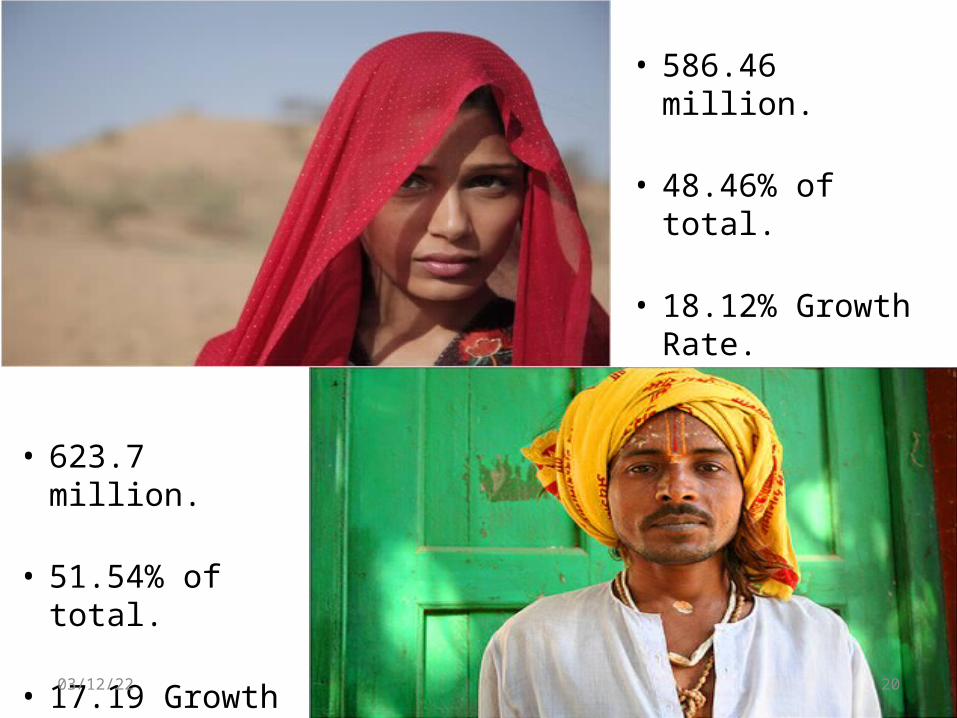
• 586.46 million.
• 48.46% of total.
• 18.12% Growth Rate.
• 623.7 million.
• 51.54% of total.
• 17.19 Growth Rate.04/07/23 20

Sex Ratio
The sex ratio of India is 940. The sex ratio at the National level has risen by seven points since the last Census in 2001. This is the highest since 1971.
04/07/23 21
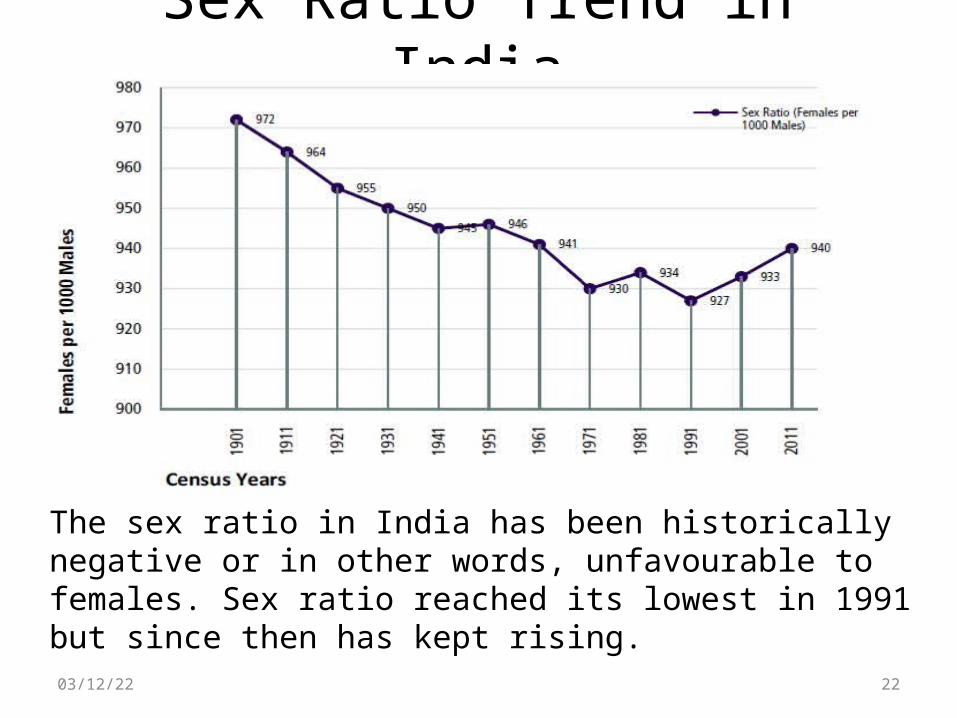
Sex Ratio Trend in India
The sex ratio in India has been historically negative or in other words, unfavourable to females. Sex ratio reached its lowest in 1991 but since then has kept rising.
04/07/23 22

State-wise Sex Ratios
04/07/23 23
Sex Ratio Stand-outs
• In 2001, the State of Kerala and the Union Territory of Puducherry reported above unity sex ratio. Both these States have not only retained their status but have also shown considerable increase in 2011.
• An increase of Forty five points was seen in the highly urbanised National Capital Territory of Delhi.
• A point to be noted is that the States having historically low sex ratio such as Punjab, Haryana, Delhi and Chandigarh have shown appreciable increase in the sex ratio in Census 2011. Majority of the States identified as gender critical for special attention and intervention as part of the Census 2011 have shown increasing trend in the sex ratio as per the provisional results.
• Only major States of Bihar and Jammu & Kashmir and Gujarat have shown decline in the sex ratio. The other Union Territories registering decline in overall sex ratio include Dadra and Nagar Haveli, Daman and Diu and Lakshadweep.
04/07/23 24
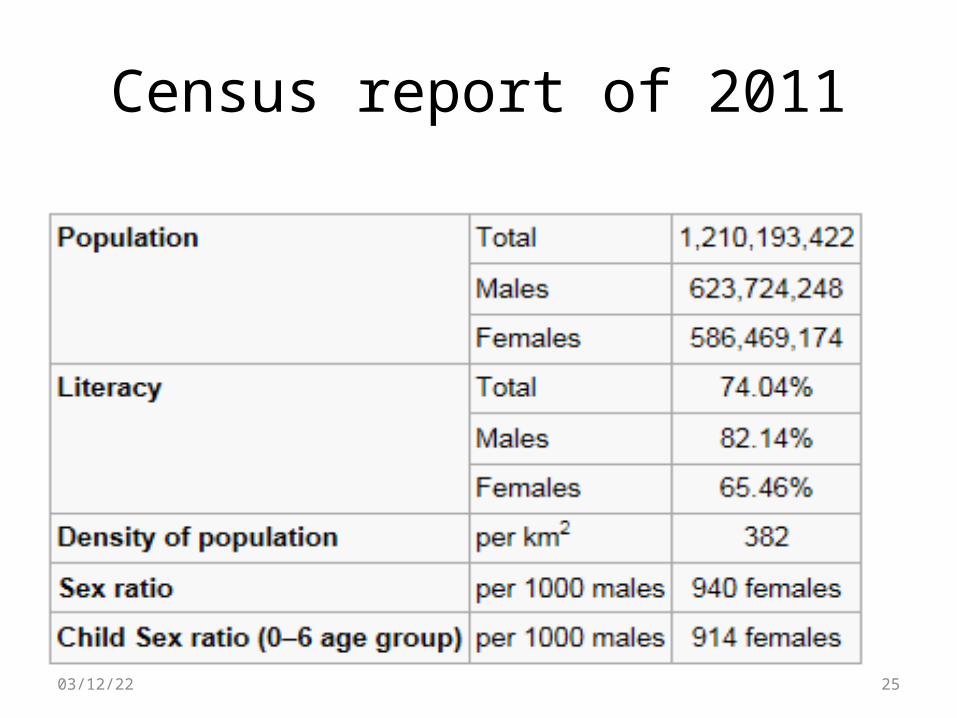
Census report of 2011
04/07/23 25
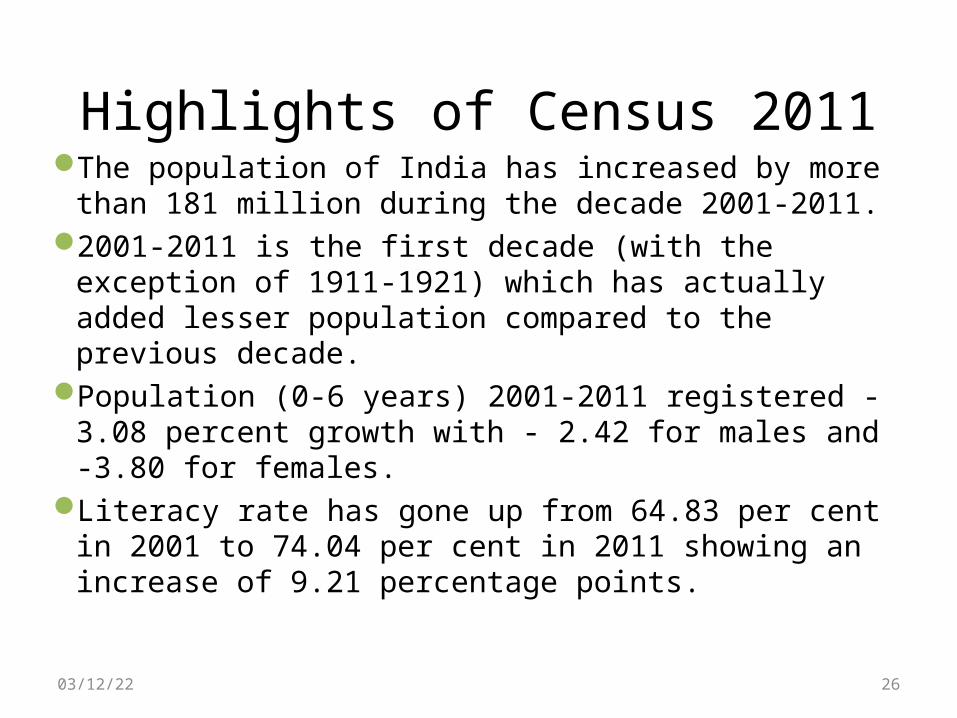
Highlights of Census 2011The population of India has increased by more than 181
million during the decade 2001-2011.2001-2011 is the first decade (with the exception of 1911-
1921) which has actually added lesser population compared to the previous decade.
Population (0-6 years) 2001-2011 registered -3.08 percent growth with - 2.42 for males and -3.80 for females.
Literacy rate has gone up from 64.83 per cent in 2001 to 74.04 per cent in 2011 showing an increase of 9.21 percentage points.
04/07/23 26
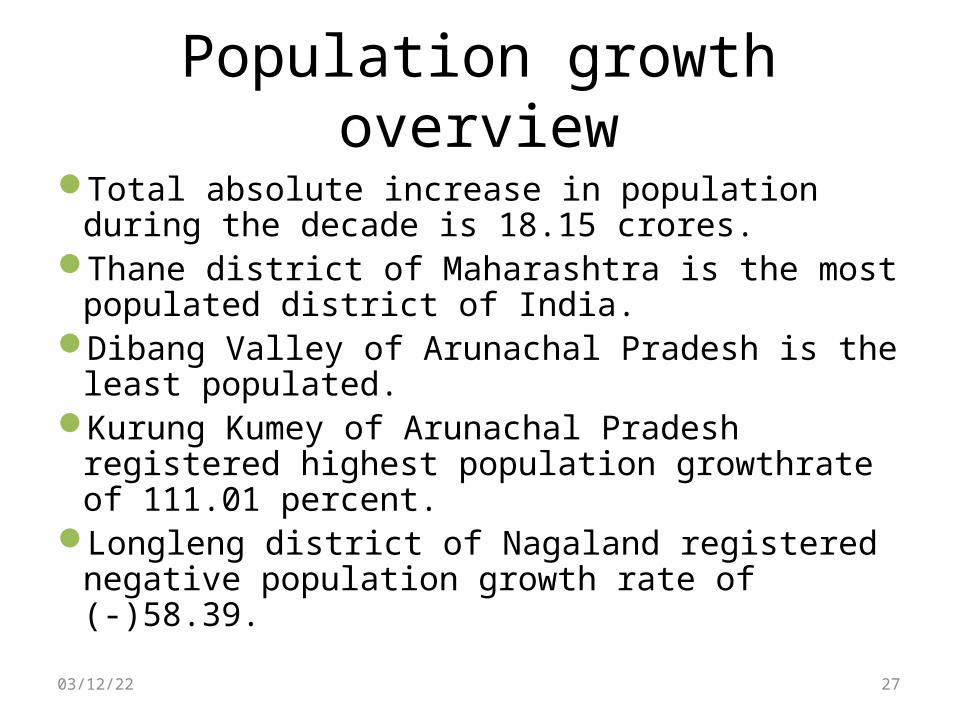
Population growth overviewTotal absolute increase in population during the
decade is 18.15 crores.Thane district of Maharashtra is the most populated
district of India.Dibang Valley of Arunachal Pradesh is the least
populated.Kurung Kumey of Arunachal Pradesh registered
highest population growthrate of 111.01 percent.Longleng district of Nagaland registered negative
population growth rate of (-)58.39.
04/07/23 27
Literacy and density of population
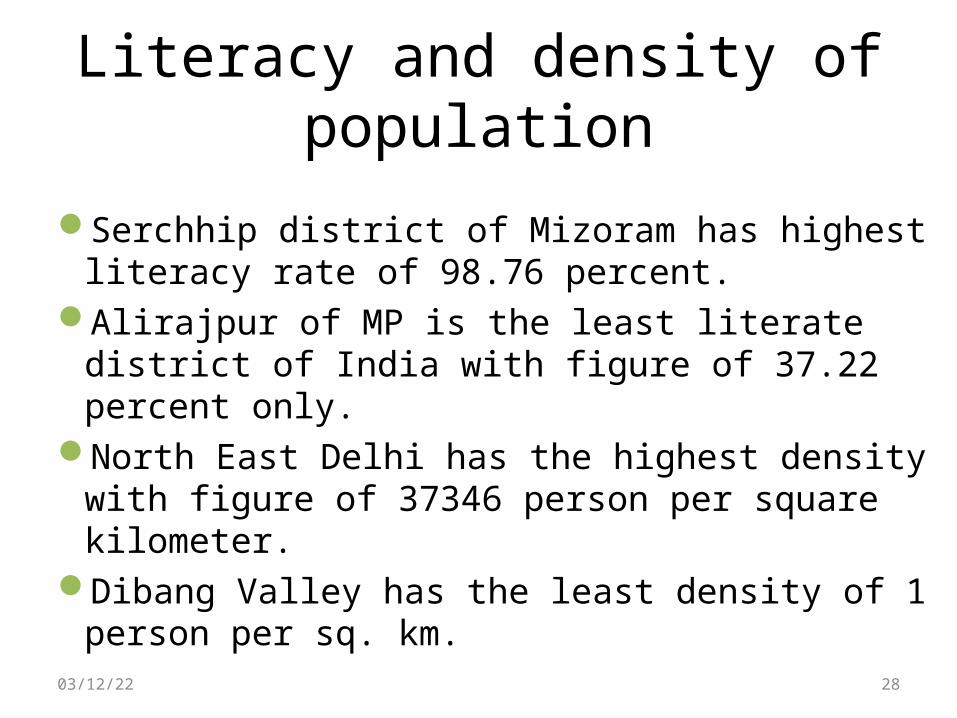
Serchhip district of Mizoram has highest literacy rate of 98.76 percent.
Alirajpur of MP is the least literate district of India with figure of 37.22 percent only.
North East Delhi has the highest density with figure of 37346 person per square kilometer.
Dibang Valley has the least density of 1 person per sq. km.
04/07/23 28
States having highest population
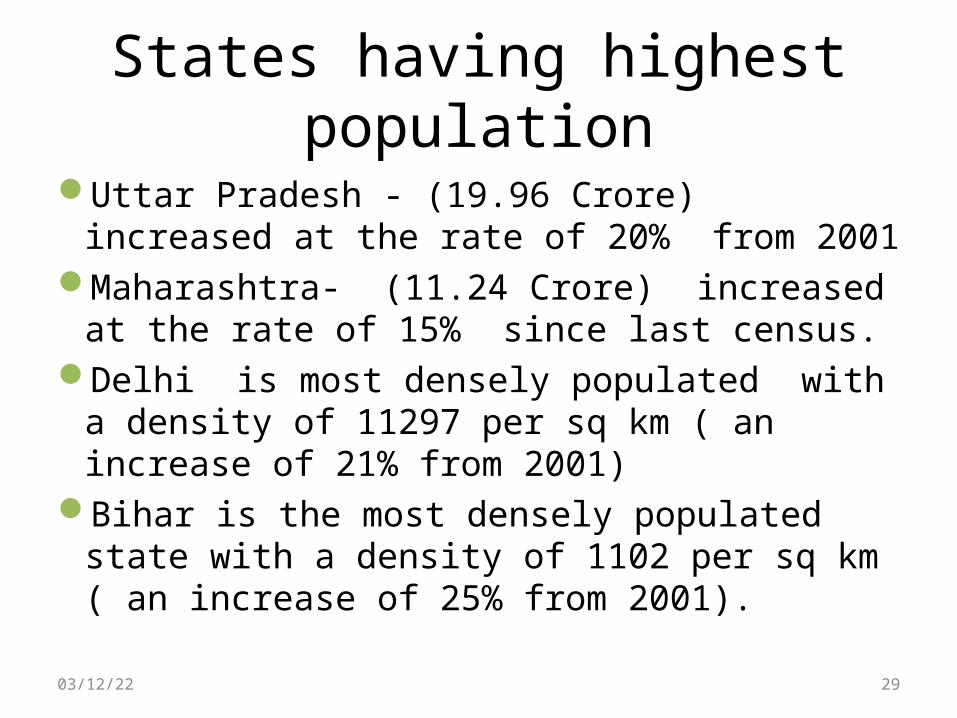
Uttar Pradesh - (19.96 Crore) increased at the rate of 20% from 2001
Maharashtra- (11.24 Crore) increased at the rate of 15% since last census.
Delhi is most densely populated with a density of 11297 per sq km ( an increase of 21% from 2001)
Bihar is the most densely populated state with a density of 1102 per sq km ( an increase of 25% from 2001).
04/07/23 29

States with highest literacy
04/07/23 30
City census 2011• The total population of Urban Agglomeration (UA)
and the city's population 2011 were calculated.• All places which had a municipality, a corporation,
notified town area community or a cantonment board was known to fall under the category of city or UA.
• Urban areas surrounding Cities are combinly called Urban Agglomeration. Under UA census data for all cities having population more than 1 lakh was made available.
04/07/23 31
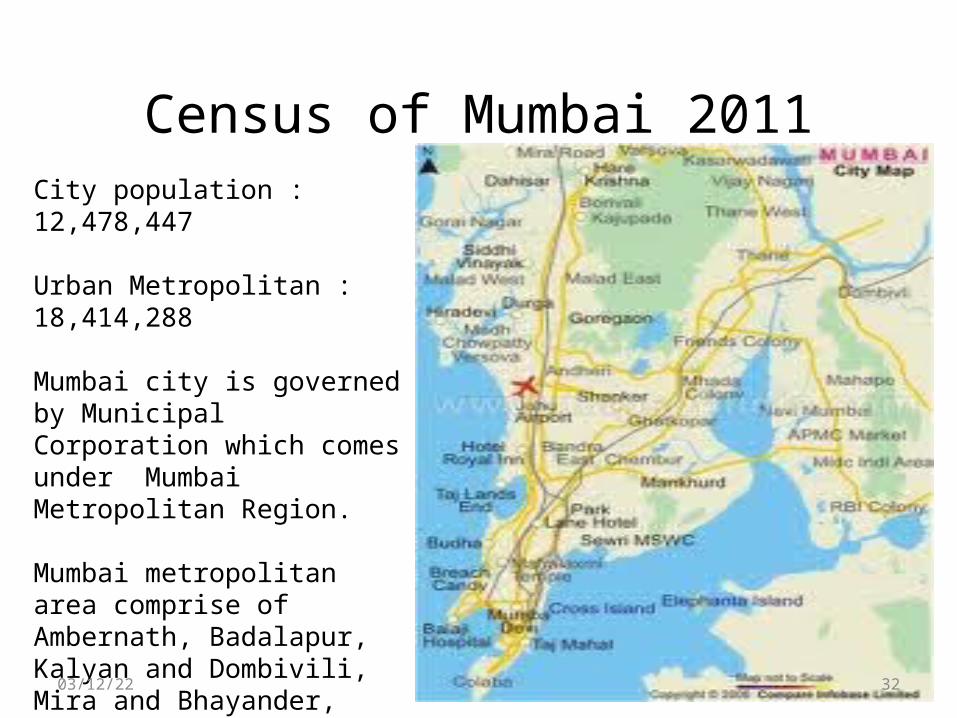
Census of Mumbai 2011City population : 12,478,447
Urban Metropolitan : 18,414,288
Mumbai city is governed by Municipal Corporation which comes under Mumbai Metropolitan Region.
Mumbai metropolitan area comprise of Ambernath, Badalapur, Kalyan and Dombivili, Mira and Bhayander, Mumbai, Navi Mumbai, Thane, and Ulhasnagar .
04/07/23 32
Interesting Facts
04/07/23 33

Interesting facts- Telecom• “More phones than toilets” Census 2011 sheds light
on changing India.• 63.2 per cent households in India now have a
telephone/mobile facility( 82 per cent in urban and 54 per cent in rural area.)
• The penetration of mobile phone is 59 per cent and landline is 10 per cent.
• More than half of Indian households (some 53.1 per cent) do not have access to something as basic as a toilet.
04/07/23 34
Facts- Communication• The penetration of computers and laptops in India is
only 9.4 per cent or less than one out of 10 households with only 3 per cent having internet facility.
• The penetration of internet is 8 per cent in urban as compared to less than 1 per cent in rural area.
• Maharashtra is the biggest Indian Internet market with 18% .
• 47.2 % of Indians own a Television• 19.9 % of Indians own a Radio/Transistors• 13.42 Million broadband connections (Home +
Offices ) combined.04/07/23 35
Facts- Literacy and Population• Uttar Pradesh is the most populous state and
the combined population of Uttar Pradesh and Maharashtra is more than that of the USA.
• Ten states and union territories have attained literacy rate of above 85 per cent.
• According to the Census report India's population is now bigger than the combined population of USA, Indonesia, Brazil, Pakistan and Bangladesh.
• 74% of Indians can now read, write and do basic maths (like adding, subtracting) — that means that 3 out of every 4 Indians are literate.
04/07/23 36
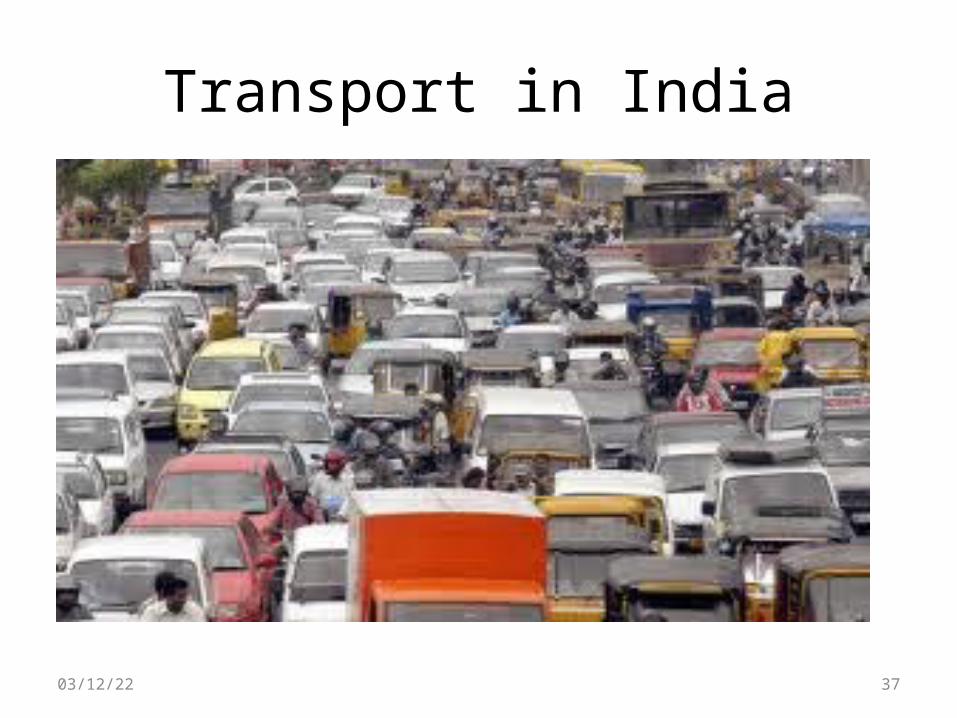
Transport in India
04/07/23 37
Facts- Transport
• Only 18 per cent of households do not have any of the specified assets — radio, TV, computer/laptop, phones, means of transportation (bicycle, car/jeep/van, scooter, motorcycle/moped).
• Bicycle penetration :Household penetration for bicycle inched up marginally from 43.7% to 44.8%. In urban India the penetration for bicycle actually declined from 46.0% to 41.9%. Among the larger states Uttar Pradesh and Punjab have a penetration level of 60% plus.
04/07/23 38

Facts- Transport• Two Wheeler growth: Household penetration of two
wheelers on an all India basis increased from 11.7% to 21.0% over the decade 2001-11. two wheeler household penetration in rural India more than doubled to 14.3%, the growth in urban India was from 24.7% to 35.2%. Above average growth recorded for North eastern states and Bihar.
• Household penetration for passenger vehicles almost doubles: Four wheeler penetration jumped from 2.5% to 4.7% over 2001-11. In the urban India it was at 9.7% while in the rural region it was at 2.3%. High growth was recorded in Rajasthan & Gujarat.
04/07/23 39
Facts : Ownership of Vehicles
• Ownership of multiple vehicles : Considering the household penetration level of 4.7% on an all India basis for passenger vehicles, we derive a vehicle population of 11.6mn units. However, as per the industry data available 13.4mn vehicles have been sold over the ten year period of 2001-2011.A portion of the 13% difference could be explained by ownership of multiple PVs in a household.
04/07/23 40
Observation : Transport• The demand for two wheelers would continue to be
driven by the rural India as penetration levels continue to remain low at 14.3. For passenger vehicles there would be an equal demand pull from both rural and urban India as penetration levels are low in both the regions.
• The geographical demand is expected to change over the forthcoming decade. Also considering that on a pan India basis 80% of the households still do not own a two wheeler and 40% of the population have no mode of transport, saturation in demand for two wheelers is still some years away.
04/07/23 41
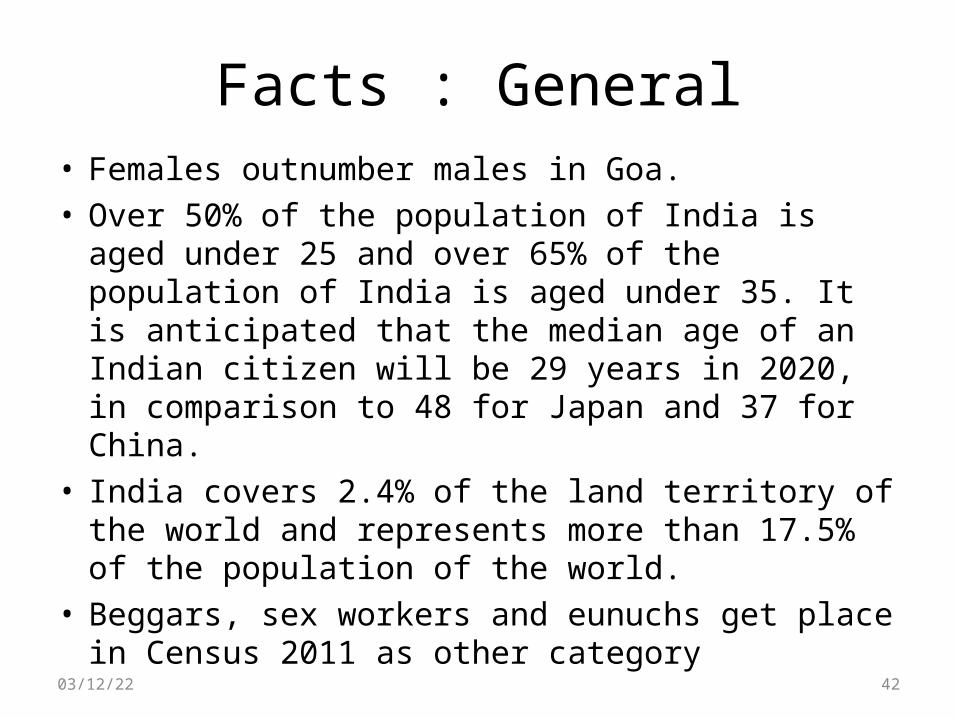
Facts : General• Females outnumber males in Goa.• Over 50% of the population of India is aged under 25
and over 65% of the population of India is aged under 35. It is anticipated that the median age of an Indian citizen will be 29 years in 2020, in comparison to 48 for Japan and 37 for China.
• India covers 2.4% of the land territory of the world and represents more than 17.5% of the population of the world.
• Beggars, sex workers and eunuchs get place in Census 2011 as other category
04/07/23 42

Facts : General
Total expenditure and materials used : • Cost Rs. 2200 crore • Cost per person Rs. 18.33 • No. of Census Functionaries 2.7 million • No. of Languages in which Schedules were canvassed 16 • No. of Languages in which Training Manuals prepared 18 • No. of Schedules Printed 340 million • No. of Training Manuals Printed 5.4 million • Paper Utilised 12,000 MTs • Material Moved 10,500 MTs
04/07/23 43
04/07/23 44
References
• http://www.census2011.co.in/• http://articles.timesofindia.indiatimes.com/2011-03-
31/india/29365558_1_uts-percentage-decadal-growth-rates-census
• http://censusindia.gov.in/• http://en.wikipedia.org/wiki/2011_census_of_India• http://www.mapsofindia.com/census2011/
04/07/23 45
THANK YOU -Presented By-
Aditya KrishnanDeepesh KothariGautam Agarwal
Kandarp DesaiSaya DhingraSneh ShuklaTushar Bhatt
04/07/23 46


