FEWS NET 1717 H Street NW Washington DC 20006 [email protected]FEWS NET is a USAID-funded activity. The authors’ views expressed in this publication do not necessarily reflect the view of the United States Agency for International Development or the United States Government. CENTRAL AFRICAN REPUBLIC Desk Review May 2012 EXECUTIVE SUMMARY Central African Republic is a landlocked country nearly the size of Texas at the very heart of the African continent, with slightly more than 5 million people and valuable natural resources. Of this 5 million people, population is mostly concentrated in the southern, western, and southwestern areas of the country, particularly in the capital, Bangui. CAR is endowed with vast swaths of arable land, robust forests, and diamonds. Despite these resources and the ecological conditions that make agriculture viable, a number of limiting factors render CAR a chronically underperforming country in both a general economic sense, and specifically in the area of food security. In 2011, CAR ranked 179 out of 187 countries on the Human Development Index, and had a per capita income of around $767. WFP has identified 7.5 percent of households as severely food insecure, and 22.7 percent as moderately food insecure. As a result of successive coups and the presence of foreign militants, civil insecurity has been and remains a serious threat to the creation and stability of a well-functioning economy. Moreover, CAR’s external neighbors also suffer from significant instability and civil insecurity issues, which have resulted in an influx of refugees. To the north, CAR shares a long stretch of its border with Chad, which has been a source of significant numbers of refugees fleeing insecurity there. A shorter (though still significant) part of CAR’s northeastern border faces Sudan, while South Sudan is directly to the east. The Democratic Republic of the Congo occupies the greater majority of CAR’s southern border, with Congo to the southwest, and Cameroon due west. FEWS NET staff conducted a desk review for the Central African Republic. Livelihoods-related information has been collected using a variety of publicly available reports, studies and food security analyses that provide useful contextual and specific livelihoods information. No single, definitive rural or urban livelihoods zoning and mapping study has been completed for CAR. However, given the resources available, and on-the-ground activity by a number of international organizations, including WFP and the World Bank, it is possible develop a sense of which areas are in greatest need of livelihoods analysis, and what the general outcome of that study might be. Available Markets and Trade information is useful for identifying the most important commodities, the distribution of households that rely on markets to meet their dietary needs, and for gaining a broad understanding of the flow of these commodities. However, there is very little reliable price data available for markets outside of Bangui (with Bangui being the most food secure area of the country). Other price data that has been collected and published were national averages (though it is unclear what data went into calculating the “average”). For a country with very weak infrastructure and a lack of information on in-country trade, a more geographically diverse and specific collection of food price data may be of great use. MARKETS AND TRADE Important Food Commodities According to WFP’s Global Analysis of Vulnerability and Food Security conducted in CAR (2009) (otherwise known as Analyse Globale de la Vulnérabilité et de la Sécurité Alimentaire (AGVSA)), cassava is the most important staple food crop, and at 40 percent of total crop area planted, is the highest among all crops in CAR (WFP, 2009). Groundnuts and maize are also important crops, following secondary crops, such as millet, sorghum, sesame, rice, and market-gardening activities (WFP, 2009). According to WFP, yams, taro, bananas, and plantains are only “marginally” important. Market Structure • Market Centers: In 2011, WFP conducted a study on market functioning that used seven major regions (along with their major cities) as market centers for its analysis of market integration, including: o Region 1: Bimbo/Boda o Region 2: Berbérati/Bouar
FEWS NET is a USAID-funded activity. The authors’ views expressed in this publication do not necessarily reflect the view of the United States Agency for International Development or the United States Government.
CENTRAL AFRICAN REPUBLIC Desk Review May 2012 EXECUTIVE SUMMARY Central African Republic is a landlocked country nearly the size of Texas at the very heart of the African continent, with slightly more than 5 million people and valuable natural resources. Of this 5 million people, population is mostly concentrated in the southern, western, and southwestern areas of the country, particularly in the capital, Bangui. CAR is endowed with vast swaths of arable land, robust forests, and diamonds. Despite these resources and the ecological conditions that make agriculture viable, a number of limiting factors render CAR a chronically underperforming country in both a general economic sense, and specifically in the area of food security. In 2011, CAR ranked 179 out of 187 countries on the Human Development Index, and had a per capita income of around $767. WFP has identified 7.5 percent of households as severely food insecure, and 22.7 percent as moderately food insecure. As a result of successive coups and the presence of foreign militants, civil insecurity has been and remains a serious threat to the creation and stability of a well-functioning economy. Moreover, CAR’s external neighbors also suffer from significant instability and civil insecurity issues, which have resulted in an influx of refugees. To the north, CAR shares a long stretch of its border with Chad, which has been a source of significant numbers of refugees fleeing insecurity there. A shorter (though still significant) part of CAR’s northeastern border faces Sudan, while South Sudan is directly to the east. The Democratic Republic of the Congo occupies the greater majority of CAR’s southern border, with Congo to the southwest, and Cameroon due west. FEWS NET staff conducted a desk review for the Central African Republic. Livelihoods-related information has been collected using a variety of publicly available reports, studies and food security analyses that provide useful contextual and specific livelihoods information. No single, definitive rural or urban livelihoods zoning and mapping study has been completed for CAR. However, given the resources available, and on-the-ground activity by a number of international organizations, including WFP and the World Bank, it is possible develop a sense of which areas are in greatest need of livelihoods analysis, and what the general outcome of that study might be. Available Markets and Trade information is useful for identifying the most important commodities, the distribution of households that rely on markets to meet their dietary needs, and for gaining a broad understanding of the flow of these commodities. However, there is very little reliable price data available for markets outside of Bangui (with Bangui being the most food secure area of the country). Other price data that has been collected and published were national averages (though it is unclear what data went into calculating the “average”). For a country with very weak infrastructure and a lack of information on in-country trade, a more geographically diverse and specific collection of food price data may be of great use. MARKETS AND TRADE Important Food Commodities According to WFP’s Global Analysis of Vulnerability and Food Security conducted in CAR (2009) (otherwise known as Analyse Globale de la Vulnérabilité et de la Sécurité Alimentaire (AGVSA)), cassava is the most important staple food crop, and at 40 percent of total crop area planted, is the highest among all crops in CAR (WFP, 2009). Groundnuts and maize are also important crops, following secondary crops, such as millet, sorghum, sesame, rice, and market-gardening activities (WFP, 2009). According to WFP, yams, taro, bananas, and plantains are only “marginally” important. Market Structure
• Market Centers: In 2011, WFP conducted a study on market functioning that used seven major regions (along with their major cities) as market centers for its analysis of market integration, including:
o Region 1: Bimbo/Boda o Region 2: Berbérati/Bouar
o Region 3: Bozoum/Basoangoa o Region 4: Bambari o Region 5: Bria o Region 6: Bangassou o Region 7: Bangui (5 markets)
Six of the cities listed above are among the 10 largest cities in CAR, and it is reported that markets are most commonly located in the capital cities of each prefecture, along major trades routes, and in mining zones. Moreover, studies repeatedly identify Bangui as a major consumption market, which is supplied by both internal and external producers.
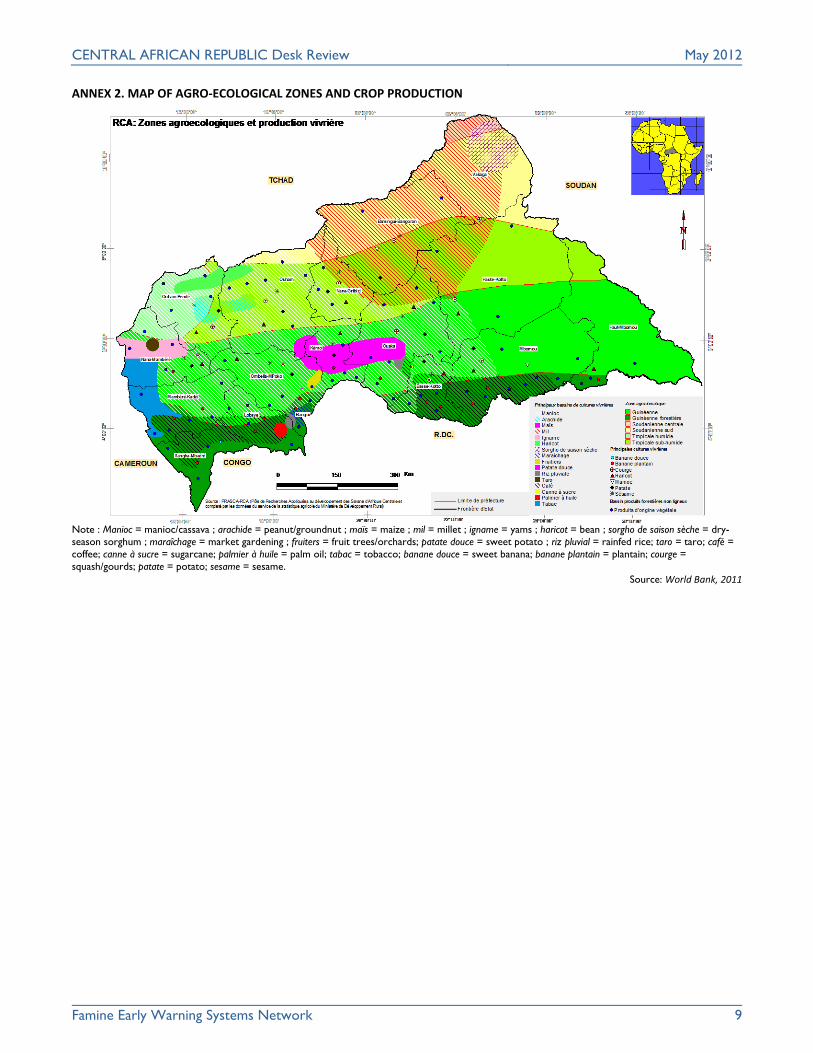
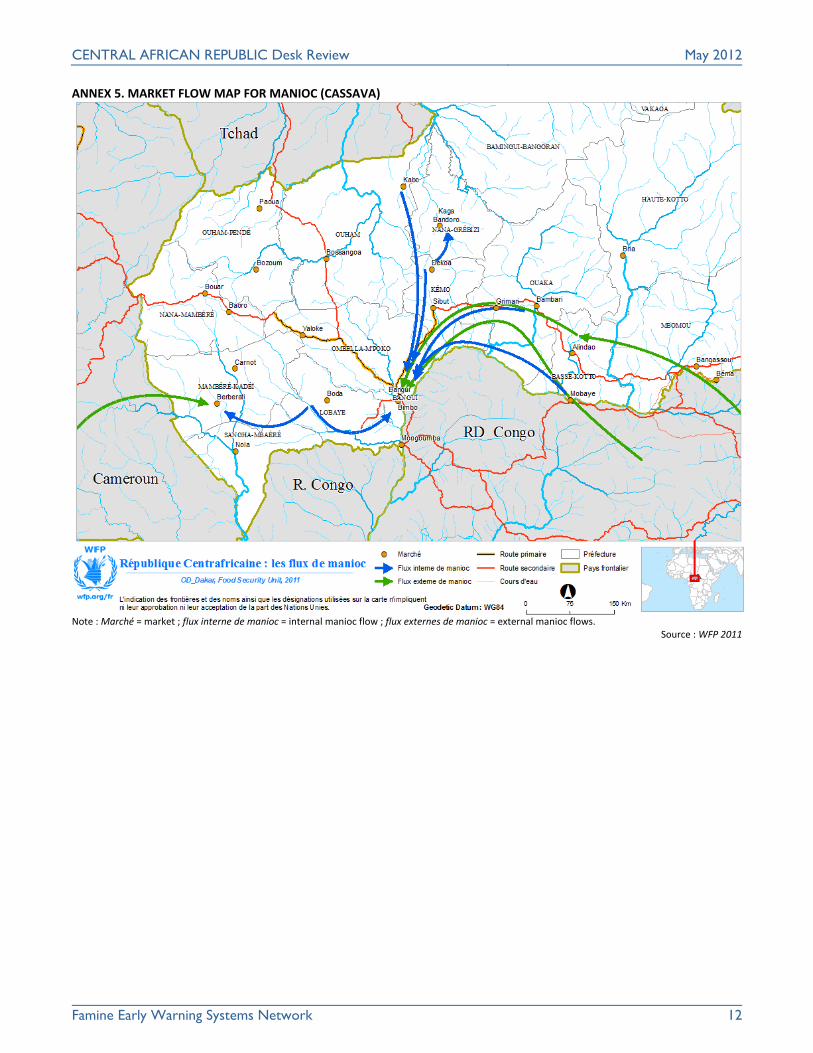
If production areas can be used as an indicator for more where crop surpluses may exist, then they may be used as an indicator for the location of markets of specific crops. For instance, a very small strip of in the Nana-Mambéré prefecture in the far west of CAR is the main site of yam production. In terms of market activity, this area could be the most likely location for wholesale purchasing activities for retail sale in markets elsewhere. In contrast, a very large stretch of land, stretching from the western border with Cameroon to nearly two-thirds of the way across the country, is the site of cassava production. Cassava is the most important crop in terms of CAR production and consumption, and it would be difficult to break down the site of marketing activities for such a large area. Nevertheless, knowing its general location can give us some indication of where wholesale purchasing may be highest.
• Market Channels: Specific information on the locations and characteristics of markets are difficult to find.
However, it should be noted that most of CAR’s population resides in cities or along transportation routes. These locations suggest that urban market centers are a major arena for sales of crops, with roadside sales an option for more direct sales by rural populations.
• Market Infrastructure: Poor road transportation infrastructure is a major constraint on market functioning within
CAR. According to the WTO, only 5 percent of CAR’s 15,000 km of rural/agricultural roads are in “good” condition, with 57 percent in “bad” condition, and the rest unusable. (WTO, 2007). Transport of imports from Kinshasa and Brazzaville via the Oubangui and Congo rivers is possible, but as of 2007, sufficient investment had not yet been completed in order to make more intensive use of the river.
Other sectors remain weak as well. As of 2007, only 3 percent of the population had access to electricity (WTO, 2007). Nationwide water services are also poor, as the Central African Water Distribution Company only reaches 23 percent of CARs population in the 8 largest cities.
• Market Associations: Market associations exist at the sub-prefecture level for most markets, and are organized
into a national federation based in Bangui. According to WFP, this federation is primarily involved with resolving disputes and assisting traders when they encounter problems with local authorities. These associations are less involved with sectoral market structure and supply chain activities.
Market Supply
• Production: Despite having around 15 million hectares of fertile land favorable to crop production, only 0.7 million is currently cultivated, and only around 23 percent of agricultural households make use of fertilizer and pesticides. Crop production data is available using FAO’s online statistical repository, which includes commodity production data for several CAR commodities. In the case of cassava, FAO has data stretching from 1961 through 2010. As is the case with much crop data currently available for CAR, this production data is only available at the national level, and is not disaggregated by geographic region or production center. On a related note, FAO has collected statistics on agricultural land use (area harvested, production, yield) that are available on their website (Global Spatial Database of Agricultural Land-use Statistics). While this data is usefully broken down by prefecture and mapped, as well as available for download, it appears that the only two years for which this data is available are 1992 and 1993.
CENTRAL AFRICAN REPUBLIC Desk Review May 2012
Famine Early Warning Systems Network 3
According to a very recent study conducted by WFP, actual rural agricultural production statistics are harder to find and often unreliable. This study reports that the last agricultural “census” was conducted in 1985, and security concerns and a lack of financing prevented annual agricultural studies after 1992. As a result, agricultural production statistics have been based on constant annual projections (WPF, 2011).
• Livestock and Dairy: In general terms, livestock production has increased markedly during the past two decades. As
with agricultural production, it is difficult to estimate with certainty the amount of livestock in CAR. The same World Bank report says that cattle estimates are based on numbers obtained from a vaccination campaign conducted in 1983, for which it is suspected that some herders did not present their livestock for vaccination. However, the World Bank report does include data from 2000-2010 on animal production for cattle, sheep, goats, pigs, and fowl (poultry).
Livestock production data for 2009 is available in WFP’s extensive research study on food security in CAR, although past production data is not included in that study. Nevertheless, this data is broken down by both préfecture and commodity, rendering a more detailed context in which to analyze future data, should it be collected.
• Food stocks: According to WFP, food stocking is not a well-developed practice in CAR, and is limited by poor
financing available to traders, the humid climate, and insufficient stocking facilities. On average, stocking capacity for each trader/merchant/commercant is estimated to be roughly 8.5 sacks, or about 15 days worth of sales. Groundnuts and cereals (maize, rice, and sorghum) are the most commonly stocked commodities (WFP, 2011).
It is also interesting to note that in the far southeastern market of Zemio (along the DRC border in the Haut-Mbomou prefecture), stocking practices are slightly more robust, which can cover needs for nearly a month during the dry season. The WFP report hypothesizes that this could be due to security concerns and worries about displacement could be a factor encourage stocking behavior. Perhaps an area of future study could include a more specific comparison between areas that have historically been subject to insecurity and population displacement, to see if stocking behavior there is more prevalent (WFP, 2011).
electrical equipment, motor vehicles, chemicals, pharmaceuticals.
• Key Exports: Timber, diamonds, coffee. Diamonds account for about 40 percent of export earnings, while timber accounts for about 16 percent. Cotton is also exported.
• Cross-border trade: Cross-border trade occurs
across borders in nearly every direction, and most intensely in the areas with the highest concentrations of population. The most import commodities from neighboring countries are ground nuts, millet/sorghum, and onions imported from Chad and destined for Bangui, but Cameroon and DRC are also important trading neighbors. Cross-border trade maps are included in this desk review in Annex 1.
Market Demand
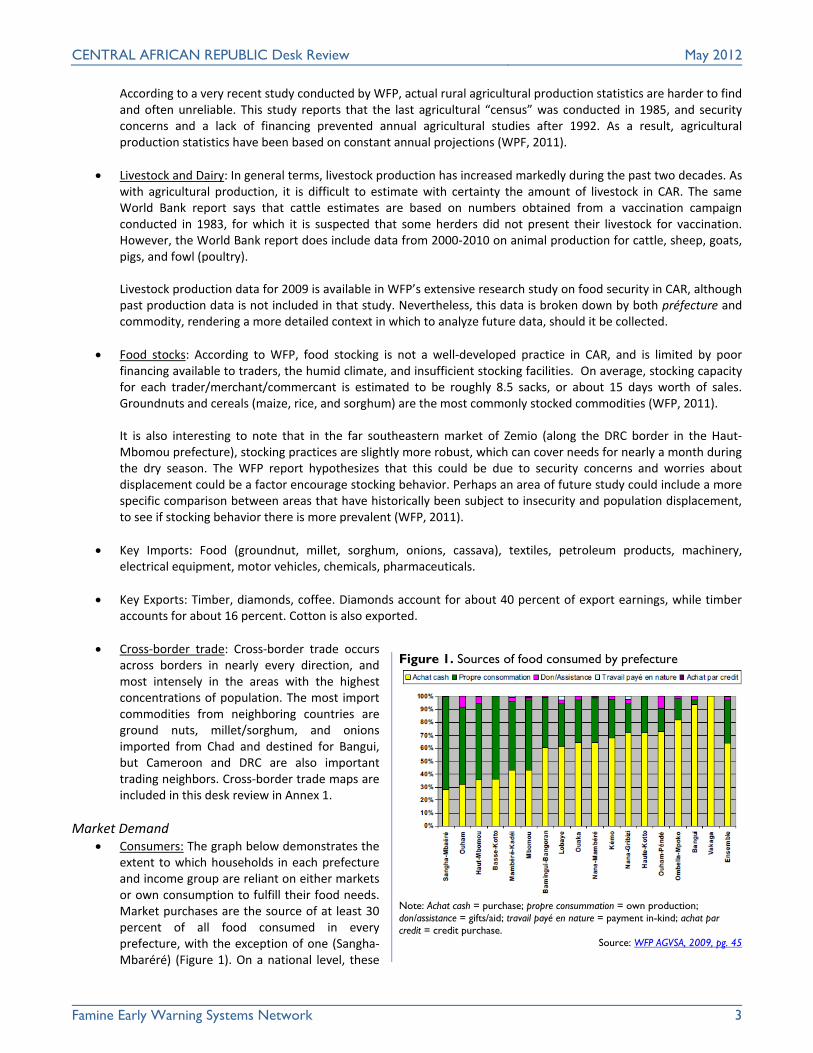
• Consumers: The graph below demonstrates the extent to which households in each prefecture and income group are reliant on either markets or own consumption to fulfill their food needs. Market purchases are the source of at least 30 percent of all food consumed in every prefecture, with the exception of one (Sangha-Mbaréré) (Figure 1). On a national level, these
Figure 1. Sources of food consumed by prefecture
Note: Achat cash = purchase; propre consummation = own production; don/assistance = gifts/aid; travail payé en nature = payment in-kind; achat par credit = credit purchase.
purchases are most important among salaried workers (the least food insecure group, and mainly concentrated in Bangui) (Figure 2). However, markets are still a very important source of food for the more vulnerable households, such as fishing/agriculture and agriculture, for which market purchases represent about 35 percent and 45 percent of food consumed, respectively.
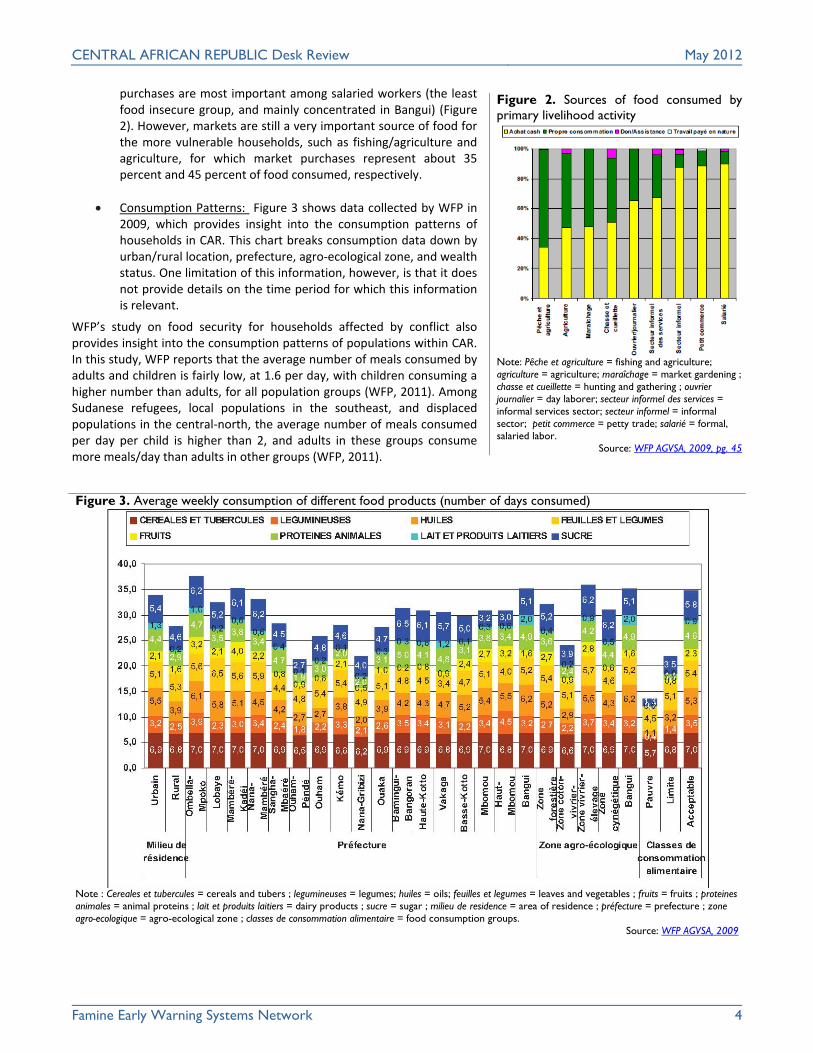
• Consumption Patterns: Figure 3 shows data collected by WFP in 2009, which provides insight into the consumption patterns of households in CAR. This chart breaks consumption data down by urban/rural location, prefecture, agro-ecological zone, and wealth status. One limitation of this information, however, is that it does not provide details on the time period for which this information is relevant.
WFP’s study on food security for households affected by conflict also provides insight into the consumption patterns of populations within CAR. In this study, WFP reports that the average number of meals consumed by adults and children is fairly low, at 1.6 per day, with children consuming a higher number than adults, for all population groups (WFP, 2011). Among Sudanese refugees, local populations in the southeast, and displaced populations in the central-north, the average number of meals consumed per day per child is higher than 2, and adults in these groups consume more meals/day than adults in other groups (WFP, 2011).
Figure 2. Sources of food consumed by primary livelihood activity
Note: Pêche et agriculture = fishing and agriculture; agriculture = agriculture; maraîchage = market gardening ; chasse et cueillette = hunting and gathering ; ouvrier journalier = day laborer; secteur informel des services = informal services sector; secteur informel = informal sector; petit commerce = petty trade; salarié = formal, salaried labor.
Source: WFP AGVSA, 2009, pg. 45
Figure 3. Average weekly consumption of different food products (number of days consumed)
Note : Cereales et tubercules = cereals and tubers ; legumineuses = legumes; huiles = oils; feuilles et legumes = leaves and vegetables ; fruits = fruits ; proteines animales = animal proteins ; lait et produits laitiers = dairy products ; sucre = sugar ; milieu de residence = area of residence ; préfecture = prefecture ; zone agro-ecologique = agro-ecological zone ; classes de consommation alimentaire = food consumption groups.
Market Performance • Prices for commodities – WFP reports main staple food price changes for CAR in their quarterly Price Monitor. With
regard to CAR, this publication reports Bangui market prices for cassava, maize, groundnut oil, and yams. In previous editions of this report, prices for these crops had been reported only using the national average. In is unclear whether these national average calculations were made by CAR’s central statistics service, though this case seems the most likely, as WFP routinely provides details the markets for which prices are collected. Price data disaggregated by geographic region or market center is considerably more difficult to find, especially outside the Bangui market.
The central economics and social studies statistics service (ICASEES) does collect and report some price and CPI information, although online reporting of this data is irregular and is generally from the years 2008-2010. This data is broken down by commodity at the consumption level.
• Livestock prices: No data on livestock prices were found through ICASEES, the World Bank, FAO, or WFP.
• Market Integration: Inter-regional markets in CAR tend to be poorly integrated, according to a WFP study of
market functioning, which was based on price data analysis and anecdotal evidence. In a correlation analysis of seven major markets (which represent some of CAR’s largest cities), no correlation between any two markets broke the 0.5 coefficient, with 0.0 being no correlation, and 1.0 representing complete integration. However, this analysis did show market integration reaching 0.60 and 0.56 coeffecients between the Bozoum/Basoangoa maize market in CAR, and the Chad and Cameroun maize markets, respectively. The Bozoum/Basoangoa market lies in two western prefectures that border Cameroon and Chad. This analysis would seem to indicate that these maize markets are better integrated with their external neighbors than their internal ones, which showed a coefficient of 0.15 (for Bangui). (WFP, 2011).
This study was limited, however, in the extent to which it examined integration of intra-regional trade. The markets it studied were the largest cities, and therefore it is difficult to determine the extent to which there is integration among rural markets, and between rural and urban ones within the same region.
• Sources of income: By far the most important source of income is agriculture, and is a primarily livelihoods strategy
for 45.3 percent of households nationally (WFP, 2009). The next largest group is salaried workers, which represent approximately 12-13 percent of the population, informal sources of income (11.6 percent), hunting and gathering (9.7 percent), and the informal service sector (9.5 percent). Remaining sources include: fishing and agriculture (4.2 percent), commerce (3.6 percent), daily labor (1.6 percent), and market-gardening activities (1.5 percent). WFP’s report also includes a table containing additional information on where these households are generally located, whether they are poor, moderate, or wealthy income groups, and how much of their income is spent on food. Remittances appear to play only a marginal role for most households in CAR. According to the AGVSA, 10 percent of households report receiving remittances, and these tend to favor households in urban areas, rather than rural ones (WFP, 2009).
Market Barriers and Government Policies
• Transportation Infrastructure: Poor transportation infrastructure is a major barrier to better market performance. According to the WTO, only 5 percent of CAR’s 15,000 km of rural/agricultural roads are in “good” condition, with 57 percent in “bad” condition, and the rest unusable. (WTO, 2007).
• Access to Credit: The World Bank cites reports a “near complete lack of an agricultural credit system” (World Bank, 2011).
• Weak demand: A consistent feature of food security analysis for CAR indicates a “vicious cycle” relationship between 1) poor agricultural production/performance and 2) an inefficient commercial environment and poor infrastructure. In this situation, the low level of agricultural production provides little incentive for creating commercial structures and infrastructure to facilitate trade. As a result, the limited ability to conduct trade on a
CENTRAL AFRICAN REPUBLIC Desk Review May 2012
Famine Early Warning Systems Network 6
regional and national level prevents the production sector from benefiting from trade in other areas (such as fertilizer, seeds, etc.) and from access to traders who might be in a better position to market their goods. As a result, both production and commercial activity remain low. (WFP, Sept 2011, pg. 8).
LIVELIHOODS As the first step in FEWS NET’s livelihoods framework, Livelihood Zoning provides a geo-spatial understanding of areas within which people share broadly the same options for meeting their basic needs. This understanding forms a basis to identify local food security monitoring and crisis indicators and aids assistance targeting. In the second step, livelihoods information is disaggregated further, by wealth group, to gain an understanding of how wealth influences access to food and income and a household’s ability to cope with shocks. With this information, food security analysts and decision-makers are better able to project food security outcomes and make informed judgments on appropriate interventions. There is substantial primary and secondary livelihoods-related information available for the Central African Republic, and food security analysis based on this information has been attempted by other organizations. While no definitive, food security-related livelihoods zone study has been conducted in CAR, there are a number of valuable studies that can inform future efforts to determine how potential shocks might impact populations who broadly meet their basic needs in the same way. Several documents reviewed include the following:
• Analyse Globale de la Vulnérabilité et de la Sécurité Alimentaire – République Centrafricaine, 2009. • Evaluation approfondie de la sécurité alimentaire des ménages affectés par les conflits – République Centrafricaine,
2011 • Renforcement du suivi de la vulnérabilité, de l’insécurité alimentaire, et de la nutrition en république
centrafricaine, rapport définitif, World Bank, 2011. • VAM, WFP Food Security Analysis • Interactive Forest Atlas for Central African Republic, World Resources Institute, 2010.
The most important of these studies is the Analyse Globale de la Vulnérabilité et de la Sécurité Alimentaire (AGVSA), conducted in May-June 2009 and published at the end of that year. The AGVSA contains a highly-detailed report on the context and status of food security conditions in CAR. This examination includes details on natural capital, agricultural and animal production, social capital, migration, health, physical capital, wealth indices and economic capital, food and nonfood-related spending patterns, sources of revenue, livelihoods, food diversity, food consumption profiles, potential shocks, vulnerabilities, and response strategies. In many cases, this report disaggregates its analysis based on area of residence (rural vs. urban), prefecture, agro-ecological zone, and food consumption class. Below is an agro-ecological zone and food crop production zone map for CAR (Annex 1), followed by a food crop production zone map (Annex 2). Additional information included in WFP AGVSA report is a livelihoods zone map, which breaks down the livelihoods zones by sub-prefecture. While a livelihoods zone map in perspective, future livelihoods analysis work will need to be conducted in order to link these zones to specific markets, wealth groups, vulnerability to shocks, and potential coping strategies. SELECTED BIBLIOGRAPHY “Aid for Trade at a Glance 2009 – Central African Republic.” Organization for Economic Co-operation and Development. Last accessed May 21, 2012 at http://www.oecd.org/document/56/0,3746,en_2649_201185_45844344_1_1_1_1,00.html Center for International Earth Science Information Network, The Earth Institute, Columbia University. “Pastures, 2000: Africa.” Global Agricultural Lands. Copyright 2012. Last accessed May 21, 2012 at http://sedac.ciesin.columbia.edu/maps/gallery/set/aglands-pastures-2000 Doctors Without Borders. “Nutrition Emergency in Central African Republic.” Published September 22, 2009. Last accessed May 21, 2012 at http://www.doctorswithoutborders.org/press/release.cfm?id=3954&cat=press-release
Enhanced Integrated Framework, World Trade Organization. “Central African Republic: Diagnostic Trade Integration Study – Draft.” March 2007. Last accessed May 21, 2012 at http://www.enhancedif.org/EN%20web%20pages/Where%20we%20work/CAR.htm#a FAOSTAT, 2012. Agricultural Land use Statistics – Central African Republic. Food and Agriculture Organization. Retrieved May 20, 2012, from http://faostat3.fao.org/home/index.html#VISUALIZE_BY_DOMAIN Institut Centrafricain des Statistiques, des Etudes Economiques et Sociales (ICASEES). “Prix Info Avril 2010.” Retrieved May 20, 2012, from http://www.minplan-rca.org/documents-cles/cat_view/22-icasees. Institut Centrafricain des Statistiques, des Etudes Economiques et Sociales (ICASEES). “Prix Info Mars 2010.” Retrieved May 20, 2012, from http://www.minplan-rca.org/documents-cles/cat_view/22-icasees. Socioeconomic Data and Applications Center (SEDAC). “Central African Republic: Population Density, 2000.” Center for International Earth Science Information Network, The Earth Institute, Columbia University. Last accessed on May 21, 2012 at http://sedac.ciesin.columbia.edu/maps/gallery/set/grump-v1-population-density/2 The World Bank. “The Central African Republic’s Infrastructure: A Continental Perspective.” Dominguez-Torrez, Carolina and Foster, Vivien. Policy Research Working Paper 5697. June 2011. Last accessed May 21, 2012 at http://water.worldbank.org/node/84041 The World Bank. “Trade policy and regionalism in the Central African Republic.” Walkenhorst, Peter. August 2006. Last accessed May 21, 2012 at http://mpra.ub.uni-muenchen.de/23863/ World Food Programme. “Analyse du fonctionnement des marchés en relation avec la sécurité alimentaire des ménages.” November 2011. Last accessed May 21, 2012 at http://www.wfp.org/content/republique-centrafricaine-analyse-marches-securite-alimentaire-des-menages-novembre-2011 World Food Programme. “Analyse Globale de la Vulnérabilité et de la Sécurité Alimentaire (AGVSA): République Centrafricaine. Published in December 2009 (May-June 2009 data). World Health Organization. “Central African Republic: Factsheets of Health Statistics 2010.” Last accessed online at http://www.afro.who.int/en/central-african-republic/country-health-profile.html World Health Organization. “Central African Republic: health profile.” Published in 2011, Data from 2000. World Resources Institute and le Ministère des Eaux, forets, chasse et péche de la République Centrafricaine. “Atlas Forestier Interactive de la République Centrafricaine.” Version 1.0, Document de Synthèse. 2010. Last accessed on May 21, 2012 at http://www.wri.org/publication/interactive-forest-atlas-central-african-republic World Bank. “République Centrafricaine: Renforcement du suivi de la vulnérabilité, de la sécurité alimentaire et de la nutrition en République Centrafricaine, Rapport définitif.” Décembre 2011.
ANNEX 1. MAP OF AGRO-ECOLOGICAL ZONES IN THE CENTRAL AFRICAN REPUBLIC
Source: WFP AGVSA, 2009
Note : Zone forestière ou zone équitoriale = Forest or equitorial zone ; Zone vivrier élevage ou zone guinéene = Cereals and livestock or Guinean Zone ; Zone coton-vivrier-élevage ou zone soudano-guinéene = Cotton-cereals-livestock zone or Sudano-Guinean zone ; Zone cynégétique et touristique = Hunting and Tourism zone.


![Central African Republic's Constitution of 2004 with ... · Central African Republic 2004 (rev. 2010) Page 5 In the Central African Republic one is neither subject [to] nor [has]](https://static.documents.pub/doc/80x56/601873c5009151652554c5ec/central-african-republics-constitution-of-2004-with-central-african-republic.jpg)


