37 Iranian Journal of Chemical Engineering Vol. 12, No. 2 (Spring 2015), IAChE CFD Insight of the Flow Dynamics and Velocity Fields in a Gas Turbine Combustor with a Swirl Flame A. R. Bahramian * Department of Chemical Engineering, Hamedan University of Technology, Hamedan, Iran Abstract The computational fluid dynamics (CFD) simulations of gas turbine combustor were performed for CH 4 /air flow with swirl flames. The flow dynamics and velocity fields were numerically studied and the results compared with the experimental data obtained by laser measurements. Two-dimensional (2D) and three-dimensional (3D) simulations were performed with consideration of a two-step oxy-combustion reaction kinetics model. The Eddy Dissipation Concept (EDC) combustion model was used in the numerical analysis. The numerical results obtained by EDC model were in good agreement with the experimental data. However, an error analysis showed that the simulated mean velocity components obtained by 3-D geometry were more consistent with the experimental data than those obtained by 2-D geometry. Keywords: Gas Turbine, Combustion, CFD Simulation, Flow Dynamics, Velocity fields 1. Introduction Swirl flame is applied in combustion processes because it allows reaching high energy conversion. Swirling flows can show various phenomena such as vortex cores, vortex breakdown and their transition. These phenomena are important to combustor design in order to reach an optimum operational condition through the control of the combustion fluid dynamics and the flow field of the flame and the fuel in the combustion chamber [1-4]. In recent years, with the increase in industrial applications, serious research efforts have been made concerning Corresponding author: [email protected]development of combustion systems with low pollutant emissions, small coke formation and reduced fuel consumption [2,5]. Considerable experimental methods have been employed to measure the flow fields and velocity components, which can effect on the flame stability and emission limits and performance of combustors. For example, flame structure is measured by the techniques such planar laser-induced uorescence (PLIF) or particle imaging velocimetry (PIV). Laser Doppler Velocimetry (LDV) and PIV techniques are used to determine the flow fields and velocity components in the combustion chamber [5-8].
Transcript
37
Iranian Journal of Chemical Engineering Vol. 12, No. 2 (Spring 2015), IAChE
CFD Insight of the Flow Dynamics and Velocity Fields in a Gas
Turbine Combustor with a Swirl Flame
A. R. Bahramian*
Department of Chemical Engineering, Hamedan University of Technology, Hamedan, Iran
Abstract The computational fluid dynamics (CFD) simulations of gas turbine combustor were performed for CH4/air flow with swirl flames. The flow dynamics and velocity fields were numerically studied and the results compared with the experimental data obtained by laser measurements. Two-dimensional (2D) and three-dimensional (3D) simulations were performed with consideration of a two-step oxy-combustion reaction kinetics model. The Eddy Dissipation Concept (EDC) combustion model was used in the numerical analysis. The numerical results obtained by EDC model were in good agreement with the experimental data. However, an error analysis showed that the simulated mean velocity components obtained by 3-D geometry were more consistent with the experimental data than those obtained by 2-D geometry. Keywords: Gas Turbine, Combustion, CFD Simulation, Flow Dynamics, Velocity fields
1. Introduction Swirl flame is applied in combustion processes because it allows reaching high energy conversion. Swirling flows can show various phenomena such as vortex cores, vortex breakdown and their transition. These phenomena are important to combustor design in order to reach an optimum operational condition through the control of the combustion fluid dynamics and the flow field of the flame and the fuel in the combustion chamber [1-4].
In recent years, with the increase in industrial applications, serious research efforts have been made concerning
development of combustion systems with low pollutant emissions, small coke formation and reduced fuel consumption [2,5].
Considerable experimental methods have been employed to measure the flow fields and velocity components, which can effect on the flame stability and emission limits and performance of combustors. For example, flame structure is measured by the techniques such planar laser-induced uorescence (PLIF) or particle imaging velocimetry (PIV). Laser Doppler Velocimetry (LDV) and PIV techniques are used to determine the flow fields and velocity components in the combustion chamber [5-8].
CFD Insight of the Flow Dynamics and Velocity Fields in a Gas Turbine Combustor with a Swirl Flame
38 Iranian Journal of Chemical Engineering, Vol. 12, No. 2
The numerical simulation techniques have shown great potential for studying combustion characteristics and flow dynamics of the flame and the fuel in the burner. Computational fluid dynamic (CFD) modeling helps to explain the details of combustion characteristics and permits developing quantitative process models that enable predictive process optimization. But, the experimental analysis is a useful database for verification and validation of CFD simulation codes and combustion models [9-10].
Combustion flow regimes are usually applied to characterize the physical processes that dominate a flame and to choose turbulence models. The combustion flow regime is not only governed by turbulence models but depends on mixing caused by velocity and pressure fluctuations; different combustion flow regimes are achievable depending on the fuel injection system, type of fuel, and chamber geometry [11]. CFD Simulation results showed that among the turbulence models such as K- , renormalization group (RNG) K- and Reynolds stress model (RSM), the RNG K- model better describes flows in curved surfaces and rotary flows than the other models. There are several mathematical models such as Eddy Dissipation Model (EDM), Eddy Dissipation Concept (EDC) model, Eddy Dissipation/ Finite Rate (EDFR) model, and Laminar Flamelet Model (LFM) to study the combustion flow regimes in the burner. The simulation results showed that the EDC model was suitable to describe combustion reactions with pre-mixture between CH4 and air in nozzles [12-14].
In the past, some methodologies were
introduced for the modeling of the combustion process. The EDC model, which is an extended version of Eddy Break-Up model (EBU), is one of the other models proposed by Magnussen and Hjertager, which is an extension of the ED model to include detailed chemical mechanism of turbulent reacting flows in combustion systems [15]. The EDC model was established efficiently without the need for changing the coefficients (i.e., the rate exponent and Arrhenius rate parameters) in the premixed combustion systems, where the chemical kinetic rate is faster than the overall fine structure mixing rate.
Stefanidis et al. performed CFD simulations using a 3-D mathematical model for predicting flow, temperature and concentration fields in the radiation section of industrial scale steam cracking units [16]. They proposed an extended combustion model to make use of Detailed Reaction Kinetics (DRK) which permits detailed study on the flame structure in combination with an EDC model for combustion modeling in steam cracking furnaces under normal firing conditions.
Maghbouli et al. reported the CFD results of turbulent natural gas combustion for a jet in a co-flow of lean combustion products in the combustion burner system. Their numerical analysis showed that the use of EDC model in conjunction with a detailed chemistry mechanism predicted the axial profiles of mean velocity and temperature in the flue gas acceptably well when compared to experimental data. Also, they reported that the realizable k- model shows better performance in the prediction of entrainment [17].
Bahramian
Iranian Journal of Chemical Engineering, Vol.12, No. 2 39
Because of reduction of NOx in SNCR systems and CO burnout in quenched flames, the flames are usually operated lean [18]. At this condition, some flame instabilities can be seen experimentally. Regarding this fact, one-dimensional (1-D), two-dimensional (2-D) and three-dimensional (3-D) geometry simulation models were applied to study the swirl flame propagation and its effect on combustion parameters and emission formation process. It can be expected that using a 3-D geometry provides a higher level of flame instability which agrees well with the experimental observations. But, in the case of complex and large systems, 1-D or 2-D analyses were chosen because of the lower required computation time.
Benedetto et al. investigated the role of the cross-sectional geometry on the ignition-extinction behavior of catalytic micro combustors using a two-dimensional CFD simulation [19]. Their predicted results showed that the two-dimensional models neglect the fluctuations of velocity, temperature, and species concentration, especially for the systems in small-scale. Thus, ignoring these parameters may lead to inaccurate predictions for combustion systems in the micro-scale.
The present study is focused on turbulent combustion CFD modeling of swirl flame in a gas turbine combustor. The flow dynamics and velocity fields were numerically studied and the results compared with available experimental data. The EDC combustion model, which introduces turbulence-chemistry interactions, was used in numerical analysis by considering a two-step oxy-combustion reaction kinetics model. CFD simulations were performed in 2-D and 3-D
geometries to study the dynamics of flow. The results of each simulation were compared with the measured data reported by Weigand et al. [20] to validate the used model and applied geometry.
2. Simulation procedure An overview of the gas flow equations, EDC model, boundary conditions (BCs), and the numerical procedures are presented in the following section. 3. Gas flow modeling The transport equations such as continuum, momentum, energy, and mass balance and dissipation rate of turbulent kinetic energy are presented in the following:
0jj
ux
(1)
ijj i i
j i j
pu u gx x x
(2)
1
j eff tj j j
NSm
t m h radmj j
Tu Hx x x
yD D h S Sx x
(3)
Where eff effH E ,
2 ij ijS S S ,
12
jiij
j i
uuSx x
, t t p tc Pr , 2t c k ,
0 0845C . , t tD D . Sh is the source of
energy caused by chemical reaction (kW/m3), and Srad is the source of radiation obtained from the solution of discrete ordinates radiation model equations.
CFD Insight of the Flow Dynamics and Velocity Fields in a Gas Turbine Combustor with a Swirl Flame
40 Iranian Journal of Chemical Engineering, Vol. 12, No. 2
j k t kj j j
kku Px x x
(4)
where 139k . , 2t C k , 2k t ij ijP S S
2
1 2
j tj j j
k
ux x x
C P Ck k
(5)
Where 01 3
11 42
1C . , sK ,
0 438. , 0 012. , 2 168C .
4. EDC model The EDC is based on the turbulent energy cascade that means that larger eddies break up into smaller eddies. Through a step-wise description of the turbulence energy cascade process from large to progressively smaller eddies, an expression for the mass fraction * of the fine-structures and for the characteristic time scale * for mass exchange between the fine-structures and the bulk fluid is derived, dependent on the turbulence quantities and the viscosity:
3 4
ck
(6)
where is the kinematic viscosity, is the turbulent dissipation rate, k is the turbulent kinematic energy and c is volume constant and reported as 2.1377 [15,21]. The time scale for the mass transfer from the fine structure to the fluid is:
1 2
EDC c (7)
1
1 1k ,tot
k ,mix k i
RR R C ,T
(8)
where c is time scale constant and reported as 0.4082 in the literature [21].
The reaction rates for the two-step mechanism describing methane oxidation process that were derived by Westbrook and Dryer (1981) are presented in the Table 1 [22].
The total rate of reaction should be given in the following form:
Because the present equation may make numerical problems in the calculation of the overall rate, it is not used in the literature.
Table 1 Simplified reaction equations used for methane.
No. Reaction scheme Kinetic reaction
(1) CH4+1.5 O2 CO + 2H2O R1=1.5 1013 e-125604/RTCCH4-0.3
(2) CO + 0.5 O2 CO2 R2=3.98 1020 e-167472/RTCCOCCH2O0.5 CO2
0.25
Bahramian
Iranian Journal of Chemical Engineering, Vol.12, No. 2 41
5. Boundary conditions (BCs) The main assumptions and BCs used in the simulations are: 1. Continuous phase is treated as ideal gas. 2. Combustion is assumed to be stoichiometric. 3. The initial mass fractions of all species were set to their inlet values. 4. No-slip BC is considered at the wall of combustion chamber. 5. The air velocity was selected as 20 m/s in the simulations. 6. The pressure-outlet BC was selected for the outlet side of combustor. The pressure is also assumed to be atmospheric.
6. Numerical procedure The combustion modeling using EDC model was carried out in steady state mode of calculations. The two-dimensional (2-D) and three-dimensional (3-D) axisymmetric solver was selected in the present simulations. To model the gas-phase reaction, a two-step mechanism was chosen. Fluent software was used to plot the characteristics of the flow and gambit software was used to design the 2D and 3D models. The transport equations (1–5) were discretized by finite volume technique. The k- turbulence kinetic model is a semi-empirical one based on model transport equations for turbulence kinetic energy (k) and dissipation rate ( ). The k- turbulence model, constants and parameters are obtained from the following equations:
tk
k
. vk . k P Dt (9)
where 2t C k and 2Dt k RT
2
1 2t
kk
. vk . C P Ck k
(10)
Where k and are the turbulence Prandtl number for k and , respectively.
The Semi-Implicit Method for Pressure-Linked Equations (SIMPLE algorithm) is used to couple the pressure and velocity iterative calculations. The computational domain is discretized using tetrahedral cells.
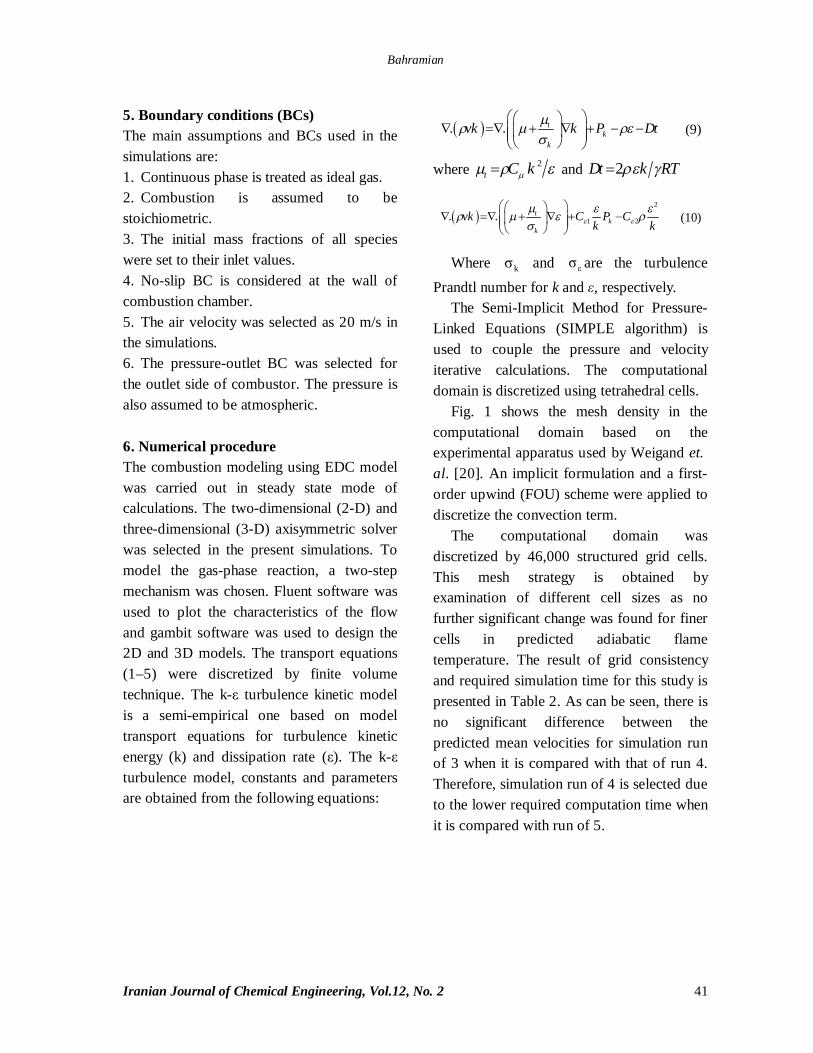
Fig. 1 shows the mesh density in the computational domain based on the experimental apparatus used by Weigand et. al. [20]. An implicit formulation and a first-order upwind (FOU) scheme were applied to discretize the convection term.
The computational domain was discretized by 46,000 structured grid cells. This mesh strategy is obtained by examination of different cell sizes as no further significant change was found for finer cells in predicted adiabatic flame temperature. The result of grid consistency and required simulation time for this study is presented in Table 2. As can be seen, there is no significant difference between the predicted mean velocities for simulation run of 3 when it is compared with that of run 4. Therefore, simulation run of 4 is selected due to the lower required computation time when it is compared with run of 5.
CFD Insight of the Flow Dynamics and Velocity Fields in a Gas Turbine Combustor with a Swirl Flame
42 Iranian Journal of Chemical Engineering, Vol. 12, No. 2
(a) (b) (c)
Figure 1. (a) Schematic diagram of experimental apparatus, (b, c) the computational meshes used for present simulation. (b) 2-D and (c) 3-D geometry.
Table 2 The results of grid independency study.
Run No. of grid cells Predicted mean
velocity at z=0 and r=0 (m/s)
Difference Percentage (%)
Total simulation time (h)
1 22000 -24.6 16.25 18
2 34000 -23.7 12.51 21
3 46000 -22.4 6.83 24
4 55000 ~ -22.3 6.81 32
5 62000 ~ -22.1 6.79 ~ 48
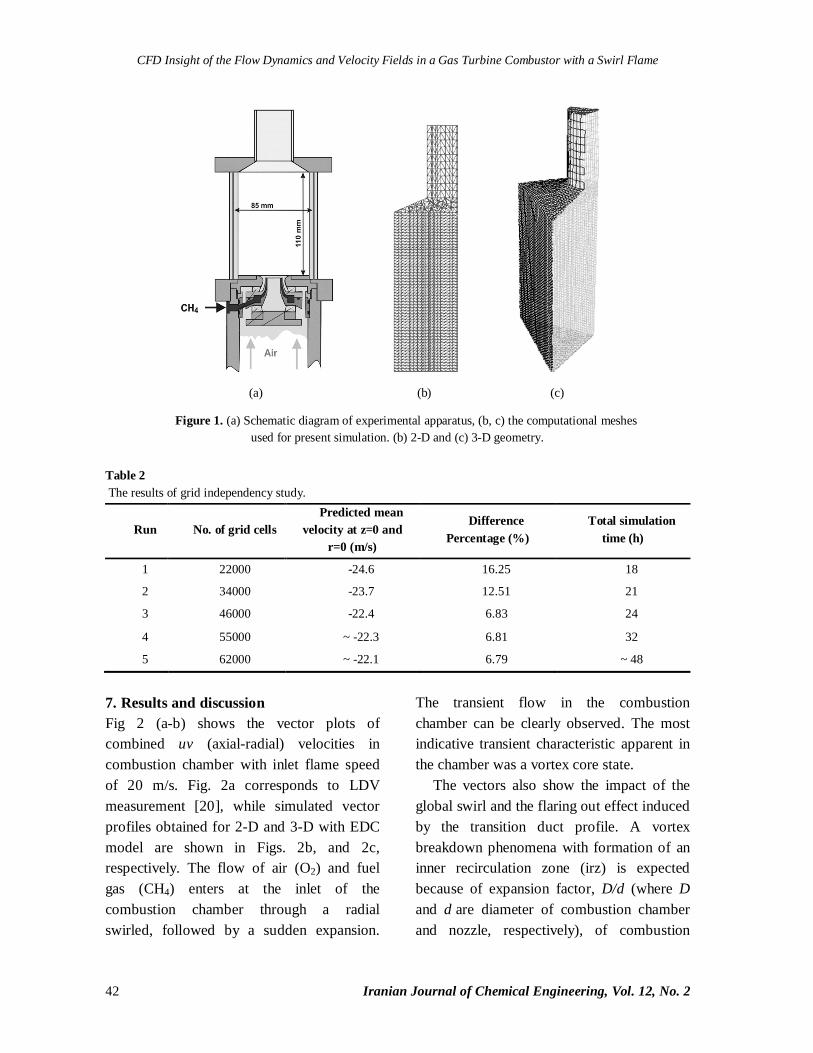
7. Results and discussion Fig 2 (a-b) shows the vector plots of combined uv (axial-radial) velocities in combustion chamber with inlet flame speed of 20 m/s. Fig. 2a corresponds to LDV measurement [20], while simulated vector profiles obtained for 2-D and 3-D with EDC model are shown in Figs. 2b, and 2c, respectively. The flow of air (O2) and fuel gas (CH4) enters at the inlet of the combustion chamber through a radial swirled, followed by a sudden expansion.
The transient flow in the combustion chamber can be clearly observed. The most indicative transient characteristic apparent in the chamber was a vortex core state.
The vectors also show the impact of the global swirl and the flaring out effect induced by the transition duct profile. A vortex breakdown phenomena with formation of an inner recirculation zone (irz) is expected because of expansion factor, D/d (where D and d are diameter of combustion chamber and nozzle, respectively), of combustion
Bahramian
Iranian Journal of Chemical Engineering, Vol.12, No. 2 43
chamber was selected to be 3.4. An outer recirculation zone (orz) was established because of the confinement. As shown in Fig. 2, the flow field of the flame shows an irz and an orz across the axial direction at the center and near the walls of combustion chamber, respectively.
The recirculation zone, which is attributable to the asymmetric outlet of the flue gas in the chamber, starts from near the wall at an approximate height of 60 mm and expands to the upper heights and toward the combustion chamber. As shown in the results of 3-D simulations (Fig. 2c), a recirculation zone was predicted in the lower part of combustion chamber, at z ~ 40 mm, by applying EDC model compared with the 2-D geometry (Fig. 2b).
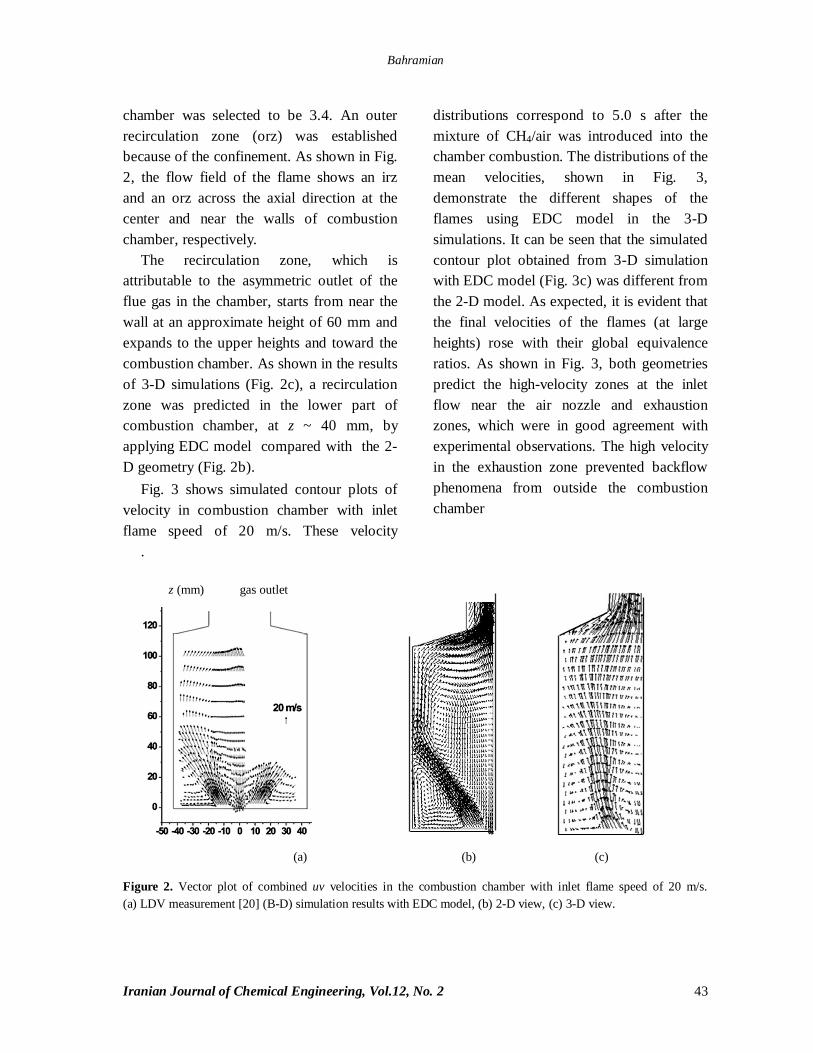
Fig. 3 shows simulated contour plots of velocity in combustion chamber with inlet flame speed of 20 m/s. These velocity
distributions correspond to 5.0 s after the mixture of CH4/air was introduced into the chamber combustion. The distributions of the mean velocities, shown in Fig. 3, demonstrate the different shapes of the flames using EDC model in the 3-D simulations. It can be seen that the simulated contour plot obtained from 3-D simulation with EDC model (Fig. 3c) was different from the 2-D model. As expected, it is evident that the final velocities of the flames (at large heights) rose with their global equivalence ratios. As shown in Fig. 3, both geometries predict the high-velocity zones at the inlet flow near the air nozzle and exhaustion zones, which were in good agreement with experimental observations. The high velocity in the exhaustion zone prevented backflow phenomena from outside the combustion chamber
.
(a) (b) (c)
Figure 2. Vector plot of combined uv velocities in the combustion chamber with inlet flame speed of 20 m/s. (a) LDV measurement [20] (B-D) simulation results with EDC model, (b) 2-D view, (c) 3-D view.
z (mm) gas outlet
CFD Insight of the Flow Dynamics and Velocity Fields in a Gas Turbine Combustor with a Swirl Flame
44 Iranian Journal of Chemical Engineering, Vol. 12, No. 2
Figure 3. Simulated contour plots of velocity in the combustion chamber with inlet flame speed of 20 m/s. (A, B) simulation results with EDC model, (a) 2-D view, (b) 3-D view.
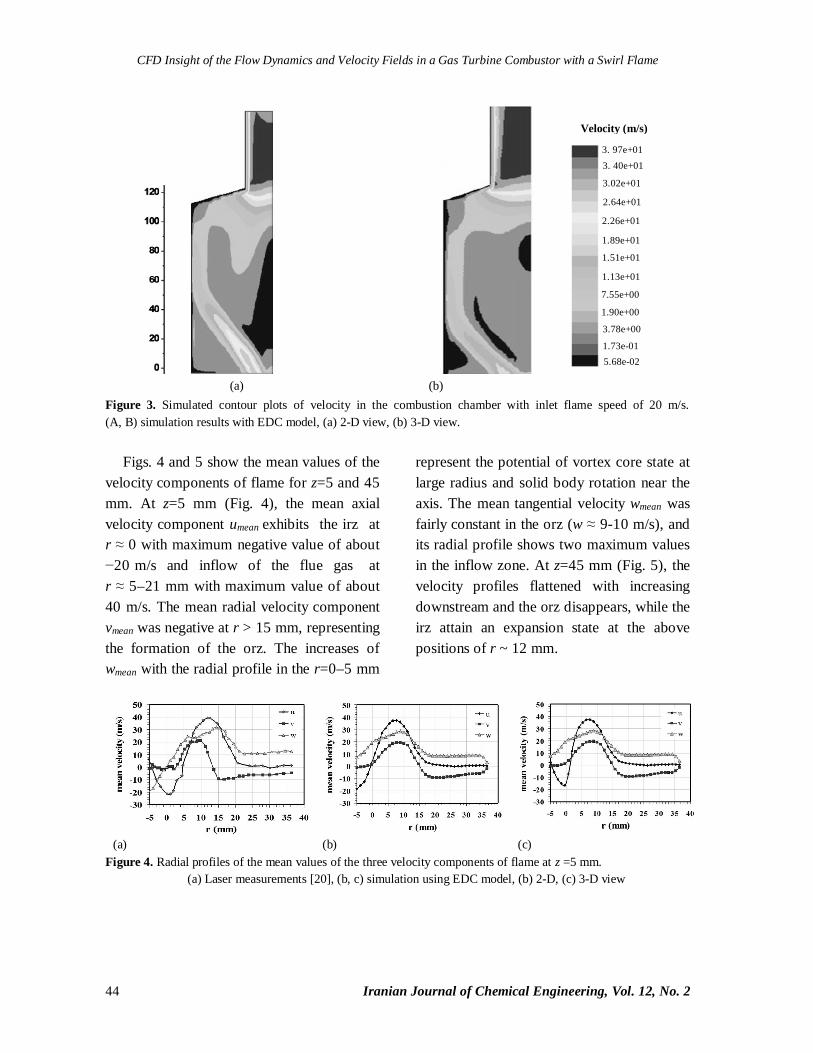
Figs. 4 and 5 show the mean values of the
velocity components of flame for z=5 and 45 mm. At z=5 mm (Fig. 4), the mean axial velocity component umean exhibits the irz at r 0 with maximum negative value of about
20 m/s and inflow of the flue gas at r 5–21 mm with maximum value of about 40 m/s. The mean radial velocity component vmean was negative at r > 15 mm, representing the formation of the orz. The increases of wmean with the radial profile in the r=0–5 mm
represent the potential of vortex core state at large radius and solid body rotation near the axis. The mean tangential velocity wmean was fairly constant in the orz (w 9-10 m/s), and its radial profile shows two maximum values in the inflow zone. At z=45 mm (Fig. 5), the velocity profiles flattened with increasing downstream and the orz disappears, while the irz attain an expansion state at the above positions of r ~ 12 mm.
(a) (b) (c)
Figure 4. Radial profiles of the mean values of the three velocity components of flame at z =5 mm. (a) Laser measurements [20], (b, c) simulation using EDC model, (b) 2-D, (c) 3-D view
Velocity (m/s)
3. 97e+01 3. 40e+01
3.02e+01
2.64e+01
2.26e+01
1.89e+01
1.51e+01
1.13e+01
7.55e+00
3.78e+00
1.90e+00
1.73e-01 5.68e-02
(a) (b)
Bahramian
Iranian Journal of Chemical Engineering, Vol.12, No. 2 45
(a) (b) (c)
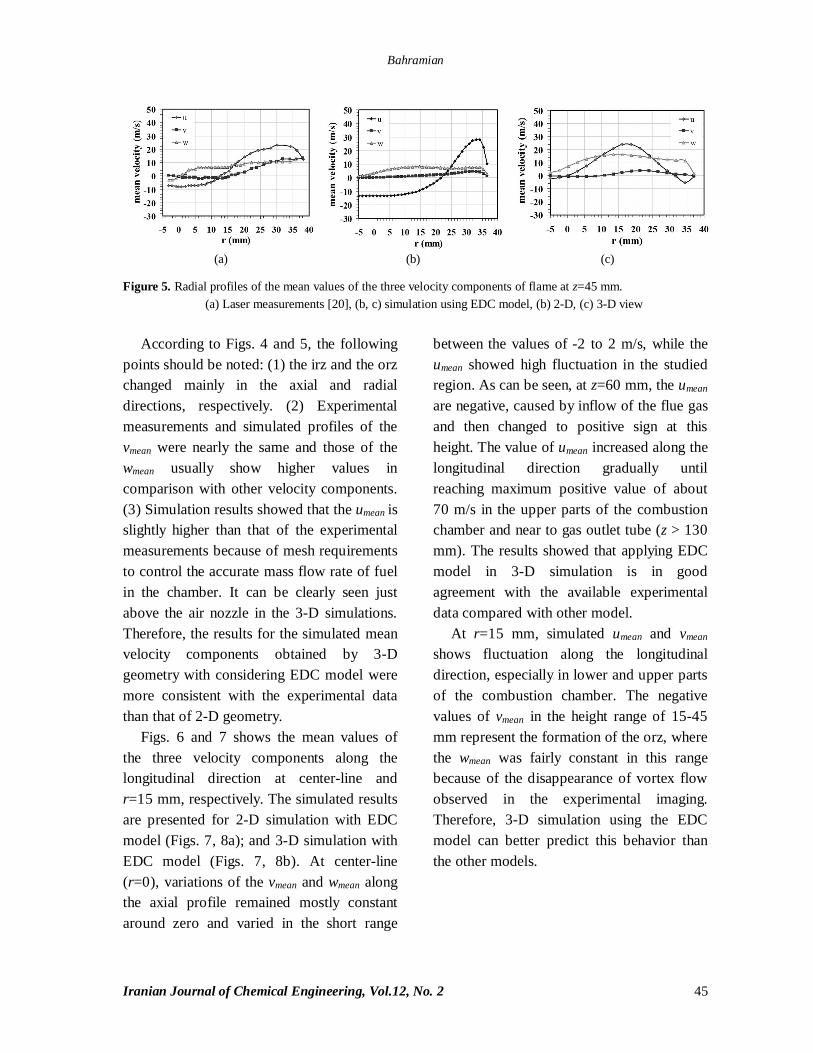
Figure 5. Radial profiles of the mean values of the three velocity components of flame at z=45 mm. (a) Laser measurements [20], (b, c) simulation using EDC model, (b) 2-D, (c) 3-D view
According to Figs. 4 and 5, the following
points should be noted: (1) the irz and the orz changed mainly in the axial and radial directions, respectively. (2) Experimental measurements and simulated profiles of the vmean were nearly the same and those of the wmean usually show higher values in comparison with other velocity components. (3) Simulation results showed that the umean is slightly higher than that of the experimental measurements because of mesh requirements to control the accurate mass flow rate of fuel in the chamber. It can be clearly seen just above the air nozzle in the 3-D simulations. Therefore, the results for the simulated mean velocity components obtained by 3-D geometry with considering EDC model were more consistent with the experimental data than that of 2-D geometry.
Figs. 6 and 7 shows the mean values of the three velocity components along the longitudinal direction at center-line and r=15 mm, respectively. The simulated results are presented for 2-D simulation with EDC model (Figs. 7, 8a); and 3-D simulation with EDC model (Figs. 7, 8b). At center-line (r=0), variations of the vmean and wmean along the axial profile remained mostly constant around zero and varied in the short range
between the values of -2 to 2 m/s, while the umean showed high fluctuation in the studied region. As can be seen, at z=60 mm, the umean are negative, caused by inflow of the flue gas and then changed to positive sign at this height. The value of umean increased along the longitudinal direction gradually until reaching maximum positive value of about 70 m/s in the upper parts of the combustion chamber and near to gas outlet tube (z > 130 mm). The results showed that applying EDC model in 3-D simulation is in good agreement with the available experimental data compared with other model.
At r=15 mm, simulated umean and vmean shows fluctuation along the longitudinal direction, especially in lower and upper parts of the combustion chamber. The negative values of vmean in the height range of 15-45 mm represent the formation of the orz, where the wmean was fairly constant in this range because of the disappearance of vortex flow observed in the experimental imaging. Therefore, 3-D simulation using the EDC model can better predict this behavior than the other models.
CFD Insight of the Flow Dynamics and Velocity Fields in a Gas Turbine Combustor with a Swirl Flame
46 Iranian Journal of Chemical Engineering, Vol. 12, No. 2
(a)
(b)
Figure 6. Axial profiles of the mean values of the three velocity components of flame at r=0.
(a) 2-D simulation using EDC model, (b) 3-D simulation using EDC model
(a)
(b)
Figure 7. Axial profiles of the mean values of the three velocity components of flame at r=15 mm. (a) 2-D simulation using EDC model, (b) 3-D simulation using EDC model.
Table 3 shows the relative error between the experimental data [20] and the simulation results of the mean velocity components obtained by EDC model in 2-D and 3-D geometries. It can be noted that the presented values were obtained by averaging each of the velocity components in radial profiles. Based on Table 3, the following points should be noted: (1) the numerical results obtained by EDC model with 3-D geometry are more consistent with the experimental data for predicting velocity components than the 2-D geometry. (2) Maximum standard deviations between the experimental data and simulated values are found for the umean, while minimum deviations are obtained for the wmean.
Table 3 Mean standard deviations between the components obtained by EDC model.
Mean velocity
components (m/s)
Mean standard deviation (%)
2-D simulation
3-D simulation
u 21.4 15.4 v 12.8 10.2 w 10.3 9.4
Bahramian
Iranian Journal of Chemical Engineering, Vol.12, No. 2 47
8. Conclusions A mathematical model is developed for
the CFD simulation of flow dynamics and velocity fields in a gas turbine combustor with a swirl flame for CH4/air flow
Model takes into account turbulence-chemistry interactions through the Eddy Dissipation Concept (EDC) combustion model proposed by Magnussen and Hjertager. The k- turbulent model is used to calculate the reaction rate. The CFD simulation results obtained by the EDC model were compared with the experimental data obtained from laser measurements, which were studied by Weigand et al. A series of 2-D and 3-D CFD simulations were performed taking two-step oxy-combustion reaction kinetics model into consideration. The simulated results show that the flow of air and fuel gas enters at the inlet of the combustion chamber through a radial swirler, followed by a sudden expansion. The 3-D simulation results using the EDC model predict a vortex breakdown flow behavior with formation of an inner recirculation zone (irz), while an outer recirculation zone (orz) was established because of the confinement. The flow field of flame predicts an irz and an orz across the axial direction at the center and near the walls of combustion chamber, respectively. Also, the simulation results predict a recirculation zone near the wall and in the lower part of combustion chamber. This zone expands to the upper heights and toward the combustion chamber. Also, the EDC model predicts the high-velocity zones at the inlet flow near to the air nozzle and exhaustion zones, which were in good agreement with experimental observations. These results were in relatively good
agreement with the experimental observations. The mean axial velocity component umean obtained by 3-D numerical analysis exhibits the irz with maximum negative value. The mean radial velocity component vmean was negative at the wall, representing the formation of the orz. The mean tangential velocity wmean was fairly constant in the orz. 2-D and 3-D simulation results showed that the umean is slightly higher than that of the experimental measurements because of mesh requirements to control the accurate mass flow rate of fuel in the chamber. Therefore, the numerical results obtained by EDC model were in good agreement with the experimental data. However, an error analysis showed that the simulated mean velocity components obtained by 3-D geometry was more consistent with the experimental data than that of 2-D geometry.
Nomenclature Symbols C Concentration, mol.cm-3 d Nozzle diameter, m D Combustion diameter, m g Acceleration due to gravity, m.s-2 Heff effective enthalpy per unit mass, J.kg-1 k Turbulent kinematic energy, m2.s-2 M Molecular weight, kg.mol-1 P Pressure, N.m-2 r radius direction, m R Rate of reaction k, mol m-3.s-1 Sh Source of energy caused by chemical reaction, kW.m-3 Srad Source of radiation, kW.m-3 t Time, s T Temperature, K umean Mean axial velocity component, m.s-1
CFD Insight of the Flow Dynamics and Velocity Fields in a Gas Turbine Combustor with a Swirl Flame
48 Iranian Journal of Chemical Engineering, Vol. 12, No. 2
vmean Mean radial velocity component, m.s-1 wmean Mean tangential velocity, m.s-1 x Longitudinal direction, m Greek letters
k– model constant * mass fraction of the ne structures dissipation rate of turbulent kinetic
energy per unit mass, m2.s-3
turbulence to mean shear time scale ratio molecular conductivity, J.m-1.s-1.K-1 t turbulent conductivity, J.m-1.s-1.K-1 kinematic viscosity, m2.s-1 * characteristic time scale of the ne
structures, s References
[1] Guiberti, T. F., Durox, D., Scouflaire, P. and Schuller T., "Impact of heat l T. oss and hydrogen enrichment on the shape of confined swirling flames", P. Combust. Inst., 35 (2), 1385 (2015).
[2] Day, M., Tachibana, Sh., Bell, J., Lijewski, M., Beckner, V. and Cheng, R, K., "A combined computational and experimental characterization of lean premixed turbulent low swirl laboratory flames II. Hydrogen flames", Combust. Flame, 162 (5), 2148 (2015).
[3] Singh, S. and Chander, S., "Heat transfer characteristics of dual swirling flame impinging on a flat surface", Int. J. Thermal. Sci., 89 (1), 1 (2015).
[4] González-Cencerrado, A., Gil, A. and Peña, B., "Characterization of PF flames under different swirl conditions based on visualization systems", Fuel, 113 (1), 798 (2013).
[5] Pianko-Oprych, P., Nienow, A.W. and Barigou, M., "Positron emission particle tracking (PEPT) compared to particle image velocimetry (PIV) for studying the flow generated by a pitched-blade turbine in single phase and multi-phase systems", Chem. Eng. Sci., 64 (23), 49551 (2009).
[6] Birjandi, A. H. and Bibeau, E. L., "Improvement of Acoustic Doppler Velocimetry in bubbly flow measurements as applied to river characterization for kinetic turbines", Int. J. Multiphase. Flow., 37 (8), 919 (2011).
[7] Ainsworth, R.W., Thorpe, S. J. and Manners, R. J., "A new approach to flow-field measurement—A view of Doppler global velocimetry techniques", Int. J. Heat. Fluid. Flow., 18 (1), 116 (1997).
[8] Bulat, G., Fedina, E., Fureby, C., Meier, W. and Stopper, U., "Reacting flow in an industrial gas turbine combustor: LES and experimental analysis", P. Combust. Inst., 35 (3), 3175 (2015).
[9] Krieger, G. C., Campos, A. P. V., Takehara, M. D. B., Alfaia da Cunha, F. and Gurgel Veras, C. A. "Numerical simulation of oxy-fuel combustion for gas turbine applications", Appl. Therm. Eng., 78 (1), 471 (2015).
[10] Gobbato, P., Masi, M., Toffolo, A., Lazzaretto, A. and Tanzini, G., "Calculation of the flow field and NOx emissions of a gas turbine combustor by a coarse computational fluid dynamics model", Energy, 45 (1), 445 (2012).
[11] Gicquel, L. Y. M., Staffelbach, G. and Poinsot, T. "Large Eddy Simulations of gaseous flames in gas turbine combustion
Bahramian
Iranian Journal of Chemical Engineering, Vol.12, No. 2 49
[12] Lee, J., Jeon, S., and Kim, Y., "Multi-environment probability density function approach for turbulent CH4/H2 flames under the MILD combustion condition", Combust. Flame, 162 (4), 1464 (2015).
[13] Ganji, H. B. and Ebrahimi, R., "Numerical estimation of blowout, flashback, and flame position in MIT micro gas-turbine chamber", Chem. Eng. Sci., 104 (18), 857 (2013).
[14] Prieler, R., Demuth, M., Spoljaric, D. and Hochenauer, Ch., "Evaluation of a steady flamelet approach for use in oxy-fuel combustion", Fuel, 118 (1), 55 (2014).
[15] Magnussen, B. F. and Hjertager, B. H., "On mathematical modeling of turbulent combustion with special emphasis on soot formation and combustion", Symp. (Int.) Combust., 16, (1) 719 (1977).
[16] Stefanidis, G. D., Merci, B., Heynderickx, G. J. and Marin, G. B., "CFD simulations of steam cracking furnaces using detailed combustion mechanisms", Comput. Chem. Eng., 30 (4), 635 (2006).
[17] Maghbouli, A., Khoshbakhti Saray, R., Shafee, S. and Ghafouri, J., "Numerical study of combustion and emission characteristics of dual-fuel engines using 3D-CFD models coupled with chemical kinetics", Fuel, 106 (1), 98 (2013).
[18] Lee, G. W., Shon, B . H. Yoo, J . G. Jung, J . H. and Oh, K . J., "The influence of mixing between NH3 and NO for a De-NOx reaction in the SNCR process", J. Ind. Eng. Chem., 14 (4), 457 (2008).
[19] Di Benedetto, A., Di Sarli, V. and Russo, G., "Effect of geometry on the thermal behavior of catalytic micro-combustors", Catal. Today, 155 (1–2), 116 (2010).
[20] Weigand, P., Meier, W., Duan X. R., Stricker, W. and Aigner, M., "Investigations of swirl flames in a gas turbine model combustor I. Flow field, structures, temperature, and species distributions", Combust. Flame, 144 (1), 205 (2006).
[21] Ma, T., Gao, Y., Kempf, A. M. and Chakraborty, N., "Validation and implementation of algebraic LES modelling of scalar dissipation rate for reaction rate closure in turbulent premixed combustion", Combust. Flame, 161 (12), 3134 (2014).
[22] Ertesvag, I. S. and Magnussen, B. F., "The eddy dissipation turbulence energy cascade model", Combust. Sci. Technol., 159 (1), 213 (2000).