Page 1
8/10/2019 Ch10 Evans BA1e Case Solution
http://slidepdf.com/reader/full/ch10-evans-ba1e-case-solution 1/19
Page 2
8/10/2019 Ch10 Evans BA1e Case Solution
http://slidepdf.com/reader/full/ch10-evans-ba1e-case-solution 2/19
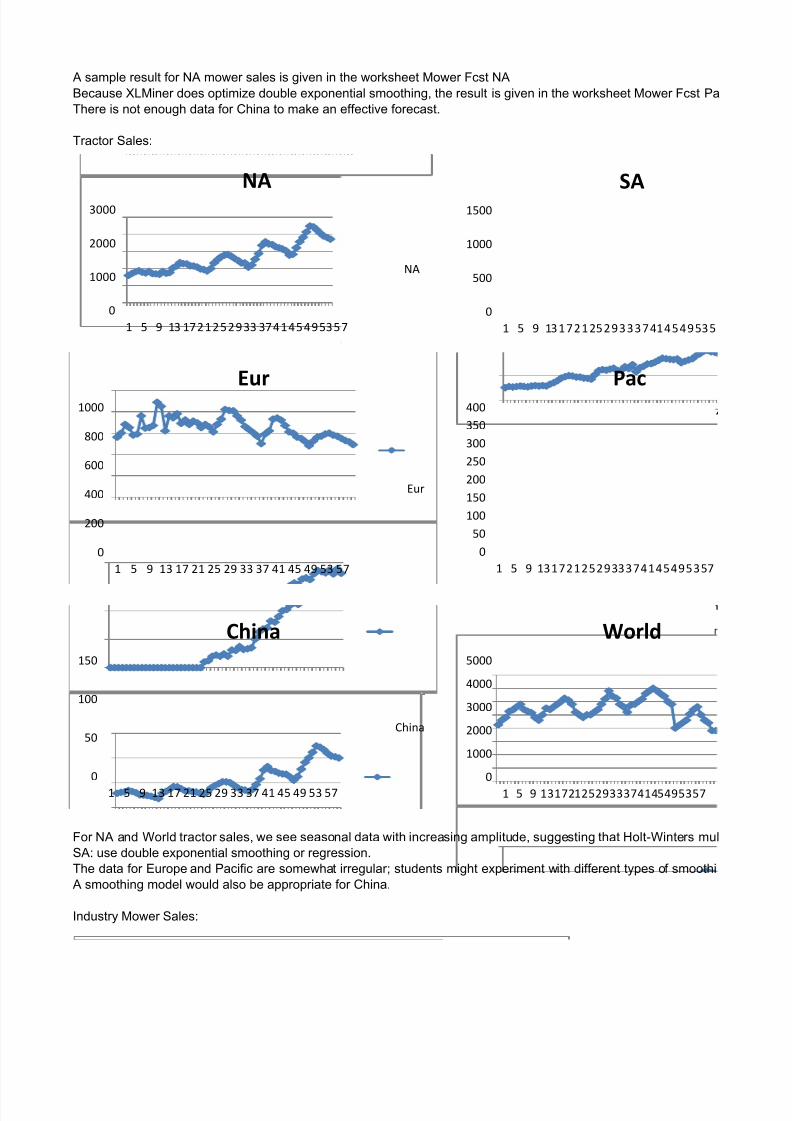
A sample result for NA mower sales is given in the worksheet Mower Fcst NABecause XLMiner does optimize double exponential smoothing, the result is given in the worksheet Mower Fcst PaThere is not enough data for China to make an effective forecast.
Tractor Sales:
For NA and World tractor sales, we see seasonal data with increasing amplitude, suggesting that Holt-Winters mulSA: use double exponential smoothing or regression.The data for Europe and Pacific are somewhat irregular; students might experiment with different types of smoothi
A smoothing model would also be appropriate for China.
Industry Mower Sales:
0
1000
2000
3000
1 5 9 13 1721252933 374145495357
NA
NA
0
500
1000
1500
1 5 9 13172125293337414549535
SA
0
200
400
600
800
1000
1 5 9 13 17 21 25 29 33 37 41 45 49 53 57
Eur
Eur
050
100150200250300350400
1 5 9 131721252933374145495357
Pac
0
50
100
150
1 5 9 13 17 21 25 29 33 37 41 45 49 53 57
China
China
0
1000
2000
3000
4000
5000
1 5 9 131721252933374145495357
World
Page 3
8/10/2019 Ch10 Evans BA1e Case Solution
http://slidepdf.com/reader/full/ch10-evans-ba1e-case-solution 3/19
Similar logic can be applied. All except Pacific region would use Holt Winter no trend model, and Pacific would pro
Industry Tractor Sales:
NA: Holt Winter multiplicativeWorld: Holt Winter multiplicativeEurope: exponential smoothing or moving averageSA, Pacific, and China: smoothing model
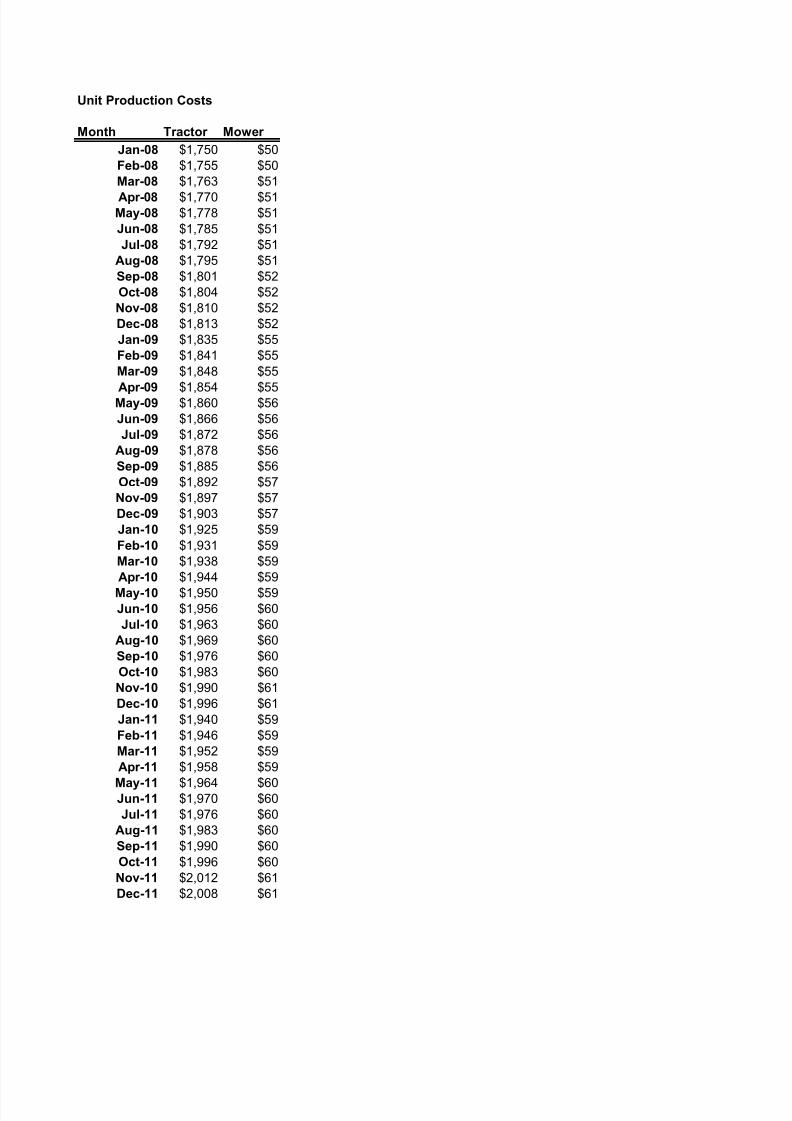
Unit production costs follow a close linear trend except for an apparent anomoly in in 2011.It will be interesting to see how students handle it. They might question the integrity of the data.For example, we see that a linear trendline will underestimate the data for tractors.For mowers, there appears to be a decreasing return, so a polynomial trendline might be adequate as would a dou
0
20000
40000
60000
80000
100000
120000
140000
1 4 7 10 13 16 19 22 25 28 31 34 37 40 43 46 49 52 55 58
NA
Eur
World
0
500
1000
1500
2000
2500
1 4 7 10 13
0
5000
10000
15000
20000
25000
30000
1 4 7 10 13 16 19 22 25 28 31 34 37 40 43 46 49 52 55 58
NA
Eur
World
0
500
1000
1500
2000
2500
3000
3500
4000
1 4 7 10 13 16
y = 6.1658x + 1750R² = 0.9626
$2,200
Tractor
Page 4
8/10/2019 Ch10 Evans BA1e Case Solution
http://slidepdf.com/reader/full/ch10-evans-ba1e-case-solution 4/19
$1,500
$1,600
$1,700
$1,800
$1,900
$2,000
$2,100
1 3 5 7 9 11131517192123252729313335373941434547495153555759
Tractor
Linear (Tractor)
y = -0.0025x 2 + 0.3867x + 49.283R² = 0.9508
$40
$45
$50
$55
$60
$65
$70
1 3 5 7 9 11131517192123252729313335373941434547495153555759
Mower
Mower
Poly. (Mower)
Page 5
8/10/2019 Ch10 Evans BA1e Case Solution
http://slidepdf.com/reader/full/ch10-evans-ba1e-case-solution 5/19
ssign different time series to different students or groups.ir choices.
o it would be difficult to expect the "best" model.
53 57
SA
57
Pacific
Page 6
8/10/2019 Ch10 Evans BA1e Case Solution
http://slidepdf.com/reader/full/ch10-evans-ba1e-case-solution 6/19
cific
iplicative models are appropriate.
g models.
SA
Pac
World
Page 7
8/10/2019 Ch10 Evans BA1e Case Solution
http://slidepdf.com/reader/full/ch10-evans-ba1e-case-solution 7/19
bably use double exponential smoothing.
ble exponential smoothing model.
16 19 22 25 28 31 34 37 40 43 46 49 52 55 58
SA
Pac
19 22 25 28 31 34 37 40 43 46 49 52 55 58
SA
Pac
China
Page 8
8/10/2019 Ch10 Evans BA1e Case Solution
http://slidepdf.com/reader/full/ch10-evans-ba1e-case-solution 8/19
123456
789
10111213141516171819202122232425262728293031323334353637
383940414243444546474849505152
5354555657585960616263
A B C D E F GMower Unit Sales
Month NA SA Europe Pacific China WorldJan-08 6000 200 720 100 0 7020Feb-08 7950 220 990 120 0 9280Mar-08 8100 250 1320 110 0 9780
Apr-08 9050 280 1650 120 0 11100May-08 9900 310 1590 130 0 11930Jun-08 10200 300 1620 120 0 12240Jul-08 8730 280 1590 140 0 10740
Aug-08 8140 250 1560 130 0 10080Sep-08 6480 230 1590 130 0 8430Oct-08 5990 220 1320 120 0 7650Nov-08 5320 210 990 130 0 6650Dec-08 4640 180 660 140 0 5620Jan-09 5980 210 690 140 0 7020Feb-09 7620 240 1020 150 0 9030Mar-09 8370 250 1290 140 0 10050Apr-09 8830 290 1620 150 0 10890May-09 9310 330 1650 130 0 11420Jun-09 10230 310 1590 140 0 12270Jul-09 8720 290 1560 150 0 10720
Aug-09 7710 270 1530 140 0 9650Sep-09 6320 250 1590 150 0 8310Oct-09 5840 250 1260 160 0 7510Nov-09 4960 240 900 150 0 6250Dec-09 4350 210 660 150 0 5370Jan-10 6020 220 570 160 0 6970Feb-10 7920 250 840 150 0 9160Mar-10 8430 270 1110 160 0 9970Apr-10 9040 310 1500 170 0 11020May-10 9820 360 1440 160 0 11780Jun-10 10370 330 1410 170 0 12280Jul-10 9050 310 1440 160 0 10960
Aug-10 7620 300 1410 170 0 9500Sep-10 6420 280 1350 180 0 8230Oct-10 5890 270 1080 180 0 7420
Nov-10 5340 260 840 190 0 6630Dec-10 4430 230 510 180 0 5350Jan-11 6100 250 480 200 0 7030Feb-11 8010 270 750 190 0 9220Mar-11 8430 280 1140 200 0 10050Apr-11 9110 320 1410 210 0 11050May-11 9730 380 1340 190 0 11640Jun-11 10120 360 1360 200 0 12040Jul-11 9080 320 1410 200 0 11010
Aug-11 7820 310 1490 210 0 9830Sep-11 6540 300 1310 220 0 8370Oct-11 6010 290 980 210 0 7490Nov-11 5270 270 770 220 0 6530Dec-11 5380 260 430 230 0 6300Jan-12 6210 270 400 200 0 7080
Feb-12 8030 280 750 190 0 9250Mar-12 8540 300 970 210 0 10020Apr-12 9120 340 1310 220 5 10995May-12 9570 390 1260 200 16 11436Jun-12 10230 380 1240 210 22 12082Jul-12 9580 350 1300 230 26 11486
Aug-12 7680 340 1250 220 14 9504Sep-12 6870 320 1210 220 15 8635Oct-12 5930 310 970 230 11 7451Nov-12 5260 300 650 240 3 6453Dec-12 4830 290 300 230 1 5651
Page 9
8/10/2019 Ch10 Evans BA1e Case Solution
http://slidepdf.com/reader/full/ch10-evans-ba1e-case-solution 9/19
Tractor Unit Sales
Month NA SA Eur Pac China WorldJan-08 570 250 560 212 0 1592Feb-08 611 270 600 230 0 1711Mar-08 630 260 680 240 0 1810Apr-08 684 270 650 263 0 1867May-08 650 280 580 269 0 1779Jun-08 600 270 590 280 0 1740Jul-08 512 264 760 290 0 1826
Aug-08 500 280 645 270 0 1695Sep-08 478 290 650 263 0 1681Oct-08 455 280 670 258 0 1663Nov-08 407 290 888 240 0 1825Dec-08 360 280 850 230 0 1720Jan-09 571 320 620 250 0 1761Feb-09 650 350 760 275 0 2035Mar-09 740 390 742 270 0 2142Apr-09 840 440 780 280 0 2340May-09 830 470 690 290 0 2280Jun-09 760 490 721 300 0 2271Jul-09 681 481 680 312 0 2154
Aug-09 670 460 711 305 0 2146Sep-09 640 460 695 290 0 2085Oct-09 620 440 650 260 0 1970Nov-09 570 436 680 250 0 1936Dec-09 533 420 657 240 0 1850Jan-10 620 510 610 250 10 2000Feb-10 792 590 680 250 12 2324Mar-10 890 610 730 260 20 2510Apr-10 960 600 820 270 22 2672May-10 1040 620 810 290 20 2780Jun-10 1032 640 807 310 24 2813Jul-10 1006 590 760 340 20 2716
Aug-10 910 600 720 320 31 2581Sep-10 803 670 660 313 30 2476Oct-10 730 630 630 290 37 2317Nov-10 699 710 603 280 32 2324
Dec-10 647 570 570 260 33 2080Jan-11 730 650 500 287 35 2202Feb-11 930 680 590 290 50 2540Mar-11 1160 724 620 300 63 2867Apr-11 1510 730 730 310 68 3348May-11 1650 760 740 330 70 3550Jun-11 1490 800 720 340 82 3432Jul-11 1460 840 670 350 80 3400
Aug-11 1390 830 610 341 90 3261Sep-11 1360 820 599 330 100 3209Oct-11 1340 810 560 320 102 3132Nov-11 1240 827 550 300 110 3027Dec-11 1103 750 520 290 114 2777Jan-12 1250 780 480 200 111 2821Feb-12 1550 805 523 210 121 3209Mar-12 1820 830 560 220 123 3553Apr-12 2010 890 570 230 120 3820May-12 2230 930 590 253 130 4133Jun-12 2490 980 600 270 136 4476Jul-12 2440 1002 580 280 134 4436
Aug-12 2334 970 570 250 132 4256Sep-12 2190 960 550 230 137 4067Oct-12 2080 930 530 220 130 3890Nov-12 2050 920 517 190 139 3816Dec-12 2004 902 490 190 131 3717
Page 10
8/10/2019 Ch10 Evans BA1e Case Solution
http://slidepdf.com/reader/full/ch10-evans-ba1e-case-solution 10/19
Industry Mower Total Sales
Month NA SA Eur Pac WorldJan-08 60000 571 13091 1045 74662Feb-08 77184 611 17679 1111 96585Mar-08 7 7885 658 22759 1068 102369Apr-08 8 6190 778 27966 1237 116171
May-08 9 6117 886 27895 1313 126210Jun-08 9 7143 882 30566 1176 129768Jul-08 8 4757 848 29444 1359 116409
Aug-08 7 9804 735 28364 1238 110141Sep-08 64800 657 28393 1215 95065Oct-08 59307 595 24444 1154 85500Nov-08 52157 553 18000 1262 71972Dec-08 45049 462 12453 1386 59349Jan-09 58627 553 12778 1443 73401Feb-09 76200 615 18214 1515 96545Mar-09 8 2871 658 23889 1373 108791Apr-09 8 4904 784 29455 1442 116584
May-09 9 3100 846 29464 1215 124625Jun-09 9 3000 838 27414 1333 122585Jul-09 8 3048 763 27368 1415 112594
Aug-09 7 4854 694 27321 1296 104164Sep-09 60769 625 29444 1402 92241Oct-09 55619 610 23774 1468 81470Nov-09 48155 571 17308 1351 67386Dec-09 42647 512 12941 1389 57489Jan-10 57885 537 10962 1509 70892Feb-10 77647 595 15273 1402 94917Mar-10 8 1845 659 20556 1524 104583Apr-10 8 6095 756 26786 1574 115211
May-10 9 1776 878 24828 1468 118949Jun-10 100680 825 24737 1560 127801Jul-10 8 6190 756 24828 1441 113216
Aug-10 71887 714 25179 1545 99325Sep-10 60000 651 24545 1667 86863Oct-10 55566 643 19286 1698 77193Nov-10 50857 619 15273 1810 68558
Dec-10 42596 548 9107 1731 53982Jan-11 58095 581 8571 1887 69135Feb-11 75566 614 13158 1845 91182Mar-11 8 0286 622 19655 1923 102486Apr-11 8 5140 727 25179 1981 113027
May-11 9 0093 826 23103 1810 115832Jun-11 9 5472 783 24286 1942 122482Jul-11 8 7308 681 24737 1961 114686
Aug-11 7 4476 646 26607 2000 103729Sep-11 61698 625 22982 2075 87381Oct-11 57238 617 16897 2019 76771Nov-11 50673 587 13750 2095 67105Dec-11 51238 591 7818 2150 61797Jan-12 59712 563 7547 1852 69673Feb-12 77961 571 13889 1743 94165Mar-12 8 3725 625 18302 1892 104544Apr-12 9 0297 723 25192 2037 118250
May-12 9 1143 848 24706 1887 118583Jun-12 9 9320 792 25306 1944 127363Jul-12 9 3922 745 27083 2170 123919
Aug-12 7 3143 739 26042 2037 101961Sep-12 66699 667 26304 2018 95688Oct-12 56476 660 22558 2072 81766Nov-12 51068 625 14773 2182 68648Dec-12 46893 608 6977 2035 56510
Page 11
8/10/2019 Ch10 Evans BA1e Case Solution
http://slidepdf.com/reader/full/ch10-evans-ba1e-case-solution 11/19
Industry Tractor Total Sales
Month NA SA Eur Pac China WorldJan-08 8143 984 5091 987 278 15483Feb-08 8592 1051 5310 1090 283 16325Mar-08 8630 1016 6071 1127 285 17129Apr-08 8947 1027 5856 1209 288 17327May-08 8442 1057 5273 1221 286 16278Jun-08 7500 1019 5315 1327 287 15448Jul-08 6145 977 7170 1324 289 15905
Aug-08 5882 1057 5926 1268 290 14422Sep-08 5595 1086 6075 1209 293 14258Oct-08 5233 1045 6321 1168 295 14061Nov-08 4494 1078 8381 1127 298 15378Dec-08 3913 1029 7944 1085 301 14272Jan-09 5938 1172 5688 1185 306 14289Feb-09 6633 1273 7037 1286 302 16530Mar-09 7327 1423 6981 1286 303 17320Apr-09 8077 1612 7500 1346 307 18842May-09 7830 1728 6571 1388 309 17826Jun-09 7103 1815 6990 1449 312 17669Jul-09 6239 1776 6667 1490 315 16487
Aug-09 6036 1685 6762 1449 318 16250Sep-09 5664 1679 6635 1394 321 15692Oct-09 5345 1618 6311 1256 315 14844Nov-09 4831 1564 6476 1214 318 14402Dec-09 4454 1522 6250 1171 320 13716Jan-10 5299 1835 5922 1208 333 14597Feb-10 6529 2115 6667 1214 313 16836Mar-10 7120 2202 7228 1256 606 18412Apr-10 7619 2151 8200 1311 571 19852May-10 8387 2214 7941 1415 556 20513Jun-10 8110 2278 7921 1520 526 20355Jul-10 7752 2100 7677 1675 513 19716
Aug-10 6894 2128 7200 1584 769 18575Sep-10 6015 2367 6735 1527 750 17394Oct-10 5368 2211 6495 1422 732 16226Nov-10 4964 2483 6061 1366 714 15587
Dec-10 4444 1986 5816 1262 698 14207Jan-11 5000 2257 5051 1373 714 14394Feb-11 6284 2353 6082 1436 1063 17218Mar-11 7785 2457 6327 1478 1264 19310Apr-11 9934 2517 7604 1512 1333 22901May-11 10645 2612 7789 1642 1556 24244Jun-11 9491 2749 7347 1667 1739 22993Jul-11 9182 2887 6979 1733 1702 22483
Aug-11 8528 2833 6489 1700 1915 21465Sep-11 8293 2789 6316 1642 2083 21123Oct-11 8221 2765 5833 1576 2128 20523Nov-11 7470 2746 5789 1493 2292 19789Dec-11 6509 2534 5591 1450 2245 18329Jan-12 7267 2635 5106 1010 2292 18311Feb-12 8807 2703 5474 1045 2449 20477Mar-12 10168 2795 6022 1106 2400 22489Apr-12 11044 2997 6064 1150 2353 23607May-12 12120 3131 6344 1244 2600 25439Jun-12 13459 3311 6593 1357 2653 27374Jul-12 13048 3390 6304 1421 2600 26764
Aug-12 12275 3277 6064 1263 2549 25428Sep-12 11347 3232 5789 1173 2453 23995Oct-12 10667 3131 5699 1128 2517 23142Nov-12 10459 3087 5604 974 2541 22666Dec-12 10082 3030 5444 979 2453 21989
Page 12
8/10/2019 Ch10 Evans BA1e Case Solution
http://slidepdf.com/reader/full/ch10-evans-ba1e-case-solution 12/19
Unit Production Costs
Month Tractor Mower Jan-08 $1,750 $50Feb-08 $1,755 $50Mar-08 $1,763 $51Apr-08 $1,770 $51
May-08 $1,778 $51Jun-08 $1,785 $51Jul-08 $1,792 $51
Aug-08 $1,795 $51Sep-08 $1,801 $52Oct-08 $1,804 $52Nov-08 $1,810 $52Dec-08 $1,813 $52Jan-09 $1,835 $55Feb-09 $1,841 $55Mar-09 $1,848 $55
Apr-09 $1,854 $55May-09 $1,860 $56Jun-09 $1,866 $56Jul-09 $1,872 $56
Aug-09 $1,878 $56Sep-09 $1,885 $56Oct-09 $1,892 $57Nov-09 $1,897 $57Dec-09 $1,903 $57Jan-10 $1,925 $59Feb-10 $1,931 $59Mar-10 $1,938 $59Apr-10 $1,944 $59
May-10 $1,950 $59Jun-10 $1,956 $60Jul-10 $1,963 $60
Aug-10 $1,969 $60Sep-10 $1,976 $60Oct-10 $1,983 $60Nov-10 $1,990 $61Dec-10 $1,996 $61Jan-11 $1,940 $59Feb-11 $1,946 $59Mar-11 $1,952 $59Apr-11 $1,958 $59
May-11 $1,964 $60Jun-11 $1,970 $60Jul-11 $1,976 $60
Aug-11 $1,983 $60Sep-11 $1,990 $60Oct-11 $1,996 $60Nov-11 $2,012 $61Dec-11 $2,008 $61
Page 13
8/10/2019 Ch10 Evans BA1e Case Solution
http://slidepdf.com/reader/full/ch10-evans-ba1e-case-solution 13/19
Jan-12 $2,073 $63Feb-12 $2,077 $63Mar-12 $2,081 $63Apr-12 $2,086 $63
May-12 $2,092 $63Jun-12 $2,098 $63
Jul-12 $2,104 $64Aug-12 $2,110 $64Sep-12 $2,116 $64Oct-12 $2,122 $64Nov-12 $2,129 $64Dec-12 $2,135 $64
Page 14
8/10/2019 Ch10 Evans BA1e Case Solution
http://slidepdf.com/reader/full/ch10-evans-ba1e-case-solution 14/19
XLMiner : Time Series - Holt Winter(No Trend) Forecasting Method
Inputs Fitted Model Forecast
Elapsed Time
Inputs
Time Actual Forecast Residuals1 6000 5985.7796 14.22040042 7950 7810.30333 139.6966663 8100 8302.23173 -202.2317354 9050 8908.99475 141.0052485 9900 9566.65943 333.3405746 10200 10195.4211 4.57885957
7 8730 9002.27908 -272.279088 8140 7721.36122 418.6387829 6480 6535.28492 -55.2849176
10 5990 5930.38923 59.610771611 5320 5239.09112 80.908878712 4640 4748.83742 -108.83742113 5980 6063.94831 -83.948314614 7620 7891.51688 -271.51687515 8370 8287.10598 82.894018516 8830 8968.60871 -138.60871217 9310 9577.81289 -267.81288618 10230 10066.2276 163.77236519 8720 8905.31237 -185.31237320 7710 7678.45954 31.5404628
21 6320 6418.58671 -98.586707522 5840 5820.74774 19.252261223 4960 5136.40968 -176.40967524 4350 4602.46719 -252.46718925 6020 5841.46989 178.53010726 7920 7663.31696 256.68304327 8430 8172.09267 257.90732728 9040 8873.14005 166.8599529 9820 9536.17132 283.82867730 10370 10156.8238 213.176248
Data
Output Navigator
Error Measures(Training) Error Measures(Validation)
Gamma (Seasonality) 0.05
# Records in input data 60Input data Mower Unit Sales!$B$4:$B$63Selected variable NA
Parameters/Options Alpha (Level) 0.2Beta (Trend) N.A.
#Forecasts 12
Fitted Model
Season length 12Number of seasons 5Forecast Yes
0
2000
4000
6000
8000
10000
12000
N A
Time
Time Plot of Actual Vs Forecast (Tr
Actual Forecast
Page 15
8/10/2019 Ch10 Evans BA1e Case Solution
http://slidepdf.com/reader/full/ch10-evans-ba1e-case-solution 15/19
Page 16
8/10/2019 Ch10 Evans BA1e Case Solution
http://slidepdf.com/reader/full/ch10-evans-ba1e-case-solution 16/19
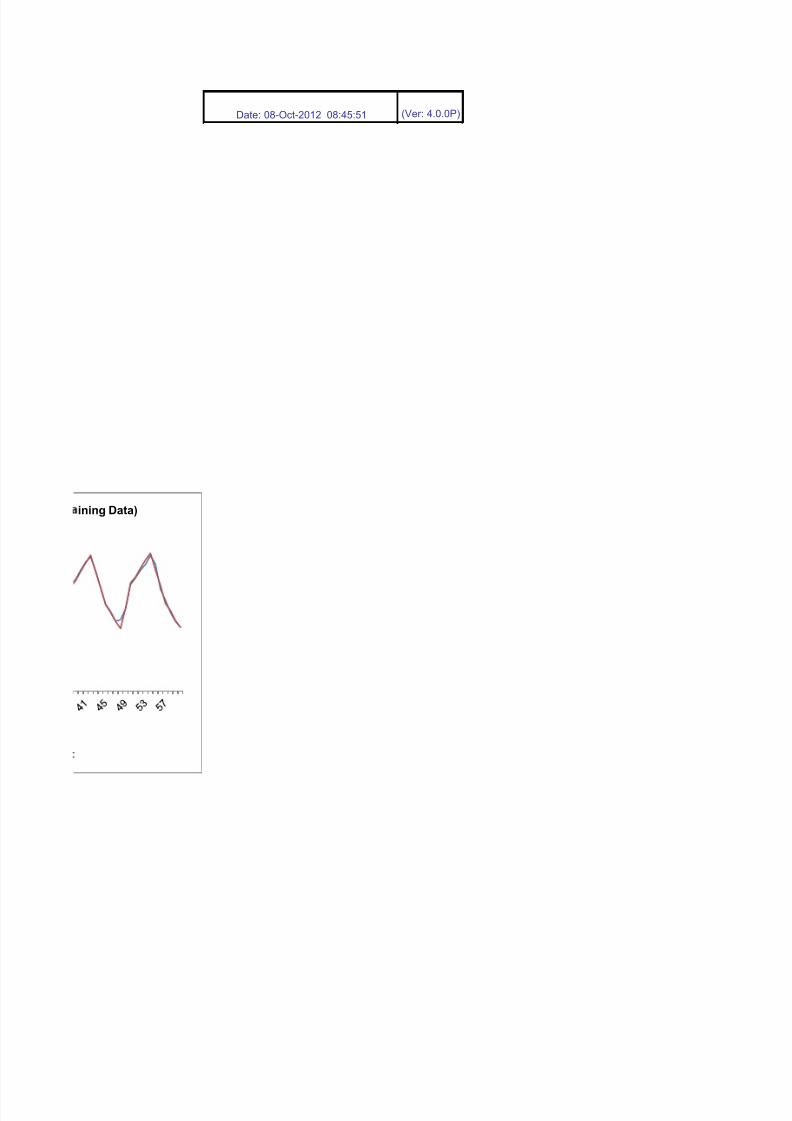
(Ver: 4.0.0P)Date: 08-Oct-2012 08:45:51
ining Data)
Page 17
8/10/2019 Ch10 Evans BA1e Case Solution
http://slidepdf.com/reader/full/ch10-evans-ba1e-case-solution 17/19
XLMiner : Time Series - Double Exponential Smoothing
Inputs Fitted Model Forecast
Elapsed Time
Inputs
Time Actual Forecast Residuals1 100 111.57377 -11.57377052 120 113.639066 6.360933593 110 115.704362 -5.704362324 120 117.769658 2.230341765 130 119.834954 10.1650458
6 120 121.90025 -1.900250077 140 123.965546 16.0344548 130 126.030842 3.96915819 130 128.096138 1.90386218
10 120 130.161434 -10.161433711 130 132.22673 -2.2267296512 140 134.292026 5.7079744413 140 136.357321 3.6426785214 150 138.422617 11.577382615 140 140.487913 -0.4879133116 150 142.553209 7.4467907817 130 144.618505 -14.618505118 140 146.683801 -6.6838010619 150 148.749097 1.25090303
20 140 150.814393 -10.814392921 150 152.879689 -2.879688822 160 154.944985 5.0550152823 150 157.010281 -7.0102806324 150 159.075577 -9.0755765525 160 161.140872 -1.1408724626 150 163.206168 -13.206168427 160 165.271464 -5.271464328 170 167.33676 2.6632397929 160 169.402056 -9.40205613
Data
Output Navigator
Error Measures(Training) Error Measures(Validation)
Beta (Trend) 0.437764844
# Records in input data 60Input data Mower Unit Sales!$A$4:$G$63Selected variable Pacific
Parameters/OptionsOptimization Selected Yes
Alpha (Level) 2.69555E-16
Gamma (Seasonality) N.A.Season length N.A.Number of seasons N.A.Forecast Yes#Forecasts 12
Fitted Model
0
50
100
150
200
250
300
P a c
i f i c
Time
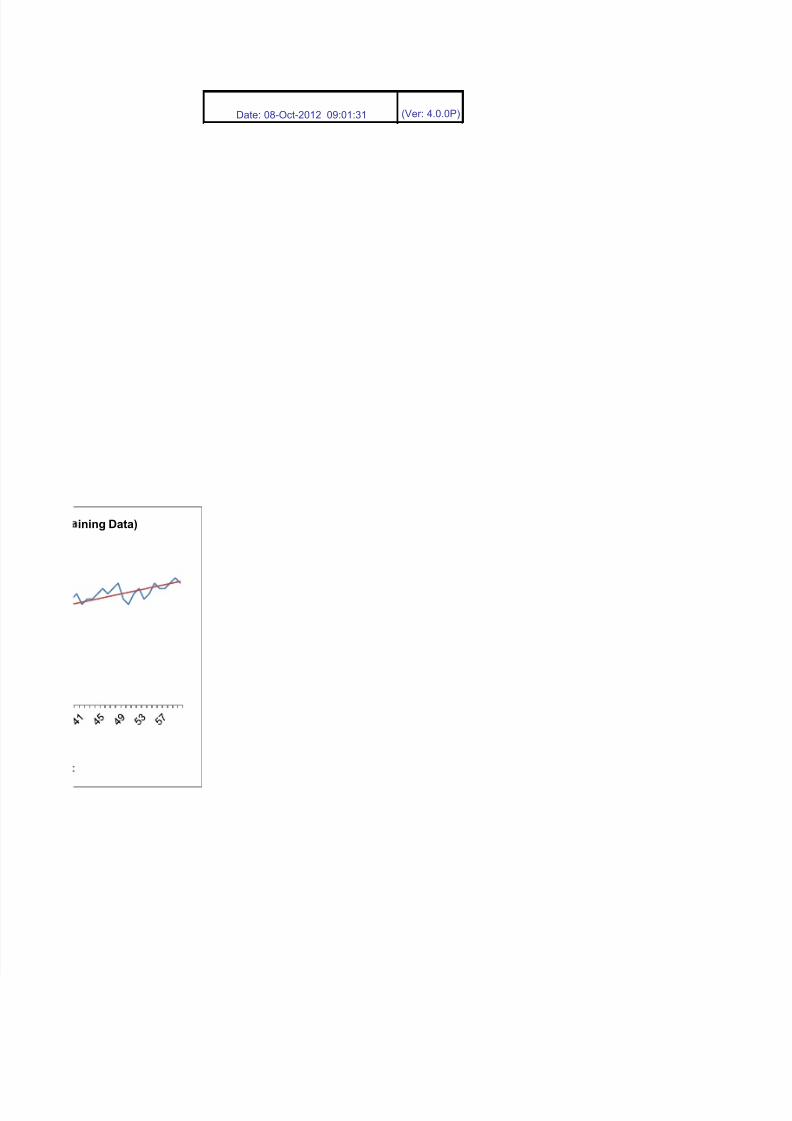
Time Plot of Actual Vs Forecast (Tr
Actual Forecast
Page 18
8/10/2019 Ch10 Evans BA1e Case Solution
http://slidepdf.com/reader/full/ch10-evans-ba1e-case-solution 18/19
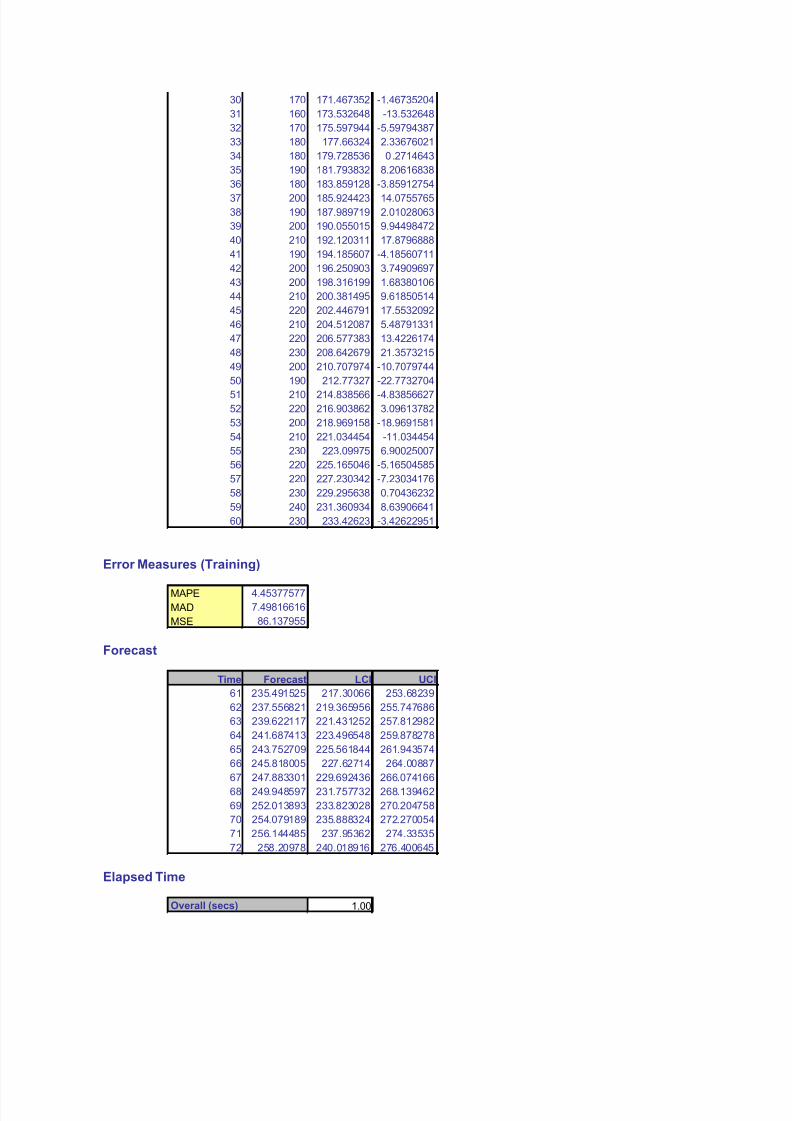
30 170 171.467352 -1.4673520431 160 173.532648 -13.53264832 170 175.597944 -5.5979438733 180 177.66324 2.3367602134 180 179.728536 0 .271464335 190 181.793832 8.2061683836 180 183.859128 -3.8591275437 200 185.924423 14.075576538 190 187.989719 2.0102806339 200 190.055015 9.9449847240 210 192.120311 17.879688841 190 194.185607 -4.1856071142 200 196.250903 3.7490969743 200 198.316199 1.6838010644 210 200.381495 9.6185051445 220 202.446791 17.553209246 210 204.512087 5.4879133147 220 206.577383 13.422617448 230 208.642679 21.357321549 200 210.707974 -10.707974450 190 212.77327 -22.773270451 210 214.838566 -4.8385662752 220 216.903862 3.0961378253 200 218.969158 -18.969158154 210 221.034454 -11.03445455 230 223.09975 6.9002500756 220 225.165046 -5.1650458557 220 227.230342 -7.2303417658 230 229.295638 0.7043623259 240 231.360934 8.6390664160 230 233.42623 -3.42622951
Error Measures (Training)
MAPE 4.45377577MAD 7.49816616MSE 86.137955
Forecast
Time Forecast LCI UCI61 235.491525 217.30066 253.6823962 237.556821 219.365956 255.74768663 239.622117 221.431252 257.81298264 241.687413 223.496548 259.87827865 243.752709 225.561844 261.94357466 245.818005 227.62714 264.00887
67 247.883301 229.692436 266.07416668 249.948597 231.757732 268.13946269 252.013893 233.823028 270.20475870 254.079189 235.888324 272.27005471 256.144485 237.95362 274.3353572 258.20978 240.018916 276.400645
Elapsed Time
1.00Overall (secs)
Page 19
8/10/2019 Ch10 Evans BA1e Case Solution
http://slidepdf.com/reader/full/ch10-evans-ba1e-case-solution 19/19
(Ver: 4.0.0P)Date: 08-Oct-2012 09:01:31
ining Data)