32
Chapter 13 Measurement Winston Jackson and Norine Verberg Methods: Doing Social Research, 4e
| Date post: | 03-Jan-2016 |
| Category: |
Documents |
| Upload: | vernon-ralph-flowers |
| View: | 229 times |
| Download: | 1 times |
Chapter 13Measurement
Winston Jackson and Norine Verberg
Methods: Doing Social Research, 4e

13-2 © 2007 Pearson Education Canada
Theoretical, Conceptual, and Operational Levels
Measurement is the “process of linking abstract concepts to empirical referents” (Carmines & Zeller)
Hence, one moves from the general (theoretical level) to the specific (empirical level) I.e., For each concept, an indicator is identified E.g., What is the best way to measure, or indicate, a
person’s social prestige? The concepts we measure are called variables See Figure 13.1 (next slide)
13-3 © 2007 Pearson Education Canada
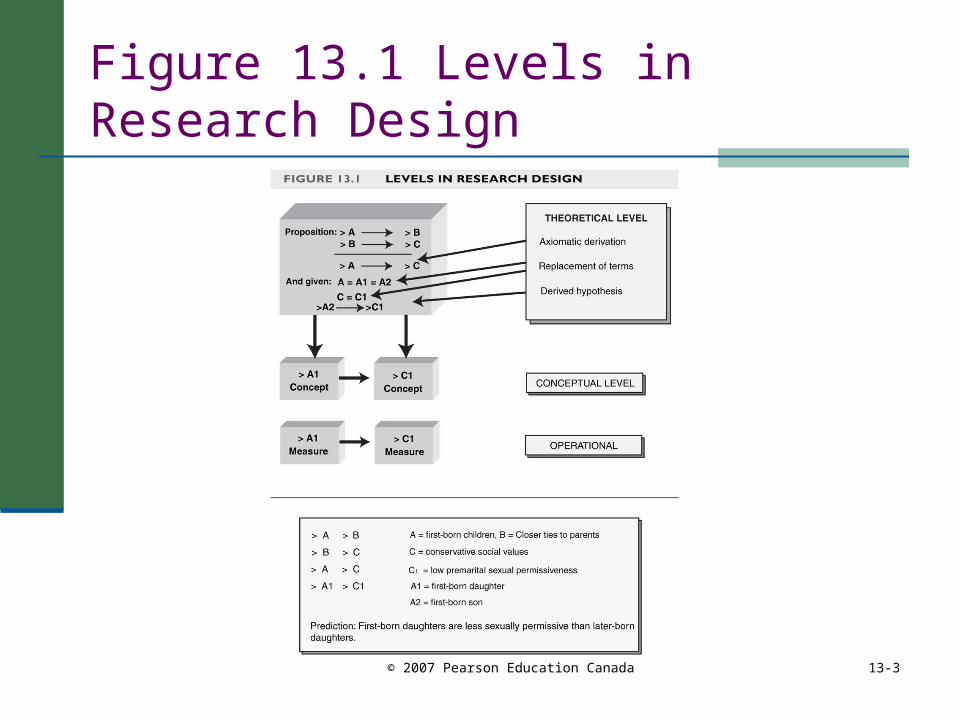
Figure 13.1 Levels in Research Design
13-4 © 2007 Pearson Education Canada
Figure 13.1 Explained
Shows movement from the general to the specific – from the theoretical level to the operational level Referred to as operationalization
At the theoretical level, concepts are conceptualized (e.g., socioeconomic status, alienation, job satisfaction, conformity, age, gender, poverty, political efficacy)
At the operational level, the researcher must create measures (or indicators) for the concept Indicators should reflect the variable’s conceptual
definition

13-5 © 2007 Pearson Education Canada
Assessing Indicators
We assess the link between the concepts and the indicators by evaluating the validity and reliability of the indicators
1. Validity The extent to which a measure reflects a
concept, reflecting neither more nor less than what is implied by the conceptual definition
2. Reliability The extent to which, on repeated measures,
an indicator yields similar readings
13-6 © 2007 Pearson Education Canada
1. Validity (in Quantitative Research)
Illustration: concept – socioeconomic status Conceptual definition: a “hierarchical continuum
of respect and prestige” Operational definition: annual salary Assessment: Low validity (salary might not
capture prestige – widows, ministers, nuns – prestige and respect would be higher than income suggests
Measure should be congruent with conceptual definition (e.g., use a prestige scale)
13-7 © 2007 Pearson Education Canada
Types of Validity
Face validity: “on the face of it...” Content validity: reflects the dimension(s)
implied by the concept Criterion validity: two types
Concurrent validity: correlation of one measure with another
Predictive validity: predict accurately Construct validity: distinguishes participants
who differ on the construct
13-8 © 2007 Pearson Education Canada
Validity in Experimental Design
Internal validity: the extent to which you can demonstrate that the treatment produces changes in dependent variable
External validity: the extent to which one can extrapolate from study to the general population
In qualitative research, “credibility” is the issue Degree to which the description “rings true” to
the subjects of the study, to other readers, or to other researchers
13-9 © 2007 Pearson Education Canada
2. Reliability (in Quantitative Methods)
A measure should provide similar results when repeated – should be “reliable” measure of the variable
Can assess the internal reliability of items used to construct an index (an index combines several items into a single score) Split-half method: randomly split the items in
two, construct index, check to see if results correlate highly
Internal consistency: statistical procedure done in SPSS (described later in chapter)
13-10 © 2007 Pearson Education Canada
Measurement Error
Researchers assume that the object being measured has two or more values (i.e., is not a constant) and that it has a “true value” True value: the underlying exact quantity of a
variable at any given time Researchers also assume that measurement
errors will always occur because instruments are imperfect Measurement error is any deviation from “true
value”

13-11 © 2007 Pearson Education Canada
Measurement Error (Cont’d)
MEASURE = True Value ± (SE ± RE) SE: Systematic error is non-random error that
systematically over- or under-estimates a value (hence, distorts results) E.g., in coding, if researcher assigns the lowest
value when respondents does not answer non-response coded as lack of support for x
RE: Random error is random fluctuations around the true value Will not distort results
13-12 © 2007 Pearson Education Canada
Tips for Reducing Random and Systematic Error1. Take the average of several measures
2. Use several different indicators
3. Use random sampling procedures
4. Use sensitive measures
5. Avoid confusion in wording questions or instructions
6. Error-check data carefully
7. Reduce subject and experimenter expectations

13-13 © 2007 Pearson Education Canada
Levels of Measurement
Introduced in Chapter 8; this chapter stresses the importance of level of measurement for measuring concepts Level of measurement constrains type of
statistical procedures one can use Three levels of measurement
1. Nominal
2. Ordinal
3. Ratio

13-14 © 2007 Pearson Education Canada
Levels of Measurement (cont’d)
Nominal: Involves no underlying continuum; assignment of numeric values arbitrary Examples: religious affiliation, gender, etc.
Ordinal: Implies an underlying continuum; values are ordered but intervals are not equal Examples: community size, Likert items, etc.
Ratio: Involves an underlying continuum; numeric values assigned reflect equal intervals; zero point aligned with true zero Examples: weight, age in years, % minority,
indexes
13-15 © 2007 Pearson Education Canada
The Effects of Reduced Levels of Measurement
Best to achieve most precise, and highest, level of measurements possible
When lower levels are used, the results under-estimate the relative importance of a variable The greater the reduction in measurement
precision, the greater the drop in correlations between variables
Precisely measured variables will appear to be more important than poorly measured ones
13-16 © 2007 Pearson Education Canada
Indexes, Scales, and Special Measurement Procedures While used interchangeably, an index refers
to the combination of two or more indicators; a scale refers to a more complex combination of indicators where the pattern of responses is taken into account
Indexes are routinely constructed to reflect complex variables Socioeconomic status, job satisfaction, group
dynamics, social attitudes toward an issue Produce more valid and reliable measures
than single-item measures

13-17 © 2007 Pearson Education Canada
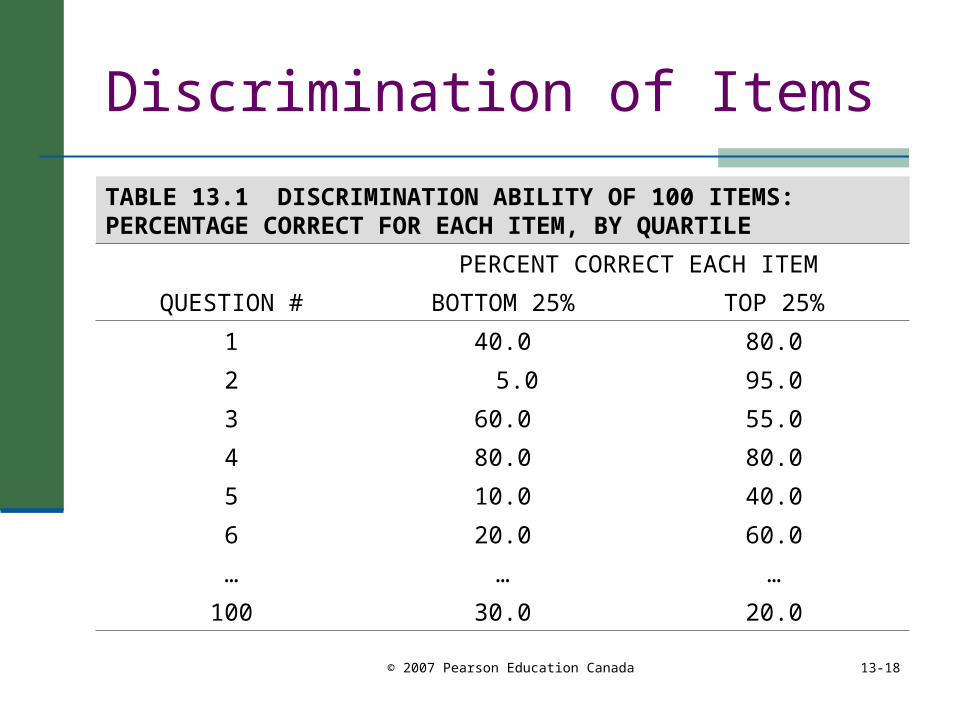
Item Analysis
Items in an index should discriminate well Example of test item development
Test graded, students divided into upper and lower quartile
Examine performance on each question Select those questions that discriminate best See Table 13.1 (next slide)
13-18 © 2007 Pearson Education Canada
Discrimination of Items
TABLE 13.1 DISCRIMINATION ABILITY OF 100 ITEMS: PERCENTAGE CORRECT FOR EACH ITEM, BY QUARTILE
PERCENT CORRECT EACH ITEM
QUESTION # BOTTOM 25% TOP 25%
1 40.0 80.0
2 5.0 95.0
3 60.0 55.0
4 80.0 80.0
5 10.0 40.0
6 20.0 60.0
… … …
100 30.0 20.0

13-19 © 2007 Pearson Education Canada
Selecting Index Items
1. Review conceptual definition Note if the concept has different dimension
2. Develop measures for each dimension Developed items for each dimension of the
concept
3. Pre-test index Complete the index yourself, then pre-test it
with target-group members
4. Pilot test index Use SPSS to assess internal consistency
13-20 © 2007 Pearson Education Canada
The Rationale for Using Several Items in an IndexIllustration: goal – to measure people’s attitudes
toward abortion Would it be better to have one question or
several questions in our measure? Answer: use several items
Why? Attitude toward abortion would be complex;
a valid measure should reflect complexity (e.g., their view may differ if mother’s life is threatened, or was result of rape)
13-21 © 2007 Pearson Education Canada
Rationale (cont’d)
Single item questions (e.g. Are you in favour of abortion? yes/no) are more prone to measurement error (less reliable and valid) Such measures often lack precision; e.g., do
not state conditions influencing attitudes Do not measure degree of support; thus,
may not represent people’s opinion Have a limited range of values (limits type of
statistical analysis)
13-22 © 2007 Pearson Education Canada
Likert-Based Indexes
Idea of constructing indexes based on related questions introduced by Rensis Likert
Original measure: asks respondent to note agreement with list of statements using a five-point scale: (1) strongly disagree, (2) disagree, (3) undecided
or neutral, (4) agree, (5) strongly agree To improve reliability – increased number of
response options from 5 to 9 Example shown on next slide
13-23 © 2007 Pearson Education Canada
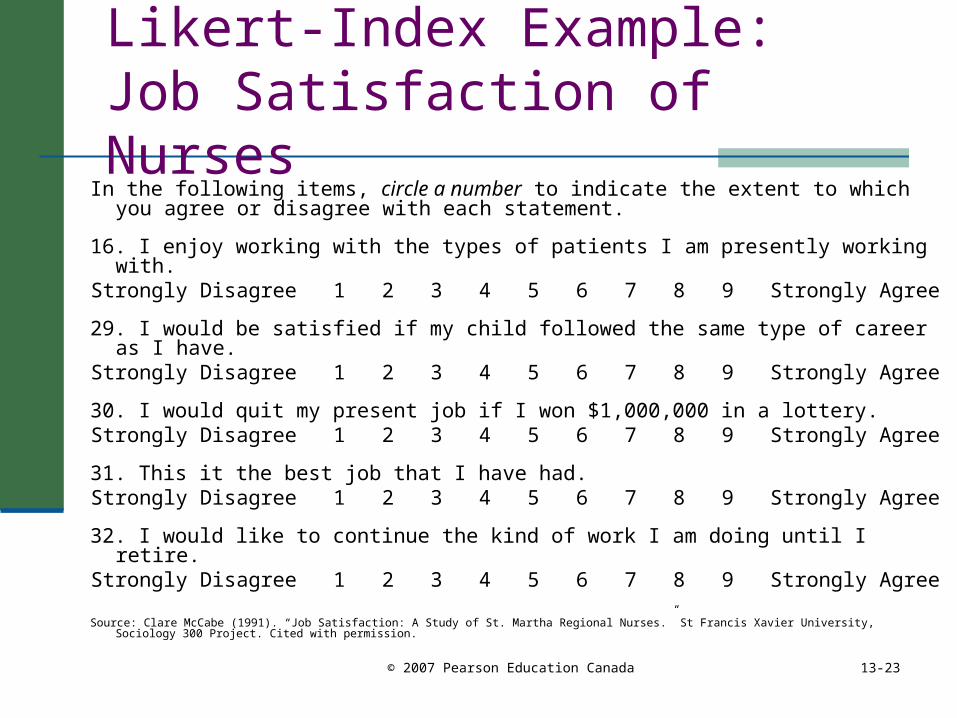
Likert-Index Example: Job Satisfaction of Nurses
In the following items, circle a number to indicate the extent to which you agree or disagree with each statement.
16. I enjoy working with the types of patients I am presently working with.Strongly Disagree 1 2 3 4 5 6 7 8 9 Strongly Agree
29. I would be satisfied if my child followed the same type of career as I have.Strongly Disagree 1 2 3 4 5 6 7 8 9 Strongly Agree
30. I would quit my present job if I won $1,000,000 in a lottery.Strongly Disagree 1 2 3 4 5 6 7 8 9 Strongly Agree
31. This it the best job that I have had.Strongly Disagree 1 2 3 4 5 6 7 8 9 Strongly Agree
32. I would like to continue the kind of work I am doing until I retire.Strongly Disagree 1 2 3 4 5 6 7 8 9 Strongly Agree
Source: Clare McCabe (1991). “Job Satisfaction: A Study of St. Martha Regional Nurses.” St Francis Xavier University, Sociology 300 Project. Cited with permission.

13-24 © 2007 Pearson Education Canada
Likert-Based Indexes (cont’d)
Likert-based indexes are widely used Popularity due to a variety of factors:
They are easy to construct There are well-developed techniques for
assessing the validity of potential items They are relatively easy for respondents to
complete improves response rate on surveys
One can assess the reliability of the measure
13-25 © 2007 Pearson Education Canada
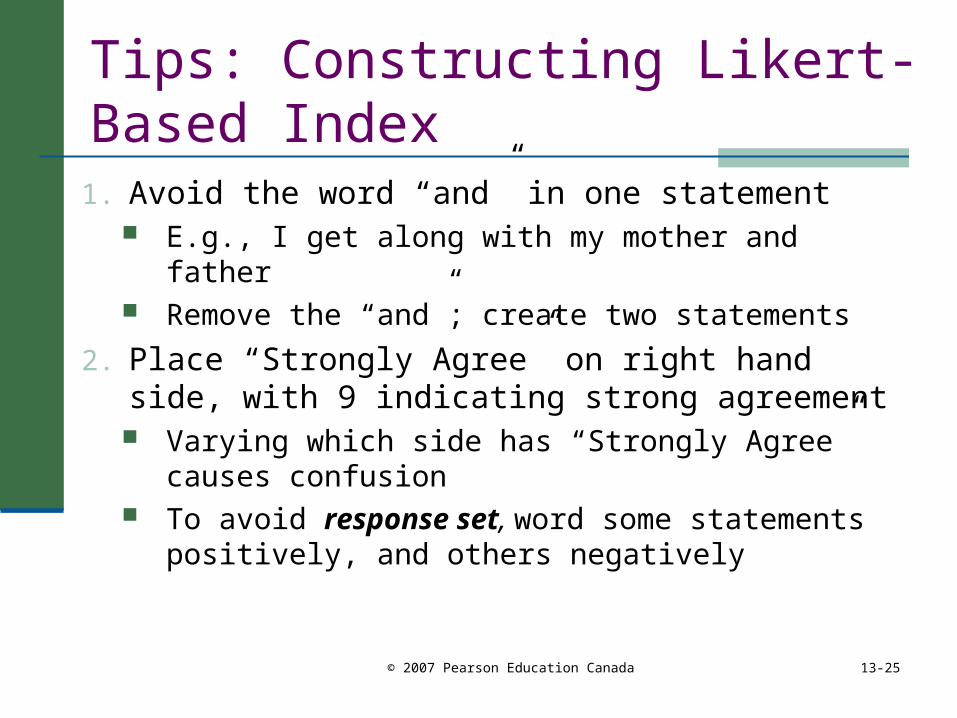
Tips: Constructing Likert-Based Index
1. Avoid the word “and” in one statement E.g., I get along with my mother and father Remove the “and”; create two statements
2. Place “Strongly Agree” on right hand side, with 9 indicating strong agreement Varying which side has “Strongly Agree”
causes confusion To avoid response set, word some
statements positively, and others negatively
13-26 © 2007 Pearson Education Canada
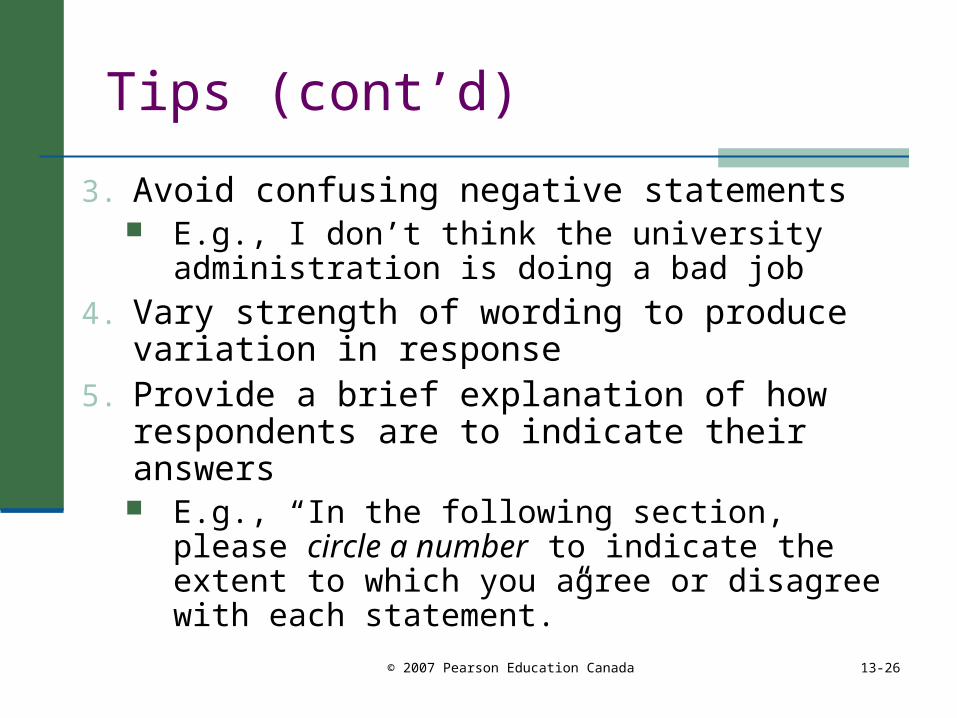
Tips (cont’d)
3. Avoid confusing negative statements E.g., I don’t think the university administration
is doing a bad job
4. Vary strength of wording to produce variation in response
5. Provide a brief explanation of how respondents are to indicate their answers E.g., “In the following section, please circle a
number to indicate the extent to which you agree or disagree with each statement.”
13-27 © 2007 Pearson Education Canada
Evaluation of Likert-Based Indexes
We assume that the summation score of a set of Likert-type responses reflects the true underlying value of the variable
Assess this by examining the correlation among the items

13-28 © 2007 Pearson Education Canada
Using the Internal Consistency Approach to Selecting Index Items Internal consistency (or homogeneity) refers
to the ability of the items in an instrument to measure the same variable The greater the intercorrelation among the
items, the greater the internal consistency Most commonly used method for evaluating
internal consistency is Cronbach’s alpha Easy to calculate with computer software
(Reliability procedure in SPSS)
13-29 © 2007 Pearson Education Canada
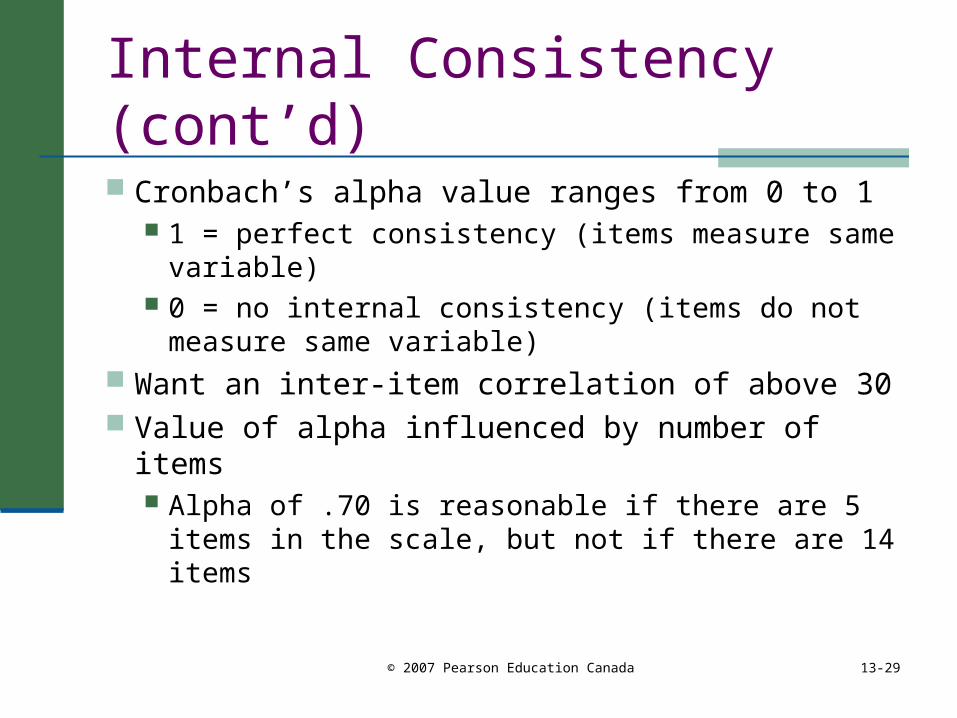
Internal Consistency (cont’d)
Cronbach’s alpha value ranges from 0 to 1 1 = perfect consistency (items measure same
variable) 0 = no internal consistency (items do not
measure same variable) Want an inter-item correlation of above 30 Value of alpha influenced by number of items
Alpha of .70 is reasonable if there are 5 items in the scale, but not if there are 14 items

13-30 © 2007 Pearson Education Canada
Semantic Differential Procedures
In this measure, a series of adjectives indicating two extremes are placed at the margins of the page. Respondent is asked to indicate where on the
continuum he or she would place the group, individual, or object being evaluated
Originally developed to measure subjective feelings toward objects or persons E.g., how respondents view out-groups
13-31 © 2007 Pearson Education Canada
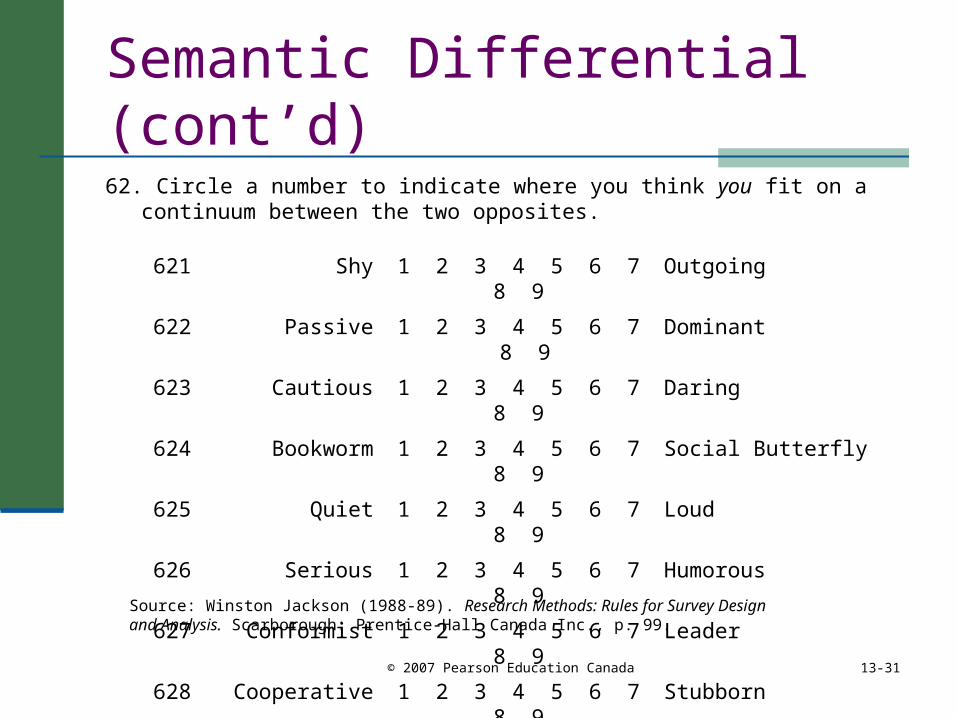
Semantic Differential (cont’d)
62. Circle a number to indicate where you think you fit on a continuum between the two opposites.
621 Shy 1 2 3 4 5 6 7 8 9 Outgoing
622 Passive 1 2 3 4 5 6 7 8 9 Dominant
623 Cautious 1 2 3 4 5 6 7 8 9 Daring
624 Bookworm 1 2 3 4 5 6 7 8 9 Social Butterfly
625 Quiet 1 2 3 4 5 6 7 8 9 Loud
626 Serious 1 2 3 4 5 6 7 8 9 Humorous
627 Conformist 1 2 3 4 5 6 7 8 9 Leader
628 Cooperative 1 2 3 4 5 6 7 8 9 Stubborn
Source: Winston Jackson (1988-89). Research Methods: Rules for Survey Design and Analysis. Scarborough: Prentice-Hall Canada Inc., p. 99.

13-32 © 2007 Pearson Education Canada
Magnitude Estimation Procedures
Respondents use numbers or line lengths to compare the magnitude of a series of stimuli to some fixed standard Useful when comparative judgments are
required (See Box 13.4 and 13.5 in text) E.g., comparing liking of teachers; seriousness
of crimes; liking of one community compared to another one, etc.
Yields ratio level measures Researcher must be present to explain
instructions


