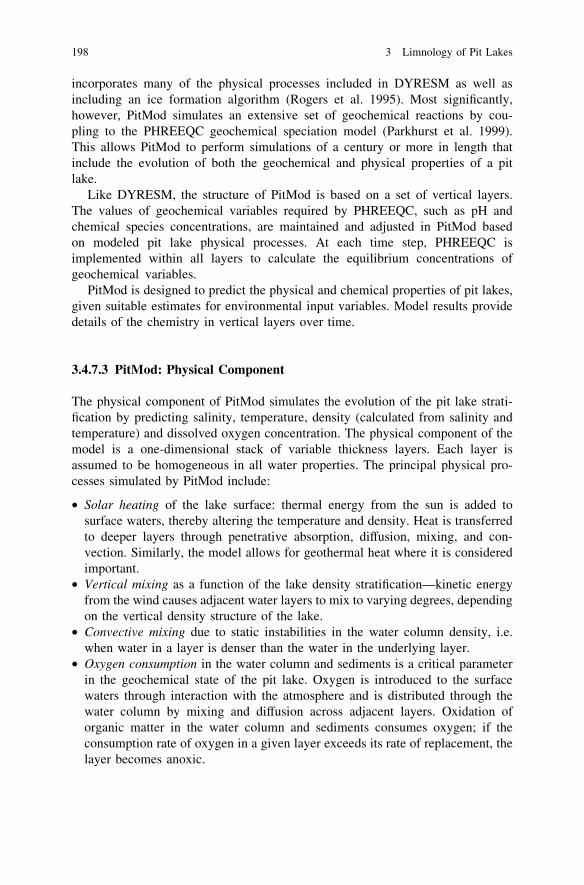
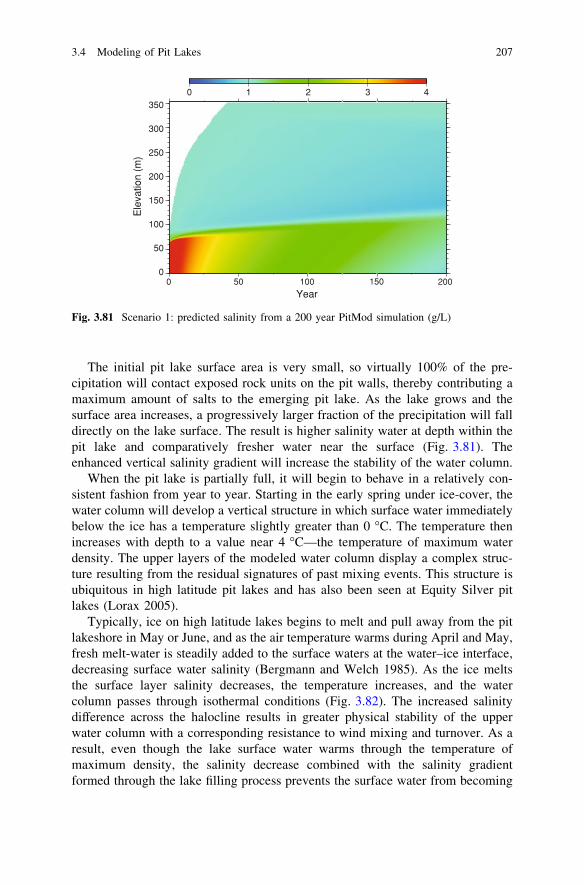
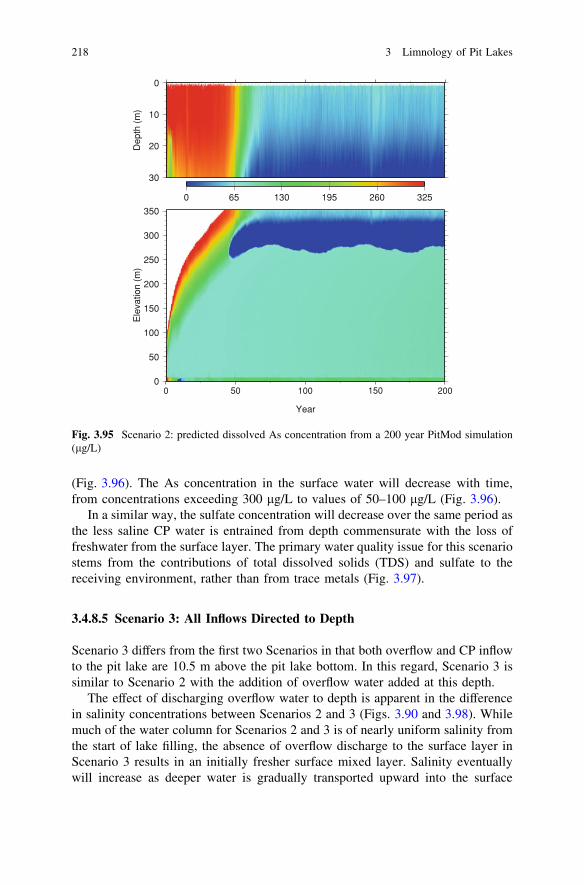
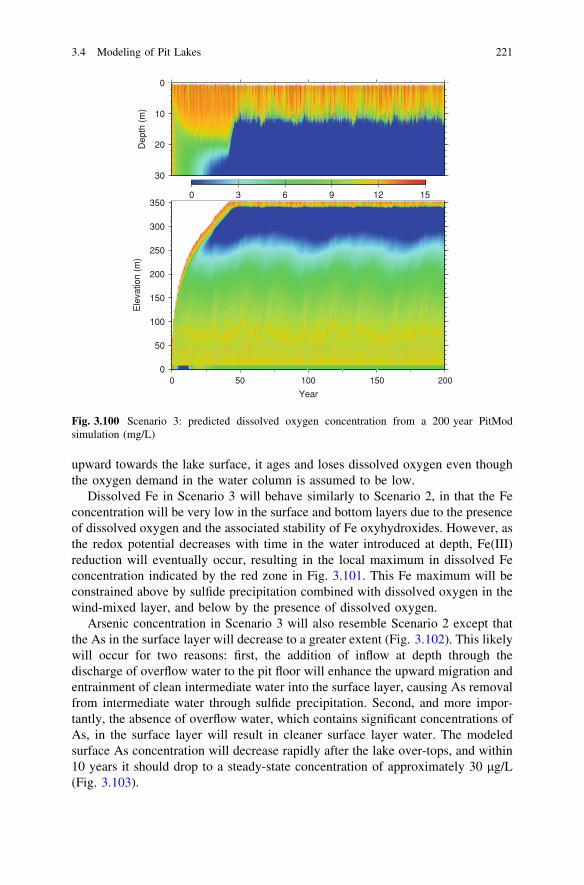
Chapter 3 Limnology of Pit Lakes 3.1 Physical Properties of Acidic Pit Lakes Bertram Boehrer Mine water in pit lakes can have a pH of 3 or even less. In some cases, we find gradients of pH within the same lake extending from acidic to neutral. In addition, pH-neutral water can possess the potential to turn acidic when brought into contact with oxygen. In acidic waters, the concentrations of heavy metals can be high, which differentiates such lakes from ‘natural’ lakes, except for a few volcanic ones. Given these high concentrations, common approximations for electrical conductivity or density that may be reasonable in less contaminated water will not necessarily be accurate. In conclusion, alternative approaches need to be devel- oped. In the following subsection, the most common approaches to deal with these properties are presented. 3.1.1 Electrical Conductivity Acidity represents a reactive constituent. When iron rich, monimolimnetic waters of Waldsee are brought into contact with dissolved oxygen, iron is precipitated. The resulting hydrolysis of ferric iron, releases H + ions, which directly affect the carbonate buffering system and hence lower the conductivity. As a consequence, the implementation of electrical conductivity as a tracer underlies some severe restrictions. Natural freshwater lakes usually have an electrical conductivity in the range of 0.1–0.5 mS/cm at 25°C. Mine drainage can have considerably higher conductiv- ities (see Fig. 3.1). As a consequence, the precipitation versus evaporation deficit in the eastern German summer shows up in high values of conductivity during summer stratification (Karakas et al. 2003), while during deep circulation and in W. Geller et al. (eds.), Acidic Pit Lakes, Environmental Science and Engineering, DOI: 10.1007/978-3-642-29384-9_3, Ó Springer-Verlag Berlin Heidelberg 2013 23
Transcript
Chapter 3Limnology of Pit Lakes
3.1 Physical Properties of Acidic Pit Lakes
Bertram Boehrer
Mine water in pit lakes can have a pH of 3 or even less. In some cases, we findgradients of pH within the same lake extending from acidic to neutral. In addition,pH-neutral water can possess the potential to turn acidic when brought into contactwith oxygen. In acidic waters, the concentrations of heavy metals can be high,which differentiates such lakes from ‘natural’ lakes, except for a few volcanicones. Given these high concentrations, common approximations for electricalconductivity or density that may be reasonable in less contaminated water will notnecessarily be accurate. In conclusion, alternative approaches need to be devel-oped. In the following subsection, the most common approaches to deal with theseproperties are presented.
3.1.1 Electrical Conductivity
Acidity represents a reactive constituent. When iron rich, monimolimnetic watersof Waldsee are brought into contact with dissolved oxygen, iron is precipitated.The resulting hydrolysis of ferric iron, releases H+ ions, which directly affect thecarbonate buffering system and hence lower the conductivity. As a consequence,the implementation of electrical conductivity as a tracer underlies some severerestrictions.
Natural freshwater lakes usually have an electrical conductivity in the range of0.1–0.5 mS/cm at 25�C. Mine drainage can have considerably higher conductiv-ities (see Fig. 3.1). As a consequence, the precipitation versus evaporation deficitin the eastern German summer shows up in high values of conductivity duringsummer stratification (Karakas et al. 2003), while during deep circulation and in
W. Geller et al. (eds.), Acidic Pit Lakes, Environmental Science and Engineering,DOI: 10.1007/978-3-642-29384-9_3, � Springer-Verlag Berlin Heidelberg 2013
23
the hypolimnion conductivity remains roughly constant. High concentrations ofdissolved substances can contribute to epilimnetic water density. Especially inareas of dry summers, this effect can contribute to deep mixing when the higherepilimnetic concentrations of dissolved substances help overcome temperaturestratification when falling autumn temperatures allow deep mixing. Ocean watershave an electrical conductivity of around 42 mS/cm at 25�C, while some (natural)salt lakes show an electrical conductivity even higher than 200 mS/cm (Dead Sea,Akawwi 2006; case study 5.3).
Acidic waters contain a considerable concentration of dissolved substances,i.e. the H+ ions and corresponding ions to balance the electric charge. The specificelectrical conductivity of H+ is particularly high, i.e. a factor of 5–10 higher thanmost other ions (see Millero 2001). The conductivity contribution of H+ ions (andOH-) can be evaluated for infinite dilution, which of course is not realistic for pHvalues below 1 or above 13. The conductivity contribution of H+ and OH- give alower limit of the electrical conductivity at 25�C of lake water (for the pH range0–14, see Fig. 3.2). If the conductivity of a water sample is at least an order ofmagnitude above the curve in Fig. 3.2, H+ (and OH-) ions contribute a muchlower portion to electrical conductivity, compared to other ions.
If lakes are neutralized by the addition of buffers, conductivity may remainhigh, as seen in the example of Lake Bockwitz, where soda was added to reduceacidity. The situation is less drastic if, during the filling period, water had beenintroduced from natural systems to dilute the highly mineralized (acidic) drainagefrom the mined area (e.g. Lake Goitsche, Boehrer et al. 2003).
0 5 10 15 20 25 301.6
2
2.4
2.8
3.2
elec
tr. c
ondu
ctiv
ity [m
S/c
m]
temperature [°C]
9 m
0.5 m
5 m
Fig. 3.1 Temperature dependence of electrical conductivity in water samples from severaldepths in Mining Lake 111 versus temperature (0.5 m—epilimnion, 5 m—hypolimnion,9 m—monimolimnion; modified after Karakas et al. 2003)
24 3 Limnology of Pit Lakes
Electrical conductivity is a function of dissolved substances and temperature.To use it to assess the concentration of dissolved substances, the temperature effectis commonly removed by referring to the conductivity, as it were at a certainreference temperature, usually 25�C. Experience shows that the effect of temper-ature can be approximated quite well using linear regression, C(T) = aT ? b (seeFig. 3.1). This yields an equation for calculating j25 from a field measurement ofpairs of temperature T and in situ conductivity C(T), using Eq. 3.1,
j25 ¼CðTÞ
a25ðT � 25oCÞ þ 1ð3:1Þ
where a25 is commonly set to 0.02/K, or rarely to slightly lower values for naturalneutral lakes.
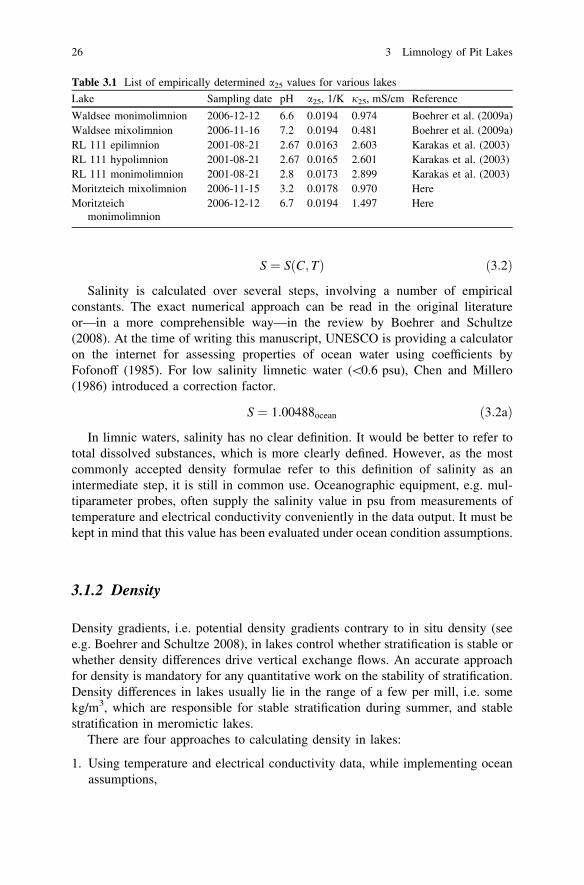
All ions show specific temperature dependences, though, except for H+, they liewithin a relatively narrow band (see Sorensen and Glass 1987). As a consequence,the electrical conductivity of neutral waters calculated in this manner aligns wellwith Eq. 3.1. In acidic waters, however, the temperature dependence must bequantitatively analysed. In lakes with a low pH, a value for a25 considerablysmaller than 0.02/K must be used (see Table 3.1).
For temperature compensation, the most common reference temperature is25�C, though tables have also been developed for 20�C. Choosing a referencetemperature closer to the temperatures found in the lake can improve the accuracyof the results (e.g. Boehrer et al. 2009b).
Oceanographers define salinity S as a function of temperature T and electricalconductivity C. Values are given in practical salinity units [psu], which give agood indication of dissolved salts in g/kg of ocean water and brackish water.
0 2 4 6 8 10 12 1410−6
10−4
10−2
100
102
pH
el. c
ondu
ctiv
ity [m
S/cm
]
H+
OH−
sum
Fig. 3.2 Electrical conductivity at 25�C of the water ions, H+ and OH- and the sum against pH,calculated for infinite dilution
3.1 Physical Properties of Acidic Pit Lakes 25
S ¼ SðC; TÞ ð3:2Þ
Salinity is calculated over several steps, involving a number of empiricalconstants. The exact numerical approach can be read in the original literatureor—in a more comprehensible way—in the review by Boehrer and Schultze(2008). At the time of writing this manuscript, UNESCO is providing a calculatoron the internet for assessing properties of ocean water using coefficients byFofonoff (1985). For low salinity limnetic water (\0.6 psu), Chen and Millero(1986) introduced a correction factor.
S ¼ 1:00488ocean ð3:2aÞ
In limnic waters, salinity has no clear definition. It would be better to refer tototal dissolved substances, which is more clearly defined. However, as the mostcommonly accepted density formulae refer to this definition of salinity as anintermediate step, it is still in common use. Oceanographic equipment, e.g. mul-tiparameter probes, often supply the salinity value in psu from measurements oftemperature and electrical conductivity conveniently in the data output. It must bekept in mind that this value has been evaluated under ocean condition assumptions.
3.1.2 Density
Density gradients, i.e. potential density gradients contrary to in situ density (seee.g. Boehrer and Schultze 2008), in lakes control whether stratification is stable orwhether density differences drive vertical exchange flows. An accurate approachfor density is mandatory for any quantitative work on the stability of stratification.Density differences in lakes usually lie in the range of a few per mill, i.e. somekg/m3, which are responsible for stable stratification during summer, and stablestratification in meromictic lakes.
There are four approaches to calculating density in lakes:
1. Using temperature and electrical conductivity data, while implementing oceanassumptions,
Table 3.1 List of empirically determined a25 values for various lakes
Lake Sampling date pH a25, 1/K j25, mS/cm Reference
2. Making freshwater assumptions (of natural lakes) at low salinity,3. Evaluating lake-specific regressions between temperature, conductivity, and
density, and4. By adding partial molal volumes and masses, when concentrations of all rel-
evant dissolved substances are known.
1. Oceanographers use the so-called UNESCO formula by Fofonoff and Millard(1983) to evaluate density. This approach is valid only between 2 and 42 psu ofsalinity, and hence should only be used for a small number of lakes. In addition,the salt composition must be similar to brackish water (e.g. Rassnitzer See,Wallendorfer See in mining area Merseburg-Ost; Böhrer et al. 1998). This isthe most commonly used approach for calculating density in numerical strati-fication models of lakes, and so this formula has become very important inlimnology.
2. For natural lakes with salinities below 0.6 psu, Chen and Millero (1986) pro-posed using a different approach to calculate density. They suggested using aterm that is based on the above definition of salinity for limnic waters toincorporate the density contribution of solutes. However, for acidic lakes, andalso for most natural lakes, the composition of dissolved substances does notconcur with the waters used for the regressions by Chen and Millero.An alternative was offered by Bührer and Ambühl (1975) for alpine lakes(in Europe): They used a third order polynomial for density against temperatureand added the density of dissolved substances with a linear term for conduc-tivity. This formula at least seems to satisfy the density requirements in severalnatural lakes, possibly with a small adjustment for the coefficients (e.g. Heinz1990). The numerical approaches, including the required coefficients, werelisted by Boehrer and Schultze (2008).
3. In many cases, these approaches are not accurate enough to calculate densityin pit lakes, as the differences due to chemical composition of solutes lead toconsiderable errors. In these cases, an empirical approach should be used.If concentration changes of solutes are found, but the composition of thesolutes does not change much, the best approach is probably the following: alake water sample is investigated for its electrical conductance (j25sample seeEq. 3.1) and its density over the required temperature range is measured in adensitometer. Usually a forth order polynomial is required to fit the densitycurve within the accuracy that is delivered from high accuracy densitometers(relative accuracy, e.g. PAAR Graz). A ‘‘pure water’’ sample is also measuredin the same densitometer. The density difference between the samples isattributed to the conductivity of the lake water sample, as a measure of thesolute concentration. The density formula hence has the general form (e.g.Karakas et al. 2003)
q ¼ qW þj25
j25sample
Dq ð3:3Þ
3.1 Physical Properties of Acidic Pit Lakes 27
Nowadays, the pure water reference qW can be taken from Kell (1975) or Tanakaet al. (2001). The density difference Dq can be a constant or a polynomial intemperature DqðTÞ. Conducting a dilution series can improve the accuracy,especially in highly saline systems (e.g. Jellison et al. 1999).If a lake consists of two layers that differ in their chemical composition, as inmeromictic lakes (see below), the gradient can be reflected in the followingapproach: starting from Eq. 3.3, the lake sample is replaced by the monimolimnionsample (higher conductance from deep waters) and the pure water sample by amixolimnion sample (lower conductance from shallow waters), e.g. Boehrer et al.
(2009a). A density regression qmixo ¼P4
i¼0 piTi (see Fig. 3.3) is produced, and acorresponding qmonimo for the monimolimnion sample. The density difference
between both samples qmonimo � qmixo ¼P4
i¼0 qiTi is attributed to the higherconductance of the monimolimnion sample.Now, any sample of conductance j25 can be linearly interpolated for densitycalculation, under the assumption that any water parcel behaves similar to a linearcombination of the samples measured in the laboratory. Thus, a lake-specificdensity function can be attained for calculating density profiles from fieldmeasurements of temperature, T, and in situ conductivity, C (yielding j25
following Eq. 3.1):
q ¼X4
i¼0
qiTiqW þ
j25 � j25�mixo
j25�monimo � j25�mixo
:X4
i¼0
qiTi ð3:4Þ
The evaluated coefficients for Waldsee (Boehrer et al. 2009a) are lake-specific andhence have not been listed here.
0 10 20 300.2
0.4
0.6
0.8
1
1.2
Temperature [°C]
Con
duct
ivity
[m
S/cm
]monimolimnion 3m
mixolimnion 1m
0 10 20 30−5
−4
−3
−2
−1
0
1
2
Temperature [°C]
Den
sity
−10
00 [
kg/m
3 ]
mixolimnion 1m
monimolimnion 3m
Fig. 3.3 Conductivity (left panel) and density (right panel) of a mixolimnion sample and amonimolimnion sample from Waldsee, Germany versus temperature (from Boehrer et al. 2009a,with permission of American Geophysical Union)
28 3 Limnology of Pit Lakes
4. Finally, density of lake waters can be calculated from partial molal volumes ofsolutes. This approach requires that all substances contributing significantly todensity are known. The approach is straightforward, but has not been widelyused in limnological practice: adding the masses of water plus the concentrationsin molal units bn of substances of molar mass Mn yield the mass m of thesolution, while the volume of water at the respective temperature plus the molalvolumes Vn ¼ oV
obnyield the volume V of the solution (Millero 2001, Table 3.19).
qmv ¼m
V¼ mW þ mW
PnbnMn
mW=qW þ mWP
nbnVn¼ 1þ
PnbnMn
1=qW þP
nbnMnð3:5Þ
Molar masses of solutes are easily available, but molal volumes depend ontemperature and ionic strength. A numerical approach can be found in thework of Boehrer et al. (2010), where the required coefficients oflimnologically important substances are also given. The numerical approachRHOMV can be accessed via the internet (www.ufz.de/webax).
3.1.3 Optical Properties of Lake Water
Due to high concentrations of dissolved substances, mine lakes can have verydistinct coloring. Below pH of about 3, ferric iron is soluble in water; a pro-nounced red color is often encountered. In the aluminum buffered pH range ofabout 5, mine water can show a turbid blue to turquoise color. Light attenuation inthese colored lakes can be very high.
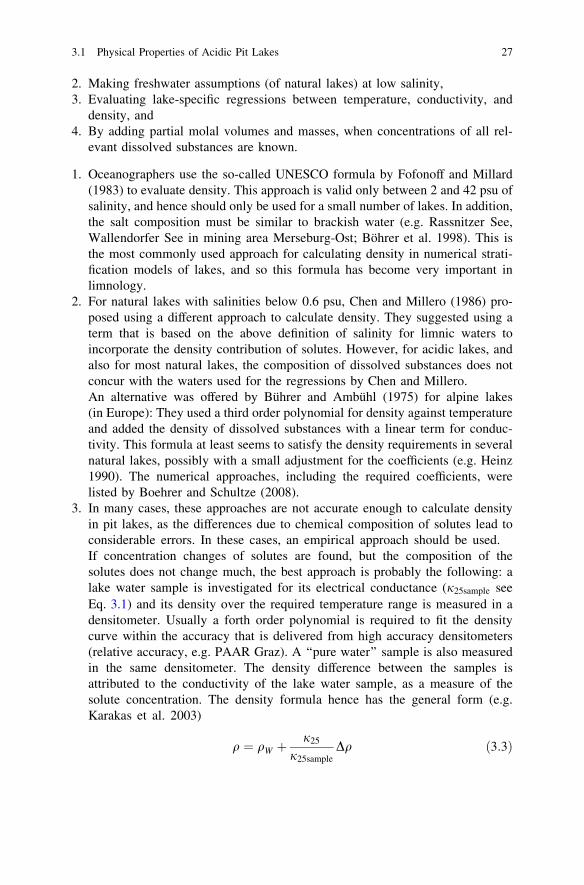
Measurements in Moritzteich show the spectrum of irradiated light againstdepth (Fig. 3.4), which shows pH values of about 3.2 in the mixolimnion (above10 m depth). While directly below the surface there is considerable input of nearinfrared light and near UV, wave lengths below 300 nm and above 750 nm havebeen (nearly) completely attenuated before reaching a depth of 1 m. Hence lightattenuation is a function of wave length. This is also reflected in the perception ofwater color.
While light intensities of wave lengths between 400 and 700 nm can decreaseby 50% from a depth of 0.01–1 m, attenuation is much less below 1 m. At a depthof 2 m, about 80% of the light intensity at 1 m depth can be recorded. Here, lightattenuation is also a function of water depth. In conclusion, the commonassumption of exponential light intensity decrease with depth is a rough approx-imation, at least in some cases.
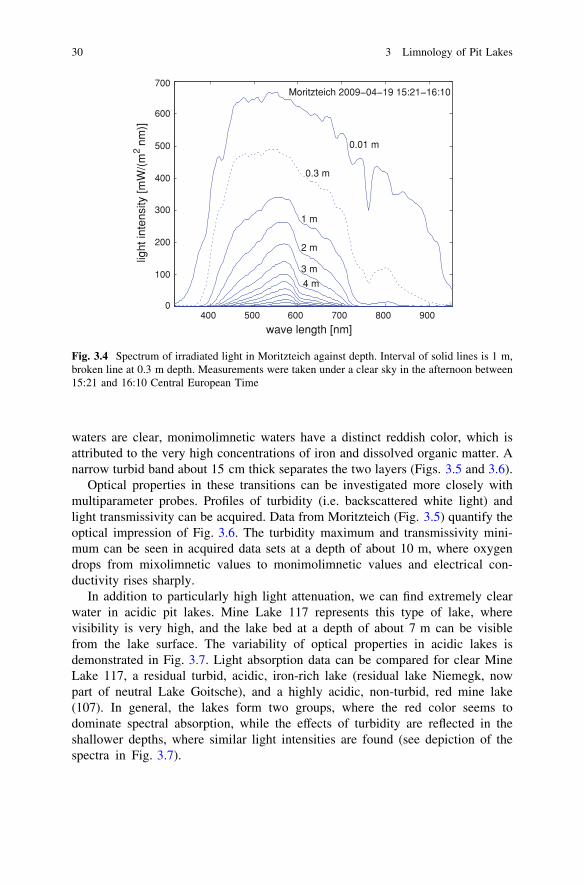
Vertical gradients of dissolved substances result in variable water properties.In the case of meromictic lakes, such a transition can be very sharp, as seen inMoritzteich where water properties go from oxic mixolimnion to anoxic monim-olimnion conditions within several decimeters (see Fig. 3.5). While mixolimnetic
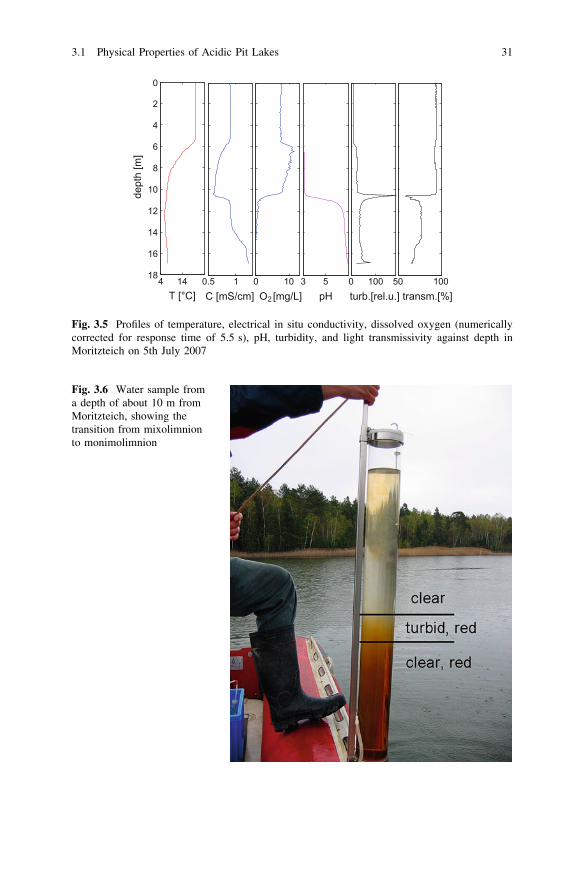
waters are clear, monimolimnetic waters have a distinct reddish color, which isattributed to the very high concentrations of iron and dissolved organic matter. Anarrow turbid band about 15 cm thick separates the two layers (Figs. 3.5 and 3.6).
Optical properties in these transitions can be investigated more closely withmultiparameter probes. Profiles of turbidity (i.e. backscattered white light) andlight transmissivity can be acquired. Data from Moritzteich (Fig. 3.5) quantify theoptical impression of Fig. 3.6. The turbidity maximum and transmissivity mini-mum can be seen in acquired data sets at a depth of about 10 m, where oxygendrops from mixolimnetic values to monimolimnetic values and electrical con-ductivity rises sharply.
In addition to particularly high light attenuation, we can find extremely clearwater in acidic pit lakes. Mine Lake 117 represents this type of lake, wherevisibility is very high, and the lake bed at a depth of about 7 m can be visiblefrom the lake surface. The variability of optical properties in acidic lakes isdemonstrated in Fig. 3.7. Light absorption data can be compared for clear MineLake 117, a residual turbid, acidic, iron-rich lake (residual lake Niemegk, nowpart of neutral Lake Goitsche), and a highly acidic, non-turbid, red mine lake(107). In general, the lakes form two groups, where the red color seems todominate spectral absorption, while the effects of turbidity are reflected in theshallower depths, where similar light intensities are found (see depiction of thespectra in Fig. 3.7).
400 500 600 700 800 9000
100
200
300
400
500
600
700
wave length [nm]
light
inte
nsity
[mW
/(m
2 nm
)]
Moritzteich 2009−04−19 15:21−16:10
0.01 m
0.3 m
1 m
2 m
3 m
4 m
Fig. 3.4 Spectrum of irradiated light in Moritzteich against depth. Interval of solid lines is 1 m,broken line at 0.3 m depth. Measurements were taken under a clear sky in the afternoon between15:21 and 16:10 Central European Time
30 3 Limnology of Pit Lakes
4 1418
16
14
12
10
8
6
4
2
0
T [°C]
dept
h [m
]
0.5 1C [mS/cm]
0 10O2[mg/L]
3 5pH
0 100turb.[rel.u.] transm.[%]
50 100
Fig. 3.5 Profiles of temperature, electrical in situ conductivity, dissolved oxygen (numericallycorrected for response time of 5.5 s), pH, turbidity, and light transmissivity against depth inMoritzteich on 5th July 2007
Fig. 3.6 Water sample froma depth of about 10 m fromMoritzteich, showing thetransition from mixolimnionto monimolimnion
3.1 Physical Properties of Acidic Pit Lakes 31
3.1.4 Stratification and Circulation
At the surface, lakes are exposed to seasonal changes in weather conditions.Exposed to sensible heat exchange with the atmosphere and irradiation from thesun, surface waters show a pronounced annual temperature cycle (see Fig. 3.8).As diffusive transport through water is slow, deeper layers are shielded from heatinput from the atmosphere. Consequently temperature excursions at greater depthsare generally much smaller over an annual cycle (Fig. 3.8). For general features oflake stratification, we refer to Boehrer and Schultze 2008.
During stratification, the density at the lake surface is less than in deeper water.As a consequence, vertical exchange of water parcels requires energy. If notenough energy is available to overcome the density difference, the lake remainsstratified. Usually a strong temperature gradient (thermocline) is formed. Lowerautumn temperatures allow deeper mixing due to falling surface temperatures andhigher water density at the surface. As a consequence, the annual cycle of a lake isdivided into stratification and circulation periods (see Fig. 3.9).
During stratification periods, vertical exchange of dissolved substances is verymuch restricted to vertical circulation of the epilimnion in cold and windy periods.Below the thermocline, vertical transport is generally small. In areas of highdensity gradients, transport coefficients can be close to the molecular level (vonRohden et al. 2009) while at depths that are weakly stratified, transport coefficientscan be larger by several orders of magnitude (e.g. von Rohden and Ilmberger2001).
In small- to medium-size lakes, this turbulent transport mainly happens at theside boundaries where waves and currents interact with the slope of the side walls(Gouldsmit et al. 1997). Turbulence created in the open water only contributes a
Niemegk, 0.5 m12/08/1996
ML 107, 1 m04/06/1996
ML 117, 1 m05/06/1996
Moritzteich, 1 m16/04/2009
300 400 500 600 700 800
wavelength [nm]
abso
rbed
frac
tion
1.0
0.8
0.6
0.4
Fig. 3.7 Light attenuation in acidic pit lakes: ML 117: Mining Lake 117 (pH = 3, very clear),ML 107: Mining Lake 107 (pH = 2.4, clear and red) and residual lake Niemegk (acidic,pH = 2.7, turbid red; all data from Schimmele and Herzsprung 2000) in comparison toMoritzteich (mixolimnion pH = 3.2)
32 3 Limnology of Pit Lakes
large portion of the vertical transport in larger lakes (e.g. Lake Constance, Boehreret al. 2000; Kocsis et al. 1991). As the density gradient is the crucial quantity toovercome, transport coefficients have been correlated with the potential densitygradient in the form of a stability frequency
N2 ¼ � g
qoqoz
ð3:6Þ
for an empirical correlation of transport coefficients under given stratificationconditions (Heinz et al. 1990; von Rohden and Ilmberger 2001).
0 50 100 150 200 250 300 3500
5
10
15
20
25
Julian day of 2004
tem
pera
ture
[°C
]
0.5 m4.0 m7.0 m10 m18 m31 m
XN5 − 2004
Fig. 3.8 Temperature time series acquired at several depths in Lake Goitsche at sampling siteXN5
Fig. 3.9 Circulation pattern of a dimictic lake, with a circulation period in spring and autumn,separated by stagnation periods during summer, and periods of ice cover in winter
3.1 Physical Properties of Acidic Pit Lakes 33
In contrast, during circulation periods, vertical transport happens at a fast rate.Oxygen is supplied to deeper layers of the lake and dissolved substances, whichhave accumulated in the deep waters during the stratification period, are redis-tributed through the lake.
If a lake is temperature stratified during summer and covered by ice duringwinter, it usually experiences two separate stratification periods (stagnation),separated by two deep circulation periods. Such lakes are called dimictic. Usuallylakes without an ice cover circulate sporadically during winter under appropriateweather conditions. These lakes are called monomictic, as they show one extendedperiod of stratification and one period of (intermittent) full vertical circulation overan annual cycle.
Only very deep lakes without gradients of dissolved substances can havecontinuous stratification throughout winter without an ice cover. These lakes mayexhibit other specialties of permanent stratification due to pressure effects on thetemperature of maximum density (see Crawford and Collier 1997; Petterson 1902;Yoshimura 1936). This kind of stratification has been observed in very deep craterlakes in Japan (Fig. 3.10, Boehrer et al. 2009b), which have a similar shape andsize as large mine pits (several kilometres in diameter and depths that can exceed200 m). Due to the small horizontal dimension, the deep water stratification inthese lakes corresponds to model results derived under consideration of horizontalhomogeneity and stability criteria (Boehrer et al. 2008).
Deep water renewal by thermobaric instabilities, as postulated for the deepwater renewal in Lake Baikal (Weiss et al. 1991), do not play an important role atthis size of lake basins. In very deep lakes, the difference between potentialtemperature and in situ temperature can become important, especially if deepwater temperatures differ much from the temperature of maximum density (see e.g.Boehrer and Schultze 2008).
If surface temperatures of a lake never fall below the temperature of maximumdensity around 4�C, the deep water will have a temperature above 4�C. Hence,these lakes can only circulate vertically when surface waters have cooled suffi-ciently to overcome the density of the deep water. Due to the variability of wintertemperatures, this is not necessarily the case every winter, especially if the lakesare deep. Such lakes are termed oligomictic.
In cases where gradients of dissolved substances contribute significantly to thedensity stratification, concentrations in the deep water may suffice to prevent a lakefrom a full overturn (e.g. Findenegg 1933; Hutchinson 1957). Isolated fromexchange with the atmosphere, the deepest layers in the lake develop a chemicalmilieu different from the waters above. Such a bottom layer is called a monimo-limnion, contrary to the mixolimnion, i.e. the ensemble of epilimnion and hypo-limnion above (see Fig. 3.11). A zone of high chemical gradients, a ‘chemocline’separates the two layers. Such lakes are called meromictic, as opposed to holomictic,when a full overturn of the water masses takes place at regular or irregular intervals.
Many lakes in deep mine pits will develop meromictic conditions (e.g. Boehrerand Schultze 2006; Stevens and Lawrence 1997, 1998). Analogies have beenreported between volcanic lakes and lakes forming in abandoned opencasts
34 3 Limnology of Pit Lakes
concerning shape and size (Boehrer et al. 2009b), geochemistry and microbialactivity (e.g. Wendt-Potthoff and Koschorreck 2002), and meromixis (e.g. Boehrerand Schultze 2006; Murphy 1997; Sánchez-España et al. 2008; Stevens andLawrence 2006).
A number of geochemical processes can be involved in sustaining the densitystratification (see Table 3.2), including the iron cycle as the most prominent for lakesoriginating from mining (see Boehrer and Schultze 2006, 2008). In addition, thegroundwater connection plays an important role in many meromicitic pit lakes (vonRohden and Ilmberger 2001; Seebach et al. 2008; von Rohden et al. 2009). Quantifi-cation and numerical simulation of processes controlling meromixis remain a chal-lenge (Böhrer et al. 1998; Jellison et al. 1998; Heidenreich et al. 1999; Fig. 3.12).
Besides iron, the anoxic decomposition of organic material, manganese, andcalcite precipitation must be included in stability considerations. Many otherelements experience co-precipitation, when the above-mentioned chemicals formsolids in the water column. For a proper meromixis prognostication, a full geo-chemical model is required. Geochemical models have been developed (Mülleret al. 2008; Salmon et al. 2008), but they still require the proper coupling ofgeochemical processes to density effects to properly reflect the evolution ofstratification (Moreira et al. 2011).
In many cases, mining has disrupted an equilibrium that had existed for manycenturies or even millennia before. Removal of an overburden and lowering thewater table has provided oxygen to layers where input had previously been verylow. As a consequence, some mineral deposits have gained mobility, such as metalions after oxidation of their sulfide deposits. Depending on the paths they havetaken before entering a pit lake, groundwaters from various aquifers can greatlyvary in their concentrations of dissolved substances. As a consequence, pit lakes ingeneral are exposed to high mineral gradients.
2 3 4 5
300
200
100
0
temperature [°C]
dept
h [m
]
8 10 12 14pH, O
2[mg/L]
130 135κ
4 [μ S/cm]
04−19
04−11
05−21 pH
O2
Fig. 3.10 Profiles of temperature, electrical conductivity, pH, and dissolved oxygen in LakeShikotsu in Japan from 21st May 2005 (and other dates where annotated, modified after Boehreret al. 2009b)
3.1 Physical Properties of Acidic Pit Lakes 35
Monimolimnia, however, do not represent entirely isolated water bodies. There isa certain minimum diffusive exchange with the overlying mixolimnion. In addition,small-scale turbulence may transport dissolved substances across the chemocline.
Fig. 3.11 Circulation pattern of a meromictic lake; the chemically different monimolimnionremains in the deepest depression of the lake bed throughout the year
Table 3.2 Documented precipitation processes responsible for sustaining meromixis
Substance Lake, country Reference
Sodium sulphate Shield lakes, Canada Rawson and Moore (1944)Organic material Längssee, Austria Frey (1955)Calcite Lake La Cruz, Spain Rodrigo et al. (1998)Iron Swinsjöen, Norway Kjensmo (1967)Manganese Lake Nordbytjernet, Norway Hongve (1997)
monimo-limnion
mixo-limnion oxic, fresh, cold
anoxic, saline, warm
Fe IIIFe2+ heat
HCO3-
reduction
heat
oxidation
O2 CO2
DOMCO2
Fig. 3.12 Geochemical cycle sustaining the iron meromixis in Waldsee (from Boehrer et al.2009a, with permission of the American Geophysical Union)
36 3 Limnology of Pit Lakes
In many cases, monimolimnia receive inflows from the groundwater domain, anddischarge into it (Heidenreich et al. 1999). Pit lakes are young aquatic systems, wheretime has been short to form a sediment layer that could isolate the lake water from thegroundwater domain. As a result, highly dynamic systems are formed that can beclosely linked to groundwater flows that may have unusually high gradients.
To confine hazardous substances to deeper waters, it may be desirable to reducevertical exchange (Schultze and Boehrer 2009). At least in two cases, resultingmeromictic conditions have been induced or retained intentionally (Island CopperMine Lake in Canada: Fisher 2002, Fisher and Lawrence 2006; Lake Vollert-Süd:Stottmeister et al. 1998). In both cases, dissolved substances were considered ahazard to the surface waters. Confined to deeper layers of the water column, theydo not pose a danger to the fauna around the lake. In the case of Island CopperMine Lake, anoxic conditions in the deep water are anticipated after oxygen isdepleted, which should induce precipitation of metal sulfides.
Decomposition of organic material and co-precipitation leads to accumulationof dissolved substances in the deep water. These substances contribute to densityand thus sustain the presence of meromixis. Accumulation continues until for-mation is balanced by exports out of the monimolimnion into the mixolimnion orgroundwater space. Some of these dissolved substances are gases. In addition topassive transport by the water, gases can escape by forming bubbles, which movedue to their own buoyancy. Bubbles form when the sum of partial pressuresovercomes the local pressure (e.g. Halbwachs et al. 2004), which essentially is thesum of hydrostatic pressure and air pressure. Concentrations in the water andpartial pressures are linked by the so-called Bunsen coefficient.
Amongst gases, carbon dioxide plays a particular role. As its Bunsen coefficientis much larger (&1) than most other gases (&0.01), a much higher volume of CO2
can be dissolved in water. Above pH = 5, part of the carbonate is dissolved asbicarbonate ions or carbonate ions. In addition, the density contribution of CO2 ispositive, while other common gases such as O2 and N2 contribute negatively todensity, i.e. dissolving oxygen in water decreases the density due to an expandingvolume. As a consequence, a water column can be stably stratified due to itsincreasing CO2 concentration towards greater depths.
The sudden release of large volumes of dissolved gases has been documentedfrom tropical volcanic lakes. Such limnic eruptions have cost the lives of 1,700human beings in the neighborhood of Lakes Monoun and Nyos, both located inCameroon, in 1984 and 1986, respectively. Despite much research, the releasemechanisms of these events are not agreed upon.
3.1.5 Waves and Currents in Mining Lakes
Like natural and neutral lakes, acidic lakes are exposed to meteorological forcing.Winds and differential cooling, for example, drive currents and create surface andinternal waves. There are differences in the flow behavior of mine pit lakes and
3.1 Physical Properties of Acidic Pit Lakes 37
natural (and neutral) lakes, beyond what was discussed about deep recirculation,which are due in most cases to the morphometric peculiarities of the pits ratherthan the water properties. In this subsection, we refer to a number of specialstratification and flow features that may be encountered in mine pit lakes andwhich are not commonly discussed when referring to currents in lakes in general.For the general context of currents in lakes, we refer to the literature of physicallimnology (e.g. Fischer et al. 1974; Hutter 1987; Imberger and Patterson 1990;Imboden and Wüest 1995).
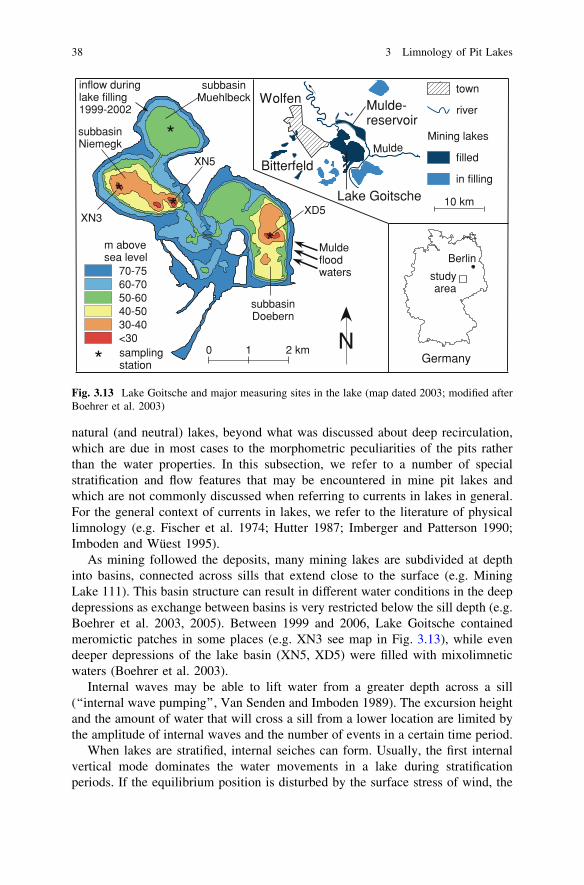
As mining followed the deposits, many mining lakes are subdivided at depthinto basins, connected across sills that extend close to the surface (e.g. MiningLake 111). This basin structure can result in different water conditions in the deepdepressions as exchange between basins is very restricted below the sill depth (e.g.Boehrer et al. 2003, 2005). Between 1999 and 2006, Lake Goitsche containedmeromictic patches in some places (e.g. XN3 see map in Fig. 3.13), while evendeeper depressions of the lake basin (XN5, XD5) were filled with mixolimneticwaters (Boehrer et al. 2003).
Internal waves may be able to lift water from a greater depth across a sill(‘‘internal wave pumping’’, Van Senden and Imboden 1989). The excursion heightand the amount of water that will cross a sill from a lower location are limited bythe amplitude of internal waves and the number of events in a certain time period.
When lakes are stratified, internal seiches can form. Usually, the first internalvertical mode dominates the water movements in a lake during stratificationperiods. If the equilibrium position is disturbed by the surface stress of wind, the
Germany
Berlin
studyarea
10 km
in filling
filled
river
town
Mining lakes
N
Mulde
Wolfen
Lake Goitsche
Bitterfeld
Mulde-reservoir
inflow duringlake filling1999-2002
subbasinMuehlbeck
subbasinNiemegk
subbasinDoebern
70-7560-7050-6040-5030-40<30
m abovesea level
0 1 2 km
Muldefloodwaters
samplingstation*
*
*
*
*
XN5
XN3XD5
Fig. 3.13 Lake Goitsche and major measuring sites in the lake (map dated 2003; modified afterBoehrer et al. 2003)
38 3 Limnology of Pit Lakes
cessation of the wind will result in internal waves, where the epilimnion andhypolimnion usually move in opposite directions in a frequency determined by thelake morphometry and the density stratification of the water column. At a fixedposition, temperature oscillations of a distinct frequency can be recorded(Fig. 3.14). Higher modes have also been reported, and in a few cases, they aredominant (Vidal et al. 2005), but usually, their influence on currents is small, andcan be quantified numerically (Boehrer 2000).
Lake Goitsche consists of several subbasins, which were interconnected bychannels for the flooding procedure. By the year 2001, the subbasins had reached acommon water surface, slightly greater than 70 m above sea level (see Fig. 3.13). Thethermocline of the subbasin Niemegk (between 7 and 10 m water depth, Fig. 3.14)lay below the sill depth of the neighboring Mühlbeck and Döbern subbasins. Inter-facial waves on the thermocline (i.e. first mode internal waves), were not able to leavethe basin. The internal wave recorded at location XN5 had a period of 4 h. Thisoscillation period was clearly related to the size of the Niemegk subbasin. Theoscillation of the thermocline induced currents in the epilimnion (and hypolimnion).However, as the thermocline oscillation was confined to the subbasin, surface currentsmust have felt the sill although they flowed clearly above the sill depth.
Boehrer and Stevens (2005) pointed out that the distribution of kinetic energymay be affected by the fact that reflection conditions for internal (ray) waves inmany mine lakes are different than in natural lakes. Natural lakes typically have ashallow near-shore zone that acts as a ray wave trap (e.g. Turner 1973). In addi-tion, benches left from mining produce even steeper walls. Furthermore, suchbenches act as discrete locations that can create internal wave rays of defined wavelength and imposed frequency, such as the internal seiche in Island Copper MineLake. The observed turbulence pattern below the chemocline (Stevens et al. 2005)may be connected to the uniform wavelength (Boehrer and Stevens 2005).
8 10 12 14 165
10
15
20
time [days of May 2001]
tem
pera
ture
[°C
]
0.5 m2.5 m4.0 m7.0 m10 m18 m31 m
XN5
Fig. 3.14 Temperature time series at several depths in Lake Goitsche, subbasin Niemegk(position XN5), showing oscillations
3.1 Physical Properties of Acidic Pit Lakes 39
3.1.6 Mixing and Vertical Transport
Gradients of dissolved substances can be sustained for longer time periods, ifdensity stratification restricts vertical transport. This was verified when the pre-viously acidic residual lake Niemegk was filled with river water to reduce acidity.While the introduced flooding water had neutralized the epilimnetic waters withina short time period during 2000, the deep waters retained their low pH until deeprecirculation later during the year allowed for vertical exchange of dissolvedsubstances, such as buffering chemicals, into the deeper water (Fig. 3.15, Boehreret al. 2003). Gradients of pH are stable over longer time periods only wheredensity gradients reduce vertical mixing.
Meromictic lakes can show especially high vertical density gradients. VonRohden and Ilmberger (2001) measured the spreading of an introduced tracer
0
5
10
15
20
30
40
50
60
70
altit
ude
[m]
Lake Niemegk XN3
temperature
0
2
4
6
30
40
50
60
70
altit
ude
[m]
electricalconductance 25
2
4
6
8
30
40
50
60
70
1999 2000 2001
altit
ude
[m]
pH - value
Fig. 3.15 Contour plots of temperature (in �C), electrical conductivity at 25�C (in mS/cm), andpH at measuring site XN3 over the period of regular flooding of the Goitsche pit (modified afterBoehrer et al. 2003)
40 3 Limnology of Pit Lakes
cloud over periods of two years and calculated vertical transport coefficients fromtheir measurements. A strong correlation of vertical diffusivity and densitygradient could be verified. High gradients in the deep waters limited verticaltransport to values little above molecular diffusion (Fig. 3.16; von Rohden andIlmberger 2001; von Rohden et al. 2009).
Goudsmit et al. (1997) showed that in a lake that is several kilometers long(Alpnacher See), nearly all mixing happened along the side boundaries. Even inlakes as large as Lake Constance, mixing due to friction and shoaling at the sidewalls can still overcome pelagic mixing (Boehrer et al. 2000; Kocsis et al. 1998).Hence, the generally steep side walls in mine pits can affect vertical mixing. And,as mentioned above, the steepness of sidewalls and benches can produce differentwave patterns and can alter distribution of internal wave energy at depth.
Transport can be established by double diffusion. This occurs when two speciesof different diffusivities contribute to density, one in a stabilizing and one in adestabilizing configuration. In meromictic lakes especially, we find exampleswhere the temperature and concentration of dissolved substances both increasewith depth. This usually results in staircases of temperature and conductivityprofiles (Newman 1978; Schmid et al. 2005). This process is well established intropical lakes, but has also been discovered in meromictic lakes of the temperateclimate zone (von Rohden et al. 2010; case study 5.3).
Despite the overall stable density stratification in meromictic lakes, doublediffusion can greatly enhance vertical transport (Brandt and Fernando 1995;Schmid et al. 2005). If temperature increases with depth, and hence opposes thedensity gradient implied by dissolved matter, the previously continuously densitystratified water column is broken up into convection layers alternating with layersof high gradients.
Double diffusion also happens at chemoclines, where waters of differentproperties meet. In the case of Waldsee near Döbern, the density difference can be
Fig. 3.16 Vertical diffusivity versus stability (modified after von Rohden and Ilmberger 2001)
3.1 Physical Properties of Acidic Pit Lakes 41
largely due to dissolved ferrous iron in the monimolimnion, which cannot enter theoxic mixolimnion, as biochemical oxidation will cause it to precipitate back intothe monimolimnion (Boehrer et al. 2009a). The configuration approaches the caseof two immiscible layers in thermal contact (Fig. 3.12). As a consequence, doublediffusive convection cells are not restricted to the step size derived for conser-vative salts (e.g. Federov 1988), and a full monimolimnetic overturn has beenobserved, resulting in the redistribution of dissolved substances within the mon-imolimnion (Boehrer et al. 2009a).
3.1.7 Concluding Remarks
Pit lakes have quite a few peculiarities. This section has discussed special featuresof pit lakes that are not usually covered sufficiently in books about limnology.Some of these aspects have developed from site-specific solutions to more generalconsiderations, e.g. temperature compensation of electrical conductivity, and theimplementation of density functions based on partial molal volumes in numericalmodels. The effect of (biogeo-)chemical transformations on stratification stillneeds to be quantitatively investigated. Numerical models must be developed andused to improve prognostication of the evolution of water quality in pit lakes andto demonstrate remediation strategies for pit lakes. Such prognosticative tools mayalso prove useful for predicting changes in ‘‘natural’’ lakes that may result underchange of use and climate variability.
Acknowledgements Acquisition of data shown from Moritzteich (and Waldsee) was funded byDeutsche Forschungsgemeinschaft
3.2 Limnochemistry of Water and Sedimentsof Acidic Pit Lakes
3.2.1 Pit Lakes from Coal and Lignite Mining
3.2.1.1 Water, Sediment, and Pore Water
Kurt Friese, Peter Herzsprung and Martin Schultze
Introduction
Hard coal and lignite are important raw materials for energy and steel production.Coal provides 26.5% of global primary energy needs and generates 41.5% of theworld’s electricity. Over 5,560 million tons (Mt) of hard coal and ca. 890 Mt ofbrown coal/lignite are currently produced worldwide. There are over 847 billiontons of proven coal reserves worldwide and recoverable reserves in about
42 3 Limnology of Pit Lakes
70 countries (World Coal Institute 2009). About 47% of power generated inGermany (the world’s largest lignite producer), is provided by coal and lignitewhereas, for example, in Poland, it exceeds 90% (Euracoal 2009). Hard coal andlignite is the principal source of energy production for several countries in Europeand elsewhere (e.g. Australia, China, India, Indonesia, Republic of South Africa,Russia (and the former states of the USSR), USA, and to a lesser extent, othercountries in Africa, Asia, and Latin America). Table 3.3 shows the 10 major coaland lignite producing countries.
This chapter provides an overview of the chemistry of water and sediment in pitlakes from former coal and lignite open cast mines, mainly by comparing resultsfrom Australia, Germany, Poland, and the United States. Results of studies on pitlake water chemistry from India are considered as well. Generalized results of thechemistry of sediments and their pore waters were mainly deduced from studies onAustralian and German pit lakes because comparable results were not foundelsewhere. A review paper covering water chemistry and sedimentary processes ofacidic coal mine pit lakes in Germany was published recently by Blodau (2006).
The geological conditions that lead to the formation of lignite and hard coal,mainly the anoxic conditions in the presence of sulfur and iron in a brackishenvironment, also favor the formation of pyrite or marcasite (FeSs), and to lesserextent, mackinawite (FeS). Hence, lignite and hard coal deposits are oftenaccompanied by pyrite/marcasite in the strata. The content and distribution ofpyrite can vary over a broad range from 0.1 to 5% by weight (e.g. Knöller et al.2004; Ludwig and Balkenhol 2001; Ludwig et al. 1999; Rolland et al. 2001;Seoane and Leiros 1997; Tiwary 2001) in disseminated occurrence, concentratedin clusters or in scattered pockets (Evangelou and Zhang 1995) depending on themechanism of pyrite formation (e.g. syngenetic or epigenetic). Therefore, it is notsurprising that mining opens the pathways for the oxidation of this pyrite. Surfacemining needs dry conditions; consequently, before a mine pit can be opened, thegroundwater table has to be lowered to an appropriate depth below the coal seams.
Table 3.3 Top ten coal and lignite producers and worldwide production in 2008 (Mt—milliontonnes; from Statistik der Kohlewirtschaft 2010)
Hard coal (Mt) Lignite (Mt)
Chinaa 2,586 Germany 175USA 1,000 Russia 76India 436 Turkey 71Australia 334 USA 68Russia 247 Australia 67Indonesia 150 Greece 63South Africa 250 Poland 59Kazakhstan 104 Czech Republic 47Poland 84 Serbia 36Colombia 70 Romania 35World 5,562 World 892a including lignite
3.2 Limnochemistry of Water and Sediments of Acidic Pit Lakes 43
This is the first step in exposing the pyrite to oxygen, which afterwards is accel-erated when the strata and coal are excavated.
When the mine is closed and operations cease, groundwater pumping, whichnormally is contemporaneous with increasing depth of the mine pit, stops.Consequently, the groundwater table rebounds until hydrological equilibration isreached. The ascending groundwater enters the pit by passing through the dewa-tered strata. On its way, the groundwater transports the products of pyrite oxida-tion, mainly sulfate, iron, and acidity (see Sect. 2.2) or dissolves secondaryminerals that might have formed, in particular in overburden dumps.
The hydrochemistry of coal mine pit lakes is the result of the geologicalbackground, the hydrologic situation, the amount of sulfur within the strata, theextent of pyrite oxidation, and the mining technology used (e.g. Blodau 2006;Rolland et al. 2001; Wisotzky and Obermann 2001). Consequently, lake waterchemistry has to be generalized with care and several exceptions might exist.
Pit Lake Water Chemistry
The first examples of strip mine pit lake water chemistry were from hard coalmining in the USA and were published by Campbell and Lind (1969), Campbellet al. (1964), and Parsons (1964), based on initial studies of Crawford (1942; citedin Campbell et al. 1964) and Heaton (1951, cited in Campbell et al. 1964) fromcoalfields in the Cedar Creek region of Missouri. Parsons (1964) described six acidstrip mine pit lakes with a pH between 2.5 and 3.0 and ferric iron concentrationsfrom 1 to 300 mg L-1 and sulfate concentrations from 2000 to 8,400 mg L-1.Typically, all these lakes could be classified as acidic, hard water lakes of theCa–SO4-type. The Al concentrations in these lakes were quite high, ranging from96 to 183 mg L-1. In the same region (about 20 km north of the lakes investigatedby Parsons (1964), Campbell et al. (1964) and Campbell and Lind (1969) inves-tigated five acid strip mine pit lakes over a period of five to six years. The pH ofthese lakes ranged from 2.3 to 8.2. The concentrations of dissolved substancesdepended on the pH and on the depth of water sampling, showing increasedconcentrations with lower pH and greater depth. The maximum concentrationsreported by Campbell et al. (1964) were 4,350 mg L-1 of ferric iron,7,600 mg L-1 of sulfate, and 83 mg L-1 of manganese, whereas Campbell andLind (1969) reported 426 mg L-1 of aluminum and 217 mg L-1 for zinc asmaximum values from the bottom of the most acidic pit lake from this series.According to Campbell et al. (1964), similar conditions of strip mine pit lake waterchemistry could be expected for coalfields in Arkansas, Oklahoma, Kansas, andIowa from the same geological formation.
The first summary of existing and expected pit lake water chemistry of hardcoal mines in the western USA was given by Miller et al. (1996). The main ioncomposition of these lake types defines them as Ca–SO4 waters with high ironcontents in the range of 200 mg L-1. Due to the low sulfur content of the hard coaldeposits in Montana, Wyoming, and Dakota (an average of about 0.6% S, Turbak
et al. 1979) and alkaline groundwaters, most of these hard coal mine pit lakes havea neutral pH (Anderson and Hawkes 1985). Similar observations were reportedfrom a set of coal mine pit lakes from Illinois (Gibb and Evans 1978, cited inCastro and Moore 2000).
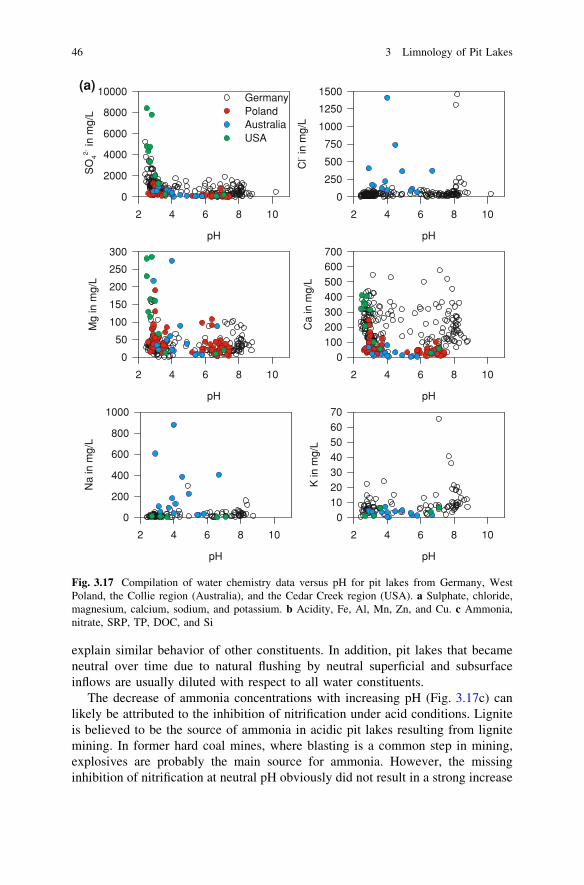
Further sets of geochemical data were available from 14 pit lakes in former hardcoal mines in the Collie region in Western Australia (Lund and McCullogh 2008;Salmon et al. 2008; McCullough et al. 2010; see also case study 5.4), from 71 pitlakes in former lignite mines in Western Poland (Samecka-Cymerman andKempers 2001; Solski and Jedrczak 1990, 1991a, b; see also case study 5.2)and from even more pit lakes in former lignite mines in Germany (for data sourcesand further details, see case study 5.1). These data are used to illustrate howthe concentrations of dissolved substances are related to pH (Fig. 3.17 a–c).The ranges within the datasets are compared and discussed (Figs. 3.18 and 3.19).
The solubility of many constituents increase with decreasing pH, in particularcarbonates, metal (hydr)oxides, and silicates. Magnesium (Fig. 3.17a), aluminum,the heavy metals including iron (Fig. 3.17b), and silicon (Fig. 3.17c) followthis pattern. Whereas ferric iron and oxidized manganese species increasinglyprecipitate with increasing pH, concentrations of iron and manganese can still beelevated under neutral conditions due to the high solubility of iron(II) and man-ganese (II) at anoxic conditions. Figure 3.17 a–c shall be used for a brief dis-cussion of some fundamental biogeochemical rules in pit lake water; these rulesare well established in geochemistry and have been discussed in more detail byEary (1999).
The relevance of iron and aluminum buffering in pit lakes has often beendemonstrated (e.g. Totsche et al. 2004; Uhlmann et al. 2004). Totsche et al. (2006)demonstrated that zinc also may buffer pH. However, those investigations weredone in water originating from a waste rock dump of a Canadian base metal mine.In pit lakes resulting from coal and lignite mining, only iron and aluminum reachconcentrations high enough to form relevant buffering systems.
Calcium, sodium, and potassium (Fig. 3.17a) do not show a clear concentrationdependence on pH. This may be due to the formation of secondary minerals, suchas gypsum and jarosite. In the case of German pit lakes, another reason is theintrusion of saline groundwater from Permian salt deposits into some of the pitlakes (see case study 5.1). For at least some of the Australian pit lakes, thediversion of highly saline water into lakes from the local rivers during the firstflush at the beginning of the wet season would have likely disrupted any rela-tionship between these cations and pH. The source of the salt in the river water wasagricultural land use (McCullough et al. 2010), which is causing salinization ofsoil, groundwater, and river water in many regions of Australia. For more detailson the mechanisms behind this phenomenon see e.g. Jolly et al. (2001). Theabsence of any relationship of chloride concentrations to pH supports this con-clusion (Fig. 3.17a).
The decrease of sulfate concentrations with increasing pH (Fig. 3.17a) probablyreflects that less pyrite oxidation occurs in certain lake catchments, which there-fore have higher pH-values and lower acidities. To some degree, this might also
3.2 Limnochemistry of Water and Sediments of Acidic Pit Lakes 45
explain similar behavior of other constituents. In addition, pit lakes that becameneutral over time due to natural flushing by neutral superficial and subsurfaceinflows are usually diluted with respect to all water constituents.
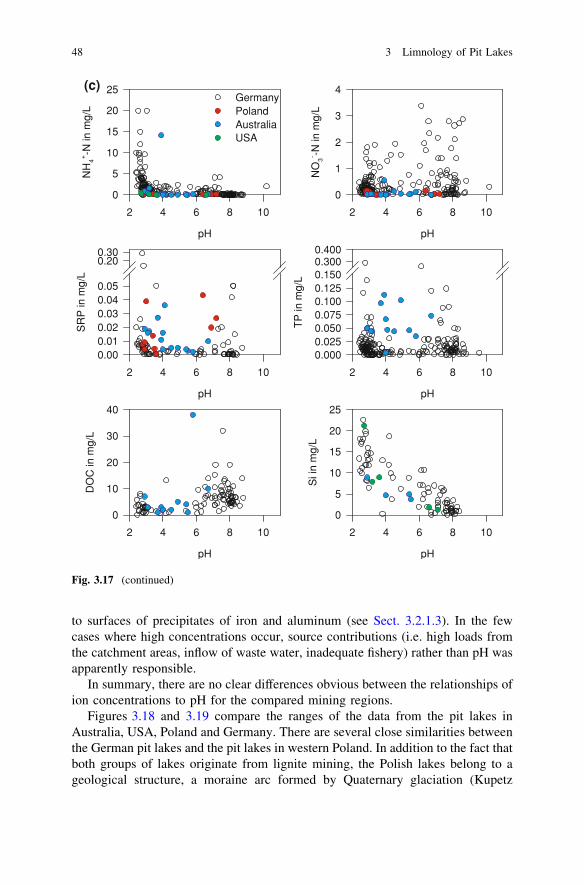
The decrease of ammonia concentrations with increasing pH (Fig. 3.17c) canlikely be attributed to the inhibition of nitrification under acid conditions. Ligniteis believed to be the source of ammonia in acidic pit lakes resulting from lignitemining. In former hard coal mines, where blasting is a common step in mining,explosives are probably the main source for ammonia. However, the missinginhibition of nitrification at neutral pH obviously did not result in a strong increase
pH
2 4 6 8 10
SO
42-
in m
g/L
0
2000
4000
6000
8000
10000 GermanyPolandAustraliaUSA
pH
2 4 6 8 10
Cl- in
mg/
L
0
250
500
750
1000
1250
1500
pH
2 4 6 8 10
Ca
in m
g/L
0100200300400500600700
pH
2 4 6 8 10
Mg
in m
g/L
0
50
100
150
200
250
300
pH
2 4 6 8 10
Na
in m
g/L
0
200
400
600
800
1000
pH
2 4 6 8 10
K in
mg/
L
010203040506070
(a)
Fig. 3.17 Compilation of water chemistry data versus pH for pit lakes from Germany, WestPoland, the Collie region (Australia), and the Cedar Creek region (USA). a Sulphate, chloride,magnesium, calcium, sodium, and potassium. b Acidity, Fe, Al, Mn, Zn, and Cu. c Ammonia,nitrate, SRP, TP, DOC, and Si
46 3 Limnology of Pit Lakes
of nitrate with increasing pH (Fig. 3.17c). Other microbial processes, like uptakeof nutrients and denitrification, may have also influenced the concentrations ofnitrate.
The relation of pH to the concentration of dissolved organic carbon (DOC) isalso not well understood (Fig. 3.17c). The increase of DOC at pH above 5 mayresult from better solubility of humic acids at higher pH and from less intenseco-precipitation of organic compounds with precipitating iron and aluminum dueto the much lower availability of the metals at neutral pH. Furthermore, the oxi-dation of organic carbon, i.e. its consumption during photo-reduction of ferric iron,is occurring only under acid conditions. The concentrations of SRP and totalphosphorus (TP; Fig. 3.17c) are generally low. This is due to their strong binding
(b)
Fig. 3.17 (continued)
3.2 Limnochemistry of Water and Sediments of Acidic Pit Lakes 47
to surfaces of precipitates of iron and aluminum (see Sect. 3.2.1.3). In the fewcases where high concentrations occur, source contributions (i.e. high loads fromthe catchment areas, inflow of waste water, inadequate fishery) rather than pH wasapparently responsible.
In summary, there are no clear differences obvious between the relationships ofion concentrations to pH for the compared mining regions.
Figures 3.18 and 3.19 compare the ranges of the data from the pit lakes inAustralia, USA, Poland and Germany. There are several close similarities betweenthe German pit lakes and the pit lakes in western Poland. In addition to the fact thatboth groups of lakes originate from lignite mining, the Polish lakes belong to ageological structure, a moraine arc formed by Quaternary glaciation (Kupetz
pH
2 4 6 8 10
DO
C in
mg/
L
0
10
20
30
40
pH
2 4 6 8 10
Si i
n m
g/L
0
5
10
15
20
25
pH
2 4 6 8 10
NO
3- -N
in m
g/L
0
1
2
3
4
pH
2 4 6 8 10
NH
4+-N
in m
g/L
0
5
10
15
20
25GermanyPolandAustraliaUSA
pH
2 4 6 8 10
SR
P in
mg/
L
0.000.010.020.030.040.05
0.200.30
pH
2 4 6 8 10
TP
in m
g/L
0.0000.0250.0500.0750.1000.1250.1500.3000.400
(c)
Fig. 3.17 (continued)
48 3 Limnology of Pit Lakes
1996), that crosses the border into Germany. Lignite was mined there very early,mainly during the first half of the 20th century, since the seams reached the surfaceas a result of deformation by the pressure of the glaciation.
The frequency distribution of pH in the pit lakes in all of these regions had astatistical mode in the acidic range (Fig. 3.18). In Germany and in Missouri, thepH range indicated buffering by iron. The maximum frequency distribution of pH
Germany
frequency
0 10 20 30 40 50 60
pH-v
alue
2
3
4
5
6
7
8
9
10 West-Poland
0 5 10 15 20
Collie,WesternAustralia
0 1 2 3 4 5
CedarCreek,
Missouri
0 1 2 3 4 5
Fig. 3.18 Comparison of the frequency distributions of pH in pit lakes from Germany (datasources described in case study 5.1), from West Poland (data from Solski and Jedrczak 1990;Samecka-Cymerman and Kempers 2001), from the Collie region of Western Australia (data fromMcCullough et al. 2010) and from the Cedar Creek region in Missouri (data from Parsons 1964;Campbell and Lind 1969). Note the different scales for the frequency
conc
entr
atio
ns in
meq
/L fo
r A
CY
,ot
hers
in m
g/L
0.0001
0.001
0.01
0.1
1
10
100
1000
10000
100000
GermanyPolandAustraliaUSA
ACY CaMg Fe Al SRPMn ZnSO42- NH4
+-N NO3--N
Fig. 3.19 Comparison of concentrations of major constituents characterizing the water chemistryin pit lakes from Germany (data sources described in case study 5.1), from West Poland (data fromSolski and Jedrczak 1990; Samecka-Cymerman and Kempers 2001), from the Collie region ofWestern Australia (data from McCullough et al. 2010) and from the Cedar Creek region in Missouri(data from Parsons 1964; Campbell and Lind 1969). Lines within the boxes are median values, boxlimits 25 and 75%, and whiskers show the 10 and 90% values, respectively. ACY—acidity. Pleasenote the different number of values behind the plots: 121–221 for the German pit lakes, 9–71 forWest Poland, 12 for the Collie region and 4–11 for the Cedar Creek region
3.2 Limnochemistry of Water and Sediments of Acidic Pit Lakes 49
in the pit lakes of the Collie region lay at higher pH, which is closer to the pHrange typical for buffering by aluminum. Only the Polish and the German pit lakesshowed a second maximum in their pH frequency distribution in the neutral range.It could be that the datasets from the Collie region and from the Cedar Creekregion were not large enough to show a second maximum. Alternatively, therelative absence of neutral pit lakes in the Collie and Cedar Creek regions may bedue to the limited age of the pit lakes at the time of the investigation and the lackof broad remediation programs, comparable to those conducted in Germany duringthe last 20 years (see case study 5.1). The findings of Campbell et al. (1964) andCampbell and Lind (1969) support this assumption. They found that pH increasedin three of the investigated lakes from 1940 to the 1960s due to natural processeslike long term wash out, natural buffering by slow weathering processes (e.g.dissolution of silicates), and microbial alkalinity production by sulfate reduction.
On average, i.e. according to the median, the pit lakes in Missouri showed thehighest concentrations of the solutes in Fig. 3.19, except for ammonia. The con-centrations of acidity, sulfate, calcium, iron, and manganese all followed the samepattern: the highest concentrations were found in the pit lakes in Missouri, withintermediate concentrations in Polish and German pit lakes, and the lowest con-centrations in the pit lakes in Western Australia. The concentrations of magne-sium, aluminum, and zinc followed different patterns. Data on the concentrationsof dissolved organic carbon (DOC) and the nutrients nitrogen and phosphorus wereonly available for the pit lakes of Germany and the Collie region in WesternAustralia (Figs. 3.17, 3.19). The occurrence of many neutral pit lakes in Germanyis assumed to be one reason for the higher concentrations of DOC and nitrate in theGerman pit lakes. The embedding of the German pit lakes in sand and graveladditionally allows more intense interaction between remnant lignite in theoverburden and the groundwater than is possible under the hydrogeological con-ditions of the Collie region (hard coal, sandstone, mudstone, shale). This probablyalso contributed to the lower concentrations of ammonia in the pit lakes of theCollie regions. The reasons for the differences in soluble reactive phosphorus(SRP) are not known. The different geological conditions of the various miningregions (hard coal in Missouri and Western Australia versus lignite in West Polandand Germany, and the different ages of the coal and lignite (Carboniferous inMissouri, Permian in the Collie region, and Tertiary in Poland and Germany))probably contribute to the other notable differences in water quality, as do thedifferent ages of the pit lakes at the time of their investigation and differences inhow they were filled (natural rebound of groundwater or flooding with river water).
Published hydrochemical data from coal mine pit lakes outside of the UnitedStates of America, Australia, Poland, and Germany are rare. Denimal et al. (2005)reported on three pit lakes in former coal mines at the north-eastern edge of MassifCentral (France). The lakes had a circumneutral pH and two of them were mer-omictic. Sulfate concentrations ranged from 500 mg L-1 to 1,500 mg L-1.Iron concentrations were low at the surface (0.01–0.11 mg L-1) and at depth(0.06–0.3 mg L-1), whereas manganese concentrations were at rather typicallevels (0.02–0.2 mg L-1 at surface, 1.4–4.5 mg L-1 at depth). Water chemistry
50 3 Limnology of Pit Lakes
comparable to the German lignite pit lakes was reported from acid mine waters(not pit lakes) from coalfields in India (Singh 1988; Tiwary 2001). Furthermore,there are also several coalfields in India producing neutral and less contaminatedmine waters (e.g. Choubey 1991; Gupta 1999; Khan et al. 2005; Tiwary 2001).Similarly, few data (only sulfate and zinc) were given by Geldenhuis and Bell(1997) for acid overspill water (pH range 2.0–3.4) collected in control reservoirs ofthe Loubert Mine in South Africa (Witbank coalfield, eastern Transvaal).Although, electric conductivity (EC) in these overspill water was in the same rangeas EC values measured in lignite mine pit lakes of Germany (e.g. 2–6 mS/cm),sulfate and zinc concentration were much higher in the overspill water (up to 5 g/Land up to 4.7 mg/L, respectively).
Sediment Chemistry
The authigenic sediments from coal mine pit lakes are generally very fine grainedwith a near-surface (upper 5–10 cm) high water content ([40%; Friese 2004;Friese et al. 1998b). In several cases, water contents of 60–80% were detected inthe top 5 cm (e.g. Fritz and Carlson 1982; Langner 2002). The amount ofin-lake sedimentation depends strongly on local conditions (e.g. amount and rateof groundwater inflow or precipitation). As much groundwater and seepage ordrainage water enters the lake, precipitation of solid phases from the oxidation ofpyrite and—if they exist—secondary minerals will occur. Typical sedimentationrates are on the order of 5–10 mm/y (deduced from 10 to 20 cm sediment layers in10–40 years old pit lakes; e.g. Bachmann et al. 2001; Friese 2004; Friese et al.1998b; Peine 1998; Peine and Peiffer 1996, 1998; Peine et al. 2000).
The main component of the sediment is often iron (iron oxides, hydroxides, andhydroxosulfates), ranging from only 5% to 45% of the dry weight (Bachmann et al.2001; Blodau et al. 1998; Brugam et al. 1988; Lessmann et al. 1999; Meier et al.2004; Peine et al. 2000). Other major components are generally Si, Ca, Mg, Na, K,and Al (Friese 2004; Friese et al. 1998a, b; Read et al. 2009). All of these can beattributed to the dissolution of silicates, like quartz, feldspar, or clay minerals.Mineralogical analyses of sediments from coal mine pit lakes are scarce in theliterature. Göttlicher and Gasharova (2000) described the precipitation of goethiteand jarosite as the main iron precipitates in the lignite mine pit lake ML-111 (seealso case study 5.6), whereas Peine et al. (2000) found mainly schwertmannite inmine pit lake 77 from the same German mining district. Our own mineralogicalanalyses (not yet published) of sediment cores from the Lusatian mine pit lakesML-111 and ML-107 confirm the precipitation of iron hydroxosulfates, likeK-jarosite, and of iron-oxides like goethite (Table 3.2) in the upper 15–20 cm ofthe lake sediments. Quartz and clay minerals are also common throughout the lakesediments. Geochemical analyses by XRF (X-ray fluorescence) show that ironpredominates in these sediments.
A generalized sequence of typical sediment from the acid lignite mine pit lakesof Lusatia (Germany) is given in Table 3.4. Often, the top 1–2 cm layer of the
3.2 Limnochemistry of Water and Sediments of Acidic Pit Lakes 51
Tab
le3.
4T
ypic
alse
quen
ceof
the
sedi
men
tst
ruct
ure
and
com
posi
tion
inac
idpi
tla
kes
ofth
eL
usat
ian
lign
ite
min
ing
dist
rict
,G
erm
any
Uni
tD
epth
(cm
)C
olor
Str
uctu
reG
rain
size
Mai
nm
iner
alog
yM
ain
geoc
hem
istr
y
10–
2R
ed–b
row
nW
itho
utan
yte
xtur
eF
ine
clay
Am
orph
ous
orle
sscr
ysta
llin
e;F
e-hy
drox
osul
fate
s(j
aros
ite,
schw
ertm
anni
te)
Wat
erco
nten
t:70
–80%
;L
OI:
20–4
0w
t%;
Fe 2
O3:
30–4
5w
t%;
SiO
2:&
10w
t%2
2–3
Bla
ckW
itho
utan
yte
xtur
eF
ine
clay
Am
orph
ous
orle
sscr
ysta
llin
eF
eS,
FeS
2,
Me(
Zn,
Ni)
SW
ater
cont
ent:
70–8
0%;
LO
I:20
–40
wt%
;F
e 2O
3:
10–2
0w
t%;
S:
2–3
wt%
33–
20R
eddi
shye
llow
tobr
own
Lam
inat
edC
laye
yF
e-ox
ides
,F
e-hy
drox
ides
,F
e-hy
drox
osul
fate
s,cl
aym
iner
als,
quar
tz,
feld
spar
Wat
erco
nten
t:60
–70%
;L
OI:
20w
t%;
Fe 2
O3:
10–3
0w
t%;
S:
1–2
wt%
;A
l 2O
3:
5–10
wt%
4[
20G
rey
Gra
ined
Sil
tyto
sand
yQ
uart
z,fe
ldsp
arS
iO2:[
80w
t%;
Al 2
O3:
10–1
5w
t%
Ple
ase
note
that
diff
eren
ces
inth
eth
ickn
ess
ofun
its
occu
rfr
omla
keto
lake
asw
ell
asw
ithi
na
part
icul
arla
kede
pend
ing
onth
ebo
ttom
mor
phol
ogy
and
the
indi
vidu
alse
dim
enta
tion
.A
ddit
iona
lly,
unit
1is
not
obse
rved
inev
ery
lake
52 3 Limnology of Pit Lakes
sediment is a very fluffy and water-rich layer of freshly precipitated iron hy-droxosulfates. The form of the iron precipitated from the water column stronglydepends on the pH-Eh conditions (e.g. Stumm and Morgan 1996). Since iron is akey factor in the water–sediment system for this type of lake, the iron cycle isdescribed in detail separately (Sect. 3.2.1.2). In several cases, this layer is notapparent and the top unit consists of a very dark black, water- and organic-rich,strongly reduced layer (named unit 2 in Table 3.4) that is enriched with reducedsulfur compounds like FeS, FeS2, and probably other metal sulfides (ZnS, NiS).The occurrence of reduced sulfur compounds and the precipitation of secondaryiron sulfides within this layer were proven by sulfur isotope measurements (Fau-ville et al. 2004; Knöller et al. 2004). However, most of the sediment is a unit oflaminated precipitates of iron-hydroxosulfates, -oxides and -hydroxides, quartz,and clay minerals (unit 3 in Table 3.4). Since this laminations is very fine (withinthe mm to sub-mm range), it is not yet clear what causes the lamination(Table 3.4).
In general, trace elements are of minor importance in German lignite minepit lake sediments. As, Cd, Co, Cu, Cr, Pb, and Zn all display mass concen-trations below 50–70 mg/kg (dry weight). In some cases, there is a closepositive correlation found between iron and arsenic, iron and copper, and ironand cobalt within the depth profiles of the sediments, which is probably theresult of co-precipitation onto iron-hydroxides/hydroxosulfates. On the otherhand, in sediment cores with strong anoxic conditions and a pronounced unit 2(Table 3.4), positive correlations can be found between S and Ni and S and Znwithin the top 5 cm due to precipitation of metal sulfides, as mentioned above.Similar high correlations between S and Cu and Ni were reported by Brugamet al. (1988) from near-surface sediments of coal mine lakes from the mid-western U.S. (about 30 lakes). The amount and distribution of trace metalsco-precipitated onto iron hydroxides/hydroxosulfates and the precipitation ofmetal sulfides varies from year to year and also within a year, depending on thestability of oxic and anoxic conditions at the sediment surface or within the top5 cm, respectively.
Sediment Pore Water Chemistry
Pore water is an interface and transfer component between the solid (sediment) andliquid (lake water) phases, and between the groundwater and lake water, so itscomposition can play a major role in pit lake water chemistry. Thus, analysis ofpore waters gives information about transport and transformation processes withinthe sediment (e.g. Blodau et al. 1998; Koschorreck et al. 2007 a, b; Regenspurget al. 2004). Chemical (Knorr and Blodau 2006) and microbiological (Meier et al.2004) transformative processes are both responsible for cycling elements betweenthe pore water and sediment. Researchers have focussed on chemical processesthat can be derived from pore water profiles in acid lignite and coal mine pit lakesediments (Herzsprung et al. 2002; Knorr and Blodau 2006; Peine et al. 2000);
3.2 Limnochemistry of Water and Sediments of Acidic Pit Lakes 53
the most important of these involve transformations of ferric and ferrous minerals(see also Sect. 3.2.1.2). Generally, the researchers analyzed pH, dissolved oxygen(or redox potential; Koschorreck et al. 2007a), ferrous iron, total dissolved iron,sulfate, and DOC (Laskov et al. 2002) in the pore water. To complete processunderstanding and enable geochemical modeling (PHREEQC or similar pro-grams), additional analysis of remaining major ions (calcium, magnesium, sodium,potassium, and chloride), other metal ions like aluminum, manganese, and zinc,and nutrients like ammonia and soluble reactive phosphate may be required(Herzsprung et al. 2002).
Diagenesis of minerals like schwertmannite, jarosite, and goethite occurs inacidic pit lake sediments (Bozau et al. 2007; Knorr and Blodau 2006; Peine et al.2000; Regenspurg et al. 2004). The pore water composition reflects the steady stateresulting from all transformation and transport processes in the sediment (Knorrand Blodau 2006). The influence of biogeochemical transformations on pore waterchemistry will be discussed using examples from the literature (Herzsprung et al.2002; Knorr and Blodau 2006; Laskov et al. 2002; Peine et al. 2000).
Investigating the electron flow in the iron-rich Mining Lake 77, Peine et al.(2000) found a predominant pH gradient in the sediment pore water (Fig. 3.20).Protons are transferred by diffusion from acidic pelagic water to the sediment andare produced by transformation of schwertmannite to goethite and by precipitationof solid ferric iron minerals at the oxic/anoxic boundary. In deeper sedimentlayers, protons are consumed by reductive dissolution of ferric minerals and bysulfate reduction. The precipitation or dissolution of manganese oxides (MnOx)produces similar effects (Tan et al. 2010).
Figure 3.20 demonstrates the dependence of pore water chemistry on the geo-chemical conditions of acid pit lake sediments. ML 111 is extremely acidic; porewater pH values \ 3.5 were found at sediment depths up to more than 20 cm(Herzsprung et al. 2002; Koschorreck et al. 2007a). ML 77 contains less acidity thanML 111. The pore water pH of ML 77 rises to higher values (up to 6) with increasingsediment depth (Peine et al. 2000). Ferrous iron and sulfate pore water concentra-tions are influenced by transport, dissolution, and precipitation processes. Knorr andBlodau (2006) demonstrated that pore water gradients change dramatically withgroundwater percolation (upward). AMD-polluted groundwater (from dump siteswith high ferrous iron and sulfate concentration) percolates the sediment of ML 77,so the concentration gradients are considerably less distinct than would be the casewithout percolation (Fig. 3.20). A local maximum of ferrous iron and sulfate porewater concentration (as shown in Fig. 3.20) qualitatively indicates transformation ofschwertmannite to goethite (Knorr and Blodau 2006).
The DOC content in acid pit lake sediment pore water typically exceeds pel-agial water DOC by at least an order of magnitude (Friese et al. 1998a, b; Laskovet al. 2002). As assumed by Laskov et al. (2002), the release of DOC into porewater is linked to the transformation of schwertmannite to goethite by desorptiveprocesses. All parameters involved in redox cycling (ferric and ferrous iron, sul-fate, pH, ORP, and DOC) were intensively investigated in pit lake pore waters,with minor consideration given to the other inorganic parameters mentioned above
54 3 Limnology of Pit Lakes
pH
2.0 2.5 3.0 3.5 4.0 4.5 5.0 5.5 6.0
dept
h in
cm
0
5
10
15
20
Lake 111 substrateLake 111 controlLake 77 high groundwater inflowLake 77 control
ferrous iron in mmol/L
0 5 10 15 20 25
dept
h in
cm
0
5
10
15
20
sulphate in mmol/L
0 5 10 15 20 25 30
dept
h in
cm
0
5
10
15
20
Fig. 3.20 Profiles of pH, ferrous iron and sulphate concentrations in pore water of sedimentsfrom two different pit lakes of the Lusatian lignite mining district, Germany. The sediment ofMining Lake 77 was treated by a high upward flow of groundwater (data from Knorr and Blodau2006) and the sediment of Mining Lake 111 by the addition of Carbokalk on the sediment surface(data from Herzsprung et al. 2002; for details see text)
3.2 Limnochemistry of Water and Sediments of Acidic Pit Lakes 55
(other major ions, metal ions). Blodau et al. (1998) stated that concentrationgradients of calcium, magnesium, potassium, sodium, and chloride were lesspronounced. Herzsprung et al. (2002) investigated pore water chemistry afterorganic substrate (carbokalk, a by-product of the sugar industry, cf. Frömmichenet al. 2003, 2004) and lime were added to stimulate alkalinity production. Asshown in Fig. 3.20, pH values were elevated in the uppermost sediment layersafter addition of substrate to lake water in an enclosure of mine pit lake ML-111(Lusatia, Germany; cf. Geller et al. 2009). The concentrations of sulfate andferrous iron increased due to reductive dissolution of ferric minerals. The porewater composition changed considerably. Ferrous iron, sulfate, potassium, andammonia were released into the pore water while aluminum and silica concen-trations were depleted by precipitation. The release of potassium indicated thedissolution of K-jarosite, which is probably also the source of enriched ammoniaconcentrations within the pore water; both ions have a similar ionic radius and soNH4
+ might replace K+ in K-jarosite.In a similar study conducted by Read et al. (2009), the change of pore water pH,
iron, and sulfide after addition of DOC was investigated in a laboratory experimenton sediments from two Australian pit lakes and compared to the ML-111 results.Reductive processes were induced in all experiments, leading to increased con-centrations of iron and ammonia in the overlying water, but sulfide was onlymeasurable in the pore water in the Australian pit lake sediments. The highconcentrations of ferric iron in the ML-111 sediment inhibited the formation ofsulfide (see also Sect. 3.2.1.2). Consequently, a shift to increased pH within the toplayer of the sediment was only observed in the Australian pit lake sediments.
Observations (Blodau et al. 1998; Herzsprung et al. 2002; Peine et al. 2000)indicate that the concentrations of calcium, magnesium, sodium, and chloride inpore water are not very different from pelagial water concentrations (exception:calcium in pore water after treatment with lime). These parameters seem to beneither involved in biogeochemical transformations nor in groundwater/lake waterinteractions. The concentration of manganese is elevated in acidic lake water andnearly equal in pore water and pelagial water (Herzsprung et al. 2002). In neutralcoal mining affected lakes, manganese concentrations are low under oxic condi-tions (Wu et al. 2001). However, in the corresponding pore water, peak manganeseconcentrations can be found near the sediment water boundary. Manganese cyclingin pit lake sediments after remediation and neutralization by flooding with riverwater is discussed by Herzsprung et al. (2010) and Wu et al. (2001). The behaviorof phosphorus in acidic pit lake sediment pore water was explored by Kleeberget al. (2005, see also Sect. 3.2.1.3).
Concluding Remarks
In the past 15 years, remarkable progress has been made in understanding pit lakechemistry and pit lake processes, mainly through research at pit lakes in Germanyand Australia. Lakes in former hard coal mines have been much less intensively
56 3 Limnology of Pit Lakes
investigated than at lignite mines. Although many results from the German andAustralian pit lakes can be generalized, a more international database is needed tobetter understand the relationships between the geological conditions of thedeposits and the final chemical conditions in the lakes. This includes differencesresulting from being in unconsolidated or in solid rock, which affects the inter-action between the pit lakes and groundwater, and the contribution of residues ofcoal and lignite to the organic matter in the pit lakes. Furthermore, a detailedstructural characterisation of this organic matter and quantification of its degra-dability and its contribution to reductive alkalinity production is needed.
3.2.1.2 The Role of Iron Minerals in the Biogeochemistryof Acidic Pit Lakes
Stefan Peiffer, Klaus-Holger Knorr and Christian Blodau
Predominant Iron Minerals in Acidic Mine Pit Lakes
Environments affected by acidic mine drainage (AMD) are characterized by theoccurrence of a large variety of iron oxy (hydroxy) sulfates. Depending on theredox state of Fe and the degree of dilution, a broad range of sulfate and hydroxideminerals can form, ranging from pure melanterite (FeSO4) in highly concentratedvery acidic waters to goethite (FeOOH) in dilute waters (for a review cf. e. g.Nordstrom and Alpers 2000). A mineral characteristic to rivers affected by AMD isschwertmannite. It has the general formula, Fe8O8(OH)x(SO4)y 9 n H2O, where(8–x)/2 = y and 1.0 \ y \ 1.75 and a mineral structure probably akin to aka-ganéite (c-FeOOH; Bigham et al. 1994). The exact structure is, however, still amatter of discussion (Majzlan and Myneni 2005; Waychunas et al. 2001). Theoccurrence of schwertmannite was demonstrated also in the sediment of an acidicpit lake (APL) in layers up to 5 cm thick (Peine et al. 2000). In a survey performedin APLs from 17 pit lakes of three different lignite mining districts (Regenspurget al. 2004), schwertmannite was the predominant iron mineral in fresh sediments.In addition to environments affected by AMD, it has been found in acidic sulfatesoils, where it is subject to a dynamic iron turnover (Burton et al. 2006)
Schwertmannite is restricted to a geochemical window characterized by pHvalues between 2.5 and 4.5 and sulfate concentrations between 10 and30 mmol L-1 (Bigham et al. 1994; Yu et al. 1999). At pH \ 2.5, jarosite pre-dominates (Cravotta et al. 1999). Geochemical modelling revealed that there is achemical equilibrium between Fe3+ dissolved in lake water sampled from theselakes and schwertmannite (Regenspurg et al. 2004, Fig. 3.21). It can therefore bepostulated that the geochemical window reflects a pH buffering system establishedby schwertmannite precipitation. This seems to be characteristic for many APLs,buffering the pH to values between 2.6 and 3.3 (Peine et al. 2000). An extensivereview on acidity generation and consumption in APLs has been provided byBlodau (2006).
3.2 Limnochemistry of Water and Sediments of Acidic Pit Lakes 57
Formation and Stability of Schwertmannite
In the APLs studied by Regenspurg et al. (2004), a redox equilibrium between Fe2+
and schwertmannite was detected, which implies that schwertmannite is the firstmineral formed after Fe(II) oxidation in these environments. Given the slow oxi-dation kinetics of Fe(II) at low pH, this observation implies that schwertmanniteformation is controlled by the oxidation kinetics of Fe2+. This assumption wasconfirmed by a mass balance of dissolved Fe(II) and suspended Fe(III) establishedfor a specific, yet typical APL studied by Peine et al. (2000). In this lake, solid Fe(III)was identified to be exclusively bound to schwertmannite, of which the sedimenta-tion rate was measured to be 2.6 9 10-3 mol Fe(III) m-2 year-1 on average, whichagreed well with the Fe(II) oxidation rate of 3.0 9 10-3 mol Fe(II) m-2 year-1.
Schwertmannite formation seems to be directly linked to bacterial oxidation ofFe2+ (Kawano and Tomita 2001). The bacterial cell appears not to be involved inthe precipitation of either jarosite or schwertmannite (Eneroth and Bender Koch2004), although direct contact between the bacterial cells and the crystal surfacewas demonstrated (Ferris et al. 2004). In a study of the bacterial community at aplant that generates pure schwertmannite while treating acidic waters from anactive lignite surface mine (Glombitza et al. 2007), strains of Fe(II) oxidizingbacteria belonging to the class of beta-proteobacteria, closely related to the neu-trophilic iron-oxidizing Gallionella ferruginea, were the dominant group (Hedrichet al. 2007; Heinzel et al. 2008).
Schwertmannite has been demonstrated to be metastable with respect to goe-thite (Bigham et al. 1996). Once suspended in water, it ultimately transforms intogoethite, thereby lowering the pH (Jönsson et al. 2005; Knorr and Blodau 2007;
-10
-9
-8
-7
-6
-5
-4
-3
-2
2 2.5 3 3.5 4 4.5 5pH
-10
-9
-8
-7
-6
-5
-4
-3
-2
Goethite
Ferrihydrite
Jarosite
Schwertmannitelo
g a(
Fe3
+)
Fig. 3.21 Plot of the logarithm of the Fe3+ activity (mean values of measured data) versuspH for surface waters of 17 APLs. Solubility lines were calculated for goethite(log a(Fe3+) = 1.4–3 pH), ferrihydrite (log a(Fe3+) = 4.83–3 pH), K-jarosite (mid-linelog a(Fe3+) = -0.19 - 2 pH), and schwertmannite (mid-line log a(Fe3+) = 2.7–2.63 pH).Maxima and minima (dashed lines) for the solubility window of schwertmannite are forthe range of log a(SO4
2-) = –1 to –1.5, that of jarosite –1.85 to –2.5, and for log a(K+) = –3.5 to–4.07 (after Regenspurg et al. 2004)
58 3 Limnology of Pit Lakes
Regenspurg et al. 2004; Schwertmann and Carlson 2005). The transformation rateis slow under acidic conditions (pH & 3) and increases significantly at higher pH(Regenspurg et al. 2004; Schwertmann and Carlson 2005), being driven by asupply of alkalinity (Peine et al. 2000). This transformation also seems to bedependant on temperature and concentrations of sulfate and dissolved organiccarbon (DOC; Jönsson et al. 2005; Knorr and Blodau 2007), factors that can behighly variable under field conditions. High concentrations of sulfate and DOCprobably also impede or at least retard the formation of well-crystalized goethite;instead; low-sulfate but poorly crystalline, x-ray amorphous iron oxyhydroxidesform (Knorr and Blodau 2007).
Transformation to goethite has been demonstrated to occur in the sediment ofan APL (Peine et al. 2000) at a rate of 3.5 mol m-2 year-1. This reaction generatesadditional acidity in the sediment:
The Role of Schwertmannite for the Element Cycles in APLs
As discussed above, schwertmannite plays a prominent role in the acid–base budgetof APLs and is abundant in their sediments (e.g. Sánchez-Espana et al. 2008). Thishas consequences for the nature and rates of elemental cycling in APLs. The stabilityof acidic conditions in APLs is enhanced by the acidity-driven iron cycle at thesediment–water interface, where acidity generated by oxidation of Fe2+ to schw-ertmannite (1.0–4.7 mol m-2 year-1 in the sediment of Mining Lake (ML) 77,Lower Lusatia, Eastern Germany; Eq. 3.2) is balanced by alkalinity gained bymicrobial reduction of schwertmannite in this zone (0.65–4.0 mol m-2 year-1 inML 77; Peine et al. 2000).
8Fe2þ þ y SO2�4 24� 2y þ xð Þ= 2 H2O
! Fe8O8 OHð Þx SO4ð Þyþ 24� 2yð Þ Hþ þ 8 e� ð3:8Þ
Contrary to other minerals, schwertmannite is easily microbially reduced underacidic conditions by acidophilic bacteria, such as Acidophilium cryptum JF-5(Küsel et al. 1999). This is reasonable, minding the strong dependence ofmicrobial reducibility of iron minerals on factors such as crystallinity and surfacearea (Lovley and Phillips 1988; Roden 2003). Goethite is reduced at significantlylower rates by acidophilic bacteria than dissolved Fe(III) or amorphous ferrichydroxide by Acidiphilium SJH (Bridge and Johnson 2000). The reducibility ofjarosite by Acidiphilium SJH is even lower than that of goethite (Bridge andJohnson 2000). In the acidic, schwertmannite-enriched zone of APL sediment, arate of 6–25 nmol g-1 h-1 (Peine et al. 2000) was measured. Addition of schw-ertmannite to APL sediment-peat slurries also stimulated the Fe(II) release ratecompared to both unamended controls and goethite addition in incubationexperiments (Blodau and Gatzek 2006), which clearly indicated Fe(III) reduction.
3.2 Limnochemistry of Water and Sediments of Acidic Pit Lakes 59
The lowering of pH and potentially the increase in dissolved ferric iron appearedto be critical to the increase in bacterial iron reduction in these schwertmannite-amended incubation experiments.
The alkalinity derived from reductive dissolution was, however, completelyconsumed by the transformation of schwertmannite into goethite and the reoxi-dation of Fe(II) (Peine et al. 2000). Sulfate reduction only took place at a depthwhere the transformation was complete and the pH increased. The rate of alka-linity formation from sulfate reduction (2.0 eq m-2 year-1) in deeper zones(&10 cm) of the sediment from ML 77 was in the range of the acidity generatedby schwertmannite transformation (3.5 eq m-2 year-1) at &5 cm depth. Itappeared that these two processes balanced each other. Thus, the pH did notincrease in the lake water or in the top 5 cm of the sediment (this picture can,however, be changed by advective groundwater flow conditions, cf. below). Underthese low pH conditions and without a supplemented carbon source, sulfatereduction is inhibited (Küsel and Dorsch 2000; Meier et al. 2004), so that Fe(II)cannot be fixed as iron sulfide in the top layers of the sediment. Reprecipitation ofiron sulfides, however, would be a prerequisite for long-term neutralization ofAPLs (Blodau 2006).
Moreover, schwertmannite also appears to control metabolic activity in thesediment by selectively retaining microbially labile organic carbon (Laskov et al.2002). Less than 10% of the organic carbon in the top sediment of a lignite APLwere identified as autochthonous; the other fractions were either terrestrial(30–40%) or coal carbon. A density fractionation revealed that in the upper 4 cmof the sediment, 70% of the total carbon were associated with the heaviest, hence,iron-containing fraction, which itself made up 95% of the total mass. The ironfraction consisted of pure schwertmannite (Peine et al. 2000). A detailed analyis ofthe quality of the carbon pools in the three density fractions revealed that thecarbon associated with the iron fraction was of the ‘‘best’’ quality with respect toits microbial availability (Table 3.5). It had the lowest C/N ratio, and the lowestcontent of lignite and aromatic polycarbonic acids, a marker for coal carbon(Glaser et al. 1998).
These observations may imply restrictions with regard to the primary produc-tion in APLs. Primary production in APLs seems to depend on the benthic supplyof dissolved inorganic carbon (DIC), due to the low concentrations of DIC inacidic waters (Nixdorf and Kapfer 1998; see also Sects. 3.3.1.1 and 3.3.1.4). Thissupply may be severly affected by the availability of labile organic carbon beingused for respiration by dissimilatoric bacteria associated with the large iron(schwertmannite) pool.
Table 3.5 Quality of organic carbon in different density fractions as indicated by C/N-ratio,lignine content, and the amount of aromatic polycarbonic acids, a marker for coal carbon
Density (g cm-3) C/N ratio (g/g) R Lignine (lg/mg C) aPCA (lg/mg C)
\2.0 56 9.0 952.0–2.4 23 4.0 68[2.4 19 3.3 48
60 3 Limnology of Pit Lakes
In addition to the impact of schwertmannite on pit lake geochemistry andmetabolism, the mineral may also strongly influence the mobility and sequestra-tion of trace elements. The mineral has a high affinity to anions and is, due to itslarge surface area, an efficient sink for As(V) (e.g. Acero et al. 2006; Schroth andParnell 2005) and As(III) (Paikaray et al. 2011) in mine waters (see also case study5.5). The adsorption of arsenate has been demonstrated to be an exchange reactionwith non-structural sulfate (Fukushi et al. 2003). Similarly, phosphate can beretained, although at high concentrations, phosphate and arsenate may lead todestruction of the schwertmannite structure (Regenspurg and Peiffer 2005).Schwertmannite may therefore be regarded as an effective sink for both toxicanions and essential nutrients that control primary production, and can alsoenhance carbon sequestration in these waters.
Hydrogeochemical Effects on Schwertmannite Stability Under TransientHydrological Conditions
APLs are hydrologically characterized by a strong interaction with groundwater(Werner et al. 2005; Fleckenstein et al. 2009). Influent groundwater tends to beonly weakly acidic, due to intensive buffering activites in the adjacent dumpmaterials, but rich in Fe(II) and sulfate (Bozau and Strauch 2002; Rolland et al.2001; Werner et al. 2001). The extent of exchange with groundwater has a sig-nificant effect on biogeochemical processes in the sediments. Pore-water pH val-ues, concentrations of Fe(II), sulfate reduction rates, and iron sulphide contentwere higher in areas of groundwater inflow (Blodau 2004, see also Sect. 3.2.1.1).The proton balance within the sediments was negative in areas with groundwaterinflow and positive in those without groundwater inflow (Blodau 2005).
It appears that these observations are strongly linked to the reactivity ofschwertmannite exposed to different flow rates in combination with different loadsof FeSO4 and DOC (Blodau und Knorr 2006; Knorr und Blodau 2006). Percolationin columns filled with schwertmannite-containing sediment material stimulatedtransformation of schwertmannite and thus acidity export. Mobilization increasedwith flow rates and decreased FeSO4 concentration.
In order to quantify these relationships, we reanalyzed the data from Knorr andBlodau (2006) under conditions of pseudo steady-state. Acidity formation rateswere calculated as the difference between acidity concentration at the inflow andthe outflow of the columns times the flow rate. Acidity was calculated from theconcentration of the following species and components
Acidity ¼ 2 c Fe2þ� �þ 3 c Fe3þ� �
þ 2 c FeOH2þ� �þ 3 c Al3þ� �
þ c HSO�4� �
þ c Hþð Þ ð3:9Þ
The acidity formation rate decreased non-linearly with the load of sulfate(Fig. 3.22). This variable shows the same dependence on sulfate load as the ratiobetween inflow and outflow sulfate concentration, which suggest a relationshipbetween the dissolution rate of schwertmannite and sulfate load. The acididity
3.2 Limnochemistry of Water and Sediments of Acidic Pit Lakes 61
formation rate therefore seems to be proportional to the degree of undersaturation(Ksp - IAP)/Ksp, with IAP being the ion activity product of schwertmannite andKsp its solubility product.
The implication of these considerations for APL water quality could be severewhen groundwater inflow changes compared to conditions under which schwert-mannite deposits formed. Such a scenario can be expected when the regionalgroundwater flow field is altered by the cessation of water drainage in pit mines.Influent groundwater will tend to dissolve sedimentary schwertmannite, therebyamplifying acidity flow into a lake. This effect becomes even more relevant ifsulfate load is low. On the other hand, exfiltrating lake water will export acidityinto the groundwater. The sediment layers underlying the schwertmannite-con-taining layer in such areas will thus receive acidity, inhibiting sulfate reduction andlong-term neutralization of the acidity.
3.2.1.3 Phosphorus in Acidic Mining Lakes: Importanceand Biogeochemical Cycling
Björn Grüneberg and Andreas Kleeberg
Because phosphorus (P) availability often limits phytoplankton growth, elevatedconcentrations of P usually accelerates freshwater eutrophication. A large body ofknowledge exists on P in neutral freshwater lakes and lakes acidified by airbornepollutants, but the role of P as a key nutrient in geogenically acidified mining lakes(MLs) is not adequately considered. This is important because many MLs aresubject to rapid P import by ecotechnological measures or flooding with riverwater. Changes in pelagic and benthic conditions (e.g. pH, redox potential, C, andFe supply), either through natural development or due to anthropogenic manipu-lations, affect P mobility (Kleeberg and Grüneberg 2005). Independent of velocityand grade of manipulation during ML development, a low trophic state (oligo- tomesotrophic) has to be maintained, either to satisfy utilization concepts (e.g.recreation) or to meet regulatory standards (e.g. the EU water frameworkdirective).
0
2
4
6
8
10
0 0.05 0.1 0.150
0.01
0.02
0.03
SO42-- ratio
acidity formation rate
c(S
O42-
) inflo
w :
c(S
O42-
) out
flow
acidityform
ationrate,m
olh-1
SO42- load, mol h-1
Fig. 3.22 Acidity formationrate and ratio between inflowand outflow sulfateconcentration as a function ofsulfate load measured incolumn experiments by Knorrand Blodau (2006) underpseudo steady-stateconditions
62 3 Limnology of Pit Lakes
Acid MLs are usually characterized by low pelagic concentrations of total P(TP, \ 5–38 lg L-1, n = 23 MLs; Nixdorf et al. 1998; Fig. 3.23) and solublereactive P (SRP, 6–26 lg L-1, n = 4 MLs; Spijkermann 2008). These lakes areusually oligotrophic (Nixdorf et al. 2003). High TP concentrations (42–230 lg L-1)occur in meromictic or sewage-impaired MLs (Fig. 3.23). Exceptionally high SRPconcentrations (3.5–14.8 mg L-1), derived from the dissolution of phosphorite-nodules by highly aggressive acid mine drainage (AMD), were reported for an acid(pH 2.5) pond (Woelfl et al. 2000).
The vulnerability of MLs to critical P loads from river flooding (Schultze andKlapper 2004), P loading due to in-lake measures (e.g. Lessmann et al. 2003), andfish farm emissions for neutral MLs (Axler et al. 1996, 1998; Rümmler et al. 2003;Yokom et al. 1997) is of present and future concern. Hence, the prediction offuture trophic state requires knowledge of mechanisms of import and accumulationof P in relation to that of other substances during ML succession, particularly on Ppelagic settling and scavenging, benthic P diagenesis, and mobility aspects knownto influence P retention and pelagic P availability.
The objectives of this section are to: (1) review the state of knowledge con-cerning P in acidic MLs in order to evaluate its actual import paths, accumulation,and retention mechanisms, (2) assess recent and future sedimentary P mobility inyoung MLs, and (3) address open and critical research and management questions.Due to the dynamic development of the young (only a few decades old) MLs, thediscussion refers in some cases (e.g. sedimentation, P forms) only to conditions ofthe current (acid) phase of succession. Furthermore, the number of studies on P inMLs is limited and little long-term data exists, so some conclusions arepreliminary.
Import of Phosphorus
Soil erosion, in the form of transported suspended sediment in overland flow, isoften associated with high rates of particulate P transfer from land to water bodies.A review of P loss from land to water by Sharpley et al. (2001) revealed that theloss of P originates mostly from small areas within watersheds, and typicallyduring a few periods of high rainfall intensity. However, the results of commonsoil erosion processes are not transferable to the dumps of the post-mining land-scape (e.g. Abel et al. 2000; Biemelt et al. 2005).
A year of monitoring and ten short rainfall simulations have revealed higherosion rates and loss rates for P and Fe from bare lignite mining dumps atSchlabendorf, Lusatia, Germany (Kleeberg et al. 2008). The hydrophobicityled to very low infiltration, thus generating surface runoff even at low rainfallintensities. The mean annual soil erosion rate from the monitoring site was18 9 106 kg km-2 year-1. Loss rates for P and Fe were 470–650 kg km-2 year-1
and 37.9 9 103–71 9 103 kg km-2 year-1, respectively. These rates are equiva-lent to those of intensively used agricultural catchments. However, P import from
3.2 Limnochemistry of Water and Sediments of Acidic Pit Lakes 63
these P-poor (17–90 lg g-1) tertiary spoil materials into MLs will hardly affecttheir trophic state due to the accompanying high Fe import (Fe:P & 60).
The diversion of river water into mining pits, both to quickly fill the pit and, atsome sites, as flow-through to maintain sustainability, is one of the major man-agement strategies to prevent (hydraulic gradient towards the dumps) or to combatacidification by dilution and import of alkalinity (see Sects. 4, 5.1).
Primary filling can cause extremely high short-term P loading for the new pitlakes. For example, various MLs in Saxony-Anhalt, Germany, have been floodedwith river water (TP 110–160 lg L-1), resulting in short-term P loading between0.07 and 3.15 g m-2 year-1 for ML Merseburg Ost to 3.6 g m-2 year-1 for MLRunstädt (Schultze and Klapper 2004; see also case study 5.1). In-lake TP con-centration during flooding ranged between \3 and 160 lg L-1 and usuallydecreased rapidly for MLs with significant ‘mining impact’ (metal import). Asdocumented for ML Goitsche, Germany, which was flooded by River Mulde water(TP & 110 lg L-1), P was efficiently removed from the water column by Fe- andAl-compounds adsorbing riverine P, leading to low TP concentrations of 6–11 lg L-1 a few months after flooding (Duffek and Langner 2002; Herzsprunget al. 2010). However, elevated TP concentrations (12–70 lg L-1) after floodingof other MLs, such as ML Runstädt, depict the limits of this technique and the riskof eutrophication.
Through flow of alkaline river water is required for many MLs as a continuousmanagement measure to buffer acidity (Senftenberger See, ML Dreiweibern) or touse MLs as reservoirs to buffer variable discharge. Most examples show that MLscan compensate for this extra nutrient load (e.g. 20% for ML Dreiweibern) by highP retention, depending on the degree of mining impact, thus retaining a meso- oroligotrophic state.
Groundwater (GW) often dominates the water budgets of acid and neutral MLsafter cessation of flooding (Hofmann et al. 2008; Werner et al. 2001). Despite theavailability of high quality water mass balances from three-dimensional GWmodeling (Heidenreich et al. 1999; Knoll et al. 1999), it is difficult to quantify Pimport because: a) TP concentrations in GW vary over a wide range (e.g. 101–254 lg L-1 for ML 117; 50–1,700 lg L-1 for ML Dreiweibern, Germany), and b)the P concentration is altered substantially during sediment passage.
The composition of GW after sediment passage as measured by seepage metersdiffers considerably from that in the vicinity of a lake (e.g. Driescher et al. 1988;John and Lock 1978). During passage through mining-influenced sediment, whichtypically has an elevated Fe content in both acid and neutral MLs compared tosediment of near naturally neutral lakes (Fig. 3.23), it is very unlikely that sub-stantial amounts of P initially reach the ML water. Due to the high P sorptioncapacity of Fe-rich sediments (e.g. 5.6–9.1 mg g-1 in ML 117), predominantlyadsorption of P onto Fe oxyhydroxides, P levels rarely exceed the sorption equi-librium concentration of about 3 lg L-1. With typical Fe contents [70 mg g-1
and Fe:P ratios[60 for acid ML sediments (Fig. 3.23) there is no case where P isclose to saturation, i.e. Fe:P \ 10 (Lijklema 1977).
Complete P mass balances allow the estimation of the TP concentration in GWafter sediment passage if whole lake retention (R) is assumed. For ML Dreiweibern,a GW TP concentration of 0–75 lg L-1 was calculated (for R = 0.85–0.88), whichis considerably less than measured in GW wells. However, preferential flow isprobably important due to small-scale bottom inhomogeneities that are influencedby the regional surface excavation technique. Preferential flow into deeper parts ofe.g. ML 117 by means of electrical conductivity and seepage meter measurementsrevealed a 82–93% reduction of TP concentration to 17–71 lg L-1, compared toGW, despite high discharge at these locations and a short, i.e. \10 cm sedimentpassage (Hofmann 2003; Hofmann and Lessmann 2006). From a whole-lake sedi-ment P budget, we estimated that the GW infiltrating the sediment had a TP con-centration of 200–300 lg L-1, which was almost completely adsorbed duringsediment passage, generating a mean in-lake SRP concentration of\4 lg L-1.
Role of Phosphorus in Mine Lake Remediation
In the dumps, phosphate (PO43-) additions can reduce the potential of Fe3+ to act
as a pyrite oxidant if PO43- precipitates with Fe3+, forming relatively insoluble
iron phosphate minerals, such as amorphous FePO4 and FePO4 � 2H2O (strengite;e.g. Baker 1983; Hood 1991). However, experiments to verify the P control onpyrite oxidation indicated that the inhibition is only temporary because of ironarmoring (Huang and Evangelou 1992; Fytas and Evangelou 1998). An example ofnatural phosphate rock application to precipitate iron is also described in casestudy 5.7. To our knowledge, practical application of this technique is limitedbecause of the high costs, and the potential adverse environmental effects of Pfertilization.
The approach of neutralizing poorly buffered airborne acidified lakes bytreatment with P fertilizer has been known for a long time (Davison et al. 1995). Inrecent years, some have attempted to use single P amendments to reduce AMDfrom mine dumps, or to stimulate a ML’s primary production to enhance the Csupply for benthic alkalinity generation. Additions of P should be most effective inremoving acidity via iron sulfide sequestration. Theoretically, to remove 1 molacid, it is necessary to form 1 mol of FeS2. This can be achieved by applying either0.05 mol PO4
3- (‘controlled eutrophication’, Fyson et al. 1998a), or 0.5 molCaCO3 (‘lake liming’, e.g. Lindmark 1982), or alternatively 3.75 mol of organicmatter\CH2O[(‘saprobization’, Fyson et al. 1998b). However, the following fewexamples show that single P additions have had limited effects.
Fyson et al. (1998a, b) tested amendments of organic C and hydroxyapatite inlab mesocosm experiments with sediment of an acid (pH 3.1) ML. Additions ofpotatoes at rates of 51–348 g dry weight (dw) m-2, equivalent to a P load of 0.13–0.88 g m-2 (P content 1.8 mg g-1) resulted in anoxic conditions above the sedi-ment, and an increase in dissolved Fe, SRP, NH4
+, and organic and inorganic C asthe potatoes decomposed. In contrast, a single hydroxyapatite addition(692.9 g P m-2) was not effective in supplying organic C via planktonic
3.2 Limnochemistry of Water and Sediments of Acidic Pit Lakes 65
Sur
face
Sed
imen
tW
ater
p e a e, f,
se e g,
hn d,
o, j
e e, r
d, o
, ja e c a e a a a a q q e c c i r m a,
gt a a,
l, mSource
ML
107
(98)
Sed
litz
(93)
ML1
13 (
01)
ML
111
(98-
00)
Lich
tena
uer
See
(93
)S
kado
(93
)M
L 11
7 (0
2-04
)M
L 11
2 (0
1)N
iem
eck
(Goi
tsch
e) (
99)
Hal
bend
orf (
93)
Kos
chen
(93
)D
oebe
rn (
Goi
tsch
e) (
02)
Bär
wal
de (
09)
Sen
ftenb
erg
Süd
feld
(93
)G
obpi
le (
<86
)F
elix
see
(01)
Sen
ftenb
erg
(93)
Sen
ftenb
erg
(09)
Dre
iwei
bern
(01
)D
reiw
eibe
rn (
08)
Grä
bend
orf (
09)
Kul
kwitz
(01
)H
asel
bach
(07
)S
chön
feld
er S
ee (
95)
Bas
s (<
(86)
Lind
en (
<86
)S
prem
berg
Res
erv.
(01
)La
ubus
ch (
Hyp
o) (
98)
Gol
pa IV
(95
)
Wal
ds. D
öb. (
Mon
im)
(03)
Mor
itzte
ich
(Mon
im)(
04)
Lugt
eich
(M
onim
) (0
1)
natu
ral l
akes
acid
ML
s
neu
tral
ML
s
nat
ura
l lak
es
mer
om
icti
c M
Ls
TP
Sed
(mg
g-1)
0.50
0.50
0.29
0.45
0.21
0.30 0.
900.
450.
500.
670.
390.
500.
48 0.79
0.40
0.40
2.4
1.6
0.61 1.
250.
72
0.86
1.00
2.8
4.5
0.60 1.
105.
0
0.48
0.18
1.50
02
46
8
15
2,3
(n=
105)
pH w
ater
24
68 <
4
> 6
18 840
11 9 11 6 11 6 12 5 6 9.5
2 5 6 15 12 10 11 4 12
4327
5030
050
100
150
TP
wat
er
(µg
L-1)
124
140
300
2.4
9114
071
100
200
300
220
140
320
117
290
25 32
140
137
9024
386
27
100
45 5813
340
96
300
277
190
34
015
030
0
TF
e S
ed
(mg
g-1) (n
= 2
6)
73
14 9
256 5 2 3.
3
5 5.5
54
8293
050
100
S S
ed
(mg
g-1) 17
0
42
1419
29 26 2519
28 29
14
21 2211
18 23 22 25
36 40
025
50
LOI
(%)
2813
521
849
105
933
230
25 5 4.1
4.2
0.3
1.8
0.0
0.1
0.2
0.4 13
129
0.3
0.5
0.5
0.2
010
020
030
0
TF
e w
ater
(mg
L-1) 82
6
420
400
332
511
236
913
162
246 33
218
219
935
413
5 203
35 44 32 4682 10
866
31 6417 32 26 5 4
277
139
21 8
148
020
040
0
Fe:
P
2.3
6.3
3.0
7.7
6.6
4.2
1.0
1.0 1.
91.
2
10
05
10
Fe:
S
66 3 Limnology of Pit Lakes
production. The studies demonstrated that organic wastes remove acidity in theshort-term by generating reducing conditions around the sediment surface andstimulating P release to the overlying water.
To study whether self-sustaining acidity removal is possible by ‘controlledeutrophication’, enclosure experiments were run in dimictic, acidic (pH & 3) ML117-Grünewalder Lauch (A = 0.94 km2, zmax = 14.4 m) from August to October2002. 12 enclosures ([ = 1 m) were installed at a water depth of 6 m. Two wereneutralized by adding Na2CO3, two were neutralized and fertilized (Na2CO3 ? Pwith 3 g m-2), two were only fertilized with P (3 g m-2), two were neutralized andfertilized with 3 kg fresh potatoes (309 g C m-2 incl. 1.44 g P m-2 on a dw basis),two were only fertilized with 3 kg potatoes, and two were left untreated as controls.
Neutralization and C addition in combination was most efficient in terms ofsustainability of increased pH and decreased Eh at the sediment water interface andsecondary supply of particulate organic C (POC) from primary production towardsthe sediment. There was no permanent effect after single neutralization, C addition,or P fertilization. In the neutralized and P-fertilized enclosures, the Na2CO3 additionsled to a rapid decrease of TP concentration from 500 to 15 lg L-1 by co-precipi-tation with Fe carbonate and Fe hydroxide, and so significantly decreased the pelagicP availability for primary producers. Consequently, there was (at least for theamounts added) no long-term effect as a consequence of the diminishedphytoplankton production and the corresponding POC flux. In summary, therewas a gradual component-specific effect on pH in the sequence: ‘potatoes’ [‘Na2CO3 ? P’ [ ‘P’ [ ‘control’ indicating that biogenic alkalinity generation dueto organic C supply is more efficient than liming or P amendments.
Lessmann et al. (2003) reported on in-lake treatment by the addition of organicwaste material to increase primary production and to form anoxic microbial reactioncompartments and thereby stimulate biogenic alkalinization via sulfate reduction.The small (A = 10 ha, V = 105 m3), shallow (zmax = 2.5 m) acidic mining lakeKoyne 113, Germany, was treated four times in three consecutive years with a total of243 t of a mixture (C: 486 g kg-1, N: 6.36 g kg-1, P: 94 mg kg-1) of cut-up beerand water bottle labels in jute bags. These additions resulted, from before thetreatment to the third year, in increased lake water concentrations of organic C from2.9 to 8.0 mg L-1, of TP from 10 to 43 lg L-1, and of chlorophyll a from 28 to85 lg L-1. However, acidity (KB4.3 = 10.4 ± 0.4 mmol l-1; KB8.2 = 13.9 ±
0.6 mmol l-1) and pH (2.5 ± 0.05) did not change.
Fig. 3.23 Sediment and water data for MLs with emphasis on sediment P and mining indicators(Fe, S) for acid, neutral, and meromictic MLs; (Hypo: hypolimnion; Monim: monimolimnion).Sources: a) own unpublished data; b) Borovec and Hejzlar (2001); c) Brugam et al. (1988); d)Duffek and Langner (2002); e) Friese et al. (1998); f) Frömmichen et al. (2004); g) Grüneberg andKleeberg (2005); h) Grüneberg (2006); i) Heidenreich and Kleeberg (2003); j) Herzsprung et al.(2004); k) Herzssprung et al. (2010); l) Hupfer (1998); m) Hupfer et al. (1998); n) Kleeberg andGrüneberg (2005); o) Langner (2004); p) Lessmann et al. (1999); q) LMBV (various unpublishedreports and monitoring data from state company responsible for the remediation of former lignitemines in eastern Germany; www.lmbv.de); r) Nixdorf et al. (2000); s) Saballus (2000); Stellm-acher (2004)
b
3.2 Limnochemistry of Water and Sediments of Acidic Pit Lakes 67
This approach obviously failed because the import of acidity-forming constit-uents was not stopped. For example, within the observation period, sulfate con-centrations increased from 1.59 to 2.86 g L-1, i.e. by 79.9%. This increase showedthat either no sulfate reduction occurred in the shallow lake, or sulfides werere-oxidized due to constant high oxygen saturation [90% in the water column.Even if part of the sulfate was stored in the sediment, such an oxygen supplyfavors a re-oxidation of sulfides as shown by Koschorreck et al. (2002).
Furthermore, the addition of C (mostly Corg) with 1,181 g m-2, of N with15.5 g m-2, and of P with 0.23 g m-2 corresponds to a ratio of C13,356:N150:P1.This ratio differs quite a lot from the mean composition of phytoplankton withC106:N16:P1 (Redfield 1934), which indicates that the nutrient mixture was notappropriate. The total P amount of waste material addition should theoreticallylead to a pelagic TP concentration of 228 lg L-1, representing an already highlyeutrophic lake. However, the TP concentration monitored after the measure(43 lg L-1) revealed that most of the P (77.6%) was precipitated due to surplus ofP-binding partners, such as Fe, Al, and Mn (Fe:P 6366, Al:P 4248, and Mn:P 180)in the water. Metal concentrations even increased during the experiment.
Phosphate and nitrate have also been directly applied to surface waters of pitlakes to reduce metal concentrations and toxicity. Island Copper pit lake (Fisherand Lawrence 2006; Pelletier et al. 2009), and enclosures in Main Zone andWaterline pit lake, Canada (Martin et al. 2003) received P additions between 0.1and 2.0 mmol m-2 d-1. Due to increased primary production, a pronouncedremoval of dissolved and total Zn, Cu, and Cd was attained by active uptake orsorption to algal surfaces and subsequent particle settling, and by metal-sulfideprecipitation under anoxic conditions. Combined limestone neutralization and Pamendment reduced Al and Zn metal toxicity by shifting metal species to pre-dominantly non-bioavailable forms in mesocosms with Lake Kepwari water, WestAustralia (Neil et al. 2009; case study 5.4).
To summarize, it is best to lower the import of AMD to a minimum prior anyin-lake manipulations. In the case of P fertilization, the concomitant import orpelagic and benthic surplus of P-binding partners, such as Fe, Al, and Mn, has tobe adequately considered in terms of a mass balance and respective sediment.Even a surplus of P and organic C by waste materials does not guarantee effectiveacidity sequestration, even though it bears the risk of eutrophication.
Sedimentation and Accumulation of Particulate Matter and Phosphorus
Composition and sedimentation of particulate matter in MLs has rarely beenstudied. High deposition rates for dry weight (dw; 3.8 g m-2 d-1) and Fe(1.45 g m-2 d-1) were reported for acidic (pH 2.9) ML 77, Germany (Peine et al.2000). Similar dw deposition rates (2.1 g m-2 d-1) were reported for meromicticML Waldsee, Germany (Dietz, unpubl.), and considerably lower rates (dw:0.94 g m-2 d-1, Fe: 0.2 g m-2 d-1) for ML 117 (Grüneberg 2006). Due to thehigh Fe content of settling matter (210–363 mg g-1), Fe fluxes are an order of
68 3 Limnology of Pit Lakes
magnitude higher than in natural lakes. A three-year sediment trap study in acidic(pH 3.0) dimictic ML 117, representing moderate Fe concentrations (9.3 mg L-1)revealed, first, annual mean epilimnetic sedimentation rates of organic C(101 mg m-2 d-1) and TP (1.4 mg m-2 d-1) were similar to those of naturaloligotrophic lakes. Second, Fe oxyhydroxide precipitation dominated sedimenta-tion only for a short time, between mid June and August (max. 2.2 g Fe m-2 d-1;Fig. 3.24a), inducing low C:P ratios during summer (Fig. 3.24c) by scavenging oforganic C, a seasonal trend opposite to that of natural neutral lakes. Third, evenduring periods of intensive Fe oxyhydroxide floc formation, low concentrations ofSRP & 3 lg L-1 limited P adsorption, so downward P transport was mainlyorganic (algae; 39–71% TP).
Sediment composition and accumulation rates differ for shallow and deep partsof ML 117 due to different rates of lateral Fe oxyhydroxide and organic particletransport and mobilization. The sediment formed at a shallow water depth(2.5–8 m) has a high P sorption potential due to a high Fe (400 mg g-1) and low Pcontent (0.4 mg g-1). In contrast, an Fe-poor (24–250 mg g-1) but C- and P-rich(loss on ignition: 32–70%; TP: 0.9–3.4 mg g-1) sediment formed at deeper(8–14 m) water depths. Although these results are from a single case study, dif-ferentiation in small deep and extended shallow areas is characteristic for a numberof MLs (Nixdorf et al. 2001). Thus, the effects of morphometry-triggered sedimentaccumulation and composition patterns for P retention or for processes dependingon POC supply have to be considered as likely to occur in other MLs as well.
Phosphorus Adsorption Properties of Mining Lake Sediments
The low trophic state of acid MLs is, to a great extent, a consequence of the high Padsorption capacity of metal oxyhydroxides (e.g. 37.3 mg P g-1 Fe for fresh Fehydroxide at pH 7; Parfitt et al. 1975). Phosphorus adsorption capacities (batchexperiments, Langmuir isotherm) varied between 0.3 and 3.3 mg g-1 dw forsediment of neutral Spremberg reservoir, Germany, receiving river water
15
0
2
4
6
8
50
150
250
350
450
J F MAM J J A S O ND J F MA M J J A S OND J F MA MJ J A SO ND
2002 2003 2004
C :
P
0.0
1.0
2.0
-1
C:P 106
stratification(a)
(b)
(c)P (
mg
m-2
d-1
)F
e (g
m-2
d)
Fig. 3.24 Monthly mean ofsedimentation rate at thedeepest site of acid (pH & 3)ML 117, Germany, for theepilimnetic 7 m trap (opensymbol) and hypolimnetic12 m trap (closed symbol)for: a total Fe, b total P, andc the atomic C:P ratio ofmaterial entrapped
3.2 Limnochemistry of Water and Sediments of Acidic Pit Lakes 69
discharged by AMD (Heidenreich and Kleeberg 2003), and 3.8–9.1 mg g-1 dw forthree ML sediments (Grüneberg 2006) with P adsorption clearly depending onsedimentary Fe content (R2 = 0.90; n = 8). These numbers are significantlyhigher than those known from natural lakes ranging from 0.03 to 3.0 mg g-1 dw(e.g. Detenbeck and Brezonik 1991; Pant and Reddy 2001), and are similar toother Fe hydroxide media (Adler and Sibrell 2004; Zeng et al. 2004).
Working with these numbers, it should be considered that P adsorption a) islower (e.g. 5.6–8.5 mg g-1 for ML 117) if determined in continuous flowexperiments as to mimic GW sediment passage with more realistic (0.4 and2.0 mg L-1) adsorbate concentrations (Grüneberg 2006), and b) may significantlydecline under anoxic conditions (e.g. Pant and Reddy 2001).
The significance of the very efficient non-redox sensitive Al–P sorption(Lijklema 1980; Parfitt 1989) has been documented for rain-acidified lakes (e.g.Kopácek et al. 2004), but not for MLs. There are contradictory views on theinfluence of humic substances on metal-P adsorption, which compete with P foradsorption sites at metal surfaces (Antelo et al. 2007; de Vincente et al. 2008), butmay also increase P sorption (Bloom 1981; Gerke and Herman 1992). This mightbe especially significant for MLs, giving the substantial amounts of partly lignite-derived C associated with metal oxyhydroxides (Laskov et al. 2002).
Phosphorus Forms in Mining Lake Sediments
The stability of P binding in acid ML sediments was highlighted by Brugam et al.(1988). They found that only a small fraction of P dissolves in 0.1 N HCl (rep-resenting inorganic metal-bound P) and that most P (and other elements) isreleased only in ashed sediment by hot HCl. Thus, most P is strongly adsorbed orin organic form.
Many authors apply a sequential extraction (e.g. Hupfer 1998; Psenner et al.1984) to identify operational phases and to interpret pools and mobility of benthicP forms. Because of the high Fe contents of ML sediments, the procedure wasmodified (Grüneberg 2006; Saballus 2000), and a simple method for TP and TFedetermination was tested for sediments with Fe contents up to 450 mg g-1
(Grüneberg and Kleeberg 2005).Iron is regarded the predominant sorption partner for P in MLs due to the
abundance of Fe oxyhydroxides. However, BD-P (Fe-bound P) comprised only17–30% of TP in oxic sediments of acid ML 112 (Kleeberg and Grüneberg 2005)and ML 117 (Grüneberg and Kleeberg 2005). The potential for P adsorption to Feoxyhydroxides (BD-P) is not completely fulfilled in these acid MLs due to anexcess of Fe compared to P.
Aluminum contributes differently to P sorption in MLs depending on thegeochemical setting. Despite high atomic Al:P ratios (13 - 440; n = 8) in acidML surface sediments, Al is of minor importance for P binding if mainly presentas constituent of clay particles, as found for ML Golpa IV (Hupfer et al. 1998), andby means of energy-dispersive X-ray analysis and sequential extraction for ML117 (Grüneberg and Kleeberg 2005). The increase of NaOH-P (metal-bound P,
70 3 Limnology of Pit Lakes
mainly Al, and organic P) at the expense of BD-P between pH 4 and 7 wasinterpreted as a shift of relevance from Fe- to Al-oxydroxides for P sorption inML Goitsche (Duffek and Langner 2002; Duffek and Schultze 2002). Dominanceof Al–P binding was also demonstrated for rain-acidified (pH 4.9) Lake Plešne dueto high Al import (Kopácek et al. 2004) and for Mud Pond Lake (pH 4.8), asevidenced by 80% solubility of Al and [95% solubility of P in the NaOH-fraction(Wilson et al. 2008).
Vivianite [Fe3(PO4)2] is known to be a long-term P sink in anoxic lake sedi-ments (e.g. Holdren and Armstrong 1980; Nriagu and Dell 1974). Positivevivianite saturation indices were determined by chemical equilibrium calculationsfor the highly anoxic deeper sediment of ML Golpa IV (Hupfer et al. 1998) and inmesocosm experiments with organic C and P additions to ML sediments(Grüneberg 2006; Langner 2004). These authors concluded that the high Fecontent of ML sediments and the dominance of Fe reduction over SO4
2- reductionresult in excess Fe2+ in pore water, which allows concurrent sulfide and vivianiteformation not possible under most conditions (Nriagu 1972).
Metal–organic complexation was assumed to be an important P bindingmechanism as it offers an explanation for the high BD- and NaOH-NRP (non-reactive P) content of ML sediments (Grüneberg and Kleeberg 2005) that isconsistent with the finding that organic matter is preserved after degradation due toadsorption to Fe oxyhydroxide surfaces (Antelo et al. 2007; Laskov et al. 2002;Tipping 1981).
To summarize, there are indications of Al control of P binding for MLs at pH4–6.5, based on one case study and analogous rain-acidified lakes. For acid(pH \ 4) MLs, high organic P contents were found in two cases (up to 36–42%NaOH-NRP in ML 112 and 117 surface sediment), while most Fe-based Padsorption capacity remains unfulfilled due to the high Fe contents. Evidence forvivianite as well as metal–organic complexation is vague despite their potentiallyhigh relevance as long-term sinks for P in MLs.
Phosphorus Mobility and Availability: Implications for Mine Lake Succession
There are mechanisms and indications for both very efficient P binding in MLsediments and also for increased mobility of P with ML succession. Four mech-anisms that could lead to increased P mobility and potentially higher trophic statehave been identified. First, the import of Fe and Al into MLs will decrease withmaturation and reclamation of their catchments; thus, the supply of P bindingpartners will decline (Kleeberg and Grüneberg 2005). Second, the P adsorptioncapacity of Fe oxyhydroxides will decline with increasing pH due to transfor-mations to more crystalline forms. Third, the burial of metal-rich sediments byparticles from river flooding or increased primary production may render the Feoxyhydroxides from the acid phase inactive for P adsorption (Schultze andKlapper 2004). And finally, natural maturation or artificial neutralization will leadto P and C accumulation in MLs, which may cause anoxic conditions at the
3.2 Limnochemistry of Water and Sediments of Acidic Pit Lakes 71
sediment, reductive dissolution of Fe oxyhydroxides, immobilization of Fe asFeSx, and consequent mobilization of Fe-bound P analogous to natural lakes(Caraco et al. 1993; Kleeberg 1998).
However, anoxic conditions do not inevitably cause P release. SRP concen-tration remained close to the detection limit of &3 lg L-1, despite anoxicconditions (Eh \ 150 mV) and periodic neutralization of hypolimnetic water topH 5–6.4 in ML 117 (Grüneberg 2006). The meromictic and anoxic ML Goitscheshowed no sign of eutrophication (TP 8 lg L-1), despite a short-term highP import by a river flood (Herzsprung et al. 2010). In both cases, the re-oxidationof Fe2+ from reductive dissolution in anoxic sediment layers at the sediment waterinterface (‘ferrous wheel’; Campbell and Torgersen 1980; Davison 1993) allowedcontinuous P precipitation by newly-formed Fe oxyhydroxides. Thus, a high Fe:Pratio in pore water (&10,000 for ML Goitsche, basin Niemegk) was suggested asan indictor for a low trophic state (Herzsprung et al. 2010; Sect. 3.2.1.1).
The longevity of an effective Fe–P co-precipitation is elucidated by the case ofnatural lake Groß-Glienicker See, Germany (A = 0.67 km2, zmax = 10.8 m).P sorption capacity has remained high for 16 years (13 cm of new sediment) afteriron hydroxide and iron chloride treatment (Hupfer 2004), as evidenced by anelevated Fe content, low pore water SRP, and a high Fe:P ratio in sediment (7.5)and pore water (15.0; Fig. 3.25).
Conversely, batch and column experiments involving the addition of organic Chave shown that P release from Fe-rich ML sediments is possible under permanentanoxic conditions. However, P release rates between 0.15 and 0.46 mg m-2 d-1
(Grüneberg 2006) and 6.2 mg m-2 d-1 (Langner 2004) are low compared to thoseof oligotrophic (0–1 mg m-2 d-1) and mesotrophic (2.1–6.7 mg m-2 d-1) lakes(Nürnberg and Lazerte 2004). Grüneberg (2006) found that P release occurred onlyfrom ML sediments where Fe was largely immobilized as FeSx, as evidenced by alow atomic Fe:S ratio (1.4–2.0). The measured SRP pore water concentrationswere in adsorption equilibrium with the fraction of Fe not immobilized as FeSx.
Explanations for high P retention, the limits of P binding, and conditions thatcause high pelagic P concentrations can also be derived by analyzing the geo-chemisty of ML water and sediment (Figs. 3.23 and 3.26): MLs without additionalnutrient inputs are characterized by low TP concentrations in water column(\12 lg L-1) and sediment (\0.5 mg g-1). Additional nutrients provided by riverflooding or wastewater discharge results in high sediment TP, but pelagic TPconcentration increases only if the P loading exceeds sedimentary P sorptioncapacity (e.g. ML Golpa IV). Elevated P concentrations (30–50 lg L-1) in themonimolimnion of meromictic MLs Moritzteich and Waldsee Döbern, whichreceive only natural low P imports, highlight that high Fe contents(&300 mg g-1) and Fe:P ratios (140–280) in the sediment are insufficient indi-cators for P mobility (Fig. 3.26c). For most cases, prerequisites for high P con-centrations are anoxic conditions in the hypolimnion and sediment as well asimmobilization of Fe as FeSx as indicated by low atomic Fe:S ratio \2(Fig. 3.26e). Kleeberg (1998) already identified the ‘degree of pyritization’ (DOP),
72 3 Limnology of Pit Lakes
0
5
10
15
20
25
0 40 80 120 160
Al (mg g-1), Fe (mg g-1)
Sed
imen
t de
pth
(cm
)
0 1 2 3 4 5
TP (mg g-1)
1992
0
5
10
15
20
25
0 40 80 120 160
Al (mg g-1), Fe (mg g-1)
Sed
imen
t de
pth
(cm
)0 1 2 3 4 5
TP (mg g-1)
Al
Fe
TP
0
5
10
15
20
25
0 10 20 30 40 50
Fe:P (atomic)
Sed
imen
t de
pth
(cm
)
GGS
ML 117
-25
-20
-15
-10
-5
0
5
10
15
20
25
0 200 400 600 800
SRP (µg L-1), GGS
Dep
th (
cm)
0 20 40 60 80
SRP (µg L-1), ML 117
GGS
ML 117
(a) (b)
(d)(c)
Fig. 3.25 Vertical profile of sedimentary Al, Fe, and total P (TP) for a neutral lake GroßGlienicker See, Potsdam, Germany, which has been treated by ferric Fe in 1992 (see arrow), andb for acid ML Grünewalder Lauch (ML 117), Lauchhammer, Germany; c respective atomic Fe:Pratio for both lakes; d vertical profile of soluble reactive P (SRP) in pore water at the deepest siteof lake Groß-Glienicker See (GGS) in September 2008, and for ML 117 in June 2003
3.2 Limnochemistry of Water and Sediments of Acidic Pit Lakes 73
an expression of the percentage of Fe sequestered in FeSx form, as an essentialindicator for P mobility.
Groundwater seepage into MLs largely determines water geochemistry due tothe import of elevated quantities of dissolved metals and sulfur associated withmining activities (Blodau et al. 2006; Graupner et al. 2005; Wisotzky and Ober-mann 2001). As the cycling of P relates to the quantity of this mining impact,various indicators for P mobility have been used, reflecting the interconnectionsbetween P, Fe, Al, and S (Fig. 3.27). A high mining impact (metal import and theirpelagic precipitation as oxyhydroxides) leads to very low benthic P mobility inacid MLs. Under anoxic conditions, P mobility remains low due to: a) upwardpropagation of the aforementioned ‘ferrous wheel,’ which leads to a high Pbinding capacity of Fe-rich ML sediments beyond the period of a massive AMD,despite decreasing Fe- and Al-import and ongoing deposition of organic and P-richsediment; b) the possibility of vivianite formation as a permanent P sink con-current with sulfide formation, given a Fe2+ surplus; and c) the higher thermo-dynamic stability of the Fe(OH)3–P complex, compared to Fe(OH)3, so that analmost complete transformation of ferric Fe to FeSx ([75%) is required before Prelease becomes significant (Golterman 1995).
A high pore-water Fe:P ratio and low SRP concentrations was found to assureefficient adsorption onto re-precipitated Fe oxyhydroxides, an indicator conceptalso suggested for natural lakes (e.g. Baccini 1985). The surface sediment Fe:Pratio, suggested as an indicator for shallow oxic lakes (Jensen et al. 1992;Sondergaard et al. 1993), can be used for MLs only when the DOP is low.Analogously, the Al:P ratio (Rydin et al. 2000; Welch and Cooke 1999) may beused with Al hydroxide as the binding partner. Kopácek et al. (2005) proposed theratio NaOH-Al: BD ? H2O–P [ 25 as an indicator for efficient Al-based Psorption. Maaßen (2003) and Jin et al. (2006) suggested combined Al and Feindicators, a concept not tested for MLs yet. We recommend the application of theFe:S ratio or log(Fe:S) 9 log(Fe:P) ratio to account for the fact that DOP deter-mines the availability of Fe as binding partner.
Phosphorus Retention in Mining Lakes and Prognosis of Trophic State
Acid MLs exhibit a high availability of P binding partners as a result of miningactivities, as indicated by sediment Fe:P ratios up to 370 (Fig. 3.23). Evenneutral MLs (without unusually high P loading) have significantly higher sedi-ment Fe:P ratios (17–148) than natural lakes (&8; Fig. 3.23). As a consequenceof this elevated sediment-based P binding capacity, whole lake P retention for aset of eight Lusatian MLs was 14.7 ± 5.5% higher than predicted from theempirical OECD (1982) model (Grüneberg, unpublished). Data indicate thateven a slight mining impact (e.g. Fe surplus) leads to significantly increased Pretention. We suggest that empirical P retention models be adapted for MLssince this underestimation of permissible loading may, for instance, lead to usagerestrictions.
74 3 Limnology of Pit Lakes
3.2.2 Hardrock Metal Mine Pit Lakes: Occurrenceand Geochemical Characteristics
L. Edmond Eary and Devin N. Castendyk
3.2.2.1 Introduction
Pit lakes are an increasingly common legacy of modern, large-scale surface miningoperations. Pit lakes formed in open pit metal mines, where base and preciousmetals are extracted from ore deposits hosted in predominantly igneous andmetamorphic silicate rocks, comprise one category of pit lakes. This category isreferred to as hardrock metal-mine pit lakes, to distinguish them from pit lakesformed in above-ground hydrocarbon, industrial minerals, and aggregate miningoperations.
Ore deposits exploited by mining consist of rock assemblages with naturallyelevated concentrations of metals. These include the base metals (e.g. Co, Cu, Pb,Mo, Ni, and Zn) and precious metals (e.g. Ag and Au). Base metals are typically
020406080
100120140
1 3 5 7 9pHwater
TPw
ater
(µg
L-1)
MLGolpa IV
02468
10121416
1 3 5 7 9pHwater
TPSe
d (m
g g-1
) acid MLsneutral MLsmeromictic MLsnatural lakes
ML Golpa IV
020406080
100120140
0 100 200 300 400atomic Fe:Psediment
TPw
ater
(µg
L-1)
Walds. Döbern
Moritzteich
020406080
100120140
0.0 0.5 1.0 1.5 2.0log(Fe:S) log(Fe:P)sed.
0
50
100
150
0 2 4 6 8 10 12Fe:S sediment
TP w
ater
TPw
ater
(µg
L-1)
(a) (b)
(c) (d)
(e)
Fig. 3.26 Concentration of total P of water (TPwater) and sediment (TPsediment) versus indicators(ratios in water and sediment) supposed to indicate conditions of low and high P concentrations inMLs (n = 27, see Fig. 3.23) compared to natural lakes (n = 5)
3.2 Limnochemistry of Water and Sediments of Acidic Pit Lakes 75
found as metal sulfides and sulfosalt minerals, and precious metals as sulfideminerals (e.g. acanthite—Ag2S) or as native metals (gold, silver, electrum), inassociation with iron sulfides. Accessory minerals containing As and Se arecommon. Due to the ubiquitous presence of iron sulfides, acid rock drainage is amajor water quality problem in metal-mine pit lakes. Thus, the environmentalproblems with metal-mine pit lakes are similar to those at coal and lignite pit lakes,where acid rock drainage from iron sulfide oxidation occurs, but hardrock metal-mines often have a more diverse set of metals at high concentrations available fordissolution and release to surface and groundwater systems, compared to coal andlignite pit lakes.
Water quality in pit lakes is often an important issue that affects permitting ofnew mines, expansion of existing mines, and planning for closure. There arenumerous approaches for using numerical models to predict future water quality inpit lakes (e.g. Balistrieri et al. 2006; Castendyk and Webster-Brown 2007a, b; Earyet al. 2008; Kempton et al. 1997; Schafer et al. 2006). However, one of the bestways to assess whether predictions are credible is to compare them to water qualitypatterns that occur in existing pit lakes located in ore deposits with similar geo-environmental characteristics. This chapter provides an overview of the geoen-vironmental characteristics and associated water quality patterns for metal-minepit lakes that provides a starting point for comparative purposes. The frequency ofoccurrence of metal-mine pit lakes is also discussed. These topics are fundamentalto understanding the importance of geoenvironmental models for guiding the setupof numerical models of future pit lake water quality and assessing the credibility ofthe resulting numerical predictions.
oxic
anoxic
oxic
Porg
Fe~Corg~P
Fe(OH)3~P
P mobility
< 0.70.7 - 2log(Fe:P) log(Fe:S)
< 22 - 12Fe:S
Diagenesisand release
Import
4.6-27.5Al:P ***
< 5.5-8.3sediment: Fe:P **
0.04 - 4∼10.000pore water: Fe:P *
xvivianite formation due to Fe2+ surplus
xFe2+ upward diffusion and re-oxidation
xFe(OH3) reductive dissolution, FeSxformation
Corg scavenging, metal-organic complexation
Fe/Al-oxides high sorption capacity
river flooding burial of Fe/Al-layer
future: Fe, Al decrease; P, C increase
at present: Fe, Al >> P
x
x
x
x
x
HighLow
wat
erse
dim
ent
process / mechanism
Fe2+
Fe3+
FeSx
Fe3(PO4)2
Fe, Al, S‘mining impact’
P, C, …
H2PO4-
’iron wheel’
oxic
Indication for P mobility
catc
hmen
t
anoxic
Sedimentation and sediment P binding
Fig. 3.27 Processes in MLs with implications for low or high P mobility and indicators for Pmobility; (*) no quantitative relation for P mobility versus pore water Fe:P or threshold value forMLs established yet; (**) only if Fe is not immobilized as FeSx; (***) only as Al hydroxide, notas clay constituent
76 3 Limnology of Pit Lakes
3.2.2.2 Occurrence of Hardrock Metal-Mine Pit Lakes
The metal mining industry has faced an increasing challenge of meeting society’sdemand for metals to maintain economic growth while ore grades in metallic oredeposits have steadily declined. For example, worldwide production of copper hassteadily increased at an annual rate of about 4% since 1910 while average oregrades have declined by about 50% (Fig. 3.28). The long term trends in worldwidegold production and ore grade are similar to copper (Fig. 3.29), although the trenddata for gold show more ups and downs due to various factors, such as economicdisruptions, opening of new mining districts, and improvements in extractiontechnologies. Since 1910, worldwide gold production has increased from about700–2,500 t/year in 2006. This increase in production has taken place even thoughore grades have decreased by 50–75% since the early 1900s (Fig. 3.29). Obvi-ously, gold recovery from lower and lower grade ores has become increasinglyimportant for maintaining production rates.
An important technology for efficiently extracting gold from low grade oxideores is heap leaching with cyanide. In this process, crushed ore is saturated with acyanide solution which dissolves microscopic grains of gold. The solution isrecovered and processed to extract the gold. First trialed in New Zealand at theturn of the 20th century, gold heap leaching became a primary extraction methodfor oxide ores starting in the 1970s. By 1986, about 30% of the world’s productionof gold was through heap leaching with cyanide (Dorey et al. 1988).
Increasing metal production from decreasing ore grades requires processingmore material. Thus, open pit mining has become the dominant method for metalrecovery over time because it is a more efficient method of excavating hugeamounts of ore. The dominance of open pit mining can be seen in a compilation ofdata on yearly worldwide investments in mining projects from 2001 to 2007,which was a period of rapid increase in mine production. Figure 3.30 shows thesedata for all base metals, precious metals, iron, and diamonds. Figure 3.31 showsdata specifically for gold and copper. Each of these charts shows that the pro-portion of mines planned to be operated as open pits has increased coincident withthe recent increase in mining activity. This trend is especially evident for gold andcopper mines (Fig. 3.31). For all metal mines, the proportion planned to beoperated as open pits increased from 61% in 2001 to 79% in 2007 (Fig. 3.31). Forcopper and gold mines, the proportion planned as open pits increased from 63% in2001 to 87% in 2007 (Fig. 3.31). While these data represent only a short time span,they show how open pits have become the dominant mining method for metals dueto the need to increase production while ore grades have decreased.
The data on mining project investments also provides a good depiction of wheremetal mines are located and where they will be located in the future. Figure 3.32shows the trends in investment by region. Australia (included as part of Oceania)has consistently been the leading country for investments in metal mining projectssince 2001. Overall, investments are distributed across all geographic regions, andthe proportions of investments by region have remained roughly constant, exceptfor small increases for Latin America at the expense of other regions.
3.2 Limnochemistry of Water and Sediments of Acidic Pit Lakes 77
Fig. 3.29 Trends in worldwide gold production (Kelly and Matos 2008b) and gold ore grades(Craig and Rimstidt 1998—U.S.A.; Mudd 2007—South Africa and Australia) since 1910
78 3 Limnology of Pit Lakes
The global distribution of pit lakes can be expected to resemble the distributionof investments in mining (Fig. 3.32) because the trends shown in Figs. 3.30 and3.31 indicate that a high percentage of metal mines will be open pit operations.Given the past exploitation of many prospects in the established mining districts ofCanada, the United States, and South Africa, it is anticipated that the number ofopen pit mines (and therefore pit lakes) in East and Central Africa, Central Asia,and Latin America will increase in the future (Castro and Moore 2000).
Metal-mine pit lakes have the potential to cause long-term changes to hydro-logic systems and water quality (National Research Council 1999). The creation oflakes in areas where no lake existed prior to mining can potentially affect theviability of nearby water resources. Given their potential volumes, mine pit lakescomprise a potentially large water resource in arid to semi-arid regions andmountainous areas, where potable water is a valuable commodity. For example,Miller (2002) estimated that 35 pit lakes in Nevada have the potential to store1.85 9 109 m3 of water, compared to 0.74 9 109 m3 of water in all the reservoirsin Nevada constructed for water storage. However, the resource value of water inpit lakes is greatly diminished if the water is of poor quality or lost to evaporation.Evaporative loss from large-surface-area pit lakes in arid regions effectively‘‘pumps’’ stored groundwater from aquifers to the atmosphere while simulta-neously increasing the concentration of dissolved metals in residual lake water.Conversely, pit lakes in humid climates may undergo more extensive sulfideoxidation and generate larger volumes of acidic discharge owing to higher inputsof direct precipitation, runoff, and groundwater.
The sections below describe the typical causes of poor water quality at metal-mine pit lakes based on known geochemical processes and observed trends inchemical compositions of existing pit lakes. While these descriptions are useful formaking generalizations about the characteristics of metal-mine pit lakes, there are
0
50
100
150
200
250
2001 2002 2003 2004 2005 2006 2007
Nu
mb
er o
f M
ajo
r M
inin
g P
roje
cts
Year
Underground
Open Pit and Underground
Open Pit
Fig. 3.30 Trends in major mining projects (copper, gold, iron, lead, nickel, platinum groupmetals, silver, diamonds, zinc; E&MJ 2002–2008)
3.2 Limnochemistry of Water and Sediments of Acidic Pit Lakes 79
many deviations from such generalizations due to differences in the geoenviron-mental characteristics of specific mine sites.
3.2.2.3 Hydrogeochemical Processes in Metal-Mine Pit Lakes
There are a number of hydrochemical processes that can affect water quality inmetal-mine pit lakes over the long term, including:
0
10
20
30
40
50
60
70
80
90
2001 2002 2003 2004 2005 2006 2007
Nu
mb
er o
f M
ajo
r C
op
per
an
d G
old
P
roje
cts
Year
UndergroundOpen Pit and UndergroundOpen Pit
Fig. 3.31 Trends in major mining projects for copper and gold (E&MJ 2002–2008)
0
50
100
150
200
250
300
350
2001 2002 2003 2004 2005 2006 2007
An
nu
al In
vest
men
t (B
illio
ns
US
$)
Year
Oceania/Australia
North America
Latin America
Europe
Asia
Africa
Fig. 3.32 Annual investments in metal mining projects by region (E&MJ 2002–2008)
80 3 Limnology of Pit Lakes
• Geoenvironmental characteristics• Sulfide mineral oxidation• Water balance• Mineral solubility• Surface adsorption• Water column dynamics• Sediment biogeochemical processes• Mitigation and remediation efforts
This list of processes is not meant to imply rank in importance but is merely ageneralized compilation of the numerous factors that influence water quality in pitlakes. The following sections discuss the importance of these processes in moredetail.
3.2.2.4 Geoenvironmental Characteristics
The geoenvironmental characteristics of an ore deposit generally exerts theprimary influence on water quality in pit lakes in the absence of remedialmeasures. The characteristics of ore deposits are often discussed in terms ofgeoenvironmental models, which are a convenient way to categorize geologicallysimilar mineral deposits and their wastes with respect to their geochemical,mineralogical, geological, geophysical, hydrological, and climatic properties.Summaries and examples of geoenvironmental models can be found in duBray(1995), Plumlee (1999), Plumlee and Nash (1995), Plumlee et al. (1999) andSeal et al. (2007).
Two of the more important aspects of geoenvironmental models are hostrock reactivity and alteration mineralogy. Host rock reactivity is importantbecause a portion of the wallrock that surrounds a pit lake is usually comprisedof partially mineralized and/or sub-ore grade host rocks that typically containmetal sulfides. Alteration mineralogy is important because the secondary min-erals left exposed in the pit walls (host rocks, remnant ore, and adjacent rocks)after mining is completed represent potential sources of leachable metals andacidity. Table 3.6 provides a list of ore deposit types arranged by major metalcommodity and their typical assemblages of host rocks. The reactivities of thehost rocks are also indicated for each deposit type in terms of typical acidneutralization potential and acid generation potential. The predominant themethat can be gained from the data in Table 3.6 is that most metal ore depositsare contained in silicate rock types that typically have more acid generationpotential than acid neutralization potential. The few exceptions to this gener-alization, such as the lead–zinc Mississippi Valley deposits and Carlin-typegold deposits, are hosted in carbonate rocks, and hence tend to have moderateto high acid neutralization potential. However, the host rocks of most metal oredeposits have an excess of acid generation potential relative to acid neutral-ization potential.
3.2 Limnochemistry of Water and Sediments of Acidic Pit Lakes 81
Table 3.7 lists typical alteration types and secondary mineral assemblages thatmay be overprinted on host and ore rocks at metal ore deposits. The effects of thesecondary minerals on acid neutralization and acid generation potential are alsoqualitatively estimated in Table 3.7. Most types of alteration result in a decreasedpotential for acid neutralization because the metasomatic processes involved insecondary mineral formation usually remove or replace reactive primary carbonateand silicates with less reactive silicates and, in some cases, iron sulfides and metalsulfates (e.g. alunite, jarosite), depending on redox conditions. The primaryexception to this generalization is carbonitization, in which primary minerals arereplaced by carbonate minerals.
The geoenvironmental characteristics of an ore deposit, such as those listed inTables 3.6 and 3.7, cannot be used to predict absolute values of water qualityparameters, such as pH or metal concentration, but they can provide a usefulqualitative guide about what type of water quality should be expected in a pit lake.For example, a prediction of neutral pH and low metal concentrations for a futurepit lake in a porphyry copper deposit with pervasive argillic alteration should bequestioned to identify what mitigating characteristics make it an exception whenits geoenvironmental characteristics would predict that acidic water quality shouldoccur. For existing pit lakes, an examination of the geoenvironmental character-istics of the deposit can provide context for explaining observed water qualities.This information may be used to identify the range of conditions that may occurbased on comparison to pit lakes in similar deposit and host rock types, which maybe useful in the design of remedial strategies for final closure of the pit lake.
3.2.2.5 Sulfide Mineral Oxidation
The primary processes responsible for poor water quality in metal-mine pit lakes isacid mine drainage due to the oxidation of iron sulfide minerals, such as pyrite,marcasite, and pyrrhotite. Sulfides are present in the floors and wallrocks of mostmetal-mine pit lakes and in the groundwater flow paths leading to pit lakes. In thegroundwater flow paths, oxidation may take place in dewatered aquifers, providinga potential source of solutes that could be rinsed and transported into a mine(above and below ground) after mining has ended and the groundwater levelrecovers to its natural elevation. Sulfides may also be present in waste rock and orestockpiles sometimes left in the pits after closure.
Iron sulfide is oxidized by molecular oxygen and ferric iron through reactionssuch as:
A similar type of reaction can be written for pyrrhotite oxidation. Depending onpH conditions, dissolved oxygen concentrations, and microbial activity, ferrous
82 3 Limnology of Pit Lakes
Tab
le3.
6S
umm
ary
ofm
ajor
ore
type
san
dac
id–b
ase
char
acte
rist
ics
for
hard
rock
met
al-m
ine
pit
lake
s
Pri
mar
ym
etal
Dep
osit
type
Typ
ical
host
rock
sH
ost
rock
acid
–bas
ech
arac
tera
Exp
ecte
dla
kew
ater
qual
ity
Au
Adu
lari
a-se
rici
teep
ithe
rmal
vein
Sil
icic
—vo
lcan
ics:
rhyo
lite
,da
cite
,la
tite
,an
desi
teL
owN
P;
mod
erat
eto
high
AG
PA
cidi
cto
circ
umne
utra
lE
pith
erm
alqu
artz
-al
unit
eS
ilic
ic—
volc
anic
sL
owN
P;
high
AG
PA
cidi
c
Car
lin
type
(sil
icic
)S
ilic
ic—
silt
ston
e,sa
ndst
one,
shal
e,±
igne
ous
intr
usiv
eL
owN
P;
low
tom
oder
ate
AG
PM
ildl
yac
idic
toci
rcum
neut
ral
Car
lin
type
(cal
care
ous)
Car
bona
tes—
calc
areo
ussi
ltst
one,
silt
y,ch
erty
ordo
lom
itic
lim
esto
ne,
silt
ston
e,li
mes
tone
Mod
erat
eto
high
NP
;lo
wto
mod
erat
eA
GP
Cir
cum
neut
ral
toal
kali
neL
owsu
lfide
quar
tz-
gold
vein
sS
ilic
ic—
gran
itic
intr
usiv
es,
gree
nsto
ne,
gnei
ssL
owN
P;
mod
erat
eA
GP
Aci
dic
Au–
Ag
tell
urid
eve
ins
Sil
icic
—al
kali
cpo
rphy
riti
cig
neou
s(s
yeni
te,
mon
zoni
tedi
orit
e,ph
onol
ite)
,vo
lcan
icbr
ecci
a,di
atre
mes
,st
ockw
orks
Low
NP
;m
oder
ate
AG
PA
cidi
c
Qua
rtz-
pebb
leco
nglo
mer
ate
Sil
icic
—C
last
icse
dim
ent,
igne
ous
(gra
nite
,gr
eens
tone
,±
volc
anic
s)L
owN
P;
mod
erat
eA
GP
Aci
dic
Ska
rnC
arbo
nate
s—li
mes
tone
,do
lom
ite,
mar
ble,
met
ased
imen
tsM
oder
ate
tohi
ghN
P;
mod
erat
eA
GP
Aci
dic
toal
kali
ne
Ag
Sed
imen
tary
exha
lati
veS
ilic
ic—
sili
cifi
edm
etas
edim
ents
,sa
ndst
one,
silt
ston
e,m
udst
one,
shal
eL
owN
P;
mod
erat
eA
GP
Aci
dic
Adu
lari
a-se
rici
teep
ithe
rmal
vein
Sil
icic
—vo
lcan
ics
(rhy
olit
e,da
cite
,la
tite
,an
desi
te)
Low
NP
;m
oder
ate
tohi
ghA
GP
Aci
dic
Pol
ymet
alli
cve
ins
Sil
icic
—ig
neou
sin
trus
ives
(dio
rite
,gr
anod
iori
te,
mon
zoni
te),
volc
anic
s(a
ndes
ite
torh
yoli
te),
met
ased
imen
ts
Low
NP
;m
oder
ate
tohi
ghA
GP
Aci
dic
Au–
Ag
tell
urid
eve
ins
Sil
icic
—al
kali
cpo
rphy
riti
cig
neou
s(s
yeni
te,
mon
zoni
tedi
orit
e,ph
onol
ite)
,vo
lcan
icbr
ecci
as,
diat
rem
es,
stoc
kwor
ks
Low
tom
oder
ate
NP
;m
oder
ate
tohi
ghA
GP
Aci
dic
(con
tinu
ed)
3.2 Limnochemistry of Water and Sediments of Acidic Pit Lakes 83
Tab
le3.
6(c
onti
nued
)
Pri
mar
ym
etal
Dep
osit
type
Typ
ical
host
rock
sH
ost
rock
acid
–bas
ech
arac
tera
Exp
ecte
dla
kew
ater
qual
ity
Cu
Sea
floo
rm
assi
vesu
lfide
Sil
icic
—m
afic
tofe
lsic
volc
anic
s,m
etas
edim
ents
Low
tom
oder
ate
NP
depe
ndin
gon
min
eral
asse
mbl
age;
high
AG
PA
cidi
c
Mag
mat
icm
assi
vesu
lfide
Sil
icic
—m
afic
volc
anic
:di
abas
e,ga
bbro
,pyr
oxen
ite
Low
tom
oder
ate
NP
depe
ndin
gon
min
eral
asse
mbl
age;
high
AG
PA
cidi
cto
neut
ral
Sed
imen
tary
exha
lati
veS
ilic
ic—
sili
cifi
edm
etas
edim
ents
,sa
ndst
one,
silt
ston
e,m
udst
one,
shal
eL
owto
mod
erat
eN
P;
mod
erat
eA
GP
Aci
dic
Por
phyr
yS
ilic
ic—
igne
ous
intr
usiv
es(t
onal
ite
tom
onzo
gran
ite,
syen
ite
porp
hyri
es)
Low
NP
;m
oder
ate
tohi
ghA
GP
Aci
dic
Sed
imen
tho
sted
Sil
icic
—re
d-be
ds(g
reen
shal
e,gr
aysh
ale,
silt
ston
e,sa
ndst
one,
±ca
rbon
ates
,ev
apor
ites
)L
owto
mod
erat
eN
P;
low
tom
oder
ate
AG
PA
cidi
cto
neut
ral
Ska
rnC
arbo
nate
—L
imes
tone
,do
lom
ite,
mar
ble,
calc
-si
lica
tem
etas
omat
ic,
igne
ous
intr
usiv
es(t
onal
ite
tom
onzo
gran
ite,
syen
ite
porp
hyri
es)
Mod
erat
eto
high
NP
;m
oder
ate
AG
PN
eutr
al
Mo
Por
phyr
yS
ilic
ic—
igne
ous
intr
usiv
e:gr
anit
ic-r
hyol
itic
porp
hyri
esL
owN
P;
mod
erat
eA
GP
Aci
dic
Pb–
Zn
Sea
floo
rm
assi
vesu
lfide
Sil
icic
—m
afic
tofe
lsic
volc
anic
s,m
etas
edim
ents
Low
tom
oder
ate
NP
depe
ndin
gon
min
eral
asse
mbl
age,
Hig
hA
GP
Aci
dic
Sed
imen
tary
exha
lati
veS
ilic
ic—
sili
cifi
edm
etas
edim
ents
,sa
ndst
one,
silt
ston
e,m
udst
one,
shal
eM
oder
ate
NP
;lo
wto
mod
erat
eA
GP
Aci
dic
Mis
siss
ippi
Val
ley
type
Car
bona
te—
dolo
ston
e,±
lim
esto
ne,
sand
ston
e–si
ltst
one,
shal
eM
oder
ate
tohi
ghN
P;
mod
erat
eA
GP
Neu
tral
toal
kali
ne
Man
to/s
karn
Car
bona
te—
lim
esto
ne,
dolo
mit
e,sa
ndst
one–
silt
ston
eM
oder
ate
tohi
ghN
P;
mod
erat
eA
GP
Aci
dic
toal
kali
ne
aN
Pne
utra
liza
tion
pote
ntia
l,A
GP
acid
gene
rati
onpo
tent
ial
84 3 Limnology of Pit Lakes
Tab
le3.
7S
umm
ary
ofac
id–b
ase
char
acte
rist
ics
ofm
ajor
alte
rati
onty
pes
foun
din
met
alli
cor
ede
posi
tsba
sed
onth
esu
mm
ary
inP
lum
lee
(199
9)
Alt
erat
ion
Sec
onda
rym
iner
als
Aci
d–ba
sech
arac
teri
stic
sa
Aci
dsu
lfat
e(a
luni
te)/
adva
nced
argi
llic
Qua
rtz/
chal
cedo
ny,
pyri
te,
alun
ite,
jaro
site
,ka
olin
ite,
±py
roph
ylli
te,
dick
ite
Gre
atly
decr
ease
sN
P,i
ncre
ases
AG
P;
incr
ease
spo
tent
ial
for
rapi
din
itia
lre
leas
eof
acid
?su
lfat
eA
rgil
lic
Kao
lini
te,
illi
te,
mon
tmor
illo
nite
,±
pyri
te,
±ch
lori
teD
ecre
ased
NP
;po
ssib
lein
crea
sein
AG
P
Phy
llic
Qua
rtz,
seri
cite
,py
rite
Dec
reas
edN
P;
incr
ease
dA
GP
Pot
assi
cK
-fel
dspa
r,bi
otit
e,±
anhy
drit
eD
ecre
ased
NP
;po
ssib
lera
pid
rele
ase
ofsu
lfat
eP
ropy
liti
cE
pido
te,
chlo
rite
,ca
lcit
e,al
bite
,±
pyri
teIn
crea
sed
NP
depe
ndin
gon
amou
ntof
calc
ite
form
ed;
Pos
sibl
ein
crea
sein
AG
Pfr
ompy
rite
Sil
ica
Sil
ica
(qua
rtz,
chal
cedo
ny)
Dec
reas
edN
P;
AG
Pno
tsu
bsta
ntia
lly
chan
ged
Jasp
eroi
dS
ilic
a(q
uart
z,ch
alce
dony
)G
reat
lyde
crea
sed
NP
due
tore
plac
emen
tof
sedi
men
tary
carb
onat
esw
ith
sili
ca;
AG
Pno
tsu
bsta
ntia
lly
chan
ged
Gre
isen
Qua
rtz,
mus
covi
te,
fluo
rite
,ca
ssit
erit
e,m
agne
tite
Pot
enti
alfo
rde
crea
sed
NP
;A
GP
not
subs
tant
iall
ych
ange
d
Ska
rnC
asi
lica
tes,
sili
ca,
mag
neti
te,
±py
rite
Dec
reas
edN
P;
incr
ease
dA
GP
Dol
omit
izat
ion
Dol
omit
eD
ecre
ased
effe
ctiv
eN
Pdu
eto
form
atio
nof
pote
ntia
lly
less
reac
tive
dolo
mit
e;A
GP
not
subs
tant
iall
ych
ange
dC
arbo
niti
zati
onC
alci
te,
dolo
mit
e,si
deri
te,
rhod
ochr
osit
eP
oten
tial
lyla
rge
incr
ease
inN
P(b
utne
utra
liza
tion
from
side
rite
isco
unte
red
byox
idat
ion
ofF
e2+;
AG
Pno
tsu
bsta
ntia
lly
chan
ged)
Sul
fida
tion
Pyr
ite
Dec
reas
edN
P;
incr
ease
dA
GP
aN
Pne
utra
liza
tion
pote
ntia
l,A
GP
acid
gene
rati
onpo
tent
ial
3.2 Limnochemistry of Water and Sediments of Acidic Pit Lakes 85
iron is fairly rapidly oxidized to ferric and precipitated as ferric hydroxide andschwertmannite, producing more acid, as in:
It is generally recognized that dissolution reactions involving carbonates (calciteand dolomite) have a high potential to neutralize the acid generated by sulfideoxidation through reactions such as:
CaCO3 þ Hþ ! Ca2þ þ HCO�3 ð3:14Þ
Silicates also have the capacity to neutralize acidity through dissolution reactions,such as the following reaction for anorthite:
There are numerous detailed descriptions of the above types of reactions involvedin sulfide mineral oxidation in the literature (e.g. Nordstrom and Alpers 1999;White et al. 1999) and it is not the purpose of this paper to discuss them in detail.However, a comparison of the kinetics of acid generation reactions (Eqs. 3.10 and3.11) to the rates of acid neutralization (Eqs. 3.14 and 3.15) is useful for illus-trating why some metal-mine pit lakes become acidic and some do not.
Williamson and Rimstidt (1994) describe the abiotic rate of pyrite oxidation byoxygen for a reference system with a surface area to water ratio of 1 m2 pyrite/1 kg of solution:
Rateðmol pyrite m�2s�1Þ ¼ 10�8:19 m0:5O2
m0:11Hþ
!
ð3:16Þ
These authors also describe the abiotic rate of pyrite oxidation by ferric iron forconditions where both dissolved oxygen and ferric iron are present in solution for areference system (Williamson and Rimstidt 1994):
Rateðmol pyrite m�2s�1Þ ¼ 10�6:07m0:93
Fe3þ
m0:4Fe2þ
!
ð3:17Þ
For carbonate minerals, Palandri and Karaka (2004) describe the rates of calciteand dolomite dissolution:
Finally, the rates of dissolution of silicates can be described by the general form ofthe following rate expression (Casey and Ludwig 1995; Chou and Wollast 1985;Palandri and Karaka 2004):
Palandri and Karaka (2004) provide a detailed summary of the values of rateconstants and exponents for Eq. 3.19 for silicate minerals.
Figure 3.33 shows a comparison of the above reaction rates for a range of pHfor equivalent quantities and surface areas. The rates of pyrite oxidation by bothoxygen and ferric iron are more rapid than neutralization by the types of silicatesmost commonly found in silicic intrusive rocks hosting metal sulfide ores, such asquartz, feldspars, clays, and micas. The dissolution rates of some mafic silicates(e.g. olivine and anorthite) approximate the rate of pyrite oxidation by oxygen,suggesting that they may be good sources of neutralization. However, few eco-nomic grade metallic ore deposits mined in open pits are hosted in mafic silicates;hence, their importance for preventing acid generation for most pit lakes isminimal.
In comparison, the rates of carbonate mineral (calcite and dolomite) reac-tions are more rapid than pyrite oxidation (Fig. 3.33). That is why carbonateminerals, when present in sufficient quantities, can prevent acid generation inmetal-mine pit lakes; they react rapidly enough to keep up with the rate of ironsulfide oxidation, assuming that they are not completely consumed before thesulfides.
The conclusion that can be drawn from Fig. 3.33 is that most silicate mineralsgenerally do not dissolve fast enough to preclude acid generation under mostcircumstances, in contrast to carbonate minerals. This conclusion is not surprising;otherwise, acid rock drainage would not be the common phenomena that it is giventhe predominance of silicate rock types over carbonates in most mineralized dis-tricts. Similar observations have been made for natural, closed-basin lakes locatedin volcanic terrains with high sulfur contents where the buffering capacities ofsilicate minerals have been overwhelmed by pervasive acid alteration from sulfurand sulfide oxidation, resulting in naturally acidic, saline lakes (Risacher et al.2002).
3.2.2.6 Water Balance
Water balance, which describes the inputs and outputs of water and their associ-ated solute loads to a pit lake, has a fundamental control on water quality in metal-mine pit lakes, especially during the initial period of infilling. Solutes enter thelake primarily through groundwater inflow, leaching of wallrocks, leaching ofbackfill material (if present), and the dissolution of secondary minerals and metal-salts, some of which may exist as efflorescence on pit walls and in pore spacesprior to lake filling. Salts may also exist in the dewatered parts of aquifers sur-rounding a mine due to oxidation processes. Because solute influxes are functionsof flow rates, they are directly dependent on the rates of water inflow from thedifferent hydrologic sources that make up the water balance of the pit lakewatershed. Sources may include groundwater, pit wall runoff, direct rainfall, and
3.2 Limnochemistry of Water and Sediments of Acidic Pit Lakes 87
possibly surface water diverted into the open pit to accelerate lake filling. The ratesof inflow of different hydrologic sources may change over time as the pit lake fills.For example, the proportion of the water balance from groundwater inflow maydecrease over time as the local groundwater table recovers and hydrologic gra-dients diminish, whereas the relative proportions of water from runoff and directprecipitation may increase, depending on the pit morphology and catchment area.Sulfide mineral oxidation will slow as the wallrocks are increasingly inundated,thereby slowing the rates of acid and metals release. In some cases, the rinsing ofsulfide oxidation products from wallrocks and backfill materials may provide ashort-term high influx of solutes during the early stages of pit filling (see also casestudy 5.1). If evaporation is the only route for water loss from the pit lake, manysolute concentrations not affected by solubility will increase slowly over time dueto evapoconcentration. Biogeochemical processes and surface adsorption reactionstaking place in the water column and sediments may moderate the concentrationsof some solutes, but for the most part, the water and chemical balance will pri-marily control water quality.
The water balances for most hardrock mining pit lakes can be categorized ingeneral terms as either: terminal pit lakes, in which outflow occurs only asevaporation or; flow-through pit lakes, in which surface and/or groundwater flowinto and out of the pit lake (see also Sect. 4.1.2). The typical trends in water quality
-14
-13
-12
-11
-10
-9
-8
-7
-6
-5
-4
-3
-2
2 3 4 5 6 7
log
Rat
e (m
ole
m-2
s-1 )
pH
Forsterite & Bytownite
K-Feldspars,Biotite, Chlorite
Dolomite
Calcite
MaficSilicates
Carbonates
Pyrrhotite Oxidation by Fe3+
in equilibrium with Fe(OH)3
Pyrite oxidation by O2
Anorthite
LabradoriteAndesine
Albite & Oligoclase
Pyrite Oxidation by Fe3+
in equilibrium with Fe(OH)3
Fig. 3.33 Comparison of reaction rates for acid generation and acid neutralization reactionsrelevant to metal-mine pit lakes (reference surface area to solution ratio of 1 m2/kg H2O).Sources of rate data are Williamson and Rimstidt (1994) for pyrite and Palandri and Karaka(2004) for pyrrhotite, carbonates, and silicates
dynamics for each type are likely to be different for different water balancescenarios.
A common situation for many hardrock mining pit lakes is that the wallrockleachates are acidic due to sulfide mineral oxidation, whereas the inflowinggroundwater has a circumneutral to alkaline pH and some amount of acid-buf-fering capacity. As a result, the dynamics in water quality are controlled by therelative influx proportions from these two sources. For example, most terminal pitlakes with low influxes of acid solutes from wallrock leaching and high influxes ofalkalinity from groundwater will evolve to water qualities with one of the fol-lowing sets of characteristics: (1) circumneutral pH values, gypsum saturation, andlow cationic and anionic metal concentrations due to solubility and adsorptionconstraints, or (2) alkaline pH values, calcite saturation, and low cationic metalconcentrations but potentially elevated concentrations of arsenic and selenium(Davis and Eary 1997; Eary 1998). In either case, the total dissolved solidsconcentrations will continue to increase over time in terminal pit lakes due toevapoconcentration (Fig. 3.34). Pit lakes formed in Carlin-type gold deposits areexamples of circumneutral to alkaline pit lakes with occasional instances of ele-vated arsenic and selenium (Davis and Eary 1997; Eary 1998).
For pit lakes with high influxes of acid equivalents from wallrocks compared togroundwater inflow, the initial and long-term water quality can be expected to beacidic, with high total dissolved solids (TDS) due to elevated metal concentrationsand sulfate (Fig. 3.34; Eary 1999). The pH will most commonly stabilize over timebetween 2.5 and 4, but the TDS will continue to increase due to evapoconcentration(Fig. 3.34). Over the long-term, some amount of microbial activity in the sedimentsof anoxic lower layers of meromictic lakes may produce small increases in pH anddecreases in metal concentrations due to sulfate reduction, but the lakes are likely toremain acidic in the absence of remedial measures due to their large volume and theisolation of meromictic waters from shallower lake layers. The acidic pit lakes of theIberian Pyrite Belt (Sánchez-España et al. 2008) associated with polymetallicmassive sulfide deposits and the former Spenceville pit lake (Levy et al. 1997),which formed in a silicic polymetallic vein deposit, are examples of terminal pitlakes with high rates of acid influx and evapoconcentration.
Bowell and Parshley (2005) documented the existence of a variety of secondaryiron sulfates and arsenic oxyhydroxides on pit wallrocks that may act as sources ofeasily leachable metals to pit lakes during the initial stages of pit infilling andpotentially on a seasonal basis thereafter. Pit lakes receiving high initial loads ofmetals and sulfate from the wash off of oxidation products may initially haveacidic pH values that eventually rise as the effects of the wash off of acidic solutesdiminish and the pit walls become inundated, slowing further sulfide mineraloxidation (Fig. 3.34). The TDS trends for this situation may show an initial periodof decrease due to dilution from inflowing groundwater with lower TDS con-centrations, but over time, the trend for TDS will be upward (Fig. 3.34). This typeof TDS trend may be most applicable to arid climate pit lakes.
Flow-through and terminal pit lakes with high influxes of acidity from wall-rocks relative to groundwater inflow are likely to remain acidic in the absence of
3.2 Limnochemistry of Water and Sediments of Acidic Pit Lakes 89
remedial measures (Fig. 3.35). Conversely, flow-through pit lakes with low acidloads from wallrocks and high influxes of alkalinity from groundwater are mostlikely to have circumneutral pH values. An important difference with terminal pitlakes is that TDS concentrations in flow-through pit lakes will only increase untilthe lake reaches hydrologic steady state with the groundwater system (Fig. 3.35).At that point in time, the TDS should stabilize as a balance is reached betweenchemical inputs and losses to and from the pit lake. The Berkeley pit lake is anexample of an eventual flow-through system in which total solute concentrationshave slowly increased over time as the lake approaches its hydrologic spill-overpoint (Gammons and Duaime 2006), although its water quality dynamics are alsoaffected by water management systems associated with metal extraction andinflows from underground workings. An important consideration for both terminaland flow-through pit lakes is that the time scale for the dynamics in chemicalprocesses may be different from hydrologic processes (Schafer and Eary 2009).A flow-through pit lake may reach hydrologic equilibrium in a relatively shortperiod of time, but various chemical processes and water column dynamics interminal pit lakes may continue to evolve and result in changes in water quality.
3.2.2.7 Water Column Dynamics
It is generally recognized that metal-mine pit lakes have substantially differentshapes than natural lakes. Pit lakes tend to have lower ratios of surface area todepth and are steep-sided compared to natural lakes. This difference is evident in acomparison of relative depths for pit lakes. (Relative depth is defined by Wetzel(2001) as the ratio of the maximum depth to the average diameter, in percent.
2
3
4
5
6
7
8
0
2
4
6
8
10
12
14
16
18
pH
TD
S (
g/L
)
Time
Scenario 2:pHTDS
Scenario 1:pH
TDSScenario 3: pH
TDS
Fig. 3.34 Generalized time trends in pH and TDS for terminal pit lakes for Scenario 1—highgroundwater alkalinity and low wallrock acidity; Scenario 2—high wallrock acidity andlow groundwater alkalinity; and Scenario 3—moderate groundwater alkalinity with initial acidwash off
90 3 Limnology of Pit Lakes
See also Sect. 2.1) Natural lakes usually have relative depths in the range of 2% orless, whereas metal-mine pit lakes have much higher values, from 15 to 45%(Castendyk 2009). Highwalls, which are common on one or more sides of pitlakes, may also decrease the transfer of wind energy to the lake surface, decreasingthe potential for mixing of the water column.
Based on these general characteristics, it has been thought that pit lakes shouldbe more likely to be permanently stratified (meromictic) than natural lakes, whichcommonly experience seasonal overturn (holomictic), and that a calculation ofrelative depth may be sufficient to predict water column dynamics (Castro andMoore 2000; Doyle and Runnells 1997; Lyons et al. 1994). However, Schultze andBoehrer (2009) and Castendyk (2009) independently showed that relative depth isa poor predictor at best of the tendency for stratification in pit lakes. For example,a plot of maximum depths against surface areas for metal-mine pit lakes showsthat, as might be expected, meromictic lakes tend to have slightly higher depthsthan holomictic lakes, there is a great deal of overlap between the two sets of data(Fig. 3.36). Many steep-sided pit lakes have high depths and small surface areasyet show holomictic water column dynamics. These data indicate that while theshape of a pit lake undoubtedly has an important influence on the water columndynamics, numerous other factors, such as the chemistry and density of lake waterinputs, climate, and hydrology, are also important (see also Sect. 3.1).
The data in Fig. 3.36 show that predicting whether a pit lake will becomepermanently stratified or experience seasonal or occasional overturn cannot bebased solely on shape. Knowledge of water column dynamics is important forpredicting long term water quality and designing mitigation strategies to improvewater quality. For example, a lake that experiences seasonal overturn may beexpected to remain oxygenated for most of the year. This factor that can be used toparameterize predictive models for future pit lakes or interpret water qualitymodels of existing pit lakes where redox processes are important for controllingmetal concentrations. In comparison, a pit lake that experiences permanent
2
3
4
5
6
7
8
0
2
4
6
8
10
12
14
16
18
pH
TD
S (
g/L
)
Time
pH: High wallrock acidity;
Low groundwater alkalinity
pH: Low wallrock acidity;
High groundwater alkalinity
TDS
Fig. 3.35 Generalized time trends in pH and TDS for flow-through pit lakes
3.2 Limnochemistry of Water and Sediments of Acidic Pit Lakes 91
stratification may have substantially different redox conditions and water qualitiesin different lake layers. Oxygenated conditions may exist near the surface whereasanoxic conditions may exist at depth, leading to sulfate reduction and alkalinityproduction in bottom sediments.
Permanent stratification and associated effects on biogeochemical processesmay be incorporated into approaches for improving water quality. For example,the strategies employed at the Island Copper pit lake in British Columbia haveresulted in greatly improved water quality in surface layers, even though the lakeexperienced inputs of acid mine drainage water (Pelletier et al. 2009). In a differentstudy, Colarusso et al. (2003) determined that density stratification of the watercolumn in the South Mine Pit lake at the Copper Basin Mine, Tennessee would bestable for a range of potential conditions. This result was used by Wyatt et al.(2006) to justify development of an in-pit lime treatment system to improve thewater quality of discharges from the top, low-TDS water layers.
3.2.2.8 Mineral Solubilities
Mineral and gas solubilities play an important role in affecting rates of soluterelease in pit lakes similar to contaminant attenuation processes observed in somesurface groundwater systems. Numerical models of pit lakes typically rely at leastin part on thermodynamic-based geochemical models of aqueous speciation, sol-ubility, and surface adsorption, as well as kinetic formulations for predicting waterquality trends in future pit lakes and interpreting water quality conditions inexisting pit lakes. Pit lakes, however, are dynamic systems in which both kineti-cally controlled abiotic and biotic chemical processes occur, producing conditions
0
50
100
150
200
250
300
350
400
0.1 1 10 100 1000
Max
imu
m D
epth
(m
)
Area (ha)
Meromictic
Holomictic
Fig. 3.36 Maximum lake depth versus area for meromictic and holomictic metal-mine pit lakesfrom the compilations of Castendyk (2009) and Sánchez-España et al. (2008)
92 3 Limnology of Pit Lakes
of disequilibrium that may metastably persist. Eary (1999) reviewed equilibriumtrends in pit lakes to provide guidance to numerical modelers about which solu-bility reactions are reasonably well represented by chemical equilibrium and whichare more likely to be affected by kinetic processes.
A summary of potential solubility controls for different solutes from Eary(1999) and supplemented by a few more recent studies is given in Table 3.8. Thereview by Eary (1999) showed that sulfate is the dominant solute in most metal-mine pit lakes, especially acidic pit lakes, and sulfate concentrations are typicallylimited by gypsum solubility. Gypsum is indicated to be a solubility control basedon its trend in saturation indices calculated for a number of metal-mine pit lakes asa function of sulfate concentration (Fig. 3.37). Other important solubility controlsfor major ions indicated from saturation indices were calcite, fluorite, and barite. Inaddition, the data trends from numerous acidic pit lakes indicated that reasonablywell defined solubility controls include alunite for aluminum, ferrihydrite for iron,and manganite and birnessite for manganese. Schwertmannite may also be animportant solubility control for iron in acidic pit lakes, based on evaluationsprovided by Nordstrom and Alpers (1999) and Sánchez-España et al. (2009).
Solubility controls for divalent minor metals are much less well established, butdata trends suggest otavite for cadmium, brochantite and malachite for copper,cerrusite and pyromorphite for lead, and hydrozincite and zinc silicate for zinc(Table 3.8). Concentrations of As and Se are not represented by any establishedmineral solubilities and may be primarily affected by adsorption to aluminum andiron oxyhydroxide minerals under acidic conditions. For example, Sánchez-España et al. (2008) report that arsenic concentrations are significantly lower inacidic pit lakes that have pH values within the pH stability field of schwertmannite(i.e. pH \&4) compared to pit lakes in which schwertmannite is not stable.Arsenic may also be incorporated into uncommon mixed hydroxyl sulfate min-erals, such as beudantite [PbFe3(AsO4)(SO4)(OH)6] (Romero et al. 2007).Adsorption processes are less effective for removing arsenic and selenium fromsolution in high sulfate concentrations or in higher pH (i.e. [pH 6) solutions andtheir concentrations can be expected to increase linearly with evapoconcentration.
In summary, mineral solubilities provide reasonable representations of maxi-mum concentrations for many major solutes (e.g. Ca, Mg, HCO3
-, SO42+, F, Al,
Fe3+, and Mn) in metal-mine pit lakes (Eary 1999; Eary and Schafer 2009), butthey are much less reliable for predicting the concentrations of divalent minormetals (e.g. Cd, Cu, Pb, and Zn) and metalloids (e.g. As and Se). In most cases,predictive models will need to rely on empirical formulations to represent metaland metalloid concentrations derived from either experimental, field data, and/orcomparisons to existing pit lakes in similar geoenvironmental settings.
Trend data for CO2(g) partial pressures as a function of pH for metal-mine pitlakes are shown in Fig. 3.38. These CO2(g) levels are calculated from measure-ments of pH and bicarbonate alkalinity and carbonate equilibrium speciation. Theyshow that most acidic metal-mine pit lakes can be expected to be oversaturatedwith CO2(g) compared to the atmospheric level of 10-3.5 atm (Fig. 3.38). Thedegree of oversaturation increases in acidic pH conditions and reaches about
3.2 Limnochemistry of Water and Sediments of Acidic Pit Lakes 93
Tab
le3.
8S
umm
ary
ofpo
tent
ial
solu
bili
tyco
ntro
llin
gm
iner
als
for
met
al-m
ine
pit
lake
s(B
owel
lan
dP
arsh
ley
2005
;E
ary
1999
)
Aci
dic
(pH
\&
4.5)
Cir
cum
neut
ral
(pH
&4.
5to
&7.
5)A
lkal
ine
(pH
[&
7.5)
Al
Alu
nite
,ba
salu
min
ite
Gib
bsit
e,ka
olin
ite,
allo
phan
e,se
rici
teG
ibbs
ite,
kaol
init
e,al
loph
one,
seri
cite
Alk
alin
ity
Not
appl
icab
leC
alci
teb
Cal
cite
b
As
Ads
orpt
ion
tofe
rrih
ydri
tean
dsc
hwer
tman
nite
h,
scor
odit
ej ,bu
kovs
kyit
ek,
scor
odit
e-m
ansfi
eldi
tek,
wei
lite
k,
phar
mac
olit
ekA
dsor
ptio
nto
ferr
ihyd
rite
hN
one
iden
tifi
ed
Ba
Bar
ite
Bar
ite,
wit
heri
teB
arit
e,w
ithe
rite
Cd
Non
eid
enti
fied
Ads
orpt
ion
tofe
rrih
ydri
teO
tavi
teC
aG
ypsu
mG
ypsu
mG
ypsu
m,
calc
ite
Cu
Cop
per
sulf
ates
jB
roch
anti
teg
Mal
achi
te,
broc
hant
iteg
Fl
Flu
orit
eF
luor
ite
Flu
orit
eF
ecF
erri
hydr
ite,
schw
ertm
anni
te,
mel
ante
rite
jS
ider
ite
(Fe2
+)j
Sid
erit
e(F
e2+)j
Pb
Ang
lesi
tef ,
chlo
ropy
rom
orph
ited
,pl
umbo
jaro
site
j ,A
ngle
site
f ,ch
loro
pyro
mor
phit
ed,
adso
rpti
onto
ferr
ihyd
rite
Cer
rusi
te,
chlo
ropy
rom
orph
ited
Mn
Man
gani
te,
birn
essi
teM
nHP
O4d
Rho
doch
rosi
teS
eA
dsor
ptio
nto
ferr
ihyd
rite
iA
dsor
ptio
nto
ferr
ihyd
rite
Non
eid
enti
fied
Str
onti
umC
eles
tite
Cel
esti
te,
stro
ntia
nite
Cel
esti
te,
stro
ntia
nite
Sul
fate
Gyp
sum
,co
piap
itek
,m
elan
teri
tek,
mir
abol
itek
,ha
lotr
ichi
te-p
icke
ring
itek
Gyp
sum
Gyp
sum
Zin
cN
one
iden
tifi
edH
ydro
zinc
itee ,
ZnS
iO4g
ZnS
iO4g
,zi
ncit
e,sm
iths
onit
ej
aO
vers
atur
atio
nw
ith
calc
ite
isty
pica
lin
mos
tpi
tla
kes;
bO
vers
atur
atio
nw
ith
CO
2at
10-
3.5
atm
typi
call
yoc
curs
for
pH\
8.5
and
unde
rsat
urat
ion
for
pH[
8.5;
cA
ssum
edto
befe
rric
iron
;dD
epen
dent
onth
epr
esen
ceof
phos
phat
e;e
Req
uire
sth
epr
esen
ceof
carb
onat
eal
kali
nity
;fR
equi
res
rela
tive
lyhi
ghsu
lfat
eco
ncen
trat
ion
such
asth
ose
reac
hed
atgy
psum
satu
rati
on;g
Req
uire
sth
epr
esen
ceof
diss
olve
dsi
lica
near
orap
proa
chin
gsa
tura
tion
wit
hch
alce
dony
;h
Dec
reas
esin
effi
cien
cyw
ith
incr
ease
sin
sulf
ate
conc
entr
atio
n;i
Neg
ligi
ble
for
sulf
ate
conc
entr
atio
n[
100
mg/
L;j
Fro
mco
mpi
lati
onfo
rac
idm
ine
wat
ers
inN
ords
trom
and
Alp
ers
(199
9)k
Fro
mco
mpi
lati
onof
Bow
ell
and
Par
shle
y(2
005)
94 3 Limnology of Pit Lakes
10–2 atm or about 30 times atmospheric CO2(g) for pH less than 7. These data areimportant for providing information on the levels of oversaturation that should beexpected to occur when parameterizing geochemical models of pit lakes. Modelsof metal-mine pit lakes should expect conditions of disequilibria with respect toCO2(g), particularly for lakes with pH less than the circumneutral range. This is animportant point for modelers to remember when predicting pit lake geochemistry.By specifying CO2(g) in equilibrium with the atmosphere, the model will forceCO2(g) out of solution, resulting in a higher pH than would otherwise be calculated.This can lead to predicted higher pH values than observed pH values.
3.2.2.9 Surface Adsorption
At a microscopic scale, charged ions and molecules are attracted to electrically-charged surfaces of suspended particulate matter (SPM) within pit lake water. Posi-tively-charged cations (e.g. Cu2+, Pb2+, Zn2+) are attracted to negatively-chargedsurfaces, whereas negatively-charged anionic metalloids (e.g. SeO4
2-, SeO32-,
AsO33-, AsO4
3-) are attracted to positively-charged surfaces. Once the ion or mol-ecule adsorbs onto a surface, it will remain there until the pH of the surroundingsolution changes or the SPM decomposes. Under optimal conditions, the water qualityof a pit lake may improve due to metal adsorption to SPM and the SPM settles to thebottom of the pit lake where it is buried. With this goal in mind, improving waterquality via surface adsorption forms the basis of many contemporary remediationstrategies for pit lakes (Kalin and Wheeler 2009; Pelletier et al. 2009).
Hydrous ferric oxides (HFO), such as ferrihydrite and schwertmanite, which areproduced by the oxidation of iron sulfides in acidic pit lakes, typically provideabundant surface area for adsorption. Webster et al. (1998) discuss the effects ofsurface adsorption on the water quality of acid mine drainage. Castendyk andWebster-Brown (2007b) demonstrate the effects of surface adsorption on predictedpit lake water quality by comparing As, Cd, and Cu concentrations modeled
-3
-2
-1
0
1
0 1 2 3 4 5 6
Gyp
sum
Sat
urat
ion
Inde
x
Sulfate (g/L)
Fig. 3.37 Gypsum saturationindices for metal-mine pitlakes (Eary 1999)
3.2 Limnochemistry of Water and Sediments of Acidic Pit Lakes 95
without surface adsorption to concentrations modeled with surface adsorption ontofreshly precipitated ferrihydrite.
The surfaces of other particles, such as Al and Mn hydroxides and claysminerals (e.g. smectite, illite, kaolinite) that develop surface charges in response tocation substitutions may also be adsorption substrates. Furthermore, the surfaces ofsuspended organic matter, such as phytoplankton and diatoms spines, provideadsorption sites; hence, some remediation strategies endeavor to stimulate bio-logical productivity of pit lakes by the addition of nutrients (Kalin and Wheeler2009; Pelletier et al. 2009).
General depictions of percent adsorption of various dissolved cations andanionic metalloids onto a sample of HFO as a function of pH (Figs. 3.39 and 3.40partially explain why low pH pit lakes tend to have elevated concentrationsof cationic metals whereas high pH pit lakes may exhibit elevated concentrationsof anionic metalloids (see below). However, these diagrams should only be used asgeneral indicators of adsorption trends as each pit lake will contain differentsurface adsorption surfaces and different water chemistry.
3.2.2.10 Sediment Biogeochemical Processes
Geochemical processes occurring in bottom sediments have the potential to affectmetal cycling in metal-mine pit lakes in ways similar to natural water bodies.These reactions are driven in large part by the oxidation of carbon catalyzed bymicrobial processes. In simple terms, the oxidation of organic carbon can bedescribed by:
Corganic þ 2H2O ¼ CO2 þ 4Hþ þ 4e� ð3:20Þ
In the anaerobic environment at the bottom of a pit lake, anaerobic microor-ganisms derive energy from the oxidation of organic carbon coupled with the fol-lowing reduction reactions, which are listed in order of decreasing redox potential:
While these types of reactions are well established as important controls onsediment chemistry, there are few investigations specific to metal-mine pit lakesavailable in the literature that can be used to develop detailed understanding ofsediment mineralogy, chemical composition, pore water chemistry, biogeochem-istry, and their effects on water quality. Information gleaned from a few availablestudies is summarized in Table 3.9, although most of these studies were focused
pH
80
60
40
20
0
% A
dso
rpti
on
2 4 6 8 10 12
Pb2+
Cu2+
Zn2+
Cd2+
100Fig. 3.39 Approximateadsorption of cations ontogeneric HFO as a function oflake pH (after Drever 2002,with data from Dzombak andMorel 1990)
100
pH
80
60
40
20
0
% A
dsor
ptio
n
2 4 6 8 10 12
SeO42-
andSO4
2-
AsO33-
SeO32- AsO4
3-
? ?
Fig. 3.40 Approximateadsorption of anionic metalsonto generic HFO as afunction of lake pH (afterDrever 2002, with data fromDzombak and Morel 1990)
3.2 Limnochemistry of Water and Sediments of Acidic Pit Lakes 97
on acidic, stratified (i.e. meromictic) pit lakes. The common characteristics of thelakes summarized in Table 3.9 are acidic compositions, seasonal or permanentstratification, oxygenated upper portion of the water column, and anoxic condi-tions at depth and in sediments. Iron and aluminum oxyhydroxide and sulfateminerals are commonly found in sediments along with gypsum. These mineralsare most likely to have formed as secondary phases in wallrocks and carried into thepit lakes by erosion or formed in the water column and subsequently settled to thebottom. Triantafyllidis and Skarpelis (2006) also report the presence of a number ofmetal sulfate minerals present as a thin layer of precipitants in the bottom of ashallow, highly acidic pit lake that is oxygenated throughout the water column.
Accompanying the anoxic conditions at depth are increases in pH in the sedi-ment pore water relative to the overlying water column and occasional presence ofhydrogen sulfide (Table 3.9). These characteristics are indicative of biologically-mediated reduction of sulfate and Fe3+, potential for release of metals due toreductive dissolution of metal oxyhydroxides, and potential for re-precipitation ofsome metals as metal sulfides. Biological reduction of sulfate requires an energysource for microbial activity in the form of organic carbon. However, there are fewdata on organic carbon levels in metal-mine pit lakes. Levy et al. (1997) found lowconcentrations of dissolved organic carbon (DOC) in the water column of theacidic Spenceville pit lake, although concentrations were greater in the sedimentpore water (Table 3.9). Levy et al. (1997) speculated that the low DOC levels incombination with high Fe3+ levels limited the extent to which microbial processesresulted in sulfate reduction in the sediments of the Spenceville pit lake. Cameronet al. (2006) reported low DOC concentrations in the water column but relativelyhigh concentrations in the sediment pore water from the acidic Berkeley pit lake(Table 3.9). However, there is little evidence of sulfate reduction in the Berkeleypit lake sediments, which Cameron et al. (2006) interpreted as an indication thathighly acidic, metal laden conditions are hostile to supporting high populations ofsulfate-reduction bacteria. In contrast, the less acidic Udden pit lake shows lowTOC and evidence of some amount of sulfate reduction. Some of the highly acidicpit lakes of the Iberian Pyrite Belt also show increased pH values in sedimentscompared to the overlying water column and hydrogen sulfide has been detected insome deep water samples, indicative of sulfate reduction (Sánchez-España et al.2009).
It is important to note that biogeochemical reactions do not always improvepit lake water quality. Wendt-Pottoff et al. (2004) observed that stimulation ofsediment biogeochemical processes in an acidic pit lake in Germany releasedFe2+ to the overlying water column, which in turn oxidized and counteractedneutralization.
Also, the concepts and data discussed in this chapter are directed at naturalfactors that affect water quality in metal-mine pit lakes in the absence of mitigationand remediation efforts. Many different remedial approaches exist for improvingwater quality in pit lakes. The reader is referred to the appropriate chapters orsections in this volume and also discussions in Kalin and Wheeler (2009), Pelletieret al. (2009), and Wielinga (2009).
98 3 Limnology of Pit Lakes
Tab
le3.
9S
umm
ary
ofse
dim
ent
geoc
hem
istr
ych
arac
teri
stic
sfo
rac
idic
,m
etal
-min
epi
tla
kes
Pit
lake
Lim
nolo
gypH
/Red
oxco
ndit
ions
Org
anic
carb
onS
econ
dary
min
eral
sin
sedi
men
tsR
efer
ence
Spe
ncev
ille
Pit
,C
alif
orni
abM
erom
icti
cpH
2.4–
2.9
inw
ater
colu
mn;
pH3.
42in
sedi
men
tpo
rew
ater
;D
OC
and
H2S
inse
dim
ents
DO
C:
7m
g/L
wat
erco
lum
n;D
OC
:11
0m
g/L
inse
dim
ent
pore
wat
erJa
rosi
te,
gyps
uma ,
unid
enti
fied
amor
phou
sA
lph
ase
Lev
yet
al.
(199
7)
Kir
ki(A
gios
Fil
ippo
s)P
it,
Gre
ece
Not
repo
rted
pH2.
9–3.
1in
wat
erco
lum
n;ox
idiz
ing
Not
repo
rted
Jaro
site
,w
roew
olfe
ite,
beav
erit
e,gy
psum
,an
gles
ite,
scor
odit
e,bu
kovs
kyit
e,go
ethi
te,
mel
ante
rite
,ro
zeni
te,
butl
erit
e
Tri
anta
fyll
idis
and
Ska
rpel
is(2
006)
McL
augh
lin
Sou
thP
it,
Cal
ifor
nia
Hol
omic
tic
pH4
inw
ater
colu
mn;
anox
icin
low
erla
kela
yers
Not
repo
rted
Fer
rihy
drit
efl
ocin
wat
erco
lum
nad
sorb
sA
san
dS
bR
ytub
aet
al.
(200
0)
Udd
enP
it,
Sw
eden
Dim
icti
cpH
4.8
insu
rfac
ein
crea
sing
to6.
4at
the
bott
omof
wat
erco
lum
n;an
oxic
inlo
wer
lake
laye
rs;
incr
ease
dF
e,A
s,an
dM
nw
ith
dept
h
TO
C:
0.4–
0.6
mg/
Lin
surf
ace
laye
rsin
crea
sing
to2.
7m
g/L
atde
pth
Fer
rihy
drit
ea ,gi
bbsi
tea
Ram
sted
tet
al.
(200
3)
Ber
kele
yP
it,
Mon
tana
Mer
omic
tic
(may
have
been
holo
mic
tic
inth
epa
st)
pH3.
1–3.
4in
sedi
men
tpo
rew
ater
;an
oxic
atde
pth
TO
C:
0.3–
0.4%
inse
dim
ents
;D
OC
:2.
5–4.
5m
g/L
inw
ater
colu
mn
and
50–3
80m
g/L
inse
dim
ent
pore
wat
er
Jaro
site
,gy
psum
,A
lOH
SO
4a,
schw
ertm
anni
te(w
ater
colu
mn)
aT
wid
wel
let
al.
(200
6;C
amer
onet
al.
2006
)
Num
erou
spi
tla
kes
ofth
eIb
eria
nP
yrit
eB
elt
Mer
omic
tic
and
holo
mic
tic
pH1.
2–4.
7in
wat
erco
lum
n;ty
pica
lly
oxid
izin
gin
surf
ace
wat
erla
yers
and
anox
icat
dept
h;ev
iden
ceof
Fe3
+an
dS
O4
redu
ctio
nin
sedi
men
tsin
the
form
ofH
2S
odor
Not
repo
rted
(Fer
rihy
drit
e,al
unit
e,sc
hwer
tman
nite
,jar
osit
e,gi
bbsi
te,
jurb
anit
e)c ;
Effl
ores
cent
min
eral
son
shor
elin
esin
clud
egy
psum
,pi
cker
ingi
te,
and
hexa
hydr
ite
Sán
chez
-Esp
aña
etal
.(2
008;
2009
)
aIn
ferr
edfr
omso
lubi
lity
calc
ulat
ions
bS
penc
evil
lepi
tw
asba
ckfi
lled
in20
01c
Infe
rred
from
elem
enta
lan
alys
esof
coll
oids
coll
ecte
dfr
omth
ew
ater
colu
mn
and
solu
bili
tyca
lcul
atio
ns
3.2 Limnochemistry of Water and Sediments of Acidic Pit Lakes 99
3.2.2.11 Water Quality Trends
Inspection and analysis of data trends from existing metal-mine pit lakes canprovide useful knowledge about important factors affecting water quality, such asore deposit type, geochemical processes, and hydrologic cycles. However, thereare no publicly accessible, comprehensive international databases on pit lake waterquality currently in existence that can be used for thorough assessment of chemicaltrends. Various amounts and detail on water quality data are available in openliterature reports and scientific papers for individual and collections of pit lakes.The water quality data collected for this paper and discussed below are summa-rized in Table 3.10. Data from these sources were compiled for the purpose ofsummarizing trends in water quality and comprise 144 water quality analyses for49 pit lakes. This dataset is predominantly reflective of pit lakes formed in goldmines in the western U.S. and is relatively old. Hence, it is recognized that thesedata represent, at best, only snapshots of water quality at the time of study and thusnot a completely accurate representation of all types and variabilities of all types ofmetal-mine pit lakes. However, taken together, these water quality data do provideuseful context for identifying trends generally common to metal-mine pit lakes.
TDS is an important parameter in the evaluation of water quality trends toprovide context for more detailed inspection of other solutes, such as metals(discussed below). Figure 3.41 shows a plot of TDS as a function of pH for metal-mine pit lakes where the data are categorized according to the ore deposit type.The TDS concentration can be strongly affected by evapoconcentration; hence, theage of the pit lake may be an important factor. The data shown in Fig. 3.41represent lakes at all ages of maturity. While the factor of age may obscure somedetails in TDS trends, the data in Fig. 3.41 indicate that elevated TDS concen-trations occur most frequently under acidic conditions (pH \& 4.5), although afew alkaline (pH [& 7.5) pit lakes also show elevated TDS (Fig. 3.41). Lakeswith a pH between pH 4.5 and 7.5 generally have low TDS concentrations.Overall, the highest TDS concentrations occur for acidic pit lakes formed at minesof massive sulfide, high sulfidation polymetallic vein, and porphyry types ofdeposits.
A closer inspection of the major components of TDS indicates that thepercentage comprised of sulfate increases as TDS increases (Fig. 3.42). The per-centage of TDS as alkalinity decreases as TDS is increased as it is increasinglysupplanted by sulfate. Sulfate is, by far, the dominant solute in nearly all pit lakeswith highly elevated TDS concentrations. The majority of the high TDS, highsulfate pit lakes included in the datasets shown in Figs. 3.41 and 3.42 are acidic.A direct reflection of high acidity can be seen by the increase in the percentage ofTDS comprised of metals (Al ? Fe ? Mn) with an increase in TDS. These metalscomprise 5–20% of the TDS concentrations in most acidic pit lakes, such as thoseof the Iberian Pyrite Belt in Spain (Sánchez-España et al. 2008) and the Berkeleypit lake in Montana (Pellicori et al. 2005). These highly acidic pit lakes containpredominantly acidic sulfate solutions in which metals, sulfate, hydrogen ion, andto a lesser extent, base cations, make up most of the TDS concentrations.
100 3 Limnology of Pit Lakes
Tab
le3.
10S
umm
ary
ofw
ater
qual
ity
data
sour
ces
for
met
al-m
ine
pit
lake
s
Dep
osit
Pit
lake
sL
ocat
ion
Num
ber
ofw
ater
qual
ity
valu
es
Ref
eren
ce
Low
sulfi
dego
ld-
quar
tzde
posi
tH
arva
rdC
alif
orni
a1
Ash
ley
and
Sav
age
(200
1)
Vol
cano
geni
clo
wsu
lfida
tion
Sle
eper
Nev
ada
8D
owli
nget
al.
(200
4)
Qua
rtz
adul
aria
Bos
s,A
uror
a,T
usco
raN
evad
a25
Pri
ceet
al.
(199
5)C
arli
n-ty
peC
orte
z,B
igS
prin
gs,
Ade
laid
e,G
etch
ell
(sou
th,
cent
er,
nort
h)N
evad
a16
Pri
ceet
al.
(199
5)
Por
phyr
yY
erin
gton
,L
iber
ty,
Rut
h,K
imbl
ey,
Cyp
ress
-T
onap
ah,
Ana
cond
a,B
erke
ley
Nev
ada
Mon
tana
35B
ird
etal
.(19
94;D
avis
and
Ash
enbu
rg19
89;
Mac
Don
ald
1993
;P
rice
etal
.19
95;
Pel
lico
riet
al.
2005
)Q
uart
zal
unit
eK
etch
upF
lat
Nev
ada
6P
rice
etal
.(1
995)
Ska
rnF
orti
tude
Nev
ada
3P
rice
etal
.(1
995)
Hig
hsu
lfida
tion
poly
met
alli
cve
in
Spe
ncev
ille
McL
augh
lin
(sou
th,
nort
h),
Kir
kiC
alif
orni
aC
alif
orni
aG
reec
e16
Lev
yet
al.
(199
7;R
ytub
aet
al.
2000
;T
rian
tafy
llid
isan
dS
karp
elis
2006
)
Mas
sive
sulfi
de22
Iber
ian
Dis
tric
tpi
tla
kes,
Udd
en,
Eli
zabe
th(s
outh
,no
rth)
Spa
inS
wed
enV
erm
ont,
New
Ham
pshi
re34
Sán
chez
-Esp
aña
etal
.(2
008;
Ram
sted
tet
al.
2003
;S
eal
etal
.20
06)
3.2 Limnochemistry of Water and Sediments of Acidic Pit Lakes 101
Iron, Al, and Mn are most commonly the dominant dissolved metals in acidic pitlakes due to the increased solubilities of the minerals that contain these elements. Thiseffect can be seen in plots of Fe, Al, and Mn as functions of pH (Figs. 3.43, 3.44 and3.45 respectively). Iron concentrations may exceed 1,000 mg/L in the most acidic pitlakes formed in massive sulfide, polymetallic high sulfidation, and porphyry deposits(Fig. 3.43). Only total Fe concentrations are shown in Fig. 3.43, but both ferrous andferric iron are usually present when pH values are less than about 4.5 due to slowoxidation kinetics and absence of dissolved oxygen in the lower layers of acidic pitlakes. Iron concentrations tend to be low in pit lakes formed in Carlin type, quartzadularia, and low sulfidation deposits due to circumneutral to slightly alkaline pHconditions resulting from low sulfide content in the host rocks of many of the pit lakesincluded in this dataset. The secondary minerals reported to best explain iron con-centrations in acidic pit lakes are schwertmannite and ferrihydrite, whereas sideritemay be a reasonable solubility control for neutral to alkaline pit lakes (Table 3.8),depending on redox conditions. Trends in Al and Mn concentrations with pH(Figs. 3.44 and 3.45) are similar to Fe, although there are fewer data for Al, and Mnshows much more variability through the mid-pH range. Most secondary oxyhy-droxide and sulfate minerals containing Fe, Al, and Mn have amphoteric solubilities,and hence show similar trends in concentrations with pH. Secondary solids such asgibbsite and various Al-sulfates, such as jurbanite, alunite, and basaluminite, areimportant solubility controls for dissolved Al in acidic pit lakes. For slightly acidic toalkaline pit lakes, poorly crystalline clay-type minerals, such as kaolinite and allo-phane, may be the most common secondary minerals incorporating dissolved Al.
Concentration data for divalent cationic metals are shown in a Ficklin-type plotin Fig. 3.46. These metals show the expected trend of greatly increased
0
1
10
100
1
TD
S (
g/L
)
pH
Massive Sulfide Volcanogenic Low Sulfidation
Quartz Adularia Carlin Type
Porphyry Quartz Alunite
High Sulfidation Polymetallic Vein Skarn
98765432
Fig. 3.41 Trends in total dissolved solids in metal-mine pit lakes
102 3 Limnology of Pit Lakes
concentrations in acidic pit lakes formed in massive sulfide, polymetallic highsulfidation, and porphyry deposits. A number of circumneutral lakes (pH [&4.5and \&8) formed in massive sulfide and porphyry deposits also show relativelyhigh metal concentrations due primarily to Cu and Zn (Fig. 3.46). Secondaryminerals incorporating Cu and Zn are relatively soluble in the slightly acidic toneutral pH range. High solubilities allow high concentrations of these metals tooccur in pit lakes due to the combined effects of sulfide oxidation and evapo-concentration, although adsorption to iron oxides may partially moderate cationicmetal concentrations under these conditions (Fig. 3.39).
A final group of solutes is the anionic metalloids of As and Se. The trends forAs concentrations in metal-mine pit lakes show a more complex relationship to pHthan the cationic metals. Arsenic concentrations are highest at low pH, decrease totheir lowest values in the pH range from about 4.5–7, and then tend to be higher atpH [ 7 (Fig. 3.47). On the acidic end, pit lakes formed in massive sulfide depositshave the highest As concentrations due in part to the mineral arsenopyrite, whereaspit lakes formed in quartz adularia deposits tend to have the highest As concen-trations for alkaline pH conditions. Selenium concentrations show a differentpattern: the lowest concentrations (generally below detection limits) occur inacidic pit lakes and the highest concentrations occur in neutral to alkaline pit lakes(Fig. 3.48). Pit lakes formed in quartz adularia and porphyry deposits tend to havethe highest Se concentrations (Fig. 3.48).
The tendency for elevated As and Se concentrations to occur in quartz adulariaand porphyry pit lakes has been previously recognized by Shevenell et al. (1999),who examined water quality trends for 16 pit lakes in Nevada. Neither As or Seform low solubility secondary minerals under most pH conditions and theadsorption of As and Se anions is minimized under alkaline pH conditions.Because of these adsorption characteristics, the highest concentrations of As andSe tend to occur in alkaline pit lakes that have or are expected to evapoconcentrate(Eary 1998). A similar phenomenon is seen in natural evaporative lakes of the
0%
20%
40%
60%
80%
100%
0 2 4 6 8 10
Per
cen
t o
f T
DS
TDS (g/L)
Sulfate
Metals (Al+Fe+Mn)
Alkalinity
Fig. 3.42 Major components of TDS in metal-mine pit lakes expressed as percentages of TDS
3.2 Limnochemistry of Water and Sediments of Acidic Pit Lakes 103
western USA that also contain elevated alkalinities and As concentrations, such asMono Lake, California (Maest et al. 1992), Toulon and Upper Humboldt Lake,Nevada (Seiler et al. 1993), and Abert Lake, Oregon (Whitehead and Feth 1961).
3.2.2.12 Conclusions
The concentrations of solutes in metal-mine pit lakes show distinct trends that areprimarily related to pH. The pH, in turn, is a complex function of the geoenvi-ronmental characteristics, sulfide mineral content and oxidation rates, water
Fig. 3.43 Trends in total Fe concentrations with pH in metal-mine pit lakes
0.01
0.1
1
10
100
1000
10000
1 3 5 7 9
Al (
mg
/L)
pH
Massive sulfide Volcanagenic low sulfidation
Quartz adularia Carlin type
Porphyry Quartz alunite
High sulfidation polymetallic vein Skarn
Fig. 3.44 Trends in Al concentrations with pH in metal-mine pit lakes
104 3 Limnology of Pit Lakes
balance, solubilities of secondary mineral phases, water column dynamics, sedi-ment biogeochemical processes, and remediation efforts. Thus, geoenvironmentalcharacteristics can provide a useful framework for interpreting the hydrochemistryof existing pit lakes, making predictions of water quality for future pit lakes, anddesigning remedial strategies. However, there are still many areas where researchcould greatly improve our understanding of metal-mine pit lakes. A regularly
Fig. 3.45 Trends in Mn concentrations with pH in metal-mine pit lakes
0.001
0.01
0.1
1
10
100
1000
10000
1 3 5 7 9
Cu
+Cd
+Pb
+Co
+Ni+
Zn
(mg
/L)
pH
Massive sulfide Volcanagenic low sulfidation
Quartz adularia Carlin type
Porphyry Quartz alunite
High sulfidation polymetallic vein Skarn
Fig. 3.46 Ficklin plot of divalent cationic metal concentrations with pH in metal-mine pit lakes
3.2 Limnochemistry of Water and Sediments of Acidic Pit Lakes 105
updated, international database on water quality from existing pit lakes in differenttypes of mining regions, deposit types, metal resource, climate, and hydrologicenvironment could be valuable for identifying important factors affecting waterquality, testing numerical models, and tracking remediation effectiveness. Inaddition, detailed studies on metal and nutrient cycling in the water column andsediments of pit lakes are needed to better understand the role of biogeochemicalprocesses on water quality.
0.001
0.01
0.1
1
10
100
1000
1 2 3 4 5 6 7 8 9
As
(mg/
L)
pH
Massive sulfide
Volcanagenic low sulfidation
Quartz adularia
Carlin type
Porphyry
Quartz alunite
High sulfidation polymetallic vein
Skarn
Fig. 3.47 Trends in As concentrations with pH in metal-mine pit lakes
Fig. 3.48 Trends in Se concentrations with pH in metal-mine pit lakes
106 3 Limnology of Pit Lakes
3.3 The Biology and Ecosystems of Acidic Pit Lakes
Katrin Wendt-Potthoff
Acid Pit Lakes as Special Habitats
Compared to typical acid mine drainage and chemically-similar hydrothermalsolutions, the ionic composition of acid pit lakes is generally less concentrated, dueto dilution of acid-generating oxidation products with groundwater or rainwater.The dissolved metal concentrations are typically elevated compared to naturallakes, but not necessarily at levels considered toxic for freshwater biota—thisdepends largely on the origin of the pit (lignite/coal versus metal ore mining, Sects.2.2 and 3.2). As in natural lakes, stratification and mixis depend on the ambientclimate, but also on the chemical influence of catchment and in-lake processes(Sects. 3.1 and 3.2.2). Iron and sulfur cycling determine the biogeochemistry,especially in the anoxic zones, in contrast to natural freshwater lakes, where themain anaerobic process is typically methanogenesis. The high iron concentrationsof pit lakes also bring about significant photochemical reduction of Fe(III) nearthe lake surface, which is coupled with photochemical oxidation of dissolvedorganic carbon, a process that further diminishes the available organic carbon fororganisms. The food webs of acidic pit lakes have much fewer levels and speciesthan those of natural freshwater lakes. This makes them interesting locations forstudying fundamental ecological processes. Therefore, the trophic interactions andflow of energy have been comprehensively investigated (Sect. 3.3.1.4). Much less isknown about the taxonomy and physiology of bacterioplankton components andfungi in the water column, since microbiological studies have mainly focused onthe sediments, where anaerobic, alkalinity-generating processes are common.Besides their extreme chemistry, many pit lakes are quite young (decades or years),which might also explain deficits in their colonization.
3.3.1 Plankton
3.3.1.1 Phytoplankton
Dieter Lessmann and Brigitte Nixdorf
Phytoplankton plays a key role in the biocoenotic structure of lakes—in acidic lakesjust as in pH neutral lakes, although the importance of biotic factors decreases withincreasing acidity, in contrast to abiotic conditions (Arnott and Vanni 1993).Phytoplankton species composition, in terms of species-related characteristics suchas size, edibility, preferred nutrient sources, together with species abundance andbiomass, profoundly influence other trophic levels (see also Sect. 3.3.1.4).
3.3 The Biology and Ecosystems of Acidic Pit Lakes 107
Phytoplankton coenoses of acidic pit lakes differ considerably from those oflakes in the circumneutral pH range due to their low species diversity, low bio-mass, different seasonal patterns, and utilization of resources. This is similar tofindings for the phytobenthos of these lakes and of rivers and lakes that areacidified by acid mine drainage (AMD) or from volcanic sources.
During the past 15 years, scientists from different institutions have focussedtheir research on acidic pit lakes in the Lusatian and central German lignite miningdistrict in the southeastern part of Germany, where this specific type of lake isrelatively abundant. Other acidic water bodies that have been studied intensively bylimnologists recently include streams in the Iberian Pyrite Belt (e.g. Sabater et al.2003; Aguilera et al. 2007), streams affected by AMD in New Zealand (e.g. Niyogiet al. 1999, 2002; Bray 2007), and lakes and streams influenced by volcanism in theArgentinean Andes (e.g. Beamud et al. 2007; Pedrozo et al. 2010).
Species Diversity and pH
The biocoenotic structures of acidic lakes are determined by multiple abioticstressors (Frost et al. 1999; Nixdorf et al. 2003b), which becomes especiallyevident in the correlation of species diversity with pH (Fig. 3.49). The planktoncoenosis is less diverse as pH decreases, and the structure of the food web becomessimpler (see also Sects. 3.3.1.2 and 3.3.1.4). Only a small number of phyto-plankton species tolerate the high proton and metal concentrations; the latter aresite-specific and of different composition and importance. The loss of biodiversityand its effects are also well known from waters acidified by acidic deposition,whose lowest pH is around 3.5 (e.g. Baker and Christensen 1991; Matschullat et al.1994; Steinberg and Wright 1994).
In Lusatian pit lakes, which have been regularly sampled for several years, thenumber of phytoplankton taxa in the pH range 2.5–3 is mostly between 7 and 9,whereas at pH values around 4, the taxa number increases to 17–25 (Fig. 3.49;Lessmann and Nixdorf, unpubl.; 2000). The majority of these algae belong to thenanoplankton or picoplankton (20–2 and 2–0.2 lm, respectively). These groupsare usually underestimated in Lugol’s samples (Sorokin 1999; Woelfl and Whitton2000), and many algae have not yet been identified to the species level due to alack of distinctive morphological characteristics. Comprehensive molecularbiological studies are needed. The approach of Aguilera et al. (2007) for theinvestigation of the eukaryotic benthic community of Rio Tinto is an example howmolecular approaches and traditional techniques can be combined to analyse thebiocoenoses of acidic waters with greater accuracy.
Algal Communities at a pH of About 3
Most acidic pit lakes have a pH of about 3 due to iron buffering (Geller et al.1998; Totsche et al. 2003). In Lusatian pit lakes with pH B 3, the typicalphytoplankton community is dominated by the genera Ochromonas and
108 3 Limnology of Pit Lakes
Chlamydomonas (Table 3.11; Lessmann et al. 2000; Nixdorf et al. 1998). Bothare ubiquitous taxa in waters acidified by AMD (Lackey 1939; Sheath et al.1982). Chlamydomonas acidophila is probably the only widespread species ofits genus in these lakes and can be the most abundant phytoplankton taxon(Spijkerman 2008; Spijkerman et al. 2007). It is also a very common species inother extremely acidic waters, such as volcanic lakes, which can have evenlower pH ranges than acidic pit lakes (Rhodes 1981; Satake and Saijo 1978;Sheath et al. 1982; Twiss 1990). The genus Ochromonas, with six morpho-logically distinct types, was eudominant in all lakes surveyed by Lessmannet al. (2000), who found that it constituted more than 50% of the annual totalbiovolume. Lepocinclis teres, Euglena mutabilis and Chromulina sp. can alsobe found frequently in several lakes. Two phytobenthic diatom species, Eunotiaexigua and Nitzschia sp., occurred in most samples, but their contribution tototal phytoplankton biomass is low in deep lakes (Lessmann et al. 2000).E. mutabilis is especially abundant in the littoral zone of the lakes, formingdense mats on the sediment surface (Kapfer 1998a, b).
Nevertheless, there is high variability in the phytoplankton community. Recent datashow that Peridinium umbonatum and Scourfieldia cordiformis can be common in someof these lakes, in addition to Chlamydomonas and Ochromonas, and can represent ahigh portion of the annual total biovolume (Lessmann and Nixdorf, unpubl.).
In acidic pit lakes of the central German mining district around Leipzig, with apH of 2.7–3.3, the dominant taxa, before remediation, were Ochromonas andChlamydomonas, together with Cryptomonas and Chrysococcus, respectively(Rönicke et al. 2001, 2010). Another pit lake in that region that had a pH 3.4–3.6was inhabited by five phytoplankton species, with Chlamydomonas being the mostdominant, followed by Chrysococcus (Rönicke et al. 2002).
Many diatom species are unable to maintain a population at pH values below4.5. DeNicola (2000) reviewed the occurrence of diatom species at pH B 3.5.He identified less than nine species as real inhabitants in this pH range, mostbelonging to the phytobenthos.
2.0 2.5 3.0 3.5 4.0 4.50
10
20
30
taxa
num
ber
pH
Fig. 3.49 Relationshipbetween the number ofphytoplankton taxa and themean pH of 17 acidic pitlakes in Lusatia regularlysampled for several years,based on microscopicanalyses
3.3 The Biology and Ecosystems of Acidic Pit Lakes 109
Usually, Cyanobacteria are absent in such acidic water. Steinberg et al. (1998)detected the phycobilins phycocyanin and phycoerythrin (using fluorescence signalsin flow-cytometry) in a pit lake with pH 3.0 and attributed them to filamentousCyanobacteria. However, these fluorescence signals could not be assigned tospecific cells by direct microscopic evidence (Whitton, Wendt-Potthoff, pers.comms.); so the detected pigment fluorescence might have come from eukaryoticalgae with phycobilins (Rhodophyta, Cryptophyta, Glaucophyta). Unquestionableis that the green sulphur bacterium Chlorobium limicola can occur in extremelyacidic waters (Overmann, pers. comm.).
The phytoplankton inhabitation of extremely acidic pit lakes can be comparedwith acidic volcanic water systems and streams receiving AMD. An unknowngreen alga occurs in high densities in the Indonesian crater lake Kawah Ijen withpH \ 0.3 (Löhr et al. 2006). Ch. acidophila is known to be highly productive inthe Japanese volcanic lake Katanuma at a pH of 1.9 (Satake and Saijo 1974).
The volcanic Río Agrio/Lago Caviahue acidic water system in the Argentinean Andeshas been studied intensively for more than 10 years. The system comprises a crater lakefrom which the upper Río Agrio originates, which has a pH gradient of 0.4–1.5, LagoCaviahue, with a pH of about 2.3, and the lower Río Agrio (Pedrozo et al. 2010).In contrast to most pit lakes, the waters are rich in metals and phosphorus. The chemistryvaries due to fluctuations in the activity of the volcano Copahue. While the crater lakelacks any phototrophic organisms, the upper Río Agrio is inhabited predominantly bythe Chrysophycean genus Gloeochrysis (Table 3.12), which contributes 99% of therelatively low epilithon biomass, which totals\5 mg m-2 Chl-a (Baffico 2007; Bafficoet al. 2004). The Chlorophycean species Keratococcus rhaphidoides represents morethan 90% of the total annual abundance in Lago Caviahue, with eight other algal taxaalso present (Table 3.12; Beamud et al. 2007; Pedrozo et al. 2001, 2010).
Table 3.11 Presence and dominance of phytoplankton taxa that occur in pit lakes with pH B 3.Data are based on 14 pit lakes of the Lusatian mining district
Class Taxon Presence (%) Dominance
Chrysophyceae Chromulina sp. 53 subd–euOchromonas spp. (6 types) 100 eu
Range of mean dominance: eu (dominant) with [10% of the total annual biovolume; dom(inant)with 5–10%; subd(ominant) with 2–5%; rec(edent) with 1–2%; subr(ecedent) with\1% (acc. toSchwerdtfeger 1975; after Lessmann et al. 2000)
110 3 Limnology of Pit Lakes
In addition to high acidity and high metal concentrations, autotrophs in streamsthat receive AMD are usually confronted with metal oxide deposition, which cancover all substrates where flow velocity is low (Bray 2007; Niyogi et al. 1999,2002). Bray (2007) analysed the effects of AMD on algae in streams that showacidity gradients and identified pH as the most important controlling factor of thealgae assemblage structure. With 15 taxa, algal diversity is low at pH \ 3.6. Thiscorresponds with the taxa number of the phytoplankton occurring in pit lakes withthe same pH range. Certain species tend to dominate, especially filamentousKlebsormidium acidophilum. Other abundant species are E. mutabilis, Naviculacincta, Microspora quadrata, and Microthamnion kuetzingianum.
The benthic eukaryotic community of Rio Tinto, with a pH between 0.9 and 2.5due to pyrite oxidation and AMD, comprises 10 algal taxa. The lowest taxanumbers are associated with the most acidic sites. Members of Chlorophyta, suchas Chlamydomonas, Dunaliella, Chlorella, and Euglena, are the most frequentspecies, forming large green patches along the riverbed. Dunaliella and Cyanidiumrelated species inhabit the most acidic site (Aguilera et al. 2007). Sabater et al.(2003) found low taxa and dominance structure fluctuations in Rio Tinto within theyear and that the dominant taxa were Klebsormidium flaccidum, Pinnularia aco-ricola, and Euglena mutabilis. In acidic effluents from abandoned mines in Por-tugal, Valente et al. (2007) observed an algal flora that was dominated by Euglenamutabilis and Klebsormidium sp.
According to these findings, the dominant phytoplankton taxa in extremelyacidic pit lakes are typically Ch. acidophila and species of the genus Ochromonas.The most common species in all kinds of extremely acidic waters is E. mutabilis.Klebsormidium appears to be a typical algal taxon in extremely acidified streams.However, large fluctuations in the biocoenotic structures can occur in theseextremely acidic waters.
Phytoplankton Communities at pH 3.5 to 5
The phytoplankton community changes with increasing pH. Compared with lakeswith a mean pH of 3 or lower, the taxa number increases and other species becomedominant. At pH 4, the most common species in Lusatian pit lakes are Peridiniumumbonatum, Cryptomonas spp., and in some lakes, Amphidinium elenkinii. Due to
Table 3.12 Algal species, pH, and electrical conductivity (EC, mS cm-1) in the upper RíoAgrio/Lago Caviahue water system (after Pedrozo et al. 2010)
Site pH EC Taxa
Crater Lake 1.2 500 (no phototrophs)Upper Río Agrio 1.3–1.8 7.9–14.2 Gloeochrysis sp., Euglena mutabilisLago Caviahue 2.3 2.1 Keratococcus raphidioides, E. mutabilis,
3.3 The Biology and Ecosystems of Acidic Pit Lakes 111
the lack of a stabilising buffering system, only a small number of these lakes showpH values between about 4.3 and 5.5. In this pH range, the phytoplanktoncommunity of Lusatian pit lakes is mostly formed by Scourfieldia cordiformis,Cryptomonas spp., Peridinium umbonatum, Amphidinium elenkinii, and Gymn-odinium sp. (Lessmann and Nixdorf, unpubl.).
A few studies have monitored changes in the phyoplankton during an increaseof pH due to remediation. Rönicke et al. (2010) found an increase in diversityslowly following the changes in pH during chemical neutralisation. The mostcommon phytoflagellates (Chlamydomonas, Ochromonas, Chrysococcus) from theextremely acidic phase continued to dominate at the beginning of lake neutrali-sation. Chromulina, diatoms (Synedra acus, Nitzschia acicularioides, Eunotiaexigua), Cryptomonads (Cryptomonas ovata, Rhodomonas minuta) as well asDinoflagellates (Peridinium umbonatum) became increasingly important duringthe following years. Cyanobacteria did not occur until circumneutral conditionswere achieved.
Kalin et al. (2006) describe the effects of pH changes in a pit lake in Canadawhere pH decreased from 5 to 3. Phytoplankton diversity dropped from 52 to42 taxa, the number of taxa with a frequency [10% from 39 to 10. OnlyOchromonas and Chlamydomonas were consistently present. Peridinium, Pinnu-laria, and Euglena were frequent during the pH 5 phase and declined at lower pH.Lepocinclis proliferated when pH decreased and metal concentrations increased.
Control Mechanisms of Primary Production and SeasonalSuccession of Phytoplankton
The biocoenotic structures are not the only difference between acidic pit lakes andcircumneutral lakes; primary production control mechanisms also differ. Intenseproductivity studies and analyses of primary production and seasonal phytoplanktonsuccession are available, especially from pit lakes of the Lusatian mining district.
Primary production is low in most lakes and does not exceed bacterial pro-duction, even during daylight. This leads to high differences on daily basis, with anaverage primary production rate of about 31 mg C m-3 d-1, in contrast with abacterial production rate of 186 mg C m-3 d-1. The algal to bacterial productionratio identifies the lakes clearly as heterotrophic systems, which results in oxygenundersaturation of the water bodies (Nixdorf et al. 2003a). Beulker et al. (2002,2004) measured autotrophic production of mining lake (ML) Plessa 117 (mean pH2.9) regularly for more than a year. Primary production rates ranged from less than1– 12.5 mg C m-3 h-1 in the upper water body. The wide range reflects the highseasonal fluctuation. With 278 mg C m-2 d-1, the mean annual lake area relatedrate was low compared with natural lakes of the region (Beulker et al. 2004).
In general, mean annual phytoplankton biomass seems to be independent of thedegree of acidification and to depend primarily on the availability of nutrients.In oligotrophic acidic pit lakes at pH values around 3 and 4, mean phytoplanktonbiovolume is within a similar range, between 0.3 and 0.7 mm3 L-1. At certain
112 3 Limnology of Pit Lakes
times of the year, maxima of 2–3 mm3 L-1 can occur (Lessmann and Nixdorfunpubl.; Nixdorf et al. 1998). As in natural pH-neutral lakes, the increase inphosphorus concentrations can significantly increase phytoplankton biomass andcan lead to eutrophication despite the high phosphorus binding capacity of theiron-rich water and sediments (Lessmann et al. 2003; Tittel and Kamjunke 2004;Woelfl et al. 2000).
Nevertheless, large seasonal fluctuations of primary production and biomass aretypical for oligotrophic acidic pit lakes and can generally be attributed to inorganiccarbon limitation rather than to changes in phosphorus concentrations. Under acidicconditions below pH 4.3, CO2 is the only available inorganic carbon source forphotosynthesis. As long as the water body is in exchange with the atmosphere, theequilibrium between water and atmosphere and the uptake by autotrophs lead todissolved inorganic carbon (DIC) concentrations that are far lower than in pH-neutralwaters with bicarbonate buffering and their high availability of inorganic carbon.
However, CO2 can accumulate in water layers isolated from the atmosphericexchange, i.e. in the hypolimnion or under ice. This can cause a fast increase inphytoplankton biomass. In contrast, during circulation periods and especially inthe epilimnion of the summer stagnation phase, CO2 concentrations are low.Increasing CO2 concentrations are typical for the hypolimnia due to the inflow ofCO2-rich groundwater and respiration and decomposition of organic matter asmajor sources. During winter, ice cover can significantly reduce inorganic carbonloss to the atmosphere and lead to an increase in DIC concentrations and inphytoplankton biomass, if there is no shading by snow.
As an example, in ML Plessa 117 a typical pattern of seasonal phytoplanktonsuccession was observed with the highest biomass in winter under an ice cover freeof snow, followed by a second phytoplankton bloom in the upper hypolimnion atthe beginning of the summer stratification and a small increase during theautumnal overturn (Fig. 3.50). In ML Plessa 117, these blooms are usually formedby a small number of species, with Ochromonas and Chlamydomonas being themost important ones. In consequence, mild winters without long-lasting ice covershow no algal bloom, and the maximum phytoplankton biomass occurs during thesummer stratification as a deep chlorophyll maximum (DCM) in the metalimnion
J F M A M J J A S O N D
20
40
60
80
100
Ph
yto
pla
nkt
on
bio
mas
s
Profile/Epilimnion Hypolimnion
with clear ice coverFig. 3.50 Scheme of theseasonal pattern ofphytoplankton biomasssuccession in ML Plessa 117(pH 2.9), usually formed byspecific algae and indicating,in particular, the significanceof the availability ofincreased inorganic carbonconcentrations forphytoplankton growth in thislake
3.3 The Biology and Ecosystems of Acidic Pit Lakes 113
and upper hypolimnion (Lessmann and Nixdorf 2002; Beulker et al. 2003;Lessmann et al. 2006). DCMs are also characteristic of other oligotrophic acidicpit lakes (Tittel et al. 2003).
In addition to pelagic primary production, benthic algae can be important con-tributors to primary production of acidic lakes. A dense layer of the diatoms Eunotiaspp. and Pinnularia obscura covers the sediment surface in a lake with pH 2.6(Koschorreck and Tittel 2002, see also Sects. 3.3.2.2 and 3.3.2.3). The micro-phytobenthos in the littoral zones of the Lusatian pit lakes Plessa ML 111, ML 108,and ML 117 is dominated by E. mutabilis, Eunotia spp., and Nitzschia paleaeformis.Chlorophyll-a concentrations, primary production rates, and specific primary pro-duction were strikingly higher at Euglena dominated sites (12–176 mg Chl-a m-2;2.99–7.84 mg C m-2 h-1; 0.30–0.47 mg C (mg Chl-a)-1h-1) than at sites domi-nated by Eunotia (1–89 mg Chl-a m-2; 0.46–3.84 mg C m-2h-1; 0.03–0.35 mg C(mg Chl-a)-1h-1) (Kapfer 1998a, b). Elevated phytobenthos production may beattributed to higher concentrations of soluble reactive phosphorus (SRP), dissolvedinorganic carbon (DIC), and dissolved organic carbon (DOC) in the sediment porewater than in the pelagic water, especially where groundwater inflow occurs(Hofmann and Lessmann 2006; Kapfer 1998a, b).
The presumed limitation of primary production by phosphorus and inorganiccarbon in ML Plessa 117 is supported by laboratory experiments. To increase thevolume-specific primary production rates, it was necessary to increase the inor-ganic carbon concentrations above 0.6 mg L-1 and the total phosphorus concen-trations above 10 lg L-1 (Beulker et al. 2002, 2004).
Calculation of the carrying capacity for autotrophic phytoplankton showschanges in primary production limitations with water depth during the summerstratification of partly meromictic ML 111. While primary production is limited byinorganic carbon in the epilimnion, phosphorus becomes the limiting nutrient inthe hypolimnion. Light limitation occurs only in the deepest parts of the lake(Fig. 3.51; Krumbeck et al. 1998).
In contrast to Lusatian mining lakes, in volcanic Lago Caviahue (pH about 2.5),primary production is primarily limited by nitrogen (dissolved inorganic nitrogen:30–150 lg L-1; compare also Berkeley Pit Lake, case study 5.5). The N:P ratioranges from 0.03 to 0.11. A seasonal succession is missing and variations can mostlybe attributed to volcanic activity. In addition to ammonium, phytoplankton biomassis also controlled by inorganic and, for mixotrophic species, by organic carbon(Pedrozo et al. 2008, 2010). Despite the lack of seasonal gradients of phytoplanktonbiomass in the water column, sometimes DCMs can be observed in the upperhypolimnion due to locally increased nutrient concentrations (Beamud et al. 2010).
Adaptation Strategies of Phytoplankton
Protists with fast asexual reproduction potential under favourable conditions formthe most important group of the phytoplankton in the most acidic pit lakes. Ch.acidophila is able to survive at pH 1.0 for short time; its limit for sustained growth
114 3 Limnology of Pit Lakes
is pH 1.5–2.0 (Pollio et al. 2005). Acidophilic algae developed different physio-logical adaptations to be able to maintain their cytoplasmatic pH in the circum-neutral range or to increase pH in the water layer adjacent to their cell surface forthe control of their osmoregulation (Pick 1999).
The two most common taxa Ch. acidophila and Ochromonas have a differentpH niche width. While Ch. acidophila is an obligate acidophilic species, Ochro-monas is acidotolerant, because Ch. acidophila has its fitness optimum underextremely acidic conditions, whereas Ochromonas grows best under moderatelyacidic conditions. That shows that in extremely acidic pit lakes, the phytoplanktoncoenosis is formed by a mixture of acidophilic specialists and acidotolerant gen-eralists (Moser and Weisse 2011).
With regard to the occurrence of light and nutrient gradients, especially the lackof inorganic carbon in the epilimnion during summer, motility and the ability forfast reproduction under optimized conditions (C-strategists acc. to Reynolds 1997)are major advantages for phytoflagellates in acidic pit lakes (Fyson and Rücker1998; Lessmann and Nixdorf 2000; Nixdorf et al. 1998).
Analysing the trophic spectrum that the dominant species are able to use, it isapparent that there is a high proportion of mixotrophs (Beulker et al. 2004; Nixdorfet al. 1998). These can either live as photoautotrophic organisms or (additionally)change to osmotrophy and feed on the organic carbon available in the water columnor on bacteria, as phagotrophic organisms. Chlamydomonas and Scourfieldiacordiformis combine phototrophy with osmotrophy; Ochromonas, Gymnodinium,Lepocinclis, and Cryptomonas combine phototrophy with phagotrophy. In thisgroup, Ochromonas can also feed on Chlamydomonas (Beulker et al. 2004;Tittel et al. 2003).
10
8
6
4
2
0
0.1 1 10 100 1000
dept
h (m
)
Fig. 3.51 Realized biomass and carrying capacity (cc) of phytoplankton expressed as Chl-a concentrations with regard to the available resources of inorganic carbon (TIC), phosphorus(TP), and light (l*) in the water column of ML 111 during summer stratification. The watercolumn is divided into the epilimnion, down to a depth of about 3 m, the hypolimnion, fromabout 3 m to about 7 m, and the monimolimnion below (after Krumbeck et al. 1998)
3.3 The Biology and Ecosystems of Acidic Pit Lakes 115
The ecosystem of ML 111 is very well investigated (see also Sects. 3.3.1.4 and 5.6).The plankton consists of single-celled and filamentous bacteria, mixotrophicflagellates with Ch. acidophila and Ochromonas, the Rotifera Elosa worallii andCephalodella hoodi, and Heliozoa as the most important taxa of the food web.Heterotrophic flagellates, Crustacea, and fish are missing; Ciliata and Rhizopoda arerare. While bacterial filaments, Ochromonas, Elosa, and Heliozoa dominate in theepilimnion, the hypolimnion is dominated by single-celled bacteria, Chlamydomonasand Cephalodella. Chlamydomonas is primarily phototrophic and limited by lightand inorganic carbon and is grazed by Ochromonas in the epilimnion. However,Ochromonas is primarily phagotrophic and controlled by prey availability (Kamjunkeet al. 2004). Tittel and Kamjunke (2004) and Tittel et al. (2005) were able to show inexperiments that the phototrophic growth of Ch. acidophila is limited at the watersurface and that the addition of DIC leads to an increase in the growth rate. Despitesignificant photosynthetic activity, the alga also reduced the high DOC concentrations.Mixotrophic phytoflagellates are also important bacterial grazers. In ML 111,Ochromonas grazes 88% of the daily bacterial production of the epilimnion and68% of that of the hypolimnion (Schmidtke et al. 2006).
Top-down control of the phytoplankton is only likely with the occurrence oflarger zooplankton in high abundance, such as Brachionus sericus and Chydorussphaericus (Wollmann and Deneke 2004; Wollmann et al. 2000); otherwise, theinfluence of higher trophic levels on phytoplankton is negligible (Lessmann et al.1999; Weithoff 2004; see also Sects. 3.3.1.2 and 3.3.1.4).
To summarize, the extreme environmental conditions of acidic pit lakes, withhigh proton and metal, and low nutrient concentrations (limitation of primaryproduction by P and C), control phytoplankton coenoses, resulting in low diversityand biomass (Fig. 3.52). On the other hand, several taxa show adaptations to theextreme habitat, especially physiological adaptations to the low pH, which allowthem to thrive there. Mixotrophy, motility, and high reproduction potential areadditional features for successful colonization of acidic pit lakes.
acidificationinitiated by pyrite oxidation
high conc. of H+, Al, other metals
effectiveP precipitation
and binding
P limitation
low biomass
phytoplankton
DIC limitationparticularly in epilimnion
advantagesfor mixotrophic
flagellates
low diversity
Fig. 3.52 Major controlmechanisms ofphytoplankton coenoses inacidic pit lakes (modifiedafter Lessmann and Nixdorf2000)
Relationship of Species Occurrence and Taxonomic Diversity to pH
Species richness of metazoan zooplankton is typically very low in acidic pit lakes,as few species can tolerate their harsh abiotic conditions (Nixdorf et al. 1998). Asin other extreme environments, one or very few species dominate, resulting in lowcommunity evenness. Regarding the taxonomic composition of zooplankton inacidic pit lakes at pH 2.3–4.5, rotifers clearly outnumber crustaceans. Cladoceraare represented by few species, but they can be important colonizers in lakes withpH C 3, whereas Copepoda are rare (Deneke 2000).
Despite unfavorable abiotic conditions, even extremely acidic lakes arecolonized by zooplankton: at pH 2.3, two rotifer species—Cephalodella hoodi andRotaria rotatoria—were observed in the pelagic zone of Lake Plessa 107—a pitlake in northeast Germany (Lessmann et al. 1999). These two species, together withElosa worallii, Cephalodella gibba, and Brachionus sericus constitute the corezooplankton community in highly acidic pit lakes with pH around 3 (Deneke 2000).A number of rotifer species from the genera Lecane, Colurella, Trichocerca,Lepadella, and Philodina are occasionally found in highly acidic pit lakes, but theyare never very abundant (reviewed in Deneke 2000). All of the acid-tolerant rotiferspecies also occur in less acidic pit lakes (Wollmann et al. 2000), above theirspecies-specific lower in situ pH thresholds (Table 3.13); however, they disappearfrom the pelagic zone of neutral and alkaline pit lakes, being replaced by a speciesassemblage typical of natural non-acidic lakes (Nixdorf et al. 1998). Chydorussphaericus (Cladocera, Chydoridae) is the most acid-tolerant crustacean speciesthat colonizes acidic pit lakes, with an in situ pH threshold of 3.0 (Wollmann et al.2000). At pH [ 3.5, two more crustaceans occur in acidic pit lakes—anothercladoceran, Scapholeberis mucronata, and the most tolerant cyclopoid copepod,Diacyclops sp. (Wollmann et al. 2000). Remarkably, calanoid copepods that oftendominate zooplankton communities in soft-water acidic lakes (Brett 1989) arecompletely lacking in acidic pit lakes.
The majority of acidic pit lakes fall into the pH range of 2–4.5. At pH 4.5–6,chemical conditions become unstable due to the lack of a buffer system; thus,weakly acidic pit lakes are rare (Nixdorf et al. 2003). Hence, field studies oncolonization patterns along the entire pH gradient from acidic to circumneutralconditions in pit lakes are methodologically hampered. The very few pit lakes witha pH range of 4.5–6 are recently or incompletely neutralized lakes, where waterchemistry has not yet stabilized. These lakes are valuable sites to study coloni-zation patterns and ecology of colonizing species under weakly acidic pit lakesconditions. For example, littoral Cladocera have been studied within a horizontalpH gradient in Lake Senftenberger See, formed within a channel connecting theacidic (pH 3) and the neutral (pH 7.5) basins of the lake (Belyaeva and Deneke
3.3 The Biology and Ecosystems of Acidic Pit Lakes 117
Tab
le3.
13Z
oopl
ankt
onsp
ecie
soc
curr
ing
inac
idic
pit
lake
san
dth
elo
wes
tin
situ
pHat
whi
chth
eyw
ere
reco
rded
Tax
onom
icgr
oup
Spe
cies
pHS
ampl
ing
site
Ref
eren
ce
Ext
rem
ely
acid
icpi
tla
kes
Rot
ifer
a,M
onog
onon
taC
epha
lode
lla
hood
i(G
osse
1896
)2.
3L
ake
Ple
ssa
107
Les
sman
net
al.
(199
9)R
otif
era,
Bde
lloi
dea
Rot
aria
rota
tori
a(P
alla
s17
66)
2.3
Lak
eP
less
a10
7R
otif
era,
Mon
ogon
onta
Cep
halo
dell
agi
bba
(Ehr
enbe
rg18
38)
2.5
Pit
lake
s,Il
lino
is,
US
AM
cCon
athy
and
Sta
hl(1
982)
Rot
ifer
a,B
dell
oide
aP
hilo
dina
sp.
2.5
Pit
lake
s,Il
lino
is,
US
AR
otif
era,
Mon
ogon
onta
Elo
saw
oral
lii
Lor
d18
912.
6L
ake
Ple
ssa
(ML
111)
Wol
lman
net
al.
(200
0)R
otif
era,
Mon
ogon
onta
Lec
ane
(Mon
osty
la)
luna
ris
Ehr
enbe
rg18
322.
6P
itla
kes
inL
usat
iaD
enek
e,un
publ
Ver
yac
idic
pit
lake
sR
otif
era,
Mon
ogon
onta
Bra
chio
nus
urce
olar
isO
.F
.M
ülle
r17
73a
2.6
Pit
lake
s,Il
lino
is,
US
AM
cCon
athy
and
Sta
hl(1
982)
Rot
ifer
a,M
onog
onon
taC
olur
ella
sp.
2.7
Pit
lake
sin
Lus
atia
Den
eke,
unpu
blR
otif
era,
Mon
ogon
onta
Tri
choc
erca
sim
ilis
Wie
rzej
ski
1893
2.7
Pit
lake
sin
Lus
atia
Rot
ifer
a,M
onog
onon
taL
ecan
est
icha
eaH
arri
ng19
133.
0P
itla
kes
inL
usat
iaR
otif
era,
Mon
ogon
onta
Lep
adel
lasp
.3.
0P
itla
kes
inL
usat
iaR
otif
era,
Mon
ogon
onta
Lec
ane
(Mon
osty
la)
bull
a(G
osse
1886
)3.
0P
itla
kes,
Illi
nois
,U
SA
McC
onat
hyan
dS
tahl
(198
2)C
lado
cera
,C
hydo
rida
eC
hydo
rus
spha
eric
us(M
ülle
r17
76)
3.0
Grü
new
alde
rL
auch
(ML
117)
Wol
lman
net
al.
(200
0)M
oder
atel
yac
idic
pit
lake
sC
lado
cera
,D
aphn
iida
eSc
apho
lebe
ris
muc
rona
ta(M
ülle
r17
76)
3.5
Gei
ersw
alde
rS
eeB
elya
eva
and
Den
eke,
unpu
blC
opep
oda,
Cyc
lopi
dae
Dia
cycl
ops
sp.
3.5
Fel
ixse
eW
ollm
ann
etal
.(2
000)
Wea
kly
acid
icpi
tla
kes
Rot
ifer
a,M
onog
onon
taP
olya
rthr
asp
.4.
7G
räbe
ndor
fer
See
Den
eke,
unpu
blR
otif
era,
Mon
ogon
onta
Ker
atel
laco
chle
aris
(Gos
se18
51)
4.7
Grä
bend
orfe
rS
eeR
otif
era,
Mon
ogon
onta
Ker
atel
late
stud
o(E
hren
berg
1832
)4.
7G
räbe
ndor
fer
See
Rot
ifer
a,M
onog
onon
taF
ilin
ialo
ngis
eta
(Ehr
enbe
rg18
34)
4.7
Grä
bend
orfe
rS
eeC
lado
cera
,D
aphn
iida
eC
erio
daph
nia
sp.
4.7
Grä
bend
orfe
rS
eeC
lado
cera
,B
osm
inid
aeB
osm
ina
core
goni
Bai
rd18
574.
7G
räbe
ndor
fer
See
Cla
doce
ra,
Chy
dori
dae
Eur
ycer
cus
lam
ella
tus
(Mül
ler
1776
)4.
9S
enft
enbe
rger
See
Bel
yaev
aan
dD
enek
e(2
007)
(con
tinu
ed)
118 3 Limnology of Pit Lakes
Tab
le3.
13(c
onti
nued
)
Tax
onom
icgr
oup
Spe
cies
pHS
ampl
ing
site
Ref
eren
ce
Cla
doce
ra,
Chy
dori
dae
Ple
urox
ustr
unca
tus
(Mül
ler
1785
)4.
9S
enft
enbe
rger
See
Cla
doce
ra,
Bos
min
idae
Bos
min
alo
ngir
ostr
is(M
ülle
r17
85)
5.0
Sen
ften
berg
erS
eeC
lado
cera
,S
idid
aeSi
dacr
ysta
llin
a(M
ülle
r17
76)
5.0
Sen
ften
berg
erS
eeC
lado
cera
,C
hydo
rida
eA
lona
affin
is(L
eydi
g18
60)
5.0
Sen
ften
berg
erS
eeC
lado
cera
,C
hydo
rida
eA
crop
erus
harp
ae(B
aird
1835
)5.
7S
enft
enbe
rger
See
Cla
doce
ra,
Chy
dori
dae
Alo
naco
stat
aS
ars
1862
5.7
Sen
ften
berg
erS
eeC
lado
cera
,D
aphn
iida
eC
erio
daph
nia
pulc
hell
aS
ars
1862
5.7
Sen
ften
berg
erS
eeC
lado
cera
,P
olyp
hem
idae
Pol
yphe
mus
pedi
culu
s(L
inne
1761
)5.
7S
enft
enbe
rger
See
Cla
doce
ra,
Chy
dori
dae
Alo
nagu
ttat
aS
ars,
1862
5.7
Sen
ften
berg
erS
eeC
lado
cera
,S
idid
aeD
iaph
anos
oma
brac
hyur
um(L
iévi
n18
48)
5.7
Sen
ften
berg
erS
eeC
lado
cera
,D
aphn
iida
eSi
moc
epha
lus
vetu
lus
(Mül
ler
1776
)6.
1S
enft
enbe
rger
See
Cla
ssifi
cati
onof
lake
sis
acco
rdin
gto
Nix
dorf
etal
.(2
005)
,sl
ight
lym
odifi
ed.
Cor
esp
ecie
sth
atdo
min
ate
zoop
lank
ton
com
mun
itie
sin
acid
icpi
tla
kes
are
unde
rlin
ed.
Lak
esar
ein
Ger
man
yun
less
othe
rwis
esp
ecifi
eda
Alt
houg
hth
issp
ecie
sw
asre
cord
edfr
omN
orth
Am
eric
anpi
tla
kes
asB
rach
ionu
sur
ceol
aris
,it
isli
kely
B.s
eric
us,w
hich
appe
ars
tobe
muc
hm
ore
acid
-to
lera
ntth
anth
efo
rmer
spec
ies.
The
obse
rved
min
imum
insi
tupH
of2.
6fo
rth
eN
orth
Am
eric
anpo
pula
tion
sdi
ffer
sfr
omth
atin
Ger
man
lake
s,w
here
this
spec
ies
has
only
been
foun
dat
apH
of2.
7an
dab
ove
(Den
eke
2000
)
3.3 The Biology and Ecosystems of Acidic Pit Lakes 119
2007). Only two cladoceran species, C. sphaericus and S. mucronata, were foundat pH below 4.9, whereas rather diverse communities occurred at pH C 4.9(Table 3.13). Dramatic changes in cladoceran species composition were observedwithin a distance of several hundred meters along the pH gradient, despite the lackof any physical barriers that might have limited the dispersal of species. Thus, theloss of species towards the acidic part of the lake can be attributed to the adverseeffects of the chemical conditions. To our knowledge, no published studies reporton the species composition of Copepoda and Rotifera within the pH range of 4.5–6in pit lakes, although both groups do occur at these conditions (Belyaeva andDeneke unpubl.; Woelfl et al. 1998).
Most zooplankton species that are found in acidic pit lakes have been recordedfrom different continents and appear to be cosmopolitan. However, it should benoted that most data on zooplankton communities come from studies on pit lakesin Germany, while less is known about the biota of these habitats outside Europe.C. hoodi, C. gibba, and B. sericus have been recorded in both European and NorthAmerican acidic pit lakes (Deneke 2000). There is a lack of detailed taxonomicstudies confirming the co-specificity of geographically distant populations.Particularly, uncertainties exist concerning the taxonomic status of B. sericus.Although Rousselet (1907) described B. sericus as a separate species, it was oftenlater regarded as a variety of B. urceolaris (e.g. Koste 1978). Hence, some recordsof B. sericus, B. urceolaris var. sericus, and B. urceolaris by different authors maypossibly refer to the same taxon. If so, it colonizes acidic hard-water lakes sepa-rated by large geographical distances, being also found in Australian billabongponds affected by mine drainage (Tait et al. 1984), geogenically acidified lakes inJapan (Uéno 1958), and in the Canadian Arctic ponds acidified by burnt bitumi-nous shales (Havas and Hutchinson 1983). On the other hand, Elosa worallii isvery common in acidic hard waters, but only in Europe (Nixdorf et al. 1998; Vallin1953), while a detailed study of North American pit lakes by McConathy and Stahl(1982) did not detect this species. C. sphaericus has been recorded in hard-wateracidic lakes on different continents (Deneke 2000). Yet, these populations prob-ably belong to distinct, though closely related species (Belyaeva and Taylor 2009).
Volcanic and coastal sulfur lakes are natural analogues of acidic pit lakes, withsimilar water chemistry (Geller et al. 1998); they are also inhabited by similarzooplankton communities (Deneke 2000). However, there are some differences inspecies occurrence patterns, e.g. occurrence of copepods at pH around 3 in vol-canic lakes in Japan (Uéno 1958), but not in pit lakes. This may be related toadaptation of species in the regions, where hard-water acidic lakes have existedover evolutionary relevant time scales.
Factors Influencing Colonization of Acidic Pit Lakes by Zooplankton
Zooplankton species richness and community composition in acidic pit lakes areboth highly predictable from the lake pH value (Deneke 2000). The strongcorrelation between zooplankton species richness and pH (Fig. 3.53) exists
120 3 Limnology of Pit Lakes
despite considerable variability in lake morphology, mixis regime, and trophicstatus of pit lakes. This, however, does not necessarily mean that high concen-tration of protons alone limits species occurrence. Generally, multiple abioticstressors act in acidic lakes (Frost et al. 1999). Zooplankton species compositionin acidic pit lakes differs greatly from that in soft-water acidic lakes, whichindicates that other water chemistry parameters might be crucial for biologicalcolonization. Laboratory tests with cladocerans have shown that aluminum, iron,and heavy metal ions (Lopes et al. 1999; Soucek et al. 2001) as well as highsulfate content (Kennedy et al. 2005) can contribute to the toxicity of watersaffected by acid mine drainage. Metal ions may be elevated in soft-water acidiclakes as well, but their toxicity is mitigated by colored dissolved organic carbon(cDOC; Williamson et al. 1999). As cDOC content is usually very low in acidicpit lakes (Friese et al. 2002), its beneficial effects are diminished. Therefore,abiotic conditions in acidic pit lakes should be more toxic for organisms thanthose in naturally acidic lakes at the same pH values. Indeed, in our study onlittoral Cladocera (Belyaeva and Deneke 2007), we reported higher species-specific in situ pH thresholds for most species in a pit lake vs. soft-water acidiclakes (Fig. 3.54). As a result, species diversity in acidic pit lakes is expectedlylower than in naturally acidic soft-water lakes.
Acidity reflects buffering capacity, i.e. the stability of pH conditions. Soft-waterlakes are rather poorly buffered, and spatial as well as seasonal pH fluctuationsoccur, whereas acidic pit lakes at pH \ 4.5 are well-buffered and display very littlewithin-lake variation in pH, with the exception of meromictic pit lakes. At pH [ 4.5,soft-water lakes are buffered by cDOC, but in pit lakes, this buffer system is lacking,and so the pH is very unstable (Nixdorf et al. 2003). Precipitation of metalcompounds occurs during pH changes, which can adversely affect organisms(Belyaeva and Deneke 2007; Weatherley et al. 1991). This may occur, for example,during whole-lake neutralization or within mixing zones, where neutral river waterenters a highly acidic pit lake. Thus, the detrimental effect of metal precipitationshould be taken into account while planning neutralization measures.
2.0 2.5 3.0 3.5 4.00
2
4
6
8
10 r2 = 0.734a = -9.00b = 4.65p < 0.0001N = 21
Spe
cies
num
ber
pH
Fig. 3.53 Zooplankton species richness along a pH gradient in acidic pit lakes, based on monthlysamples from 21 lakes in Lusatia, Germany, over a period of at least one year. Indicated areparameters of linear least square regression fitted to the data. Filled circles indicate that thecommunities lacked crustaceans; open circles indicate that crustaceans were observed
3.3 The Biology and Ecosystems of Acidic Pit Lakes 121
Evidently, specific water chemistry in acidic pit lakes exerts profound effects on thezooplankton species diversity and composition. Secondary production and biomass inacidic lakes seem to be less affected, due to compensating shifts in biomass of tolerantspecies (Frost et al. 1995). On the other hand, food availability is believed to controlzooplankton biomass in acidic lakes (Havens and Carlson 1998; Nixdorf et al. 1998) aswell as within-lake distribution (Weithoff 2004) and seasonal dynamics of populations,but it is unlikely to limit species occurrence. Another limiting factor is, possibly,availability of micro-habitats in the littoral zone. Many acidic pit lakes arecharacterized by low macrophyte growth (Pietsch 1998); hence, plant-associatedzooplankton species may be rare or completely excluded due to a lack of suitablemicro-habitats. Biotic factors, such as predation and competition, play an importantrole in natural lakes. Yet, in acidic lakes, the importance of biotic factors decreases atlow pH, where abiotic conditions become increasingly more stressful (Arnott andVanni 1993). In the most extremely acidic pit lakes (pH \ 2.8), neither predation norcompetition seem to be important (Weithoff 2004), whereas at pH [ 2.8, some effectsof biotic interactions may be present, although water chemistry is still the majordeterminant of zooplankton community structure (Wollmann and Deneke 2004).
Dispersal of zooplankton may be hindered by the young age and/or isolatedcharacter of many acidic pit lakes. However, no published data is available on theprimary colonization of newly created pit lakes, and it is unknown how long ittakes the core zooplankton community to get established. Another interestingquestion for future studies would be the genetic structure and exchange amongpopulations colonizing acidic pit lakes, i.e. metapopulation dynamics. It is possiblethat it would be reduced due to isolation of pit lakes, yet, many zooplanktonspecies colonizing these habitats are pioneer species with high dispersal capabil-ities (see below), which can enhance metapopulation dynamics.
3 4 5 6 7 80
5
10
15
20
25
Cum
ulat
ive
Spe
cies
Ric
hnes
s
Fig. 3.54 Logistic regression curves for the potential cumulative species richness of littoralCladocera within a horizontal pH gradient from 3 to 7 in a pit lake Senftenberger See (circles)and natural soft-water lakes (squares) based on in situ pH thresholds for individual species.Lower potential species richness predicted for acidic pit lakes, as compared to soft-water lakes,results from higher species-specific pH thresholds (modified from Belyaeva and Deneke (2007),with kind permission from Springer Science ? Business Media)
122 3 Limnology of Pit Lakes
Ecology of Species Colonizing Acidic Pit Lakes
Anthropogenically stressed environments, such as acidic pit lakes, are commonlycolonized by extremophilic specialists as well as generalist species with broadtolerance ranges to a number of environmental factors. In contrast to bacteria, algae,and protists, which are often represented by acidophiles in acidic pit lakes, theevidence for acidophily among zooplankton is rather weak (but see Sect. 3.3.1.4).Most of the zooplankton species occurring in acidic pit lakes have been also found innatural lakes at acidic and neutral conditions (Deneke 2000), although they exhibitsomewhat different abundance patterns and habitat preferences there (see below).Furthermore, core species from acidic pit lakes—C. sphaericus, B. sericus,E. worallii, and C. hoodi—cultured at ambient pH, could be successfully transferredto neutral pH under laboratory conditions (Belyaeva and Deneke 2007; Denekeunpubl.). Hence, zooplankton community in acidic pit lakes largely, if not exclu-sively, comprises generalist species. In contrast, there are possibly some specialistsamong zooplankton species colonizing acidic soft-water lakes that have not beenrecorded in acidic pit lakes or in neutral hard-water lakes, e.g. the rotifers Lecaneacus, Habrotrocha lata, Keratella serrulata (Berzin�š and Pejler 1987), and thecladocerans Acantholeberis curvirostris and Streblocerus serricaudatus (Flößner2000). However, the designation of these species as specialists is derived from fieldoccurrence data alone. It remains unclear whether their physiological optima lieunder soft-water acidic conditions, or if they are simply weak competitors that areoutcompeted in species-rich neutral lakes. Still, many soft-water acidic ‘specialists’have not been found in species-poor acidic pit lakes, which suggests that they are notcapable of tolerating the abiotic stresses there. The complete absence of specialists inacidic pit lakes is probably explained by insufficient time for adaptive evolution,since those are young habitats with peculiar abiotic conditions, and their naturalcounterparts, such as volcanic lakes, are rare.
Zooplankton species found in acidic pit lakes can be characterized as pioneersthat also colonize newly created and perturbed water bodies. Pioneer species arer-strategists (meaning they have high growth rates) with efficient dispersalmechanisms, and they are able to use a wide range of food sources. For example,C. sphaericus is often the first crustacean species colonizing new sites (Louetteet al. 2008); it is capable of using different food sources (De Eyto and Irvine 2001),tolerates a wide range of abiotic conditions (Belyaeva and Deneke 2007), and isoften abundant in anthropogenically disturbed environments, e.g. highly eutrophiclakes (De Eyto 2001). Despite their large potential for colonization, pioneerspecies are presumably weak competitors. Their mass development is onlyobserved in species-poor communities, such as acidic pit lakes, or in natural lakes,when superior competitors are (temporarily) absent, e.g. C. sphaericus developingin the absence of Daphnia and copepod nauplii (Matveev 1986).
Absence of pelagic forms and a simultaneous habitat shift of littoral species tothe pelagic zone is a common observation in all kinds of acidic lakes, includingsoft waters (Nilssen 1980; Nilssen and Wærvågen 2003). This is probably due tothe lack of competition and predation pressure under acidic conditions (Locke and
3.3 The Biology and Ecosystems of Acidic Pit Lakes 123
Sprules 2000). In European acidic pit lakes, no zooplankton species were foundexclusively in benthic or littoral habitats (Deneke 2000), although rotifers andcrustaceans exhibited heterogeneous distributions within the water column(Weithoff 2004; Wollmann and Deneke 2004). In North American acidic pit lakes,two species, Lecane bulla and Philodina sp., were found only in benthic algalclumps, but not in plankton (McConathy and Stahl 1982). The absence of largepelagic species in acidic pit lakes results in a shift towards species with bodysize \500 lm. A similar shift in size structure has been documented for naturallyacidic and atmospherically acidified lakes (Schindler et al. 1985).
It is not quite clear what physiological adaptations of tolerant zooplanktonspecies have led to successful colonization of acidic pit lakes. In general, organ-isms living at low pH are capable of maintaining a circum-neutral internal pH viapassive or active mechanisms (Rothschild and Mancinelli 2001). Additionalchallenge for colonization of pit lakes is seemingly provided by the high total ioniccontent and high metal concentrations typical of these waters. Hence, it is possiblethat survival of zooplankton in acidic pit lakes is ensured due to different physi-ological mechanisms than those that are employed in soft-water acidic lakes. Thereis still a lack of knowledge concerning particular mechanisms of ion regulation inmetazoan zooplankton species under acidic hard-water conditions. A study on arotifer, C. hoodi, from extremely acidic pit lakes failed to detect any additionalphysiological costs or specific ecological adaptations (Weithoff 2005).
Ecological Characteristics of Zooplankton Communities in Acidic Pit Lakes
The major features of biological communities in acidic pit lakes are greatly reducedspecies diversity and extirpation of fish, so that the role of top predators is taken overby invertebrates (Wollmann et al. 2000). This leads to truncated and very simplefood webs (Sect. 3.3.1.4). In acidic pit lakes, zooplankton community composition iscontrolled by pH and related water chemistry parameters, whereas zooplanktonbiomass is possibly controlled by food availability (Wollmann and Deneke 2004;Sect. 3.3.1.4), as in soft-water acidic lakes (Havens and Carlson 1998). Bioticinteractions seem to be rather weak, at least in the most acidic pit lakes (Weithoff2004). However, some ecological patterns occurring in natural lake ecosystems,such as niche separation among different species (Weithoff 2004), seasonalsuccession, and top-down and bottom-up effects on zooplankton (Wollmann andDeneke 2004; Wollmann et al. 2000), have been observed in acidic pit lakes as well.On the other hand, zooplankton community composition is rather peculiar andunique in acidic pit lakes, what may result in rather specific biotic interactions.
Nixdorf et al. (2005) proposed a classification scheme for acidic pit lakes based onpH, chemical buffer system, and colonization patterns by phyto- and zooplankton(Table 3.14). The defined lake groups can also be viewed as successive stages ofhabitat maturation, as acidic lakes should become neutral with time due to naturalalkalinity generation by chemical and biological processes. Characteristic core speciesoccur in each group of lakes (Table 3.14), whose presence often has a pronounced
124 3 Limnology of Pit Lakes
effect on the food web structure and seasonal population dynamics (Wollmann andDeneke 2004). In ‘extremely acidic’ pit lakes (pH \ 2.8), the zooplankton communityis dominated by two small rotifer species, C. hoodi and E. worallii, and potentialcommunity grazing rates are very low (less than 1% per day). Hence, the impact onprimary producers is negligible; indeed, no top-down effects on phytoplankton havebeen observed in extremely acidic pit lakes even during metazooplankton abundancepeaks (Lessmann et al. 1999; Weithoff 2004). Heliozoa play the role of top predators inthe pelagic food web; however, it appears that they are not capable of exerting anynoticeable effect on zooplankton (Weithoff 2004).
In ‘very acidic’ pit lakes (2.8 B pH \ 3.5), the appearance of larger zoo-plankton species with higher clearance rates—B. sericus and C. sphaericus—leadsto top-down effects on phytoplankton (Wollmann and Deneke 2004). As a result, aseasonal pattern is observed with a break-down of phytoplankton biomassfollowing mass development of both zooplankton species in summer (Wollmannet al. 2000). Corixidae prey on both dominant zooplankton species here, whileheliozoans disappear from pit lakes at pH [ 2.8. As corixids can feed both onbenthos and zooplankton, they enable benthic-pelagic coupling in the food webs(Wollmann et al. 2000).
In ‘moderately acidic’ pit lakes (pH 3.5–4.5), zooplankton communities are morediverse, including several additional rotifer species, a cladoceran S. mucronata, andcopepods (Wollmann et al. 2000). The community composition is intermediatebetween the acidic and neutral pit lake communities (Wollmann and Deneke 2004).Still, acid-tolerant species that are characteristic of very acidic pit lakes alsodominate here. Weakly acidic pit lakes with pH [ 4.5 are very rare due to thelacking buffer system.
The metazooplankton community can serve as a reliable and simple biologicalindicator of water quality in acidic pit lakes (Nixdorf et al., 2005). Colonizationpatterns mostly reflect physiological thresholds of individual species. Hence, speciescomposition and community structure is intimately related to chemical conditions,whereas variation due to biotic interactions and within-lake habitat heterogeneityis almost absent. Pit lakes with similar water chemistry conditions, though they
Table 3.14 Classification of acidic pit lakes based on water chemistry and zooplankton coloni-zation (modified from Nixdorf et al. 2005)
Lake group pH Conductivity(mS cm-1)
Acidity(mmol L-1)
Buffer system Characteristiczooplankton species
Extremelyacidic
\2.8 [3 [15 Iron Cephalodella hoodi,Elosa worallii
Very acidic 2.8–3.5 1.5–3.0 [1.6–15 Iron Brachionus sericus,Chydorus sphaericus
3.3 The Biology and Ecosystems of Acidic Pit Lakes 125
might be different in their morphology, mixis regime and trophic status, are stillremarkably similar with respect to their zooplankton communities. All this makeszooplankton well-suited for bio-indication of ecological quality in acidic pit lakes.
3.3.1.3 Prokaryotic Microorganisms, Protists, and Fungi
Katrin Wendt-Potthoff
Bacterial Numbers and Biomass in Acidic Pit Lakes
Total bacterial numbers determined by epifluorescence microscopy in acidic pitlakes are similar to those of natural lakes and in many cases correspond to thetrophic state of the lake inferred from primary production. Most acidic pit lakesin Germany are oligotrophic, and their bacterial counts normally do not showdistinct vertical or seasonal patterns. Generally, the bacterial counts are roughly10% of those from natural hard-water lakes (Nixdorf et al. 2003). Spanish pitlakes, which result from ore mining and include many meromictic lakes, oftenshow pronounced vertical differences in bacterial numbers. For the numerousAustralian pit lakes, no data on bacterioplankton, fungi, or heterotrophic protistsare available.
Bacterial cell counts in acidic pit lakes are positively correlated to DOC concen-trations (Kampe et al. 2010). In a comparative study of four pit lakes in Lusatia,average values lay between 1.6 and 3.4 9 105 cells mL-1, with the highest valuesfound in the most acidic (and oldest) lake. However, a neutral pit lake in the sameregion, which was studied as a reference, had bacterial counts of 4.9(±4.4) 9 105 cells mL-1 (Table 3.15). For Lake 111, bacterial cell numbers wereconfirmed by subsequent studies (Müller 2004; Pöhler et al. 2002), so they appear to bestable with time. The bacterial counts of acidic lakes correspond to bacterial biomassand production, which are negatively correlated with pH and in the same range as thoseof natural lakes (Kamjunke et al. 2005). In contrast to the Lusatian lakes, pronouncedvertical gradients of bacterial counts were found in Spanish pit lakes, with maxima atthe surface in a dam (Malki et al. 2006) and in the rather young and meromictic SanTelmo lake (Sánchez-España et al. 2007). In the latter, bacterial counts reached 108
cells mL-1 in the upper 5 m, showed a minimum of &106 cells mL-1 in the deepermixolimnion, and increased again to 3.6 9 106 cells mL-1 in the anoxic monimo-limnion. The Berkeley Pit in Montana, USA, had bacterial counts around 105 mL-1 inthe upper part and lower counts at depths[55 m (Mitman 1999).
The percentage of filamentous organisms in bacterioplankton is often high in pitlakes and seems to be negatively correlated with pH. When filaments longer than10 lm were considered, their proportion was below 1% in 11 of 12 samples in theneutral pit lake, Lake B. Bacterioplankton of the acidic pit lakes, Lake 111(pH 2.6) and Lake 107 (pH 2.3), comprised 13 ± 9 and 17 ± 7% filaments(median ± standard deviation, n = 12 and 10, respectively; Babenzien and Meier
126 3 Limnology of Pit Lakes
Tab
le3.
15B
acte
rial
coun
tsan
dpe
rcen
tage
ofce
lls
form
ing
mic
roco
loni
eson
poly
carb
onat
efi
lter
s(m
ean
±st
anda
rdde
viat
ion)
,de
term
ined
byep
i-fl
uore
scen
cem
icro
scop
yaf
ter
stai
ning
wit
hac
ridi
neor
ange
Lak
e11
7(p
H3.
0)10
7(p
H2.
3)11
1(p
H2.
6)B
(pH
8.0)
F(p
H2.
8)
Tot
alba
cter
ial
coun
ts(m
L-
1)
1.8
±0.
5�1
05
(n=
12)
3.4
±2.
0�1
05
(n=
8)2.
8±
2.0�1
05
(n=
24)
4.9
±4.
4�1
05
(n=
23)
1.6
±1.
0�1
05
(n=
23)
%of
cell
sfo
rmin
gm
icro
colo
nies
23±
12(n
=12
)n.
d.26
±9
(n=
20)
23±
10(n
=22
)25
±19
(n=
21)
%of
mic
roco
loni
esw
ith
2–3
cell
s82
±8
(n=
11)
n.d.
60±
25(n
=20
)70
±21
(n=
22)
71±
12(n
=20
)%
ofm
icro
colo
nies
wit
h4–
11ce
lls
11±
6(n
=11
)n.
d.15
±11
(n=
20)
21±
17(n
=22
)21
±19
(n=
20)
%of
mic
roco
loni
esw
ith[
12ce
lls
7±
3(n
=11
)n.
d.9
±8
(n=
20)
9±
8(n
=22
)9
±5
(n=
20)
Sam
plin
gto
okpl
ace
betw
een
1995
and
1997
.M
icro
colo
nyfo
rmat
ion
was
not
dete
rmin
ed(n
.d.)
for
Lak
e10
7be
caus
eof
the
larg
efr
acti
onof
fila
men
tous
cell
s.A
pply
ing
one
way
AN
OV
Aan
dsu
bseq
uent
pair
wis
eco
mpa
riso
nby
the
Hol
m-S
idak
met
hod,
tota
lba
cter
ial
coun
tsin
the
neut
ral
Lak
eB
wer
esi
gnifi
cant
lydi
ffer
ent
from
Lak
e11
7,11
1an
dF
,bu
tno
tfr
omth
em
ost
acid
icL
ake
107
3.3 The Biology and Ecosystems of Acidic Pit Lakes 127
1998, unpublished report); a later study (Müller 2004) reported around 11%filamentous cells in Lake 111 with a total cell count around 106 mL-1. In additionto straight filaments of various sizes, conspicuously curled morphologies alsooccurred (Fig. 3.55a, b). A high proportion of filamentous forms can be a conse-quence of grazing pressure. In acidic pit lakes, bacteria are mainly grazed byphago-mixotrophic flagellates of the genus Ochromonas (Sect. 3.3.1.4).
Since microscopic counts of fixed cells not necessarily represent viableorganisms, and microorganisms from the environment mostly fail to grow on solidculture media, dilution cultures in liquid media or microcolony assays usingmembrane filters (Straskrabova 1972) are used to enrich organisms or to testthe viability of microscopically visible cells. Microcolony assays using whitepolycarbonate membranes have been successfully applied for acidophiles(de Bryun et al. 1990); this method has been modified to assess the ability of acidicpit lake microorganisms to divide with only their original 0.2 lm filtered lakewater as a substrate (Wendt-Potthoff, unpublished). After 48 h, cells were fixedand stained with acridine orange following the protocol of Binnerup et al. (1993),and cell and microcolony numbers were counted using a filter immediately fixedafter sampling as a reference. Some typical microcolonies are shown in Fig. 3.55(c–f). Roughly 25% of total cells were able to divide on the polycarbonatemembranes in both the neutral and acidic pit lakes. Most of the colonies (around70%) were small, indicating that time and resources were only sufficient for one totwo divisions (Table 3.15). However, larger colonies also formed with all of thestudied lake waters, and their percentages were similar (Table 3.15). There is littlepublished information to rank these results. They are within the range found formarine bacteria in membrane cultures with seawater and mud extract (0.8–66.1%,Bianchi and Giuliano 1996) and similar to those obtained with a slide cultureapproach without additional nutrients on freshwater and sewage samples (Fry andZia 1982). Bartscht et al. (1999) found a higher percentage of 58.3 ± 23.1%dividing cells with a synthetic freshwater medium, but in this case, 15 mg L-1 ofnatural DOC was added, and the incubation time was 10 days.
Fig. 3.55 Micro-organisms with ‘‘curled’’ morphology from a Lake 111 and b Lake 107.Microcolonies grown on polycarbonate filters from c Lake 117, d Lake 107, e Lake F, f theneutral pit lake, Lake B. Bars indicate 10 lm
128 3 Limnology of Pit Lakes
In addition to the high percentage of cells able to divide with only lake water asa substrate, pit lake microbiota also showed a high potential to utilize 14C-glucoseduring incubation at in situ temperature (Babenzien and Meier 1998, unpublishedreport). The process was temperature-dependent; in summer, uptake rates of0.13–0.67 lg C L-1 h-1 were measured in Lusatian acidic pit lakes. These are inthe range of activities measured in natural mesotrophic lakes and above that ofthe neutral reference pit lake, Lake B (0.12 lg C L-1 h-1). The fraction of14C-glucose converted to CO2 was not considered in these experiments. Metabo-lism of 14C-glucose was also studied in summer samples from Reservoir 29, a lakethat receives acidic drainage from coal refuse piles (Gyure et al. 1987). In thisstudy, both uptake and respiration were considered, and there was a clear trend ofincreasing glucose utilization with depth. When converting these data, their rangewas either 0.04–8.6 or 0.2–43 lg C L-1 h-1 because of inconsistent informationabout label addition. Assuming that respiration accounts for approximately 30% ofthe measured activity (Hobbie and Crawford 1969), rates are comparable exceptfor the deep-water measurements from Lake 29, which are roughly tenfold higher.Together with the fact that bacterial growth in acidic pit lakes was greatly limitedby DOC availability (Kamjunke et al. 2006), this confirms the importance ofheterotrophic metabolism in acidic pit lakes. The role of substrates and energyflow within the pit lake food web is discussed in detail in Sect. 3.3.1.4.
In conclusion, the numbers, biomass, viability, and thus the acclimatization ofacidic pit lake bacterioplankton to the prevailing conditions appears to be com-parable to that of other aquatic habitats.
Taxonomic Composition of Bacterioplankton in Acidic Pit Lakes
Information regarding the taxonomic composition of bacterioplankton in acidic pitlakes is scattered and inconsistent. The diversity of bacteria does not generallydecline with sinking pH values, and the bacterial community composition ingeographically close pit lakes of different pH appears to be similar (Kampe et al.2010). The communities consisted mainly of alpha-, beta-, and gamma-Proteo-bacteria ([90% in most samples); Actino- and Acidobacteria were only minorcomponents. Despite similar bacterial counts throughout the year, strong seasonalchanges of community composition became evident by sequencing PCR productsobtained with universal bacterial primers after denaturing gradient gel electro-phoresis (DGGE; Kampe et al. 2010).
In a separate study, a clone library was prepared from Lake 111 water by 16S rDNAamplification with bacterial primers. Sequences of obligately anaerobic microor-ganisms were not detected in the clone library, corresponding to the oxic status of thewater column. Here, the most prominent groups among the bacteria were Acido-bacteria, Acidiphilium and, surprisingly, organisms affiliated with Nitrosomonas andLegionella (Müller 2004, Fig. 3.56). Ammonia oxidizers have also been found to beimportant in mine waters in North Wales (Hallberg et al. 2006). The presence ofLegionellae was confirmed by Kampe et al. (2010). Members of the genus Legionella
3.3 The Biology and Ecosystems of Acidic Pit Lakes 129
(and of candidatus Odyssella as well) occur as endosymbionts in free-living amoebae(see review by Horn and Wagner 2004), and appreciable numbers of amoebae werealso detected in Lake 111 (Müller 2004, see below). Although this association ofmicroorganisms has not been reported from any other acidic pit lake, Legionellae andtheir potential host amoebae have been detected in a pH 2.7 geothermal stream inYellowstone National Park (Sheehan et al. 2005). The fraction of unidentified clonesin the Lake 111 clone library includes many rare phylotypes that were not furthercharacterized. This indicates that the true diversity of Lake 111 bacterioplankton wasnot fully resolved by this clone library, though the phylotypes most frequent at thetime of sampling could be classified. Müller (2004) also investigated Lake 111bacterioplankton by whole cell hybridization. With eubacteria-directed probes,approximately 57% of all cells were marked. Among these, alpha-proteobacteria(27.6% of total cells) were most prominent, followed by gamma- and beta-proteo-bacteria and acidobacteria (7.2, 4.3, and 6.4% of total cells, respectively). The probefor alpha-proteobacteria stained many of the filamentous cells. For Acidobacteriasubdivision 1, an improved oligonucleotide probe for whole cell hybridization wasdesigned, and seasonally varying counts of 0.4–3.7 9 104 cells mL-1 were detectedwith this probe in Lake 111 bacterioplankton. This is equivalent to 37–70% ofcells detected by the probe EUB338, and to 1.4–7.9% of all DAPI-stained cells(Kleinsteuber et al. 2008).
Fig. 3.56 Phylotypes detected in a clone library from a mixed water sample of Lake 111. Thelegend denotes taxa in decreasing order of percentage from top to bottom. The high fraction ofclones that were not identified includes very rare phylotypes that were not further characterized.Percentages are given for taxa comprising more than 1% of the clones (data from Müller 2004)
130 3 Limnology of Pit Lakes
The Spanish pit lake San Telmo also showed a high percentage (47–78%) ofalpha-proteobacteria (which include Acidiphilium) in the upper mixolimnion; inthe lower part of the mixolimnion, Leptospirillum-like organisms (17–22%) werealso important (Sánchez-España et al. 2007). Acidithiobacillus-related bacteriawere generally rare in pit lake waters (Kamjunke et al. 2005; Sánchez-España et al.2007). This is remarkably different from the prokaryotic diversity in the watercolumn of the Río Tinto, about 80% of which was attributed to Acidithiobacillusferrooxidans, Leptospirillum ferrooxidans, and Acidiphilium spp., all of which areinvolved in iron cycling (González-Toril et al. 2003).
Two reservoirs associated with the largest open pit copper mine in China (termedYTW and ZJ, both pH 3), which contained a mixture of acid mine drainage,infiltration water, and rain, were obviously dominated by gammaproteobacteria(61 and 90.1% of clones, Yin et al. 2008). This group includes Acidithiobacillusferrooxidans, and 28.2 and 27.5% of clones from YTW and ZJ were related to thisspecies. Despite their equal pH, the chemistry of the reservoirs exhibitedpronounced differences, with YTW having similar concentrations of iron andaluminum (both between 900 and 100 mg L-1) and ZJ being rich in aluminum andcopper (1,588 ± 206 and 213 ± 26 mg L-1) associated with moderate(198.61 ± 17.9 mg L-1) iron concentrations. This may explain the much lowertotal bacterial diversity (a Shannon–Weaver diversity index of H = 2.23 comparedto 4.16 in YTW) in that reservoir (Yin et al. 2008). Although much effort has beenmade to cultivate bacteria from tailings and acid mine drainage streams in recentyears (e.g. Diaby et al. 2007; Johnson et al. 2001), there seems to be no such study onacidic pit lake water. However, an isolate from Lusatia was identified as Acidiph-ilium organovorum by fatty acid analysis (Wendt-Potthoff et al., unpublished).
In contrast to findings from extreme acid mine drainage, where archaea canaccount for up to 50% of prokaryotic cells in summer samples (Edwards et al. 1999),archaea seem to be less important in the cooler and more dilute waters of acidic pitlakes. Few archaea (3%) were detected in the water of the Spanish pit lake San Telmo(Sánchez-España et al. 2007). In Lake 111, abundance and diversity of archaea wasalso low. Except for some non-thermophilic Crenarchaeota, they were affiliated toThermoplasmatales (Müller 2004). No archaea were found in clone libraries fromthree samples of the acidic river Rio Tinto in Spain, and few archaeal cells weredetected by whole cell hybridization (Garrido et al. 2008).
The occurrence of live cyanobacteria has not been reported from acidic pit lakesso far, but related sequences have been detected in PCR products obtained withuniversal bacterial primers following DGGE and sequencing (Kampe et al. 2010).Sequences of other phototrophic prokaryotes were not found, and bacterial pigmentsindicative of such organisms are also generally absent (Kamjunke et al. 2005).A special situation may arise in meromictic pit lakes. If the monimolimnion is closeto neutral and sulfidic, anoxygenic phototrophic bacteria may establish a presence atthe chemocline. So far, only two such cases have been reported, in the small lakesWaldsee and Lugteich in Lusatia (Rücker et al. 1998). Waldsee has a naturally highinput of organic matter in the form of leaf litter, and Lugteich had received municipalsewage that had only been mechanically treated from approximately 1970–1990.
3.3 The Biology and Ecosystems of Acidic Pit Lakes 131
Pigment analyses revealed the presence of green sulfur bacteria, Chlorobiaceae,with bacteriochlorophyll –d concentrations of up to 500 lg L-1.
Generally, the taxonomic composition of bacterioplankton from pit lakesexhibits marked similarities with those of concentrated acid mine drainage andgeothermally influenced waters. As a rule of thumb, acidic pit lakes tend to havea higher prokaryotic diversity as well as a higher proportion of heterotrophs and alower proportion of archaea.
Fungi and Yeasts
Fungi and yeast are known to occur over a wide pH range, and a considerablediversity of isolates has been obtained from acidic habitats (e.g. Das et al. 2009;Joseph 1953). A high percentage (43% of 274 strains) of hyphomycete isolatesfrom Rio Tinto was demonstrated to grow in Rio Tinto conditions (Lopez-Archillaet al. 2001). Fungal communities in pit lakes have not been as systematicallystudied as streams influenced by acid mine drainage or volcanic activity. Fungi ingeneral have been termed ‘‘tolerant’’ to ‘‘common’’ in a collection of more than200 mine water samples, which included pit lakes, as they were found in 8.05% ofspring and 18.05% of summer samples (Lackey 1939). Yeast and fungal coloniesregularly appeared on solid culture media inoculated with water samples fromLusatian lakes and were sometimes hard to separate from bacterial isolates,because fungicides were either not fully effective at pH 3, or the organisms wereresistant to them. When carbon substrates were added to acidic pit lake water,fungal proliferation was observed within 24 h (Babenzien and Meier 1998,unpublished report). A yeast bloom has also been observed in situ after theaddition of whey to an enclosure experiment in Lake 111 that was intended toconsume the oxygen in the water column. However, none of these findings arequantitative. Colony counts of 6 9 104–6 9 105 mL-1 have been reported fromacid streams in northern West Virginia and Pennsylvania (Joseph 1953), andGadanho et al. (2006) counted between 2 and [15,000 L-1 yeast colony formingunits (cfu) in water samples from ponds and creeks in the Sao Domingos and RioTinto mines of the Iberian Pyrite Belt (pH 1.8–2.9). They used an acidified (pH 3)medium, which yielded higher counts than the conventional medium with pH 5.7.Tests with some samples revealed even higher counts when an acidic medium withwater from the original sites was prepared. This shows that the yeast present in theacidic waters were well adapted to their habitat.
Using the same cultivation approach on a naturally volcanic-acidic water systemin Argentina, Russo et al. (2008) counted lower yeast numbers (30–1,200 cfu L-1
for Rio Agrio and only 30–60 cfu L-1 for Lake Caviahue). Yeast diversity in a pitlake and a pond increased from spring to autumn, an as-yet unexplained observationthat deserves further study (Gadanho et al. 2006). In total, 27 yeast species (bothascomycetous and basidiomycetous) were isolated, of which 48% might representundescribed taxa. Among these, a Cryptococcus sp. required low pH for growth, aproperty that had not been observed before in yeasts (Gadanho et al. 2006). The
132 3 Limnology of Pit Lakes
acid-tolerant yeasts belonged to other Cryptococcus sp., Lecytophora sp., Candidafluviatilis, Rhodosporidium toruloides, Williopsis californica, and Rhodotorula sp.A truly acidophilic Cryptococcus sp. was also isolated by Russo et al. (2008) fromthe volcanic-acidic Rio Agrio-Lake Caviahue environment. Moreover, a Crypto-coccus sp. with a growth optimum at pH 3 and almost no growth at pH 8 was isolatedfrom an acidic pond at Smoking Hills in Canada, and was shown to live in amutualistic relationship with the acidophilic alga Euglena mutabilis (Nakatsu andHutchinson 1988). This possibly indicates a widespread occurrence and environ-mental significance of such Cryptococcus species.
Regarding the in situ activity of fungi, Satake and Saijo (1974) postulated thatthe heterotrophic activity in waters below pH 3 were mainly attributed to molds,but at that time, there was no substantiating in situ data. Schlief and Mutz (2005),investigating fungal biomass and respiratory activity in a Lusatian pit lake, foundmaximum fungal biomass in autumn and winter, probably caused by leaf fall.At the time of maximum leaf-associated respiration, fungi were responsible for47 (±7.7) % of total respiration.
After decades of acidic pit lake research, the taxonomic structure and in situactivity of their fungal communities is still not well known. However, refinementof culture media and isolation and molecular identification of both highly acid- andmetal-tolerant as well as truly acidophilic species from various acid waters willhopefully help to close this gap in the near future.
Heterotrophic Protists in Acidic Pit Lakes
Heterotrophic protists found in acidic pit lake plankton comprise mainly heliozoa,ciliates, and amoebae; sometimes, heterotrophic nanoflagellates are also present.Due to the delicate structure of protists and the extreme chemical matrix of the lakewater, sampling and preservation of protists requires special care (Woelfl andWhitton 2000). Among the ciliates, members of the orders Prostomatida, Hypo-trichida, and Peritrichida were detected. They typically reached maximum celldensities of 5,000–30,000 cells L-1 or even 335,000 cells L-1 in an extreme case,which are comparable to densities known from natural lakes (Packroff 2000).Hypotrichida, mostly represented by large, slow-swimming forms, was also thedominant ciliate taxon in the Río Tinto system (Aguilera et al. 2007). The regularfinding of hypotrich ciliates in plankton, which are typically benthic organisms, is anunusual feature of acidic pit lakes and acid rivers and may be attributed to a lack ofpredatory pressure (Aguilera et al. 2007; McConathy and Stahl 1982; Packroff 2000).
In some acidic pit lakes, heliozoa appear to be the main protistan component ofthe plankton. They can reach cell densities of 26,000 cells L-1 (Packroff 2000),and be the top predators in some acidic pit lakes (Bell et al. 2006; Woelfl et al.1998). The heliozoa present in Lake 111 were putatively identified as Actinophryssol, but their cells were smaller than those of the same species found in otheraquatic habitats. They exhibited pronounced temporal and vertical patterns inabundance, biomass, and cell volume, with abundance and biomass maxima in late
3.3 The Biology and Ecosystems of Acidic Pit Lakes 133
June/early July and September (Bell et al. 2006; for growth characteristics andfood web relations, see Sect. 3.3.1.4).
Müller (2004) reported 2.5 9 104 amoebae per mL in Lake 111. A highdiversity of amoebae has also been isolated from the extremely metal-richBerkeley Pit Lake in Montana, USA (Mitman 1999), and Arcella vulgaris has beenfound to thrive in a highly acidic (pH 2.0) AMD-polluted lake in Ontario (Kumarand Patterson 2000). Considerable benthic recruitment of heliozoa and rhizopodstakes place in Lake 111 (Bell and Weithoff 2003); this aspect deserves furtherinvestigation in other acidic pit lakes.
Data on heterotrophic nanoflagellates in acidic pit lakes are scarce. As thephytoplankton in these lakes is dominated by mixotrophic flagellates, theirheterotrophic counterparts are generally outcompeted in the illuminated part of thewater body (Rothaupt et al. 1996; Tittel et al. 2003). Packroff (2000) reported anaverage heterotrophic flagellate density of 2.3 9 106 cells L-1 for Lake Cospuden(East Germany), and Müller (2004) counted an almost identical value of2.4 9 106 cells L-1 for Lake 111. Sediment traps deployed in Lake 111 regularlycontained some heterotrophic flagellates with a peculiar morphology, possessingflexible cells with two flagella on opposite sides (Fig. 3.57). They were identifiedas cercomonads. In addition, the widespread flagellates Bodo saltans, Neobododesignis, Neobodo covifilus, and a taumathotomatid type were also found in thesesamples (Markus Weitere, personal communication). A Cercomonas species wasalso detected in a rRNA gene diversity study of the acidic river Rio Tinto (AmaralZettler et al. 2003), indicating that there might be cercomonads specificallyadapted to acid waters. Aguilera et al. (2007) observed a higher abundance ofcercomonads in winter months. This confirms the above-mentioned importanceof light for their distribution and biomass.
From the accessible data, it is hard to definitely judge microbial diversity inacidic pit lakes. Often, species identification has not been possible, or clonelibraries are small and the information on seasonal patterns is missing. It appears
Fig. 3.57 Phase contrastimage of sediment trapmaterial from Lake 111 withcercomonad flagellates(arrow)
134 3 Limnology of Pit Lakes
that microbial diversity in acidic pit lakes is higher than at extremely acidic minesites, but lower than in natural lakes. Prokaryotic diversity is, however, higher insediments than in the water column of acidic pit lakes (Sect. 3.3.2). Additionalresearch is needed to understand the relationship between microbial communitycomposition and environmental factors other than pH in acidic pit lakes.
3.3.1.4 Trophic Interactions and Energy Flow
Guntram Weithoff, Elly Spijkerman, Norbert Kamjunke and JörgTittel
Survival in acidic mine pits is possible for only a limited number of planktonicspecies (e.g. Lessmann et al. 2000; Wollmann et al. 2000; Sect. 3.3.1.1). Growth ofthe plankton and especially phytoplankton species has been suggested to be limitedby pH, light quality and quantity, concentrations of ferric iron, zinc, aluminum,and manganese, CO2, and inorganic phosphorus (Pi). The effects of theseparameters will be evaluated separately, followed by field measurements ofprimary production, bacteria production, and their relation to each other. Ananalysis of the food web in extremely acidic lakes is provided, and the potentialof ‘‘controlled eutrophication’’ for the abatement of acidification is discussed.
Adaptations to the Chemical Environment and to the Unusual Light Climate
pH
In many acidic mine pits, pH values are relatively stable over long time periodsbecause the systems are buffered by high iron concentrations, which only fluctuateto a minor extent. Generally, pH values range between 2.0 and 3.5. Therefore, thelakes must be inhabited by species that are either acid tolerant or true acidophiles.In many such mine pits, a Chlamydomonas species can be found, often identifiedas Chlamydomonas acidophila (e.g. Gerloff-Elias et al. 2005a). C. acidophila cangrow over a wide range of pH values, the lower pH limit lying at pH 1.5 and theupper limit at pH 7 (Fig. 3.58, Gerloff-Elias et al. 2005a; Nishikawa and Tominaga2001; Spijkerman 2005). Its growth is optimal between a pH of 2.5 and 3.5,coinciding with the pH range of most acidic mine pits, and declines strongly atpH [ 6. Maximum growth rates of C. acidophila at low pH are comparable tothose of Chlamydomonas reinhardtii at pH 7 (Förster et al. 2001), indicating thatlow pH per se does not necessarily result in reduced growth.
Also, the maximum net photosynthetic rates of C. acidophila at pH 2.6(308 mmol O2 (g Chl a h)-1) is comparable to that of C. reinhardtii at pH 7.0(265 mmol O2 (g Chl a h)-1, Gerloff-Elias et al. 2005a; 300 mmol O2 (g Chl ah)-1, Förster et al. 1999), indicating that low pH also does not hamper maximumphotosynthetic capacity. These results indicate that C. acidophila is well adaptedto low pH and as this species is a main contributor to primary productivity
3.3 The Biology and Ecosystems of Acidic Pit Lakes 135
(Kamjunke et al. 2004), the relatively low primary production rates in acidic minelakes (Kamjunke et al. 2005; Nixdorf et al. 2003) do not result from the low pH(Gerloff-Elias et al. 2005a).
Ochromonas spp. often dominates the plankton in the acidic mine pits inGermany, constituting 45–80% of plankton biomass (Kamjunke et al. 2004;Wollmann et al. 2000). An isolate of Ochromonas from one of these lakes, Lake111, grew at pH 2.6 phototrophically with a rate of 0.07 d-1, but could reachgrowth rates of 0.27 and 0.32 d-1 mixo- or phagotrophically, respectively (Tittelet al. 2003). These rates are much lower than those obtained with neutral relativeswho on average have growth rates of 0.46 d-1 (max. 1.3 d-1) under autotrophic,and 2.0 d-1 (max. 3.14 d-1) under mixotrophic conditions (Andersson et al. 1989;Maranger et al. 1998; Rothhaupt 1996; Sanders et al. 2001).
A dominant littoral microorganism in acid mine drainage is Euglena mutabilis.This algal species tolerates acid conditions down to pH 1.7, and its distribution isrestricted to habitats with pH \ 4.6, with prolific growth between pH 3.0 and 3.5(Brake et al. 2001), possibly not much slower than mesophilic Euglena species.
Experiments with rotifer species from the genera Cephalodella and Elosaisolated from Lake 111, neighbouring lakes, and an acidic lake in Austria revealed apH tolerance of 2.7–5 and 6, respectively (Weithoff, unpublished data). These resultssuggest that these rotifers are acidophiles. The calculated gross growth efficiency ofCephalodella sp. was in the range of isolates from neutral lakes (Weithoff 2005).In addition, the ciliate Oxytricha sp., also isolated from Lake 111, realised growthrates at pH 2.6 similar to that of mesophiles. It therefore appears that most speciesinhabiting acidic mine pits are acidophilic rather than acidotolerant, and mostperform just as well at pH 2.6 as do their neutral relatives at pH 7.
Light
The underwater light spectrum in acidic mine pits is distorted and red-shifted.Contrasting to neutral lakes, only red light with a wavelength over 550 nmpenetrates into the deeper water strata, whereas the blue light (k\ 450 nm)is already absorbed in the surface strata (Koschorreck and Tittel 2002;
Fig. 3.58 Exponentialgrowth rates ofChlamydomonas acidophilaunder non-aerated conditionsover a range of external pH.Mean and SE of 3independent replicates(modified after Spijkerman2005)
136 3 Limnology of Pit Lakes
Gerloff-Elias et al. 2005b). The light absorption in acidic mine pits results mainlyfrom the high concentrations of dissolved ferric iron (for more detailed informa-tion, see paragraph 3.1). Consequently, the iron-rich Lake 111 (122 mg Fe L-1)had an attenuation coefficient Kd(PAR) of -0.7 m-1, whereas it was only -0.2 m-1 in Lake 117 (5.5 mg Fe L-1). In situ experiments revealed thatC. acidophila exhibited a significantly higher absorption efficiency and a highercellular chlorophyll b content when incubated in the red-shifted underwater lightof Lake 111 than in the more typical, blue-green dominated light spectrum of Lake117 (Gerloff-Elias et al. 2005b). At a depth of 7 m, where only 0.1–0.3% ofsurface irradiation arrives as a result of the high absorption coefficient of iron-richlake water, benthic algal mats can still photosynthesize, using the red light veryefficiently (Koschorreck and Tittel 2002).
Metals
In acidic mine lakes, concentrations of many metals are enhanced (Friese et al.1998; Nixdorf et al. 1998; Packroff 2000), with high iron concentrations being themost striking feature. Compared with neutral lakes, Fe concentrations in acidicmine pits are about a thousand-fold higher, and they are a million-fold higher thanin the Pacific Ocean, where Fe may limit phytoplankton growth (Timmermanset al. 2004). High concentrations of many metals can be toxic (Gross 2000),although acidophilic organisms are generally rather tolerant (Gimmler et al. 1991).A principal component analysis on data from the Rio Tinto (Spain) showed acluster consisting of concentrations of most of the analyzed metals with Dunaliellasp., and an inverse relationship between this cluster and Chlamydomonas sp.(Aguilera et al. 2006). Possibly, Chlamydomonas sp. inhabits this site despite thehigh metal contamination, but its lesser pH tolerance than Dunaliella sp. shouldalso be considered when looking at component analyses, as low pH and metalsolubility negatively correlate (and Dunaliella sp. grows well at pH \ 2.0).
There are several suggested compensatory mechanisms in extremophiles, suchas increased accumulations of heat shock proteins (Hsps; Laksanalamai and Robb2004). In comparison to the mesophilic C. reinhardtii, C. acidophila exhibitedsignificantly higher accumulations of Hsps under non-contaminated culturingconditions, and an increased accumulation of small Hsps when incubated in metal-rich lake-water (Spijkerman et al. 2007a). Increased levels of small Hsps canprotect photosynthesis from metal stress, as it supposedly does in higher plants(Heckathorn et al. 2004).
Gross (2000) evaluated a possible defence mechanism for acidophiles towithstand high metal concentrations via a highly positive surface charge of the outercell membrane. The positively charged membrane and positive zeta potential allowDunaliella acidophila to maintain a neutral intracellular pH, and results in both a highacid resistance and a high resistance against toxic di- and trivalent cations (Gimmlerand Weiss 1999). The observed metal resistance in acidophiles can therefore be dueto a general cation resistance rather than to a specific H+ or metal resistance.
3.3 The Biology and Ecosystems of Acidic Pit Lakes 137
In C. acidophila, a large tolerance for Zn, Cd, Cu, and Co was described(Nishikawa and Tomanaga 2001). In contrast, after culturing the species in anFe-rich medium, the maximum quantum yield was reduced, whereas highconcentrations of Zn, Mn, or Al had no effect (Fig. 3.59, Spijkerman et al. 2007a).Repeating these experiments with Fe2(SO4)3 instead of FeCl3 revealed that it wasthe Fe speciation that caused the effect, and only very high concentrations ofFe2(SO4)3 could inhibit the photosynthesis of C. acidophila (Spijkerman,unpublished data).
The periphytic green alga Stigeoclonium tenue, isolated from ditches containingmine water, was Zn-tolerant. It was able to grow and reproduce at external Znconcentrations -C1 mg Zn L-1 (Pawlik-Skowronska 2003). In contrast to whatwould be expected, the Zn-tolerant ecotype of S. tenue significantly accumulatedmore Zn and Pb than a Zn-sensitive ecotype. Zn-toxicity experiments on neutro-philes often cover rather low concentrations; for example, the maximum concen-tration tested was 2.6 lg Zn L-1 in a marine Chlamydomonas sp., but resulted in a10% decrease in growth rate (Sunda and Huntsman 1998), and similarly5 lg Zn L-1 inhibited growth in Selenastrum capricornutum (Kuwabara 1985).
Similarly, the acidophilic protozoan Euglena mutabilis can grow at extremelyhigh Fe concentrations (0.7–1.7 g Fe L-1, Casiot et al. 2004) and has the ability tobio-accumulate Fe (Mann et al. 1987, 1989). E. mutabilis also contributes toformation of Fe-rich stromatolites by releasing intracellularly stored Fe compoundsafter death, which contribute to the solid material of stromatolites and act asnucleation sites for precipitation of authigenic Fe minerals (Brake et al. 2002).In addition, the acidophilic red alga Cyanidium caldarium also accumulated iron inacidic mine pits (Nagasaka et al. 2003). For neutrophilic algae, no Fe-toxicity valueswere found in the literature.
Little is known about the combined effect of metal ions and low pH onzooplankton. However, a study on several littoral crustaceans revealed that the
Fig. 3.59 Exponential growth rates over 5 days and maximum quantum yield after 3 days ofChlamydomonas acidophila cultivated in a minimal (WC) medium enriched with11 mg Mn L-1, 60 mg Al l-1, 3.3 mg Zn L-1 or 800 mg Fe L-1, reflecting metal concentra-tions in Lake 107 (modified after Spijkerman et al. 2007a). Results are mean and SE of 3 cultures
138 3 Limnology of Pit Lakes
harmful effect of low pH can be enhanced by high concentrations of aluminum(Havens 1991a). Total cation concentrations in these experiments were much lowerthan concentrations typically found in acidic mine lakes. High concentrations of lesstoxic cations may counteract the harmful effect of low pH and high heavy metalconcentrations.
In summary, multiple adaptations of acidophiles (high Hsp levels, decreasedmetal uptake as a result of a positive cell membrane, or storage and de-toxificationof metals) increase their tolerance to high metal concentrations.
Phosphorus
One possible factor limiting primary production and biomass yield in acidic minelakes is inorganic phosphorus (Pi; Nixdorf et al. 1996; Beulker et al. 2003, see alsoSect. 3.2.1.3). Experiments performed using pulsed amplitude modulation (PAM)techniques suggested a Pi-limitation in the phytoplankton of some mine lakes inLusatia, Germany (Lake 117 and 111, but not in Lake 107; Beulker et al. 2002). Thisresult was explained by the higher Pi concentrations in Lake 107 (25 lg P L-1)compared with those in Lake 117 (6 lg P L-1) and 111 (12 lg P L-1). Comparingthe phytoplankton from 4 lakes containing different Pi concentrations showed a largebiomass increase after Pi- enrichment experiments, suggesting that Pi is the mainnutrient limiting algal growth (Fig. 3.60; Spijkerman 2008a). Also, in otheracidic mine pits, Pi was acknowledged as the most important limiting factor forphytoplankton productivity (Simmons et al. 2004).
In an enrichment study performed on 4 acidic Lusatian lakes, C. acidophilaappeared to be the most severely Pi-limited phytoplankton species (Spijkerman2008a). In these lakes Ochromonas sp. dominates the biomass, but it isphagotrophic in nature and may avoid a Pi-limitation by engulfing P-rich particlessuch as bacteria (Schmidtke et al. 2006). C. acidophila is the dominantphoto-autotrophic species and therefore primary productivity in the acidic minelakes is most likely decreased by a Pi-limitation.
The minimum cell quota for phosphorus (Q0) of C. acidophila (2.0–2.1 mg P g C-1)was similar to that of C. reinhardtii (2 mg P g C-1; Lürling and van Donk 1997),indicating no enhanced metabolic costs by the extreme environment (Spijkerman2007; Spijkerman et al. 2007b). Enhanced metabolic costs should result in a highercellular ATP content under all growth conditions, but it is best to compare species using awell-defined parameter, such as Q0. Metabolic costs have been suggested in an isolateof C. acidophila from the Rio Tinto, but might consist of only a slightly increasedATP consumption rates (Messerli et al. 2005). Interestingly, the Q0 of C. acidophila washigher at low than at high CO2 conditions (Spijkerman 2007; Spijkerman et al. 2007b),demonstrating a relationship between CO2 and Pi acquisition. Possibly, growth ofC. acidophila in the acidic mine lakes is co-limited by CO2 and Pi.
For bacterial production in Lake 117, indications were found for a Pi-limitation(Spijkerman 2008a), but it is acknowledged that bacterial production is generallylimited by the low concentrations of organic carbon.
3.3 The Biology and Ecosystems of Acidic Pit Lakes 139
Carbon
In acidic waters below pH 4.0, inorganic carbon (Ci) is present only as CO2, andHCO3
- is virtually absent. Algae growing in acidic lakes are therefore often assumedto be Ci-limited in their natural environment (e.g. Nixdorf et al. 2003). However,adding CO2 did not clearly enhance electron transport rates in phytoplankton samplesfrom Lake 107, Lake 111, or Lake 117 (Beulker et al. 2002), although the phyto-plankton succession revealed a clear dependence from the Ci concentration (Beulkeret al. 2003). More precisely, rapidly increasing phytoplankton densities that wereobserved under ice and in the hypolimnion, correlated with enhanced Ci concentra-tions (Sect. 3.3.1.1). In addition, laboratory experiments with C. acidophila showedan increased maximum growth rate under high CO2 conditions (Tittel et al. 2005).Concentrations of Ci in the upper water strata of acidic lakes are typically not muchhigher than equilibrium concentrations of CO2 with the air (about 0.2 mg C l-1,Tittel et al. 2003). This concentration of total Ci would limit photosynthesis andgrowth of algae in a neutral environment (e.g. Bozzo and Colman 2000). However,C. acidophila has a high affinity uptake system for CO2 by photosynthesis, with anaffinity constant of 0.025 mg C l-1 (Cuaresma et al. 2006; Spijkerman 2005, 2008b),similar to that in C. noctigama at pH 6.3 (van Hunnik et al. 2000) and C. reinhardtii(Bozzo and Colman 2000). Consequently, maximum photosynthetic rates can berealised in situ. Recent experiments suggest that high population densities, a Pi
limitation and/or high concentrations of Fe might result in a CO2 limitation, but muchwork still needs to be done. Only CO2 enrichment experiments can reveal if Ci isindeed a growth limiting factor for the phytoplankton in acidic mine pits. Theseexperiments will be difficult as the increased maximum growth rate at high CO2 willlikely not be realised in the field due to other population regulating factors.
Fig. 3.60 Biomass yield (BY) of P-enrichment experiments after a one week incubation asmeasured by fluorescence of chlorophyll a. Lake Pi concentrations increase from left to right.Mean ± SD of 4 replicate measurements (from Spijkerman 2008a)
140 3 Limnology of Pit Lakes
Mixotrophy and Resource Limitation of Consumers
Mixotrophy as a Strategy to Overcome Resource Limitation
Mixotrophic organisms combine photosynthesis and the uptake of organicresources as modes of nutrition (Jones 1994, 2000). This phenomenon is especiallycommon in flagellates. The relative contribution of mixotrophs to total phyto-plankton biomass increases with increasing ‘‘extremeness’’ of the habitat. Twoways of mixotrophy can be distinguished: osmo-mixotrophy and phago-mixotro-phy. Osmo-mixotrophic organisms can take up dissolved organic carbon com-pounds of both autochthonous and allochthonous origin. Phago-mixotrophicflagellates are able to ingest particles, e.g. bacteria or small algae. Both typessupplement their photosynthetic carbon fixation by uptake of organic carbon whenphotosynthesis is limited. The degree of mixotrophy varies among species, that is,some use both carbon sources simultaneously most of their life, and some aremainly restricted to one carbon source and use the other only when the favourablecarbon source is limited (Jones 1994). The uptake of dissolved organic carbon(DOC) in osmo-mixotrophic flagellates leads to potential competition with bac-teria. In laboratory experiments, C. acidophila isolated from Lake 111 was capableof using the natural lake DOC for growth in the light, in the dark, and also in thepresence of bacteria competitors. In addition, the alga readily assimilated aromaticcompounds, typically occurring as light-degradation products of humic carbon ofterrestrial origin (Tittel et al. 2009). In contrast, phago-mixotrophic flagellates actas predators on bacteria and algae. Since bacteria typically have a lower C: P ratio(i.e. they are relatively rich in phosphorus) than algae, phago-mixotrophs benefitfrom bacteria ingestion due to both the uptake of phosphorus and of carbon(Gaedke et al. 2002). This might be one driving factor for the high abundance ofthe phago-mixotrophic Ochromonas sp. in acidic mine pits.
Resource Limitation of Consumers
In principal, consumers can be limited either by resource quantity or by resourcequality. When the first trophic level (i.e. the primary producers, such as phyto-plankton) are limited by nutrient availability or other factors, then this translatesdirectly to the first consumer level. Food supplement studies with rotifers fromLake 111 exhibited a quantitative resource limitation in the epilimnion over thewhole vegetation period under ambient food conditions (Weithoff 2004). Indeed,artificially enriched enclosures in this lake exhibited both a higher biomass ofphototrophs and an increased abundance of rotifers (unpublished data). Foodquality also affects consumer growth in acidic lakes; besides potential minerallimitation due to low phosphorus availability, biochemical limitation might beimportant. Mixotrophic protists are abundant in extreme habitats and can adapttheir mode of nutrition according to environmental conditions. These may changeseasonally or vertically in the water column. Since the physiological pathwaysdiffer between autotrophic and heterotrophic nutrition, the biochemical
3.3 The Biology and Ecosystems of Acidic Pit Lakes 141
composition of protists strongly depends on their resource supply (Boechat et al.2007; Poerschmann et al. 2004). Significant differences in the biochemicalcomposition were found (e.g. in the composition and total amount of fatty acids).In particular, concentrations of polyunsaturated fatty acids are reduced when theheterotrophic pathway is employed (Boechat et al. 2007; Poerschmann et al.2004). These fatty acids are often essential in zooplankton consumers and the lackof them may significantly reduce their growth. A case study with the osmo-mixotrophic C. acidophila grown heterotrophically (in the dark with glucose),mixotrophically (in the light with glucose), and autotrophically (in the lightwithout any organic carbon source) demonstrated species-specific effects on thelife history of rotiferan consumers. Cephalodella sp. achieved similar growth rateswith all three types of Chlamydomonas, whereas Elosa worallii exhibited positivepopulation growth only with autotrophic Chlamydomonas (Weithoff and Wacker2007; Fig. 3.61). Thus, the competitive abilities of the consumers changeaccording to the mode of nutrition of the mixotrophic flagellates (Hartwich et al.2010). These results reveal that the performance of consumers is not only deter-mined by the physical and chemical characteristics of mine lakes, but also by thebiochemical composition of their resource.
Pelagic Primary Production and Bacterial Production in Lusatian Mine Lakes
In Lusatian mine lakes (Germany) of different pH, there was no relationshipbetween pelagic primary production (PP) and pH. The highest PP was measured inthe least acidic lake (Lake 117, pH 3.0), moderate values in the most acidic lake(Lake 107, pH 2.3), and the lowest PP in the lake with a pH of 2.6 (Lake 111).Overall, mean PP in all three mine lakes (14 lg C L-1 d-1) was far below themeans observed in many other lake systems (184 lg C L-1 d-1, median72 lg C L-1 d-1; Cole et al. 1988). PP was in the range of values observed inpolyhumic lakes, where PP was mainly limited by light (Ahtiainen et al. 1985;
Fig. 3.61 Exponential growth rates of the rotifers Cephalodella sp. and Elosa worallii feedingon autotrophic (a), mixotrophic (m) and heterotrophic (h) Chlamydomonas acidophila. Data fromlife table experiments, error bars denote the 95% confidence interval (modified from Weithoff andWacker 2007)
142 3 Limnology of Pit Lakes
Arvola 1984). PP in the acidic mine lakes could therefore be light limited, due tothe high concentrations of dissolved ferric iron. Alternatively, the high seston C: P(mol:mol) ratio, ranging between 500 and 650 (Spijkerman 2008a), suggests that aPi-limitation lowers PP. Overall, PP might be limited by a complex interaction offactors and vary with water depth (light availability), season, and among differentlakes.
Bacteria
Most of the bacteria found in acidic mine lakes in Lusatia (Germany) were chemo-organo-heterotrophic, i.e. they take up organic compounds and gain energy fromrespiration. Chemolithotrophic bacteria (i.e. bacteria that use inorganic resourcesfor gaining energy) of the genera Acidithiobacillus and Leptospirillum were foundin very low numbers in the aerobic pelagic zone of the acidic mine lakes(Kamjunke et al. 2005; see also Sect. 3.3.1.3), so their metabolism can be assumedto be of minor importance compared to that of heterotrophic bacteria. Furthermore,no light absorption characteristic for bacterial pigments (bacteriochlorophyll orrhodopsin) was observed and, thus, no bacterial photosynthesis took place(Kamjunke et al. 2005). The bacteria comprised at least four species of the generaAcidiphilium, Acidocella, and Acidosphaera (Kamjunke et al. 2008). In contrast tomine waters in China (Yin et al. 2008), no differences in bacterial compositionwere observed in German lakes of different pH (Kampe et al. 2010).
Biomass and Production
In the Lusatian mine lakes, bacterial biomass showed values of 4–16 lg C L-1 inLake 117, 8–59 lg C L-1 in Lake 111, and 22–82 lg C L-1 in Lake 107(Kamjunke et al. 2005). Bacterial production (BP) ranged between 2–19 lg C L-1 d-1 in Lake 117, 4–17 lg C L-1 d-1 in Lake 111, and 8–45 lg C L-1 d-1 in Lake 107. The mean BP in all three mine lakes (10 lgC L-1 d-1) was in the range of the mean (26 lg C L-1 d-1, median11.5 lg C L-1 d-1) reported by Cole et al. (1988). The biomass-specific BPamounted to 0.06–1.8 d-1 (one value 2.6 d-1, mean 0.78 d-1) in Lake 117, 0.03–2.3 d-1 (one value 3.3 d-1, mean 0.73 d-1) in Lake 111, and 0.06–2.0 d-1 (mean0.70 d-1) in Lake 107, and fell in the range observed by Tremaine and Mills (1991) inacidic lakes with a pH of 3.6 (1.1–1.9 d-1). Biomass-specific heterotrophic pro-duction (HP) in the mine lakes showed no dependence on pH but was positivelyrelated to water temperature (p \ 0.001). The Q10 value (factor of increase within10�C) amounted to 2.45 and agreed with literature values from non-acidic envi-ronments, which usually range between 2 and 3 (Lee et al. 2001; Pomeroy and Wiebe2001; White et al. 1991).
Total bacterial biomass and production were negatively related to pH, and thehighest values were observed in the most acidic, most iron-rich lake (Fig. 3.62;Kamjunke et al. 2005). Bacterial biomass was probably promoted by iron photore-duction. In non-acidic waters, DOC is photochemically degraded (Kieber et al. 1989)
3.3 The Biology and Ecosystems of Acidic Pit Lakes 143
by UV irradiation and photosynthetic active radiation (PAR; Graneli et al. 1996,1998; Wetzel et al. 1995). This mechanism differs in iron-rich mine lakes, where UVand short wavelength PAR are absorbed within the uppermost layer (Koschorreckand Tittel 2002) and the photolysis of Fe(III) aquo complexes generates hydroxylradicals that react with refractory DOC (Brinkmann et al. 2003; Friese et al. 2002;Herzsprung et al. 1998). Light stimulated the formation of ferrous iron, changedthe DOC composition (formation of low-molecular-weight organic acids, such asacetate, formate, and pyruvate), and increased the BP in laboratory experiments,suggesting that iron photoreduction caused DOC degradation (Kamjunke et al.2005). Since the iron concentration in the mine lakes is negatively related to the pHof the waters, this may explain why measurements of BP were the highest in themost acidic and most iron-rich lake and lowest in the least acidic lake.
Carbon Sources
Vertical means of BP were not correlated with DOC concentrations, which rangedbetween 0.3 and 2.2 mg C L-1 in Lake 117, 0.7–2.9 mg C L-1 in Lake 111, and0.1–1.8 mg C L-1 in Lake 107 (Kamjunke et al. 2005). The bulk of the DOC inthe lake consists of polymeric fulvic acids (Poerschmann et al. 2004) that cannotbe used directly by bacteria, whereas qualitative changes in chemical composition
Bac
teria
l bio
mas
s (µ
g C
L-1
) r2 = 0.48
Lake 107Lake 111Lake 117
2 2.4 2.8 3.2 3.6
pH
BP
(µg
C L
-1 d
-1)
r2 = 0.49
10
100
y = -0.70x + 2.82
1
10
100
y = -0.76x + 3.24
Fig. 3.62 Negativecorrelation (p \ 0.001)between the vertical means ofbacterial biomass andbacterial production (BP) andthe pH in three acidic lakes ofeastern Germany withdifferent, extremely low pHand high iron concentrations.Modified after Kamjunkeet al. (2005)
144 3 Limnology of Pit Lakes
of the DOC after degradation allow increased bacterial assimilation and utilizationof the organic substrates (Wetzel et al. 1995). Unlike other lakes (Coveny andWetzel 1995; Kamjunke et al. 1997; Robarts et al. 1994), there was no significantrelationship between vertical means of BP and PP in the mine lakes (Kamjunkeet al. 2005). This uncoupling is the first indication that planktonic PP was not thebacteria’s main carbon source. Comparing average BP and PP of many waters, thedata points of the more acidic, iron-rich, Lakes 111 and 107 are situated above theregression line (Fig. 3.63).
The high importance of other carbon sources is supported by high ratios of BPto PP, ranging between 0.08–2.0 in Lake 117, 0.7–10.8 in Lake 111, and 0.7–1.5 inLake 107. Contrary to results from many other systems, BP was on the same orderas PP in the lakes, and exceeded it in two-thirds of all cases. The majority of thevalues were far above the mean proportion of 20% BP compared to PP, as reportedin many other lakes (Cole et al. 1988). Values above 100% have been observed,mainly from humic lakes with high DOC concentrations (above 10 mg C L-1)from allochthonous inputs (Jansson et al. 2000), whereas such values were alsoobserved for mine lakes at low DOC concentrations (Fig. 3.64). Karlsson et al.(2002) also found high BP/PP ratios in clear alpine lakes with low DOC con-centrations, and their maximum ratio of 10 matched the maximum of 11 in themine lakes. The exceptionally high ratios clearly indicate that BP in the lakes wassupported by PP and additional carbon sources.
In one particular lake (Lake 111, pH 2.6), bacteria exhibited high growth rateand efficiency on exudates of pelagic and benthic algae. In contrast, they showed alower growth rate and efficiency with organic carbon from groundwater, and grewat a very high rate but a very low efficiency on leaf leachate (Kamjunke et al.2006). Given the magnitude of differential source inputs into the lake, benthic
0.1
1
10
100
1 10 100 1000
PP (µg C L-1 d-1)
BP
(µg
C L
-1 d
-1)
Lake 107
Lake 111
Lake 117
Fig. 3.63 Relationship between bacterial production (BP) and primary production (PP) of manywater bodies. The line shows the regression of Cole et al. (1988; logBP = 0.8 logPP - 0.46)with 90% CI for the values. Data points represent data from acidic mine lakes of eastern Germany(modified after Cole et al. 1988)
3.3 The Biology and Ecosystems of Acidic Pit Lakes 145
primary production was probably the most important carbon source for pelagicbacteria.
Overall, it appears that bacteria play a more important role in the cycling ofmatter and as a basis for the whole food web in acidic mine lakes than in otherlake ecosystems, and that their importance increases in more acidic and iron-rich lakes.
Accumulation of Algae in Subsurface Layers
In mesotrophic circumneutral lakes, algae often build up high biomasses at thethermo- or chemocline, leading to a deep chlorophyll maximum (DCM). TheseDCMs often comprise cyanobacteria and/or cryptophytes (Adler et al. 2000). Aprerequisite for the formation of a DCM is a stable stratified water column.DCMs have also often been observed in mine pits. A case study of the DCM inLake 111 revealed that the accumulation of the alga C. acidophila at depth wasbased on grazing losses in the upper water layers. Chlamydomonas was con-sumed by the pigmented flagellate Ochromonas. This mixotroph combinedphotosynthesis and prey uptake as substitutable energy resources. The abun-dance of prey alga reflected the critical food concentration of Ochromonas. Thealga was reduced to low numbers if light was well available and vice versa,creating low Chlamydomonas abundances near the surface and a maximum atdepth (Tittel et al. 2003). Such a situation leads to two partly segregated sub-habitats with differing trophic interactions and species composition (Kamjunkeet al. 2004; Weithoff 2004).
0
1
2
3
4
5
6
0 5 10 15 20
DOC (mg C L-1)
PP
/BP
Lake 107
Lake 111
Lake 117
Fig. 3.64 Relationship between the ratio of primary to bacterial production (PP/BP) andconcentration of dissolved organic carbon (DOC) of many water bodies. The line with small opencircles shows the regression of Jansson et al. (2000; PP/BP = 6.28e-0.18DOC). Large data pointsrepresent acidic mine lakes of eastern Germany (modified after Jansson et al. 2000)
146 3 Limnology of Pit Lakes
Food Web Structure in Acidic Mine Lakes
The pH of the water is a major factor determining the distribution of zooplankton.For example, crustaceans, which need calcium carbonate for their carapax, sufferseverely from low pH, because the dominant inorganic carbon species in suchenvironments is CO2. Thus, very few crustacean species occur in waters with a pHnear 3 (Deneke 2000; Sect. 3.3.1.2). The lack of crustaceans and especially efficientfilter-feeders such as Daphnia as well as the lack of higher invertebrates andvertebrates has considerable consequences for the structure of the food web and theflow of energy therein. The extreme nature of the habitat limits the length of the foodchain to about two trophic levels due to the absence of higher trophic levelsorganisms (Gaedke and Kamjunke 2006) rather than low productivity, as suggestedby Havens (1991b, which was derived from a field survey of rain-acidified lakes inNorth America). However, since most species are either mixotrophic or omnivorous,no straight food chains occur, though more complex interconnected trophic relationsare common. Nevertheless, most of the carbon channelled through the trophiccompartments is transferred by only one or two steps. Furthermore, the number ofspecies of typical plankton groups (phytoplankton, heterotrophic protists, and rot-ifers) is also strongly reduced, leading to truncated pelagic food webs with a limitednumber of acting species (Gaedke and Kamjunke 2006; Kamjunke et al. 2004;Weithoff et al. 2010; Woelfl 2000, Wollmann et al. 2000). In neutral lakes with lowabundances of cladocerans, the dominant bacterivores are phagotrophic flagellates(Jürgens 1994). This pattern was also found in a very acidic lake (Lake 111),where the estimated loss of bacterial production was mainly attributed to thephago-mixotrophic flagellate Ochromonas sp. The feeding of Ochromonas wassize-selective, with highest volume-specific ingestion rates in a size range of1.5–2 lm in diameter (Schmidtke et al. 2006).
Another key feature of these food webs is the dominance of mixotrophs and theprevailing omnivory of some consumers (e.g. Havens 1991b). As planktonic top pre-dators, Heliozoa have been identified feeding on mixotrophic algae (Chlamydomonas)and on consumers such as rotifers (Bell et al. 2006; Woelfl 2000). However, as forrotifers, Heliozoa do not achieve positive growth rates with Ochromonas as the singlefood source (Bell et al. 2006; Weithoff 2004).
Increasing pH values in the range of 4–6 support an increasing number ofphytoplankton and zooplankton and the resulting food web resembles the classicalfood web known from neutral lakes (Belyaeva and Deneke 2007; Havens 1991b;Keller and Yan 1991).
Potential of ‘‘Controlled Eutrophication’’ for Abatement of Acidification
Eutrophication is a classical field in limnology and the undesirable consequencesof algal mass development are well known. With respect to acidic lakes and theirneutralisation, however, the potential of a deliberate eutrophication has beendebated for a long time (see also Chap. 4). The idea is based on the stimulation of
3.3 The Biology and Ecosystems of Acidic Pit Lakes 147
lake photosynthesis and organic carbon production (Davison et al. 1995) anddiffers from approaches in which organic carbon of external origin is supplied(Brugam et al. 1995; Klapper and Schultze 1997). Algae have also been used forthe removal of heavy metals from acid mine drainage (see also case study 5.7).This has been reviewed by Das et al. (2009) and is not addressed here.
The growth and biomass production of algae can change the alkalinity directlyby uptake and incorporation of inorganic nitrogen and its permanent burial in thesediment (Koschorreck and Tittel 2007). The assimilation of nitrate is associatedwith a gain in alkalinity, while assimilation of ammonia, which is the dominantform of inorganic nitrogen in acidic pit lakes, leads to a decrease in alkalinity(Wendt-Potthoff and Neu 1998). The photosynthetic uptake of inorganic carbondoes not affect the pH, in contrast to circumneutral lakes, since bicarbonate andcarbonate ions are practically absent below pH 4 and inorganic carbon is presentonly as dissolved CO2 gas. Potentially more important is the indirect contributionof primary production if it serves as a carbon source for iron and sulfate reduction.These are the most significant processes of alkalinity generation in pit lakes(Blodau 2006) and their rates are typically limited by the availability of organiccarbon compounds (Peine and Peiffer 1996).
There are examples indicating that internal organic carbon production canactually support iron- and sulfate reduction. In a productive lake having a mod-erately high phytoplankton biomass, the sediment top layer was characterised byhigher organic carbon contents and lower C: P ratios compared to a less productivelake. More reduced sulfur was accumulated in the productive lakes’ sediment andthe pore water exhibited a neutral pH, in contrast to the lake with low phyto-plankton production. The authors concluded that the potential of acidic lakes to beinternally neutralised can be based on the supply of autochthonous carbon (Peineand Peiffer 1996). Other studies have also pointed to the significance of the originand availability of organic substrates. For example, autochthonus carbon con-tributed 5–14% to total organic carbon in the sediment of three pit lakes butsupported 50–75% of respiration (Blodau et al. 2000).
The idea that the addition of mineral nutrients stimulates the internal productionof algal carbon and subsequently neutralisation has been applied to experiments atdifferent scales. Laboratory-based mesocosms with a moderate to high basecapacity of the water (kB8.2 2–15 mmol L-1) were fertilised with phosphorus.Although dramatic increases of algal biomass could be observed, there were nosignificant effects on alkalinity or pH (Fyson et al. 1998a, 2006; Totsche et al.2006). Mesocosms with a diameter of 30 m were mounted in the acidic Lake 111(pH 2.6) and fed with straw and other substrates (Koschorreck et al. 2007a). Twoyears later, the leached mineral nutrients still supported a substantial algal biomassand carbon production. However, assuming that 30% of the production werechannelled into iron- and sulfate reduction, the internal carbon production wassufficient to compensate for only 14% of ongoing inputs of acidity. The basecapacity was very high and equalled 13–15 mmol L-1 (Tittel and Kamjunke2004). The addition of organic waste products to Lake Koyne 113 (Lusatia,Germany) resulted in an increase of total organic carbon, phosphorus, and
148 3 Limnology of Pit Lakes
phytoplankton biomass, up to 6 mm3 L-1 and to 85 lg L-1 Chl a. However, nochange of base capacity (13–15 mmol L-1) was observed (Lessmann et al. 2003),and the pH remained at 2.6 (Spijkerman 2008a). In contrast to these examples fromacidic pit lakes, moderate fertilization affected acidity in a rain-acidified softwaterlake characterized by a low base capacity (0.01 mmol L-1). The pH responded tophosphorus addition and subsequent phytoplankton growth with a moderateincrease, from about 5–6 (Davison et al. 1995).
How much of the autochthonous carbon in fertilised mesocosms and lakes may bechannelled into iron and sulfate reduction is not known. From planktonic organiccarbon production, we can estimate an upper limit of acidity input that can becompensated for by internal lake processes. In general, acidic conditions do notprevent the development of a high phytoplankton biomass (Woelfl et al. 2000). In theacidic and polymictic Lake Niemegk (Lusatia, Germany), algal biomass peaksreached 22 g C m-2 and the production ranged from 0.23–11.5 g C m-2 d-1
(Zippel 2005), which is similar to biomass yield and production in hyper-eutrophiclakes. Assuming that 30% can be used for alkalinity generation, a theoretical removalof acidity of 2–117 mol m-2 a-1 can be calculated. The actual rates, however,strongly depend on the conditions at the sediment and are probably much lower(Blodau et al. 2000). This is illustrated by the example of Lake 117, where the actualrate of iron reduction was less than 1% of the potential rate derived from carbonsupply (0.8 and 106 mol m-2 a-1, respectively). The authors attributed this largedifference to a possible limitation of iron availability and to competition with otherprocesses, e.g. aerobic mineralization (Koschorreck et al. 2007b). Furthermore, highrates of gross sulfate reduction do not equal a long-term alkalinity gain, as a sub-stantial proportion of reduced sulfur can be reoxidised and is not buried (Koschorrecket al. 2007a). In conclusion, deliberate eutrophication can be an option, if thestanding stock of acidity and the inflow of acidity are low, the latter probably nothigher than 0.5–1 mol m-2 a-1. Candidates are lakes without a distinct red color-ation of water. If neutral conditions are achieved, ongoing acidity inputs can bebalanced by internal alkalinity generation of 0.24–1.4 and 1.6–9.5 mol m-2 a-1 inless productive and productive lakes, respectively (Koschorreck and Tittel 2007).
3.3.2 Littoral, Benthic and Sediment Zone
3.3.2.1 Macrophytes and Neophyte Invasions
Benedikt Beck and Arnulf Melzer
Introduction
The major reasons for macrophyte community changes during the last centuryhave been eutrophication of freshwater ecosystems and acidification, caused byatmospheric deposition, and the consequences that these have had on lake water
3.3 The Biology and Ecosystems of Acidic Pit Lakes 149
and sediment chemistry (e.g. Arts 2002; Farmer 1990; Smolders 2002). Indicatorsystems based on characteristic macrophyte communities have been developed inGermany to assess the trophic status of lakes and running waters (e.g. Kohler andSchneider 2003; Melzer 1999). In addition to natural lakes, a large number of newartificial water bodies have formed in Germany over the last few decades or are inthe process of being formed in the old open cast lignite mining pits (Nixdorf et al.2005; see also Sects. 2.1 and 5.1). Many of these lakes are strongly acidified due topyrite or marcasite oxidation. As a result, some of them offer living conditionscomparable to extreme naturally occurring habitats, like volcanic crater lakes.Nevertheless, the lakes have been and are being colonized by specialized species.The most extensive work in the world on macrophyte colonization of this extremeenvironment was undertaken in the Lusatian Mining District (LMD) in Germany(Pietsch 1965, 1970, 1973, 1998). Overall, 234 water bodies ranging from acidic toneutral have been investigated since 1963, and a macrophyte community sequencehas been developed that characterizes the aging process of the acidic mining lakes(Pietsch 1998). The latest research has focused on macrophyte species in stronglyacidic mining lakes (e.g. Chabbi 1999, 2003; Chabbi et al. 2001; Fyson 2000;Küsel et al. 2003; Nixdorf et al. 2001).
There is an increasing demand for knowledge of macrophyte colonization ofmining lakes. First, there are commitments to evaluate the ecological state ofmining lakes larger than 50 ha to comply with the EU Water Framework Directive(WFD; Nixdorf 2005). Macrophytes are commonly used as an indicator for theecological state of lakes and running waters (e.g. Meilinger et al. 2005;Schaumburg et al. 2004; Stelzer et al. 2005), but until now, no WFD classificationfor mining lakes has been developed that takes into account acidified mining lakes.In addition, mass development of indigenous and neophytic macrophytes is aproblem in water ecosystems all over the world and threatens the planned usage oflarge mining lakes. The most prominent example is the invasion of the neophyticmacrophyte species Elodea nuttallii in the formerly acidic mining lake Goitschenear Bitterfeld (Hilt et al. 2006; Rönicke et al. 2006). Here, the main macrophytecommunities, the adaptations of selected species, and the possibility of invasionsof unwanted aquatic weeds in mining lakes shall be discussed.
Vegetation of Mining Lakes
In the most acidic mining lakes, pHs down to 1.9 have been reported (Pietsch1998). Their water is strongly buffered by an iron buffer system (Klapper andSchultze 1995; Nixdorf et al. 2003). At a pH between 4 and 5, the buffer systemchanges to an aluminum buffer system, which is also characteristic of acidified softwater ecosystems with a comparable pH. At a circumneutral state, a calciumbicarbonate buffer system prevails.
Pietsch (1998) identified four different stages of macrophyte colonization inmining lakes that are mostly concordant with these buffering systems. Theso-called Initial and Early Stage referred to mining lakes that have a pH below 4.
The Transitional Stage included mining waters with a pH ranging from 4 to 6. TheClimax Stage consisted of weakly acidic to weakly alkaline mining lakes with apH of 6 to 8.
Young lakes of the Initial Stage were found to lack macrophyte vegetation dueto extreme chemical conditions and other adverse factors, like unstable soil sub-strates (Pietsch 1998). The older Early Stage lakes (ca. 10 years) had somewhatmitigated chemical characteristics but still had a pH less than 4. An overview ofmacrophyte species occurring in these mining waters is provided (Table 3.16). Themain types of vegetation described by Pietsch (1998) were dominant stands of thesubmerged growing bulbosus rush (Juncus bulbosus) and/or emergent reed spe-cies. Bog mosses (Sphagnum div. spec.), Potamogeton natans, and the neophyticMyriophyllum heterophyllum were also observed at a pH below 4 (Pietsch 1998;Pietsch and Jentsch 1984), and also commonly occur in Transitional Stage lakes.
In addition to the species mentioned by Pietsch (1998), Samecka-Cymermanand Kempers (2001) found the moss Drepanocladus aduncus as the only sub-merged macrophyte in a Polish mining lake at a pH of 2.8. Other mosses of thegenus Drepanocladus are known to grow in volcanic crater lakes (e.g. Satake2000) as well as acidic arctic ponds, at a pH from 2.8 to 3.8 (Havas and Hutch-inson 1983; Hawes et al. 2002; see also Sect. 5.7.4).
Despite comparable chemical properties, the mentioned mosses do not seem tobe common in acidic mining lakes. The moss Leptodictyum riparium has onlybeen reported from a neutral mining lake (Hussner et al. 2005; own observation)even though it is able to survive at a pH down to 1.6 in a volcanic crater lake(Tamura 1936, cited in Havas and Hutchinson 1983). Additionally, it has beenfound together with a sedge, Eleocharis acicularis, in secondary acidified Cana-dian lakes (Gorham and Gordon 1963).
Flowing waters affected by acid mine drainage (AMD) in North America haveoften been found to be colonized by E. acicularis (e.g. Koryak and Reilly 1984; Krohand Schein 1981; Rothrock and Wagner 1975). The lowest pH reported from thesesites was 2.85. We have observed this species in mining lakes in Germany with a pHaround 4 as well as in circumneutral pH mining lakes. Additionally Pietsch (1998)mentions an E. acicularis dominated vegetation type (Littorello—Eleocharietumacicularis) typical for fish ponds as one of the Climax Stages of macrophyte colo-nization in circumneutral mining lakes in the LMD. Other examples of submergedmacrophytes in strongly acidic flowing waters affected by AMD are the liverwortScapania nemorosa (Engleman and McDiffett 1996), Sparganium emersum (Sand-Jensen and Rasmussen 1978) and S. americanum (Rothrock and Wagner 1975).
For Transitional Stage mining lakes, Pietsch (1998) described various J. bulbosusassociations that show some similarities to the vegetation of natural lakes. Massivegrowth of Juncus bulbosus together with bog mosses (Sphagnum div. spec.) wasreported from secondarily acidified soft water lakes (e. g. Arts 2002; Melzer 1997;Melzer and Rothmeyer 1983; Melzer et al. 1985; Roelofs et al. 1995; Smolders et al.2002). Outside of the Lusatian Mining District, this type of vegetation has beenfound in acidified Bavarian mining lakes near Schwandorf (C. Weilner, personalcommunication) and in mining waters of the Helmstedt Mining District in Lower
3.3 The Biology and Ecosystems of Acidic Pit Lakes 151
Saxony (Wiegleb 1978). Other common species in the Transitional Stage are thefern Pilularia globulifera, the pondweeds Potamogeton natans and P. polygonifo-lius, and the mixotrophic bladderworts Utricularia minor and U. ochroleuca(Pietsch 1998). While the first three species are also known from acidic softwaterlakes (e.g. Eriksson et al. 1983; Srivastava et al. 1995), the latter are typical for fens,bogs, or heath ponds (Pott 1995). As has been mentioned before, the neophyticspecies M. heterophyllum is also frequent in lakes of the Transitional Stage,developing dense dominant stands. In Germany, mainly manmade waters arecolonized (Pietsch and Jentsch 1984).
Overall, Transitional Stage mining waters are rarely found in Germany outsideof the LMD due to differing geological conditions. Klapper and Schultze (1995)showed that most mining lakes in the Central German Mining District (CGMD)are either strongly acidified or neutral. In the Lower Rhine Mining District(LRMD), only two small acidified mining lakes exist (Christmann 1998). Thesame can be assumed for some of the vegetation types of the Climax Stagedisplayed by Pietsch (1998). As he mentions himself, most of these are typical ofthe Lusatian region and mainly occur in bog and heath ponds.
Christmann (1998), in contrast, describes mainly typical hardwater macrophytespecies in the LRMD. Similarly, we have found macrophyte communities knownfrom neutral hardwater lakes in over 30 mainly neutral mining lakes in the most
Table 3.16 Submerged and emergent macrophyte species occurring in mining waters with a pHbelow 4
Species References
Submerged speciesDrepanocladus aduncus Samecka-Cymerman and Kempers (2001)Eleocharis acicularis Rothrock and Wagner (1975)Juncus bulbosus Chabbi (1999), Nixdorf et al. (2001), Pietsch (1998), Wiegleb
(1978)Myriophyllum
heterophyllumPietsch and Jentsch (1984)
Potamogeton natans Pietsch (1998)Sparganium americanum Rothrock and Wagner (1975)Sparganium emersum Sand-Jensen and Rasmussen (1978), Nixdorf (2001)Scapania nemorosa Engleman and McDiffett (1996)Sphagnum div. spec. Pietsch (1998), Wiegleb (1978)Emergent speciesCarex rostrata Mayes et al. (2008), Nixdorf et al. (2001), Pietsch (1998)Eriophorum angustifolium Mayes et al. (2008), Nixdorf et al. (2001), Pietsch (1998)Eleocharis acicularis Rothrock and Wagner (1975)Juncus bulbosus Chabbi (1999), Nixdorf et al. (2001), Pietsch (1998)Juncus effusus Mayes et al. (2008), Nixdorf et al. (2001), Pietsch (1998)Phragmites australis Mayes et al. (2008), Nixdorf et al. (2001), Pietsch (1998)Schoenoplectus lacustris Mayes et al. (2008), Nixdorf et al. (2001), Pietsch (1998)Typha angustifolia Mayes et al. (2008), Nixdorf et al. (2001), Pietsch (1998)Typha latifolia Mayes et al. (2008), Nixdorf et al. (2001), Pietsch (1998)
152 3 Limnology of Pit Lakes
important lignite mining districts in Germany (Fig. 3.65). The species composition ismostly influenced by the trophic state, as also occurs in natural neutral hardwaterlakes (Melzer 1999). Lackmann (1998) gives an example from the vegetation of threemining lakes from the LRMD. Charophytes dominate an oligotrophic lake whilemore eutraphent higher plants occur in the eutrophicated lakes. Pietsch (1998)mentions lakes dominated by Chara hispida as a possible climax state in neutralmining lakes, mainly outside of the LMD. Our investigations show that C. hispida isonly one of several different charophyte species that frequently occur in oligotrophicmining lakes (see Table 3.17). These lakes are unusually transparent, which hasallowed macrophyte vegetation down to a depth of 20 m. One intensively investi-gated example is the Kulkwitzer Lake west of Leipzig (Doege et al. 2006).
We have observed that mainly higher plants from the genera Myriophyllum andPotamogeton generally dominate mesotrophic to eutrophic mining lakes. Similarto natural lakes, very eutrophic mining lakes may lack submerged vegetation dueto turbidity.
Strategies of Macrophyte Survival in Acidic Environments
In acidic environments, aquatic plants are faced with adverse conditions. Oneimportant peculiarity of most acidified waters is the low content of dissolvedinorganic carbon (DIC) in the water column, which occurs almost totally as free CO2,in equilibrium with the atmosphere below a pH of 4.5 (Klapper and Schultze 1995;
monospecific stands ofJuncus bulbosus and
reed species
species poorJuncus bulbosus
associations
species richJuncus bulbosus
associations
charophytes higher plants free of submergedmacrophytes
3.3 The Biology and Ecosystems of Acidic Pit Lakes 153
see also Sects. 3.3.1.1, 3.3.1.4 and 3.3.2.2). Low DIC concentrations can limitmacrophyte growth at low pH more than the acidity (e.g. Pagano and Titus 2007;Roelofs et al. 1984; Titus et al. 1990). This is not the case for emergent macrophytespecies, such as Phragmites australis or Typha latifolia (see Table 3.16), and speciespossessing floating leaves, like Potamogeton natans or P. polygonifolius (Maberlyand Madsen 2002), due to their ability to use atmospheric CO2. Juncus bulbosus hasmany adaptations that allow it to thrive in low DIC environments (Table 3.18).Wetzel et al. (1984) demonstrated the ability of bulbous rush to recycle CO2 origi-nating from its own respiration in the lacunar system of the plant. Additionally, thespecies can rely on higher DIC concentrations in sediment pore water (Roelofs et al.1984; Wetzel et al. 1985). Root uptake can account for 15–35% of the total CO2
demand of the plant (Raven et al. 1988), which is extremely high, second only tovarious isoetid species (Maberly and Madsen 2002). Additionally, the species ben-efits from bacterial CO2 production in the rhizosphere as well as in the sediment–water interface (Wetzel et al. 1984, 1985). Comparable results were shown byChabbi et al. (2001) and Küsel et al. (2003). They assumed greater CO2 availabilitydue to microbial decomposition of organic root exudates by bacteria inhabitingmicrospaces in iron plaques around the roots of J. bulbosus. The Sphagnum speciesthat occur in acidified mining lakes or soft water lakes together with J. bulbosus areCO2-dependent and do not possess roots. Observations of Roelofs (1983) show thehighest sediment pore water DIC concentrations beneath Sphagnum beds. Thisindicates a ‘‘local CO2’’ supply as would be the case near the sediment–waterinterface. Maberly and Madsen (2002) have suggested that this CO2 uptake strategyis also used by species of the genus Utricularia. Eleocharis acicularis may possess aC4-like carbon fixation (Keeley and Sandquist 1991) that is comparable to thecrassulacean acid metabolism often found in isoetid species (Keeley 1998).
Another characteristic of acidified mining lakes is a high concentration ofNH4
+, which results from inhibited nitrification (Nixdorf et al. 2001), which can be
Table 3.17 Examples of dominant charophyte species in oligotrophic neutral mining lakes inGermany
Dominant charopyhte species Bla Bor Hel Kul Mar WerChara contraria m m m m m m
Chara globularis m m m m
Chara hispida m m
Chara polyacantha m
Chara vulgaris m m m
Nitella mucronata m
Nitella opaca m m m m m
Nitellopsis obtusa m m
Maximum macrophytedepth limit, m
16 19 16 19 10 13
Bla: Blausteinsee (LRMD), Bor: Borkener See (BMD), Kul: Kulkwitzer See (CGMD), Mar:Markkleeberger See (CGMD), Wer: Werbener See (CGMD), Hel: Helenesee with Katjasee(LMD); BMD: Borken Mining District (Hessen), unpublished data (Beck 2006–2007)
154 3 Limnology of Pit Lakes
toxic to some aquatic plants (e.g. Glänzer et al. 1977; van Katwijk et al. 1997).Many submerged macrophyte species occurring in acidic mining lakes show apreference for ammonium uptake. J. bulbosus predominantly uses ammonium as anitrogen source (Schuurkes et al. 1986) but can also use nitrate, to a lesser extent.Exclusive ammonium use and high tolerances have also been shown for differentSphagnum species (Paffen and Roelofs 1991; Schuurkes et al. 1986). It has beenassumed that the elevation of ammonium together with DIC were key factors forextensive growth of J. bulbosus and Sphagnum in acidified softwater lakes (Arts2002; Farmer 1990; Smolders et al. 2002). In situ experiments showed little nitratereductase activity by Potamogeton natans (Melzer 1980), which implies prefer-ential ammonium use. This is supported by reports of high ammonium concen-trations in a typical P. natans association in a small stream influenced by acidicwater from mining lake Bergwitzsee (Köck 1981). Pietsch and Jentsch (1984)describe habitats for Myriophyllum heterophyllum that are surprisingly low inammonium concentrations unless it colonizes acidified sites with a pH down to3.7. This may indicate that high ammonium concentrations negatively affect thisspecies.
The high solubility of most metals under low pH conditions and the possiblyphytotoxic effect of the resulting high concentrations is another characteristic ofacidic mining lakes (Nixdorf 2001). Some macrophytes have been shown toaccumulate high concentrations of heavy metals without toxic effects (e.g. Aulio1986; Farmer 1990). This allows certain reed species to be used in wetlandsconstructed for remediation of polluted areas (e.g. Mayes et al. 2008). There aretwo principle ways for plants to avoid heavy metal toxicity; the first is to preventthe uptake of the toxic ions and the other is to dispose of any that enters the plant(Reichman 2002). Iron and manganese root plaque formation, which results fromradial oxygen loss by aquatic plants and acts as a physical barrier or site ofprecipitation, is widely discussed as a heavy metal tolerance mechanism (e.g.Batty et al. 2002; Chabbi 1999, 2003; Ye et al. 2001). Different iron tolerancesamong fen plants have been shown to be related to iron plaque formation on theroots (Snowden and Wheeler 1993, 1995). Some of the most iron tolerant speciesof the study, like Eriophorum angustifolium or Juncus effusus, are found instrongly acidified mining lakes (Table 3.16). However, the role of the plaques isnot clarified. Negative effects of root plaque formation have been shown for theacid-tolerant species Lobelia dortmanna (e.g. Christensen and Wigand 1998;Christensen et al. 1998). Organic acids exudation also plays a role in metal tol-erance of plants by formation of complexes (Reichman 2002) but the function isalso unclear and very species specific (Jones 1998). For J. bulbosus, organic acidexudation over the roots has been reported (Chabbi et al. 2001; Küsel et al. 2003),which might additionally favor the occurrence of the species in very acidic hab-itats. Internal mechanisms for metal tolerance have been reviewed by Reichman(2002) and include: compartmentation in vacuoles, complexing with phytochela-tins, methallothioneins, organic acids, and inorganic and organic ligands, as wellas alterations in cell metabolism. However, as the author mentioned, additionalresearch is needed to reveal species specific mechanisms. For J. bulbosus, it has
3.3 The Biology and Ecosystems of Acidic Pit Lakes 155
been shown that metals are internally accumulated at the rhizodermis, exodermis,and endodermis (Chabbi 1999, 2003). Aquatic mosses have been found to accu-mulate metals in or at their cell walls (e.g. Crowder 1991; Engleman and McDiffett1996; Satake 2000). In this context, cation exchange capacities of the species playan important role (Crowder 1991; Reichman 2002), which is especially high inSphagnum mosses (e.g. Breuer and Melzer 1990a, 1990b; Clymo and Hayward1982).
Macrophyte Invasions in Mining Lakes
The invasion of aquatic ecosystems by neophytic macrophyte species and theirnegative consequences to the ecosystem and to public use of the water bodies areknown from all over the world (Willby 2007). The economical costs of invasionscan be huge. For example, mass development of Myriophyllum spicatum hascaused annual losses of 30–45 million US $ in the Truckee River watershed in theUSA (Charles and Dukes 2007).
The impacts of a neophytic invasion were impressively demonstrated by themass development of Elodea nuttallii in the formerly acidic mining lake Goitsche,near Bitterfeld (Hilt et al. 2006; Rönicke et al. 2006). It occurred in 2004 only twoyears after the pit was fully flooded with eutrophic river water, which also led toneutralization of the lake (Schultze and Geller 2004). The plants formed densefloating canopies more than 5 m deep, which seriously restricted the use of thelake for swimming, boating, and fishing. Subsequently, the mass development hasbeen less intense although the only countermeasure that has been taken has beenmowing stands of the species. Hilt et al. (2006) mentioned annual expensesranging from 19,000 to 130,000 € spent in mowing E. nuttallii in other German
Table 3.18 Effects of low pH-environment and adaptations of Juncus bulbosus
Effect Adaptation Reference
Low DIC in water column Internal CO2 recycling Wetzel et al. (1984)CO2 uptake from sediment
and waterWetzel et al. (1985),
Roelofs et al. (1984)Microbial CO2 production
in iron root plaquesChabbi (2001),
Küsel (2003)High NH4
+ concentrations Almost exclusiveammonium use
Schuurkes et al. (1986)
High concentrations ofdissolved metals
Iron and manganese rootplaque formationa
Chabbi (1999)
Exudation of organic acidsa Chabbi (2001),Küsel (2003)
Internal barriers Chabbi (1999),Chabbi (2003)
High turbidity Extremely low lightcompensation point
Roelofs et al. (1985)
a unclear function
156 3 Limnology of Pit Lakes
lakes. Like most other neophytic aquatic weeds, E. nuttallii is distributed easily byfragments of the plants (e.g. Di Nino et al. 2005). In the case of Lake Goitsche, thegreat flood in August 2002 caused the river Mulde to break through into the lakebasin. This probably led to wide distribution of Elodea fragments which, alongwith nutrients provided by the flood water and other inflows, resulted in nuisancemacrophyte developments and eutrophication. Nutrient-rich sediments can alsopromote eutraphent species like E. nuttallii, even under oligotrophic conditions(Angelstein 2008).
Typically, charophyte communities dominate nutrient-poor lakes. These are notproblematic, even if occurring in masses. Additionally, they are beneficial sincethey help maintain the oligotrophic state by acting as a nutrient sink (Hilt et al.2006; Kufel and Kufel 2002; Kufel and Ozimek 1994). In Lake Goitsche,charophytes can compete even with the very aggressive E. nuttallii during ongoingoligotrophication of the lake (personal observations).
In contrast to circumneutral mining lakes, the extreme habitat conditions ofstrongly acidified mining lakes restrict the occurrence of macrophytes to a smallgroup of adapted species. Even so, mass developments of Myriophyllum hetero-phyllum in mining lakes with a pH down to 3.7 have demonstrated that such eco-systems can be invaded by neophytic species (Pietsch and Jentsch 1984).Additionally, some other invasive neophytic macrophytes can colonize acidifiedlakes. For example Cabomba caroliniana (Crow and Hellquist 2000; Hogsden et al.2007) or Crassula helmsii (Klavsen and Maberly 2009) might be problematic in suchlakes in the future, though there is no evidence of invasions in Germany yet.
No neophytic macrophyte occurrence has been reported in the most acidifiedmining lakes. However, the predominant indigenous species in these lakes,J. bulbosus, can be considered to be invasive as well. Examples of dense floatingmats can be seen in Lake Senftenberg (see Fig. 4 C in Chabbi 1999) and weredescribed by Pietsch (1998). From natural waters, problems with mass occurrencesof bulbosus rush have been documented (e.g. Roelofs et al. 1994; Rorslett 1988).Dense stands of the species can produce impressive biomass of more than 1,000 gdry weight m-2 (Roelofs et al. 1994). In acidic mining lakes with extensiveshallow areas, even extensive stands of reed species like Phragmites australismight interfere with planned uses of the lake (see Fig. 3.66).
At near-neutral pH, a great variety of neophytic as well as indigenous macro-phyte species are capable of causing a nuisance. Gollasch and Nehring (2006) haveprovided a list of aquatic neophytes in Germany. Evidence of macrophyte massdevelopments, mainly in natural lakes, was shown by Hilt et al. (2006), whileTable 3.19 lists examples in mining lakes. Rising water temperatures associatedwith climate change will further increase the number of potential invasive species(Hussner and Lösch 2005; Willby 2007).
Considering the great variety of possible invaders, it has to be realized that ‘‘…invasions are more than just likely, they are inevitable.’’ (McIntosh et al. 2007).Nevertheless, some considerations might mitigate or even prevent macrophyteinvasions in future mining lakes. As has been mentioned, flooding water plays animportant role. Eutrophic flooding water should be avoided whenever possible.
3.3 The Biology and Ecosystems of Acidic Pit Lakes 157
Fig. 3.66 Examples of dominance stands of Myriophyllum heterophyllum (a) and Phragmitesaustralis (b) in German mining lakes (Photos by B. Beck 2006–2007)
Table 3.19 Examples of mass developments of neophytic (N) and indigenous (I) macrophytespecies observed in mining lakes from acidic to neutral
Myriophyllum spicatum(I) Circumneutral Speicher Knappenrode a
Myriophyllum verticillatum(I) Circumneutral Zechau III a
a own observation; b Rönicke et al. (2006); c Hilt et al. (2006), d Hussner (2005)
158 3 Limnology of Pit Lakes
Additionally, knowledge about potential invasive species in the watershed of theriver could be useful in assessing invasion risk. Another problem to be consideredis the planned connection of mining lakes with channels for boating. If one lake isinvaded, the invasion risk for connected lakes rises due to propagule dispersion byeither boating or water flow (e.g. Jacobs and Macisaac 2009). Finally, the mor-phology of the lake basins can promote intensive macrophyte growth by offeringwide areas of shallow water with an approximate depth of 5 m or less (see Sect.2.1). The creation of steep shores in critical lake areas could at least preventfloating stands of rooted macrophyte species.
3.3.2.2 Zygnematalean Green Algae (Streptophyta, Zygnematales) in LakesImpacted by Acidic Precipitation, Experimental Acidification,and Acid Mine Drainage
Andreas Kleeberg
Introduction
The green algal order Zygnematales has long been known to occur in diverse habitatsworldwide (West and Starkey 1915). They occur in brackish and limnic waters,including natural acidic freshwaters (Greenwood and Lowe 2006; Hoshaw andMcCourt 1988) and even in the Antarctic (Hawes 1989). Zygnematales typicallycolonize stagnant shallow lakes, ponds, pools, acidic wetlands (Greenwood andLowe 2006), and the slow-flowing parts of running waters over a large pH range(Hoshaw and McCourt 1988). The dispersion of the Zygnemataceae due to acidifi-cation was documented for the first time in Scandinavia (Hendrey et al. 1976) andlater in experimentally acidified (pH 4.5–6.2) lakes in North America (e.g. Stokes1986). Zygnematalean green algae (ZGA) also occur in freshwaters that have beenacidified by acid mine drainage (AMD; Bray 2007; Kleeberg et al. 2006).
Previous authors have focused on diverse facets of zygnematalean biology: (1)identification (France et al. 1992), (2) distribution (e.g. Howell et al. 1990; Turneret al. 1995a, b, c), (3) function as pH indicator species (e.g. Greenwood and Lowe2006; Jackson et al. 1990; Verb and Vis 2005; Vinebrooke 1996; Vinebrooke andGraham 1997), (4) nutrient interactions (e.g. Fairchild and Lowe 1984; Hansson1989; Graham and Vinebrooke 1998; Müller 1980; Niyogi et al. 1999; Pringle1987), and (5) ecophysiology (Donahue et al. 2003; Graham et al. 1996; Gross2000; Klug and Fischer 2000; Sheath et al. 1996). These studies, mostly for NorthAmerica, further emphasize the importance of Zygnematales in acidic lakes.Several review articles provide useful general coverage of Zygnematales (Hoshawand McCourt 1988), methodology (Aloi 1990), and the effects of acidification onZygnematales (Planas 1996).
This chapter aims to summarize scientific knowledge on ZGA in freshwatersthat have been impacted by acid rain, experimental acid additions, and acid mine
3.3 The Biology and Ecosystems of Acidic Pit Lakes 159
effluents, and raise issues that require future study on this functional group inacidic mining lakes. For the purposes of this project, it was not appropriate toinclude coverage of humic (bog/peatland) lakes or acidic hot springs.
General Features of Zygnematales
Zygnematales and Desmidiales are exceptionally diverse and numerous in acidic(humic) lakes and bogs. The Zygnematales include the unicellular saccodermdesmids and closely related unbranched filamentous algae, such as the genusZygnema (for which the order is named). Zygnematales are classified in thephylum Streptophyta, which includes the land plants (Bremer et al. 1987), or inCharophyta (Lewis and McCourt 2004), instead of in Chlorophyta. Modern sys-tematic treatments apply the term Chlorophyta to groups of green algae that do notinclude the Zygnemataleans. It is important to note that the filamentous zygne-mataleans do not form a separate clade from closely related saccoderm unicells.Zygnematales and Desmidiales are monophyletic sister clades that together form amonophyletic group/class, variously named Zygnemophyceae or Zygnematophy-ceae. The family Zygnemataceae represents unbranched ZGA, which sexuallyreproduce by conjugation as shared with Desmidiales. 13 genera with 784 speciesbelong to the Zygnemataceae (Hoshaw and McCourt 1988). Only a few special-ized genera occurring in acidic waters (pH \ 5) are considered (Table 3.20).
Distinctive Features of Zygnematalean Green Algae
Conjugation distinguishes the Zygnemataceae from all other filamentous Strep-tophyta, except for a few species of filamentous desmids; for details, seeKadłubowska (1984) and Hoshaw and McCourt (1988).
ZGA, such as Mougeotia spp., Spirogyra spp., and Zygogonium spp., excretecopious amounts of muscilaginous substances, which prevent colonization byepiphytic algae (Vinebrooke et al. 2001). The metaphytic floating growth formsmay also be unreliable and physically inaccessible to most littoral organisms.
Table 3.20 Systematic classification of filamentous green algae of Zygnemataceae with theacidophilic genera occurring in acidic waters, with the number of their species and their per-centages on species number of the family (Kadłubowska 1984; Hoshaw and McCourt 1988)
Therefore, the blooms and mats, respectively, of ZGA occur because they out-compete other species at conditions of low concentrations of dissolved inorganiccarbon (DIC) and grazing pressure (Vinebrooke et al. 2001).
Chloroplast movement is a light-driven phytochrome-mediated process. Forexample, in response to direct light, the chloroplast of Mougeotia spec. rotates aboutthe long axis of the cell to change the amount of surface area exposed to light. In lowlight, the large flat side of the chloroplast faces the light. In bright light, the narrowedge profile is turned toward the light (Hoshaw and McCourt 1988).
Ecological Importance of Zygnematalean Green Algae
The acidification-induced growth of ZGA in lakes is most probably primarilya water temperature governed seasonal phenomenon, whereat the maximalabundances can fluctuate from lake to lake and from year to year (Morin andCattaneo 1992; Planas 1996). While diatoms (e.g. Bacillariophyceae) have beenused for a long time for pH indication (Hustedt 1939), the ZGA were linked tothe acidification of lakes considerably later (Hendrey et al. 1976). In particular,the species of the genus Zygogonium (Table 3.20) are acidobiontic (dependent onacidity) indicator species, which exhibit broad acidity tolerance (Vinebrookeet al. 2001).
ZGA have an important influence on nutrient cycles (C, N, and P), and partly onthe deposition of nutrients (Turner et al. 1995a, b), and can considerably contributeto the benthic C accumulation. They also influence the biogenic alkalinitygeneration via the sulfur cycle, by moving the horizon, in which the benthic sulfatereduction occurs, into larger sediment depth where the reoxidation of depositedreduced compounds is prevented (Koschorreck et al. 2007; Turner et al. 1995b).Thus ZGA can be important for the mediation of the internal alkalinity generationof acid mining lakes (Kleeberg et al. 2006; Koschorreck et al. 2007).
The respective zonation of the ZGA can be assigned to specific ecologicallydefined growth forms—mostly associated with the littoral sediment –according tomorphology, chemistry, trophy and light climate of a lake:
• Periphyton—microfloral community, which lives on surfaces of submersedobjects and substrates, respectively (Roll 1939), which does not include fungi,bacteria and protozoa and other animal components (unequal to the Germanterm ‘Aufwuchs’, Weber 1973).
• Metaphyton—amounts of filamentous algae, which are conjunct with benthicsubstrates. However, these algae can also form loose flocs, mats or clouds,which lie on the bottom or which float above the bottom (Behre 1956; Wetzel1983). Metaphyton is synonym to the older terms tychoplankton, pseudo-plankton (Naumann 1931) and pseudoperiphyton (Sládecková 1960).
The classification of ZGA to peri- or metaphyton is not always clear, sinceperiphytic algae can pass into metaphytic aggregations in response to hydrostaticpressure (Howell et al. 1990), wind-induced water movement (Turner et al. 1987),
3.3 The Biology and Ecosystems of Acidic Pit Lakes 161
at changes of species composition along with a decreasing pH (Howell et al. 1990;Turner et al. 1995a). Intensive primary production (PP) at low depths, withsimultaneous formation of O2 bubbles within the densely-packed associations of thefilaments (Fig. 3.67), supports the buoyancy of algal canopies (Hillebrand 1983).
Motility may be favored to best use environmental resources, light, CO2, or toescape unfavorable conditions. Specific cell wall components such as algaenan, orpossessing non-cellulosic cell walls may also facilitate growth and tolerance oflow pH conditions (Bray 2007).
The pH-dependent Occurrence of Zygnematalean Green Algae
Acid and acidified waters are colonized by acidophilic (limited to growth in acidicconditions) and acid-tolerant (highly tolerant of acidic conditions) species of ZGA.Acidophilic algae, which occur down to pH values of 0.05, are not able to grow atneutral pH. For algae that live in very low pH conditions, several adaptations arenecessary. For growth at low pH, a neutral cell pH must be maintained, which is
Fig. 3.67 a periphytic canopy of Zygogonium ericetorum at the sediment surface of acidic(pH & 3) mining lake Grünewalder Lauch, Lusatia, Germany, b dense cover of Z. ericetorum atthe sediment surface after 14 days of incubation of an in situ pore water sampler in the same lake(photos by M. Beyer), c momentary (jellyfish-like) flotation of Z. ericetorum at the water surfacedue to intensive O2 production and its related enclosure of O2 bubbles (photo by B. Grüneberg),and d microscopic picture of filaments of Zygnema spec. with the stellate and asteroidalchloroplasts, respectively (photo by H. Täuscher)
162 3 Limnology of Pit Lakes
made possible by a relatively impermeable plasma membrane, reduced protonfluxes, and increased proton pump efficiency (e.g. Gross 2000). In addition, thealgae have to cope with a restricted supply of CO2 for photosynthesis since HCO3
-
is absent. Although DIC limits benthic PP in acid lakes (Klug and Fischer 2000),the species of Zygnemataceae are superior to other species (Vinebrooke 1996).Thus, most studies show that acidification increases the benthic algae biomass inboth the littoral zones of lakes and in lotic systems (Planas 1996). Consequently,due to the high CO2-requirements and ambient shortages, ZGA in acidic envi-ronments must have a CO2 concentration mechanism (Gross 2000).
• Acidophilic to acid-tolerant peri- and metaphyton in lakes is composed mainlyof the genera given in Table 3.20. At pH 5.5–4.8, acidophilic Zygnemataceae,such as Spirogyra spp. and Mougeotia spp., occur (Table 3.21).
• Usually, ZGA are found in monospecific aggregations below pH 4.8 (Franceet al. 1992). Usually a metaphytic coverage hardly exists below a water depth of3 m. At all depths, the biomass and PP decreases with the lowering of lightsupply (e.g. Planas 1996; Schindler 1993). If the pH decreases\4.8, Spirogyraspp. and Mougeotia spp. (Table 3.21) are displaced by Zygogonium spp. (Turneret al. 1995a, b), which are acid-tolerant over a wide span of pH (Table 3.22).
• Peri- and metaphytic aggregations, which are exposed to the conditions of a highacidity, often consist of dense filamentous canopies of Zygogonium ericetorumKütz., 1843. Thus, this species paid attention to for a long time (Hodgetts 1918;West and Starkey 1915). While this acidobiontic indicator species colonized thewhole shore area in an anthropogenic, acidified (pH \ 5.6) lake (Planas 1996), itcovered about 88.3% of the bottom in an acidic (pH B 3) mining lake,Grünewalder Lauch, Lusatia, Germany (Kleeberg et al. 2006).
Factors that Determine the Distribution and Productivityof Zygnematalean Green Algae
Besides the direct physiological effects of the acid on the acid-tolerant ZGA (e.g.Klug and Fischer 2000), their species composition, biomass, and PP are deter-mined by abiotic and biotic factors. The abiotic factors are: (1) pH, i.e. prevailingH+ and metal concentrations; (2) limiting nutrients; (3) penetration depth of light,water temperature, and movement; (4) interfaces of the metaphytic mats, as wellas; (5) substrate availability. The biotic factors include (1) the community of thelittoral herbivorous macroinvertebrates and (2) competition for a limiting resource.
Abiotic Factors that Determine Distribution and Productivity
Ecosystematic disturbances that accompany the acidification of lakes, cannot beexclusively attributed to the potential toxicity of the H+ and metal concentrations,particularly that of Al. The changed biogeochemical cycle of different components
3.3 The Biology and Ecosystems of Acidic Pit Lakes 163
Tab
le3.
21O
ccur
renc
ean
ddo
min
atin
ggr
owth
form
sof
Mou
geot
iasp
p.,
Zyg
nem
atac
eae,
atre
spec
tive
pHin
natu
ral,
acid
and
circ
um-n
eutr
alas
wel
las
arti
fici
alfr
eshw
ater
syst
ems
(acc
ordi
ngto
Gra
ham
etal
.19
96,
chan
ged
and
supp
lem
ente
d).
AM
D—
acid
min
edr
aina
ge
Gro
wth
form
Occ
urre
nce
pHS
ourc
e
Ben
thic
and
plan
kton
icT
undr
a,po
nd,
Kap
Bat
hurs
tar
ea8.
1–8.
2S
heat
het
al.
(198
2)a
Flo
atin
gm
ats
Eut
roph
icpo
nd,
the
Net
herl
ands
7.5–
9.9
Hil
lebr
and
(198
3)F
loat
ing
mat
sP
ond
inco
asta
ldu
nes,
the
Net
herl
ands
5.5–
8.2
Sim
ons
(198
7)W
ith
the
sedi
men
tas
soci
ated
fila
men
tsG
eorg
iaB
ayan
dN
orth
Tun
nel,
Ont
ario
6.6–
7S
heat
het
al.
(198
8)A
ssoc
iate
dw
ith
ston
esS
trea
ms
ofth
eS
igny
Isla
nds,
Ant
arct
ica
6–7
Haw
es(1
989)
b
Agg
rega
tes
asso
ciat
edw
ith
diff
eren
tsu
bstr
ates
Aci
difi
edso
ftw
ater
lake
s,N
EP
A,
US
A4.
4–6.
2F
airs
hild
and
She
rman
(199
3)c
Met
aphy
tic
mat
sL
ake
223,
expe
rim
enta
lla
kear
ea,
Ont
ario
5.1–
5.6,
5.0–
5.2
Sch
indl
eret
al.
(198
5);
Tur
ner
etal
.(1
987)
Alg
alm
ats
Gro
undw
ater
infl
uenc
edla
ke,
mid
-Wis
cons
in4.
7–5.
6W
ebst
er(1
992)
d
Met
aphy
tic
mat
sL
ake
Lit
tle
Roc
k,W
isco
nsin
,en
clos
ure
4.7
Klu
gan
dF
isch
er(2
000)
Agg
rega
teas
soci
ated
wit
hdi
vers
esu
bstr
ates
Aci
difi
edri
vers
,S
cotl
and
4.4–
6.7
Kin
ross
etal
.(1
993)
Per
iphy
ton
com
mun
ity
AM
Dst
ress
edri
vers
,W
estp
ort,
New
Zea
land
e3.
2±
0.1
Bra
y(2
007)
Mac
roal
gal
com
mun
ity
AM
Dim
pact
edH
ocki
ngri
ver
site
s,O
H,
US
A2.
6–8.
2V
erb
and
Vis
(200
1)P
erip
hyto
nas
sam
blag
eA
MD
impa
cted
stre
amsi
tes,
ungl
acia
ted
wes
tern
All
eghe
nyP
late
au,
OH
,U
SA
1.6–
4.7
Ver
ban
dV
is(2
005)
Per
iphy
tic
patc
hes
Río
Tin
to,
SS
pain
f1.
5–2.
5S
abat
eret
al.
(200
3)a
Mou
geot
iadi
dno
tocc
urin
pond
sw
ith
pH3.
6,2.
0,an
d1.
8;b
inth
eco
ldst
ream
sgr
azer
sdi
dno
tocc
ur(s
eebe
low
);c
for
Mou
geot
ia,t
heau
thor
sga
vea
pHop
tim
umof
5.3
±0.
8;d
the
max
imum
ofbi
omas
sw
asde
term
ined
atpH
5.2;
eM
ouge
otia
cf.
depr
essa
,(H
ass.
),M
.cf
.la
evis
(Küt
z.)
and
Zyg
nem
ac.
f.cy
lind
rosp
erm
um(W
est
etW
est)
;f
inR
íoT
into
,at
pH0.
8–3,
Zyg
nem
opsi
ssp
ec.,
Zyg
nem
atac
eae,
also
occu
rred
(Agu
iler
aet
al.
2007
)
164 3 Limnology of Pit Lakes
(Fe, S, C, and N) can influence physical factors such as light climate, stratification,and/or substrate availability.
Effects of pH
Direct physiological effects of the acid on the ZGA, which determines their dis-tribution and PP, are often difficult to assess because changes in pH are accom-panied by changes in other potentially important factors such as dissolvedinorganic carbon (DIC) and metals (Kleeberg et al. 2006; Klug and Fischer 2000).Appearance of Mougeotia and Zygogonium spp. with the (experimental) loweringof pH and their disappearance, if the pH was increased, e.g. by liming (Jacksonet al. 1990; Turner et al. 1987) is well documented. However, these studies did notclarify whether the increase or decrease of dominating species are directly orindirectly attributed to pH.
Nutrient Limitation and Primary Production
Carbon—is known to be growth-limiting for the pelagic (e.g. Beulker et al. 2003;Nixdorf et al. 2003b) and benthic PP of ZGA (e.g. Mulholland et al. 1986; Turneret al. 1987, 1995a). HCO3
- is virtually non-existent at pH \ 5 and the dissolutionof CO2 from the atmosphere is very low. Consequently, at pH 3, for example, the
Table 3.22 Occurrence and dominating growth form of Zygogonium spp., Zygnemataceae, andthe pH of natural, circumneutral, and acidified freshwater systems reported in the literature
Growth form Environment pH Source
Epilithic, epiphytic Bowland Lake, Ontario 5.7–6.7 Jackson et al. (1990)Metaphytic floating
and semi-attached0–2 m littoral of softwater lakes,
Ontario, Canada5.6–6.5 Howell et al. (1990)a
France et al. (1991)Periphyton Low alkalinity lakes, Killarney
Provincial Park, Ontario\ 5 Vinebrooke (1996)b
Vinebrooke andGraham (1997)
Metaphyton Experimentally acidified Lake 302S,NW Ontario
4.5 Turner et al. (1995a)Turner et al. (1995b)
Periphyton looselyattached, tall
Lake Ruth-Roy (Ontario) 4–4.6 Graham and Vinebrooke(1998)
Loose flocs littoral of mining lake Koschen,Lusatia, Germany
3.2 Jacob and Kapfer(1999)c
Dense mats, peri- andmetaphytic form
1.6–10.5 m depth in lake GrünewalderLauch, Lusatia, Germany
2.9 Kleeberg et al. (2006)
Floating mats Warm (30–31 �C) water near thermalsprings, Yellowstone NationalPark, Wyoming
2.4–3.1 Lynn and Brock (19s69)
a predominant was Z. tunetanum; b Z. ericetorum and Z. tunetanum; c predominant during coldseason was Bumilleria klebsiana (Xanthophyceae), and during warm season Z. ericetorum(Chlorophyceae)
3.3 The Biology and Ecosystems of Acidic Pit Lakes 165
atmospheric equilibrium concentration of CO2 amounts to about 0.1 mg L-1
(Nixdorf et al. 2003b). Table 3.23 summarizes the span of nutrient concentrationsof mining lakes.
Additions of N, P, and N ? P alone in lab experiments did not stimulate thegrowth of ZGA (Fairchild and Sherman 1990). Moreover, the dense mats andmissing water movement could hamper CO2 diffusion (Turner et al. 1991,1994). At the same time, the ZGA use the CO2 originating from benthicmineralization (Wetzel et al. 1985). After additions of N and C, Fairchild andSherman (1990) found a significantly increased abundance of Mougeotia,whereas not after single C additions. Thus, this species seems to be extremelyefficient in CO2 uptake at low pH, but less efficient in the uptake of HCO3
-
(Turner et al. 1987). For Spirogyra, it was hypothesized that this species caninduce the formation of the carboanhydrase (Simpson and Eaton 1986), whichsupports the use of HCO3
-.Nitrogen—can be taken up by ZGA as nitrate (NO3
-) or ammonium (NH4+),
though NH4+ is preferentially used as a N source. In both rain-acidified soft water
lakes and geogenically acidified mining lakes the concentration of NH4+ is rela-
tively high (Table 3.23), in addition to the the NH4+ import caused by the inhi-
bition of nitrification (e.g. Nixdorf et al. 2003a; Rudd et al. 1988). Consequently,the N supply for the benthic Zygnemataceae should be adequate, which is sub-stantiated by the enrichment experiments with nutrient combinations by Fairchildand Sherman (1990). In an experimentally acidified lake (pH 4.5), the N:C ratio ofZGA, mainly of the genera Mougeotia and Zygogonium, was used to indicate theN limitation. With 0.11, i.e. between 0.1 and 0.13, it indicated a ‘moderate’ Ndeficiency (Turner et al. 1995a).
• Phosphorus—the availability of P is dependent on its import and the con-comitant import of P-binding partners, particularly metals such as Fe, Al,Mn, and Ca, and the prevailing O2, pH, and redox conditions (see also Sect.3.2.1.3). Thus, in most acidic mining lakes the P concentrations are very low(Table 3.23). The co-precipitation of P by Al and Fe oxyhydroxides isdocumented for both acid rain-acidified soft water lakes (e.g. Kopácek et al.2000) and geogenically acidified mining lakes (e.g. Kleeberg and Grüneberg2005).
• The uptake of P by epilithic or periphytic mats has rarely been studied(Hansson 1989; Riber and Wetzel 1987; Tate et al. 1995). The activity of
Table 3.23 Span of pH, of concentrations of total inorganic carbon (TIC), of ammonium(NH4
+), and of dissolved reactive phosphorus (SRP) of acidic mining lakes of the Lusatianmining region, Germany (Nixdorf et al. 2003a)
Buffer system pH TIC (mg L-1) NH4+-N (mg L–1) SRP (lg L–1) Number
indicators for P availability, such as phosphatases (Sabater et al. 2003), are alsodetermined by other factors, such as available phosphate, and hence do notallow definite termination to an existing P limitation. Turner et al. (1995a) usedthe mass ratio of P:C 9 1,000 as an indicator for the determination of Plimitation. For a community of Mougeotia and Zygogonium, this ratio amountedto 5.8, i.e. was considerably smaller than 10, which indicates an extremeP deficiency. It is also known that benthic algae are able to store P if P isavailable in surplus. Whether the phosphate that is released (possibly quickly)after microbial mineralization is immediately taken up by the algae is unknown.It is also not clear whether the dominating meta- or periphytic growth form ofZGA preferentially uses the water body (Hansson 1990) or the sediment (Wetzelet al. 1985) as the major P source.
• Primary production—The determination of photosynthetic rates of the peri-and metaphytic ZGA is, because of their heterogeneous distribution betweenthe growth forms, problematic. The variability of size of the metaphyticaggregates and concentration of algal filaments, which lie in high densitywithin the associations close together and float, respectively, can significantlyinfluence the biomass-specific PP due to the competition for light and nutrients(Mulholland et al. 1986; Turner et al. 1994, 1995a, c). This is reflected in thehorizontal distribution of the biomass of ZGA in a lake and the span amongdifferent lakes (Table 3.24). The PP of ZGA can also be limited by temper-ature (see below), and is consequently seasonally very different (Graham et al.1996; Howell et al. 1990). Moreover, the rate of net PP depends on the fall ofslope of the littoral bottom, the amount of ZGA incubated for the measure-ments, and the amount of heterotrophic organisms associated with the algae(Howell et al. 1990; Kleeberg et al. 2006). The problem of comparing thebenthic PP of the different waters becomes visible in the wide span of rates(Table 3.24; see also Sect. 3.3.2.3).
Table 3.24 Span of biomass characteristica and net primary production (PP) of various zy-gnematalean green algae (ZGA) and the pH reported in the literature (dw: dry weight, Chl a:chlorophyll a)
ZGA pH Dw (g m-2) Chl a (mg m-2) Net PP(mg C m-2 d-1)
n Number ofReferences
min Max min Max min Max
Periphyton – 0.03 46.00 0.01 2385 0.6 2,510 # aZygnema 6.7 21.7 39.80 20.00 400 31.7 32 4 bMetaphyton 5.6 0.82 1.79 1.03 2.33 6.9 119 5 cZygogonium 4.5 0.30 32.40 – – 16.8 2,222 7 dZygogonium 2.9 0.30 478.5 0.20 1,025 -12.0 851 4 ea Morin and Cattaneo (1992); # 20 journals between 1975 and 1990 have been reviewed, i.e.n = 187–1,194; b Sheath et al. (1996); Tundra stream, Toolik region, Alaska; c Howell et al.(1990); predominately Mougeotia and Zygogonium; d Turner et al. (1995a); predominatelyMougeotia and Zygogonium, data from 1991; e Kleeberg et al. (2006); Z. ericetorum in acidmining lake Grünewalder Lauch, Germany
3.3 The Biology and Ecosystems of Acidic Pit Lakes 167
For example, in experiments with cultures of Mougeotia for the determination ofPP and respiration as a function of pH, the production strongly decreased at pH = 3,but at pH \ 3, the algae died (Graham et al. 1996a). 56 combinations of light andtemperature with Mougeotia resulted in optimal conditions at 25�C and 300–2,300 lmol quanta m-2 s-1, the net photosynthesis averaged 40.4 mg O2 g-1 h-1
(Graham et al. 1996b).In determining the PP of ZGA, beside the physical factors of light and tem-
perature, pH-related factors such as the prevailing Al concentration and specieshave to be considered. Mulholland et al. (1986) determined the chlorophyll-spe-cific rate of PP over a span of pH of 4.5–6.4. The lowest rates at pH 4.5 were notonly determined by C and P limitation, but also by the toxicity of Al.
The rates of dark respiration of all benthic algae communities studied inacidified or acid lakes were higher than those of neutral references (Turner et al.1991). A changed ratio between PP and respiration is generally regarded as anindicator of acid stress (Schindler 1993; Turner et al. 1995c). At pH \ 5, the ratioof PP:respiration approached 1 (Schindler 1993).
Deposition and Toxicity of Metals
The most significant effect of AMD conditions on acid-tolerant communities is thedeposition of metal oxides (e.g. Bray 2007; Niyogi et al. 1999). In comparison tothe poorly buffered soft water lakes acidified by airborne pollutants, the metalconcentrations in geogenically acidified mining lakes are much higher. For thelatter, the concentrations of Fe vary between 0.09 and 170.2 mg L-1 and that of Albetween 0.03 and 20.5 mg L-1. In lakes with pH \ 3.4, the molar proportion of Feexceeds those of Al; at pH [ 3.7, the relations are converse (Geller et al. 2000).
At pH \ 6, Al becomes highly soluble; however, not all forms are toxic (Gen-semer and Playle 1999). Inorganic monomeric forms are very toxic; Al fluoridecomplexes are not. An Al concentration of 50 lg L-1 was toxic for phytoplankton(Planas 1996). In acidified synthetic soft water, growth of the green alga Chlorellapyrenoidosa was inhibited after 96 h at an Al concentration of 162 lg L-1 (Parentand Campell 1994). In comparison, ZGA of the genus Mougeotia (Table 3.21) aredistinctly tolerant of elevated Al concentrations. Mougeotia have been found in lakesat Al concentrations of 26–200 lg L-1 at pH 4.5–5.1, and in rivers at 41–1,410 lg L-1 at pH 4.4–7.3 (Graham et al. 1996). At higher experimental concen-trations, Al caused a rapid decline in the ZGA growth rate and a lower final biomass(Kinross et al. 2000). The physiological mechanisms responsible for Al toxicity arestill unknown (Gensemer and Playle 1999). The tolerance of Mougeotia to Zndepended on the level of concentrations (6–34,000 lg L-1) in the waters from whichthey were isolated (Graham et al. 1996). Hence, in experimental cultures, Mougeotiatolerated a Zn concentration of 3,400 lg L-1.
In acid mining lakes, the pH of the water is often seen as the primary variable thataffects aquatic biota, but pH also acts as a master variable affecting metal hydroxidedeposition. The high metal (particularly Fe) sedimentation rates should stress theZGA in these lakes. For example, Zygogonium ericetorum was always associated
168 3 Limnology of Pit Lakes
with Fe hydroxides in the mining lake Grünewalder Lauch, Lusatia, Germany(Kleeberg et al. 2006). In comparison, at pH \ 4, periphytic Ulothrix sp. (Chloro-phyceae) biomass accumulated only when the Fe deposition rate wasbelow & 1 g m-2 d-1 (Niyogi et al. 1999). Consequently, Z. ericetorum growth inLake Grünewalder Lauch is obviously seriously stressed by high rates (around0.9 g m-2 d-1) of Fe deposition during summer at shallower sites. Z. ericetorum canbecome covered by Fe hydroxides (red–orange colour in Fig. 3.67) if it does not growfaster than the rate of Fe deposition, which is between 1.2 and 2.2 g m-2 d-1 atdeeper sites. Moreover, these Fe hydroxides might also influence the extreme Pdeficiency of Z. ericetorum by their ability to efficiently adsorb phosphate (Kleebergand Grüneberg 2005). This is supported by the Zygogonium-mediated diurnal Fecycling, where about 34% of the dissolved Fe is reduced at night time and thenoxidized and precipitated during the day (Koschorreck et al. 2007).
Physical Parameters that Determine Distribution and Productivity
Light—Oligotrophying factors such as a C limitation, particularly in shallowregions of acidified soft water lakes, can improve the light climate for ZGA andcan lead to a shift of the light compensation point (Planas 1996; Turner et al.1995a). In boreal lakes, Experimental Lake Area, NW Ontario, attached algalcomposition was mostly determined by photosynthetically active radiation andultraviolet radiation fluxes. The community on rock surfaces exposed to high solarfluxes contained very high concentrations of a photoprotective scytonemin-likepigment, and was dominated by ZGA (Donahue et al. 2003). On the other hand,light can be a growth-limiting factor for ZGA. At low iron turbidity, as occurs insome acid mining lakes, ZGA development can be suppressed in the relativelyclear water by oversaturation of light, and chlorophyll a concentrations (0.2–9 lg L-1) remain at a low, C-limited, mostly oligotrophic level (Nixdorf et al.2003b), which favors the yield of light at the sediment surface. In contrast, deepchlorophyll a maxima (Beulker et al. 2003; Nixdorf et al. 2003b) could deterioratethe light climate for benthic ZGA.
Water temperature—The species of the Zygnemataceae occur over a wide rangeof temperature. They can colonize both cold streams of the Antarctic (Table 3.21)and warm thermal springs (Table 3.22). The temperature dependency of growth,photosynthesis, and respiration is only known for a few species. Studies on theinfluence of light (10–2,338 lmol quanta m-2 s-1) and temperature (5–30 �C) onthe net PP of Mougeotia at pH 4.7 showed that the compensation point (netPP = zero) lies between 10 and 20 lmol quanta m-2 s-1 at 5 �C; the temperatureoptimum was at 25 �C (Graham et al. 1996b). Thus, different species within a lake(Table 3.22) can rotate in dependence on temperature (Jacob and Kapfer 1999).
Water movement—The ZGA prefer lentic water zones. Nevertheless, moderatewater movement can increase the dispersion of benthic ZGA by modifying theboundary layer around the cells and increasing diffusion. Thus, water movementcould increase the efficiency of ZGA in absorbing dissolved C (Planas 1996;
3.3 The Biology and Ecosystems of Acidic Pit Lakes 169
Turner et al. 1987, 1991). Excessive turbulence in lotic water zones, however, canbe detrimental for the sediment-associated algae. Lower biomasses and abun-dances or absence of ZGA in low (littoral) water depth can be ascribed to wind-induced intensive water movements, when water velocity exceeds a threshold atwhich mechanical abrasion of turbulences surpasses the resistance limit of ZGA(Howell et al. 1990; Kleeberg et al. 2006).
Substratum—ZGA are often very heterogeneous and highly dynamic in theirphysical characteristics, so substrata are an important variable to consider whencomparing the occurrence and the spatial distribution of the Zygnematacea. ZGAlive beyond the very steep micro gradient zones within the upper sediment andinfluence buffering capacity by their presence and activity; they also influence the pHthrough their direct and indirect influence on alkalinity formation (Cook et al. 1986;Koschorreck et al. 2007). However, up to now, there are no specific studies showingany relationships between ZGA and the composition of the sediments or the effects ofthe influence of the sediment, e.g. the pH buffering onto the algae community, or theCO2 supply from microbial mineralization and nutrient availability.
Biotic Factors that Determine Distribution and Productivity
The effects of biotic drivers (influencing factors) cannot always be definitelydistinguished from abiotic (physical and chemical) factors, since different specieshave very different sensitivities to pH.
Grazers—The increase of ZGA biomass with decreasing pH is often ascribed tocontrol by grazers, i.e. decreasing grazing pressure accompanying increased acidi-fication. This hypothesis is supported by the fact that the acid-sensitive taxa of themacrozoobenthos, which need Ca for their shells or exoskeletons (like crustaceansand molluscs) disappear if the pH decreases\5.5 (median). Around a pH of & 6, theZGA become dominant. The dominance coincided with the loss of gastropods andamphipods (Turner et al. 1991). However, at lower pH, no larger cell diameter ZGAdominated, which indicates that the grazing of invertebrates is not a determiningfactor for the composition of the algae community (Kinross et al. 1993). Tadpoles ofan acid-tolerant frog, Rana clamitans, have suppressed Zygnemataceae associatedwith loose sediment and thereby stimulated closer sediment-associated species(e.g. Coleochaete scutata), i.e. supported a succession towards an algal physiognomythat is resistant to herbivores (Graham and Vinebrooke 1998). Only larger animalspecies, such as the algae-feeding cyprinids in soft water lakes (pH 5.6–5.9), canexert significant grazing pressure on the littoral metaphyton (France et al. 1991).
The relative effect of acidification and the total biomass of insects and pro-ductivity and the relationship between the grazer’s abundance and the algaedevelopment are also not clear. In many acidified and acid lakes, chironomidlarvae (Chironomidae, Diptera) dominate; according to different authors, theirabundances and biomass seems to be pH-independent (Müller 1980; Planas 1996).The decrease in the number of different taxa and their biomass could be related tothe fact that ZGA can shift from their two-dimensional periphytic into the three-
170 3 Limnology of Pit Lakes
dimensional metaphytic growth form (Planas et al. 1989), and thus becomephysically inaccessible to most benthic taxa (Vinebrooke et al. 2001), since themetaphytic growth form represents a food item only available to herbivores withflexible life histories and feeding behaviors.
Traditionally, it has been argued that changes in the macroinvertebrate commu-nity can determine the composition of the algae (Harvey 1989). This implies thatherbivores are selective. Their selectivity, in turn, is related to the physiognomy ofthe ZGA and their usability (Steinmann 1996). However, only a few observationsdeal with the food of acid-tolerant insects. Studies of Collier and Winterbourn (1990)showed that a large proportion ([ 60%) of the stomach content of fishflies(Ephemeroptera) and chironomids was detritus of a pH-independent origin. Donahueet al. (2003) found for ZGA species of Spirogyra, Mougeotia, and Zygogonium thatchironomid density explained only 2% of algal species variance, suggesting that theywere not overly important in determining ZGA community structure. Hence, so far,the increase in algal biomass and ZGA community structure cannot be definitelyexplained by the decrease of top-down regulation.
Competition—Increased ZGA biomass can be a consequence of lowered het-erotrophic activity with a ratio growth:decomposition that favors Zygnemataceae(Stokes 1986). The balance between the different heterotrophic and autotrophicpopulations, representing the periphyton, could change the nutrient cycle andthereby decrease competition for a certain resource (Mulholland et al. 1986; Planas1996). Whether the bacteria can outcompete the algae for a restricted P resource,as occurs in circumneutral lakes (Jansson 1988), remains an unanswered question.
Summary of Research Needed on Zygnematalean Green Algaein Acid-influenced Habitats
• Occurrence—Most studies of ZGA have only considered direct cause-effectrelationships between two or a few environmental factors (e.g. pH, presence orabsence of a ZGA species, distribution across AMD gradients), without con-sidering other physical, chemical, and biological variables that might influencetheir presence or absence. Integrative bioassays (e.g. Pringle 1987) could con-tribute to a better elucidation of connectivity.
• Long-term studies—that document the situation before and along with acidifi-cation or after neutralization in conjunction with the occurrence and produc-tivity of ZGA are needed. Spatial replications are often overlooked. An openquestion is why some ZGA species that occur together over a certain span of pHcollectively disappear after neutralization, but only some of these speciesreappear after re-acidification (e.g. Jackson et al. 1990).
• Ecological importance—The importance of ZGA as an algae substrate and afood base for invertebrate benthic organisms is still not adequately known. Thecorrespondence of acidification and total biomass of insects and productivityand the relationship between grazer abundance and algae development is alsonot clear. The increase in algal biomass and ZGA community structure cannotbe definitely explained simply by decreased top-down regulation.
3.3 The Biology and Ecosystems of Acidic Pit Lakes 171
• Productivity and nutrients—Only a few scientific studies of circumneutralsystems have paid attention to the interactions between the pelagic and benthicPP. However, they should be included in studies of mining lakes with pH \ 5.Either the pelagic or benthic PP have been determined, rarely both. The C and Plimitation of ZGA are mostly estimated using C:N:P relations. Lab experimentsto estimate the degree of limitation have rarely been performed, and would, inconjunction with other environmental parameters, explain the respectiveoccurrence, species composition, and productivity. It is also not clear whetherthe dominating meta- or periphytic growth form of ZGA preferentially uses thewater body or the sediment as the major P source, and to what extent and bywhich mechanisms ZGA can mobilize and use P in the presence of a surplus ofP-binding partners. How the densely packed filaments of mats influence nutrientexchange as conditions of diffusion change also needs to be studied.
• Interplay with bacteria—In most studies, the autotrophic components of theperi- and metaphyton, i.e. the ZGA itself are studied manifold, particularly withrespect to chlorophyll a concentration and PP. The heterotrophic componentswith bacteria and fungi are significantly less considered. There are no specificstudies on the relationships between ZGA and the composition of the sedimentsor the influence of the sediment, e.g. the effects of pH buffering onto the algaecommunity or the CO2 supply from microbial mineralization. The importance ofbacteria is not only restricted to the effects of the nutrient transformations withinthe mats, since they also play a potential role as competitors for nutrients.Whether the phosphate that is released (possibly quickly) after microbial min-eralization is immediately taken up by the ZGA is unknown. Also, whether thebacteria can outcompete algae for a restricted P resource, as shown for cir-cumneutral lakes (Jansson 1988), remains an unanswered question.
Algal physiology—The physiologic adaptations of ZGA, such as the CO2
concentration mechanism and the mechanisms responsible for Al toxicity, are notcompletely elucidated over the large span of extent of acidification and therespective water types.
Acid mining lake remediation—Information on the occurrence of acidophilicZGA, their physiological adaptations, and their ecological functions are veryuseful pertaining the development of acid mining lakes and strategies for acidremoval, i.e. particularly their role in benthic C accumulation, sediment earlydiagenesis, and biogenic alkalinity generation.
3.3.2.3 Benthic primary production
Matthias Koschorreck
If light reaches the bottom of an acidic pit lake, the sediment surface will becolonized by benthic algae. The sediment surface is a favourable place for primaryproducers since the concentrations of nutrients as well as dissolved inorganic
172 3 Limnology of Pit Lakes
carbon are higher than in the open water (Nixdorf and Kapfer 1998). Althoughlight intensities are often low, benthic algae can carry out photosynthesis directlyat the sediment surface. This has important consequences for the biogeochemistryand also the acidity status of the lake (Fig. 3.68).
The sediment surface can be colonized by small unicellular algae, mostlydiatoms such as Eunotia exigua, Nitzschia palaeformis, Pinnularia acoricola, orthe Euglenophyte Euglena mutabilis, which shows highly variable abundance dueto patchy growth (Lessmann et al. 1998; Kapfer, 1998). The phytobenthos can alsoconsist of metaphytic filamentous algae, typically Zygnemataceae (Fig. 3.69; seealso Sect. 3.3.2.2). In Mining Lake (ML) Grünewalder Lauch (ML117), 88% ofthe lake bottom was covered by several centimetre thick mats of Zygogoniumericetorum (Kleeberg et al. 2006; see also Sect. 3.3.2.2), with the highest abun-dance at water depths between 5 and 6 m and a mean biomass of 92 ± 96 g-dw m-2 (where dw indicates dry weight). These Zygogonium mats are P limitedand seriously stressed by Fe deposition, which results in low annual primaryproduction rates of 0.12 g C m-2 year-1, which is in the range of literature valuesfor filamentous green algae in lakes of various pH. Compared to the annual pelagicproduction of 43 g C m-2 year-1 (Nixdorf et al. 2003), primary production byZygogonium is of minor importance in Lake Grünewalder Lauch. During summer,however, benthic net primary production can be as high as 21.4 mg C m-2 d-1.This biomass production is the basis for high rates of microbial sulfate reductionobserved in the permanently anoxic sediment below the metaphyton layer (Kos-chorreck et al. 2007).
Ironoxidation
Ironreduction
Respi-ration
Ironoxidation
Sulfatereduction
Ironreduction
CO2
CO2
Corg
Corg
P
H S2
Alkalinity
pH 3
pH 6
O2
Photo-synthesis
Photo-synthesis
Fig. 3.68 Possible effects of benthic primary production in acidic pit mine lakes. The left partshows a benthic diatom biofilm, the right part shows a metaphyton layer covering the sediment
3.3 The Biology and Ecosystems of Acidic Pit Lakes 173
Photosynthesis carried out by the filamentous algae triggers diurnal fluctuationsof oxygen in the metaphyton layer, which in turn leads to a diurnal redox-cyclingof iron. Oxidation and precipitation of iron during the day scavenges phosphorusefficiently (Fig. 3.70).
Phytobenthic chlorophyll concentrations were 60 mg Chla m-2 in Lake Plessa107 (pH 2.3; Lessmann et al. 1999) and in ML111 (pH 2.6; Koschorreck and Tittel2002), about 10 mg m-2 in Lake 108 (pH 2.9), and about 110 mg m-2 in LakeKoschen (pH 3.1; Kapfer 1998).
Diatom-dominated benthic biofilms reached primary production rates of 1–5 mg C m-2 h-1 with specific rates being around 0.2 mg C mg-Chl-1 h-1, asmeasured by the radiocarbon method (Kapfer 1998). Benthic gross and net primaryproduction in ML111, as measured by oxygen microsensors, was 33 and15 mg C m-2 h-1 at a light intensity of 15 lE m-2 s-1, respectively (Koschor-reck and Tittel 2002). The compensation irradiance of the photosynthetic benthiccommunity was 6.8 lE m-2 s-1, showing adaptation to low light intensities. Theparticular light spectrum in iron-rich acidic lakes fits the absorption spectrum ofbenthic diatoms better than the light in ‘‘normal’’, not coloured lakes. Thus, for agiven photosynthetic active radiation (PAR), the benthic algae in ML111 could use1.5 times more photons than in a non-acidic lake (Koschorreck and Tittel 2002).
Fig. 3.69 Sediment surface of Mining Lake (ML117) Grünewalder Lauch (Germany) coveredby periphytic filamentous algae (a–c) and suspended filamentous algae and iron precipitates (d;photographs: M. Beyer)
174 3 Limnology of Pit Lakes
Although photosynthesis increased the oxygen concentration in the sediment, theoxygen penetration depth was not affected (Fig. 3.71). Thus, the direct influence ofbenthic diatom biofilms on the redox status of the sediments is probably of minorimportance. Benthic primary production, however, is probably the most importantsource of organic carbon in shallow, extremely acidic mining lakes. It has been
18 21 00 03 06 09 12 15 180.0
0.5
1.0
1.5
2.0
2.5
3.0
3.5
0
200
400
600
800
1000
1200
FeII
Fetot
SRP
time of day (h)
Fig. 3.70 Diurnal concentration fluctuation of dissolved iron and phosphorus in the metaphytonin lake Grünewalder Lauch (modified from Koschorreck et al. 2007). The shaded area indicatesthe light intensity
2
1
0
-1
-2
0 200 400 600
0 5 10 15 20 25
20
15
10
5
0
0 100 200 300 400 500 600 700
dep
th [m
m]
0 5 10 15 20 25
1 mm
(a)
(b)
Fig. 3.71 Cross section of the sediment–water interface in ML111 showing a benthicphototrophic biofilm a and oxygen distribution in the light and in the dark (lines) as well asgross photosynthesis (bars). b Graph after Koschorreck and Tittel (2002). The insert shows amagnification of the water sediment interface
3.3 The Biology and Ecosystems of Acidic Pit Lakes 175
estimated that it contributes about 2/3 of the organic carbon in Mining Lake 111(Fig. 3.72). Thus, with respect to the relative role of pelagic and benthic primaryproduction, acidic pit mine lakes are comparable to ‘‘normal’’ shallow lakes (Asket al. 2009; Vadeboncoeur et al. 2001).
3.3.2.4 Benthic and Sediment Community and Processes
Katrin Wendt-Potthoff
Zoobenthos
Due to the extreme chemistry, diversity of macrozoobenthos in acidic pit lakes isvery restricted. Acid-tolerant predatory corixids are common (Wollmann 2000);however, they are not strictly benthic. Invertebrates that actively shred leaf litter areabsent (Mutz et al. 2000). Aquatic insects are the most common group in acid waters,with 48.3% of total taxa being Diptera, mostly chironomids (Rodrigues and Scharf2001). Apparently, chironomid larvae are able to withstand the high mineral acidity,and due to the very low predatory pressure, they can reach high abundances(Table 3.25, Zullo and Stahl 1988). A species that was mistakenly identified asTendipes plumosus and later designated as Chironomus sp. was regularly found in 11of 19 coal pit lakes in Missouri and Kansas, most of which had strongly acidic waterand sediments (Harp and Campbell 1967). The authors reported that occurrence ofthe larvae was more related to the presence of leaf detritus than to pH, indicating thatlack of food sources constrained them more severely than water or sedimentchemistry. Only in the most acidic lake (Lake A1, pH 2.3, potential free acidity 819–9,090 mg CaCO3 L-1 = 16.4–182 mmol L-1) were pupae unable to emerge. A pitlake of the same pH and acidity (KB4.3) of 30.9 mmol L-1 in Lusatia had a slightlylower chironomid density, and there was no data on emergence but evidence ofpredation by corixids (Lessmann et al. 1999, Table 3.25). Harp and Hubbard (1972)studied the benthic fauna of bauxite open-pit lakes in Arkansas, which resemble coalpit lakes with respect to pH, but have a different metal chemistry (iron = 0.2–13.9 mg L-1, aluminum = 5.2–49.7 mg L-1). Their sediments had a similar den-sity of benthic animals as the iron-rich coal pit lake, Lake 111 in Lusatia, which
Fig. 3.72 Contribution ofdifferent carbon sources inMining Lake 111 (data fromKamjunke et al. 2006)
176 3 Limnology of Pit Lakes
appears to be a medium value (Table 3.25). Analysis of the gut contents ofChironomus crassimanus larvae from this lake revealed that they mainly fedon filamentous bacteria, fungal hyphae, and photosynthetic microorganisms(Rodrigues 2001).
The seasonal development and reproductive cycle of chironomids in acidic pitlakes have rarely been studied in detail (Zullo and Stahl 1988), and their relevancemight have been overlooked by common episodic sampling. It has been demon-strated for natural freshwater environments that the bioturbation and feedingactivity of chironomids play an important role in matter transport and sedimentbiogeochemistry (Nogaro et al. 2008). Therefore, in acidic pit lake sediment wherethey dominate the sediment macrofauna, effects of their bioturbating activityshould be significant. To date, there is only one study dealing with the effects ofburrowing chironomids on acidic pit lake sediments (Lagauzère et al. 2011). Theauthors found a three-fold increase of the diffusive oxygen uptake by the sediment,indicating a stimulation of organic matter mineralization. Iron transformationswere also influenced (lower rates of oxidation and reduction, stimulation ofmineral transformations, increased abundance of iron-oxidizing bacteria), but theflux of iron across the sediment–water interface was not affected.
Among the meiofauna, mites and nematodes are present in acidic pit lakesediments. Rodrigues and Scharf (2001) detected Hydrozetes lacustris in exposedleaf packs in three lakes, with increasing abundance from water pH 2.3 to 3, whilenematodes were not found at pH 2.3. A later transect study by Traunspurger (pers.comm.) revealed the presence of both nematodes and water mites in Lake 111sediment, which did not show a systematic relation to water depth. Nematodes
Table 3.25 Abundance of chironomid larvae in acidic pit lakes
Lake pH Individuals(m-2)
Comments Source
A1 2.3–3.2 0–7,435 Pupae were unable toemerge
Harp and Campbell(1967)
A3 3.4–4.1 0–40,124 Harp & Campbell(1967)
Lake 107 2.3 0–430 C. plumosus group Lessmann et al.(1999)
Bauxite pitlakes 1–4
2.9–3.4 511–5,479 Total benthic fauna counts,but almost entirelyChironomus sp.
Harp and Hubbard(1972)
Lake 111 2.6 0–4,500 C. crassimanus Lagauzère et al.(2011)
Bradley’sacidic pit
2.30–3.85 3,055–14,137(49,972)a
C. near maturus Zullo and Stahl(1988)
Bradley’sacidic pit
2.30–3.85 0–17,352(50,105)a
Tanytarsus dendyi Zullo and Stahl(1988)
a The range given comprises all sampled depths and seasons with *: the range of numbers intransects and the maximum station density indicated with parentheses
3.3 The Biology and Ecosystems of Acidic Pit Lakes 177
comprised 8 species feeding on bacteria and fungi, with Prismatolaimus sp.being dominant.
There is little information available on microzoobenthos of acidic pit lakes. Belland Weithoff (2008) reported the importance of benthic recruitment of the dom-inant zooplankton organisms, rotifers and heliozoans, in littoral sediments in Lake111 in Lusatia. Protozoan and metazoan abundance in the sediment did not exceed25 individuals cm-3; however, these values were comparable to rotifer densities ofother, natural lakes. The testate amoeba, Arcella vulgaris, has been found toinhabit even the most acidic (pH \ 2) part of James Lake, a lake acidified bydumping of waste rock from pyrite mining (Kumar and Patterson 2000).
Microbial Numbers and Biomass
Sedimentation rates have been determined for several acidic pit lakes (Siefert andMutz 2001: 0.9–4.9 g m-2 d-1). A considerable part of the sedimenting materialmay be ferric iron, as indicated by schwertmannite sedimentation rates of1–4 g m-2 d-1 (Peiffer 1999) or iron sedimentation of 1.4 g m-2 d-1 in Lake 77(Küsel 2003). This is in contrast to natural lakes of similar depth, where deadbiomass is a more important fraction of sedimenting material. Despite this, sedi-ment bacterial counts in acidic pit lakes appear to be similar to those of naturallake sediments. Average bacterial densities in the upper 2 cm of Lake 111 sedi-ment, determined by epifluorescence microscopy, were 0.82 ± 0.26 9 109 g-dw-1, which corresponds to 1.01 ± 0.34 9 109 cells cm-3 or a mean bacterialbiomass of 22.48 ± 7.13 lg C cm-3 (Bell and Weithoff 2008). Maximum cellcounts reached 1.6 9 109 g-dw-1 or 1.97 9 109 cm-3. These numbers wereapproximately three orders of magnitude higher than pelagic counts and did notshow pronounced seasonal trends. They were also in the same range as in otherfreshwater environments (Bell and Weithoff 2008). The sediments of the extre-mely acidic and metal-rich Berkeley Pit also contained 3 9 109 cells per gramsediment (Cameron et al. 2006). When bacterial counts are converted fromphospholipid phosphate values instead of counting cells microscopically, valuestend to be considerably higher for surface sediments. On a basis of 11 samplingcampaigns from 2001–2004, the upper 2 cm of Lake 111 sediment yielded cellnumbers of 3.4 ± 1.2 9 1011, corresponding to 9.5 ± 3.5 mg C g-dw-1 bacterialbiomass (Wendt-Potthoff, unpublished). These values are roughly two orders ofmagnitude higher than the counts of Bell and Weithoff (2008). The discrepancycan be explained by the fact that the phospholipid phosphate method does notdiscriminate between bacteria and other viable microbial biomass such as fungi,microalgae, or protists. Phospholipid-phosphate based values for surface sedimentsof other pit lakes were similar (Table 3.26), and they did not show a clear relationto pH. This was further tested using a set of 194 sediment samples from differentpit lakes (Fig. 3.73a). The data showed no correlation between biomass and pH,but illustrated that there are few sediment samples with intermediate pH values.A similar distribution has already been documented for the water column of such
178 3 Limnology of Pit Lakes
lakes (Geller et al. 1998). However, microbial biomass was negatively correlatedwith sediment depth (Fig. 3.73b; Pearson Product Moment correlation: P value3.26 9 10–9).
Prokaryotic Diversity in Pit Lake Sediments
Some attempts have been made to obtain a general overview of the prokaryotespresent in a pit lake, e.g. clone libraries were generated from pit lake sedimentafter amplifying the 16S rRNA gene. The prokaryotic diversity in acidic pit lakesediments is obviously higher than that of extremely acidic mine waters, butapparently these communities comprise a considerable number of similar organ-isms. However, since the detected clones are often only distantly related to knownorganisms, this approach is more suited to comparing different locations or sam-pling events than to infer microbial physiology at the studied site. Pham et al.(2007) found mostly Proteobacteria, Actinobacteria, and Firmicutes when apply-ing DGGE profiling to a sediment transect of Lake Kepwari, an oligotrophic pitlake in Western Australia (pH 4.5–5). Bacterial diversity appeared to be higher insamples of intermediate depth (10 and 18 m) than in very shallow or deep water (0and 29 m). Sulfate-reducing bacteria belonging to the genera Desulfomonile,Desulfococcus, Desulfobacterium, and Desulfomicrobium were detected except inthe 10 m sample, which in contrast was the only one containing Acidobacteria.However, the number of analyzed bands and clones was low, so this picture isprobably incomplete.
A rRNA-based clone library was generated from the sediment of the stronglyacidic (water pH 2.7, sediment pH 2.5–3.6) Lake 111 (Meier et al., in revision;Müller 2004). In this study, sulfate reducing bacteria were not detected. Beside alarge number of clones retrieved from algae chloroplasts, the largest group ofclones was found within the Xanthomonadaceae. These clones are closely relatedto phylotypes and to cultures retrieved from other acid mine drainage
Table 3.26 Biomass, cell counts and carbon contents in surface sediments (upper 2 cm) of pitlakes based on phospholipid phosphate extraction of duplicate samples
Lake N Sediment pH nmol P(g-dw-1)
Cells(g-dw-1)
Microbial carbon(mg g-dw-1)
Lake 111 11 2.8 ± 0.4 851 ± 310 3.4 ± 1.2�1011 9.5 ± 3.4Lake 117 with
N is the number of sediment samplings, and results for Lake 111 are given with standarddeviation
3.3 The Biology and Ecosystems of Acidic Pit Lakes 179
environments. The next relative genera were Dokdonella, Frateuria, Dyella,Rhodanobacter, Fulvimonas, and Luteibacter, but sequence similarities wereB91%. The second largest group of clones also belonged to the Gammaproteo-bacteria. Again, they resembled phylotypes retrieved from AMD environments,but sequence similarities to the next cultivated species were B89%. Otherimportant genera (several percent of the clones) that are also well-known fromother acidic habitats were Acidobacteria, Alphaproteobacteria of the Acidiphiliumgroup, Acidimicrobium, Sulfobacillus, Leptospirillum, Chloroflexi, and Entotheo-nella. The diversity of archaeal clones was low. All of them belonged to theThermoplasmatales and were related to phylotypes from the Río Tinto and otheracid mine drainage sites (sequence similarities 89–99%).
Blöthe et al. (2008) investigated the prokaryotic diversity in the sediments ofLake 77 in Lusatia, Germany. The sediments of this lake possess geochemicallydifferent zones, an upper acidic zone I (pH 3), a transition zone II, and a weaklyacidic zone III (pH 5.5). Zone I and zone III were studied separately by 16S rRNAbased community analysis. Denaturing gradient gel electrophoresis (DGGE)screening revealed 40 and 42 different phylotypes in zones I and III, respectively.
(a)
(b)
0
500
1000
1500
2000
2500
0 5 10 15 20 25 30 35 40
depth (cm)
nm
ol P
g-d
w-1
0
500
1000
1500
2000
2500
1 2 3 4 5 6 7 8 9
pH
nm
ol P
g-d
w-1
Fig. 3.73 Relationship between a sediment depth and microbial biomas and b sediment pH andmicrobial biomass
180 3 Limnology of Pit Lakes
A large fraction of the clones (45 and 43% in zones I and III, respectively)belonged to the phylum Acidobacteria, which is remarkably different from Lake111 (discussed above). Other sequences detected in both zones were affiliated toNitrospira, Cytophagales, Alpha-, Gamma-, and Deltaproteobacteria. Among theAlphaproteobacteria, many belonged to the genus Acidiphilium, members of whichhave also been cultured from pit lake sediments (Küsel et al. 1999). No archaealsequences were obtained. While sequences related to Firmicutes, Actinomyces, andBetaproteobacteria were only found in zone I, sequences related to Verrucomi-crobia subdivision 5, Thermus/Deinococcus, Bacillus/Clostridium, and an uncul-tured group were only obtained from zone III. These findings are comparable tothose of Becerra et al. (2009), who studied an old abandoned mine site in Mas-sachusetts where an AMD-generating zone (GZ; pH 1.7–2.4) and an AMD-attenuating zone (AZ; pH 4.5–6.0) could be distinguished. The authors detected 44and 45 operational taxonomic units (OTUs) at the GZ and AZ, respectively. Ac-idobacteria were important components of the community in both zones, andAlphaproteobacteria were also present in GZ and AZ. Members of the Nitrospira(Leptospirillum) were only detected in the GZ, where they comprised the majorityof clones. Similar to the findings of Blöthe et al. (2008), clostridia were onlyimportant in the higher pH AZ. However, Becerra et al. (2009) also undertook ararefaction analysis, which revealed that sampling was inadequate for coveringbacterial diversity in both zones and that GZ and AZ could contain 3.1–4.4 and1.3–1.7 times the number of OTUs found in the clone library.
It can be concluded that results have to be complemented by additional studies,including rarefaction analysis, to really understand diversity in pit lake sediments.Future research should aim at obtaining a better taxonomic resolution of somegroups and include comparative rRNA-based analyses of sophisticated culture ormicrocosm approaches.
Microbially Mediated Sediment Processes
In general, the same sequence of terminal electron-accepting microbial processesfrom oxic respiration to methanogenesis may be expected in pit lakes sediments asin natural sediments, although it is evident that the absolute or relative intensitiesof processes differ considerably due to the extreme chemistry.
A special case is the littoral sediment, which is often sandy with a patchy dis-tribution of microphytobenthos (Sect. 3.3.2.3) or colonized by bulbous rush, Juncusbulbosus (Chabbi 1999). In the practically unvegetated littoral sediment of Lake111, relatively deep oxygen penetration (up to 24 mm) has been observed. Theaccompanying diffusive oxygen fluxes of 3.1 ± 1.6–8.4 ± 0.4 mmol m-2 d-1
(Koschorreck et al. 2003a, 2004) were an order of magnitude lower than in naturallakes (Wendt-Potthoff and Koschorreck 2002), which indicates a relatively lowrespiratory activity. The general presence of Fe(II) in acidic pit lake sedimentssuggests that microbial Fe(II) oxidation should make an important contribution toO2 consumption near the oxic sediment–water interface. However, no in situ
3.3 The Biology and Ecosystems of Acidic Pit Lakes 181
evidence for this process was found by Koschorreck et al. (2003a), and the observeddisappearance of dissolved Fe(II) was rather due to jarosite precipitation within thesediment. In contrast, a laboratory incubation of the same sediment revealed apotential biological Fe(II) oxidation rate of 0.65 mmol cm-3 h-1 (Wendt-Potthoffand Koschorreck 2004). The range of CO2 production rates in this sediment was 6–42 mmol m-2 d-1, with maximum values in the summer months (Koschorrecket al. 2004), which is higher than in the profundal sediment and comparable tonatural lakes. This suggests that heterotrophic aerobic activity was responsible forO2 consumption in the littoral sediment of Lake 111. The same study reportedpotential iron reduction rates in the range of 6–45 mmol m-2 d-1, depending on theseason. The depth of maximum activity varied, and potential Fe(III) reduction wasregularly detected near the sediment surface. Active zones generally showed ele-vated most probable number (MPN) counts of acidophilic Fe(III) reducing bacteria.This suggests Fe(III) reduction by oxygen-tolerant organisms such as Acidiphiliumor Acidobacterium, which have been shown to carry out Fe(III) reduction undermicro-oxic conditions (Coupland and Johnson 2008; Johnson and Bridge 2002).
Many littoral sites in acidic pit lakes are colonized by Juncus bulbosus, e.g. Lake108 in Lusatia (Chabbi 1999). The plant roots release oxygen into the sediment,which stimulates microbial Fe(II) oxidation and the formation of ferric crusts (pla-ques) around the roots. Contrary to other plants, the crusts are not directly attached tothe root, but a space is left which is colonized by microorganisms (Chabbi 1999).High numbers of Fe(III) reducing bacteria and other organisms have been found to beassociated with the roots (Küsel et al. 2003), which apparently live from root exu-dates. The CO2 they generate during respiration is beneficial for the plants in anenvironment with limited inorganic carbon (Koschorreck et al. 2004).
Iron plaques also form on leaf litter sedimenting in the acidic pit lakes.Although this process triggers trapping of fine particulate material and biofilmformation, it leads to incomplete decomposition, making the leaves only a tem-porary carbon source (Schlief and Mutz 2005). However, compared to streamsaffected by acid mine drainage, iron plaque formation was weaker on sedimentedleaves in a pit lake, which was accompanied by higher fungal biomass and res-piration rates (Schlief and Mutz 2005).
Nitrate reduction and manganese reduction are not important in acidic pit lakesediments, since their nitrate and Mn concentrations are low (Schultze et al. 2010).Low nitrate concentrations are common because nitrification is inhibited at low pH.
Iron reduction is the dominant terminal electron accepting process for the oxi-dation of organic matter, hydrogen, or reduced sulfur in acidic pit lake sediments(Johnson 1995; Küsel and Dorsch 2000; Langner 2001). Signs of microbial Fe(III)reduction are reported from most investigated sediments, even the extremely metal-rich Berkeley pit (Twidwell et al. 2006), but few studies report quantitative in siturates. Generally, maxima of potential Fe(III) reduction are accompanied by elevatedviable counts of Fe(III) reducing microorganisms (e.g. Koschorreck et al. 2007a;Meier et al. 2004; Wendt-Potthoff et al. 2002). Despite this correspondence, viablecounts are too low to explain the observed activities, which is easily seen if cell-basedrates are calculated (e.g. Meier et al. 2005). More effort is needed to detect and isolate
182 3 Limnology of Pit Lakes
the organisms responsible for Fe(III) reduction in such systems. If available, Fe(III)reduction rates are comparable to or even higher than those found in iron-richfreshwater environments (Table 3.27), although physiologically and phylogentic-ally different organisms are responsible for the observed activities. However, com-parison is not trivial, since there is no good standard for quantifying in situ Fe(III)reduction, such as 35S-sulfate used for in situ sulfate reduction measurements. Ratesbased on Fe(II) fluxes are not necessarily the same as those from anoxic batchincubations with total Fe(II) determined over time.
Despite the generally large sulfate pools and cultivation-based detection ofsulfate-reducing bacteria in acidic pit lake sediments, sulfate reduction is onlyrarely detected. Similar to Fe(III) reduction, there are often reliable signs of thisprocess, but no quantification of the activity. For example, laboratory incubationsrevealed sulfate reducing activity in the littoral zone of Lake Kepwari, Australia(Read et al. 2009). This is in contrast to the well-studied Lake 111, where sulfatereduction was measured in a deep small basin (Meier et al. 2004), but not in thelittoral zone (Koschorreck et al. 2004). However, another acid, nutrient-rich pitlake, Cueva de la Mora in the Iberian Pyrite Belt, had much higher sulfatereduction rates in the mixolimnetic compared to the monimolimnetic zone(Wendt-Potthoff et al. 2012). Examples of spontaneous (without substrate additionor other treatments) sulfate reduction rates in pit lakes are given in Table 3.28.Low pH alone does not preclude sulfate reduction, and H2S or organic acidconcentrations observed in pit lake environments are too low to be inhibitory(Koschorreck 2008). Competition with iron reduction and electron donor limita-tion are more likely explanations (Blodau and Peiffer 2003; Koschorreck 2008),and this aspect is further discussed in the following subsection.
In contrast to natural freshwater ecosystems, methanogenesis is generallynegligible in acidic pit lakes. This is not a consequence of the low pH, as methaneformation is an important process in acid peatlands, swamps, and mires (Bergmanet al. 1998; Cadillo-Quiroz et al. 2006). Methane formation is inhibited by the highsulfate concentrations in the sediments (in the g L-1 range, see Sect. 3.2 on pit lakechemistry). In a lake acidified by volcanism, methanogenesis was found to takeplace in deeper sediment layers, where the pH value was above 4 and sulfatereduction became sulfate limited (Koschorreck et al. 2008). Low concentrations ofmethane (10–60 lmol L-1) were detected in the sediments of Lake 166 in Lusatia(Blodau et al. 1998). The Spanish pit lake Cueva de la Mora, which is considerablyenriched in carbon and nutrients, also had methane concentrations between 15 and70 lmol L-1 in the monimolimnetic sediments, but incubation assays failed todetect methanogenic activity (Wendt-Potthoff et al. 2012).
Iron and Sulfate Reduction and Potential for Remediation
If sulfate and iron reduction coexist in a given sediment, these reactions mightreverse the acidification caused by pyrite oxidation, and to a certain extent, pyritewill be formed again. Generally, the addition of suitable substrates to pit lake
3.3 The Biology and Ecosystems of Acidic Pit Lakes 183
Tab
le3.
27F
e(II
I)re
duct
ion
(FeR
)in
pit
lake
(P.L
.)se
dim
ents
and
natu
ral
fres
hwat
ersi
tes;
n.a.
:no
tav
aila
ble
Lak
eT
ype,
loca
tion
Sed
imen
tpH
Met
hod
FeR
(nm
olcm
-3
d-1)
FeR
(mm
olm
-2
d-1)
Ref
eren
ce
Lak
e77
,zo
neIa
P.L
.,G
erm
any
&3
Bat
chin
cuba
tion
204
Küs
elan
dD
orsc
h(2
000)
Lak
e77
,zo
neIa
P.L
.,G
erm
any
&3
Bat
chin
cuba
tion
250
Pei
neet
al.
(200
0)L
ake
77,
zone
IbP
.L.,
Ger
man
y3
Bat
chin
cuba
tion
710
Blö
the
etal
.(2
008)
Lak
e77
,zo
neII
bP
.L.,
Ger
man
y5.
5B
atch
incu
bati
on89
5B
löth
eet
al.
(200
8)L
ake
116
litt
oral
P.L
.,G
erm
any
3–[
6P
ore
wat
erpr
ofile
/flux
150
6.9
Blo
dau
etal
.(1
998)
Lak
e11
6pe
lagi
alP
.L.,
Ger
man
y3–
[6
Por
ew
ater
profi
le/fl
ux50
3.8
Blo
dau
etal
.(1
998)
Lak
eN
iem
egk
P.L
.,G
erm
any
2.6–
5P
ore
wat
erpr
ofile
/flux
5,00
0L
angn
er(2
001)
Cue
vade
laM
ora
mix
olim
nion
P.L
.,S
pain
2.8–
3.2
Bat
chin
cuba
tion
585–
627
6.06
Wen
dt-P
otth
off
etal
.(2
012)
Lak
e11
7P
.L.,
Ger
man
y6
Por
ew
ater
profi
le15
0–26
02.
6K
osch
orre
cket
al.
(200
7b)
Lak
e11
1P
.L.,
Ger
man
y2.
7B
atch
incu
bati
on67
0W
endt
-Pot
thof
f(u
npub
lish
ed)
Gre
atG
host
Lak
eO
ligo
-mes
otro
phic
,T
aiw
ann.
a.In
situ
accu
mul
atio
nof
Fe(
II)
5.07
Wan
net
al.
(199
7)
Bal
degg
erse
eli
ttor
alE
utro
phic
lake
,S
wit
zerl
and
n.a.
flux
0.06
Sch
alle
ret
al.
(199
7)
Bal
degg
erse
epe
lagi
alE
utro
phic
lake
,S
wit
zerl
and
n.a.
Flu
x0.
15S
chal
ler
etal
.(1
997)
Kal
ixR
iver
estu
ary
Est
uary
,S
wed
enn.
a.P
ore
wat
erpr
ofile
0.77
Wid
erlu
ndan
dIn
gri
(199
6)a
prob
ably
anun
dere
stim
ate,
sinc
eon
lydi
ssol
ved
Fe(
II)
was
mea
sure
d;b
incu
bate
dat
15�C
,al
thou
ghth
em
axim
umse
dim
ent
tem
pera
ture
was
12�C
184 3 Limnology of Pit Lakes
sediments increases both iron and sulfate reduction (e.g. Becerra et al. 2009;Koschorreck et al. 2007a; Küsel and Dorsch 2000; Langner 2001; Meier et al.2005; Wendt-Potthoff et al. 2002). However, many pit lake sediments do not showsulfate reduction at all, and the estimated times for neutralization in others are verylong (several hundreds or more than a thousand years: Blodau and Peiffer 2003;Peine and Peiffer 1998; Wendt-Potthoff et al. 2012). The long times for neutral-ization are due to a considerable reoxidation of sulfides in lake systems (Kos-chorreck and Tittel 2007), which is hard to control during any in situ remediationapproach (Geller et al. 2009; Chap. 4). Blodau and Peiffer (2003) demonstratedthat the neutralization process is constrained by organic matter quality and ther-modynamic effects, which together control the relative rates of sulfate and ironreduction. Substantial amounts of iron sulfides were only formed at a simultaneouspartial thermodynamic and solubility equilibrium of the involved biogeochemicalprocesses. If this is not reached, the sediments remain in an Fe(III) reducing andsulfide oxidizing state, despite addition of organic matter and nutrients. In additionto organic matter quality and low pH, which thermodynamically favors Fe(III)reduction, the supply of reactive Fe(III) is a key factor. This is demonstrated bymany cases in addition to those discussed by Blodau and Peiffer (2003). Forexample, the deep part of Lake 111, which in contrast to the rest of the lake showslow rates of sulfate reduction (Meier et al. 2004; Table 3.28) has been excludedfrom lake overturn for several years and has developed a small reduced bottomwater body. This might have greatly reduced the supply of Fe(III) to the sediments.Lake Caviahue, a glacial lake acidified by volcanism with active sulfate reduction,not only had substantial production of biomass, which was precipitated by vol-canic ash following an eruption, but also has a relatively low iron content com-pared to acidic pit lakes (Koschorreck et al. 2003b; Table 3.28). As a consequence,
Table 3.28 Sulfate reduction (SR) in the sediments of acid lakes measured by 35S tracer tech-nique. The lakes are pit lakes except Lake Caviahue, which is a glacial lake acidified byvolcanism
Lake pH ofwater
pH ofsediment
SR (nmolcm-3 d-1)
SR (molm-2 d-1)
References
Reservoir 29 2.7 3.8 16–152 Gyure et al. (1990)Lake 111 (10 m) 2.6 [4 1.6–7.2 Meier et al. (2004)Lake 116 3 [6 17–130 1.2–5.2 Blodau et al. (1998)Lake 76 2.8 [6 70 Blodau et al. (2000)Lake 77 3 [5 6 Peine et al. (2000)Lake 117 3.1 6 57–265 Koschorreck et al.
(2007b)Cueva de la Mora
(mixolimnion)2.5 2.8–3.2 4.5–314 13 Wendt-Potthoff et al.
(2012)Cueva de la Mora
(monimolimnion)3.6–4.3 4.3–4.9 0.2–2.3 0.1 Wendt-Potthoff et al.
(2012)Lake Caviahue 2.6 3 33 Koschorreck et al.
(2003)
3.3 The Biology and Ecosystems of Acidic Pit Lakes 185
it might not be sufficient to add a cheap carbon source or lime to an acidic pit laketo neutralize it, but biological production and inflows of iron, carbon, acidity, andsulfate have to be studied carefully to plan a sustainable treatment, if necessary.
In conclusion, despite restricted colonization by benthic invertebrates andpractical absence of some microbial processes typical for freshwater lakes, thesediments of acidic pit lakes show considerable microbial diversity compared toextremely acid mine sites, and biomasses and total microbial activities comparableto natural lakes. Further research is necessary to unravel the true microbialdiversity of pit lake sediments and its relation to environmental factors. It will beboth of scientific and practical interest to better quantify rates of Fe(III) reduction(also in natural freshwater bodies) and to identify and isolate the organismsresponsible for Fe(III) reduction at acid and intermediate pH values. This shouldinclude the more systematic study of different habitats in acidic pit lakes, such aslittoral and profundal zones, vegetated and unvegetated sediments, and chemo-clines in meromictic lakes. If neutralization of an acidic pit lake is attempted, suchstudies will complement approaches to get reliable estimates on carbon andnutrient supply, inflows of iron, acidity, and sulfate, which are all necessary to planrealistic and sustainable treatment options.
3.4 Modeling of Pit Lakes
Donald S. Dunbar
3.4.1 Introduction
The long-term planning and allocation of financial resources required for effectivemonitoring and remediation of pit lakes can benefit immensely from defensiblepredictions of physical and geochemical pit lake properties in advance of lakeformation. In this section, we consider numerical computer models that aredesigned to simulate the evolution and spatial distribution of physical and/orgeochemical properties of pit lakes. The discussion is limited to models designedfor long-term simulations spanning decades or even centuries. Other types of pitlake models, such as those designed for predicting biological productivity will notbe addressed.
Model predictions can provide regulators, mine operators, and other stake-holders with information critical to anticipating and addressing water qualityconcerns that are likely to arise after cessation of mining and dewatering, such as:filling rates and the timing of overtopping; water column stability, stratification,overturning, and the onset of meromixis, and; the evolution and spatial distributionof pH, sulfate, dissolved metals, and other chemical species.
Flooded open pits, unlike most natural lakes, are typically deep and steep-sidedwith large values for the relative depth, zr, given by
186 3 Limnology of Pit Lakes
Zrð%Þ ¼ 100Zm
d; ð3:27Þ
where Zm is the maximum depth and d is the mean lake diameter (Gammons and
Duaime 2006). Defining d ¼ 2ffiffiffiffiffiffiffiffiffiA=p
pfor lake surface area A yields
Zrð%Þ ¼ 50Zm
ffiffiffipA
r
ð3:28Þ
The small fetch (i.e. length of lake surface exposed to wind-energy) and largedepth result in relatively ineffective downward transfer of wind energy, therebylimiting vertical mixing. Natural lakes that exhibit strong stratification and arepoorly mixed typically have zr values greater than 4; by contrast, well-mixednatural lakes have zr values generally less than 2.
Pit lakes, and their related environmental issues, share common characteristicsthat provide a unique challenge to computer modelers. The large relative depth hasimportant implications for the downward penetration of thermal and wind energy,and their concomitant effects on vertical mixing and stability. Unlike natural lakes,which typically have a layer of organic matter at the bottom, the bottom of a pitlake–initially at least–consists of bare (and commonly, oxidized) rock. In addition,the time scales for environmental issues related to pit lakes often span decades oreven centuries.
3.4.2 Physical Properties of Pit Lakes
3.4.2.1 Water Density
Density in freshwater lakes is largely determined by temperature. The density ofpure liquid water attains a maximum of 0.99998 g/cm3 at 3.94 �C. Therefore,dense lake bottom waters tend to remain near 4 �C while the temperature near thesurface varies in response to inflows and atmospheric conditions.
The addition of dissolved salts to freshwater results in an increase in density.Seawater, for example, has a density approximately 2.8% greater than freshwater.Pit lakes contain water that has a wide range of dissolved salts and other geo-chemical species due to inflows of groundwater, precipitation, and surface inflowthat has contacted exposed pit wall surfaces. Thus, both water temperature andsalinity influence the density of water in pit lakes. The density of pit lake water iscalculated by applying an empirical equation of state relating water temperatureand the concentration of dissolved ions (salinity) to water density. Salinity can beaccurately determined by measuring the conductivity of the water. The equation ofstate for water is nonlinear with temperature for a fixed conductivity, and nearlylinear with conductivity for a fixed temperature (Fig. 3.74).
3.4 Modeling of Pit Lakes 187
3.4.2.2 Vertical Stability
Deep, freshwater lakes typically have at least two layers: a bottom hypolimnion,whose waters are at least seasonally isolated from the atmosphere (and sometimesperennially stagnant), and an upper epilimnion, which is well mixed by the wind.The two layers are separated by a relatively thin thermocline defined by a strongthermal gradient.
The physical stability of a stratified system can be described by the tendency forthe upper and lower water layers to mix. The energy required to vertically mix twowater masses increases with the density difference between the two layers. Spe-cifically, given two layers of density q1 and q2, of equal volume and thickness, h,the energy required to mix the two volumes completely, ignoring viscous dissi-pation of energy, is:
ghDq2
ð3:29Þ
Figure 3.75 shows the energy required to raise the center of mass of the originaltwo layers to their geometric center.
Increasing density with depth decreases the tendency of two water masses tomix. Large density contrasts across the density gradient, or pycnocline, suppressmixing and therefore increase the vertical stability of the water column.
Dimictic Lakes
Many natural and pit lakes experience regular, seasonal ice cover, with the timingand duration dependent primarily on latitude and altitude, but also on inter-annualvariability of air temperature, wind velocity, and solar radiation. A period of ice
-1.0
-0.5
0.0
0.5
Den
sity
-100
0 (k
g/m
3 )
0 2 4 6 8 10 12 14
CS=0.0
CS=0.5
CS=1.0 (mmhos/cm)
(a)-1.0
-0.5
0.0
0.5
0.0 0.2 0.4 0.6 0.8 1.0
Specific Conductivity (mmhos/cm)
T=0º
T=4º
T=10º
T=15º
(b)
Fig. 3.74 Water density for different values of a temperature T, and b specific conductivity
188 3 Limnology of Pit Lakes
cover, and the changes in lake temperature that precede and follow it, profoundlyaffect the physical properties of lakes. From thermally stratified conditions in latesummer, lake surface waters cool and increase in density as fall approaches until atemperature of approximately 4 �C is reached, at which point maximum density isattained and the lake convectively mixes. The degree of mixing depends on thelake depth and vertical density gradient. Some lakes mix fully every year, whileothers mix fully only occasionally. If meromixis has occurred due to high bottomlayer solute concentrations and a stable monimolimnion has formed, then completemixing is inhibited and is limited to the upper layers of the lake.
If the temperature decreases sufficiently, then ice will begin to form, thickeningover the winter months. The lake will again become thermally stratified, with lessdense 0 �C water in a surface layer overlying warmer, denser water below. The icethermally insulates surface waters from the cooler air above and eliminates windmixing. Snow accumulates on the ice, storing water until it thaws with the arrivalof warmer temperatures. With the formation of ice, the level of the lake will oftendrop as surface inflows decrease or stop altogether. Some solutes may becomesupersaturated immediately under the ice due to salt expulsion as the ice forms.
= 1 + 2
2
11
22
E g(h z) 1 + 2
2= gh
2
z = hz = h
z = 2 1h
1 + 2
hh
hh
Fig. 3.75 Energy required to completely mix two equal water volumes with different densities.The yellow dot marks the location of the centre of mass
3.4 Modeling of Pit Lakes 189
During the subsequent spring and summer thaw, the snow and ice melt and theirvolumes are added to the lake over a relatively short interval together with runofffrom the surrounding watershed. This sudden influx of water (freshet) may rep-resent a significant portion of the annual surface water budget.
As surface waters warm and the ice and snow melt, the water density increasesas the temperature climbs toward 4 �C. Again, convective mixing occurs, and inthe case of most natural lakes, complete overturning. The twice-annual cycle offall-winter and spring-summer overturning is the defining characteristic of dimicticlakes. Because of their importance in lake dynamics, ice formation and thawingare important processes to include in models of pit lakes where this occurs(Hamblin et al. 1999; Patterson and Hamblin 1988; Rogers et al. 1995).
3.4.3 Geochemical Processes Influencing Pit Lake Chemistry
The density structure of stratified lakes has an important influence on the chemicaland biological processes occurring in both the water column and sediments.In particular, the restricted mixing across the pycnocline can result in the depletionof O2 and the accumulation of other chemical species associated with the break-down of organic matter in the lake interior. In natural aquatic systems, dissolvedoxygen is consumed principally by bacterially-mediated oxidation of organicmatter (OM; Fenchel and Blackburn 1979; Stumm and Morgan 1981). OMproduced in the surface waters (i.e. plankton, zooplankton) is delivered to theinterior of the lake and lake bottom via the settling of organic detritus.
Due to the downward transport of OM, the oxidation reactions associated withits degradation occur throughout the water column. Organic matter is oxidized orremineralized by both aerobic and anaerobic bacteria. These remineralizationreactions are redox processes in which electrons are transferred from the reductant(OM) to an electron acceptor (oxidant). In shallow lakes, much of the oxidation ofOM occurs at the sediment–water interface, while in deeper lakes, significant OMoxidation can occur in bottom water (Hamilton-Taylor and Davison 1995;Northcote and Johnson 1964). Collectively, these oxidation processes result indepletion of oxygen in the bottom waters. Without deep water mixing and asso-ciated replenishment of oxygen, or where the OM flux to bottom waters is high (asin productive or eutrophic lakes), oxygen-consuming reactions can completelydeplete oxygen in bottom waters leading to anoxia.
In aerobic environments, oxygen is preferentially used as the final electronacceptor in the oxidation of OM. Once oxygen is depleted, other electron acceptorsare employed. Based on decreasing free energy yield, thermodynamics dictatesthat electron acceptors are used in the order: O2 [ NO3
- & MnIV-oxides [ FeIII-oxides [ SO4
2- (Froelich et al. 1979; Sigg et al. 1991; Stumm and Morgan 1981).Once oxygen has been exhausted as an oxidant, nitrate will be employed as theelectron acceptor for OM oxidation, followed by Mn-oxides.
190 3 Limnology of Pit Lakes
The development of anoxic bottom waters can greatly influence the behavior oftrace elements. Of particular importance is the reduction of sulfate, which liberateshydrogen sulfide (H2S). In most mine pit lake scenarios, sulfate is readily available atconcentrations capable of generating significant quantities of hydrogen sulfide.Many trace elements (e.g. Fe, Co, Ni, Zn, Cd, and Pb) react rapidly with free sulfide toprecipitate insoluble sulfide minerals (Balistrieri, Murray et al. 1994; Stumm andMorgan 1981). Consequently, the precipitation of metal sulfides, and their sub-sequent settling to the lake floor, can provide an effective mechanism for removingtrace elements from the water column (Achterberg et al. 1997; Green et al. 1989).
The same redox processes outlined above for the water column occur withinsediments and submerged mine tailings. Accordingly, lacustrine sediments con-taining organic matter are often devoid of dissolved oxygen within a few milli-meters of the sediment–water interface, even if bottom waters are fully saturatedwith dissolved oxygen (Martin et al. 2003; Pedersen et al. 1993). This sometimeshas important implications for the chemistry of waters seeping out of a perched pitlake where seepage to groundwater is important.
3.4.4 Pit Lake Model Characteristics
3.4.4.1 Basic Properties
Pit lake hydrodynamic models may be classified based on the number of spatialdimensions they include. Generally, the complexity and demands imposed oncomputer resources (i.e. memory, disk space, and CPU cycles) and the quantity offield data required for model initialization and inputs increases significantly withthe number of dimensions.
These considerations, and the very long time periods over which a model may berequired to simulate pit lake properties, impose severe constraints on the number ofspatial dimensions that may be reasonably included in a model design. Models usedto simulate pit lakes over long time periods usually include just one spatialdimension, with temporal variation of water properties occurring only in the ver-tical, and with water properties in the horizontal dimensions assumed to be isotropic.
The validity of applying a one-dimensional model to a particular pit lake isoften done without justifying the assumptions implicit in the model design. Thekey assumption is that lake properties in the vertical change much more slowlythan in the horizontal.
Horizontal gradients occur within pit lakes for a variety of reasons. Forexample, a strong wind blowing on the lake surface will temporarily create a smallsurface slope by piling water toward one side of the lake. This tilts the isopycnals,resulting in horizontal thermal and salinity gradients. When the wind stops, both asurface and internal seiche may develop which persist until friction dissipates theenergy as heat. In addition, inflows of fresh and treated water can be a source oflateral inhomogeneity. When the sources of the horizontal gradients cease, the
3.4 Modeling of Pit Lakes 191
time over which the gradients relax and vanish is generally much shorter than thetypical time scale over which comparable changes in vertical properties occur.
If necessary, the validity of the one-dimensional assumption may be tested bycalculating the Lake Number (Atenucci and Imerito 2002), which takes intoaccount the stability of the water column, and the destabilizing effect of the wind.
LN ¼ðzg � z0ÞMgð1� zT=zÞ
A1=2ð1� zg=zÞR
AðzHÞq0u2
�dAð3:30Þ
where q(z) is the vertical profile of water density; zg; z0; zT and zH are the center ofvolume, center of gravity, height of the center of the metalimnion, and height ofthe water column, respectively (measured upward from the pit bottom); M is thetotal mass of water; g is the acceleration due to gravity; A is the plan view area ofthe lake surface; and u is the surface friction velocity. For values of LN � 1 theone-dimensional assumption is considered to be valid.
The equations governing the conservation of momentum, mass, and heat areexpressed in three spatial dimensions. To reduce this number from three to onevertical dimension, the equations are laterally integrated; thus, models based onthis modified set of equations are referred to as laterally integrated models.
3.4.4.2 Turbulence and Mixing
A fundamental difficulty in modeling the physical processes in many hydrodynamicsystems, including pit lakes, is the broad range of spatial and temporal scales that areobserved in nature. In natural hydrodynamic systems, there is always a cascade ofkinetic energy from large spatial scales through to small scales due to nonlinearinteractions. At the smallest scales, viscosity becomes important and the energy isfinally dissipated as heat. This energy cascade is the signature of turbulent systemsand is an important cause of mixing. In practice, it is impossible to model turbulentsystems exactly because of the lower bound on spatial resolution in the computa-tional grid used to represent the physical system being modeled.
All processes that occur on scales smaller than the minimum model resolutionmust be included using a turbulent energy closure scheme (Moin et al. 1991).Ignoring sub-grid scale dissipation of energy creates aliasing–a transfer of small-scale energy to larger spatial scales that produces numerical instabilities and modelfailure. A common approach to solving this problem is to parameterize the small-scale turbulent processes using an analogue to molecular diffusion. Specifically,mixing at the small-scale end of the turbulent cascade is assumed to be isotropic,and is approximated by a term that includes a turbulent diffusion coefficient. In thevertical component of the momentum equation, this term appears as:
o
ozKðzÞ ou
oz
� �
; ð3:31Þ
192 3 Limnology of Pit Lakes
where K(z) is the vertical turbulent diffusion coefficient and u is the horizontal currentvelocity. This analogue treats sub-grid scale turbulence in the same way as moleculardiffusion, except that the diffusion coefficient is a variable that depends on otherproperties of the system (Kipfer et al. 2000; Osborn 1980; Weinstock 1978).
Wind is a principle source of kinetic energy for turbulent mixing in pit lakes.Surface wind stress creates vertical current shear, which in turn generates turbu-lence. The Wedderburn number, an indicator of wind-driven mixing rates in pitlakes, is defined by
W ¼ g0h2m
u2�L
ð3:32Þ
where g0 ¼ Dq=q is the reduced gravity corresponding to the density jump Dqacross the bottom of the surface mixed layer; hm is the surface mixed layerthickness; L is the length of the lake; and u2
� is the kinematic shear stress due to thewind. For W « 1 observations and scaling arguments suggest that the mixed layerdeepens rapidly due to shear production of turbulent energy (Monismith 1985).
Other mechanisms exist for transporting and releasing energy for mixing withina pit lake. The vertical density structure of a pit lake leads to spectral decompo-sition of the horizontal velocity field into a set of internal vertical modes that areexcited by surface winds, resulting in horizontal currents throughout the watercolumn. Modes are characterized by their number of zero crossing points. Verticalcurrent shear resulting from this modal excitation can generate turbulence andmixing (Hamblin et al. 1999).
Another source of mixing can occur at the interface of a monimolimnion and anoverlying, cooler hypolimnion. The differential molecular diffusion rates of heatand salt (heat diffuses at approximately 100 times the rate of dissolved salts) cancause destabilizing heating at the bottom of the hypolimnion, resulting in con-vective mixing.
3.4.4.3 Pit Shell Morphometry
The pit shell morphometry is a fundamental component of pit lake models. In one-dimensional, laterally integrated models, it is expressed as a curve or functionrelating elevation, z, above the pit bottom to the corresponding plan view area,A(z), of the pit shell. Shell volume between two elevations can then be calculatedfrom the expression:
Vðz1; z2Þ ¼Zz2
z1
AðzÞdz ð3:33Þ
These data are typically extracted from maps or digital engineering drawings of pitshells.
3.4 Modeling of Pit Lakes 193
Hydrologic Balance in Pit Lakes
The hydrologic balance for a pit lake determines the filling rate, final lake ele-vation, and volume, and is often complex, with many distinct components,including:
• surface and sub-surface inflows of natural runoff, tailings, and treated water• groundwater inflows/outflows• precipitation/evaporation/sublimation (ice/snow)• removal via pumping
Surface and subsurface inflows can consist of water diverted from nearbystreams as well as water from treatment plants, tailings, and onsite water collectionfacilities. Inflows may be seasonal due to variable rates of precipitation, evapo-ration, and ice/snow melt. At high latitudes, it is common to have a freshet, or peakin the annual inflow corresponding to increased temperatures and subsequent rapidice and snow melt.
Groundwater flows may be directed into or out of a pit lake, and are often amajor component of the water balance. The depth and intensity of these flows overtime depend on hydrological gradients in the water table enclosing the pit shell andmay be difficult to quantify accurately without extensive field data.
Other types of inflows and outflows occur in pit lakes. For example, the MainZone pit lake at the Equity Silver Mine site near Houston, BC (Canada) receives asurface discharge of relatively dense slurry (neutralization sludge) that penetratesdownward through the lake as a density flow (Crusius et al. 2003). The flowgenerates shear turbulence that entrains ambient lake water and transports itdownward. The entrainment increases the volume and decreases the density of thedescending flow, causing it to decelerate. Over the summer months, this mecha-nism results in large-scale redistribution of water properties and is an importantmechanism for surface metal removal (Dunbar 2008). In addition, clean water ispumped into an adjacent stream from a depth of 20 m in the lake.
At the Island Copper Mine saltwater pit lake near Port Hardy, BC (Canada),treated water is injected through a pipe directly into the hypolimnion at a depth ofapproximately 220 m (Fisher 2003).
3.4.4.4 Energy Balance in Pit Lakes
The primary components in the energy balance for pit lakes are the contributionsof wind and surface heat fluxes to the surface momentum flux. Subsurface flows,including groundwater and density inflows from high conductivity discharges, mayalso affect the heat budget. Less frequently, geothermal sources make a significantcontribution (Henderson-Sellers 1986). The net heat flux is given by (Balistrieriet al. 2006):
HNET ¼ ½HSWð1� ASWÞ� þ ½HLWð1� ALWÞ� � HLWB � HE � HC ð3:34Þ
194 3 Limnology of Pit Lakes
where the components include incident short (HSW) and long (HLW) wave radia-tion; long wave outgoing (blackbody) radiation (HLWB); sensible heat (HC), andlatent heat of evaporation (HE). The fraction of incident radiation absorbed by a pitlake is determined by the reflectivity or albedo (A) of the lake, which variesdepending on latitude, lake color, surface roughness due to waves, and the fre-quency of the incident radiation.
Radiation fluxes are divided between: direct solar short wave radiation (280–2,800 nm); incoming long wave radiation (greater than 2,800 nm) emitted fromclouds and water vapor; and outgoing long wave radiation emitted by the pit lakesurface. Short wave radiation is usually measured directly, while long waveradiation is more often calculated from cloud cover, air temperature, and humidity.Short wave radiation with a wavelength of less than 700 nm is classified as pen-etrative, while longer shortwave radiation is non-penetrative. The former exhibitsexponential decay with depth while the latter adds energy only at the lake surface.
Approximately 45% of the incident short wave radiation is penetrative (Gates1966). The penetrative depth is determined by the transmissivity of the pit lakewater and follows the Beer-Lambert Law given by:
PðzÞ ¼ P010�lz
where P0 is the incident shortwave power, and l is a coefficient that is dependenton the lake properties.
3.4.5 Model Inputs and Outputs
Pit lake models require input data of various types to perform calculations andgenerate output. Initial values are required for some variables at the beginning ofthe simulation (e.g. pit morphometry; initial lake depth, temperature, salinity, andgeochemical composition), while time-series of boundary values are required forinput variables that change during a model simulation (e.g. meteorological vari-ables, surface and sub-surface inflows).
The following is a list of input data required for a time-dependent, laterally-averaged (one-dimensional) pit lake model, although specific data requirementswill depend on the particular application and model design:
• Initial Values
– Pit morphometry
pit area versus elevationelevation of pit bottom, spillway, and crest
– Lake Properties
surface elevationtemperature
3.4 Modeling of Pit Lakes 195
salinitypHconcentrations of all chemical species of interest
temperaturesalinitypHconcentrations of all chemical species of interest
– Meteorological
air temperaturerelative humiditywind speedprecipitationevaporationincident short wave radiationincident long wave radiationcloud cover
Ideally, all time-series data required for a pit lake model simulation areavailable as measurements from stations at or near the lake. Since this is often notthe case, proxy data must be substituted for unknown values. Suitable proxymeteorological data may be available from permanent data collection stations.Environment Canada, for example, maintains an on-line database of historicalmeteorological data that are easily accessible. These data are often not compre-hensive, however, and may need to be supplemented from other sources.
Numerical weather forecast and climate models are often a good source ofproxy data. For example, regional values of short and long wave radiation andother variables are available through the Internet from the National Centers forEnvironmental Predictions (NCEP; Glahn and Ruth 2003).
3.4.6 Model Verification and Sensitivity
In principal, all pit lake models should be verified against measurements to vali-date their use in a particular application. However, it is often not possible to
196 3 Limnology of Pit Lakes
undertake thorough model verification, either because a complete data set isunavailable, or because of the nature of the model application (e.g. a 200 yearsimulation of a pit lake for a mine that is in the design phase). Such circumstancesmay require a certain amount of faith in a model based on an established record ofprevious successful verifications.
Of equal importance is the need to conduct sensitivity analyses for model inputs(Castendyk and Webster-Brown 2007a, b; Romero and Melack 1996). This entailsa systematic variation of key model input variables through values that bracketanticipated ranges. This is particularly important in nonlinear hydrodynamicsystems that can exhibit unpredictable, chaotic behavior due to strong nonlinear-ities (Pattantyús-Ábrahám et al. 2008). In pit lakes where there are numerousinflows, a well designed sensitivity analysis will determine the dependence of lakestratification and stability on inflow properties (Castendyk and Webster-Brown2007a, b). The thoroughness of a sensitivity analysis for a pit lake model is oftenconstrained by the time required to complete a single model simulation, whichmay extend to several days or more depending on the model and simulationcomplexity.
3.4.7 Examples of Pit Lake Models
3.4.7.1 DYRESM
The one-dimensional Dynamic Reservoir Simulation Model, or DYRESM, is oneof the most frequently used and cited numerical models for simulating pit lakehydrodynamics. It was developed by the Center for Water Research at the Uni-versity of Western Australia where it continues to be maintained and madeavailable through the Internet.
DYRESM has been successfully applied to studies of natural and artificiallakes, reservoirs, and pit lakes (Balistrieri et al. 2006; Hamblin et al. 1999;Hamilton and Schladow 1997; Patterson et al. 1984). While the current version ofDYRESM available from UWA does not include ice formation, modified versionsthat include this process have been successfully tested (Patterson and Hamblin1988). At present DYRESM is limited to modeling pit lake hydrodynamics;however, it can also be run together with the Computational Aquatic EcosystemDynamics Model (CAEDYM; Hipsey, et al. 2006). However, CAEDYM does not,at present, simulate the geochemical processes associated with pit lakes.
3.4.7.2 PitMod
PitMod is a proprietary, one-dimensional model developed by Lorax Environ-mental Services in Vancouver, BC (Canada). It is specifically designed tomodel pit lake hydrodynamics and geochemistry (Crusius et al. 2002). PitMod
3.4 Modeling of Pit Lakes 197
incorporates many of the physical processes included in DYRESM as well asincluding an ice formation algorithm (Rogers et al. 1995). Most significantly,however, PitMod simulates an extensive set of geochemical reactions by cou-pling to the PHREEQC geochemical speciation model (Parkhurst et al. 1999).This allows PitMod to perform simulations of a century or more in length thatinclude the evolution of both the geochemical and physical properties of a pitlake.
Like DYRESM, the structure of PitMod is based on a set of vertical layers.The values of geochemical variables required by PHREEQC, such as pH andchemical species concentrations, are maintained and adjusted in PitMod basedon modeled pit lake physical processes. At each time step, PHREEQC isimplemented within all layers to calculate the equilibrium concentrations ofgeochemical variables.
PitMod is designed to predict the physical and chemical properties of pit lakes,given suitable estimates for environmental input variables. Model results providedetails of the chemistry in vertical layers over time.
3.4.7.3 PitMod: Physical Component
The physical component of PitMod simulates the evolution of the pit lake strati-fication by predicting salinity, temperature, density (calculated from salinity andtemperature) and dissolved oxygen concentration. The physical component of themodel is a one-dimensional stack of variable thickness layers. Each layer isassumed to be homogeneous in all water properties. The principal physical pro-cesses simulated by PitMod include:
• Solar heating of the lake surface: thermal energy from the sun is added tosurface waters, thereby altering the temperature and density. Heat is transferredto deeper layers through penetrative absorption, diffusion, mixing, and con-vection. Similarly, the model allows for geothermal heat where it is consideredimportant.
• Vertical mixing as a function of the lake density stratification—kinetic energyfrom the wind causes adjacent water layers to mix to varying degrees, dependingon the vertical density structure of the lake.
• Convective mixing due to static instabilities in the water column density, i.e.when water in a layer is denser than the water in the underlying layer.
• Oxygen consumption in the water column and sediments is a critical parameterin the geochemical state of the pit lake. Oxygen is introduced to the surfacewaters through interaction with the atmosphere and is distributed through thewater column by mixing and diffusion across adjacent layers. Oxidation oforganic matter in the water column and sediments consumes oxygen; if theconsumption rate of oxygen in a given layer exceeds its rate of replacement, thelayer becomes anoxic.
198 3 Limnology of Pit Lakes
Along with these processes, PitMod can accommodate the introduction ofexternal source water, or the removal of resident water at any depth in the lake.
3.4.7.4 PitMod: Geochemical Component
The geochemical component of PitMod employs PHREEQC, a geochemicalmodel originally produced by the USGS (Parkhurst et al. 1999). PHREEQC iscapable of a wide variety of aqueous geochemical calculations, including:
• speciation and saturation index calculations;• mineral and gas equilibrium;• surface complexation (adsorption) reactions;• ion exchange reactions; and,• redox reactions.
PHREEQC was selected because it is widely and extensively used, has beenrigorously validated, and the computer code is freely available on the Internet. Inaddition, it includes several thermodynamic databases including WATEQ4F andMinteq. Furthermore, PHREEQC’s treatment of aqueous solution chemistry isvalid from freshwater through to the high ionic strength media often observed inpit lake systems (Parkhurst personal communication 1998).
PHREEQC requires a comprehensive set of chemical input data to characterizethe pit lake water. For a typical simulation of mine-impacted waters, this wouldinclude pH, temperature, the controlling redox couple, and the concentrations ofoxygen, secondary oxidants (e.g. nitrate and sulfate), major cations, major anions,and trace metals.
PitMod integrates the effect of all inputs on the physical and geochemicalproperties of the pit lake by solving the set of governing hydrodynamic equationsfollowed by calls to PHREEQC routines that calculate equilibrium concentrationsof all chemical species within each model layer. PHREEQC predictions are basedon thermodynamic principles and a database that includes hundreds of chemicalspecies. Figure 3.76 shows the sequence of steps in a typical application ofPitMod.
The output of PHREEQC includes the equilibrium concentration and speciationof all aqueous components, as well as the equilibrium concentrations of all min-erals. Water quality is predicted for each model layer as a function of time,yielding vertical profiles of each parameter. PHREEQC predicts whether a metalwill remain dissolved, precipitate from solution, react with an existing mineral byion exchange, or adsorb to a particle. An important case occurs in anoxic waters,where PHREEQC can predict, for a given metal and dissolved sulfide content,whether or not the metal sulfide will precipitate.
3.4 Modeling of Pit Lakes 199
3.4.8 Case Studies
3.4.8.1 The Equity Silver Mine
The Equity mine site is located in south-central British Columbia, Canada(54�11.590N, 126�15.900W). The two Equity pits produced silver, copper, and goldfrom 1981 to 1994. Subsequently, both pits flooded with groundwater and surfacerunoff. In addition, the larger Main Zone pit receives seasonal surface discharge ofrelatively dense treatment slurry (ARD neutralization sludge) as well as runofffrom the slightly higher Waterline pit lake (Table 3.29).
Water quality in the Main Zone pit lake is characterized by elevated trace metalconcentrations in the epilimnion (particularly zinc) during late spring and summer,and significantly lower values in the hypolimnion. The water level in the MainZone pit is managed by pumping water from a depth of 20 m to a nearby stream.
Fig. 3.76 Components of PitMod, a coupled physical-geochemical pit lake model
200 3 Limnology of Pit Lakes
The neutralization sludge slurry discharged to the surface of the Main Zone pitlake contains high concentrations of zinc particulates and low concentrations ofdissolved zinc. The slurry flow penetrates downward as a density current along thepit wall to the bottom layer of the lake. This is evident in the high particulate zincconcentrations found below 100 m in conjunction with high turbidity (Fig. 3.77a).In addition, the slurry is well oxygenated and delivers dissolved oxygen to thehypolimnion (Fig. 3.77b). In contrast, the Waterline pit lake oxygen remainspermanently stratified, despite Waterline being much shallower (Fig. 3.77b).
Typically, both pit lakes are covered by up to 1 m of ice from Novemberthrough May. During late spring and early summer, drainage into the lakes isgreatly enhanced by melting snow and ice. In addition, the flow of surface waterfrom Waterline into Main Zone increases. The latter flow, combined with runoffdown the pit walls, increases the flux of trace metals into the Main Zone surfacewaters. The value for [Zn] measured at 1 m depth during June 2001 was 800 lg/L.
Table 3.29 Properties of the Main Zone (MZ) and Waterline (WL) pit lakes
Pit Lake Surface Elev, m Depth, m Area, m2 Volume, 106 m3
Fig. 3.77 Vertical profiles from the Equity Mine of a dissolved Zn, total Zn, and transmissivityin the Main Zone pit lake b dissolved oxygen in the Waterline and Main Zone pit lakes duringOctober 2001
3.4 Modeling of Pit Lakes 201
This value subsequently decreased to 250 lg/L in August, and to 40 lg/L byOctober 2001 (Fig. 3.78).
Experiments carried out within limnocorrals located in the Main Zone pit lakeshow that algae can facilitate removal of dissolved zinc through both surfaceadsorption and biological uptake (Martin et al. 2003). High rates of removal wereobserved after fertilization of limnocorral surface waters stimulated algal growth.The Main Zone pit lake is oligotrophic, however, and naturally occurring algalconcentrations are insufficient to account for the observed rates of zinc removalobserved between June and October 2001.
PitMod was used to help explain temporal changes in zinc concentration during2001 within the Main Zone pit lake. The model showed that surface discharge ofneutralization sludge slurry, and subsequent density flow down the pit wall, isresponsible for the observed zinc concentrations.
Density flows occur in pit lakes when a relatively dense liquid or slurry entersless dense receiving waters and travels downward along the pit walls in response togravity. The behavior of the density flow depends on its volume flux and excessdensity. As the flow accelerates toward the lake bottom, the velocity gradientbetween the quiescent lake water and the outside surface of the density flowgenerates shear turbulence. This results in mixing between the two water massesand a transfer of momentum from the density flow to the lake water.
0
2
4
6
8
10
Dep
th (
m)
0 200 400 600 800
Dissolved Zn (μg/L)
October August June
Fig. 3.78 Vertical profiles from the Equity Mine of dissolved Zn in the Main Zone pit lakeduring June, August, and October 2001
202 3 Limnology of Pit Lakes
The vertical component of this momentum causes some of the lake water to beentrained, and to move downward with the slurry. At the same time, mixing ofslurry with some of the lake water increases the volume of the density flow anddecreases its relative density, causing it to decelerate. Depending on the volumeflux and density of the slurry, and the density and depth of the lake, the densityflow will either reach the lake bottom or separate from the pit wall near a level ofneutral buoyancy above the lake bottom. A schematic of a density flow togetherwith the governing equations are shown in Fig. 3.79.
From late June, 2001 through late August, 2002 a comprehensive set of physicaland water quality measurements were made in the Main Zone and Waterline pit lakesas part of a three year Canadian National Science and Engineering Research Council(NSERC) and industry funded study. Additional data were used to construct a detailedwater balance for the lake during the same period, including: lake surface level;precipitation and evaporation; and pumping and slurry discharge rates (Table 3.30).These provided data inputs for a 425 day PitMod simulation of the evolution of waterproperties in the Main Zone pit lake. For this simulation, all geochemical processeswere ignored and the PHREEQC module was not required. All changes in modeledconcentrations were therefore the result of physical processes only.
Time-series of zinc and copper concentrations were extracted from the modeloutput, corresponding to depths of 1, 5, and 100 m in the Main Zone pit lake andthen compared with field measurements at the same depths. The data reveal twooccurrences of elevated zinc and copper concentrations at a depth of 1 m in June
U 2h = u2 dz0
U 2h = u2 dzdd0
E = f Ri0( ) Entrainment
Ri0 = g hcos
U 2 Richardson No.
(f is empirical)
Head
Nose
x
z
U
d(Uh)
dx= EU,
d(U 2h)
dx= g hsin
Fig. 3.79 Schematic andequations governing theproperties of pit lake densityflows
Table 3.30 Mean waterbalance for the Main Zone pitlake during the periodsimulated by the model fromJune 29, 2001 to August 28,2002
of both 2001 and 2002. In both cases, subsequent measurements revealed a largedecrease over the following two to three months.
The model time-series for zinc agree well with the measured zinc concentra-tions (Fig. 3.80). In the absence of any geochemical or biological mechanism inthe model, the results support the hypothesis that the entrainment and subsequentdownward transport of surface waters by the relatively dense slurry is responsiblefor the rapid removal of dissolved trace metals from the surface waters of the MainZone pit lake. These results indicate that surface water entrainment may be animportant mechanism for the removal of trace metals in other pit lakes that receivesimilar inflows of relatively dense slurries.
3.4.8.2 A High Latitude Pit Lake
This example focuses on both the physical and geochemical evolution of a pit lakelocated at high latitude. Three scenarios were modeled using PitMod. The sce-narios differ only in the depths that two inflows are discharged to the pit lake–onefrom a contact pond (CP), and the other an overflow from an existing pit lake. Thethree scenarios are: CP and overflow both enter at the surface; CP discharged atdepth; overflow enters at the surface, and CP and overflow both discharged atdepth
The relevant physical and hydrodynamic processes simulated by PitMod underthese conditions include:
• solar heating of the lake surface by short- and long-wave radiation;• cooling by emission of long-wave radiation• sensible heat and latent heat of evaporation• wind mixing;• convective mixing due to vertical density instabilities; and• oxygen (oxidant) consumption in the water column and sediments.
0
200
400
600
800
1000
0 100 200 300 400
Days from Start of Model Simulation
1 m5 m100 m
Zn (ug/L)
PitMod
Data
ICE
Jul Aug Sep Oct Nov Dec Jan Feb Mar Apr May Jun Jul Aug
Zn ( g/L)
Fig. 3.80 Comparison of modeled and measured dissolved Zn concentrations from the EquityMine at depths of 1, 5, and 100 m in the Main Zone pit lake
204 3 Limnology of Pit Lakes
The relevant geochemical processes modeled by the PHREEQC component ofPitMod include:
• speciation and saturation index calculations;• mineral and gas equilibrium;• surface complexation (adsorption) reactions;• ion exchange reactions; and• redox reactions.
PitMod requires the following input for these three simulations:
• pit shell morphometry;• daily or hourly meteorological data, including: wind speed and direction; pre-
cipitation; evaporation; relative humidity; short- and long-wave radiation; cloudcover (%).
• water balance with daily values of inflows and outflows;• areas of exposed pit-wall geology and predicted chemistry from different rock
units; and• flow volumes and water chemistry of inflows and outflows, including both
surface runoff, waste rock seepage chemistry, consolidation water fromreclaimed tailings and groundwater (Table 3.31).
PitMod accommodates various types of data depending on their availability.Where data are missing or unavailable, surrogates are specified based on experi-ence at similar pit lakes or from other data sources. Specifically, regional data forshort and long wave radiation were obtained from the National Centers forEnvironmental Prediction (NCEP) global model database managed by NOAA(National Oceanic and Atmospheric Administration).
In the PitMod simulations, the pit lake receives inflows from tailings consoli-dation, water surface runoff from the surrounding watershed, seepages from awaste rock facility, highwall runoff, direct precipitation to the surface of the lake,and groundwater. These inflows are introduced into the pit lake at elevations andtimes appropriate for each scenario, and are allowed to mix and evolve accordingto the model equations governing lake physics and geochemistry.
To estimate the contributions from pit wall runoff, the surface area of eachexposed rock unit was digitized and input to PitMod as a surface area vs. depthprofile. The chemistry from each unit (Table 3.32) was then added to the pit lakeduring the filling process until the corresponding pit wall area was submerged bythe lake, at which point it was no longer considered reactive. Therefore, theloading of dissolved material to the lake from each rock unit decreases as the lakefills (Table 3.31, Table 3.32).
To account for exposure and repeated flushing and rinsing of salts and metalsfrom the pit wall rocks, concentrations for certain parameters were permitted todecay over time. The concentrations provided in Table 3.32 are the initial levelsprescribed.
3.4 Modeling of Pit Lakes 205
3.4.8.3 Scenario 1: CP and Overflow Discharged at Surface
PitMod predicts that the pit lake will fill in approximately 42 years. Throughoutthis period, a salinity gradient develops due to the presence of highly saline tailingspond water and progressive submergence of exposed pit walls relative to exposedlake surface area (the lake has a very small catchment, only marginally larger thanthe area of the open pit itself). In other words, as precipitation falls on the pitcatchment, it will contact either the pit wall (picking up salinity) or the lakesurface (adding no salinity to the lake).
Table 3.31 Summary of water quality of major inflows for selected species; all units in mg/L,except for Cd and Hg, which are in lg/L, and pH
The initial pit lake surface area is very small, so virtually 100% of the pre-cipitation will contact exposed rock units on the pit walls, thereby contributing amaximum amount of salts to the emerging pit lake. As the lake grows and thesurface area increases, a progressively larger fraction of the precipitation will falldirectly on the lake surface. The result is higher salinity water at depth within thepit lake and comparatively fresher water near the surface (Fig. 3.81). Theenhanced vertical salinity gradient will increase the stability of the water column.
When the pit lake is partially full, it will begin to behave in a relatively con-sistent fashion from year to year. Starting in the early spring under ice-cover, thewater column will develop a vertical structure in which surface water immediatelybelow the ice has a temperature slightly greater than 0 �C. The temperature thenincreases with depth to a value near 4 �C—the temperature of maximum waterdensity. The upper layers of the modeled water column display a complex struc-ture resulting from the residual signatures of past mixing events. This structure isubiquitous in high latitude pit lakes and has also been seen at Equity Silver pitlakes (Lorax 2005).
Typically, ice on high latitude lakes begins to melt and pull away from the pitlakeshore in May or June, and as the air temperature warms during April and May,fresh melt-water is steadily added to the surface waters at the water–ice interface,decreasing surface water salinity (Bergmann and Welch 1985). As the ice meltsthe surface layer salinity decreases, the temperature increases, and the watercolumn passes through isothermal conditions (Fig. 3.82). The increased salinitydifference across the halocline results in greater physical stability of the upperwater column with a corresponding resistance to wind mixing and turnover. As aresult, even though the lake surface water warms through the temperature ofmaximum density, the salinity decrease combined with the salinity gradientformed through the lake filling process prevents the surface water from becoming
0
50
100
150
200
250
300
350
Ele
vatio
n (m
)
Year
0 1 2 3 4
0 50 100 150 200
Fig. 3.81 Scenario 1: predicted salinity from a 200 year PitMod simulation (g/L)
3.4 Modeling of Pit Lakes 207
denser than the water below. Therefore, the lake water column does not experiencea spring turnover.
Mixing will only occur to a depth of 5–20 m (depending on wind strength and themagnitude of the salinity gradient). Physical stratification will persist and strengthenthrough the summer as surface water temperature continues to increase. With theonset of fall, the temperature differential between surface and intermediate waterwill decrease and wind mixing will begin to erode the density structure of the upperwater column, deepening the pycnocline and increasing the salinity of the surfacelayer as more saline water is mixed into the surface layer from below (Fig. 3.82).
As a result, the water column will be less stable in fall than in spring–a phe-nomenon observed at the Equity Silver Waterline pit lake in central BritishColumbia, and at other high latitude lakes. Although the fall turnover shouldextend to greater depths than in spring, it will likely only affect the upper watercolumn as more saline, and therefore denser, intermediate and deep water hinderdeeper mixing.
Fall turnover in similarly stratified pit lakes penetrates to depths of 10–50 mdepending on the placement and strength of the halocline. The depth of fallturnover varies from year to year, depending on the quantity of freshwater enteringthe lake surface during spring, the magnitude of the existing salinity gradient, andthe wind speed and duration. PitMod predicts that the wind-mixed layer willoccasionally extend to a depth of 20 m.
In the late fall and early winter thermal stratification will strengthen, withcooler water overlying denser 4 �C deep water. Ice will form in late fall and thewater column will then become insulated from surface wind energy, remainingquiescent until spring, when the cycle will start again.
Given this impediment to whole-lake mixing, the pit lake deep waters willevolve towards reducing conditions over time. As is typical of lakes with smallcatchments and low nutrient inputs (deep lakes in particular), it is likely that the pitlake will be poorly productive (oligotrophic) and as a result, the in situ oxygendemand will be very low. Nevertheless, the imposed barriers to mixing combinedwith deep, isolated waters indicate that the dissolved oxygen will be fully con-sumed in regions of the lake before it has completed its filling, provided that CPand overflow inputs are not injected at depth, as in Scenarios 2 and 3. Once
0
10
20
Dep
th (
m)
0 3 6 9 12 15 18
Thickening Mixed Layer
Open Water
One Year
Fig. 3.82 Scenario 1: predicted temperature in the upper 20 m during year 55 of a 200 yearPitMod simulation
208 3 Limnology of Pit Lakes
dissolved oxygen has been removed, secondary oxidants will be employed and thedeep lake will experience sulfate reduction, sulfide formation, and the precipitationof a variety of solid-phase sulfide minerals.
Figure 3.83 shows the predicted dissolved oxygen concentration during Sce-nario 1 (discharge of CP and overflow at surface). As the pit fills with water in theearly stages, the water column will remain reasonably well oxygenated untilapproximately year 10, when the lake is roughly 200 m deep. At this time, dis-solved oxygen in the bottom layers will become depleted due to the absence ofcomplete turnover. Salinity gradients within the interior of the lake will be suffi-ciently large to limit wind mixing and seasonal turnover to the upper 20 m,resulting in stagnation in the bottom portion of the pit lake (Fig. 3.83).
0
10
20
30
Dep
th (
m)
0
50
100
150
200
250
300
350
Ele
vatio
n (m
)
Year
0 6 9 12 15
0 50 100 150 200
3
Fig. 3.83 Scenario 1: predicted dissolved oxygen concentration from a 200 year PitModsimulation (mg/L)
3.4 Modeling of Pit Lakes 209
The depletion of oxygen in the interior of the pit lake will result in the utili-zation of secondary oxidants; specifically, nitrate (Fig. 3.84), Fe-oxides(Fig. 3.85), Mn-oxides, and sulfate. The evolution of nitrate–the first of the sec-ondary oxidants to be consumed–resembles that of dissolved oxygen in that thenitrate concentration will begin to decrease with time once oxygen has beendepleted (Fig. 3.84). Within 15 years of the start of pit filling, the interior of thewater column will start to lose nitrate through denitrification.
Iron shows evidence of its use as a secondary oxidant in deep water beginningat approximately year 18, when the concentration of dissolved Fe will increase to50 lg/L. This addition of dissolved Fe to bottom water is due to the reductivedissolution of Fe-oxides, which liberates dissolved ferrous Fe (Fe2+) to solution.However, the increase in the inventory of dissolved Fe2+ is transitory due to theprecipitation of Fe as Fe-monosulfides (FeS), which commences following sulfatereduction. The commencement of sulfate reduction can be seen in Fig. 3.86, whichshows the presence of detectable sulfide at 20 Year.
Once most of the trace metals have been precipitated as insoluble sulfideminerals, dissolved sulfide concentrations will increase, particularly within theinterior of the pit lake where there is no source of dissolved oxygen (Fig. 3.86).
With the onset of sulfate reduction in the interior of the pit lake, trace elementconcentrations will decrease due to their insolubility in the presence of free sulfide(Fig. 3.86). This behavior is illustrated in Fig. 3.87, where dissolved As within thelake interior decreases due to the formation of As sulfide once sulfate reductionstarts and most of the dissolved Fe is consumed. Dissolved As will disappear in theinterior of the lake, but not in surface waters where oxic conditions will persist.
The As concentration within the pit lake surface mixed layer will decrease withtime to a quasi-steady-state value fluctuating between 70 and 130 lg/L (Figs. 3.87and 3.88). This slow decrease with time corresponds to the progressive decrease in
0
50
100
150
200
250
300
350
Ele
vatio
n (m
)
Year
0 130 260 390 520 650
0 50 100 150 200
Fig. 3.84 Scenario 1: predicted dissolved nitrate concentration from a 200 year PitModsimulation (lg/L)
210 3 Limnology of Pit Lakes
As loading from the highwall as it is submerged by the rising lake surface, andwith ongoing removal of As through sorption to Fe- and Mn-oxyhydroxides, whichwill settle in the water column to the pit lake bottom. In comparison, the surfacewater sulfate concentration for Scenario 1 will vary little with time (&700 mg/L),as it will behave conservatively in the upper, oxic water column where sulfatereduction will not occur (Fig. 3.89).
0
50
100
150
200
250
300
350
Ele
vatio
n (m
)
0.0 10.8 21.6 32.4 43.2 54.0
0 50 100 150 200
Fig. 3.85 Scenario 1: predicted dissolved Fe concentration from a 200 year PitMod simulation(lg/L)
50
100
150
200
250
300
350
Ele
vatio
n (m
)
Year
0.0 7.2 14.4 21.6 28.8 36.0
00
50 100 150 200
Fig. 3.86 Scenario 1: predicted dissolved HS concentration from a 200 year PitMod simulation(mg/L)
3.4 Modeling of Pit Lakes 211
0
10
20
30
Dep
th (
m)
0
50
100
150
200
250
300
350
Ele
vatio
n (m
)
Year
0 65 130 195 260 325
0 50 100 150 200
Fig. 3.87 Scenario 1: predicted dissolved As concentration from a 200 year PitMod simulation(lg/L)
0 50 100 150 2000
50
100
150
200
250
300
As
(g/
L)
Year
Fig. 3.88 Scenario 1: predicted dissolved As concentration in the surface layer from a 200 yearPitMod simulation
212 3 Limnology of Pit Lakes
3.4.8.4 Scenario 2: Discharge of CP Water at Depth
Scenario 2 differs from Scenario 1 in that CP water is diverted to 10.5 m above thelake bottom instead of being discharged to the lake surface. On a seasonal orannual basis, the behavior of the upper water column of the pit lake in Scenario 2should be similar to Scenario 1. However, the surface inflow from the CP will beconsiderably less saline than the tailings water, thereby weakening the stratifica-tion in the lake as it fills. Initially, this will result in the lake having a relativelyuniform, well-mixed vertical structure. Then, as the lake fills and approaches nearsteady-state salinity stratification, a more stable structure will develop whereindeep lake mixing will occur through the introduction of CP water at a seasonallydependent temperature.
The effect of water loss from surface overflow on the properties of the pit lakewill depend on how much the overflow water differs in density from resident pitlake surface waters. The overflow water is predicted to be only slightly more salinethan the pit lake surface water and is therefore expected to sink within the mixedsurface layer of the lake to depths of a few tens of meters.
PitMod salinity values for Scenario 2 are presented in Fig. 3.90. As previouslysuggested, a strongly stratified salinity structure will evolve very early in the fillingprocess as a relatively fresh surface layer forms above a more saline bottom layer.This will be partly due to the introduction of saline contact pond water to thebottom of the pit lake, together with mixing of highly saline tailings pond water
0
1
2
3
4
TD
S (
g/L)
Sul
phat
e (m
g/L)
0 50 100 150 200
0 50 100 150 200
Year
500
1000
1500
2000
2500
0
Fig. 3.89 Scenario 1: predicted dissolved sulphate and total dissolved solids concentrations inthe surface layer from a 200 year PitMod simulation
3.4 Modeling of Pit Lakes 213
0
50
100
150
200
250
300
350
Ele
vatio
n (m
)
Year
0 1 2 3 4
0 50 100 150 200
Fig. 3.90 Scenario 2: predicted salinity from a 200 year PitMod simulation (parts per thousand)
0
10
20
30
Dep
th (
m)
0
50
100
150
200
250
300
350
Ele
vatio
n (m
)
Year
0 3 6 9 12 15 18
0 50 100 150 200
Fig. 3.91 Scenario 2: predicted temperature from a 200 year PitMod simulation (8C)
214 3 Limnology of Pit Lakes
into the pit lake surface waters. The predicted influence of this source on the deepwaters is visible in the thermal structure of the lake (Fig. 3.91). Seasonal variationsare visible as temporal striations within the bottom water caused by seasonalincursions of warm and cold water. Warm water, introduced during the summer, isless dense than the ambient water and therefore tends to mix upward in the watercolumn, while cold fall and spring water is denser and remains near the lake floor.
The seasonal wind-mixed epilimnion will be restricted to the upper few meters;however, fall turnover will penetrate more deeply than in Scenario 1, resulting in a20–30 m thick inter-annual mixed layer. This will have important implications forthe seasonal introduction of dissolved oxygen into the pit lake surface layer and tothe addition at the surface of water with disparate chemical qualities originatingfrom below the mixed layer.
An interesting and potentially important consideration involves the decreasingpenetration depth of the inter-annual turnover once the pit lake is full and over-flowing occurs (Fig. 3.92). When surface water overflows, and is lost from thelake, it causes a thinning of the mixed layer; that is, fresh surface water is removedfrom the lake, allowing relatively saline water to move upward toward the lakesurface. This is important if discharge water from the pit lake is to be removedfrom depth, rather than directly from the surface since the chemical gradientswithin the pit lake tend to be greater in the upper water column.
0
10
20
30
Dep
th (
m)
0
50
100
150
200
250
300
350
Ele
vatio
n (m
)
0 3 6 9 12 15
0 50 100 150 200
Fig. 3.92 Scenario 2: predicted dissolved oxygen concentration from a 200 year PitModsimulation (mg/L)
3.4 Modeling of Pit Lakes 215
Perhaps the most important implication of the Scenario 2 configuration is theimpact of the introduction of oxygenated CP water on the geochemical propertiesof the deep water. In particular, the stable stratification of the water column earlyin the lake filling process will have an important effect on the oxygen (and sec-ondary oxidant) distribution within the water column (Fig. 3.92). As for Scenario1, lake productivity was set to oligotrophic conditions in Scenario 2 (i.e. very lowproductivity; hence, very low oxygen demand); nevertheless, the interior of the pitlake, approximately 220–330 m above the lake floor, evolves to suboxic condi-tions within 30 years of filling (Fig. 3.92).
The surface mixed layer will remain well oxygenated through direct contactwith the atmosphere while bottom water is oxygenated by the introduction of CPwater, resulting in an upward migration of water through the lake interior such thatlake water ‘age’ is inversely related to depth (i.e. deep water is youngest, shallowwater is oldest). Accordingly, the oxygen concentration of the lake interior willdecrease away from the lake floor with time as oxygen is consumed (Fig. 3.92).
As expected, the model predicts a very low dissolved Fe concentration in thesurface layer due to the precipitation of particulate oxyhydroxides under oxy-genated conditions (Fig. 3.93). This mechanism is also responsible for removingAs from the wind-mixed surface layer over time. Similarly, dissolved Fe willremain at low concentrations in the deepest lake waters due to the presence ofdissolved oxygen. Within the intermediate water column, dissolved Fe will beremobilized through reductive dissolution, resulting in localized elevated con-centrations, and will be removed via sulfide precipitation as the lake water ageswithin a relatively narrow range of depths.
The corresponding concentration of free sulfide will progressively increase withthe age of the lake water until the water contacts the oxygenated wind-mixedsurface layer. Sulfide concentration will increase in the water column once oxygen
0
50
100
150
200
250
300
350
Ele
vatio
n (m
)
Year
0.0 3.6 7.2 10.8 14.4 18.0
0 50 100 150 200
Fig. 3.93 Scenario 2: predicteddissolved Fe concentration from a 200 year PitModsimulation (lg/L)
216 3 Limnology of Pit Lakes
has been depleted and the majority of trace metals are consumed within the lakeinterior (metal sulfide precipitation is the primary sink for free sulfide). Accord-ingly, sulfide concentration will progressively increase with time and distancefrom the source of oxygen at lake bottom, reaching a maximum immediatelybelow the wind-mixed surface layer.
Interestingly, dissolved sulfide will increase to relatively high values within thelake interior despite the oligotrophic conditions, due to the relatively long resi-dence time of water within the pit lake basin. Even though the driving force for thecreation of free sulfide is weak (i.e. low primary productivity), the concentrationwill increase as the water of the lake interior has a long residence time before it isexposed to oxygen at the lake surface (Fig. 3.94).
The impact of the pit lake structure on As is illustrated in Fig. 3.95. Arsenic willbe introduced into the pit lake primarily in the tailings pond water, and secondarilythrough highwall runoff and overflow into the lake. In comparison, the CP will addcomparatively low concentrations of As to the pit lake. Because of the dischargeconfiguration, the tailings pond water will enter the young lake, followed by the CPwater, which will be added to the denser tailings pond water, inducing convectivemixing. The addition of highwall and overflow waters to the lake surface will resultin the highest modeled surface layer As concentrations (Fig. 3.95).
The contribution of As from the highwall will diminish as the lake level rises.Combined with limited removal through co-precipitation with Fe-oxyhydroxides,this will progressively decrease the concentration of dissolved As in the surfacelayer (Fig. 3.95).
Loss of As (and other trace elements) in the lake interior will result from sulfideprecipitation; however, the proximity and resulting entrainment of low As con-centration water immediately below the wind-mixed layer due to sulfide precipi-tation will promote further decreases in As concentration within the lake surface
0
50
100
150
200
250
300
350
Ele
vatio
n (m
)
Year
0.00 0.56 1.12 1.68 2.24 2.80
0 50 100 150 200
Fig. 3.94 Scenario 2: predicted free sulphide concentration from a 200 year PitMod simulation(mg/L)
3.4 Modeling of Pit Lakes 217
(Fig. 3.96). The As concentration in the surface water will decrease with time,from concentrations exceeding 300 lg/L to values of 50–100 lg/L (Fig. 3.96).
In a similar way, the sulfate concentration will decrease over the same period asthe less saline CP water is entrained from depth commensurate with the loss offreshwater from the surface layer. The primary water quality issue for this scenariostems from the contributions of total dissolved solids (TDS) and sulfate to thereceiving environment, rather than from trace metals (Fig. 3.97).
3.4.8.5 Scenario 3: All Inflows Directed to Depth
Scenario 3 differs from the first two Scenarios in that both overflow and CP inflowto the pit lake are 10.5 m above the pit lake bottom. In this regard, Scenario 3 issimilar to Scenario 2 with the addition of overflow water added at this depth.
The effect of discharging overflow water to depth is apparent in the differencein salinity concentrations between Scenarios 2 and 3 (Figs. 3.90 and 3.98). Whilemuch of the water column for Scenarios 2 and 3 is of nearly uniform salinity fromthe start of lake filling, the absence of overflow discharge to the surface layer inScenario 3 results in an initially fresher surface mixed layer. Salinity eventuallywill increase as deeper water is gradually transported upward into the surface
0
10
20
30
Dep
th (
m)
0
50
100
150
200
250
300
350
Ele
vatio
n (m
)
Year
0 65 130 195 260 325
0 50 100 150 200
Fig. 3.95 Scenario 2: predicted dissolved As concentration from a 200 year PitMod simulation(lg/L)
218 3 Limnology of Pit Lakes
layer. As in Scenario 2, the tailings water at the bottom of the lake will be mixedinto the water column through the introduction of overflow and CP water at depth(Fig. 3.98).
The modeled temperature further illustrates the impact of redirecting surfacewaters to the pit lake bottom during the open water season (Fig. 3.99). All of thetemperature variation will occur in the surface mixed layer through direct contactwith the atmosphere and ice, and in the deepest regions of the lake where overflowand CP waters will be introduced.
50 100 150 200
As
(g/
L)
00
50
100
150
200
250
300
Year
Fig. 3.96 Scenario 2: predicted dissolved As concentration in the surface layer from a 200 yearPitMod simulation
0
1
2
3
4
0 50 100 150 200
0 50 100 150 200
500
600
700
800
900
1000
1100
TD
S (
g/L)
Sul
phat
e (m
g/L)
Year
Fig. 3.97 Scenario 2: predicted dissolved sulphate and total dissolved solids concentrations inthe surface layer from a 200 year PitMod simulation
3.4 Modeling of Pit Lakes 219
Dissolved oxygen will be saturated in the surface mixed layer and at depth butwill vanish in the intermediate water after the lake has aged 10–20 years(Fig. 3.100). The reason for this distribution of dissolved oxygen is the same as inScenario 2; that is, as oxygenated water is introduced at depth and migrates slowly
0
50
100
150
200
250
300
350
Ele
vatio
n (m
)
0 24 48 72 96 120 144 168 192
Year
0 1 2 3 4
0 50 100 150 200
Fig. 3.98 Scenario 3: predicted salinity from a 200 year PitMod simulation (parts per thousand)
0
10
20
30
Dep
th (
m)
0
50
100
150
200
250
300
350
Ele
vatio
n (m
)
Year
0 3 6 9 12 15 18
0 50 100 150 200
Fig. 3.99 Scenario 3: predicted temperature from a 200 year PitMod simulation (8C)
220 3 Limnology of Pit Lakes
upward towards the lake surface, it ages and loses dissolved oxygen even thoughthe oxygen demand in the water column is assumed to be low.
Dissolved Fe in Scenario 3 will behave similarly to Scenario 2, in that the Feconcentration will be very low in the surface and bottom layers due to the presenceof dissolved oxygen and the associated stability of Fe oxyhydroxides. However, asthe redox potential decreases with time in the water introduced at depth, Fe(III)reduction will eventually occur, resulting in the local maximum in dissolved Feconcentration indicated by the red zone in Fig. 3.101. This Fe maximum will beconstrained above by sulfide precipitation combined with dissolved oxygen in thewind-mixed layer, and below by the presence of dissolved oxygen.
Arsenic concentration in Scenario 3 will also resemble Scenario 2 except thatthe As in the surface layer will decrease to a greater extent (Fig. 3.102). This likelywill occur for two reasons: first, the addition of inflow at depth through thedischarge of overflow water to the pit floor will enhance the upward migration andentrainment of clean intermediate water into the surface layer, causing As removalfrom intermediate water through sulfide precipitation. Second, and more impor-tantly, the absence of overflow water, which contains significant concentrations ofAs, in the surface layer will result in cleaner surface layer water. The modeledsurface As concentration will decrease rapidly after the lake over-tops, and within10 years it should drop to a steady-state concentration of approximately 30 lg/L(Fig. 3.103).
0
10
20
30
Dep
th (
m)
0
50
100
150
200
250
300
350
Ele
vatio
n (m
)
Year
0 3 6 9 12 15
0 50 100 150 200
Fig. 3.100 Scenario 3: predicted dissolved oxygen concentration from a 200 year PitModsimulation (mg/L)
3.4 Modeling of Pit Lakes 221
0
50
100
150
200
250
300
350
Ele
vatio
n (m
)
Year
0 4 8 12 16 20
0 50 100 150 200
Fig. 3.101 Scenario 3: predicted dissolved Fe concentration from a 200 year PitMod simulation(lg/L)
0
10
20
30
Dep
th (
m)
0
50
100
150
200
250
300
350
Ele
vatio
n (m
)
Year
0.0 86.4 172.8 259.2 345.6 432.0
0 50 100 150 200
Fig. 3.102 Scenario 3: predicted dissolved As concentration from a 200 year PitMod simulation(lg/L)
222 3 Limnology of Pit Lakes
In Scenario 3, sulfate concentration will progressively increase from a low atyear 42 to a steady-state concentration of approximately 700 mg/L. TDS willremain relatively constant at 1,000 mg/L (Fig. 3.104).
3.4.9 Conclusions
Pit lakes exhibit a variety of physical and geochemical properties covering a broadspectrum of spatial and temporal scales. Obtaining accurate assessments of futureenvironmental and economic impacts from pit lakes requires reliable predictions of
00 48 960 50 100 150 200
Year
100
200
300
400
As
(g/
L)
Fig. 3.103 Scenario 3: predicted dissolved As concentration in the surface layer from a 200 yearPitMod simulation
0
1
2
3
4
TD
S (
g/L)
0 50 100 150 200
50 100 150 200
Sul
phat
e (m
g/L)
0400
600
800
1000
1400
1200
Fig. 3.104 Scenario 3: predicted dissolved sulphate and total dissolved solids concentrations inthe surface layer from a 200 year PitMod simulation
3.4 Modeling of Pit Lakes 223
pit lake water quality. Computer models are an indispensable tool for predictingthe spatial distribution and evolution of pit lake properties. However, the gaps inour understanding of many of the important physical and geochemical processesobserved in pit lakes ensure that models will always be limited in their ability tomimic nature.
DYRESM and PitMod are examples of models that determine pit lake prop-erties by solving systems of mathematical equations, including mass and energybalances. In addition, PitMod includes surface ice formation and the capabilitiesprovided by the PHREEQC equilibrium chemistry model to predict geochemicalproperties.
For any pit lake model, the accuracy of its predictions depends strongly on thequality of corresponding input data. More often than not, there are large gaps anddeficiencies in data sets used to run model simulations, necessitating the use ofproxy data, interpolation, or estimation.
With increases in the speed and capacity of computers showing no sign ofabating, and with our increasing understanding of the physical and geochemicalprocesses that determine pit lake properties, it appears certain that the performanceof models will continue to improve and their predictions will become increasinglyreliable.