20
Chapter 3 Material and Methods

Chapter 3
Material and Methods

aSi EPID Panel damage
3 Material and Methods
3.1 Amorphous Silicon flat panel
The Electronic Portal Imaging Device (EPID) used on this investigation
iViewGT , based on the amorphous silicon type detector panel XRD1640 AL5 and (PerkinElmer
Optoelectronics, Fremont, CA, USA). It has a fixed source
radiation sensitive layer has a size of 41 x 41 cm
a sampling aperture (pixel size) of 0.4 x 0.4 mm
These imagers are indirect
doped gadolinium oxysulphide (Gd
photons; a copper plate of 1 mm
and absorbs scattered radiation
array of coupled amorphous silicon photodi
Figure 3.1 Linear accelerator machine coupled with iViewGT aextended treatment position b), with and without the top cover (touch guard), respectively.
a)
Gantry head
EPID
Figure 3.2 Schematic illustrations of the elements of iViewGT s(a) and the scintillating phosphor acts an xdetected by the active matrix array (c) made by a
Material and Methods
Amorphous Silicon flat panel-type detector imager - Elekta iViewGT
The Electronic Portal Imaging Device (EPID) used on this investigation
, based on the amorphous silicon type detector panel XRD1640 AL5 and (PerkinElmer
Optoelectronics, Fremont, CA, USA). It has a fixed source-detector distance o
radiation sensitive layer has a size of 41 x 41 cm2 and consists of 1024 x 1024 detector elements with
a sampling aperture (pixel size) of 0.4 x 0.4 mm2 (Figure 3.1).
These imagers are indirect detectors; a phosphorous scintillation screen
doped gadolinium oxysulphide (Gd2O2S:Tb) is used to convert incident radiation to optical
copper plate of 1 mm thickness placed on top of the scintillation layer
to enhance image quality. The optical photons are detected by an
array of coupled amorphous silicon photodiodes and thin film transistors (TFTs) (Figure 3.2)
celerator machine coupled with iViewGT a-Si EPID in the retracted a) and extended treatment position b), with and without the top cover (touch guard), respectively.
b)
EPID
Schematic illustrations of the elements of iViewGT s-Si EPID. The copper metal plate (a) and the scintillating phosphor acts an x-ray converter layer, which results in optical photons detected by the active matrix array (c) made by a-Si photodiodes and TFTs.
(b)
a)
b)
c)
Chapter 3
28
Elekta iViewGT
The Electronic Portal Imaging Device (EPID) used on this investigation is of type Elekta
, based on the amorphous silicon type detector panel XRD1640 AL5 and (PerkinElmer
detector distance of 160 cm. The
and consists of 1024 x 1024 detector elements with
phosphorous scintillation screen made of terbium
is used to convert incident radiation to optical
placed on top of the scintillation layer provide build-up
The optical photons are detected by an
(Figure 3.2).
EPID in the retracted a) and extended treatment position b), with and without the top cover (touch guard), respectively.
Si EPID. The copper metal plate ray converter layer, which results in optical photons

aSi EPID Panel damage Chapter 3
29
Measurements were made using four of these detectors (based on the same design)
mounted on three linear accelerators (LINACs) applying 6 MV photon beams energy. calibrated in
isocentric reference conditions: for a field size of 10 x 10 cm2, 1 monitor unit (MU) corresponds to a
dose of 1 cGy on the central beam axis at the maximum dose depth (Dmax 6 MV = 1.5 cm).
As the present work focuses in the degradation of the image quality during a time period,
we used detectors with different clinical use (EPID age since the first irradiation), which were
tested for several months (table 3-I).
EPID Clinical Use (months)
Operational Age Research period Clinical Life
A Linac2
33 5 38 (replacement)
B Linac5
5 11 -
C Linac2
24 6 -
D Linac3
1 5 -
After the end of the clinical panel life (EPID A), EPID C (from Linac 3) was mounted in
Linac 2. At this point a new detector, EPID D, started being used for clinical applications in Linac 3,
due to a new hardware specification unsupported by Linac 2. EPID B remained installed at Linac 5
all research period.
3.1.1 Image acquisition and calibration
For all image acquisitions, Heimann imaging software (HIS) (PerkinElmer) was used to
control incoming signal data. The software is capable to demonstrate the functions of the RID
(Radiation Image Detector). It detects automatically the size of the sensor and receives images of
the detector in a 16 bit digitized data format (65535 steps). The images are displayed on the screen
with 8 bit resolution.
The detector is connected to the iViewGT computer, which provides synchronization
between the EPID and the Linac. The detector triggering, is controlled by the Detector Control
Board (DCB) which uses the gun pulse control board to synchronize the reading of data from the
detector, so that image data is read between radiation pulses. When the detector is triggered, a
single image data packet is sent directly from the detector panel to the frame grabber in the PC,
where appropriate software packages for signal processing, automatically apply a set of corrections
to all images, including offset, gain and bad pixel corrections.
Table 3-I Representation of EPIDs clinical use, research period and lifetime (end-of-life).

aSi EPID Panel damage Chapter 3
30
The Offset correction image (dark field - DF) is used to take out the specific dark current of
the detector (leakage current) or other fixed signals. The Offset image is created and stored when
the detector is not exposed to the radiation, and is then used to correct all subsequent images.
Sensitivity variations from pixel to pixel are taken into account by the Gain correction
image (flood field - FF). The value of each pixel in the offset corrected image is divided by the
corresponding pixel value of the normalized Gain to correct also the image dose calibration under
different energy conditions. The processed and corrected image I(I,j) is performed by the
application of equation 1, where a raw image (Iraw(i,j)) is acquired by the EPID and subtracted by
the dark field image (DF(i,j)), divided by the normalized Flood Field image (FF(i,j)). FFmean is the
mean value of the FF(i,j), used for image display.
���, �� � ���� ,������ ,����� ,�� � ������
The bad pixel map correction allows the ‘software repair’ of defected or non-responding
pixels to enhance image quality. It is used to identify pixels that the response cannot correct for
using gain or offset. The corresponding pixel values are set to the mean value of the neighbouring
pixels. Before starting the acquisitions, the HIS software should be prepared for radiation tests, see
appendix A. The corrections above described are linked to the imaging system software and
applied to all images in daily tests acquisitions (Figure 3.3).
a) b) c)
d) e)
Figure 3.3 iViewGT portal image correction images Dark Field image (DF(i,j)) (a), Flood Field image (FF(i,j)) (b), and the bad pixel map (c). The processed image (I(i,j)) (e) is the result of raw image (Iraw(i,j)) (d) corrected and normalized image by using the equation 3.1.
(3.1)
aSi EPID Panel damage Chapter 3
31
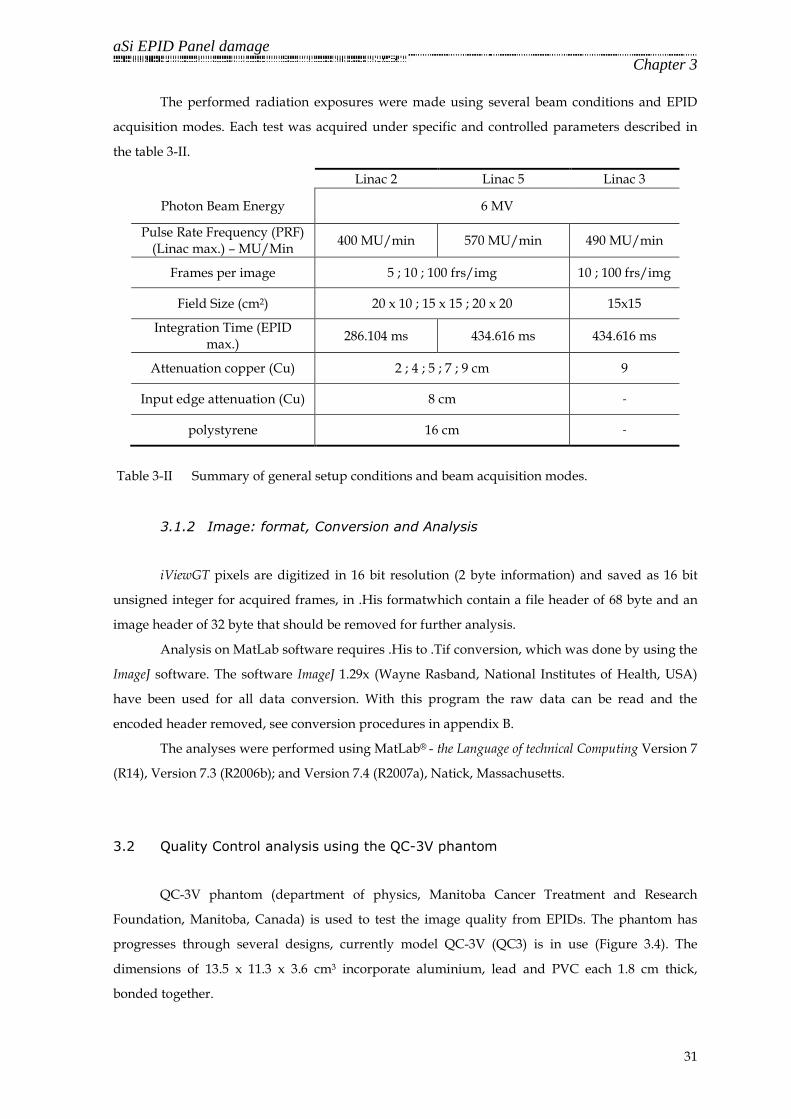
The performed radiation exposures were made using several beam conditions and EPID
acquisition modes. Each test was acquired under specific and controlled parameters described in
the table 3-II.
Linac 2 Linac 5 Linac 3
Photon Beam Energy 6 MV
Pulse Rate Frequency (PRF) (Linac max.) – MU/Min
400 MU/min 570 MU/min 490 MU/min
Frames per image 5 ; 10 ; 100 frs/img 10 ; 100 frs/img
Field Size (cm2) 20 x 10 ; 15 x 15 ; 20 x 20 15x15
Integration Time (EPID max.)
286.104 ms 434.616 ms 434.616 ms
Attenuation copper (Cu) 2 ; 4 ; 5 ; 7 ; 9 cm 9
Input edge attenuation (Cu) 8 cm -
polystyrene 16 cm -
3.1.2 Image: Format, Conversion and Analysis
3.1.2 Image: format, Conversion and Analysis
iViewGT pixels are digitized in 16 bit resolution (2 byte information) and saved as 16 bit
unsigned integer for acquired frames, in .His formatwhich contain a file header of 68 byte and an
image header of 32 byte that should be removed for further analysis.
Analysis on MatLab software requires .His to .Tif conversion, which was done by using the
ImageJ software. The software ImageJ 1.29x (Wayne Rasband, National Institutes of Health, USA)
have been used for all data conversion. With this program the raw data can be read and the
encoded header removed, see conversion procedures in appendix B.
The analyses were performed using MatLab® - the Language of technical Computing Version 7
(R14), Version 7.3 (R2006b); and Version 7.4 (R2007a), Natick, Massachusetts.
3.2 Quality Control analysis using the QC-3V phantom
QC-3V phantom (department of physics, Manitoba Cancer Treatment and Research
Foundation, Manitoba, Canada) is used to test the image quality from EPIDs. The phantom has
progresses through several designs, currently model QC-3V (QC3) is in use (Figure 3.4). The
dimensions of 13.5 x 11.3 x 3.6 cm3 incorporate aluminium, lead and PVC each 1.8 cm thick,
bonded together.
Table 3-II Summary of general setup conditions and beam acquisition modes.

aSi EPID Panel damage Chapter 3
32
EPID analysis was performed to access the system spatial resolution, by differences on
relative modulation transfer function (RMTF) from different spatial frequencies of 1 to 5 regions of
interest (ROIs), organized as shown in table 3-III. Different resolution line pair gauge bars,
generates a square wave modulation transfer function (SWMTF), which is a simple and fast way to
measure the RMTF, according the Rajapakshe et al (1996) [95] algorithms (equation 3.2),
������� � ���������
where the M(f )is the amplitude modulation response at a spatial resolution bar patterns (ROIs 1 to
4) and M(f1) is the output modulation for the lowest frequency.
Based on Rajapakshe, the contrast-to-noise ratio is determined by the difference of the
average gray values of the brightest (ROIbright – ROI 6) and darkest (ROIdark – ROI 11) homogeneous
ROIs, divided by the average of pixel value standard deviations from the 6 uniform regions (ROIs
6-11) (equation 3.3),
� � � ROI$% &'( ) ROI*�%+,
By using the QC3 standard measurements, physical parameters above described, are only
restricted to 25 x 25 pixels ROI’s in the central region of EPID.
1 Pixel = 0.04 x 0.04 cm2 => ROIs = 1.0 x 1.0 cm2
As the QC3 phantom analysis is intended to be used in central beam axis (CAXIS),
different tests were carried out to provide global information of system performance, by testing
different EPID areas in terms of spatial resolution by RMTF, CNR and system noise.
ROIs Bar resolution (lp/(mm) Bar Thicknesses
1 0,76 15 mm Lead + PVC
2 0,43 15 mm Lead + PVC
3 0,23 15 mm Lead + PVC
4 0,20 15 mm Lead + PVC
5 0,1 15 mm Lead + PVC
6 homogeneous 15 mm PVC
7 homogeneous 15 mm Aluminium
8 homogeneous 5 mm Lead
9 homogeneous 7,5 mm Lead
10 homogeneous 7,5 mm Lead
11 homogeneous 15 mm Lead
Table 3-III QC-3V Regions of Interest: (ROIs) Figure 3.4 QC-3V Phantom
(3.2)
(3.3)
1 2 3 4 5
6
7
8
11 10
9
aSi EPID Panel damage Chapter 3
33
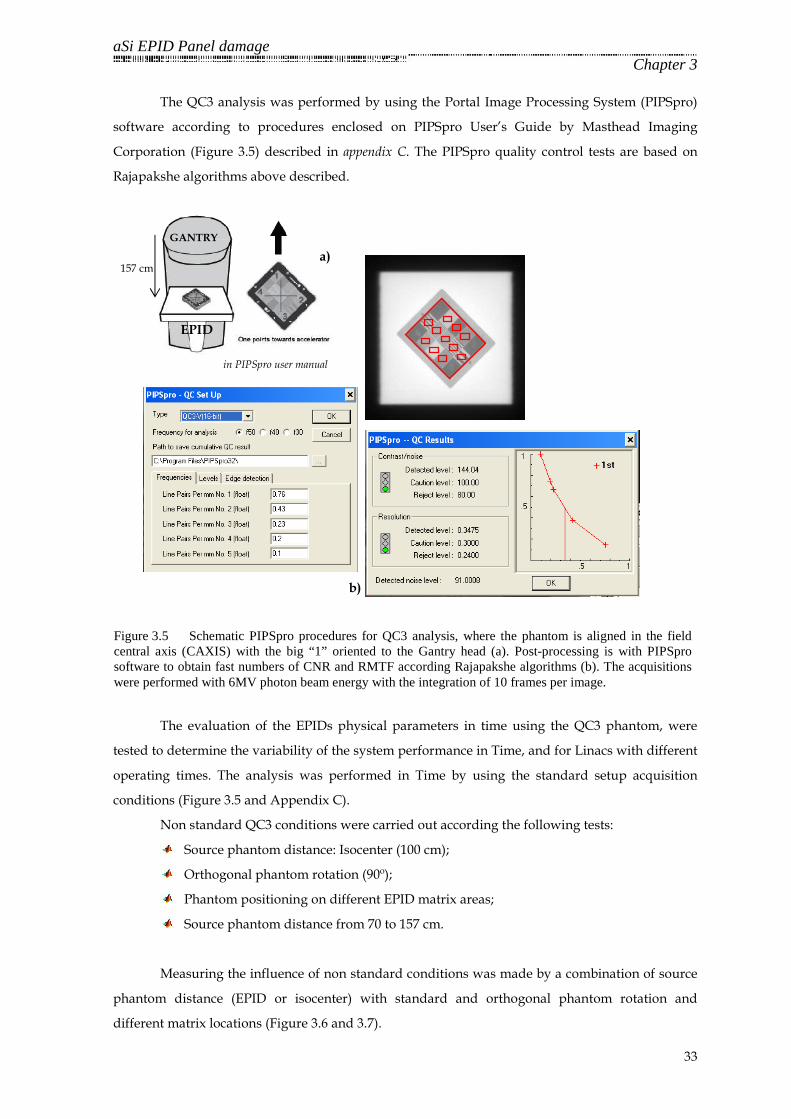
The QC3 analysis was performed by using the Portal Image Processing System (PIPSpro)
software according to procedures enclosed on PIPSpro User’s Guide by Masthead Imaging
Corporation (Figure 3.5) described in appendix C. The PIPSpro quality control tests are based on
Rajapakshe algorithms above described.
The evaluation of the EPIDs physical parameters in time using the QC3 phantom, were
tested to determine the variability of the system performance in Time, and for Linacs with different
operating times. The analysis was performed in Time by using the standard setup acquisition
conditions (Figure 3.5 and Appendix C).
Non standard QC3 conditions were carried out according the following tests:
Source phantom distance: Isocenter (100 cm);
Orthogonal phantom rotation (90º);
Phantom positioning on different EPID matrix areas;
Source phantom distance from 70 to 157 cm.
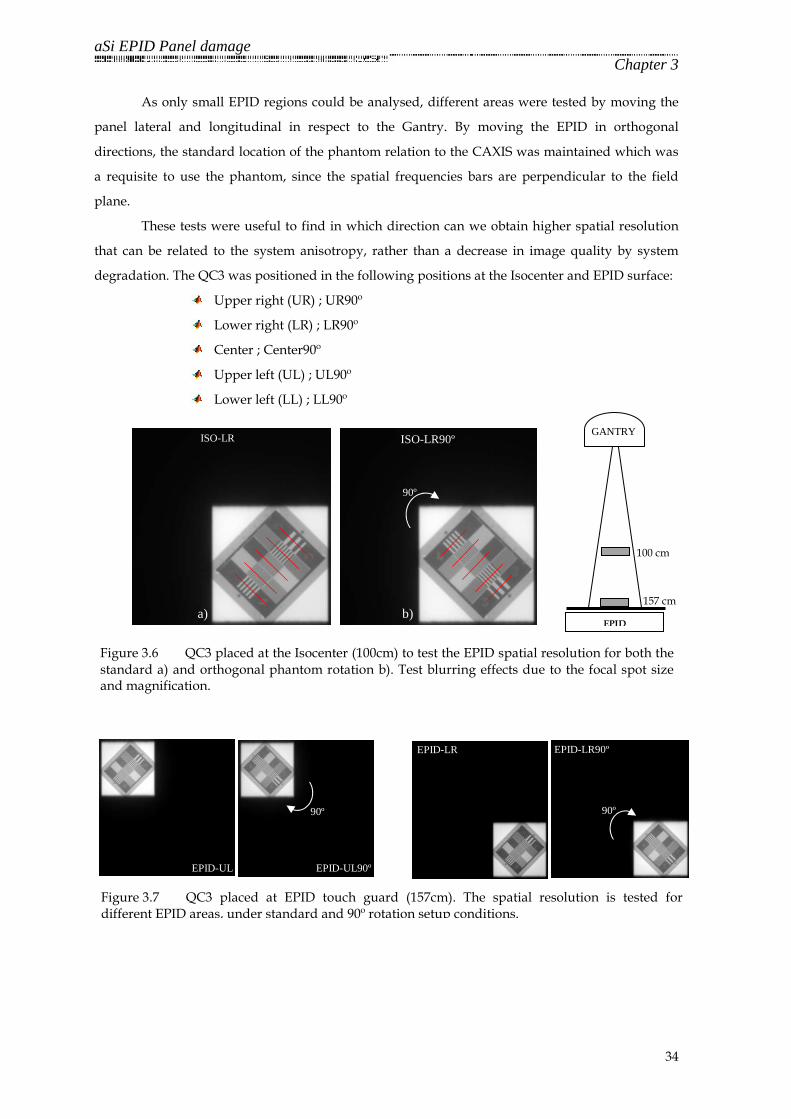
Measuring the influence of non standard conditions was made by a combination of source
phantom distance (EPID or isocenter) with standard and orthogonal phantom rotation and
different matrix locations (Figure 3.6 and 3.7).
Figure 3.5 Schematic PIPSpro procedures for QC3 analysis, where the phantom is aligned in the field central axis (CAXIS) with the big “1” oriented to the Gantry head (a). Post-processing is with PIPSpro software to obtain fast numbers of CNR and RMTF according Rajapakshe algorithms (b). The acquisitions were performed with 6MV photon beam energy with the integration of 10 frames per image.
a)
b)
in PIPSpro user manual
EPID
GANTRY
157 cm
aSi EPID Panel damage Chapter 3
34
As only small EPID regions could be analysed, different areas were tested by moving the
panel lateral and longitudinal in respect to the Gantry. By moving the EPID in orthogonal
directions, the standard location of the phantom relation to the CAXIS was maintained which was
a requisite to use the phantom, since the spatial frequencies bars are perpendicular to the field
plane.
These tests were useful to find in which direction can we obtain higher spatial resolution
that can be related to the system anisotropy, rather than a decrease in image quality by system
degradation. The QC3 was positioned in the following positions at the Isocenter and EPID surface:
Upper right (UR) ; UR90º
Lower right (LR) ; LR90º
Center ; Center90º
Upper left (UL) ; UL90º
Lower left (LL) ; LL90º
Figure 3.7 QC3 placed at EPID touch guard (157cm). The spatial resolution is tested for different EPID areas, under standard and 90º rotation setup conditions.
90º
90º 90º
Figure 3.6 QC3 placed at the Isocenter (100cm) to test the EPID spatial resolution for both the standard a) and orthogonal phantom rotation b). Test blurring effects due to the focal spot size and magnification.
ISO-LR ISO-LR90º
EPID-UL EPID-UL90º
EPID-LR EPID-LR90º
a) b) EPID
100 cm
GANTRY
157 cm

aSi EPID Panel damage Chapter 3
35
EPID and Isocenter Source Phantom Distances (SPD) intent to measure the influence of the
magnification and focal spot size on the spatial resolution, contrast and noise. For this purpose
were also tested different SPDs, ranged from 70 cm to 157 cm, 20 by 20 cm, including the SPD of
100 cm (figure 3.8).
3.3 Spatial resolution by using an Edge Response technique
The edge response is how the system responds to a sharp straight discontinuity (an edge).
The response of the EPID to an input sharp edge could be measured by calculating the distance
required to rise from 10% to 90% intensity level across the edge. Edges in images can be easily
generated by a discontinuity, based on field attenuation across the beam central axis (CAXIS)
(figure 3.10a).
The iViewGT a-Si array is read out using 16 amplifiers chips, eight for each half of the
imager. In this way, 16 image segments can be defined, each with an individual pixel response
(figure 3.9).
For practical research reasons, we have called these segments “subpanels”. Each subpanel
consists of an array of 128 x 512 pixels (51,2 x 204,8 mm) and they can be individualized from the
global matrix as shown in Table 3-IV.
90 cm
110 cm
130 cm
150 cm
EPID
100 cm
157 cm
70 cm
GANTRY
Figure 3.8 QC-3V positioned at different source distances at 70 cm, 100 cm and 157 cm. Dashed red lines represents the SPDs for the remain acquisitions (90, 110, 130 and 150 cm).
b)

aSi EPID Panel damage Chapter 3
36
The edge response for different EPID subpanels, were obtained in two orthogonal edge
orientations (x, y). This way the whole system could be characterized in terms of spatial resolution
in the spatial domain.
For this analysis were built analysis tools, to measure the edge response of 3 horizontal and
7 vertical edges. For each Horizontal edge it was possible to analyse half of detector subpanels. By
moving the EPID laterally (related to the gantry), it is possible to cover the entire subpanel matrix
(16 subpanels) Horizontal red lines in the figure 3.9.
As the subpanels are aligned 2–by–2 in the vertical direction, the maximum coverage of
subpanels for each vertical edge are only two. As the EPID arm support cannot move completely
out in relation to the CAXIS, the maximum achievable edges were 7 (3 right side + CAXIS + 3 left
side) which means that only 12 of 16 subpanels could be evaluated in (x) direction (2-7 and 10-15).
Different edges were generated by using large copper slabs that cover an approximate
35cm of the 41cm length of entire panel, in which were it was possible to investigate the edge
response of ~85% of the full matrix area.
Upper EPID subpanels
1. (1:512 , 1:128)
2. (1:512 , 129:256)
3. (1:512 , 257:384)
4. (1:512 , 385:512)
5. (1:512 , 513:640)
6. (1:512 , 641:768)
7. (1:512 , 769:896)
8. (1:512 , 897:1024)
Lower EPID subpanels
9. (513:1024 , 1:128)
10. (513:1024 , 129:256)
11. (513:1024 , 257:384)
12. (513:1024 , 385:512)
13. (513:1024 , 513:640)
14. (513:1024 , 641:768)
15. (513:1024 , 769:896)
16. (513:1024 , 897:1024)
Table 3-IV Subpanels in the 1024 x 1024 matrix

aSi EPID Panel damage Chapter 3
37
To perform the Edge response analysis in larger EPID areas, the following materials and
settings were introduced:
23 x 10 x 8 cm3 copper slab aligned to field CAXIS (4 copper slabs aligned at the
isocenter each of 23 x 10 x 2 cm3), see Figure 3.10a and 3.10b):
o 8 cm Cu thickness – reduce the influence of random noise
o CAXIS alignment – follow the field divergence
o Source table distance (STD) = 100cm
Field size: 20 x 10 (edge mid-length of width)
1D Analysis: horizontal and vertical edges by applying a 90o rotation generate
orthogonal edges for each subpanel.
Moving EPID in (x,y) directions – measurement in different subpanels (Figure 3.10c)
Frames per image: 10 and 100frs/img
(y)
(x)
Figure 3.9 EPID matrix (1024x1024), showing the individual subpanels ranged from 1 to 16 (8+8). The red lines represent the 3 horizontal and 7 vertical edges used for one-dimensional edge response analysis. Lateral and longitudinal EPID movements are done in respect to the Gantry head
1 2 3 4 5 6 7 8
9 10 11 12 13 14 15 16
CAXIS j (1024) j (0)
i (0)
i (1024)
(x)
Longitudinal movement
La
tera
l m
ov
emen
t
GA
NT
RY

aSi EPID Panel damage Chapter 3
38
3.3.1 MatLab® Edge response analysis
The measurements of the step function were performed by applying different algorithms,
each one for distinct edge positions related to the EPID matrix.
MatLab routines for Edge selection and verification (see Appendix A.I):
“Subpanel selection”
“Vertical Edge”
“Horizontal Edge”
By selecting a predefined edge image, the algorithms above mentioned, allows a
discrimination of the edge surface to be analysed. When selected a specific perpendicular line to
the edge spread function (ESF), the software generates the automatic normalization, to transform
the pixel min-to-max intensities, into 0-to-1 values. The analysis was then performed based on the
spatial difference from 10% to 90% of the normalized Edge Spread Function.
The measurements were done for all acquired edges as following described (Figure 3.9c):
7 Vertical edges - 10-by-10 mm (perpendicular analysis along the edge);
3 Horizontal edges - 5-by-5 mm (perpendicular analysis along the edge).
Figure 3.10 Setup positioning of 8 cm copper edge a) built with four copper slabs (23 x 10 x 2 cm3) aligned at CAXIS (b) and the respective measured markers for edges (horizontal and vertical) localization at the EPID surface (c).
a)
b)
c)

aSi EPID Panel damage Chapter 3
39
Input horizontal edges intent to measure vertical edge responses (y direction), and in an
opposite way, vertical edges are used for horizontal edge response measurements (x direction), see
Figure 3.11
The Edge response was extracted by using the following MatLab algorithm (see Appendix D.I):
“Slope” analysis (10% to 90% response)
By applying this function the software detects the edge slope in terms of percentage of
variation and automatically finds the index sample numbers surrounding the 10% and the 90%
from the ESF. This function calculates the exact distance between two interpolated indexed
positions. The subtraction of the two spatial positions, allows the edge discrimination in terms of
pixel index number position. By knowing the pixel size (0.4 mm) and magnification at the isocenter
distance (1.6) the edge response can be converted in distance (mm) (Figure 3.12).
Edge-H CAXIS
Ed
ge-
V C
AX
IS
Edge-H Upper
Edge-H Lower
Ed
ge-
V 1
Ed
ge-
V 2
Ed
ge-
V 3
Ed
ge-
V 4
Ed
ge-
V 5
Ed
ge-
V 6
Figure 3.11 Vertical and Horizontal edges for
edge response evaluation.
Figure 3.12 The system output response to the input physical edge (8 cm copper) represents the Edge Spread Function, where the Edge Response is the spatial distance (index pixel) from the index 90% to index 10% of respective percentage response.
%
index pixel EDGE RESPONSE
i90% i10%

aSi EPID Panel damage Chapter 3
40
3.4 System Noise by using a Subpanel Image Noise technique
The noise characteristics into x-ray imaging system process means that the system is no
longer deterministic and that its performance must be analysed using statistical methods. The
simplest measure of output noise is given by the standard deviation of the intensity over the image
of a uniform field, with or without a homogeneous attenuator.
When measuring the SNR the standard deviation represents noise and other interferences.
In these cases, the standard deviation is not important by itself, but only in comparison to the mean
pixel values, which rise to the term: signal-to-noise-ratio (SNR), measured in a simple way by the
mean value of means of each line of each subpanel, divided by the mean of the standard deviations
for the same subpanel (digital signal processing). The combination of all subpanels SINs by the
SNR calculation can give a measure of random and structural noise (fixed noise pattern) for all
tested area.
Different attenuation levels and averaged image frames were applied to set the optimal
conditions for a precise measurement of the damage in the subpanels, by reducing the quantum
noise influence. The influence of a different source attenuator distances was also tested, i.e. shadow
tray and table (isocenter).
As the random noise present in the images varies with different beam and imaging system setups,
statistical fluctuation in the number of x-rays quanta absorbed will always be unpredictable but not
significant for a reduction in the image quality. A reduction in image quality is always
accompanied by a structural noise (fixed pattern) mixed by a random noise.
As the noise in the images becomes more visible in time due to defected and less
responding pixels (isolated, in-line or clustered), the measurements of these parameters can
demonstrate the system intra-variability.
To perform the subpanel image noise analysis, the following materials and settings were
introduced:
Field size:
o 15 x 15 (isocenter – 100 cm) = 24 x 24 (EPID 160 cm) = 600 x 600 (pixels)
o 20 x 20 (isocenter) = 32 x 32 (EPID) = 800 x 800 (pixels)
Frames per image: 5, 10 and 100 frs/img
Copper attenuation – 15 x 15 (Figure 3.12a)
o 5 and 9 cm (shadow tray – Source Tray Distance = 67 cm)
Copper attenuation – 20 x 20 (Figure 3.12b)
o 4 cm (shadow tray and isocenter distance)
� (2x) - 2 copper slabs (23 x 10 x 2 cm3) on top of each other.
Polystyrene – 20 x 20 (Figure 3.12c)
o 16 cm (isocenter at half-thickness (92 cm))

aSi EPID Panel damage Chapter 3
41
3.4.1 MatLab® SIN analysis
The measurements of Subpanels Image Noise were performed by applying different
algorithms that can generate automatic numbers of means and standard deviation for each
subpanel.
MatLab routines for Subpanels array selection and analysis (see Appendix D.II):
“Analysis SIN 15 x 15”
“Analysis SIN 20 x 20”
“Function_std_mean”
These algorithms provide a fast and accurate selection of each subpanel within the 1024 x
1024 matrix. By inputting an image, the program decomposes the 2D matrix into 16 subpanels
which are introduced in a 3D matrix as multidimensional array of 512 by 128 by 16 (figure 3.13).
The Selection of the field size to be analysed depends on the field coverage attenuated area,
due to the (x,y) dimensions of the attenuator material. A field size of 15x15 and 20x20 at the
isocenter, corresponds to a 24x24cm2 (600x600 pixels) and 32x32cm2 (800x800 pixels) at the EPID
surface, respectively.
In practice, the area for analysis should take into account the radiation penumbra from the
beam edges which could influence the statistical measurements for each subpanel. From processed
images were taken out ~ 1.5cm (0.75cm for each field edge), which corresponds to an analysis of
~23.3 x 23.3 cm2 and ~31.3 x 31.3 cm2. This approach was useful for more accurate analyses without
the influence of different image gradients (at the field borders) (Figure 3.14).
As a multidimensional matrix is composed, the system can read each row or column of
each subpanel at the same time. The purpose of this test is to analyse the noise present on each
subpanel in the readout direction (x). Therefore it is possible to evaluate 8192 (16subpanels x 512
rows) means and standard deviation for all subpanels at the same time.
Figure 3.13 Setup of 9 cm of copper at shadow tray (67cm) (a), 4 cm Cu at the isocenter position (100 cm) (b) and 16cm of polystyrene at the isocenter (SPD=92 cm)(c).
a) b) c)

aSi EPID Panel damage Chapter 3
42
Sub 1
Sub 16
Sub 1
Sub 16
Sub 8
Sub 9
Sub 8
Sub 9
For each subpanel in analysis within a specified field size (above described) were
calculated row-by-row (x -direction), the mean and the standard deviation. The results were then
evaluated in a global way by taking the mean of means (µ) and the mean of standard deviations
(ρ). The Subpanel Image Noise by the SNR was calculated for each subpanel by equation 3.4:
SIN/01 � 23
Figure 3.14 Intensity colour map (RGB) from an EPID detector matrix irradiated by a 20x20 field a), where the white arrows are the (x) direction of the read-out data from the electronics. The decomposed matrix (1014x1024) b), define each EPID subpanel that compose a multidimensional array (512x128x16) for analysis c).
Sub 1 Sub 8
Sub 16 Sub 9
a)
b)
c)
(3.4)

aSi EPID Panel damage
3.5 System sensitivity
EPID Pixel response to high radiation beams used in radiotherapy is always influenced by
different kind of variables, like Linac output, intrinsic detector/electronics characteristics
signal A/D conversion. External variables as different
always an important role on the input to output transfer
different beam parameters and
detect the matrix Non Average P
frame/dose per image, see section 3.5.1.
The material and methods used for this test are the same of previously described in the
section 3.4. The analysis consists in the
beams and different number of frames per image. A pair of images (open and attenuated fields)
acquired with the same frames are then processed using homebuilt MatLab
automatically generate numbers and graphs of variability of pixel response.
3.5.1 MatLab NAPs analysis
The NAPs were performed in a time trend evaluation for checking the influence of the
ageing effects on the pixel response in the presence of
image.
Developed MatLab® routines
“badPixelcounter”
“correctForFlatteningFilter”
Figure 3.15 Schematic representation of an attenuated approximated matrix area of 24x24cmdisplayed in the imaging system as shown in b).
a)
by Non Average Pixel response
EPID Pixel response to high radiation beams used in radiotherapy is always influenced by
different kind of variables, like Linac output, intrinsic detector/electronics characteristics
xternal variables as different objects densities and thicknesses have
always an important role on the input to output transfer (figure 3.15). As the system respon
different beam parameters and imaging system setup conditions, this experiment
the matrix Non Average Pixel (NAP) response for different attenuation
frame/dose per image, see section 3.5.1.
The material and methods used for this test are the same of previously described in the
section 3.4. The analysis consists in the acquisition of open and attenuated fields with 6 MV photon
beams and different number of frames per image. A pair of images (open and attenuated fields)
acquired with the same frames are then processed using homebuilt MatLab® algorithms, which can
cally generate numbers and graphs of variability of pixel response.
MatLab NAPs analysis
The NAPs were performed in a time trend evaluation for checking the influence of the
ageing effects on the pixel response in the presence of different attenuation levels and frames per
routines for NAPs detection and analysis (see Appendix D
“badPixelcounter”
“correctForFlatteningFilter”
representation of an attenuated field 15x15cm2 a), which irradiates an area of 24x24cm2 at 160cm from the focus. The image frame integration is
displayed in the imaging system as shown in b).
b)
Chapter 3
43
EPID Pixel response to high radiation beams used in radiotherapy is always influenced by
different kind of variables, like Linac output, intrinsic detector/electronics characteristics and
ties and thicknesses have
. As the system responds to
maging system setup conditions, this experiment should be able to
attenuation levels and
The material and methods used for this test are the same of previously described in the
acquisition of open and attenuated fields with 6 MV photon
beams and different number of frames per image. A pair of images (open and attenuated fields)
algorithms, which can
The NAPs were performed in a time trend evaluation for checking the influence of the
levels and frames per
(see Appendix D.III):
a), which irradiates an from the focus. The image frame integration is

aSi EPID Panel damage Chapter 3
44
“createSubMatrix”
“angleCorr”
“imageReading”
The combination of the mentioned routines allows the creation of a sub matrix set, due to
the size of processed attenuated fields, which can be matched pixel-by-pixel with open fields. The
ratio between the open (I0) and attenuated fields (Iatt.) is firstly corrected for beam angle divergence
(IdCorr) in the attenuation material as also for the flattening filter and gain effects (polynomial fit for
each matrix line) (Figure 3.16).
e.g. Polyfit IdCorr (i)
Figure 3.16 Image correction procedures for the non average pixel response analysis. The
image (I(-log)) represent the µx (linear attenuation coefficient x distance) relationship between
open field (I0) and the attenuated fields (Iatt.). the angle correction image (IdCorr) correct for the small differences on the path length throughout the copper slab attenuator. The best resultant polynomial fit from each IdCorr raw (ii) is then divided pixel-by-pixel to correct the circular flattening filter effect.
I0 Iatt.
./ =
I(-log)
I (-log)
./
dCorr
=
I
I dCorr
I Flat NAPs Pixels > 2.5SD limits
Figure 3.17 Non Average Pixel calculation by setting 2.5 standard deviation limits. The pixels intensities on the image corrected for the flattening filter effect (IFlat) are quantified and selected according statistical limits by the standard deviation. Only clustered (>2) pixels quantified in a 5 x 5 matrix outside the limits can be assumed and counted as NAPs.
./ii
-Log

aSi EPID Panel damage Chapter 3
45
The NAPs identification is made by statistical variation around the polynomial fit, which
represents an optimal approximation of the average pixels. The NAPs are the result of statistical
differences of pixels intensities around the mean, measured by presetting a superior and inferior
statistical limit based on standard deviation from the pixel sample matrix. Only the clustered NAPs
were counted (> 2 pixels in a 5 x 5 pixel matrix) and inserted in their spatial matrix relative position
for graphical display (Figure 3.17).
When using a 4 cm copper slabs for 20x20 cm2 analysis, done by two copper slabs placed
together face to face, it is necessary to correct for the mid-line artefact by replacing intensity pixels
in this region, for the matrix mean pixel value normalized to “1”.
3.6 Subjective Clinical Evaluation
Clinical portal images (PI) for treatment setup localization and verification, is nowadays a
request for the quality assurance of a Radiotherapy treatment delivery. Routine checks of planned
fields and isocenter localization must be done prior the treatment and during the treatment.
According the institution protocols PI should be taken in the first treatment fractions, weekly and
when isocenter position or field setup change. Errors or uncertainties in set-up positioning during
the treatment should be detected by using the verification obtained by EPIDs.
As image registration, reporting and documentation become an issue for treatment quality
assurance, EPIDs take an important role in all clinical situations, which confer more reliable, fast
and accurate treatment field setup verification by a human decision maker.
The quality of clinical portal images may influence the prescribed dose to predefined
planning target volumes and organs at risk, thus it may be of great importance for treatment
outcomes.
The EPID damage and consequent image quality occurs with ageing by the radiation
history (absorbed dose in the lifetime).
Quantification of image degradation by measuring EPIDs physical parameters should be
correlated with clinical examination of portal images that can result in a prediction of the EPID
damage in time, by knowing which numbers, rates, ratios, etc. are related to an increase on
negative subjective evaluation (clinical examination of portal images).
Image degradation in time, can be subjectively evaluated by the clinical users. As portal
image artefacts become more visible in certain regions, the variability of clinical usability varies
from observer to observer, which means that this evaluation is dependent on individual
subjectivity.
The quantification of subjective evaluation of clinical portal images has been performed by
the EPID users committee (five radiotherapy technologists) (table 3-V) using a structured
questionnaire. The aim of this questionnaire is to access the expertise of clinical portal imaging

aSi EPID Panel damage
users by using a Likert scale that
for the less and more clear images respectively
The variations rated from 1 to 5, intent to measure different degrees of perception of
radiographic image quality. For practical samples
and the ability for recognize and delineate anatomical stru
(Questions 1.1, 1.2 and 1.5). Since they are meant to be related to each other a
size results in an increased power
The questions related to
artefacts detection in the images (Q.1.4) were analysed individually.
during the research period (about 11months) for
the pelvis and thorax anatomical locations
plus 2 (AP and lateral views) for a
individual user’s which means that 450 observations
Anterior and lateral images were taken for the same
influence of inter patient variability
Anterior/Lateral fields
1.1. The bony structures can
1.2. The bony structures edge can be easily delineated
1.3. The markers can be easily identified and matched
1.4. Artefacts/noise are masking the bony structures intensity
1.5. The overall image quality is enough for a precise
Figure 3.18 Portal images for (a) anteroAP (c) and lateral (d) fields.
a)
b)
Table 3-V Clinical test for subjective portal image
that range between “1“ (strongly disagree) and “5” (strongly agree),
for the less and more clear images respectively (see Appendix E-I and E-II).
The variations rated from 1 to 5, intent to measure different degrees of perception of
radiographic image quality. For practical samples evaluation, the score from overall image quality
and the ability for recognize and delineate anatomical structures were summed for analysis
ince they are meant to be related to each other an increase in sample
power.
The questions related to detectability of fiducial markers inside the body (Q.1.3) and
images (Q.1.4) were analysed individually. The questionnaire was applied
during the research period (about 11months) for the four tested EPIDs (A, B, C and D) and for both
the pelvis and thorax anatomical locations, which represents a 45 treatment isocenter localizations
plus 2 (AP and lateral views) for a clinical examination. Therefore, 90 images were analysed by 5
ser’s which means that 450 observations were performed during this
Anterior and lateral images were taken for the same patients in different EPIDs to reduce the
patient variability (figure 3.18).
Anterior/Lateral fields
1.1. The bony structures can be easily recognized
1.2. The bony structures edge can be easily delineated
1.3. The markers can be easily identified and matched
1.4. Artefacts/noise are masking the bony structures intensity
1.5. The overall image quality is enough for a precise verification
Portal images for (a) antero-posterior (AP) and (b) lateral pelvic fields, and thorax
c)
d)
est for subjective portal image evaluation by clinical user´s
Chapter 3
46
range between “1“ (strongly disagree) and “5” (strongly agree),
The variations rated from 1 to 5, intent to measure different degrees of perception of
evaluation, the score from overall image quality
ctures were summed for analysis
n increase in sample
the body (Q.1.3) and
The questionnaire was applied
C and D) and for both
, which represents a 45 treatment isocenter localizations
examination. Therefore, 90 images were analysed by 5
during this research period.
patients in different EPIDs to reduce the
posterior (AP) and (b) lateral pelvic fields, and thorax
evaluation by clinical user´s


