Page 1
A PhD THESIS ON "ROLE OF FOREIGN INSTITUTIONAL INVESTORS IN INDIAN STOCK MARKET"
99 | P a g e
Chapter 4 Data Analysis and Interpretation
4.1 Introduction
This chapter is dedicated to present the data analysis and interpretation for FIIs
investments and Indian stock index. Researcher has used secondary data for this present
study. There are two variables employed for data which are FIIs investments activities
consists with FIIs purchase, FIIs sales and FIIs net investments, Indian stock indexes
define BSE SENSEX and NIFTY50.
There are different kind of statistical tools used for analysis the data and interpret the
results. Here researcher has used descriptive statistical tools; mean, median, standard
deviation, standard error, coefficient variances, range, skewness and kurtosis for the
proper analysis study objectives.
Besides, Coefficient correlation (r), coefficient determination R2, and adjusted R2
employed for quantify the effects and association between Indian stock indexes and FIIs
investments. These tools used for find propositional effects and degree of correlation
between BSE SENSEX, NIFTY and FIIs investments activities; purchase, sales, net for
the 10 years.
Moreover, researcher has used regression residual analysis model for wrap the objective
that to come across effect of FIIs investments on the Indian stock market. The regression
analysis predicts the performance of Indian stock index SENSEX and nifty due to FIIs
purchase trend for the year 2003 to year 2012. The regression equation of the regression
model is presented cause and effect relationship between Indian stock indexes and FIIs
investments. There is hypothesis developed and tested in order to achieve objectives
toward role of FIIs on Indian stock market. Researcher has applied t-test for significant
predictive variables FIIs activities on Indian stock index and F-test to determine the
overall significance of the regression model. Subsequent, there are different section
employed for proper analysis and interpret results which are as follow:
Page 2
A PhD THESIS ON "ROLE OF FOREIGN INSTITUTIONAL INVESTORS IN INDIAN STOCK MARKET"
100 | P a g e
4.2 Trend analysis of BSE SENSEX & NIFTY with respect to descriptive statisticaltools
Researcher conducted trend analysis for BSE SENSEX & NIFTY. Researcher has
calculated daily average value of BSE SENSEX and NIFTY50 for the year 2003 to 2012.
Descriptive statistical analysis is conducted to define the effect of changing values on
measures of central tendency, variation and shape. The descriptive statistical tools
calculated for measurement of BSE SENSEX and NIFTY 50. This assists to define some
initiative for BSE SENSEX and NIFTY 50.
Table 4.1 Trend of average BSE SENSEX & NIFTY50
YearAverage of
BSE SENSEX INDEXAverage of
NIFTY50 INDEX
2003 3872.97 1233.71
2004 5563.09 1755.87
2005 7392.89 2268.91
2006 11440.04 3357.09
2007 15563.60 4571.29
2008 14492.68 4339.11
2009 13700.82 4113.96
2010 18206.91 5461.12
2011 17777.77 5335.91
2012 17617.04 5343.77
The above table shows daily average value of BSE SENSEX index and NIFTY50 index
for the year 2003 to 2012, the value of table present the chart for average value on
different plot which are exhibited in following chart 4.1:
Page 3
A PhD THESIS ON "ROLE OF FOREIGN INSTITUTIONAL INVESTORS IN INDIAN STOCK MARKET"
101 | P a g e
The above chart 4.1 and tables 4.1 show the average value of BSE SENSEX and
NIFTY50, the data represent for the 10 years start from 2003 to year 2012.
The average value of BSE SEBSEX shows that there was continuously positive trend for
the year 2003 to year 2007, Thus, Average of BSE SENSEX increased from 3872.97 to
4571.29 points which show the bull trends during this tenure. After that there was
declined trend for the year 2008 and 2009 due to global crisis. Market reached average
BSE SENSEX point 14492.68 and 13700.82 for the year 2008 and 2009 respectively. At
last, there was best performance of BSE SENSEX during the year 2010. In the contrary,
BSE SENSEX little bit declined and touched average point 17777.77 and 17617.04 for
the year 2011 to 2012. Thus, It terminated that performance of BSE SENSEX was good
and positive trend during the 2003 to year 2012.
Page 4
A PhD THESIS ON "ROLE OF FOREIGN INSTITUTIONAL INVESTORS IN INDIAN STOCK MARKET"
102 | P a g e
The average value of NIFTY50 presented that there was continuously positive trend for
the year 2003 to 2007, thus, Average of NIFTY50 increased from 1233.71 to 15563.60
points which proved the bull trends during these years. Subsequently there was declined
trend for the year 2008 and 2009 due to global crisis. Market contacted average NIFTY50
points 4339.11 and 4113.96 for the year 2008 and 2009 respectively. At last, there was
best performance of NIFTY50 during the year 2010 which shows that NIFTY50 slightly
declined and faced average point 5335.91 and 5343.77 for the year 2011 to 2012.
Consequently, It fulfilled that performance of NIFTY50 was excellent and encouraging
trend during the 2003 to year 2012.
Researcher has used descriptive statistical tools; mean, median, standard deviation,
standard error, coefficient variances, range, skewness and kurtosis for execute the
objectives of research study. Following calculation made by the researcher:
Page 5
A PhD THESIS ON "ROLE OF FOREIGN INSTITUTIONAL INVESTORS IN INDIAN STOCK MARKET"
103 | P a g e
Table 4.2 Analysis of descriptive statistical Average BSE SENSEX and NIFTY 50
Descriptive statistical tools BSE SENSEX NIFTY 50
Mean 12562.78 3778.08
Standard Error 1670.39 492.00
Median 14096.75 4226.54
Coefficient of variance% 41.18 41.18
Standard Deviation 5282.25 1555.84
Kurtosis -1.17 -1.20
Skewness -0.61 -0.56
Range 14333.94 4227.42
Minimum 3872.97 1233.71
Maximum 18206.91 5461.12
Year 2003 to 2012 10 10
The above descriptive statistical tools deliberated for average BSE SENSEX and
NIFTY50, for the year 2003 to year 2012.
BSE SENSEX has an average valued by 12562.78. It is deviated from mean value by
5282.25 in both surfaces. Standard error of BSE SENSEX is 1670.39. The average value
of NIFTY 50 is 3778.08 and standard deviation is 1555.84which indicates that mean
move away from mean value by 1555.84.The coefficient of variation measures the
variation that is expressed as percentage. The coefficient of variation of average BSE
SENSEX and NIFTY50 has equal value 41.18%.
Page 6
A PhD THESIS ON "ROLE OF FOREIGN INSTITUTIONAL INVESTORS IN INDIAN STOCK MARKET"
104 | P a g e
Median 14096.75 shows middle value in BSE SENSEX index that has been ordered from
lowest to highest value for the year 2003 to 2010. NIFTY 50 has 4226.54 middle values
that have been ordered from lowest to highest value for the year 2003 to 2012. BSE
SENSEX has wider range 14333.94 which defines from the average minimum index year
2003 and maximum index year 2010 is 3872.97 and 18206.91 respectively. The wider
range 14333.94 shows extremely volatility in the BSE SENSEX index during the year
2003 to year 2012.
Skewness and kurtosis use for the measure the normality of the data. BSE SENSEX and
NIFTY 50 have value by -0.61 and -0.56 correspondingly which shows that the
distribution is negative skewed. The average BSE SENSEX 12562.78 and 3778.08 is
lower than middle value of BSE SENSEX 14096.75 and NIFTY 50 4226.54. Kurtosis of
BSE SENSEX and NIFTY 50 has value by -1.17 and -1.20 correspondingly which is less
than 3. It means the distribution is platykurtic, so in this distribution quartile range is
preferred rather than mean
4.3 Trend analysis of FIIs activities; FIIs purchases, FIIs sales, FIIs net investmentswith respect to descriptive statistical tools
Researcher carried out trend analysis for FIIs activities; FIIs purchases, FIIs sales.
Researcher has calculated daily average investment of FIIs activities; FIIs purchases, FIIs
sales, FIIs net investments for the year 2003 to 2012. Descriptive statistical analysis is
employed to define the effect of varying values on measures of central tendency, disparity
and shape. The descriptive statistical tools calculated for measurement of FIIs activities;
FIIs purchases, FIIs sales.
Page 7
A PhD THESIS ON "ROLE OF FOREIGN INSTITUTIONAL INVESTORS IN INDIAN STOCK MARKET"
105 | P a g e
Table 4.3
Trend analysis of FIIs activities; FIIs purchases, FIIs sales, FIIs net investments
Amount in cr.
Year Average GrossPurchase
Average GrossSales
Average NetInvestments
2003 377.75 255.08 122.68
2004 735.53 580.74 154.79
2005 1135.45 948.48 186.97
2006 1854.49 1721.38 133.11
2007 3327.14 3034.00 293.14
2008 2953.93 3171.35 -217.43
2009 2597.53 2243.31 354.22
2010 3123.59 2577.69 571.13
2011 2554.98 2570.29 -15.30
2012 2777.61 2262.60 515.01
Page 8
A PhD THESIS ON "ROLE OF FOREIGN INSTITUTIONAL INVESTORS IN INDIAN STOCK MARKET"
106 | P a g e
The above chart 4.3 and tables 4.3 state the average FIIs purchases for the 10 years start
from year 2003 to 2012. There was large amount of FIIs sales 3171.35cr in the year 2008.
Same as in the year 2007, FIIs have sold 3034cr. securities in Indian stock market.
Remain all years FIIs sales continuously increase trend shows FIIs take off huge amount
capital from the Indian stock market last five years. Moreover, FIIs purchase also
increased with FIIs sales consequently, FIIs capital flow positive trend except year 2008
and year 2011 respectively.
The above chart 4.4 and table 4.3 disclosed the average FIIs sales for the 10 years start
from year 2003 to 2012.
The table value demonstrates that there was continuously optimistic trend for the year
2003 to 2007, thus, FIIs has purchased stock rs. 377.75 cr in the year 2003 than after
enhanced to 3327.14 cr. in the year 2007. The value shows that interest of FIIs optimistic
during these years. There was declined trend for the year 2008 and 2009 due to global
crisis. FIIs purchase was decreased to 2953.93 cr and 2597.53 cr. for the year 2008 and
2009 respectively.
Page 9
A PhD THESIS ON "ROLE OF FOREIGN INSTITUTIONAL INVESTORS IN INDIAN STOCK MARKET"
107 | P a g e
Besides, FIIs investment was increased to 3123.59 cr amount for the year 2010. In the
contrary, BSE SENSEX little bit declined and touched average point 2554.98 cr and
2777.61 cr for the year 2011 to 2012. Thus, last five years data indicates that interest of
foreign institutional investors superior toward Indian stock market.
The above chart 4.5 and table 4.3 show the average FIIs net investments consists with
FIIs purchases and FIIs sales for year 2003 to 2012.
FIIs net investments having upward trend for the year 2003 to year 2007. There was
negative FIIs net investments -217 cr. it presents huge sales of FIIs over FIIs purchases.
This data shows that huge sales trend of FIIs investments in Indian stock markets.
Moreover, there was negative net investments average -15.30 cr. FIIs net investments
was uppermost 571.13 cr in the year 2010 which shows FIIs purchase was excess over
FIIs sales. Same way, in the year 2012, FIIs have optimum net investments 515.01cr.
Page 10
A PhD THESIS ON "ROLE OF FOREIGN INSTITUTIONAL INVESTORS IN INDIAN STOCK MARKET"
108 | P a g e
Table 4.4 Analysis of descriptive statistical for average FIIs Investments activities
Descriptive statistical toolsFIIs Investments (cr.)
Purchases Sales Net
Mean 2143.80 1936.49 209.83
Standard Error 333.26 323.70 74.66
Median 2576.26 2252.96 170.88
Coefficient of variance% 49.16 52.86 112.52
Standard Deviation 1053.87 1023.63 236.11
Kurtosis -1.11 -1.07 0.03
Skewness -0.69 -0.57 -0.12
Range 2949.38 2916.27 788.55
Minimum 377.75 255.08 -217.43
Maximum 3327.14 3171.35 571.13
Year 2003 to 2012 10 10 10
The above descriptive statistical tools calculated for average FIIs purchase, sales and net
investments for the year 2003 to 2012.
The average value of FIIs investments activities purchase, sales and net is 2143.80 cr.
1936.49 cr. 209.83 cr. respectively. Its deviation defines through the standard deviation.
Standard deviation of average value of FIIs investments activities purchase, sales and net
is 1053.87 cr., 1023.63cr. 236.11cr. which diverged from the average from mean value in
both side. FIIs investments activities purchase, sales and net has standard error value of
333.26, 323.70 and74.66 respectively.
Page 11
A PhD THESIS ON "ROLE OF FOREIGN INSTITUTIONAL INVESTORS IN INDIAN STOCK MARKET"
109 | P a g e
FIIs purchase and FIIs sales are 49.16% and 52.86% which reveals that there is no huge
variation in FIIs purchase and FIIs sales during the year 2003 to year 2012, in the
contrary FIIs net having 112.52% coefficient of variation shows variation among the FIIs
purchase and FIIs sales during the year 2003 to year 2012.
FIIs purchase, FIIs sales and FIIs net investments have Median 2576.26cr, 2252.96cr,
170.88cr respectively which shows middle value in FIIs investments that has been
ordered from lowest to highest value for the year 2003 to year 2012.
FIIs purchase has 2948.38 wider ranges which define from the average minimum index
year 2003 and maximum index year 2010 is 377.75 and 3327.14 respectively. FIIs sales
has 2916.17 broad range which measures from the average minimum index year 2003 and
maximum index year 2010 is 255.08 and 3171.35 respectively. The ample range indicates
tremendously vary FIIs investment during the year 2003 to 2012.
Skewness and kurtosis use for the measure the normality of the data. For the year 2003 to
year 2012 FIIs purchase, sales and net investments have value -0.69, -0.57, -0.12
respectively which evidence that the distribution is negative skewed. The mean of FIIs
investments are lower than middle value. Kurtosis of FIIs purchase, sales and net
investments have -1.11, -1.07 and 0.03 respectively which is less than 3. It means the
distribution is platy-kurtic, so in this distribution quartile range is preferred rather than
mean
4.4 Analysis of regression residual model for FIIs investments activities and BSESENSEX
Regression model employed for measure the significance effect of independent variable
FIIs Investments activities on dependent variables Indian stock index; BSE SENSEX and
NIFTY50. Following different section shows the analysis of regression residual analysis
for FIIs investments activities and Indian stock indexes.
4.4.1 Regression model residual analysis for BSE SENSEX and FIIs purchase
The regression analysis predicts the SENSEX index due to FIIs purchase trend. The
regression equation of the regression model is presented in relationship between SENSEX
indexes due to FIIs purchases.
Page 12
A PhD THESIS ON "ROLE OF FOREIGN INSTITUTIONAL INVESTORS IN INDIAN STOCK MARKET"
110 | P a g e
Table 4.5
Coefficient of correlation and determination for BSE SENSEX and FIIs purchases
Coefficient correlation r 0.94
R Square 0.89
Adjusted R Square 0.88
Standard Error 1862.96
Observations 10
The correlation between BSE SENSEX index and FIIs purchase is r = 0.94 which shows
positive high degree of correlation between BSE SENSEX index and FIIs purchase. The
coefficient of determination is 0.88 in other word 88% of the volatility in the BSE
SENSEX index due to the variation in the FIIs purchase. This result shows that 0.12 or
12% of the changes due to the other factors other than FIIs purchase. A comparison of R2
0.88 with the adjusted R2 0.86 shows that the adjusted R2 reduced the overall proportion
of variation of the dependent variable accounted for by the independent variables by a
factor of 0.02 by 2%.
It concluded that FIIs purchase highly influenced on volatility of BSE SENSEX. The gap
between R2 and the adjusted R2 tends to increase as non significant independent variables
are added to the regression model. Standard error measures not only the size of chance
error that has been made but also the amount by which the regressed values away from
the actual values. Here larger standard error 1862.96 indicates a huge quantity of
variation or scatter around the regression line which constructed in chart 4.6.
Distributions of sample mean that wide spread is a better estimator of the population
mean than a distribution of sample mean.
Regression model line
Ŷ = α + βx
Ŷ = 2428.99 + 4.73 X
Page 13
A PhD THESIS ON "ROLE OF FOREIGN INSTITUTIONAL INVESTORS IN INDIAN STOCK MARKET"
111 | P a g e
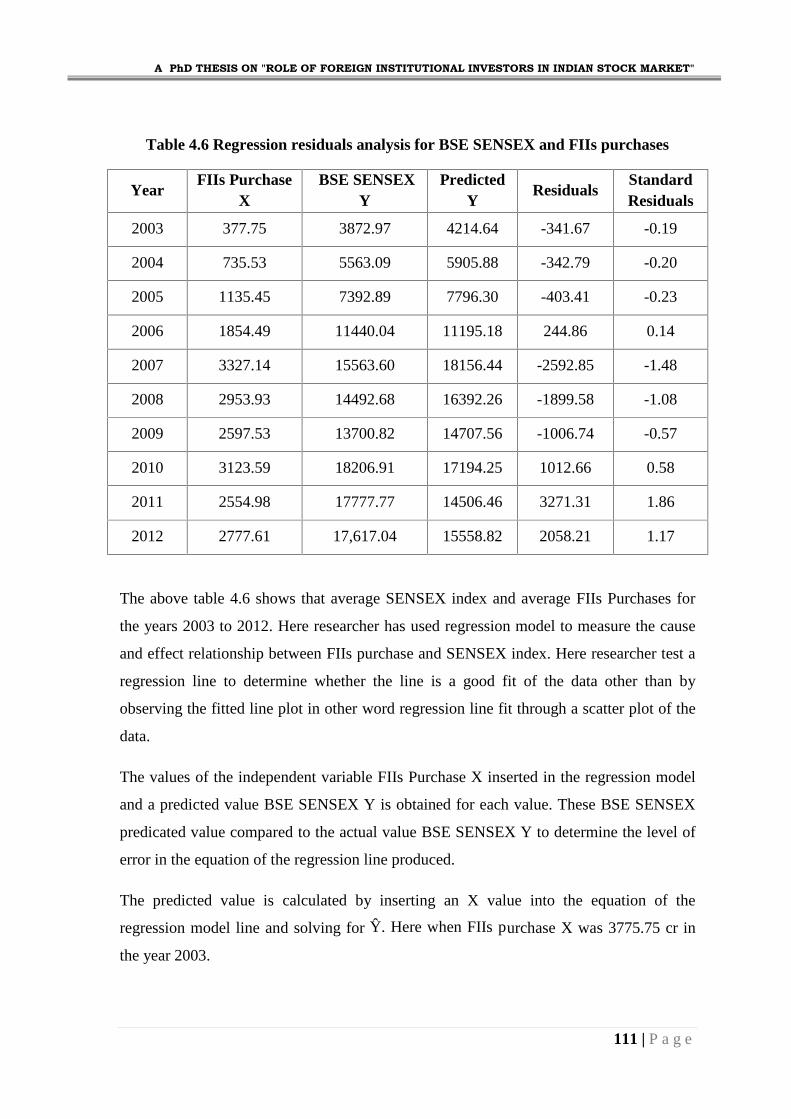
Table 4.6 Regression residuals analysis for BSE SENSEX and FIIs purchases
YearFIIs Purchase
XBSE SENSEX
YPredicted
YResiduals
StandardResiduals
2003 377.75 3872.97 4214.64 -341.67 -0.19
2004 735.53 5563.09 5905.88 -342.79 -0.20
2005 1135.45 7392.89 7796.30 -403.41 -0.23
2006 1854.49 11440.04 11195.18 244.86 0.14
2007 3327.14 15563.60 18156.44 -2592.85 -1.48
2008 2953.93 14492.68 16392.26 -1899.58 -1.08
2009 2597.53 13700.82 14707.56 -1006.74 -0.57
2010 3123.59 18206.91 17194.25 1012.66 0.58
2011 2554.98 17777.77 14506.46 3271.31 1.86
2012 2777.61 17,617.04 15558.82 2058.21 1.17
The above table 4.6 shows that average SENSEX index and average FIIs Purchases for
the years 2003 to 2012. Here researcher has used regression model to measure the cause
and effect relationship between FIIs purchase and SENSEX index. Here researcher test a
regression line to determine whether the line is a good fit of the data other than by
observing the fitted line plot in other word regression line fit through a scatter plot of the
data.
The values of the independent variable FIIs Purchase X inserted in the regression model
and a predicted value BSE SENSEX Y is obtained for each value. These BSE SENSEX
predicated value compared to the actual value BSE SENSEX Y to determine the level of
error in the equation of the regression line produced.
The predicted value is calculated by inserting an X value into the equation of the
regression model line and solving for Ŷ. Here when FIIs purchase X was 3775.75 cr in
the year 2003.
Page 14
A PhD THESIS ON "ROLE OF FOREIGN INSTITUTIONAL INVESTORS IN INDIAN STOCK MARKET"
112 | P a g e
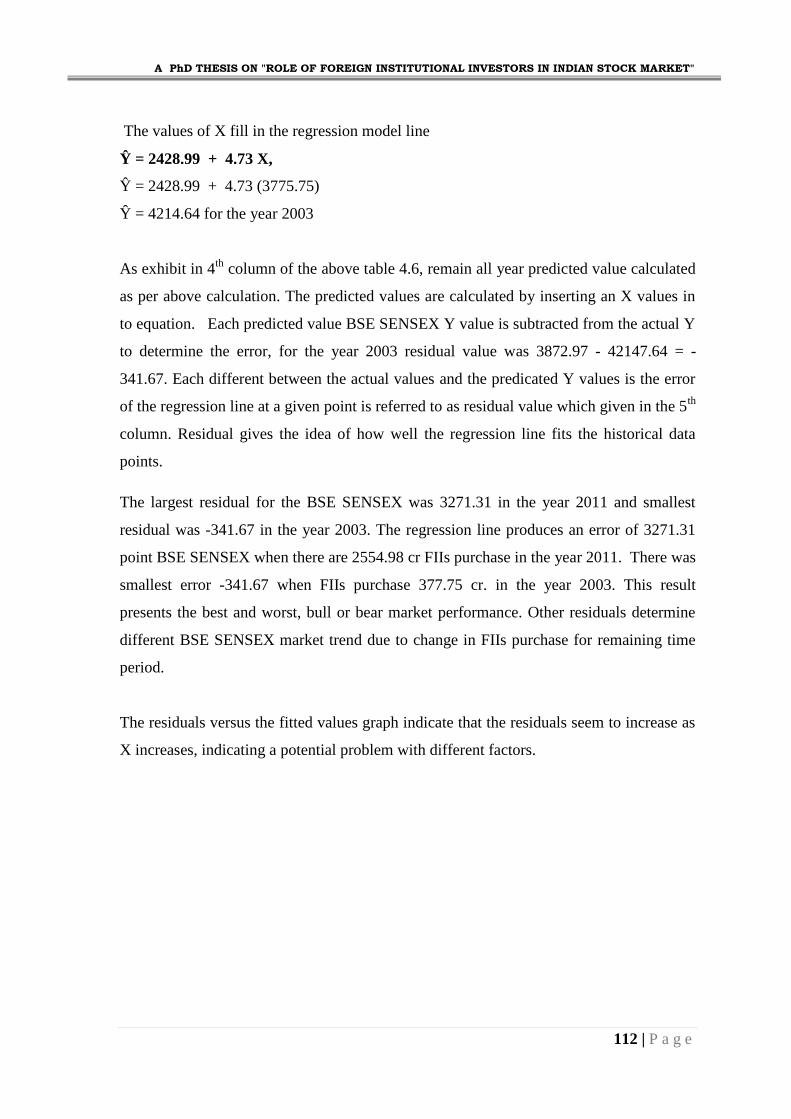
The values of X fill in the regression model line
Ŷ = 2428.99 + 4.73 X,
Ŷ = 2428.99 + 4.73 (3775.75)
Ŷ = 4214.64 for the year 2003
As exhibit in 4th column of the above table 4.6, remain all year predicted value calculated
as per above calculation. The predicted values are calculated by inserting an X values in
to equation. Each predicted value BSE SENSEX Y value is subtracted from the actual Y
to determine the error, for the year 2003 residual value was 3872.97 - 42147.64 = -
341.67. Each different between the actual values and the predicated Y values is the error
of the regression line at a given point is referred to as residual value which given in the 5th
column. Residual gives the idea of how well the regression line fits the historical data
points.
The largest residual for the BSE SENSEX was 3271.31 in the year 2011 and smallest
residual was -341.67 in the year 2003. The regression line produces an error of 3271.31
point BSE SENSEX when there are 2554.98 cr FIIs purchase in the year 2011. There was
smallest error -341.67 when FIIs purchase 377.75 cr. in the year 2003. This result
presents the best and worst, bull or bear market performance. Other residuals determine
different BSE SENSEX market trend due to change in FIIs purchase for remaining time
period.
The residuals versus the fitted values graph indicate that the residuals seem to increase as
X increases, indicating a potential problem with different factors.
Page 15
A PhD THESIS ON "ROLE OF FOREIGN INSTITUTIONAL INVESTORS IN INDIAN STOCK MARKET"
113 | P a g e
Chart 4.6 Scatter Plots Of FIIs Purchases And BSE SENSEX
F-test : Test to determine the overall significance of the regression model
This F-test determines weather regression coefficients are different from zero. Regression
provides only one predictor and only one regression coefficient test. The regression
coefficient is the slop of the regression line, the F-test for overall significance is testing
the same thing as the t-test in regression. The hypotheses being tested in simple
regression by the F-test for overall significance are as follow:
Null H0 : β = 0
Alt H1 : β ≠ 0
OR
Null H0 : there is at least one of the regression coefficients is zero
Alt H1 : there is at least one of the regression coefficients is different from zero
Page 16
A PhD THESIS ON "ROLE OF FOREIGN INSTITUTIONAL INVESTORS IN INDIAN STOCK MARKET"
114 | P a g e
Table 4.7 F-test for regression coefficients of FIIs Purchase and BSE SENSEX
DF SS MS F Significance F
Regression 1 223354193.40 223354193.40 64.36 0.00001
Residual 8 27764925.20 3470615.65
The above table 4.7 shows the F-test for testing that value of coefficients for the FIIs
Purchase and BSE SENSEX. The values of sum of squares (SS), degree of freedom (df),
and mean squares (MS) are obtained from the analysis of variance table, which is
produced with other regression statistics as standard output from statistical calculation,
above shown table is F test value for the BSE SENSEX index. F-test table, the degree of
freedom is equal to 1. Here regression models have only one independent variable FIIs
purchase for BSE SENSEX, therefore the degree of freedom error in regression analysis
is n – 1 – 1 = n – 2.
The difference between F value = 64.36 and the value obtained by squaring the t-value
(8.02)2 = 64.32 is (0.04) incurred due to error. The probability of obtaining an F value this
large by chance if there is no regression prediction in the regression model is 0.00001
according to F test. The value of F for this is 64.36 with a p-value 0.00001 which is not
significant at 5% level (0.00001< 0.05). This output value means it is highly unlikely that
the population slope is zero and there is no prediction due to regression from this model
given the sample statics obtained. Hence, it is highly likely that this regression molded
adds significant predictability of the dependent variable BSE SENSEX.
On the base of this result, the null hypothesis would not be rejected for the overall test of
significance. None of the regression coefficients are significantly different from zero, and
no significant predictability of the volatility of SENSEX Index by the FIIs Purchases
given from this regression model.
Regression model line : Ŷ = 2428.99 + 4.73 X
Page 17
A PhD THESIS ON "ROLE OF FOREIGN INSTITUTIONAL INVESTORS IN INDIAN STOCK MARKET"
115 | P a g e
A slope of 4.73 indicates that there is a positive upward trend of BSE SENSEX and FIIs
Purchases over this period year 2003 to 2012 at a 4.73cr. The Y intercept of 2428.99
represents what the regression model trend line would estimate the BSE SENSEX to have
been in 10 years.
t-test for significant predictive variables FIIs investments on BSE SENSEX
This test is determined how well a regression model fits the data. Here researcher decides
that it is not worth the effort to develop a linear regression model to predict BSE
SENSEX (Y) from FIIs investments. An alternative approach might be to average the
INDEX (Y) values and use Ŷ as the predictor of y for all values of FIIs X values.
Null H0 : β = 0
Alt H1 : β > 0
OR
Null H0 : There is no relationship between FIIs Purchase and BSE SENSEX
Alt H1 : There is positive relationship between FIIs Purchase and BSE SENSEX
Table 4.8 t-test for relationship between FIIs Purchase and BSE SENSEX
CoefficientsStandard
Errort Stat P-value
Lower95%
Upper95%
Intercept (Y) 2428.99 1393.84 1.74 0.12 -785.21 5643.18
FIIs Purchase (X) 4.73 0.59 8.02 0.00 3.37 6.09
An examination of the t test supports this result using at 5% significant level. The t value
calculated from the sample slop fall in the rejection region and the p–value is 0.0001 for
FIIs purchase. Where, p-value is less than significant level 0.05 (0.0001 < 0.05). So, the
null hypothesis that populations slope is zero rejected. That the t statistic value for testing
to determine if the slope is significantly different from zero is 8.02 with a p-value of
0.0001. This linear regression model is adding significantly more predictive variable to
the BSE SEBSEX variable Y. It shows that SENSEX index significantly more analytical
variable by FIIs purchase. It is desirable to reject the null hypothesis in testing the slope
of the regression model. In rejecting the null hypothesis of a zero population slope, so the
regression model is adding something to the explanation of the variation of the dependent
Page 18
A PhD THESIS ON "ROLE OF FOREIGN INSTITUTIONAL INVESTORS IN INDIAN STOCK MARKET"
116 | P a g e
variable BSE SENSEX that the average value of Y model does not failure to reject the
null hypothesis in this test causes the researcher to conclude that the regression model has
no predictability of the dependent variable BSE SENSEX, and the model, therefore, has
little use. The standard error of the model Se = 1862.96 indicate that if the error terms are
approximately normally distributed, about 89% of the predicted BSE SENSEX index fall
with +1862.96 to -1862.96.
4.4.2 Regression model residual analysis for BSE SENSEX and FIIs sales
The regression analysis predicts the SENSEX index due to FIIs sales trend. The
regression equation of the regression model is presented in relationship between SENSEX
index and FIIs sales.
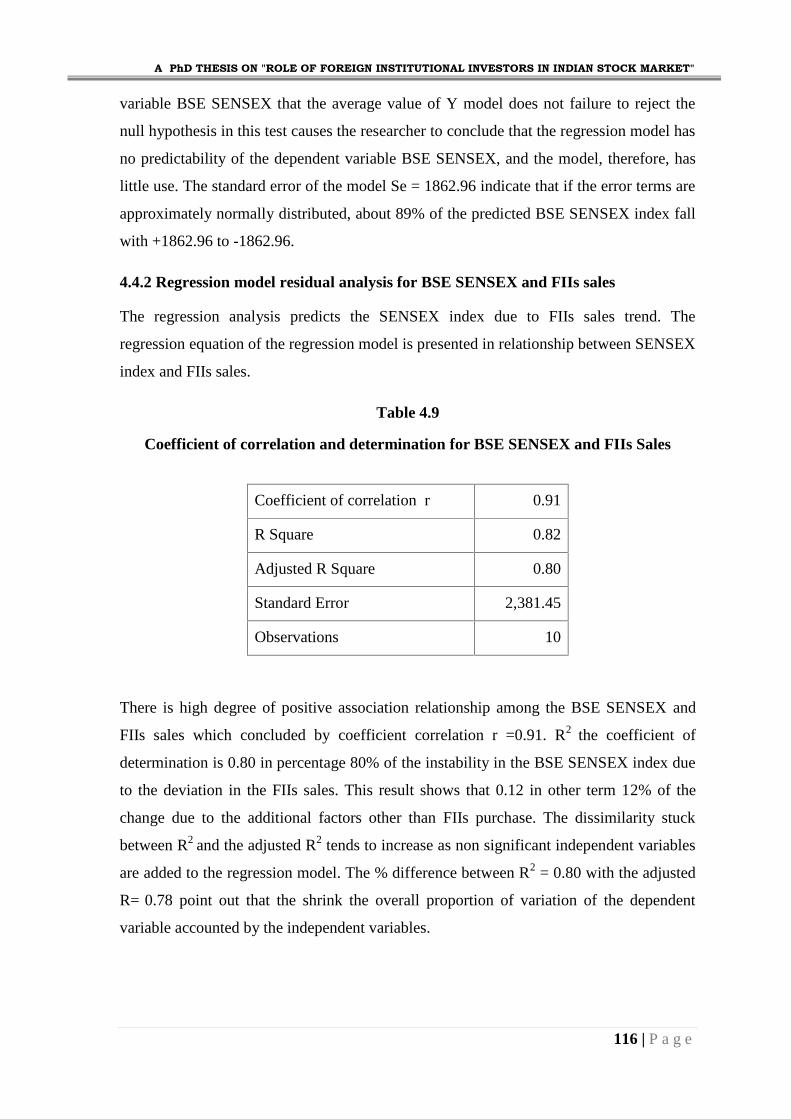
Table 4.9
Coefficient of correlation and determination for BSE SENSEX and FIIs Sales
Coefficient of correlation r 0.91
R Square 0.82
Adjusted R Square 0.80
Standard Error 2,381.45
Observations 10
There is high degree of positive association relationship among the BSE SENSEX and
FIIs sales which concluded by coefficient correlation r =0.91. R2 the coefficient of
determination is 0.80 in percentage 80% of the instability in the BSE SENSEX index due
to the deviation in the FIIs sales. This result shows that 0.12 in other term 12% of the
change due to the additional factors other than FIIs purchase. The dissimilarity stuck
between R2 and the adjusted R2 tends to increase as non significant independent variables
are added to the regression model. The % difference between R2 = 0.80 with the adjusted
R= 0.78 point out that the shrink the overall proportion of variation of the dependent
variable accounted by the independent variables.
Page 19
A PhD THESIS ON "ROLE OF FOREIGN INSTITUTIONAL INVESTORS IN INDIAN STOCK MARKET"
117 | P a g e
In short, It can be summarised that increase in change of FIIs sales trend which increase
the BSE SENSEX. Here larger standard error 2381.45 point toward a bulky amount of
variation or scatter around the regression line. Distributions of sample mean that wide
stretch is a enhanced estimator of the population mean than a distribution of sample mean
Regression model line
Ŷ = α +βx
Ŷ = 3517.55 + 4.67 X
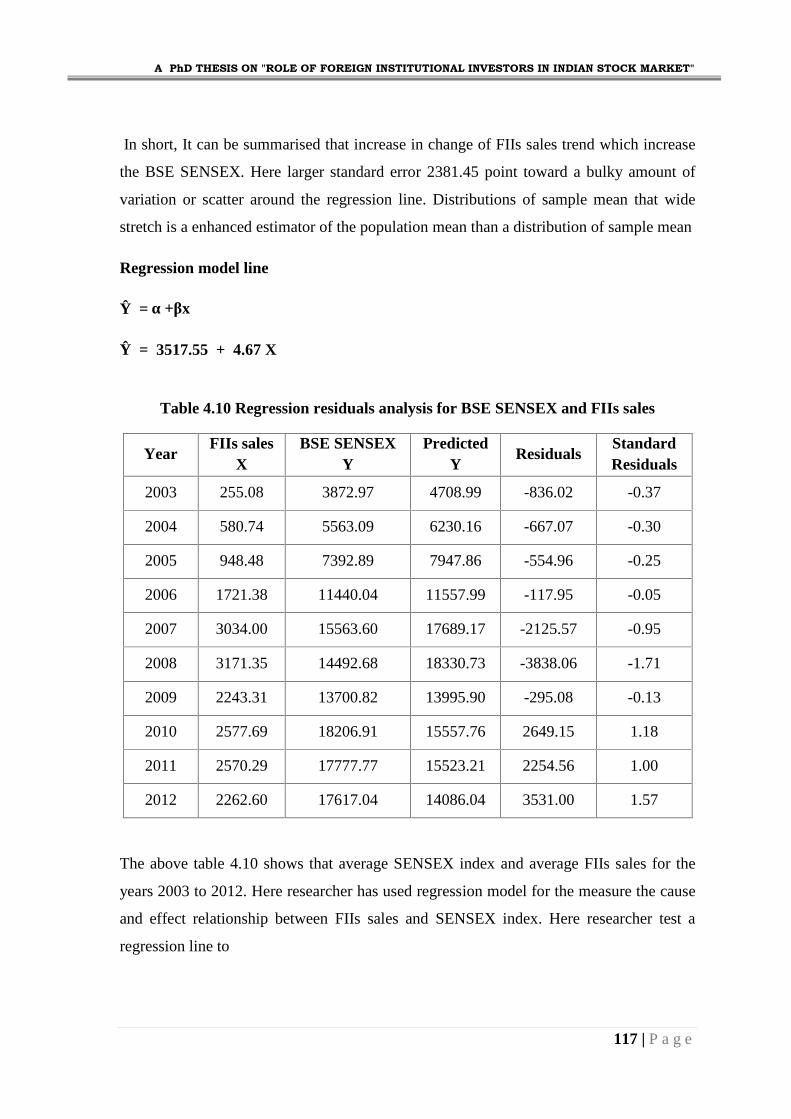
Table 4.10 Regression residuals analysis for BSE SENSEX and FIIs sales
YearFIIs sales
XBSE SENSEX
YPredicted
YResiduals
StandardResiduals
2003 255.08 3872.97 4708.99 -836.02 -0.37
2004 580.74 5563.09 6230.16 -667.07 -0.30
2005 948.48 7392.89 7947.86 -554.96 -0.25
2006 1721.38 11440.04 11557.99 -117.95 -0.05
2007 3034.00 15563.60 17689.17 -2125.57 -0.95
2008 3171.35 14492.68 18330.73 -3838.06 -1.71
2009 2243.31 13700.82 13995.90 -295.08 -0.13
2010 2577.69 18206.91 15557.76 2649.15 1.18
2011 2570.29 17777.77 15523.21 2254.56 1.00
2012 2262.60 17617.04 14086.04 3531.00 1.57
The above table 4.10 shows that average SENSEX index and average FIIs sales for the
years 2003 to 2012. Here researcher has used regression model for the measure the cause
and effect relationship between FIIs sales and SENSEX index. Here researcher test a
regression line to
Page 20
A PhD THESIS ON "ROLE OF FOREIGN INSTITUTIONAL INVESTORS IN INDIAN STOCK MARKET"
118 | P a g e
determine whether the line is a good fit of the data other than by observing the fitted line
plot in other word regression line fit through a scatter plot of the data.
The value of the independent variable FIIs sales X inserted in the regression model and a
predicted value BSE SENSEX (Y) are obtained for each value. These BSE SENSEX
predicated value compared to the actual value BSE SENSEX (Y) to determine how much
error the equation of the regression line produced. Each different between the actual
values and the predicated Y values is the error of the regression line at a given point is
referred to as residual value which given in the 5th column. Residual gives the idea of how
well the regression line fits the historical data points.
The regression model fits these particular data SENSEX index and FIIs sales well for the
year 2006 and 2009, as indicated by residuals of -117.95 and -295.08 at standard residual
-0.05 and -0.13 BSE SENSEX, correspondingly, for remaining years the residuals are
relatively large, indicating that the regression model does not fit the data for these years.
The residuals versus the fitted values graph indicate that the residuals seem to increase as
FIIs sales X increases, indicating a potential problem with vary.
Page 21
A PhD THESIS ON "ROLE OF FOREIGN INSTITUTIONAL INVESTORS IN INDIAN STOCK MARKET"
119 | P a g e
Chart 4.7 Scatter Plots Of FIIs Sales And BSE SENSEX
F-test : Test to determine the overall significance of the regression model
This F-test establishes weather regression coefficients are different from zero. Regression
provides only one predictor and only one regression coefficient test. The regression
coefficient is the slop of the regression line, the F-test for overall significance is testing
the same thing as the t-test in regression. The hypotheses being tested in simple
regression by the F-test for overall significance are as follow:
Null H0 : β = 0
Alt H1 : β ≠ 0
OR
Null H0 : there is at least one of the regression coefficients is zero
Alt H1 : there is at least one of the regression coefficients is different from zero
Page 22
A PhD THESIS ON "ROLE OF FOREIGN INSTITUTIONAL INVESTORS IN INDIAN STOCK MARKET"
120 | P a g e
Table 4.11 F-test for regression coefficients of FIIs sales and BSE SENSEX
df SS MS F Significance F
Regression 1 205748504.39 205748504.39 36.28 0.00001
Residual 8 45370614.21 5671326.78
The above F-test table 4.11 shows the F-test for regression coefficients of FIIs Purchase
and BSE SENSEX. The values of sum of squares (SS), degree of freedom (df), and mean
squares (MS) are obtained from the analysis of variance table, which is produced with
other egression statistics as standard output from statistical calculation, above shown table
is F test value for the BSE SENSEX index. F-test table, the degree of freedom is equal to
1. Here regression models have only one independent variable FIIs purchase for BSE
SENSEX, therefore the degree of freedom error in regression analysis is n – 1 – 1 = n –
2.
The difference between F value = 36.28 and the value obtained by squaring the t-value
(6.02)2 = 36.24 is (0.04) incurred due to error. The probability of obtaining an F value this
large by chance if there is no regression prediction in the regression model is 0.0001
according to F test. The value of F for this is 56.56 with a p-value 0.0001 which is not
significant at 5% level (0.00001< 0.05). This output value means it is highly unlikely that
the population slope is zero and there is no prediction due to regression from this model
given the sample statics obtained. Hence, it is highly likely that this regression molded
adds significant predictability of the dependent variable.
Consequently, the null hypothesis would not be rejected for the overall test of
significance. None of the regression coefficients are significantly different from zero, and
no significant predictability of the volatility of BSE SENSEX by the FIIs Purchases given
from this regression model.
Regression model line: Ŷ = 3517.55+ 4.67X
Page 23
A PhD THESIS ON "ROLE OF FOREIGN INSTITUTIONAL INVESTORS IN INDIAN STOCK MARKET"
121 | P a g e
This regression line shows that a slope of 4.67 indicates that there is a encouraging
upward trend of BSE SENSEX and FIIs Purchases over this period year 2003 to 2012 at a
4.67cr. The BSE SENSEX Y intercept of 3517.55 represents what the regression model
trend line would estimate the BSE SENSEX to have been in 10 years.
t-test for significant predictive variables FIIs investments on BSE SENSEX
This t-test is determined how well a regression model fits the data. Here researcher
makes a decision that it is not worth the effort to develop a linear regression model to
forecast BSE SENSEX (Y) from FIIs investments. An alternative approach might be to
average the BSE SENSEX (Y) values and use Ŷ as the predictor of y for all values of FIIs
X values.
Null H0 : β = 0
Alt H1 : β > 0
OR
Null H0 : There is no relationship between FIIs sales and BSE SENSEX
Alt H1 : There is positive relationship between FIIs sales and BSE SENSEX
Table 4.12 t-test for relationship between FIIs Sales and BSE SENSEX
CoefficientsStandard
Errort Stat P-value
Lower95%
Upper95%
Intercept (Y) 3517.55 1679.98 2.09 0.07 -356.50 7391.60
FIIs sales (X) 4.67 0.78 6.02 0.00 2.88 6.46
An examination of the t test supports this result using at 5% significant level. The t value
calculated from the sample slop fall in the rejection region and the p – value is 0.00001
for FIIs sales respectively where p-value is less than significant level 0.05 (0.00001 <
0.05). So, the null hypothesis that populations slope is zero rejected. This linear
regression model is adding significantly more predictive variable to the BSE SEBSEX
variable Y. It shows that SENSEX index significantly more analytical variable by FIIs
sales. It is desirable to reject the null hypothesis in testing the slope of the regression
model. In rejecting the null hypothesis of a zero population slope, so the regression model
Page 24
A PhD THESIS ON "ROLE OF FOREIGN INSTITUTIONAL INVESTORS IN INDIAN STOCK MARKET"
122 | P a g e
is adding something to the explanation of the variation of the dependent variable BSE
SENSEX that the average value of Y model does not failure to reject the null hypothesis
in this test causes the researcher to conclude that the regression model has no
predictability of the dependent variable BSE SENSEX, and the model, therefore, has little
use.
In rejecting the null hypothesis of a zero population slope, so the regression model is
adding something to the explanation of the variation of the dependent variable BSE
SENSEX that the average value of Y model does not failure to reject the null hypothesis
in this test causes the researcher to conclude that the regression model has no
predictability of the dependent variable BSE SENSEX, and the model, therefore, has little
use. The standard error of the model Se = 2381.45 designate that if the error terms are
approximately normally distributed, about 88% of the predicted BSE SENSEX index fall
with +2381.45 points to -2381.45 points.
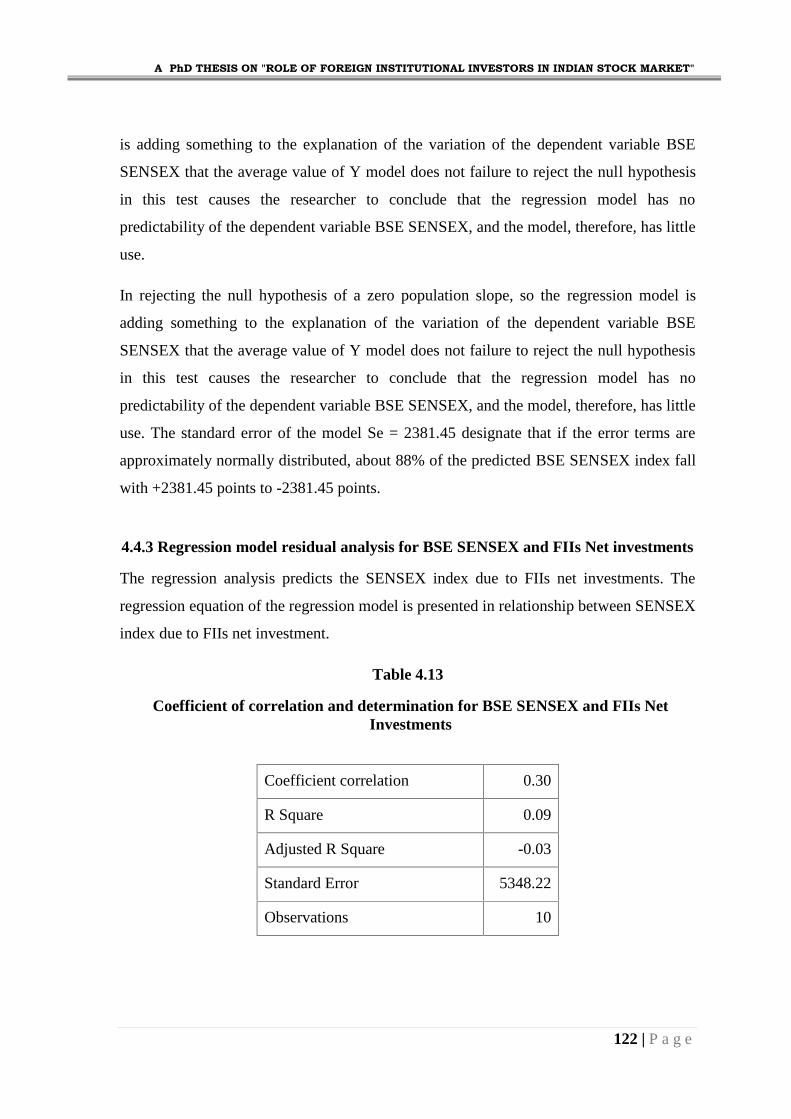
4.4.3 Regression model residual analysis for BSE SENSEX and FIIs Net investments
The regression analysis predicts the SENSEX index due to FIIs net investments. The
regression equation of the regression model is presented in relationship between SENSEX
index due to FIIs net investment.
Table 4.13
Coefficient of correlation and determination for BSE SENSEX and FIIs NetInvestments
Coefficient correlation 0.30
R Square 0.09
Adjusted R Square -0.03
Standard Error 5348.22
Observations 10
Page 25
A PhD THESIS ON "ROLE OF FOREIGN INSTITUTIONAL INVESTORS IN INDIAN STOCK MARKET"
123 | P a g e
FIIs net investments stumpy influence on BSE SENSEX. It can be defines on the base of
r and R2. R2 the coefficient of determination is 0.09 in percentage 9% of the minute
wavering in the BSE SENSEX index due to the variation in the FIIs sales. This result
shows that 0.91 or 91% senses move FIIs specific activities and external factors.
However, the coefficient of correlation, r = 0.30 shows positive correlation between BSE
SENSEX and FIIs net investment. But there is not superior association among them. An
evaluation of R2 = 0.09 with the adjusted R = -0.03 shows that the adjusted R2 reduced the
overall proportion of variation of the dependent variable accounted for by the independent
variables by a factor of 0.12 by 12%. The loop between R2 and the adjusted R2 tend to
raise as non significant independent variables are supplementary to the regression model.
. Here larger standard error 5348.22 states a large amount of disparity or scatter around
the regression line which exhibit in chart 4.8.
Table 4.14 Regression residuals analysis for BSE SENSEX and FIIs Net Investments
Year FIIs Net X BSE SENSEX Y Predicted Y ResidualsStandardResiduals
2003 122.68 3872.97 11981.86 -8108.89 -1.61
2004 154.79 5563.09 12195.92 -6632.83 -1.32
2005 186.97 7392.89 12410.39 -5017.50 -1.00
2006 133.11 11440.04 12051.40 -611.35 -0.12
2007 293.14 15563.60 13118.07 2445.52 0.48
2008 -217.43 14492.68 9714.90 4777.78 0.95
2009 354.22 13700.82 13525.21 175.61 0.03
2010 571.13 18206.91 14970.99 3235.92 0.64
2011 -15.30 17777.77 11062.13 6715.63 1.33
2012 515.01 17,617.04 14596.93 3020.10 0.60
Page 26
A PhD THESIS ON "ROLE OF FOREIGN INSTITUTIONAL INVESTORS IN INDIAN STOCK MARKET"
124 | P a g e
The above residual analysis table 4.14 shows that average SENSEX index and average
FIIs Net investment for the years 2003 to 2012. Here researcher has used regression
model for the measure the cause and effect relationship between FIIs Net investments and
BSE SENSEX index. at this stage researcher examination a regression line to find out
whether the line is a good fit of the data excluding by observing the fitted line plot in
additional remark, regression line fit through a scatter plot of the data.
The value of the independent variable FIIs net investment X inserted in the regression
model and a predicted value BSE SENSEX Y is obtained for each value. This BSE
SENSEX predicated value compared to the actual value BSE SENSEX Y to determine
how much error the equation of the regression line produced. All dissimilar between the
genuine values and the predicated Y values is the error of the regression line at a given
point is referred to as residual value which given in the table 4.14 and 5th column.
Residual gives the design of how well the regression line fits the historical data points.
The regression model fits these particular data SENSEX index and FIIs Net investments
well for the year 2006 and 2009, as indicated by residuals of -611.35 and 175.61 BSE
SENSEX, correspondingly, for remaining years the residuals are comparatively huge,
indicating that the regression model does not fit the data for these years. The residuals
versus the fitted values graph indicate that the residuals appear to increase as FIIs net
investment X increases, indicating a possible problem with heteroscedasticity.
Page 27
A PhD THESIS ON "ROLE OF FOREIGN INSTITUTIONAL INVESTORS IN INDIAN STOCK MARKET"
125 | P a g e
Chart 4.8 Scatter Plots Of FIIs Net Investments And BSE SENSEX
Null H0 : β = 0
Alt H1 : β ≠ 0
OR
Null H0 : there is at least one of the regression coefficients is zero
Alt H1 : there is at least one of the regression coefficients is different from zero
Table 4.15 F-test for regression coefficients of FIIs net and BSE SENSEX
df SS MS F Significance F
Regression 1.00 22291057.28 22291057.28 0.78 0.40
Residual 8.00 228828061.32 28603507.66
Page 28
A PhD THESIS ON "ROLE OF FOREIGN INSTITUTIONAL INVESTORS IN INDIAN STOCK MARKET"
126 | P a g e
The above table 4.15 exhibits results of F-test regarding test of regression coefficient.
Here, the values of sum of squares (SS), degree of freedom (df), and mean squares (MS)
are obtained from the analysis of variance table, which is produced with other egression
statistics as standard output from statistical calculation, above shown table is F test value
for the BSE SENSEX index. F-test table, the degree of freedom is equal to 1. Here
regression models have only one independent variable FIIs net investments for BSE
SENSEX, therefore the degree of freedom error in regression analysis is n – 1 – 1 = n –
2.
The difference between F value = 0.78and the value obtained by squaring the t-value
(0.88)2 = 0.77 is (0.01) incurred due to error. The value of F for this is 0.78 with a p-value
0.00 which is significant at 5% level (0.40 > 0.05). This output value means that the
population slope is zero and there is prediction due to regression from this model given
the sample statics obtained.
On the base of this result, the null hypothesis would be accepted for the overall test of
significance. The regression coefficients are significantly similar to zero, and there is
significant predictability of the volatility of SENSEX Index by the FIIs net investments
given from this regression model.
Regression model line : Ŷ = 11164.14 + 6.67 X
A slope of 6.67 indicates that there is a positive upward trend of BSE SENSEX and FIIs
net over this period year 2003 to 2012 at a 6.67cr. The Y intercept of 11164.14 represents
what the regression model trend line would estimate the BSE SENSEX to have been in 10
years.
t-test for significant predictive variables FIIs net investments on BSE SENSEX
This test is determined how well a regression model fits the data. Here researcher decides
that it is not worth the effort to develop a linear regression model to predict BSE
SENSEX (Y) from FIIs investments. An alternative approach might be to average the
INDEX (Y) values and use Ŷ as the predictor of y for all values of FIIs X values.
Page 29
A PhD THESIS ON "ROLE OF FOREIGN INSTITUTIONAL INVESTORS IN INDIAN STOCK MARKET"
127 | P a g e
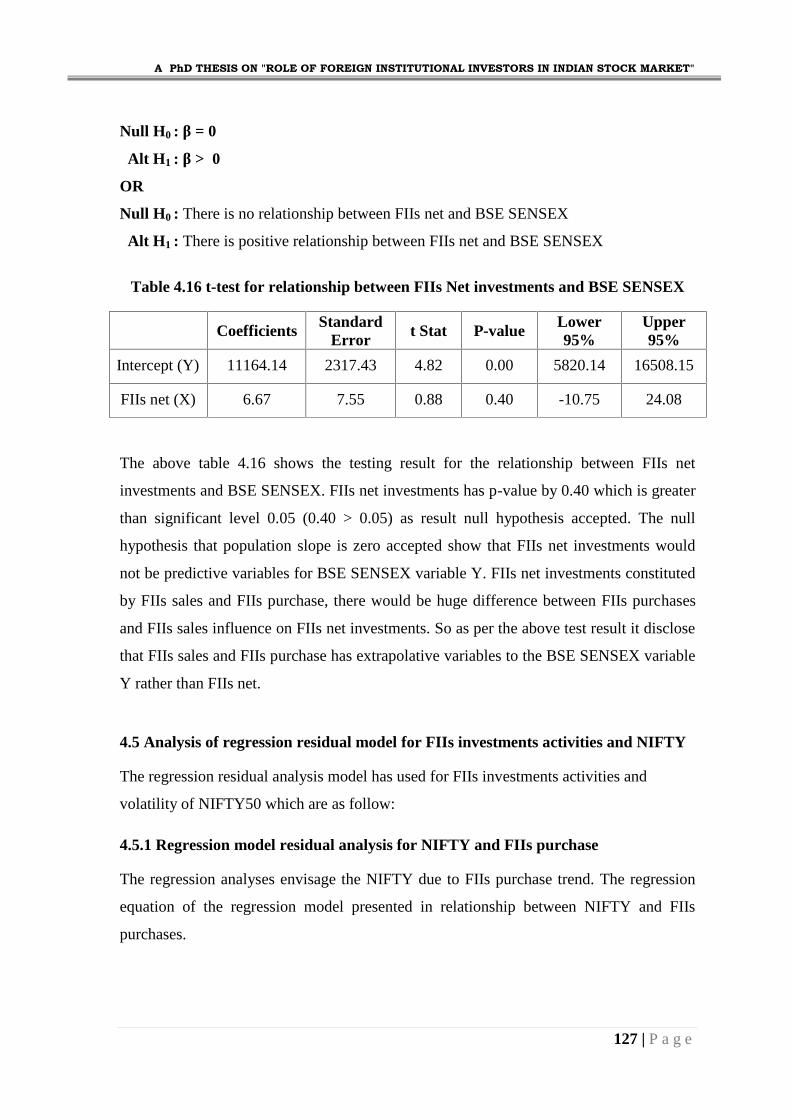
Null H0 : β = 0
Alt H1 : β > 0
OR
Null H0 : There is no relationship between FIIs net and BSE SENSEX
Alt H1 : There is positive relationship between FIIs net and BSE SENSEX
Table 4.16 t-test for relationship between FIIs Net investments and BSE SENSEX
Coefficients StandardError
t Stat P-value Lower95%
Upper95%
Intercept (Y) 11164.14 2317.43 4.82 0.00 5820.14 16508.15
FIIs net (X) 6.67 7.55 0.88 0.40 -10.75 24.08
The above table 4.16 shows the testing result for the relationship between FIIs net
investments and BSE SENSEX. FIIs net investments has p-value by 0.40 which is greater
than significant level 0.05 (0.40 > 0.05) as result null hypothesis accepted. The null
hypothesis that population slope is zero accepted show that FIIs net investments would
not be predictive variables for BSE SENSEX variable Y. FIIs net investments constituted
by FIIs sales and FIIs purchase, there would be huge difference between FIIs purchases
and FIIs sales influence on FIIs net investments. So as per the above test result it disclose
that FIIs sales and FIIs purchase has extrapolative variables to the BSE SENSEX variable
Y rather than FIIs net.
4.5 Analysis of regression residual model for FIIs investments activities and NIFTY
The regression residual analysis model has used for FIIs investments activities and
volatility of NIFTY50 which are as follow:
4.5.1 Regression model residual analysis for NIFTY and FIIs purchase
The regression analyses envisage the NIFTY due to FIIs purchase trend. The regression
equation of the regression model presented in relationship between NIFTY and FIIs
purchases.
Page 30
A PhD THESIS ON "ROLE OF FOREIGN INSTITUTIONAL INVESTORS IN INDIAN STOCK MARKET"
128 | P a g e
Table 4.17Coefficient of correlation and determination for NIFTY and FIIs purchases
Coefficient correlation 0.94
R Square 0.88
Adjusted R Square 0.86
Standard Error 580.91
Observations 10.00
The above table 4.17 formulates to measure the relation between NIFTY and FIIs
purchases. There is high degree of co relation between NIFTY and FIIs purchases which
can be states on the base of r = 0.94. The coefficient of determination is 0.88 in
additional 88% of the instability in the NIFTY index due to the deviation in the FIIs
purchase. This result shows that 0.12 in percentage 12% of the changes due to the other
factors other than FIIs purchase. A comparison of R2 = 0.88 with the adjusted R2 = 0.86
shows that the adjusted R2 reduced the overall proportion of variation of the dependent
variable accounted for by the independent variables by a factor of 0.02 by 2%.
It reveals that FIIs purchase highly influenced on volatility of NIFTY. The gap between
R2 and the adjusted R2 tends to increase as non significant independent variables are
added to the regression model. Standard error measures amount by which the regressed
values away from the actual values. Here larger standard error 580.91 indicates a huge
quantity of variation or scatter around the regression line (see chart 4.9). Distributions of
sample mean that wide spread is a better estimator of the population mean than a
distribution of sample mean.
Regression model line
Ŷ = α + βx
Ŷ = 815.75 + 1.38 X
Page 31
A PhD THESIS ON "ROLE OF FOREIGN INSTITUTIONAL INVESTORS IN INDIAN STOCK MARKET"
129 | P a g e
Table 4.18 Regression residuals analysis for NIFTY and FIIs purchase
YearFIIs Purchase
XNIFTY
YPredicted
Y ResidualsStandardResiduals
2003 377.75 1233.71 1337.74 -104.03 -0.19
2004 735.53 1755.87 1832.12 -76.25 -0.14
2005 1135.45 2268.91 2384.73 -115.82 -0.21
2006 1854.49 3357.09 3378.30 -21.20 -0.04
2007 3327.14 4571.29 5413.22 -841.93 -1.54
2008 2953.93 4339.11 4897.51 -558.40 -1.02
2009 2597.53 4113.96 4405.04 -291.08 -0.53
2010 3123.59 5461.12 5131.95 329.17 0.60
2011 2554.98 5335.91 4346.25 989.66 1.81
2012 2777.61 5343.77 4653.88 689.89 1.26
The above table 4.18 shows that average NIFTY and average FIIs Purchases for the years
2003 to year 2012. Here researcher has used regression model for the measure the cause
and effect relationship between FIIs purchase and NIFTY. Here researcher test a
regression line to determine whether the line is a good fit of the data other than by
observing the fitted line plot in other word regression line fit through a scatter plot of the
data.
For designed regression model line Ŷ = a + βX , The value of the independent variable
FIIs Purchase X inserted in the regression model and a predicted value NIFTY (Y) is
obtained for each value. This NIFT (Y) predicated value compared to the actual value
NIFTY (Y) to determine how much error the equation of the regression line produced.
The predicted values are calculated by inserting an X value into the equation of the
regression model line and solving for Ŷ. Here when FIIs purchase X was 377.75 cr in the
year 2003,
Page 32
A PhD THESIS ON "ROLE OF FOREIGN INSTITUTIONAL INVESTORS IN INDIAN STOCK MARKET"
130 | P a g e
The value of X inserted in the regression model line
Ŷ = 815.75 + 1.38 X
Ŷ = 815.75 + 1.38 (377.75)
Ŷ = 1337.74 for the year 2003
As exhibit in 4th column of the above table 4.18, remain all year predicted value
calculated as per above steps. The predicted values are calculated by inserting an X
values in to equation. Each predicted value NIFTY Y value is subtracted from the actual
Y to determine the error, for the year 2003 residual value was -104.03 (1337.74 –
1233.71). Each different between the actual values and the predicated Y values is the
error of the regression line at a given point is referred to as residual value which given in
the 5th column. Residual gives the design of how well the regression line fits the historical
data points.
The largest positive residual for the NIFTY was 998.66 in the year 2011 and smallest
negative residual was -21.20 in the year 2006. The regression line produces an error of
998.66 point NIFTY when there are 2554.98 cr. FIIs purchase in the year 2011. There
was smallest error-21.20 when FIIs purchase 1857.79 cr. in the year 2006. This result
presents the best and worst, bull or bear market performance for the residuals. Other
residuals determine different NIFTY market trend due to change in FIIs purchase for
remaining time period.
The residual versus the fitted values diagram indicates that the residuals appear to
increase as FIIs purchase X increases, indicating a potential problem with vary.
Page 33
A PhD THESIS ON "ROLE OF FOREIGN INSTITUTIONAL INVESTORS IN INDIAN STOCK MARKET"
131 | P a g e
Chart 4.9 Scatter Plots Of FIIs Purchases And NIFTY50
F-test: Test to determine the overall significance of the regression model
This F-test establishes weather regression coefficients are different from zero. Regression
provides only one predictor and only one regression coefficient test. The regression
coefficient is the slop of the regression line, the F-test for overall significance is testing
the same thing as the t-test in regression. The hypotheses being tested in simple
regression by the F-test for overall significance are as follow:
Null H0 : β = 0
Alt H1 : β ≠ 0
OR
Null H0 : there is at least one of the regression coefficients is zero
Alt H1 : there is at least one of the regression coefficients is different from zero
Page 34
A PhD THESIS ON "ROLE OF FOREIGN INSTITUTIONAL INVESTORS IN INDIAN STOCK MARKET"
132 | P a g e
Table 4.19 F-test for regression coefficients of FIIs Purchase and NIFTY
df SS MS F Significance F
Regression 1 19086021.97 19086021.97 56.56 0.00001
Residual 8 2699610.72 337451.34
The above F-test table 4.19 shows the F-test for regression coefficients of FIIs Purchase
and NIFTY. The values of sum of squares (SS), degree of freedom (df), and mean squares
(MS) are obtained from the analysis of variance table, which is produced with other
regression statistics as standard output from statistical calculation, above shown table is F
test value for the NIFTY index. F-test table, the degree of freedom is equal to 1. Here
regression models have only one independent variable FIIs purchase for NIFTY, therefore
the degree of freedom error in regression analysis is n – 1 – 1 = n – 2.
The difference between F value = 56.56 and the value obtained by squaring the t-value
(7.51)2 = 56.53 is (0.03) incurred due to error. The probability of obtaining an F value this
large by chance if there is no regression prediction in the regression model is 0.00001
according to F test. The value of F for this is 56.56 with a p-value 0.00001 which is not
significant at 5% level (0.00001< 0.05). This output value means it is highly unlikely that
the population slope is zero and there is no prediction due to regression from this model
given the sample statics obtained. Hence, it is highly likely that this regression molded
adds significant predictability of the dependent variable.
Therefore, the null hypothesis would not be rejected for the overall test of significance.
None of the regression coefficients are significantly different from zero, and no
significant predictability of the volatility of NIFTY by the FIIs Purchases given from this
regression model.
Regression model line: Ŷ = 815.75 + 1.38 X
Page 35
A PhD THESIS ON "ROLE OF FOREIGN INSTITUTIONAL INVESTORS IN INDIAN STOCK MARKET"
133 | P a g e
A slope of 1.38 indicates that there is a positive upward trend of NIFTY and FIIs
Purchases over this period year 2003 to 2012 at a 1.38cr. The NIFTY Y intercept of
815.75 represents what the regression model trend line would estimate the NIFTY to have
been in 10 years.
t-test for significant predictive variables FIIs on NIFTY
This t- test is determined how well a regression model fits the data. Here researcher make
a decision that it is not worth the effort to develop a linear regression model to forecast
NIFTY (Y) from FIIs investments. An alternative approach might be to average the
NIFTY (Y) values and use Ŷ as the predictor of y for all values of FIIs X values.
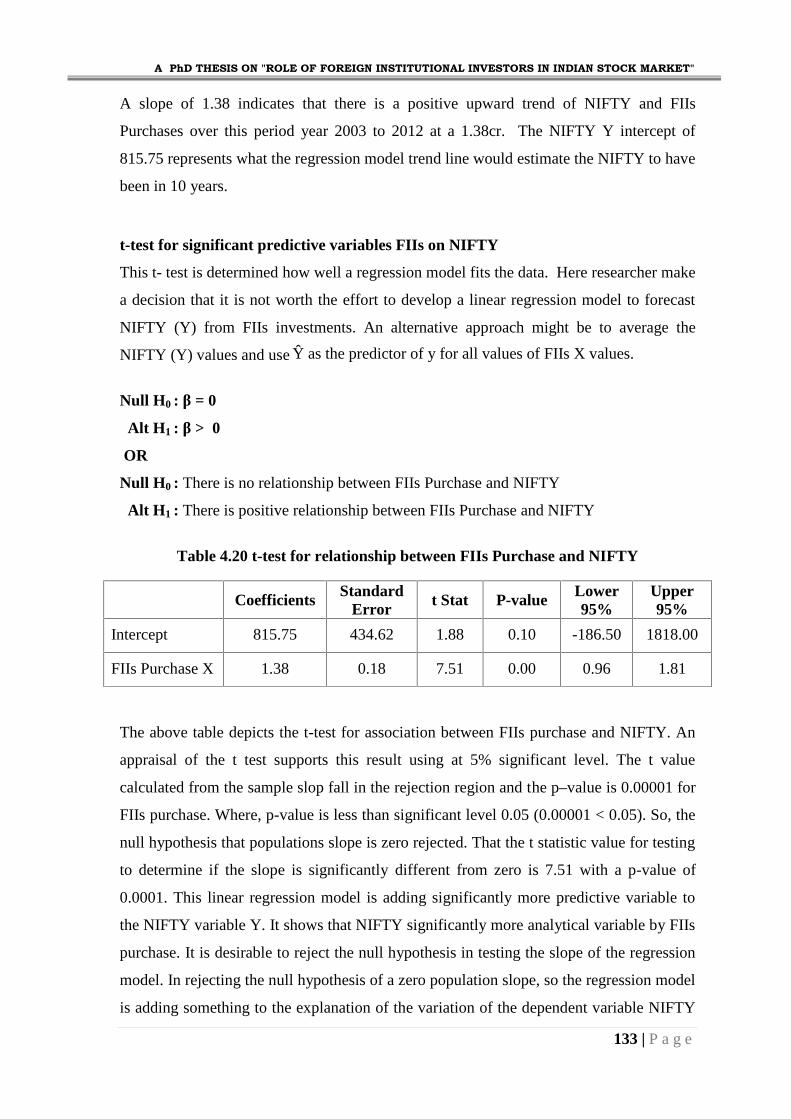
Null H0 : β = 0
Alt H1 : β > 0
OR
Null H0 : There is no relationship between FIIs Purchase and NIFTY
Alt H1 : There is positive relationship between FIIs Purchase and NIFTY
Table 4.20 t-test for relationship between FIIs Purchase and NIFTY
Coefficients StandardError
t Stat P-value Lower95%
Upper95%
Intercept 815.75 434.62 1.88 0.10 -186.50 1818.00
FIIs Purchase X 1.38 0.18 7.51 0.00 0.96 1.81
The above table depicts the t-test for association between FIIs purchase and NIFTY. An
appraisal of the t test supports this result using at 5% significant level. The t value
calculated from the sample slop fall in the rejection region and the p–value is 0.00001 for
FIIs purchase. Where, p-value is less than significant level 0.05 (0.00001 < 0.05). So, the
null hypothesis that populations slope is zero rejected. That the t statistic value for testing
to determine if the slope is significantly different from zero is 7.51 with a p-value of
0.0001. This linear regression model is adding significantly more predictive variable to
the NIFTY variable Y. It shows that NIFTY significantly more analytical variable by FIIs
purchase. It is desirable to reject the null hypothesis in testing the slope of the regression
model. In rejecting the null hypothesis of a zero population slope, so the regression model
is adding something to the explanation of the variation of the dependent variable NIFTY
Page 36
A PhD THESIS ON "ROLE OF FOREIGN INSTITUTIONAL INVESTORS IN INDIAN STOCK MARKET"
134 | P a g e
that the average value of Y model does not failure to reject the null hypothesis in this test
causes the researcher to conclude that the regression model has no predictability of the
dependent variable NIFTY, and the model, therefore, has little use. The standard error of
the model Se = 580.91 designate that if the error terms are approximately normally
distributed, about 88% of the predicted NIFTY index fall with +580.91 points to -580.91
points.
4.5.2 Regression model residual analysis for NIFTY and FIIs sales
The regression analysis predicts the NIFTY index owing to FIIs sales trend. The
regression equation of the regression model is presented in relationship between NIFTY
and FIIs sales
Table 4.21 Coefficient of correlation and determination for NIFTY and FIIs Sales
Coefficient correlation 0.90
R Square 0.80
Adjusted R Square 0.78
Standard Error 732.28
Observations 10
The above regression models determinant use for the measures the effect of FIIs sales on
NIFTY. There is high degree of optimistic contribution among the NIFTY and FIIs sales
which expressive by coefficient correlation r = 0.90. R2 the coefficient of determination is
0.80 in percentage 80% of the instability in the NIFTY index due to the deviation in the
FIIs sales. This result shows that 0.20 in other term 20% of the change due to the
additional factors other than FIIs purchase. The difference between R2 and the adjusted R2
tends to increase as non significant independent variables are added to the regression
model. The % difference between R2 = 0.80 with the adjusted R= 0.78 point out that the
shrink the overall proportion of variation of the dependent variable accounted by the
independent variables.
Page 37
A PhD THESIS ON "ROLE OF FOREIGN INSTITUTIONAL INVESTORS IN INDIAN STOCK MARKET"
135 | P a g e
In short, It can be summarised that increase in change of FIIs sales trend which increase
the NIFTY. Here, standard error 732.28 point toward a massive amount of variation or
scatter around the regression line (see figure). NIFTY index variability is fall with
+732.28 to -732.28 points. Distributions of sample mean that wide variation is a superior
estimator of the population mean than a distribution of sample mean.
Regression model line
Ŷ = α +βx
Ŷ = 1140.42 + 1.36 X
Table 4.22 Regression residuals analysis for NIFTY and FIIs sales
Year FIIs Sales X NIFTY Y Predicted Y ResidualsStandardResiduals
2003 255.08 1233.71 1487.85 -254.15 -0.37
2004 580.74 1755.87 1931.44 -175.57 -0.25
2005 948.48 2268.91 2432.33 -163.42 -0.24
2006 1721.38 3357.09 3485.07 -127.98 -0.19
2007 3034.00 4571.29 5272.97 -701.67 -1.02
2008 3171.35 4339.11 5460.05 -1120.94 -1.62
2009 2243.31 4113.96 4195.98 -82.02 -0.12
2010 2577.69 5461.12 4651.43 809.69 1.17
2011 2570.29 5335.91 4641.36 694.55 1.01
2012 2262.60 5343.77 4222.27 1121.50 1.62
Page 38
A PhD THESIS ON "ROLE OF FOREIGN INSTITUTIONAL INVESTORS IN INDIAN STOCK MARKET"
136 | P a g e
The above table 4.22 regression residual analysis for evaluates variability of NIFTY
index owning to FIIs sale. The above table shows the trend of FIIs sales and NIFTY index
for the year 2003 to 2012. Here, researcher compared the trend of FIIs sales and NIFTY
index for the measure the cause and effect relationship between FIIs sales and NIFTY
index. Here researcher test a regression line to determine whether the line is a good fit of
the data other than by observing the fitted line plot in other word regression line fit
through a scatter plot of the data.
The appreciated of the independent variable FIIs sales X inserted in the regression model
Ŷ = 1140.42 + 1.36 X
As per above regression line, predicted value NIFTY Y is obtained for each value for year
2003 to year 2012. This NIFTY predicated value compared to the actual value NIFTY Y
to determine how much error the equation of the regression line produced. Each different
between the actual values and the predicated Y values is the error of the regression line at
a given point is referred to as residual value which given in the 5th column. Residual gives
the idea of how well the regression line fits the historical data points.
The regression model fits these particular data NIFTY index and FIIs sales well for the
year 2006 and 2009, as indicated by residuals of -127.98 and -82.02 at standard residual -
0.05 and -0.13 NIFTY, there were extensive residual values 1121.50 in the year 2012
which shows enormous difference between actual value and predicated value, for
remaining years the residuals are relatively large, indicating that the regression model
does not fit the data for these years. The residuals versus the fitted values graph indicate
that the residuals seem to increase as FIIs sales X increases, indicating a potential
problem with different variables.
Page 39
A PhD THESIS ON "ROLE OF FOREIGN INSTITUTIONAL INVESTORS IN INDIAN STOCK MARKET"
137 | P a g e
Chart 4.10 Scatter Plots Of FIIs Sales And NIFTY50
F-test : Test to determine the overall significance of the regression model
This F-test determines weather regression coefficients are different from zero. Regression
provides only one predictor and only one regression coefficient test. The regression
coefficient is the slop of the regression line, the F-test for overall significance is testing
the same thing as the t-test in regression. The hypotheses being tested in simple
regression by the F-test for overall significance are as follow:
Null H0 : β = 0
Alt H1 : β ≠ 0
OR
Null H0 : there is at least one of the regression coefficients is zero
Alt H1 : there is at least one of the regression coefficients is different from zero
Page 40
A PhD THESIS ON "ROLE OF FOREIGN INSTITUTIONAL INVESTORS IN INDIAN STOCK MARKET"
138 | P a g e
Table 4.23 F-test for regression coefficients of FIIs sales and NIFTY
df SS MS F Significance F
Regression 1 17495778.40 17495778.40 32.63 0.00001
Residual 8 4289854.28 536231.79
The above table shows the F-test for regression coefficients of FIIs Sales and NIFTY. The
values of sum of squares (SS), degree of freedom (df), and mean squares (MS) are
obtained from the analysis of variance table, which is produced with other egression
statistics as standard output from statistical calculation, above shown table is F test value
for the NIFTY index. F-test table, the degree of freedom is equal to 1. Here regression
models have only one independent variable FIIs purchase for NIFTY, therefore the
degree of freedom error in regression analysis is n – 1 – 1 = n – 2.
Here, t-test value and F-test value compared for the result. The small gap between F value
= 32.63 and the value obtained by squaring the t-value (5.71)2 = 32.60 is (0.03) incurred
due to error. The probability of obtaining an F value this large by chance if there is no
regression prediction in the regression model is 0.00001 according to F test. The value of
F for this is 32.63 with a p-value 0.00001 which is not significant at 5% level (0.00001<
0.05). This output value means it is highly unlikely that the population slope is zero and
there is no prediction due to regression from this model given the sample statics obtained.
Hence, it is highly likely that this regression molded adds significant predictability of the
dependent variable.
Accordingly, the null hypothesis would not be rejected for the overall test of significance.
None of the regression coefficients are significantly different from zero, and no
significant predictability of the volatility of NIFTY by the FIIs sales given from this
regression model.
Regression model line: Ŷ = 1140.42 + 1.36 X
Page 41
A PhD THESIS ON "ROLE OF FOREIGN INSTITUTIONAL INVESTORS IN INDIAN STOCK MARKET"
139 | P a g e
As above regression model line, A slope of coefficient 1.36 indicates that there is a
positive rising tendency of NIFTY and FIIs sales over this period year 2003 to 2012 at a
1.36cr. The NIFTY Y cut off of 1140.42 represents what the regression model tendency
line would estimate the NIFTY to have been in 10 years.
t-test for significant predictive variables FIIs investments activities on NIFTY
This test is determined how well a regression model fits the data. Here researcher make a
decision that it is not worth the effort to develop a linear regression model to forecast
NIFTY (Y) from FIIs investments. An alternative approach might be to average the
NIFTY (Y) values and use Ŷ as the predictor of y for all values of FIIs X values.
Null H0 : β = 0
Alt H1 : β > 0
OR
Null H0 : There is no relationship between FIIs sales and NIFTY
Alt H1 : There is positive relationship between FIIs sales and NIFTY
Table 4.24 t-test for relationship between FIIs Sales and NIFTY
CoefficientsStandard
Error t Stat P-valueLower95%
Upper95%
Intercept 1140.42 516.58 2.21 0.06 -50.82 2331.66
FIIs sales X 1.36 0.24 5.71 0.00 0.81 1.91
An examination of the t test supports this result using at 5% significant level. The t value
calculated from the sample slop fall in the rejection region and the p –value is 0.0001 for
FIIs purchase. Where, p-value is less than significant level 0.05 (0.00001 < 0.05). So, the
null hypothesis that populations slope is zero rejected. That the t statistic value for testing
to determine if the slope is significantly different from zero is 8.02 with a p-value of
0.00001. This linear regression model is adding significantly more predictive variable to
the NIFTY variable Y. It shows that NIFTY index significantly more analytical variable
by FIIs sales. It is desirable to reject the null hypothesis in testing the slope of the
regression model. In rejecting the null hypothesis of a zero population slope, so the
Page 42
A PhD THESIS ON "ROLE OF FOREIGN INSTITUTIONAL INVESTORS IN INDIAN STOCK MARKET"
140 | P a g e
regression model is adding something to the explanation of the variation of the dependent
variable NIFTY that the average value of Y model does not failure to reject the null
hypothesis in this test causes the researcher to conclude that the regression model has no
predictability of the dependent variable NIFTY, and the model, therefore, has little use.
The standard error of the model Se = 732.28 indicate that if the error terms are
approximately normally distributed, about 89% of the predicted NIFTY index fall with
+732.28 to -732.28.
4.5.3 Regression model residual analysis for NIFTY and FIIs Net investments
The regression analysis predicts the NIFTY due to FIIs net investments. The regression
equation of the regression model is presented in relationship between NIFTY and FIIs net
investment.
Table 4.25
Coefficient of correlation and determination for NIFTY and FIIs Net Investments
Co efficient correlation 0.31
R Square 0.09
Adjusted R Square -0.02
Standard Error 1571.34
Observations 10
FIIs net investments stumpy influence on NIFTY 50. It can be defines on the base of r
and R2. R2 the coefficient of determination is 0.09 in percentage 9% of the small wavering
in the NIFTY 50 index due to the variation in the FIIs sales. This result shows that 0.91 or
91% senses move FIIs specific activities and external factors. However, the coefficient of
correlation, r = 0.31 shows positive correlation between NIFTY 50 and FIIs net
investment. But there is not superior association among them. A evaluation of R2 = 0.09
with the adjusted R = -0.03 shows that the adjusted R2 reduced the overall proportion of
variation of the dependent variable accounted for by the independent variables by a factor
of 0.12 by 12%. The loop between R2 and the adjusted R2 tend to rise as non significant
independent variables are supplementary to the regression model. Standard error 1531.34
Page 43
A PhD THESIS ON "ROLE OF FOREIGN INSTITUTIONAL INVESTORS IN INDIAN STOCK MARKET"
141 | P a g e
states a large amount of disparity or scatter around the regression line as displayed in
chart 4.11.
Table 4.26 Regression residuals analysis for NIFTY and FIIs Net Investments
Year FIIs Net X NIFTY Y Predicted Y ResidualsStandardResiduals
2003 122.68 1233.71 3602.65 -2368.94 -1.60
2004 154.79 1755.87 3667.29 -1911.42 -1.29
2005 186.97 2268.91 3732.06 -1463.15 -0.99
2006 133.11 3357.09 3623.65 -266.55 -0.18
2007 293.14 4571.29 3945.76 625.53 0.42
2008 -217.43 4339.11 2918.08 1421.04 0.96
2009 354.22 4113.96 4068.71 45.25 0.03
2010 571.13 5461.12 4505.30 955.82 0.65
2011 -15.30 5335.91 3324.91 2011.00 1.36
2012 515.01 5343.77 4392.35 951.43 0.64
The above constructed residual analysis table 4.26 shows that average NIFTY index and
average FIIs Net investment trend for the years 2003 to 2012. Here researcher has used
regression model for the measure the cause and effect relationship between FIIs Net
investments and NIFTY index. At this occasion researcher investigate a regression line to
find out whether the line is a good fit of the data excluding by observing the fitted line
plot in additional remark, regression line fit through a scatter plot of the data.
The value of the independent variable FIIs net investment X inserted in the regression
model and a predicted value NIFTY Y is obtained for each value. This NIFTY predicated
value compared to the actual value NIFTY Y to determine how much error the equation
of the regression line produced. All dissimilar between the genuine values and the
predicated Y values is the error of the regression line at a given point is referred to as
residual value which
Page 44
A PhD THESIS ON "ROLE OF FOREIGN INSTITUTIONAL INVESTORS IN INDIAN STOCK MARKET"
142 | P a g e
given in the 5th column. Residual gives the design of how well the regression line fits the
historical data points.
The regression model fits these particular data NIFTY index and FIIs Net investments
well for the year 2006 and 2009, as indicated by residuals of -266.55 and 45.25 NIFTY,
evenly, for remaining years the residuals are comparatively huge, indicating that the
regression model does not fit the data for these years. The residuals versus the fitted
values graph indicate that the residuals appear to increase as FIIs net investment X
increases, indicating a possible problem with vary variables.
Chart 4.11 Scatter Plots Of FIIs Net Investments And NIFTY50
F-test: Test to determine the overall significance of the regression model
This F-test determines a weather regression coefficient is different from zero. Regression
provides only one predictor and only one regression coefficient test. The regression
coefficient is the slop of the regression line, the F-test for overall significance is testing
the same thing as the t-test in regression. The hypotheses being tested in simple
regression by the F-test for overall significance are as follow:
Page 45
A PhD THESIS ON "ROLE OF FOREIGN INSTITUTIONAL INVESTORS IN INDIAN STOCK MARKET"
143 | P a g e
Null H0 : β = 0
Alt H1 : β ≠ 0
OR
Null H0 : there is at least one of the regression coefficients is zero
Alt H1 : there is at least one of the regression coefficients is different from zero
Table 4.27 F-test for regression coefficients of FIIs net and NIFTY
df SS MS F Significance F
Regression 1 2032744.09 2032744.09 0.81 0.39
Residual 8 19752888.59 2469111.07
The above F-test table 4.27 shows the F-test for regression coefficients of FIIs net
investments and NIFTY. The values of sum of squares (SS), degree of freedom (df), and
mean squares (MS) are obtained from the analysis of variance table, which is produced
with other egression statistics as standard output from statistical calculation, above shown
table is F test value for the NIFTY index. F-test table, the degree of freedom is equal to
1. Here regression models have only one independent variable FIIs net investments for
NIFTY, therefore the degree of freedom error in regression analysis is n – 1 – 1 = n – 2.
The difference between F value = 0.81 and the value obtained by squaring the t-value
(0.91)2 = 0.83 is (0.02) incurred due to error. The value of F for this is 0.81with a p-value
0.00 which is significant at 5% level (0.40 > 0.05). This output value means that the
population slope is zero and there is prediction due to regression from this model given
the sample statics obtained.
Thus, the null hypothesis would be accepted for the overall test of significance. The
regression coefficients are significantly similar to zero, and there is significant
predictability of the volatility of NIFTY Index by the FIIs net investments given from this
regression model.
Regression model line : Ŷ = 3355.72 + 2.01X
Page 46
A PhD THESIS ON "ROLE OF FOREIGN INSTITUTIONAL INVESTORS IN INDIAN STOCK MARKET"
144 | P a g e
A slope of 2.01 indicates that there is a positive upward trend of NIFTY and FIIs net over
this period year 2003 to 2012 at a 2.01cr. The Y intercept of 3355.72 represents what the
regression model trend line would estimate the NIFTY to have been in 10 years.
t-test for significant predictive variables FIIs net investments on NIFTY
This t- test is determined how well a regression model fits the data. Here researcher
decides that it is not worth the effort to develop a linear regression model to predict
NIFTY (Y) from FIIs investments. An alternative approach might be to average the
NIFTY (Y) values and use Ŷ as the predictor of y for all values of FIIs X values.
Null H0 : β = 0
Alt H1 : β > 0
OR
Null H0 : There is no relationship between FIIs net and NIFTY
Alt H1 : There is positive relationship between FIIs net and NIFTY
Table 4.28 t-test for relationship between FIIs Net investments and NIFTY
CoefficientsStandard
Errort Stat P-value
Lower95%
Upper95%
Intercept 3355.72 680.88 4.93 0.00 1785.62 4925.82
FIIs net 2.01 2.22 0.91 0.39 -3.10 7.13
The above table depicts the t-test for association between FIIs net investments and
NIFTY. An evaluation of the t test supports this result using at 5% significant level.
Result tested on the base of comparison with P-value and 5% significant level.
Consequently, FIIs net investments has p-value by 0.39 which is greater than significant
level 0.05 (0.40 > 0.05) as result null hypothesis accepted. The null hypothesis that
population slope is zero accepted show s that FIIs net investments would not be predictive
variables for NIFTY variable Y. FIIs net investments constituted by FIIs sales and FIIs
purchase, so as per the above test result it disclose that FIIs sales and FIIs purchase has
extrapolative variable to the NIFTY variable Y rather than FIIs net. The standard error of
the model Se = 1571.34 indicate that if the error terms are approximately normally
distributed, about 89% of the predicted NIFTY index fall with +1571.34 to -1571.34.
Page 47
A PhD THESIS ON "ROLE OF FOREIGN INSTITUTIONAL INVESTORS IN INDIAN STOCK MARKET"
145 | P a g e
4.6 Correlation Co-efficient Matrix between FIIs investments activities: FIIspurchases FIIs sales, FIIs net investments and BSE SENSEX, NIFTY50
Correlation co-efficient computed to understand the relationship between FII activities;
FIIs purchases, FIIs sales, FIIs net investments and performance of Indian stock market
NIFTY & NIFTY50. The correlation matrix is presented in following Table:
Table 4.29
Correlation Co-efficient Matrix between FIIs investments, BSE SENSEX, NIFTY50
As per the above table correlation co-efficient matrix, shows that FII inflows and the BSE
SENSEX states a significant positive correlation. It was further observed that there is
good co-movement between FII inflows and volatility of stock market BSE SENSEX &
NIFTY50. Huge inflows from FIIs make the surplus in the Indian stock market.
Furthermore, there was good co-movement between the BSE SENSEX and FIIs sales &
FIIs purchases. In the contrary, BSE SENSEX and FIIs net investments have moderate
correlation with each other. Moreover, there was high degree of correlation among the
FIIs sales and FIIs purchases. FIIs net investments have sensible correlation with
performance of NIFTY50. So analysis of correlation of coefficient matrix demonstrates
performance of Indian stock market extremely associated with the FIIs investments
activities.
Consequently, this analysis shows that dependent variables Indian stock indexes BSE
SENSEX and NIFTY50 and in independent variables FIIs investments employed in this
model correlation of coefficient matrix can provide unbiased correlation and correct
measure on dependent variables.
Variables BSESENSEX
NIFTY50 Purchase Sales NetInvestments
BSE SENSEX 1 - - - -
NIFTY50 0.9995 1 - - -
Purchase 0.9569 0.9514 1 - -
Sales 0.9274 0.9204 0.98098 1 -
Net Investments 0.3756 0.38175 0.33364 0.14443 1
Page 48
A PhD THESIS ON "ROLE OF FOREIGN INSTITUTIONAL INVESTORS IN INDIAN STOCK MARKET"
146 | P a g e
4.7 Conclusion
This research segment deals with investigation and understanding for FIIs investments
activities and performance of Indian stock index BSE SENSEX & NIFTY50. There are
different kind of statistical tools used for analysis the data and interpret for the proper
analysis study objectives. Coefficient correlation, coefficient determination R2 has used
for effects and association between Indian stock indexes and FIIs investments. These
tools used for find propositional effects and degree of correlation between BSE SENSEX,
NIFTY50 and FIIs investments activities; purchase, sales, net for the year 2003 to year
2012. Researcher has used regression residual analysis model for wrap the objective that
to come across effect of FIIs investments on the Indian stock market. Researcher has
applied t-test for significant predictive variables FIIs activities on Indian stock index and
F-test to determine the overall significance of the regression model. At last researcher has
employed correlation co-efficient matrix for FIIs activities and performance of BSE
SENSEX and NIFTY50.
Accordingly to the analysis, it shows that FIIs activities exceedingly effect of
performance of BSE SENSEX and NIFTY50. FIIs sales and FIIs purchases trend lead to
bull and bear trend toward Indian stock market. FIIs investments are the predictable
variables for the Indian stock index. Both variables have positive association relationship.
The profound result of this research study defined in the next section regarding
fundamental effect of FIIs investments activities on Indian stock market.