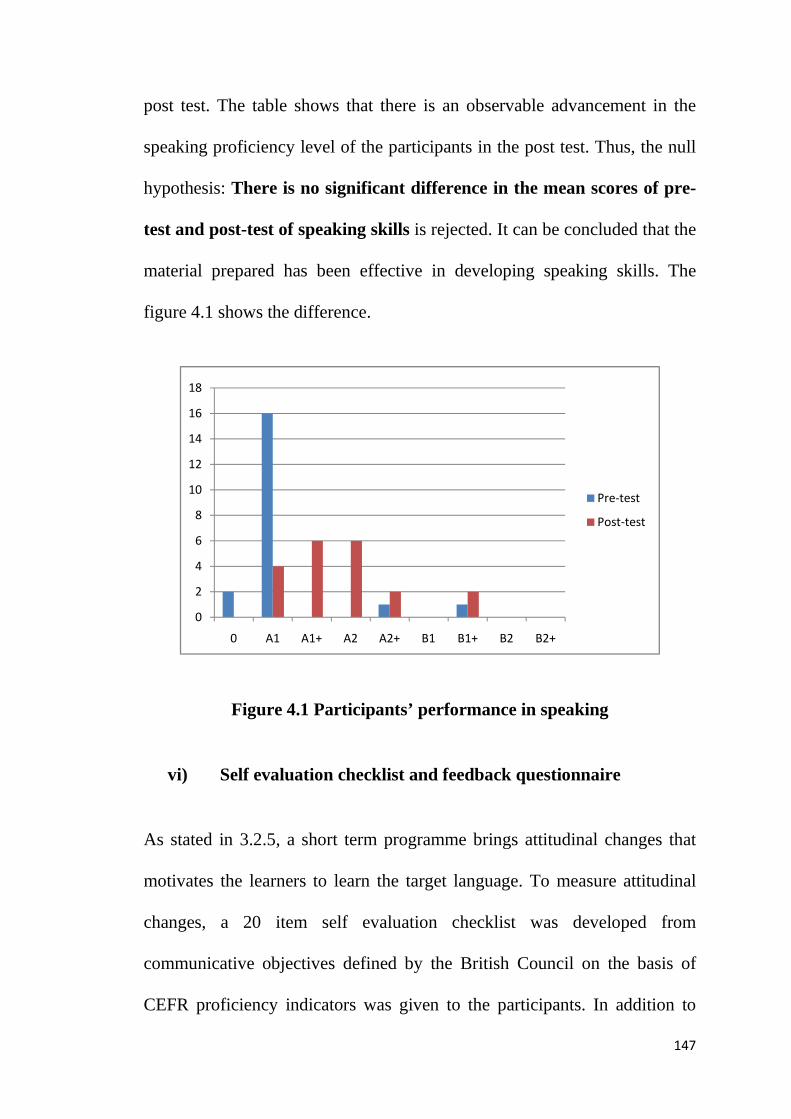
128 CHAPTER IV DATA ANALYSIS AND INTERPRETATION 4.0 Introduction Sheligar and Shohamy (1989) state that “data analysis refers to sifting, organizing, summarizing and synthesizing the data so as to arrive at the results and conclusions of the research” (p.201). This chapter presents detailed analyses of the data collected through different tools followed by interpretation of the same. The research questions for the study are reiterated in the form of the hypotheses. Quantitative results from the data collected by means of the tests are examined through different statistical procedures. In addition to the quantitative analysis and a descriptive and qualitative analysis is presented with the results of the speaking skills and of the feedback on the programme. 4.1 Hypotheses The study aimed at checking the effect of a multimedia package to enhance communication skills of the students at the UG level in the digital language laboratory.
Transcript
128
CHAPTER IV
DATA ANALYSIS AND INTERPRETATION
4.0 Introduction
Sheligar and Shohamy (1989) state that “data analysis refers to sifting,
organizing, summarizing and synthesizing the data so as to arrive at the
results and conclusions of the research” (p.201). This chapter presents
detailed analyses of the data collected through different tools followed by
interpretation of the same. The research questions for the study are reiterated
in the form of the hypotheses. Quantitative results from the data collected by
means of the tests are examined through different statistical procedures. In
addition to the quantitative analysis and a descriptive and qualitative
analysis is presented with the results of the speaking skills and of the
feedback on the programme.
4.1 Hypotheses
The study aimed at checking the effect of a multimedia package to enhance
communication skills of the students at the UG level in the digital language
laboratory.
129
The following null hypothesis guided the research study.
i. There will be no significant difference in the overall mean scores of the
pre-test and post- test of the students.
ii. There will be no significant difference in the mean scores of the pre-test
and post-test of the students in terms of gender.
iii. There will be no significant difference in the mean scores of the pre-test
and post-test of the students in terms of the discipline opted for at
higher secondary level.
iv. There will be no significant difference in the mean scores of the pre-test
and post-test of the students in terms of achievement in English at 12th
standard level.
v. There will be no significant difference in the mean scores of the pre-test
and post-test of the students in terms of SES.
vi. There will be no significant difference in the mean scores of the pre-test
and post test of the students in various language skills covered in the
programme.
4.2 Pre-test and post-test scores
In accordance with the requirement of the study, one-group pre-test, post-
test experimental research design was adopted as already explained in
Section 3.1. The pre-test was administered at the beginning of the
experiment as a regulatory means to control prior differences among
130
participants followed by the treatment and the post-test towards the end of
the experiment to measure the effectiveness of the treatment, that is, the new
materials. The statistical procedures of T-test were used to evaluate the
effectiveness of the treatment offered to the participants as part of the
experiment.
4.2.1 Descriptive analysis for overall pre-test and post-test scores
Before applying parametric test, the data were analyzed using descriptive
statistics to get the initial insights for further data analysis procedures. The
table 4.1 shows the initial figures used to establish need for the T-test.
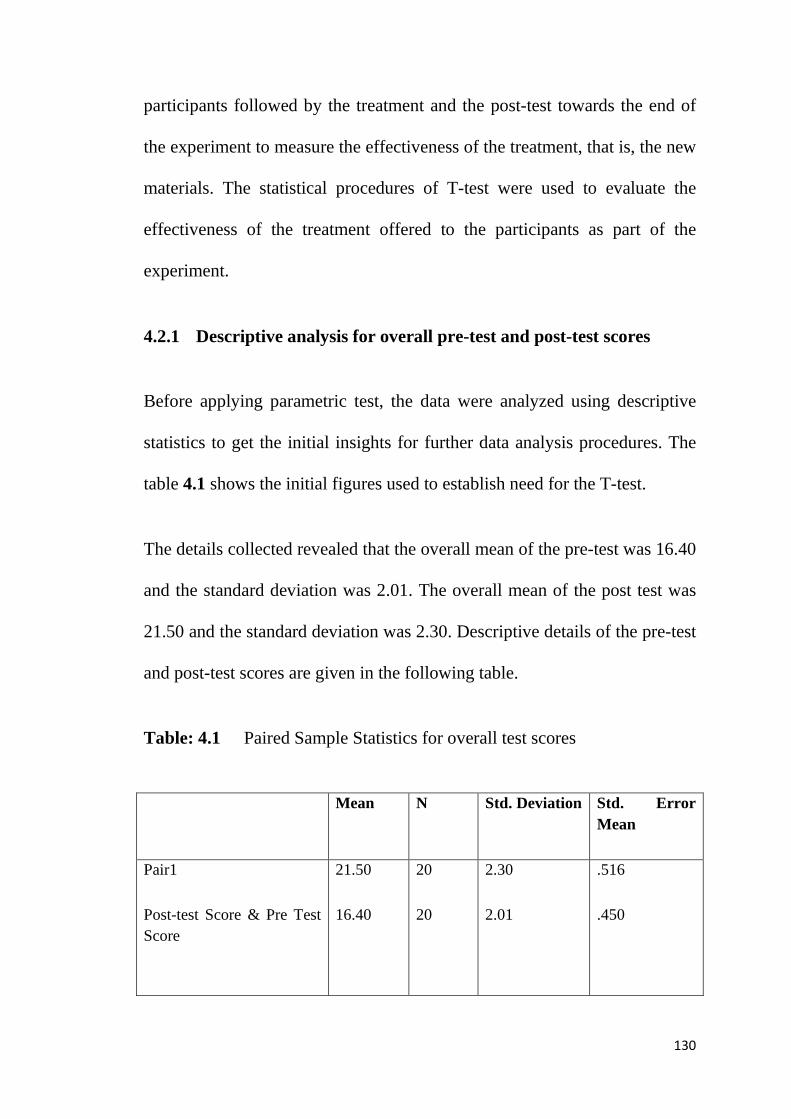
The details collected revealed that the overall mean of the pre-test was 16.40
and the standard deviation was 2.01. The overall mean of the post test was
21.50 and the standard deviation was 2.30. Descriptive details of the pre-test
and post-test scores are given in the following table.
Table: 4.1 Paired Sample Statistics for overall test scores
Mean N Std. Deviation Std. Error Mean
Pair1
Post-test Score & Pre Test Score
21.50
16.40
20
20
2.30
2.01
.516
.450
131
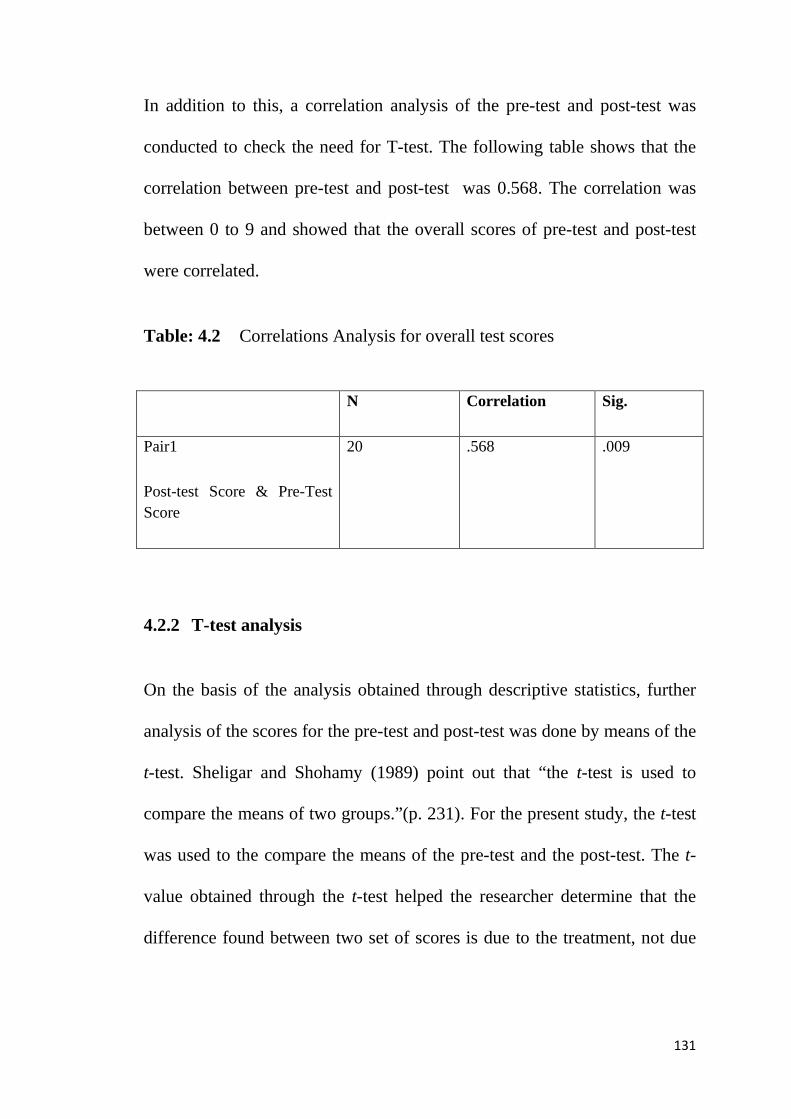
In addition to this, a correlation analysis of the pre-test and post-test was
conducted to check the need for T-test. The following table shows that the
correlation between pre-test and post-test was 0.568. The correlation was
between 0 to 9 and showed that the overall scores of pre-test and post-test
were correlated.
Table: 4.2 Correlations Analysis for overall test scores
N Correlation Sig.
Pair1
Post-test Score & Pre-Test Score
20 .568 .009
4.2.2 T-test analysis
On the basis of the analysis obtained through descriptive statistics, further
analysis of the scores for the pre-test and post-test was done by means of the
t-test. Sheligar and Shohamy (1989) point out that “the t-test is used to
compare the means of two groups.”(p. 231). For the present study, the t-test
was used to the compare the means of the pre-test and the post-test. The t-
value obtained through the t-test helped the researcher determine that the
difference found between two set of scores is due to the treatment, not due
132
to chance. For the current study, the t-test analysis was conducted for the
first hypothesis set out in the study.
Table: 4.3 Paired Samples Test of the overall score
Paired Differences
Mean Std. Deviation
Std. Error Mean
95% Confidence Interval of the Difference
Lower Upper t df Sig. (2-tailed)
Pair 1
Post-test Score-Pre-test Score
5.10 2.024 .452 4.15
6.05
11.271 19 .000
The T-value obtained from the analysis of the overall mean scores of the
pre-test and the post-test is 11.271. The mean of the paired difference is 5.10
with standard deviation 2.024. The details also reveal that the P-value or
value of significance is 0.000, at the level of 0.05. The analysis shows that
there was a significant difference between the overall mean scores of the
pre-test and post-test at 5% level of significance rejecting the first null
hypothesis: There will be no significant difference in the mean scores of
the pre-test and post- test of the students. The significance at 5% level
also suggests that the difference in the mean scores of the pre-test and post-
133
test is due to the effect of the materials and the programme, not due to
chance.
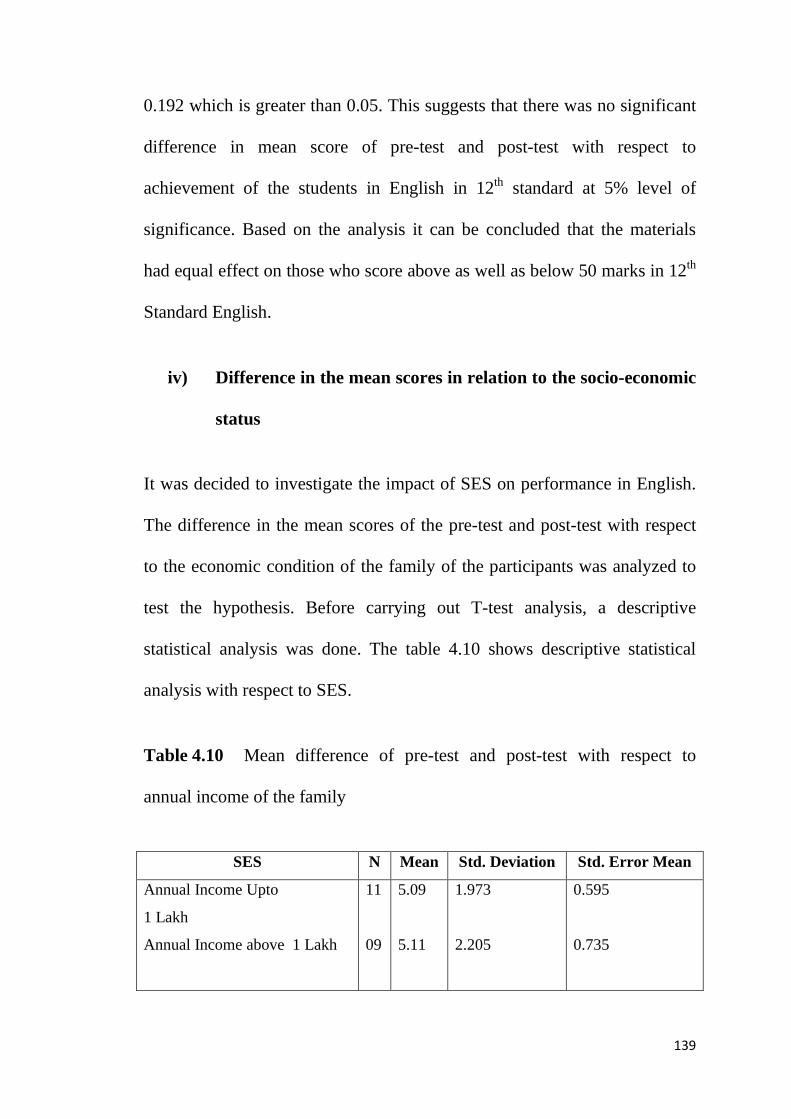
i) Difference in the mean scores in relation to gender
In order to get the difference between the pre-test and post-test in relation to
gender, Levene’s Test for Equality of Variances was applied. Before the
test a descriptive analysis of the Pre-test and post-test scores of Male and
Female participants was done to find out initial difference. The table ……
shows the group statistics of the subject according to their gender.
Table:4.4 Mean difference of post-test and pre-test in respect to Gender
Gender N Mean Std. Deviation Std. Error Mean
Female
Male
8
12
5.13
5.08
1.126
2.503
.398
.723
The table shows that the difference in the mean scores of the pre-test and the
post-test of Female participants is 5.13. The difference in the mean scores of
Male participants is 5.08. Following negligible initial difference, Levene’s
Test for Equality of Variances was applied to test the hypothesis. The table
4.5 shows the details of test.
134
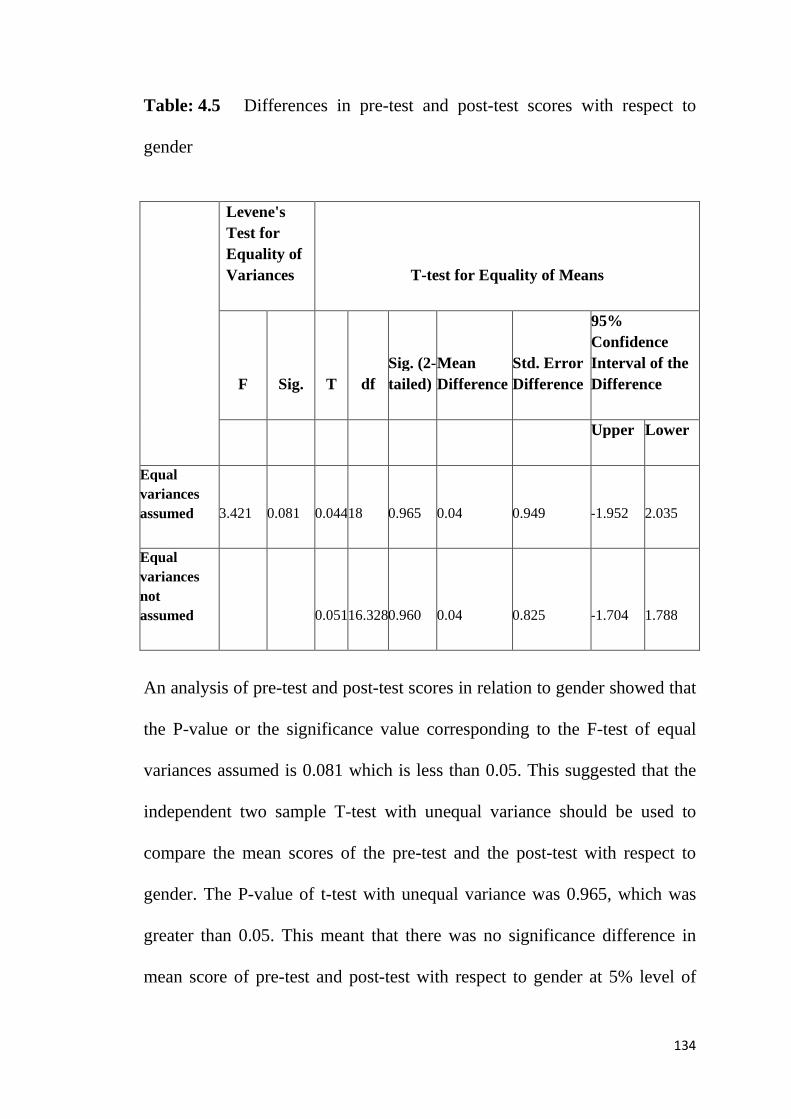
Table: 4.5 Differences in pre-test and post-test scores with respect to
gender
Levene's Test for Equality of Variances T-test for Equality of Means