Page 1
148
CHAPTER 5
DATA ANALYSIS AND INTERPRETATION
5.1 Introduction ........................................................................................................... 153
5.2 Demographics of Respondents ............................................................................. 153
5.2.1 Educational Status .......................................................................................... 153
5.2.2 Occupational Status ....................................................................................... 154
5.2.3 Income Status ................................................................................................. 155
5.2.4 Age Group ...................................................................................................... 155
5.2.5 Duration of Residence.................................................................................... 156
5.3 Preservation of Customs and Traditions ............................................................... 157
5.3.1 Cross Tabulation: Tradition and Number of Years of Residence .................. 158
5.3.2 Cross Tabulation: Tradition and Age ............................................................. 160
5.3.3 Comparative Contribution to Preservation of Traditions............................... 162
5.4 Growth of Infrastructure and Tourism .................................................................. 164
5.4.1 Comparative Contribution towards Infrastructure Growth ............................ 165
5.5 Local Income and Tourism ................................................................................... 167
5.5.1 Comparative Contribution towards Local Income ......................................... 169
5.6 Quality of Life and Tourism ................................................................................. 171
5.6.1 Comparative contribution to quality of life. .................................................. 172
5.7 Knowledge and Skill through Tourism ................................................................. 173
5.7.1 Comparative Contribution to Knowledge and Skill Acquisition ................... 175
5.8 Culture and Tourism Development ....................................................................... 175
5.8.1 Comparative Contribution towards Cultural Development ........................... 177
Page 2
149
5.9 Crime and Tourism ............................................................................................... 179
5.9.1 Perception on Reduction of Crimes ............................................................... 181
5.10 Ecological Preservation and Tourism ................................................................. 182
5.10.1 Comparative Contribution to Ecology and Environment ............................ 183
5.11 Residents‟ Psychological Engagement in Tourism Development ...................... 185
5.11.1 Psychological Engagement with Tourism ................................................... 186
5.11.2 Correlation Analysis: Psychological Engagement with Tourism ................ 188
5.11.3 Regression Analysis: Psychological Engagement with Tourism................. 189
5.12. Resident Participation in Kumbalangi Tourism Project .................................... 189
5.12.1 Resident Participation in Planning ............................................................... 190
5.12.2 Resident Participation in Implementation .................................................... 192
5.12.3 Comparison of Participation between Planning and Implementation .......... 193
5.12.4 Hypothesis Testing: Relationship between Planning and Implementation.. 194
5.13 Hypothesis Testing: Impact of Participation on Perception ............................... 196
5.13.1 Correlation Analysis: Participation and Perception ..................................... 196
5.13.2 Regression Analysis: Relationship between Participation and Implementation
................................................................................................................................. 197
5.13.3 Relationship between Participation and Perception: Conceptual Model ..... 201
5.14 Influence of Demographic Variables on Perception ........................................... 202
5.14. 1 Influence of Gender on Perception ............................................................. 203
5.14.2 Influence of Age on Perception ................................................................... 205
5.14.3 Influence of Income on Perception .............................................................. 207
5.14.4 Influence of Education on Perception .......................................................... 210
Page 3
150
5.14.5 Influence of Occupation on Perception........................................................ 213
5.14. 6 Influence of Duration of Stay on Perception .............................................. 215
5.15 Rural Tourism Influence on Development Management .................................... 217
5.16 Summary ............................................................................................................. 219
Endnotes and References ............................................................................................ 221
List of Tables
Table 5. 1 Educational status of respondents .................................................................. 153
Table 5. 2. Occupational status of respondents............................................................... 154
Table 5. 3 Income of the respondents ............................................................................. 155
Table 5. 4 Age group of respondents ............................................................................. 155
Table 5. 5 Years of residence of respondents ................................................................. 156
Table 5. 6 Preservation of traditions ............................................................................... 157
Table 5. 7 Relationship between tradition and years of stay .......................................... 159
Table 5. 8 Relationship between tradition and age ......................................................... 160
Table 5. 9 Comparative contributions to preservation of traditions ............................... 162
Table 5. 11 Infrastructure developments and tourism .................................................... 164
Table 5. 12 Relative contribution towards infrastructure growth ................................... 166
Table 5. 14 Growth of local income ............................................................................... 168
Table 5. 15 Comparative contribution to local income ................................................... 169
Table 5. 17 Quality of life due to tourism ....................................................................... 171
Table 5. 18 Comparative contribution of quality of life factors ..................................... 172
Table 5. 19 Knowledge enhancement through tourism .................................................. 174
Table 5. 20 Relative contribution to knowledge and skill .............................................. 175
Table 5. 21 Contribution to cultural development .......................................................... 176
Table 5. 22 Relative contribution towards culture ......................................................... 177
Table 5. 24 Growth of Tourism and Crimes ................................................................... 180
Table 5. 25 Perception on reduction of crimes ............................................................... 181
Page 4
151
Table 5. 27 Preservation of ecology and environment ................................................... 182
Table 5. 28 Preservation of ecology and environment ................................................... 182
Table 5. 29 Relative contributions to ecology and environment .................................... 183
Table 5. 31 Psychological engagement with tourism ..................................................... 185
Table 5. 32 Outlook towards tourism development ........................................................ 186
Table 5. 34 Correlation Analysis: Attitude factors ......................................................... 188
Table 5. 35 Regression Analysis: Psychological engagement factors ............................ 189
Table 5. 36 Resident participation in tourism planning .................................................. 190
Table 5. 37 Correlation Analysis – CV Model ............................................................... 191
Table 5. 38 Resident participation in implementation .................................................... 192
Table 5. 39 Correlation Analysis- Participation in Implementation ............................... 193
Table 5. 40 Comparison of participation between planning and implementation .......... 194
Table 5. 41 Correlation between participation and perception factors ........................... 197
Table 5. 42 Descriptive statistics of variables ................................................................ 198
Table 5. 43 Regression Analysis Values......................................................................... 199
Table 5. 45 Genderwise Group Statistics ........................................................................ 203
Table 5. 46 T-test results: Gender and perception .......................................................... 204
Table 5. 47 ANOVA results: Age and perception on DMV ........................................... 205
Table 5. 48 Tukey B and Scheffe results for age and local income ................................ 206
Table 5. 49 Tukey B and Scheffe results for age and ecology & environment .............. 207
Table 5. 50 ANOVA results: Income and perception on DMV .................................... 208
Table 5. 51 Tukey B and Scheffe results: Income and implementation ......................... 209
Table 5. 52 ANOVA results: Education and perception on DMV ................................. 210
Table 5. 53Tukey B and Scheffe results: Education and implementation ...................... 211
Table 5. 54 Tukey B and Scheffe results: Education and ecology & environment ........ 211
Table 5. 55 Tukey B and Scheffe results: Education and knowledge ............................ 212
Table 5. 56 ANOVA results: Occupation and perception on DMV .............................. 213
Table 5. 57 Tukey B and Scheffe results: Occupation and local income ....................... 214
Table 5. 58 Tukey B and Scheffe results: Occupation and quality of life ...................... 215
Table 5. 59ANOVA results: Duration stay and perception on DMV ............................. 216
Table 5. 60 Tourism impact on development ................................................................. 217
Page 5
152
List of Figures
Figure 5. 1. Comparative contributions to preservation of traditions ............................. 163
Figure 5. 2. Relative contribution to infrastructure growth ............................................ 166
Figure 5. 3. Comparative contribution to local income .................................................. 170
Figure 5. 4. Relative contribution towards culture ......................................................... 178
Figure 5. 5. Perception on different types of crimes ....................................................... 181
Figure 5. 6. Relative contributions to ecology and environment .................................... 184
Figure 5. 7. Psychological engagement with tourism development ............................... 187
Figure 5. 8. Relationship between participation and perception ..................................... 202
Figure 5. 9. Relationship between participation and perception ..................................... 218
Page 6
153
CHAPTER 5
DATA ANALYSIS AND INTERPRETATION
5.1 Introduction
This chapter analyses the situation existing in Kumbalangi village, after the
implementation of the endogenous rural tourism project. Data were collected with
the intention to evaluate the development management of the village through the
rural tourism project. Primary means of data collection was questionnaire survey.
Focus group interviews and participant observations were also conducted for
strengthening the research. Kumbalangi is the first village in India to complete the
implementation of the endogenous tourism project.
5.2 Demographics of Respondents
The participants for this study were identified from the voters list prepared by the
district election commission. Therefore all the respondents were adults and above
eighteen years of age. The updated list prepared by the authorities in 2008 was
taken for the study. The respondents were identified using stratified random
sampling. The tables and graphs below explain the socio-economic status of the
respondents. Socio-economic status of respondents are analysed under 5 headings.
5.2.1 Educational Status
Table 5. 1 Educational status of respondents
10th and
Below
HSS or
Equivalent
Bachelor
Degree
P G and
Above
Total
360 93 61 16 530
68% 18% 11% 3% 100%
Page 7
154
It is clear from the above table that majority of the respondents have their
education up to matriculation or below. The adult population in Kumbalangi have
only minimum education because in the past most of the villagers were engaged
in fishing, agriculture and allied activities. People had to go to either Alappuzha
or Cochin for higher studies. In order to travel to either place people had to
depend solely on ferries. The availability of ferries was also limited in the past.
Even today there is no higher educational institution in the island village. But at
present Kumbalangi is well connected to mainland with the construction of
bridges. This would certainly improve the possibility for higher education for
younger generation in the island.
5.2.2 Occupational Status
Table 5. 2. Occupational status of respondents
Frequency Percentage Education 22 4
Home Making 214 40
Daily Wages 251 47
Salaried 43 8
Total 530 100.0
The table above explain that the majority population in Kumbalangi village is
without regular employment. Only 8% of the respondents fall in the salaried class.
Majority of the population are daily workers. Their employment is often seasonal
and therefore they are either under employed or unemployed for many days in a
Page 8
155
year. The women are primarily engaged in homemaking without any source of
regular income.
5.2.3 Income Status
Table 5. 3 Income of the respondents
Income Level Frequency Percentage
Less than 2000 226 43
2000-4000 160 30
4001- 6000 68 13
6001 – 8000 15 3
8001 – 12000 6 1
Not declared 55 10
Total 530 100
The table above clearly demonstrate the income level of the respondents. More
than 70% of the people say that their income level is below Rs4000/- per month.
One of the major reasons for lower income is the lack of availability of
continuous jobs. Another important reason is the small size and fragmentation of
agricultural land holdings. Most of the farmers in the region have only less than
half an acre of land.
5.2.4 Age Group
Table 5. 4 Age group of respondents
Age Group Frequency Percentage
Below 22 30 6
22- 35 91 17
36-50 209 39
51- 65 141 27
Above 65 59 11
Total 530 100
Page 9
156
Most of the respondents belonged to 36- 50 age group. This is the group that can
actively contribute to tourism development in the region. Since respondents were
identified from the voters list none of the respondents are below 18 years of age.
5.2.5 Duration of Residence
Table 5. 5 Years of residence of respondents
Unlike in many peripheral areas attached to townships, even today the vast
majority of the inhabitants of Kumbalangi are natives. The presence of migrant
population at present is very low. This is an advantage for the island to develop its
own indigenous tourism products. The destination can certainly offer unpolluted
culture and traditions of a typical island village community in Kerala. One of the
reasons behind the presence of low migrant population in the region was the issue
of connectivity to the mainland. The construction of bridges as well as the
growth of tourism in the region will certainly bring the area to the limelight and
the in-migration is likely to be high in future.
Years of stay Frequency Percentage
10 and Below 84 16
11 to 25 123 23
26 to 50 209 39
Above 50 114 22
Total 530 100
Page 10
157
5.3 Preservation of Customs and Traditions
One of the major reasons behind objections to tourism development in rural
regions is the fear of either undervaluing the traditions and practices or their
commercialisation and commoditisation for the purpose of tourism. In many rural
tourism areas, the host community faces the threat of emulating the customs and
practices of tourists. All these happen when people fail to assign importance to
their own traditions.
Eight questions were asked to collect the perception of people regarding the
preservation of traditions. Responses were collected on a five point scale from
very important to no answer. The composite score of all the eight questions is
taken to present the table and the graph.
Table 5. 6 Preservation of traditions
Statistics Responses Frequency %
Mean 4.15 Very Important 117 22.2
Median 4 Important 358 67.8
Mode 4 Not Important 20 3.8
Std. D .466 Do not Know 33 6.3
Minimum 2.25
Maximum 5 Total 528 100
Page 11
158
The table above show that the attitude of people towards the preservation of
traditions and practices is very positive. Only 10% of respondents were either
neutral or negative. Most of the respondents said that traditions are important. In
many rural tourism destinations there are temptations for residents to imitate
tourists‟ behaviour and under estimate their own rich traditions.
To further under the nature of responses we look into the composite mode and
median for traditions. The mode and median are four and the mean value is 4.15
out of five, with a standard deviation of .466. That means lions majority of the
respondents is positively disposed to maintain their traditions and culture.
Kumbalangi implements endogenous rural tourism project for its development. In
order to develop unique and authentic, nature based tourism projects with
community participation, faithful preservation of the traditions and culture of the
place is absolutely necessity. The questionnaire sought responses on preservation
of religious festivals, dress patterns, life styles, food habits, occupations and
culture.
5.3.1 Cross Tabulation: Tradition and Number of Years of Residence
In order to find out the relationship between the residents‟ perceptions on
preservation of traditions and the number of years of stay both cross tabulation
and chi-square tests were done.
Page 12
159
Since the value of chi-square is 2.48 and therefore not significant at 0.05 level.
Therefore we conclude that duration of residency and one‟s willingness to follow
local traditions and customs are not significantly related.
Even the migrant population is aware of, and is interested in the preservation of
traditions and practices that are unique to Kumbalangi. This is exceptionally
advantageous for the island to develop tourism. Partially this can be ascribed to
the successful implementation of the training programmes as part of the UNDP
project. More than 5000 people were trained under the project. When we look
into the cross tabulation table, it is interesting to notice that even among the
people who have come to Kumbalangi within the last ten year period, almost 90%
support preservation of traditions of the region.
24 54 23 16 117 19.7% 24.7% 20.0% 22.2% 22.2%
86 145 80 47 358 70.5% 66.2% 69.6% 65.3% 67.8%
8 12 7 6 33 6.6% 5.5% 6.1% 8.3% 6.3%
4 8 5 3 20 3.3% 3.7% 4.3% 4.2% 3.8% 122 219 115 72 528
100.0% 100.0% 100.0% 100.0% 100.0%
Count % within stay Count % within stay Count % within stay Count % within stay Count % within stay
Very Important
Important
Don't Know
Not important
Tradition
Total
50 and Above 25-50 10-25 below 10 Stay
Total
Table 5. 7 Relationship between tradition and years of stay
Chi-Square Test Result
2.480 9 .981 Pearson Chi-Square Value df
Asymp. Sig. (2-sided)
Page 13
160
5.3.2 Cross Tabulation: Tradition and Age
The data was further analysed to find out whether there existed any relationship
between age and preservation of tradition.
Chi-square test was also done to ascertain the relationship
Since the chi square value is significant, we accept the alternate hypothesis. There
is relationship between age and preservation of traditions. From the table it is
clear that around 90% of youngsters and elderly people alike are interested in
preserving traditions and practice. There is significant difference between the age
group 22-35 and others. Almost 20% of the people in this age group are not much
concerned about traditions.
In order to ascertain the relationship between tradition and age the data is further
tested using the ANOVA. The results are given below.
Chi-Square Tests
41.124 12 .000Pearson Chi-SquareValue df
Asy mp. Sig.
(2-sided)
12 17 50 31 7 117 41.4% 19.1% 23.9% 22.1% 11.5% 22.2%
15 55 151 93 44 358 51.7% 61.8% 72.2% 66.4% 72.1% 67.8%
0 14 6 9 4 33 .0% 15.7% 2.9% 6.4% 6.6% 6.3%
2 3 2 7 6 20 6.9% 3.4% 1.0% 5.0% 9.8% 3.8%
29 89 209 140 61 528 100.0% 100.0% 100.0% 100.0% 100.0% 100.0%
Count % within Age Count % within Age Count % within Age Count % within Age Count % within Age
Very Important
Important
Don't Know
Not important
Tradition
Total
Below 22 22-35 36-50 51- 65 Above 65 Age
Total
Table 5. 8 Relationship between tradition and age
Page 14
161
Tradition
Sum of
Squares
DF Mean
Square
F Sig
Between
groups
Within
groups
Total
501.684
101115.376
10617.061
4
523
527
125.421
19.341
6.485 .000
The P-value of ANOVA (p-value < 0.05) indicates that there is significant
difference between the age groups with regard to their perceptions. Since both
chi-square and ANOVA results spoke of significant changes in perceptions
between age groups, Tukey HSD test was further administered. This was done to
find out the variation in the mean values of among different age groups Tukey
HSD test was conducted. The table below shows pair-wise comparison of the age
groups.
Comparison of mean values makes it clear that there are two groups based on
their perceptions on preserving traditions and culture. The respondents above 65
Tradition
Tukey HSD a
61 30.4754
89 31.9663 31.9663
140 32.5786
209 33.4545
29 33.7586 .282 .126
Age Above 65
22-35
51- 65
36-50 Below 22
Sig.
N 1 2
Subset for alpha = .05
Means for groups in homogeneous subsets are displayed.
Uses Harmonic Mean Sample Size = 67.531. a.
Page 15
162
years of age and those between 22 and 35 belong to one group and others another
group. However, the perception regarding the preservation of traditions among the
age group above 65, significantly differ from other age groups. Based on a
smaller mean value it is clear that unlike the usual, the older generation is less
obstinate in the preservation of traditions. The perception of the age group
between 22 and 35 is significantly closer to the older generation. This is probably
because the youth in those ages are in the strains of finding adequate livelihood
for their family and therefore less concerned about traditions and culture.
5.3.3 Comparative Contribution to Preservation of Traditions
In order to find out the relative importance of different traditions based on the
perception of people in the region a descriptive statistics is also done.
Table 5. 9 Comparative contributions to preservation of traditions
N Mean Std. Deviation
Parish Festivals 528 4.20 .647
Temple Festivals 514 4.04 .614
Mosque Festivals 514 3.90 .659
Cultural practices 516 4.21 .475
Dress habits 525 4.19 .498
Food habits 525 4.20 .498
Life style 514 4.21 .475
Traditional Occupations 520 4.23 .479
Page 16
163
Figure 5. 1. Comparative contributions to preservation of traditions
From the table and graph above it is clear that there is no significant perception
difference among the residents regarding the preservation of any tradition. People
consider all the aspects of traditions and customs very important. In general
people assign lesser importance to the preservation of religious festivals. The
standard deviations are also higher in the case of all religious festivals. The higher
mean rate for Christian and Hindu festivals is probably because the sample size
contained almost equal number of people from those religions. Hence the
respondents from the religion said the preservation of festivals of their religion is
very important while those of others are not. The residents in the island also
3.65
3.75
3.85
3.95
4.05
4.15
4.25Parish Festivals
Temple Festivals
Mosque Festivals
Cultural practices
Dress habits
Food habits
Life style
TraditionalOccupations
Page 17
164
primarily belong to Christian and Hindu religions. The mean value for
preservation of Muslim festivals is the lowest because the number of residents is
small.
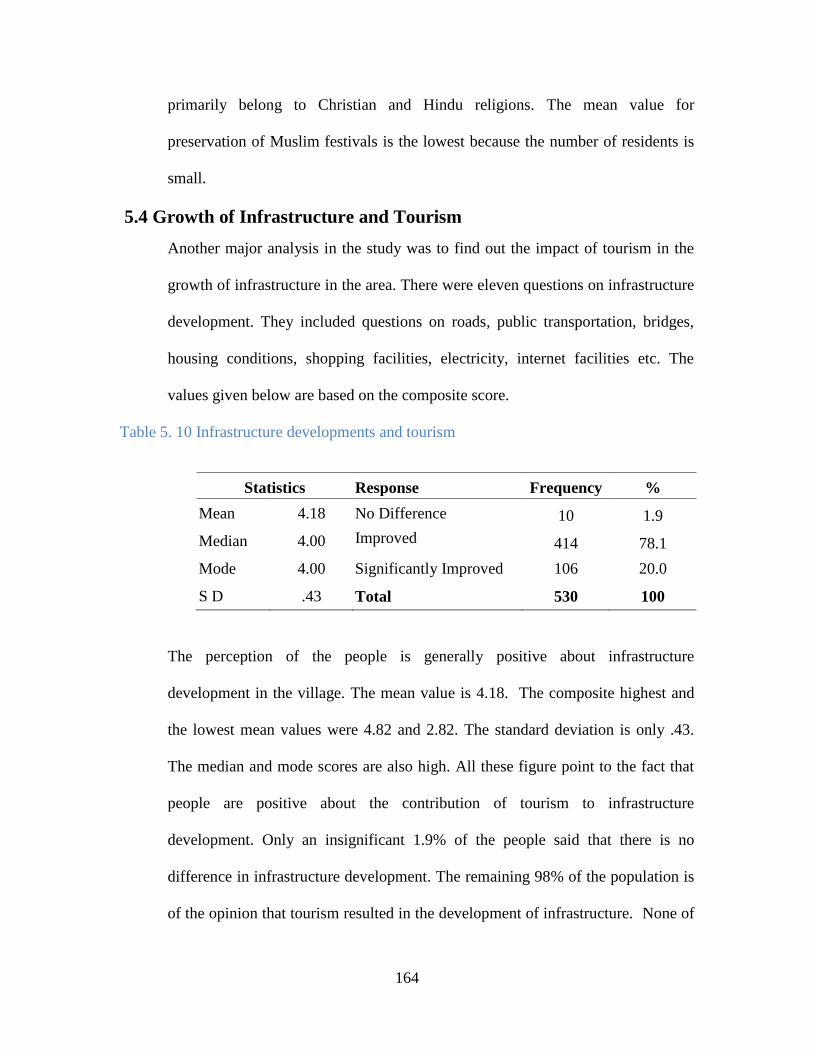
5.4 Growth of Infrastructure and Tourism
Another major analysis in the study was to find out the impact of tourism in the
growth of infrastructure in the area. There were eleven questions on infrastructure
development. They included questions on roads, public transportation, bridges,
housing conditions, shopping facilities, electricity, internet facilities etc. The
values given below are based on the composite score.
Table 5. 10 Infrastructure developments and tourism
Statistics Response Frequency %
Mean 4.18 No Difference 10 1.9
Median 4.00 Improved 414 78.1
Mode 4.00 Significantly Improved 106 20.0
S D .43 Total 530 100
The perception of the people is generally positive about infrastructure
development in the village. The mean value is 4.18. The composite highest and
the lowest mean values were 4.82 and 2.82. The standard deviation is only .43.
The median and mode scores are also high. All these figure point to the fact that
people are positive about the contribution of tourism to infrastructure
development. Only an insignificant 1.9% of the people said that there is no
difference in infrastructure development. The remaining 98% of the population is
of the opinion that tourism resulted in the development of infrastructure. None of
Page 18
165
the respondents said that tourism has worsened the availability of infrastructure in
the village. This is quite beneficial to Kumbalangi Village. In places where
enclave tourism is promoted in the rural areas, residents suffer from the lack of
availability of infrastructure facilities. Very often they are deprived of many of
the facilities they enjoyed even before the arrival of tourism.
As a part the endogenous tourism project from UNDP and Government of India
together spent, funds worth 50 lakhs rupees were for infrastructure development.
Most part of the funds was spent for public and household waste management.
Every house in the village was provided with a biogas plant to effectively manage
domestic bio-waste. There were also significant additions to roads and bridges.
The response of the people certainly approves off effective spending of available
resources.
5.4.1 Comparative Contribution towards Infrastructure Growth
Rural tourism models do not make large amount of infrastructure for tourism
alone. Therefore in Kumbalangi Panchayath there are not many infrastructure
investments made for tourism. At the same time rural tourism models must be
able to make investment in the region that would make the life of the people in the
destination more healthy and comfortable. Therefore, efforts were made to
understand the level of investments due to tourism that would raise the standard
of living of the general public in Kumbalangi Panchayath. The table below
compares the resident perception towards infrastructure.
Page 19
166
Table 5. 11 Relative contribution towards infrastructure growth
Min Max Mean
Std.
Deviation
Cleanliness in restaurants 2 5 3.88 0.46
Accommodation facilities 3 5 3.81 0.46
Public transportation 2 5 3.76 0.54
Bridges 2 5 3.74 0.54
Other public transportation ( like taxi) 2 5 3.72 0.53
Business avenues 2 5 3.71 0.51
Availability of electricity 1 5 3.65 0.58
Road construction 1 5 3.59 0.66
Availability of clean drinking water 2 5 3.56 0.61
Availability of internet and phone 2 5 3.56 0.56
Quality of food in restaurants 1 5 3.55 0.78
Figure 5. 2. Relative contribution to infrastructure growth
3.3 3.4 3.5 3.6 3.7 3.8 3.9
Clean tea shops & restaurants
Accommodation facilities
Public transportation (Bus…)
Bridges
Other public transportation (Taxi)
Business avenues
Electricity
Road
Clean drinking water
Internet and phone
Quality of food in restaurants
3.88
3.81
3.76
3.74
3.72
3.71
3.65
3.59
3.56
3.56
3.55
Page 20
167
From the table and graph it is clear that mean values of all the eleven factors
understudy are above three. This means people generally agree that there is
significant infrastructure growth as a result of tourism. It is really interesting to
note that the highest mean value is for the cleanliness of restaurants and the
lowest is for the quality of food.
Proper education and training is required to enhance the quality of food in tea
shops and small restaurants. The cleanliness and the quality of food and beverages
in the region are particularly significant to the development of tourism in
Kumbalangi, especially in the absence of any upper-class branded restaurants.
Tourists have to solely depend on the available small local restaurants. Studies
have revealed the fact that in general 10 to15 percentage of tourist spending is on
food and beverages1. Moreover Kumbalangi is projecting itself as one of the rural
tourism models. In rural tourism models contribution to local economy happens
primarily through local cuisines and beverages2. Unless the region is able to offer
quality food in a clean environment, tourists will be hesitant to come to the place.
Immediate attention to ensure quality of services is a must for the future tourism
development of the region.
5.5 Local Income and Tourism
Endogenous rural tourism was implemented in Kumbalangi village in order to
enhance the local income in a significant way. Economic gain being one of
important paradigms of development management effort was made to analyse the
contribution of tourism in enhancing the local income in Kumbalangi. Therefore
in the pilot test an effort was made to collect quantitative data regarding income.
But the effort was not successful because the ordinary residents of the place do
Page 21
168
not keep exact accounts of their income and expenditure. Even those households
who are directly engaged in tourism related activities were not keeping accounts
relating to income from tourism, because tourism is not their major activity and
moreover, the rural less educated population in India has not yet started keeping
accounts of their income and expenditure. But all of them were able to judge the
impact of tourism on local income. Therefore in the final data collection the
perception of the residents was collected to gauge the contribution of tourism to
local income.
Table 5. 12 Growth of local income
Statistics Response Frequency %
Mean 3.54 Significantly improved 27 5
Median 3.54 Somewhat improved 203 38
Mode 3.54 No difference 246 47
Std. D .261 Worsened 54 10
Total 530 100
From the table above it is clear that the respondents are evenly divided regarding
the contribution of tourism towards local income. Only less than 50% of people
feel the positive impact of contribution of tourism. When we look into the
statistics too, we see that the mean, median, and mode are equally smaller values.
However, they indicate that respondents in general agree that tourism contributes
to local income.
Tourism in Kumbalangi is still in its infancy. Though there is lot of hype being
created about the possibilities of tourism, many of the expectations are yet to be
materialised. 10% of the people feel that tourism has only reduced their income
Page 22
169
directly or indirectly. In connection with the Kumbalangi Tourism Village project,
there were efforts to implement many eco-friendly practices like minimising the
use of plastics, cultivation of paddy without chemical fertilisers and pesticides etc.
Some of these practices have negatively affected the income of the few. Unless
tourism is able to supplement the loss of their income in the near future, those
people could be sceptical about tourism impact and in the long run they could be
against tourism promotion in the region.
5.5.1 Comparative Contribution towards Local Income
The data is analysed to find out the relative contribution of the seven variables
under study. Table below gives a comparison of the perception of people
regarding the economic value of different resources available to them.
Table 5. 13 Comparative contribution to local income
Min Max Mean SD
Income from ordinary works through
tourism
1 5 2.22 0.923
Overall income of the people 2 5 2.89 0.793
Sale of goods and services 1 5 3.13 0.681
The quantity of sales in shops 2 5 3.47 0.545
Price of land and real estate 1 5 3.65 0.581
Employment opportunities 1 5 3.69 0.593
Income from artistic performances 2 5 4.65 0.488
Page 23
170
Figure 5. 3. Comparative contribution to local income
From the above table and graph it is clear that income from tourism for ordinary
workers is the lowest. Highest income is earned from artistic performance. Artists
receive higher earnings from tourism because as a part of the endogenous tourism
project, efforts were made to restore and promote traditional art forms of
Kumbalangi. Presentation of different art forms is a good means to generate
income from tourists. The Kalagram (art school), which is part of the tourism
project, was meant for the development and preservation of indigenous art forms,
is not yet complete.
The respondents perceive generation of additional income from additional job
opportunities. The rise of price in the real estate need not be always positive at
least for those in the lower economic strata. Higher real estate cost will gradually
result in the migration of people from the place and to the place. Large scale
migration will make it very difficult even to define local people.
0.1 1.1 2.1 3.1 4.1 5.1
Income from ordinary works through tourism
Overall income of the people
Sale of goods and services
The quantity of sales in shops
Price of land and real estate
Employment opportunities
Income from artistic performances
2.22
2.89
3.13
3.47
3.65
3.69
4.65
Page 24
171
Many respondents perceived increase in the sales of shops. Every year there are
exhibitions conducted in the island with a view to show case the village and to
ensure adequate market for different curios prepared in the village. In connection
with the exhibitions there are also food stalls that sell indigenous cuisines to
tourists. All these have resulted in the increase of sales in the shops. However,
when we look into the table we see that the mean value for sales is not very high
and the standard deviation is high. Based on the table given above it could be
rightly concluded that in general the respondents agree that there is moderate
increase in local income in the village due to tourism development.
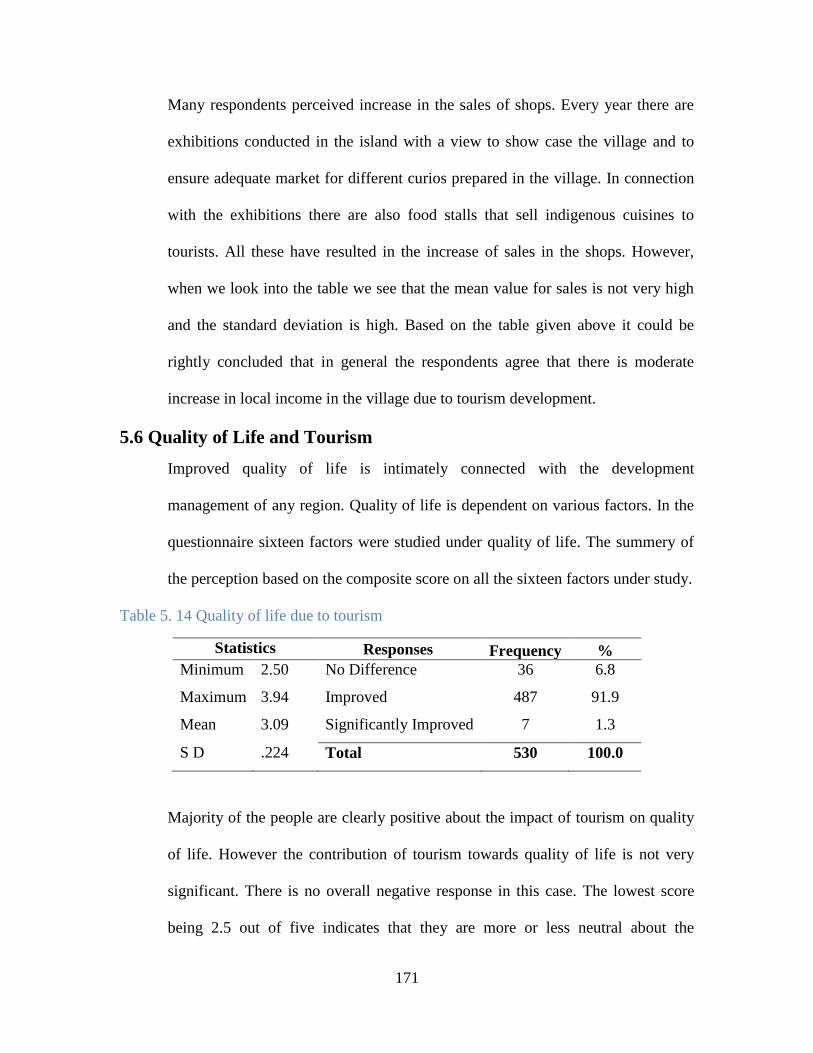
5.6 Quality of Life and Tourism
Improved quality of life is intimately connected with the development
management of any region. Quality of life is dependent on various factors. In the
questionnaire sixteen factors were studied under quality of life. The summery of
the perception based on the composite score on all the sixteen factors under study.
Table 5. 14 Quality of life due to tourism
Statistics Responses Frequency %
Minimum 2.50 No Difference 36 6.8
Maximum 3.94 Improved 487 91.9
Mean 3.09 Significantly Improved 7 1.3
S D .224 Total 530 100.0
Majority of the people are clearly positive about the impact of tourism on quality
of life. However the contribution of tourism towards quality of life is not very
significant. There is no overall negative response in this case. The lowest score
being 2.5 out of five indicates that they are more or less neutral about the
Page 25
172
contribution of tourism. The mean value indicates positive perception. However
the score is low. Data was further analysed to examine the relative contribution.
5.6.1 Comparative contribution to quality of life.
One of the primary objectives behind the implementation of the tourism project in
Kumbalangi was to enhance the quality of life. The table below gives the details.
Table 5. 15 Comparative contribution of quality of life factors
Min Max Mean S D
General well-being 1 5 2.79 .766
Public security 1 5 2.93 .652
Reduction in disturbances from public noise 1 5 3.13 .723
Reduction in spitting in public places 1 5 3.16 .718
Cultural centres like clubs 1 5 3.16 .889
Play grounds 1 5 3.33 .661
Pride in being a person from Kumbalangi 1 5 3.51 .560
Reduction in littering 1 5 3.58 .647
Recreational facilities (theatres, cinemas etc.) 2 5 3.69 .515
Ability to interact with strangers 1 5 3.80 .485
Residents' concern for material gains 1 5 3.82 .470
Cleanliness of public places 1 5 3.87 .474
Cleanliness of premises of food service areas 3 5 3.93 .368
Health consciousness 3 5 3.93 .403
Reduction in public smoking 2 5 3.97 .397
Mutual confidence among people 2 5 3.99 .498
Page 26
173
From the above table it is clear that the overall perception about quality of life is
not very high. The mean value for general well-being is the lowest among the
variables with 2.79 and it has one on the highest standard deviations. However,
even the smallest mean value is above 2.5 which suggest positive contribution of
tourism to quality of life. Highest mean value among the variables is for mutual
confidence among people. Probably the democratic process of decision making in
connection with tourism development gave the residents different forums for
mutual interaction and discussion. These forums directly and indirectly promote
social capital which again stimulates the development management of the region.
Moreover, in future the democratic process of decision making could be further
strengthened which will lead to increased participation in the tourism
development.
5.7 Knowledge and Skill through Tourism
One of the important aspects of development management is knowledge
acquisition and empowerment of residents. Through tourism development the host
community is often enriched by knowledge about other cultures and practices.
Knowledge acquisition of residents is assessed using three variables. The general
influence of tourism on knowledge and skill enhancement is presented below.
Page 27
174
Table 5. 16 Knowledge enhancement through tourism
Statistics Response Frequency %
Minimum 2.67 Worsen 11 2.1
Maximum 5 No Difference 283 53.4
Mean 3.25 Improved 220 41.5
Std. D .449 Significantly Improved 16 3.0
Total 530 100.0
It is clear from the table that people are not very positive about knowledge
gaining through tourism. There are many reasons for lack knowledge
improvement through tourism. Kumbalangi is not yet able attract large number of
tourists. Another important reason is the lack of possibility for ordinary residents
to interact with tourists. Most of the residents are having less education. Therefore
their possibility to interact with the tourists is also low. However, 45% of the
residents have expressed favourable perception regarding knowledge acquisition.
The lowest composite mean value signify positive contribution of tourism towards
knowledge. Some of the residents especially those who provide direct service to
tourists like the homestay owners and taxi drivers certainly have plenty of
opportunities to interact with tourists. That is the reason why the highest
composite mean is five. The composite mean value of 3.25 denotes the positive
impact of tourism on knowledge enhancement. Knowledge and skill
enhancement of people certainly augments the development management of the
village.
Page 28
175
5.7.1 Comparative Contribution to Knowledge and Skill Acquisition
There were three questions to evaluate the knowledge acquisition of residents.
They were asked to respond to the question on a five point scale. The table gives
the details.
Table 5. 17 Relative contribution to knowledge and skill
Mean S D
Ability to interact with strangers 2.880 .8282
Opportunity for learning 3.216 .8275
Multi linguistic skills 3.273 .5056
The mean values indicate that general perception of people is positively oriented.
The least mean value is regarding the ability to interact with strangers. As already
stated the tourism development in Kumbalangi is still in its infancy. The number
of tourists visiting the place is still small. Therefore the residents do not have
many chances to interact with strangers. The highest mean value is regarding the
acquisition of multi-linguistic skills. The development of tourism in the place led
to conscious efforts among many villagers to develop their foreign language
skills. Since the overall perception of residents is positively oriented, as the
tourism in Kumbalangi matures there will be significant value addition to their
knowledge and skills.
5.8 Culture and Tourism Development
One of the possible dangers of tourism development especially in rural areas is
the negative visitor influence on the community. In such cases the host
community will imitate the behaviour and lifestyles of the tourists. When the host
Page 29
176
community fails to preserve its culture, it is counter to organic growth and
development management of the region. Hence the cultural impact of tourism is
also was included in the study.
Table 5. 18 Contribution to cultural development
Statistics Responses Frequency % Minimum 2.75 Significantly Improved 11 2
Maximum 4.92 Somewhat Improved 315 59
Mean 3.67 No Difference 190 36
Std. D .287 Worsen 14 3
Total 530 100
Residents are generally positive about the influence of tourism on their culture.
Majority of the people said that tourism positively affects their culture. 2% have
said that there is significant improvement in the cultural expressions and 59%
people agree that there is moderate positive influence on culture. Only an
insignificant minority of respondents expressed their negative perception.
We can also see that the composite mean value also is high with 3.67 and a small
standard deviation of .278. Even the composite minimum score too indicate
positive contribution of tourism. From the development management perspective
culture has a significant role in determining the organic growth of a region. In
Kumbalangi tourism is perceived by residents as something that contribute to the
organic growth and development of their cultural expressions. The focus of
residents in preserving their traditions together with the organic growth of their
Page 30
177
culture gives abundant opportunity for the development management of
Kumbalangi village.
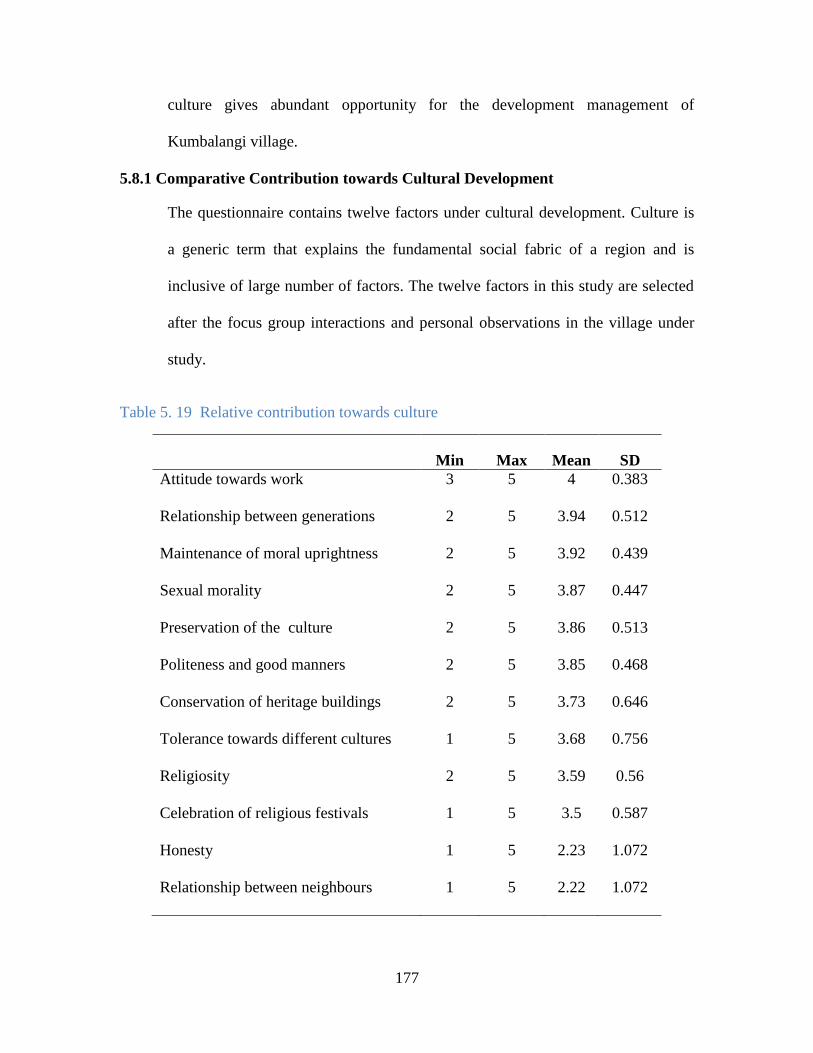
5.8.1 Comparative Contribution towards Cultural Development
The questionnaire contains twelve factors under cultural development. Culture is
a generic term that explains the fundamental social fabric of a region and is
inclusive of large number of factors. The twelve factors in this study are selected
after the focus group interactions and personal observations in the village under
study.
Table 5. 19 Relative contribution towards culture
Min Max Mean SD
Attitude towards work 3 5 4 0.383
Relationship between generations 2 5 3.94 0.512
Maintenance of moral uprightness 2 5 3.92 0.439
Sexual morality 2 5 3.87 0.447
Preservation of the culture 2 5 3.86 0.513
Politeness and good manners 2 5 3.85 0.468
Conservation of heritage buildings 2 5 3.73 0.646
Tolerance towards different cultures 1 5 3.68 0.756
Religiosity 2 5 3.59 0.56
Celebration of religious festivals 1 5 3.5 0.587
Honesty 1 5 2.23 1.072
Relationship between neighbours 1 5 2.22 1.072
Page 31
178
Figure 5. 4. Relative contribution towards culture
The table and graph above communicates clearly that tourism is helpful in the
development of culture of Kumbalangi. The respondents are negative about their
perceptions only regarding two factors, namely, honesty and relationship with
neighbours. One of the very good impacts of tourism is the changing positive
outlook towards tourism. Tourism has given opportunity for employment for
many residents, especially the women. Most probably this has also resulted in the
improvement of sexual morality in the society.
The mean value for relationship between neighbours indicates negative perception
of residents. This is probably because of economic reasons. Tourism has resulted
in creating two classes of residents – the beneficiaries of tourism and others. Not
all the residents are able to get employment or economic benefit out of tourism.
Some of the residents have benefited from tourism while many others are just
2 2.5 3 3.5 4 4.5 5
Attitude to work
Relationship between generations
Moral uprightness
Sexual morality
Preservation of the culture
Politeness and good manners
Conservation of heritage
Tolerance to other cultures
Religiosity
Religious festivals
Honesty
Relationship between neighbours
4
3.94
3.92
3.87
3.86
3.85
3.73
3.68
3.59
3.5
2.23
2.22
Page 32
179
spectators of tourism. Those who do not reap any economic or social benefit out
of tourism may turn antagonistic it in the long run. Therefore some institutional
mechanisms should be executed to ensure the flow of tourism benefits to the
general public also through some form of taxation.
The data also indicate that there is growing dishonesty among people due to
tourism. In general people of Kerala understate their economic gains therefore in
the case of gains from tourism too. Tourism development has brought in increased
interactions between residents. However the relationship between them
deteriorated. Therefore it is quite likely that those beneficiaries of tourism do not
share accurate account of monetary gains. This is probably why the respondents
said that there is growing dishonesty among people due to tourism.
One of the significant achievements of tourism is the positive change in the
attitude towards work. This has the highest mean with the lowest standard
deviation. The homestays and the increased job opportunities for women in the
tourism field have helped in the development of constructive attitudes towards
tourism related jobs.
5.9 Crime and Tourism
Increase of crime in a locality retards the development management of the region.
Very often in connection with tourism there are increased crimes and violence3.
Therefore the influence of tourism on crime is examined in this research. It
examines six types of crimes. The decision to study six types of crimes was made
based on the focus group interactions with relevant resident groups. The
following table demonstrate, the perception of people regarding crime rates. The
Page 33
180
perception regarding the growth or decrease of different crimes are summarised
below.
Table 5. 20 Growth of Tourism and Crimes
Statistics Responses Frequency %
Minimum 1.33 Increased 26 4.9
Maximum 4.67 No Change 263 49.6
Mean 2.75 Decreased 233 44
Std. D .676 Significantly
Decreased
8 1.5
Total 530 100
From the table above it is very difficult to conclude the impact of tourism on
crime because the responses of residents regarding crime are almost evenly
divided. When 44% of the respondents perceive that there is decrease in crime,
another 50% perceive that there is no difference. Yet another 5% respondents say
that there is increase. The composite mean value also is low and has a wide range
of 3.34. The standard deviation is also high. All these figures point to the fact that
many respondents believe that there is increase of crime in the village due to
tourism. However, there are also many respondents who perceive reduction of
crimes due to tourism. Globally, one of the most important forms of crime in
connection with tourism is drug abuse. Chester Nelson Mitchel wrote that tourism
“…would permit creation of tourist Mecca‟s catering to all drug tastes and
appetites in a reasonably safe, understanding atmosphere”.4 Therefore further
analysis was done to understand the growth of different forms of crimes including
drug abuse and alcoholism.
Page 34
181
5.9.1 Perception on Reduction of Crimes
The following table gives the perception of residents towards different forms of
crimes after the introduction of tourism in the village. The residents were asked to
respond from significantly increased (=1) to significantly decreased (=5).
Therefore higher values in the table and graph indicate decrease in crime and
lower values indicate increase in crime rate.
Table 5. 21 Perception on reduction of crimes
Min Max Mean SD
Vandalism 1 5 3.90 .950
Drug abuse 3 5 3.45 .532
Alcoholism 3 5 3.26 .487
Gambling 1 5 2.52 1.128
Individual crime 1 5 2.31 1.047
Organised crime 1 5 2.13 .996
Figure 5. 5. Perception on different types of crimes
From the data presented above we see that tourism influences differently on
different forms crimes. From the mean values we understand that there is increase
in both organised and individual crimes, while other forms of crimes are lower.
2.00 2.50 3.00 3.50 4.00 4.50 5.00
Vandalism
Drug abuse
Alcoholism
Gambling
Individual crime
Organised crime
Page 35
182
Kumbalangi is a village in the suburbs of fort Kochi. In Fort Kochi which is very
near to Kumbalangi village there are many criminal groups that recruit youngsters
for organized crimes. Many unemployed youth are tempted to join these groups
for money. This could be the reason why respondents perceived increased
individual and organised crimes. However, the residents perceive that the tourism
development has significantly brought down the use of alcohol and drug abuse.
5.10 Ecological Preservation and Tourism
Very often tourism is said to be a smokeless industry and therefore non-polluting.
But this is not fully true. Unless tourism is planned and implemented, it can be
detrimental to the preservation of ecology and environment of the destination.
Preservation of environment and ecology is important to the village life in
Kumbalangi. Development management also aims at preserving the quality of
ecology and environment. Hence the impact of tourism on ecology and
environment is examined in this study.
Table 5. 22 Preservation of ecology and environment
Statistics Response Frequency %
Minimum 2.29 Significantly
improved
12 2.3
Maximum 5 Somewhat
Improved
300 56.6
Mean 3.39 No Difference 87 16.4
Std. D .392 Worsen 131 24.7
Total 530 100
From the above table it is clear that almost 60% of the population is of the opinion
that tourism has contributed positively to the preservation of ecology and
Page 36
183
environment. Only 25% people expressed negative views on protection of
ecology and environment. The composite mean value is 3.39 and the standard
deviation is .392. The mean value indicate that the overall perception of
respondents is positive regarding the preservation of ecology and environment. As
part of the tourism project the residents were given special training on
preservation of ecology and environment. The responses show that the training
has constructively contributed to the protection of environment.
At present tourism in Kumbalangi is its infancy. There are only few tourists
visiting the island. When the tourism in the region grows, there could be increased
threat to the ecology and environment of the place. Therefore adequate pro-active
steps must be implemented to prevent the possible damages to environment.
5.10.1 Comparative Contribution to Ecology and Environment
The influence of tourism on ecology and environment was studied under six
variables. In order to assess the relative contribution of each of the factors the
mean values, minimum, and maximum values were calculated. The results are
presented below.
Table 5. 24 Relative contributions to ecology and environment
Min Max Mean S D
Preservation of ecology and
environment
2 5 3.91 .411
Domestic waste management 2 5 3.91 .411
Prawns 1 5 3.90 .457
Public waste management 2 5 3.87 .415
Agriculture 1 5 3.87 .434
Fishes 1 5 3.13 .830
Lobster 1 5 2.11 .885
Page 37
184
Figure 5. 6. Relative contributions to ecology and environment
From the graph and table it is clear that people are generally happy with the
preservation of ecology and environment of the Village. In all the different
aspects- except growing of lobster- the mean values are higher than 3. When we
look at the responses, we see that no one has given lowest value for waste
management and environmental protection efforts. The people are not very happy
with the situations in farming. The villagers undertake three types of farming,
namely fish farming, prawn farming and agriculture farming. All these three has
lowest mean values, lowest minimum values and highest standard deviations.
According to the response of the people now there is deterioration of quality and
extend of farming.
As a part of the UNDP tourism project all the houses were provided with biogas
plants for domestic waste management. Public waste bins were also provided in
many places in the Panchayath as a part of the scheme. Moreover there were
programmes to educate and train public regarding the need for preservation of
environment for healthy living. The use of plastic is considerably decreasing. In
3.91
3.91
3.90
3.87
3.87
3.13
2.11
2.00 2.50 3.00 3.50 4.00 4.50 5.00
Preservation of ecology and…
Domestic waste management
Prawns
Public waste management
Agriculture
Fishes
Lobster
Page 38
185
the island there is a general practice of erecting small fencing walls around each
one‟s property. Traditionally this was done using only plastic. Due to consistent
education and follow up, people have started using biodegradable materials for
fencing. As a part of tourism project many trees were also planted on both sides
of many roads. Signage boards were installed in many places in the Panchayath
with a view to educating the public regarding the importance of maintaining the
unique environment of Kumbalangi. People generally are aware of the need for
maintaining a clean environment to promote tourism in the region and are willing
to cooperate with the local authorities.
5.11 Residents’ Psychological Engagement in Tourism Development
As already stated in the methodology chapter the Civic Voluntarism Model
suggests that there is direct relationship between residents‟ psychological
engagement and their participation. Four questions were asked to draw
information regarding residents‟ psychological engagement towards the
implementation of the tourism project. Their responses were collected on a five
point scale from strongly agree (=5) to strongly disagree (=1). The summery
results are presented below.
Table 5. 25 Psychological engagement with tourism
Statistics Responses Frequency %
Minimum 1.75 Disagree 4 .8
Maximum 4.25 No Opinion 106 20.0
Mean 2.93 Agree 411 77.5
Std. D .404 Strongly Agree 9 1.7
Total 530 100.0
Page 39
186
The cumulative percentage reveals that almost 80 % of the residents have positive
outlook towards tourism. Only very insignificant number of respondents has
given total negative disposition towards tourism development. However, when
look into the composite mean value it is 2.93 which is not a high score. The mean
value is brought down by the 20% of the respondents who did not give their
opinion. This group of respondents are probably closely observing the
development of tourism. To ensure sustainable development of tourism in
Kumbalangi it is important to productively influence them. In order to better
understand the reason for low composite mean a detailed analysis each factor is
done below.
5.11.1 Psychological Engagement with Tourism
Residents‟ outlook towards the tourism project was analysed using four questions.
Questions were asked to know their attitude to tourism related decision making
process and the general impact of tourism in the region.
Table 5. 26 Outlook towards tourism development
Mean
Mode S D
Tourism decision making is always democratic 2.70 2 .972
Tourism is favourable to the culture of Kumbalangi 3.66 4 .996
Tourism is advantageous to the poor 3.65 4 .714
Willing to receive tourists at home if available 3.52 4 .691
Page 40
187
Figure 5. 7. Psychological engagement with tourism development
From the table and graph it is clear that residents in general have positive outlook
towards tourism development in the village. They have very strong positive
opinion regarding the general outcome of the project. The mode of all the
questions except the one regarding style of decision making is four out of five.
This means that large number of respondents have given the rating four out five.
The median also is very near to four. The standard deviation is also low. This
shows that majority of the respondents have favourable disposition to the effect of
tourism. However, the residents‟ outlook towards the decision making process is
not very positive.
Development management always stress democratic decision making in
developmental projects. Tourism project implemented by Government of India in
Kumbalangi visualises democratic decision making in all its details. However, the
response of residents does not give a colourful picture regarding decision making
process. Therefore beyond the wishful thinking and policy making proper
2.7
3.66
3.65
3.52
0.5 1 1.5 2 2.5 3 3.5 4
Tourism decision making is alwaysdemocratic
Tourism is favourable to the culture ofKumbalangi
Tourism is advantageous to the poor
willing to receive tourists at home ifavailable
Page 41
188
machineries must be set up to ensure participation of residents in the planning and
implementation of developmental projects.
5.11.2 Correlation Analysis: Psychological Engagement with Tourism
Analysis was done to find out the existing correlation between the four factors
under study.
Table 5. 27 Correlation Analysis: Attitude factors
1 2 3 4
1. Decision making –Consultation 1
2. Tourism destroys culture -.130**
1
3. Tourism is for the rich -.246**
.098* 1
4. Willing to receive tourists at home -.276**
.130**
.622**
1
**. Correlation is significant at the 0.01 level (2-tailed).
*. Correlation is significant at the 0.05 level (2-tailed).
From the table it is clear that there exist very strong correlation between four
factors under study. It should also be noted that the perception of residents about
the tourism decision making process is negatively affecting their psychological
engagement. In other words, lower scores to decision making process results in
higher scores to other factors. This means that the respondents who are positively
disposed to tourism are unhappy with the tourism decision making process. The
respondents are really looking for more involvement and participation in tourism
decision making.
Page 42
189
5.11.3 Regression Analysis: Psychological Engagement with Tourism
Regression analysis is further done to confirm the significance of negative
correlation found between attitude towards tourism decision making process and
other factors influencing the attitude.
Table 5. 28 Regression Analysis: Psychological engagement factors
Dependent Variable R2 β (Beta) ϝ ƥ
Tourism Decisions Democratic .095 -.092 17.683 0.000
Perception regarding tourism decision making was the dependent variable and
other factors of psychological engagement - which were already mentioned above
- were the independent variables. Regression analysis too confirms that there exist
negative relationship between the perception to tourism decision making process
and other psychological engagement factors. The R2 value speaks about the
strength of the model. 9.5% of the outlook towards tourism decision making
process is determined by other psychological engagement factors. The beta value
signifies the direction and proportion of the influence. The negative beta value
proves the assumption that those who are positively disposed to tourism have
negative disposition towards the process of decision making. The F value and
significance confirm that the relationship is significant at 0.05 level and not just
accidental.
5.12. Resident Participation in Kumbalangi Tourism Project
Participation of the residents is an important component of development
management. In this research two levels of participation of the people were
studied. At the first level the participation of the people in the planning process
Page 43
190
and at the second level their participation in the implementation of the project
were studied.
5.12.1 Resident Participation in Planning
Resident participation in planning was enquired in five different areas. They
included both public and private projects. Each factor under study is analysed
later. The table below gives a summary perspective regarding participation in
planning.
Table 5. 29 Resident participation in tourism planning
Frequency Percentage
Rarely 448 84.5
Occasionally 42 7.9
Usually 31 5.8
Always 9 1.7
Total 530 100.0
From the table it is very evident that practically everyone got involved with
planning session in some form or at some level. However, the vast majority of the
general public was not actively involved in the planning and decision making
process regarding tourism. It is evident from the figures above that only less than
20% people only ordinarily participated in the tourism planning. Kumbalangi is
village tourism model and not a mass tourism destination. Therefore long term
success and sustainability of tourism in the region is certainly dependent on public
participation. It is noteworthy that none of the respondents said that they never
participated in the project planning.
Page 44
191
The Civic Voluntarism (CV) Model was also utilised to analyse the resident
participation in planning tourism projects. The correlation between CV Model
factors and participation variables were examined. The following table gives the
details.
Table 5. 30 Correlation Analysis – CV Model
CVM Factors Variables Studied
Correlation
Coefficients
(participation
planning)
Belongingness to recruiting
networks
Duration of residence .090*
Psychological engagement Psychological engagement .053
Resources
Income of the family .127**
Educational status -.024
Occupation .039
*. Correlation is significant at the 0.05 level (2-tailed).
**. Correlation is significant at the 0.01 level (2-tailed).
As per the theory resident participation is directly related to CVM factors. The
table above suggests that belongingness and income of the family are strongly
correlated to level of participation in planning. However, correlation coefficients
of psychological engagement, educational status and occupation do not suggest
strong correlation. This means that in Kumbalangi tourism project, residents with
higher income participated in the planning stage more significantly than lower
income group. Similarly those with longer residence participated in the planning
stage more than those with lower duration of residence.
Page 45
192
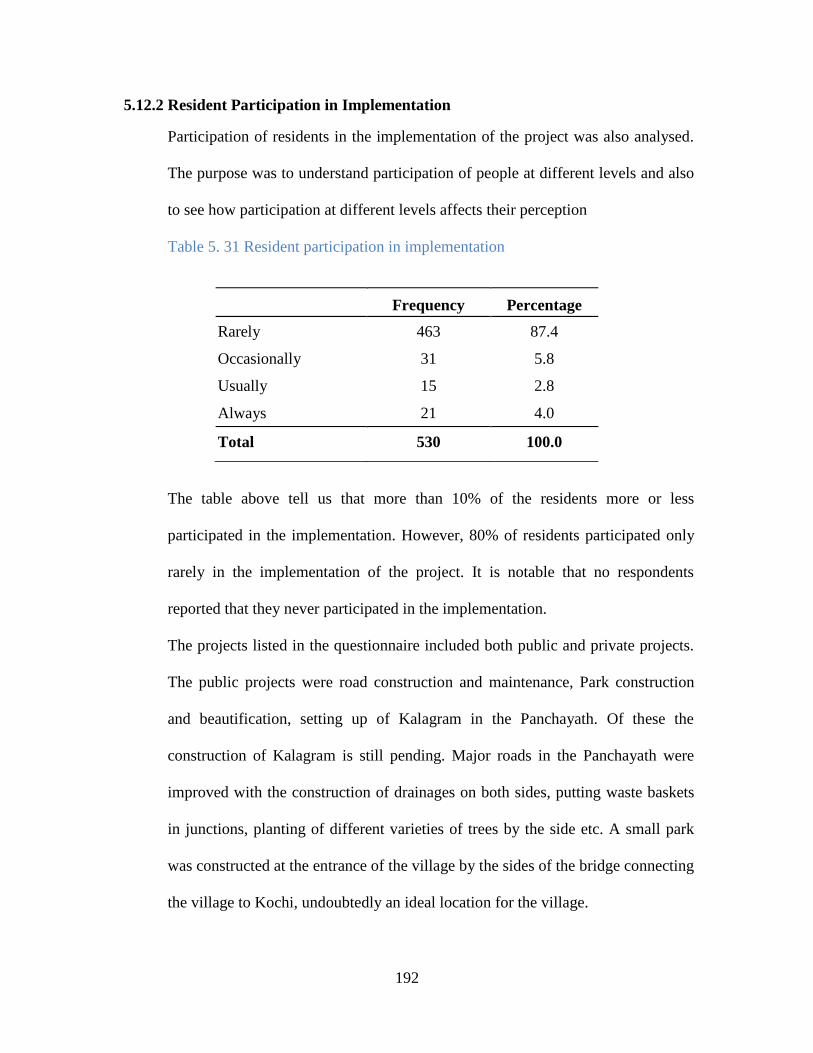
5.12.2 Resident Participation in Implementation
Participation of residents in the implementation of the project was also analysed.
The purpose was to understand participation of people at different levels and also
to see how participation at different levels affects their perception
Table 5. 31 Resident participation in implementation
The table above tell us that more than 10% of the residents more or less
participated in the implementation. However, 80% of residents participated only
rarely in the implementation of the project. It is notable that no respondents
reported that they never participated in the implementation.
The projects listed in the questionnaire included both public and private projects.
The public projects were road construction and maintenance, Park construction
and beautification, setting up of Kalagram in the Panchayath. Of these the
construction of Kalagram is still pending. Major roads in the Panchayath were
improved with the construction of drainages on both sides, putting waste baskets
in junctions, planting of different varieties of trees by the side etc. A small park
was constructed at the entrance of the village by the sides of the bridge connecting
the village to Kochi, undoubtedly an ideal location for the village.
Frequency Percentage
Rarely 463 87.4
Occasionally 31 5.8
Usually 15 2.8
Always 21 4.0
Total 530 100.0
Page 46
193
Participation in implementation also was analysed using the CV Model.
Correlation analysis between CVM factors and participation in implementation is
given below.
Table 5. 32 Correlation Analysis- Participation in Implementation
CVM Factors Variables Studied
Correlation
Coefficients
(participation
Implementation)
Belongingness to recruiting
networks
Duration of residence .006
Psychological engagement Psychological engagement .090*
Resources
Income of the family .- 213**
Educational status -.371**
Occupation .251**
*. Correlation is significant at the 0.05 level (2-tailed).
**. Correlation is significant at the 0.01 level (2-tailed).
From the table above it is clear that there is significant correlation between CVM
factors and participation in implementation. However, the correlation coefficient
of belongingness to recruiting networks is not found significant. It is also
interesting to note that the contribution to implementing the project is inversely
related to income and educational status of the residents. The data is further
analysed below to examine the relation between participation in planning and
implementation.
5.12.3 Comparison of Participation between Planning and Implementation
A detailed analysis of the data was conducted to evaluate level of participation in
each project. The table below gives a comparison of mean values and standard
deviations between participation in planning and implementation.
Page 47
194
Table 5. 33 Comparison of participation between planning and implementation
Mean SD
Participation in
Planning
Construction of the Park 1.25 .69
Implementation of Home-stays 1.27 .72
Road construction and maintenance 1.39 .88
Construction of Kalagram (Art School) 1.27 .74
Setting up water related recreations 1.22 .69
Participation in
Implementation
Construction of the Park 1.22 .78
Implementation of Home- stays 1.40 1.02
Road construction and maintenance 1.27 .85
Construction of Kalagram (Art School) 1.23 .76
Setting up water related recreations 3.53 .99
Participation in implementation has higher mean in two cases – implementation of
homestays and implementation of water related recreation avenues. The
participation in the implementation of homestays for tourists to stay is high
because, they are independently done by individual family members. At present
there are 16 registered homestays. Naturally those who plan to establish
homestays will work with dedication for successful setting up of the house.
Participation in the water related recreation is high probably because the residents
knew how to organise water related recreation avenues. Again arranging small
boats or kayak is the task of one person or one family. The other three projects in
the list can be implemented only through public participation.
5.12.4 Hypothesis Testing: Relationship between Planning and Implementation
The proposed hypothesis is:
Participation in planning directly influences participation in implementation.
Page 48
195
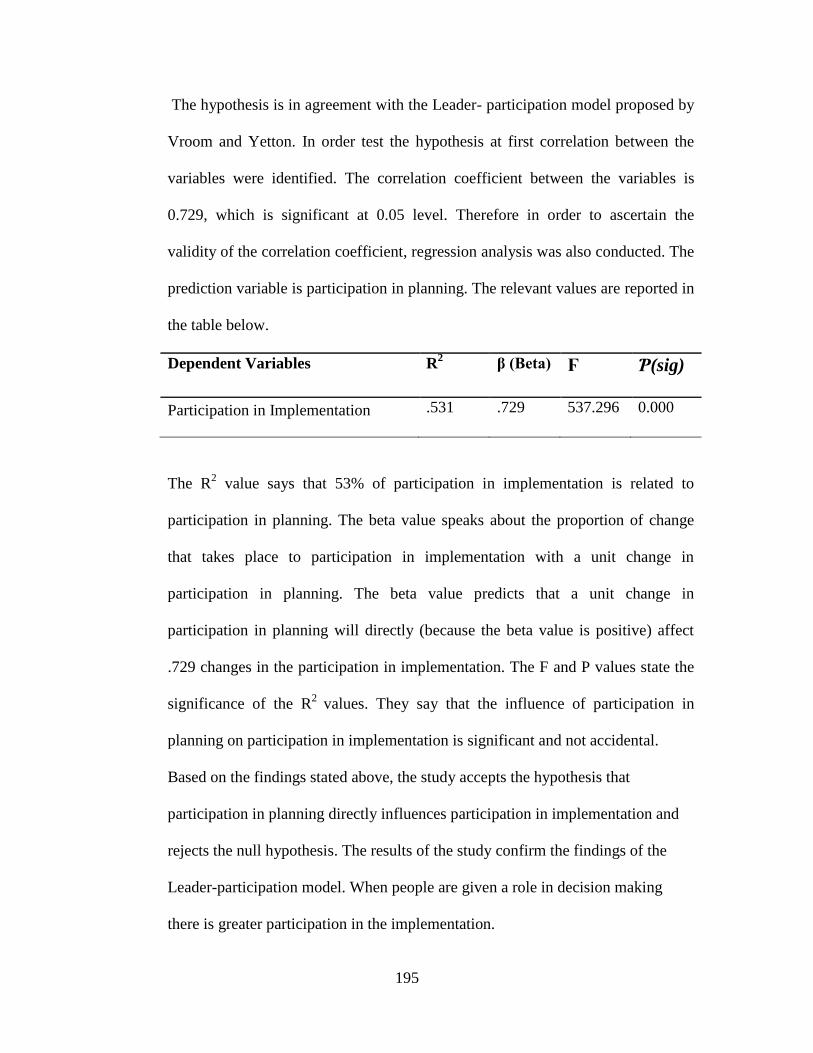
The hypothesis is in agreement with the Leader- participation model proposed by
Vroom and Yetton. In order test the hypothesis at first correlation between the
variables were identified. The correlation coefficient between the variables is
0.729, which is significant at 0.05 level. Therefore in order to ascertain the
validity of the correlation coefficient, regression analysis was also conducted. The
prediction variable is participation in planning. The relevant values are reported in
the table below.
Dependent Variables R2 β (Beta) Ϝ Ƥ(sig)
Participation in Implementation .531 .729 537.296 0.000
The R2 value says that 53% of participation in implementation is related to
participation in planning. The beta value speaks about the proportion of change
that takes place to participation in implementation with a unit change in
participation in planning. The beta value predicts that a unit change in
participation in planning will directly (because the beta value is positive) affect
.729 changes in the participation in implementation. The F and P values state the
significance of the R2
values. They say that the influence of participation in
planning on participation in implementation is significant and not accidental.
Based on the findings stated above, the study accepts the hypothesis that
participation in planning directly influences participation in implementation and
rejects the null hypothesis. The results of the study confirm the findings of the
Leader-participation model. When people are given a role in decision making
there is greater participation in the implementation.
Page 49
196
5.13 Hypothesis Testing: Impact of Participation on Perception
The research attempted to explore the impacts of the level of participation on
residents‟ perceptions on the tourism project. The proposed hypothesis was:
Resident participation in planning and implementation directly influences the
resident perception on the impact of tourism.
For this initially correlation between participation and different perception
variables were analysed. After doing the correlation analysis stepwise multiple
regressions analysis was also done to see the impact of participation -both
planning and implementation- on perception.
5.13.1 Correlation Analysis: Participation and Perception
In order to ascertain the relationship between participation and perception at first
two tailed Pearson correlation analysis was done. The correlation analysis showed
that there is stronger correlation between participation in implementation and
perceptions than between participation in planning and perceptions. Participation
in implementation certainly gives more involvement than participation in
planning. Therefore it can be rightly concluded that the intensity of participation
influences the perception. There is an exception observed in the case of
perception on crime. The details are given in the table below.
Page 50
197
Table 5. 34 Correlation between participation and perception factors
Correlations
1 2 3 4 5 6 7 8 9
1. Planning 1
2. Implementation .708**
1
3. Ecology &Environment .114* .121
** 1
4. Culture .334**
.427**
.432**
1
5. Infrastructure .132**
.153**
.340**
.468**
1
6. Income .120**
.185**
.412**
.479**
.635**
1
7. Quality of Life .126**
.129**
.433**
.512**
.473**
.492**
1
8. Knowledge .122**
.248**
.598**
.368**
.324**
.324**
.236**
1
9. Crime .336**
.300**
.290**
.453**
.049 .081 .253**
.143**
1
**. Correlation is significant at the 0.01 level (2-tailed).
*. Correlation is significant at the 0.05 level (2-tailed).
From the above table it is clear that all the correlation coefficient values except
correlation between ecology and planning are significant at 0.01. The values
indicate significant positive correlation between predictive variables and
dependent variables. Form values given in the table it is clear that there exist
strong correlation between independent variables too.
5.13.2 Regression Analysis: Relationship between Participation and Implementation
In order to establish the influence of predictive variables – participation in
planning and implementation - on independent variables a series of stepwise
multiple regression analyses were also conducted. The multiple regression
formula used is
Yn = a + B1x1 +B2x2 +.... Bnxn + ε
Page 51
198
The X1 and X2 are the predictive variables in the study. The multiple regression
analysis was performed also with the intention to test the hypothetical model
proposed in the research methodology chapter. As the first step the descriptive are
given below.
Table 5. 35 Descriptive statistics of variables
Mean
Std.
Deviation
Participation in Planning 1.2698 .63619
Participation in Implementation 1.7355 .66409
Ecological & Environmental Effect 3.5330 .30381
Culture of the Village 3.5324 .29325
Infrastructure 3.7271 .33291
Local Income 3.5811 .25924
Quality of Life of Residents 3.3065 .23476
Knowledge of Residents 3.1194 .55571
Crime 2.9275 .54473
From the stepwise multiple regression analysis R2,
β, F-values and P-values are
reported below in tabular form. R2 gives the significance of the model proposed.
β explains the relationship between Y variable and X variable. In this case the β
explains the relationship between participation (prediction variable = X ) and
perception (dependent variable = Y). F and P explain the same thing. They
explain the significance of β values.
Page 52
199
Table 5. 36 Regression Analysis Values
Dependent Variables R2 β (Beta) Ϝ Ƥ(sig)
Ecological & Environmental Effect .014 .119 7.550 0.006
Culture of the Village .193 .439 125.832 0.000
Infrastructure .038 .196 21.123 0.000
Local Income .051 .227 28.584 0.000
Quality of Life of Residents .031 .176 16.952 0.000
Knowledge of Residents .044 .214 25.186 0.000
Crime .121 .350 73.362 0.000
Stepwise multiple regression method is considered the most parsimonious model.
Each predictive variable is entered in a sequence and the value is accessed. The
advantage of stepwise method is that the relative value of each variable in the
model can be evaluated. The insignificant variables are removed from the model.
Thus stepwise multiple regression analysis helps to ensure the smallest possible
set of predictor variables for a model. The values and significance of the removed
variables are also generated by SPSS for the judgement and evaluation of the
researcher. In this study when analysis was done in all the multiple regression
analysis participation in planning was removed from the model. Moreover in all
the cases participation in planning was not found significant in the model at 0.05
Page 53
200
level (P>0.05). Therefore the values given above give the significance of
participation in implementation in the model.
While doing the analysis multicollinearity of predictive variables were also
analysed. Tolerance is 1- R2. It is generally accepted that a tolerance of less than
0.20 or 0.10 and/or a VIF of 5 or 10 and above indicates a multicollinearity
problem5. In the analysis the tolerance was close to one and hence quite within
acceptable limits. Again this study utilises the R2 because it gives more accurate
measure of relationship between predictor variables and criterion variables than R
values. The adjusted R2 was not considered because the study utilised only two
predictive variables. Adjusted R2 is often used when there are many predictive
variables. Again in the analysis the difference between R2 and adjusted R
2 was
very low.
The value given in the table must be evaluated together with the correlation table.
According to correlation analysis there was strong correlation between predictive
variables and criterion variables. But the multiple regression analysis table gives
more important and clearer insights regarding the proposed model. It is very
obvious that resident participation in implementation significantly influences their
perceptions about the impact of the project. Whereas a peripheral participation in
the planning process is not able to significantly influence the participant
perception. The R2 values are explaining the correlation between the prediction
variables and criterion variable. The R2 values are not very high. The highest R
2
value is observed in the case of perception regarding the influence on culture of
the place. 19% of the perception on preservation on culture and 12% of perception
Page 54
201
on crime is influenced by participation in the implementation of the project. The
finding is very important for the practitioners.
The beta values measure the strength of influence of predictive variable on
criterion variable. It is referring to the slope of Y. Higher the beta value greater
the influence of predictive variable on dependent variable. From the table above
we see that change in the participation in implementation will bring in significant
changes in the perceptions of people. The highest change will be regarding the
perceptions related to cultural impacts and crime impacts of tourism.
F and P values are testing the significance of R values or R2 values. In other
words these are values that test the significance of the whole regression model. In
our case we could see that F and P values are very significant in all the models.
Since F and P values are significant at 0.05 level, in all the cases tested above it
can be rightly assumed that there exists linier relationship between predictive
variables and criterion variables. In other words the alternate hypothesis is
accepted and null hypothesis is rejected.
5.13.3 Relationship between Participation and Perception: Conceptual Model
The findings based on correlation and multiple regression analyses it is very clear
that there exists strong relationship between participation in implementation and
perception. Though according to the values of correlation analysis, participation
in planning also correlates significantly with the perceptions of residents, the
regression analysis do not suggest any significant relationship between the two.
The hypotheses proposed to explain the relationship between participation and
perception was: Resident participation in planning and implementation directly
influences the resident perception on the impact of tourism. On the basis of
Page 55
202
findings of the study the first hypothesis is modified. Resident participation in
implementation directly influences the resident perception on the impact of
tourism. Resident participation in planning process is excluded from the proposed
model. The proposed new model is give below.
Figure 5. 8. Relationship between participation and perception
The above alternate model is proposed to explain the relationship between
participation and resident perception on the impact of tourism.
5.14 Influence of Demographic Variables on Perception
Demographic variables are often found significantly affecting the perception of
people. In this study the influence of gender, age, income, occupation, and level
of education on perception are analysed in detail.
Page 56
203
5.14. 1 Influence of Gender on Perception
Independent Sample T-test was used to analyse the difference in responses
between male and female. Perception differences among both genders in the case
of nine factors are analysed. As the first step mean values of the factors were
calculated.
Table 5. 37 Genderwise Group Statistics
Variables Sex N Mean S D
Planning Male 219 1.2767 .59905
Female 277 1.2643 .70159
Implementation Male 223 1.7552 .74384
Female 264 1.7189 .64762
Infrastructure Male 245 3.7071 .34226
Female 285 3.7443 .32429
Local Income Male 245 3.5867 .26347
Female 285 3.5763 .25591
Quality of Life Male 245 3.2985 .23941
Female 285 3.3134 .23089
Ecology &
Environment
Male 232 3.5283 .32572
Female 259 3.5372 .30696
Culture Male 231 3.5400 .33503
Female 253 3.5254 .27924
Knowledge Male 237 3.1153 .63321
Female 260 3.1231 .51513
Crime Male 232 2.9957 .52862
Female 276 2.8702 .57345
Page 57
204
From the above table we observe that there are differences in the mean values
between male and female. Therefore t-test was conducted to find out the
significance in the differences between mean values. The table below gives t-
value, values for degree of freedom and significance.
Table 5. 38 T-test results: Gender and perception
t-test for Equality of Means
T df
Sig.
(2-tailed)
Planning .209 494 .834
Implementation .574 485 .566
Infrastructure -1.284 528 .200
Local Income .462 528 .644
Quality of Life -.731 528 .465
Ecology & Environment -.312 489 .755
Culture .525 482 .600
Knowledge -.150 495 .881
Crime 2.546 506 .011
From the table above it is clear that there exists no perception difference between
male and female except regarding crime. T-test reveals that the difference in the
mean values in the case of crime is significant at 0.05 level. From the mean given
in table it is clear that females are more concerned about the increase of crime due
to tourism. (In the questionnaire significant reduction in crime = 5 and significant
increase in crime = 1)
Page 58
205
5.14.2 Influence of Age on Perception
Since there were more than two factors in the age groups, ANOVA test is done.
After doing ANOVA the relevant values – sum of squares, degree of freedom,
mean square, f-value and significance- are presented in tabular format.
Table 5. 39 ANOVA results: Age and perception on DMV
Variables Sum of
Squares df
Mean
Square F Sig.
Planning 1.273 4 .318 .783 .537
Implementation 4.781 4 1.195 2.548 .039
Infrastructure 1.434 4 .359 3.292 .011
Local Income .953 4 .238 3.615 .006
Quality of Life .825 4 .206 3.823 .004
Ecology & Environment 1.881 4 .470 4.868 .001
Culture 1.610 4 .403 4.394 .002
Knowledge 5.747 4 1.437 4.485 .001
Crime 4.834 4 1.209 3.996 .003
The results of ANOVA show that the differences in the mean values between
different age groups are significant at 0.05 level except in the case of participation
in planning. Therefore further analysis was done to find out the differing age
groups for each variable using Tukey‟s B and Scheffe tests. These tests further
reaffirmed that there exist significant differences among different age groups
regarding perception on local income and impact on ecology & environment. The
results of both tests showed the same differences among groups. The mean values
are given in groups in the tables below.
Page 59
206
Table 5. 40 Tukey B and Scheffe results for age and local income
Local Income
Age N
Subset for alpha =
0.05
1 2
Tukey B
&
Scheffe a
Below 22 29 3.4481
51- 65 141 3.5481 3.5481
Above 65 61 3.5906
36-50 209 3.5975
22-35 90 3.6310
Means for groups in homogeneous subsets are displayed.
a. Uses Harmonic Mean Sample Size = 67.692.
From the above table it is clear that those below twenty years of age have the least
mean value. Another group that goes with this youngest group is those between
fifty one and sixty five. In the case both these groups tourism might bring
minimum economic benefits. Most of the respondents between 18 and 22 are in
academics and they have little for tourism. Many of those between 51 and 65 are
probably not being employed by anyone. Tourism also is not offering them
significant employment opportunities. However, it should be noted that mean
values are still more than three out of five. That means in general people agree
that tourism is able to generate income for the locality.
Page 60
207
Table 5. 41 Tukey B and Scheffe results for age and ecology & environment
Ecology & Environment
Age N
Subset for alpha = 0.05
1 2
Tukey B
&
Scheffea
Below 22 29 3.4236
51- 65 134 3.4840
36-50 197 3.5279 3.5279
Above 65 58 3.5591 3.5591
22-35 73 3.6595
Means for groups in homogeneous subsets are displayed.
a. Uses Harmonic Mean Sample Size = 64.134.
It is interesting to note that respondents below 22 years and between 55 and 65
have similarity of perceptions regarding ecology and environment. Those in the
said age groups are most conservative about the income generation through
tourism. In the correlation analysis conducted above, strong direct relationship
was observed between income and ecology & environment. Therefore most
probably the opinions of those age groups are influenced by the income factor.
Regarding tourism influence on ecology & environment the respondents in
general are positive. The lowest mean value is 3.4 out of five.
5.14.3 Influence of Income on Perception
To find out the influence of income of the people on their responses, ANOVA
was conducted. The table is given below.
Page 61
208
Table 5. 42 ANOVA results: Income and perception on DMV
Sum of
Squares Df
Mean
Square F Sig.
Planning 4.483 5 .897 2.332 .041
Implementation 15.884 5 3.177 7.278 .000
Infrastructure 1.317 5 .263 2.222 .051
Local Income .916 5 .183 2.544 .027
Quality of Life 1.193 5 .239 4.326 .001
Ecology &
Environment
.824 5 .165 1.640 .148
Culture .993 5 .199 2.128 .061
Knowledge 4.162 5 .832 2.570 .026
Crime 2.920 5 .584 2.014 .075
The ANOVA results show that there are significant differences in the mean values
between different income groups regarding participation in planning, and
implementation, quality of life, and knowledge. The F values are significant at
0.05 level in the case of these four variables. However, further analysis using
Tukey B and Scheffe methods revealed that the mean differences among different
income group are significant only in the case of participation in implementation.
The test results are given below for participation implementation.
Page 62
209
Table 5. 43 Tukey B and Scheffe results: Income and implementation
Implementation
Income of the
family N
Subset for alpha =
0.05
1 2
Tukey Ba
Above 120000 8 2.1250
2000 - 4000 160 2.1563
Below 2000 226 2.1814
4001- 6000 68 2.3529
6001-8000 10 2.9000
8001-12000 15 3.0000
Scheffea
Above 120000 8 2.1250
2000 - 4000 160 2.1563
Below 2000 226 2.1814
4001- 6000 68 2.3529 2.3529
6001-8000 10 2.9000
8001-12000 15 3.0000
Means for groups in homogeneous subsets are displayed.
a. Uses Harmonic Mean Sample Size = 18.925.
From the mean values it is clear that higher income group participated more in the
implementation stage. Participation from the higher income group in the
implementation is found more, probably because of their involvement in setting
up homestays and water related recreation avenues. The advantages of the rich are
evident in both these cases. There are at present sixteen registered homestays in
the island. The rich has the possibilities to spend money for setting up water
related recreation avenues too.
Page 63
210
5.14.4 Influence of Education on Perception
Usually education is one of the important factors significantly influencing the
perception of people. Therefore analysis was done to see how significantly
education influenced the perception of people regarding tourism impacts.
ANOVA was used in this study to test the influence of education on perception.
Table 5. 44 ANOVA results: Education and perception on DMV
Sum of
Squares df
Mean
Square F Sig.
Planning 2.828 3 .943 2.319 .075
Implementation 6.646 3 2.215 4.721 .003
Infrastructure 1.936 3 .645 5.918 .001
Local Income 1.035 3 .345 5.251 .001
Quality of Life .532 3 .177 3.231 .022
Ecology & Environment 1.179 3 .393 4.011 .008
Culture 1.776 3 .592 6.431 .000
Knowledge 7.963 3 2.654 8.550 .000
Crime 3.885 3 1.295 4.321 .005
The ANOVA values above say that education significantly differentiates the
perception of people regarding all variables except participation in planning (P>
0.05). Therefore Scheffe and Tukey B tests were conducted to find out the
differing groups in each case. When this analysis was done no group differences
were noticed in the case of participation in planning, infrastructure, local income,
quality of life, and crime. However, significant group differences were observed
in the case of participation in implementation, ecology & environment, and
knowledge. Relevant tables are presented below.
Page 64
211
Table 5. 45Tukey B and Scheffe results: Education and implementation
Implementation
Education N
Subset for alpha =
0.05
1 2
Tukey B
&
Scheffea
HSS 93 2.1075
10th
and Below 353 2.2153 2.2153
Bachelor Level 61 2.4754
Masters Level 17 2.5294
Means for groups in homogeneous subsets are displayed.
a. Uses Harmonic Mean Sample Size = 45.044.
The results of both Tukey B and Scheffe tests were the same. Those with higher
secondary level of education have lower level of participation in the
implementation of the tourism project. This is probably because majority of those
having HSS level of education are still studying. Therefore they have less time to
participate in the implementation of tourism related projects. On the other hand
majority of respondents in other groups have already completed their studies.
Therefore they would be available to take part in implementing tourism projects.
Table 5. 46 Tukey B and Scheffe results: Education and ecology & environment
Ecology & Environment
Education N
Subset for alpha =
0.05
1 2
Tukey B
&
Scheffea
Masters Level 14 3.4082
10th
and Below 329 3.5076 3.5076
Bachelor Level 59 3.5835 3.5835
HSS 83 3.6179
a. Uses Harmonic Mean Sample Size = 38.660.
Page 65
212
The results of both Tukey B and Scheffe were the same. From the analysis it is
clear that those with Masters level education are not as positive as the other
groups in the case of tourism impacts on ecology and environment. It is
interesting note that close to them come the lowest educated group. Probably they
are not very positive because they are the people who work and live in the island
and have information from their direct personal experience like less fish or
prawns resources.
Difference was also found significant in the case of acquiring knowledge through
tourism. The average mean value for all groups is above three out of five. It
means that there is a general agreement about gaining of knowledge through
tourism. Respondents with lowest level of education had the lowest average
mean. Results of Tukey B and Scheffe tests were the same.
Table 5. 47 Tukey B and Scheffe results: Education and knowledge
Knowledge
Education N
Subset for alpha = 0.05
1 2
Tukey B
&
Scheffea
10th
and Below 342 3.0458
Masters Level 14 3.2143 3.2143
Some College 79 3.2152 3.2152
Bachelor Level 59 3.4181
Means for groups in homogeneous subsets are displayed.
a. Uses Harmonic Mean Sample Size = 38.476.
Page 66
213
Those with lowest level of education have lowest mean value. Majority of the
respondents in this group had only very little formal education – mostly
elementary school level. Therefore their ability to absorb knowledge also will be
limited. However, even that group has an average mean value above three out of
five.
5.14.5 Influence of Occupation on Perception
Occupation of the people is another factor found significantly affecting the
perception of people. There were eight occupational categories in the
questionnaire. But they were regrouped into four for the convenience of analysis.
To understand the influence of occupation on perception ANOVA was used.
Table 5. 48 ANOVA results: Occupation and perception on DMV
Sum of
Squares df
Mean
Square F Sig.
Planning .546 3 .182 .451 .716
Implementation 3.039 3 1.013 2.190 .088
Infrastructure .861 3 .287 2.434 .064
Local Income .949 3 .316 4.454 .004
Quality of Life 2.145 3 .715 13.018 .000
Ecology & Environment .936 3 .312 3.187 .024
Culture 1.370 3 .457 4.840 .003
Knowledge 1.906 3 .635 1.945 .122
Crime 2.924 3 .975 3.236 .022
Page 67
214
The ANOVA results show that there are significant differences in the perceptions
between people in different occupations. The mean differences are significant at
0.05 level, in the case of local income, quality of life, ecology & environment,
culture, and crime. However based on Tukey B and Scheffe tests differences in
perceptions are observed only in the case of local income and quality of life.
Table 5. 49 Tukey B and Scheffe results: Occupation and local income
Local Income
Occupation N
Subset for alpha =
0.05
1 2
Tukey B
&
Scheffea
Education 22 3.4206
Daily Wages 200 3.5606
Salaried 43 3.5656
Home
Making
214
3.6178
Means for groups in homogeneous subsets are displayed.
a. Uses Harmonic Mean Sample Size = 51.031.
The results of both Tukey B and Scheffe were the same. Those still attending
academic institutions are a different group as per both tests. The mean score is
lowest for those in the academics. Those in the education cannot give their
services to tourism and earn income from it. Probably that is the reason why they
have the lowest average mean value. However, it is to be noted that even in their
case the average mean value is above 3.4 out of five.
Page 68
215
Table 5. 50 Tukey B and Scheffe results: Occupation and quality of life
Quality of Life
Occupation N
Subset for alpha = 0.05
1 2 3
Tukey Ba Education 22 3.1493
Daily Wages 200 3.2555
Salaried 43 3.2898 3.2898
Home Making 214 3.3772
Scheffea Education 22 3.1493
Daily Wages 200 3.2555 3.2555
Salaried 43 3.2898
Home Making 214 3.3772
Means for groups in homogeneous subsets are displayed.
a. Uses Harmonic Mean Sample Size = 51.031.
According to Tukey B based on their responses people could be divided into three
categories. Scheffe divides them into two groups. Lowest mean value regarding
the perception of quality of life is among those who attend the school. The highest
mean value is found in the case of home makers. In fact tourism has given jobs
for many unemployed women in the village. They run teashops, conduct food
fests, participate in the artistic performances for tourists etc. Therefore tourism
was able to enhance the quality of life of villagers, especially the women.
5.14. 6 Influence of Duration of Stay on Perception
In many research studies, the number of years of stay is found significantly
influencing the perception of residents towards tourism. In many rural regions, the
traditional settlers object tourism development, because of the fear of damaging
Page 69
216
their culture and peaceful existence. In this research ANOVA was conducted to
evaluate the influence of number years stay on perception of people.
Table 5. 51ANOVA results: Duration stay and perception on DMV
Sum of
Squares df
Mean
Square F Sig.
Planning 3.122 3 1.041 2.584 .053
Implementation 2.500 3 .833 1.761 .154
Infrastructure 1.322 3 .441 4.037 .007
Local Income .505 3 .168 2.521 .057
Quality of Life .489 3 .163 2.987 .031
Ecology & Environment .161 3 .054 .537 .657
Culture .207 3 .069 .732 .533
Knowledge 3.801 3 1.267 3.915 .009
Crime 3.073 3 1.024 3.355 .019
From the table above it is clear that number of years of stay do not significantly
differentiate the perceptions of people. Only two differences are found significant
at 0.05 level – perceptions on infrastructure and quality of life.
Tukey B and Scheffe tests were further conducted to find out the groups with
significant differences in perception. The test results did not differentiate people
based on number of years of stay. In the case of infrastructure the difference
between mean values ranged between 3.66 and 3.82 and in the case of quality of
life it ranged from 3.2 to 3.3. Hence all of them were placed as one group. In
other words, in Kumbalangi, there are no perceptual differences between people
based on the number of years of stay in the village.
Page 70
217
5.15 Rural Tourism Influence on Development Management
Tourism in Kumbalangi is a catalyst to the development of the region. The rural
tourism model helps the region to maintain its integrity while moving towards
development. The rural tourism model being experimented in Kumbalangi is
called endogenous tourism. “Endogenous tourism development is based mainly
on local and/ or national sources while exogenous is based primarily on foreign or
transnational capital.”6 Development management also focuses on integrated
development of the region and therefore socio-cultural and environmental aspects
of development are considered equally important to economic development. The
following table facilitates a comparison of the impact of different development
management variables used in this study. The table explains the relative influence
of tourism on different development management variables under study. All the
values are the result of grouping of all the factors under one variable.
Table 5. 52 Tourism impact on development
Minimum Maximum Mean
Std.
Deviation
Planning 1.00 5.00 1.27 .65768
Implementation 1.00 5.00 1.74 .69284
Crime 1.67 4.50 2.93 .55642
Knowledge 2.00 5.00 3.12 .57390
Quality of life 2.64 4.14 3.31 .23476
Culture 2.58 4.92 3.53 .30690
Ecology & Environment 2.57 4.71 3.53 .31567
Income 2.68 4.68 3.58 .25924
Infrastructure 2.83 4.94 3.73 .33291
Page 71
218
Figure 5. 9. Relationship between participation and perception
The table and graph give us information regarding the impact of tourism on
different development management variables. Participation in planning has the
lowest mean value and infrastructure development has the highest mean value.
When we look at the table we also see that the standard deviation is also one of
the lowest for infrastructure. Participation in planning and implementation have
the highest standard deviations too. The lowest standard deviation is found for
quality of life. The mean value also is comparatively on the higher side. Tourism
development in Kumbalangi has resulted in creating additional income without
damages to ecology and environment. Tourism impact on culture also is
considered positive.
Resident participation is found very low both in the planning phase and
implementation phase. Based on the model proposed above, participation in
implementation has significant positive influence on perceptions of people.
1.27
1.74
2.93
3.12
3.31
3.53
3.53
3.58
3.73
1.00 1.50 2.00 2.50 3.00 3.50 4.00
Planning
Implementation
Crime
Knowledge
Quality of life
Culture
Ecology & Environment
Income
Infrastructure
Page 72
219
Several studies have already proved the importance of positive residents‟
perception in the implementation of tourism projects. The attitude and perception
of the host community directly influences the experience of guests too.
5.16 Summary
There are two approaches in analysing and examining tourism impacts. One is the
scientific monitoring of the actual changes in the host area. It involves the
collection of historic data and compares it with the current data after the
implementation of tourism. The other is to evaluate what the residents perceive to
be the case7. The second approach tries to collect the perception of residents
regarding different aspects of tourism. This research follows the second approach
in collecting and analysing data.
Kumbalangi was the first endogenous tourism project India, to complete its
implementation. The Government of India communication clearly outlined the
purpose of the project. „Endogenous Tourism is a new approach in tourism that
aims at maximizing local control and benefits. It tries to maximise economic
benefits to the residents and enhance their quality of life with minimum cost to the
community. Therefore rural life experience itself is presented as the tourism
product.‟8 The study indicates that the broad objectives of the project are
successfully accomplished to certain level. The study has also found that
endogenous rural tourism model implemented in Kumbalangi is a successful
model of rural development management too.
However, the project implemented in Kumbalangi needs to enhance the
participation and involvement of residents. From the model presented in this
Page 73
220
chapter it is clear that resident participation especially in the implementation of
the project significantly influences the generation of positive perception about the
project. Long term success of any development project is highly linked to the
participation of residents.
Page 74
221
Endnotes and References
1 Pan Gs .P. (2002). Private sector tourism spending, Legislative Reference Bureau, State
capital, Honolulu, Hawai, Report # 5
2 Clark G. & Chabrel M. (2007). Measuring integrated rural tourism, Tourism
Geographies, 9 (4), p. 371-386
3 Ryan C. Crime, Violence, Terrorism and Tourism: An Accidental or Intrinsic
Relationship? Tourism and Recreation Studies Unit, Nottingham Business School, UK
4 Chester N. M. (1990). The Drug Solution-Regulating Drugs According to Principles of
Efficiency, Justice and Democracy, Carlton University Press, p 255
5 Garson D. (2010 Spring). Multiple Regression, Retrieved February 2010, from
http://faculty.chass.ncsu.edu/garson/PA765/regress.htm
6 Apostolopoulos, Y., & Sonmez, S.F. (1999), From farmers and shepherds to
shopkeepers and hoteliers: Constituency-differentiated experiences of endogenous
tourism in the Greek island of Zakynthos. International Journal of Tourism Research, 1,
p. 413-427
7 Lu C.J. & Var T. (1986). Resident attitudes towards tourism impacts in Hawaii. Annals
of Tourism Research, 13(2), p.17 -37
8 Endogenous Tourism for Rural Livelihoods. (2007). Government of India. Retrieved
August 25, 2009, from: http://data.undp.org.in/facts heets/hd-rl/jan08/ETP.pdf