28
103

103

104
CHAPTER 4: Economic Profile and Development
The Economic Profile focuses on the sub-sectors on Labor and Employment, Family Income and
Expenditure, Trade and Industry and Tourism
4.1 LABOR AND EMPLOYMENT
The Labor Force Survey (LFS) conducted quarterly every year by the Philippine Statistics
Authority (PSA) has been the main employment data of the city. From the year 2004 onwards,
city level data were no longer made available in the LFS. The increase in population over the
years required increasing area samples in the survey. With no increase in the sample size, city
level figures became less accurate with a wider margin of error, therefore no longer reflected in
the results. Due to absence of city data and for the purpose of getting more updated labor and
employment statistics, NCR figures have been used to represent those of the city. This is
attributed to the large representation of the city’s population and land area to the NCR. The city
population as of 2015 based on PSA official census result is almost one-fourth or 23% of the total
population of the NCR and one-fifth or 20% of its land area which provide a great influence in
regional economic status. Even from past LFS data, when city level data were still available, it
could be noted that the city’s figures were not far off or just followed closely those of the region.
Quezon City’s projected population in 2018 is 3,040,672 or 23% of the NCR’s population
(based on official result as per PSA 2015 Census of Population). The projected working age
population 15 years old and over is 2,153,455 (70.8% of the entire population based on the
official PSA result).
The working age population is divided into:
1. The economically active population or those in the labor force.
This group is 60.3% (1,298,533) of the working age population composed of the employed
and the unemployed. Using the NCR’s rates, employment has been placed at 93.4% representing
about 1,212,830 of city’s population which also includes the underemployed (those who are
working less than the regular 8-hours per day and still looking for additional work) of 7.2% or
87,324. There are more employed males (55.8% or 676,759) than females (44.2% or 536,071).
The unemployment on the other hand, is placed at 6.6% or about 85,703 of city’s population.
(Table ED-1)
2. The economically inactive population or those not in the labor force.
The economically inactive or those not in the labor force on the other hand, makes up
39.7% or about 854,922 of the working age population not looking for work composed of
students, housewives, retirees, the sick, PWDs , etc.

105
Table ED-1:: NCR / QC Population by Employment Status -2018
EMPLOYMENT STATUS NUMBER % SHARE
Working Age Population 15 years old and over
2,153,455 100%
Labor Force Population 1,298,533 60.3
- Employed (includes the underemployed of 7.2% (87,324)
1,212,830
93.4
- Unemployed 85,703 6.6
Total 100.0
Not in the Labor Force (students, housewives, retirees, sick, PWDs)
854,922
Source: Philippines Statistics Authority (PSA) Labor Force Survey
Table ED-2 : Labor Force Participation: Employment, Unemployment Underemployment and Not in the Labor Force; Rates of NCR/QC: 2010-2018
YEAR
LABOR FORCE PARTICIPATION EMPLOYMENT UNEMPLOYMENT
UNDER EMPLOYMENT
NOT IN THE LABOR FORCE
NUMBER RATE NUMBER RATE NUMBER RATE NUMBER RATE NUMBER RATE 2010 1,215,998 62.4 1,076,158 88.5 139,840 11.5 128,063 11.9 732,717 37.6
2011 1,265,745 63.0 1,122,716 88.7 143,029 11.3 163,917 14.6 743,374 37.0
2012 1,303,012 63.1 1,164,893 89.4 138,119 10.6 167,745 14.4 761,983 36.9
2013 1,348,546 63.5 1,209,646 89.7 138,900 10.3 134,271 11.1 775,148 36.5
2014 1,407,399 64.4 1,263,844 89.8 143,555 10.2 136,495 10.8 778,003 35.6
2015 1,307,948 62.9 1,196,772 91.5 111,176 8.5 119,677 10.0 771,460 37.1
2016 1,323,291 62.9 1,234,631 93.3 88,660 6.7 107,413 8.7 780,510 37.1
2017 1,300,505 61.1 1,204,268 92.6 96,237 7.4 111,997 9.3 827,981 38.9
2018 1,298,533 60.3 1,212,830 93.4 85,703 6.6 87,324 7.2 854,922 39.7
Source: PSA Labor Force Survey (2010 & 2015 figures are Official Census results, figures for other years are
projected / estimates)
The employment rate is shown to be slightly improving every year. Underemployment
(which is part of the employment figure) in the last five years (2011 to 2016) is also favorably
decreasing but slightly increased in 2017 in spite of the growing labor force but also decreased to
7.2% in 2018. (Table ED-2)
Figure ED-1 : Labor Force 2018
Being supported by the employed population are 1,827,841 dependent population
composed of the following:
- those in the dependent age below 15 years old (887,216)
- the economically inactive (854,922)
- and the unemployed persons (85,703)
1,212,830 (93.4%)
85,703 (6.6%)
Employed Unemployed

106
Dependency ratio is therefore computed at 1.5:1 (dependent:worker) which means that
there are about three dependents for every two (2) workers for a household with an average size
of five (5) persons.
On Employment by Class of Worker (PSA data using the NCR rate), majority (988,589) or
about 81.51% of those employed are wage and salaried workers (worked for private household,
private establishment, worked for government or government controlled corporation and worked
with pay in own family-operated farm or business), followed by the self-employed without any
paid employee with about 186,898 or 15.41%, Employer in own Family-operated Farm or
Business 21,002 or 1.73% and Worked without pay in own Family-operated Farm or Business
16,341 or 1.35%. There are more male Wage and Salaried Workers 57.90 % (702,229) than
female 42.10% (510,601).
As to Major occupation in 2018 based on the NCR rate, the top 3 major occupations are
persons employed in Service, shops and market sales workers with 19.54% (236,944),
Elementary occupations (laborers and unskilled workers) 17.36% (210,587) and Managers
(Officials of Government, special interest organizations, corporate executives, managers,
managing proprietors and supervisors) with 16.65% (201,899). By sex segregation, males
formed the largest percentage group with 57.90% than females with 42.10%.
Table ED-3 : Number and Percentage Distribution of Employed Person by Major Occupation and by Sex: Quezon City Using NCR Rate: 2018
MAJOR OCCUPATION MALE FEMALE BOTH SEXES
NUMBER % NUMBER % NUMBER %
Elementary Occupations (laborers and unskilled workers)
124,295 17.70 86,292 16.90 210,587 17.36
Service, Shops and Market sales workers 117,974 16.79 118,970 23.30 236,944 19.52
Plant and machine operators and assemblers 103,228 14.70 7,659 1.50 110,887 9.14
Managers (Official of government and special interests organizations, corporate executives, managers, managing proprietors and supervisors)
96,205 13.69 105,694 20.70 201,899 16.64
Craft and related trade workers 94,099 13.40 14,807 2.90 108,906 9.05
Clerks (clerical support workers) 66,010 9.40 87,823 17.20 153,833 12.68
Technicians and associate professional 48,454 6.90 37,785 7.40 86,239 7.11
Professional 46,347 6.62 51,571 10.10 97,918 8.07
Skilled agricultural workers (farmers), forestry workers and fishery workers (fishermen)
2,809 0.40 - - 2,809 0.23
Armed Forces Occupation (special occupations)
2,808 0.40 - - 2,808 0.23
Total 702,229 100.00 510,601 100.00 1,212,830 100.00
In a separate study or census of the PSA on 2017 Business Establishments by Industry
and Employment, NCR as in the past has been shown to have the highest share (37.66%) in the
country’s total employment figure as it has been known to be the center of major business
activities in the country. The top three (3) NCR cities on employment are: Quezon City registered
the highest employment (708,369) with 24.0% of the total regional employment (2,949,627),
followed by Makati 19.23% (567,358) and Manila 10.60% (312,707) See Table ED-4.

107
Table ED – 4 Number and Percentage of Employed Persons in the
Philippines, NCR, by Other Cities in NCR, 2017
GEOGRAPHICAL
COVERAGE 2017 % from Phils. % from NCR
Philippines 7,832,089 National Capital Region 2,949,627 37.66 Quezon City 708,369 9.04 24.02 Makati City 567,358 7.24 19.23 Manila City 312,707 3.99 10.60 Pasig City 247,513 3.16 8.39 Taguig City 198,020 2.53 6.71 Mandaluyong City 180,902 2.31 6.13 Paranaque City 148,604 1.90 5.04 Pasay City 114,505 1.46 3.88 Caloocan City 107,213 1.37 3.63 Muntinlupa City 101,600 1.30 3.44 Valenzuela City 92,839 1.19 3.15 San Juan City 44,588 0.57 1.51 Las Piñas City 41,156 0.53 1.40 Marikina City 31,360 0.40 1.06 Malabon City 30,220 0.39 1.02 Navotas City 19,150 0.24 0.65 Pateros 3,523 0.04 0.12
The city’s top five industries with highest employment are: Administrative and Support
Service Activities with 219,891 or 31.04%, Wholesale and Retail Trade and Repair of Motor
Vehicles and Motorcycles with 143,406 (20.24%), Construction with 72,290 (10.21%),
Accommodation and Food Services/Hotel and Restaurant with 59,588 (8.41%) and
Manufacturing with 56,871 or 8.03%.
Table ED-5 Number and Percentage of Employed Persons by Type of Industry Classification, Quezon City: 2017
INDUSTRY CLASSIFICATION NUMBER %
Administrative and Support Services Activities 219,891 31.04 Wholesale and Retail Trade; Repair of Motor Vehicles and Motorcycles
143,406 20.24
Construction 72,290 10.21 Accommodation and Food Service Activities 59,558 8.41 Manufacturing 56,871 8.03 Education 28,925 4.08 Information and Communication 25,006 3.53 Financial and Insurance Activities 20,750 2.93 Professional, Scientific and Technical Activities 18,739 2.65 Human Health and Social Work Activities 17,986 2.54 Other Service Activities 17,707 2.50 Transport and Storage 8,655 1.22 Real Estate Activities 8,653 1.22 Arts, Entertainment and Recreation 2,972 0.42 Water Supply, Sewerage, Waste Management and Remediation Activities
2,252 0.32
Electricity, Gas, Steam and Air Conditioning Supply 2,239 0.32 Agriculture, Forestry and Fisheries 1,694 0.24 Mining and Quarrying 775 0.11 Total 708,369 100.00
Source: Philippine Statistics Authority (PSA)

108
The Informal Sector/Economy
In view of the limited employment opportunities, many are forced to engage in small-
scale entrepreneurial activities mostly unregistered, unregulated, unmonitored. These are those
who irregularly engaged in entrepreneurial activities working in full, part time or seasonal basis
who are not normally paying taxes. Section 4 of the Quezon City Ordinance No. SP-2512, S-2016
known as “The Quezon City Informal Economy Ordinance” classified the informal economy
workers into home-based workers (own account/self-employed), vendors, transportation
sectors, non-corporate construction workers and others such as street workers, waste workers
and volunteer service workers in private and public. On the other hand, Section 3 (a) defines
Informal Economy as all economic activities by workers and economic units that are in law or in
practice not covered or insufficiently covered by formal arrangements and does not cover illicit
activities. However, to uphold the rights, ensure the protection and promote the welfare of these
workers, the city government enacted said Ordinance, providing the basic framework for the
development programs for the workers in the informal economy and created the Informal
Economy Development Council.
Data available from the Market Development and Administration Department (MDAD)
had recorded 54 temporary vending sites in six (6) Districts of the city with 2,026 vendors. The
Tricycle Regulation Unit (TRU) under the Department of Public Order and Safety had 152
Tricycle Operators and Drivers Associations (TODA) operating with 24,756 units and drivers
with approved route measured capacity (RMC) by the Tricycle Franchising Board (TFB). The
Public Employment Service Office (PESO) in coordination with DOLE is the agency in-charge in
the documentation and monitoring of 779 marginalized/disadvantaged beneficiaries in the
provision of emergency short-term wage employment assistance Program through the Tulong
Panghanapbuhay sa Ating Disadvantaged workers (TUPAD).
Overseas Filipino Workers (OFW)
For better employment opportunities, many are forced to seek employment abroad.
These are the Overseas Filipino Workers (OFWS), who contribute on nations’ economic well-
being. The OFW’s foreign currency remittances constitute a big part of the Philippines National
Gross Product (GNP). Based on records of Overseas Workers Welfare Administration (OWWA)
membership as of 2018, OFW from Quezon City ranked highest in the NCR with 193,101 or
21.83% share. Male is 109,970 or 56.95%, Female comprises of 74,921 or 38.80% and Not
stated 8,300 or 4.30%
By type, land-based OFWs show a bigger number with 149,052 (77.19%) compared to
sea-based 37,570 (19.46%). The land-based and sea-based OFWs are largely dominated by
males with 52.79% and 76.69% share respectively.
According to Philippine Overseas Employment Administration (POEA) records in 2017,
there were eleven thousand five hundred forty (11,540) OFW new hires from Quezon City
deployed in foreign countries, 35.85% (4,105) are males and 64.93% (7,435) are females. In the
NCR, there are more female 20.48% (36,305) OFWs than male 19.81% (20,720) OFWs deployed
in foreign countries. Majority were deployed in the Middle East Countries such as: Saudi Arabia,
Qatar, United Arab Emirates, Kuwait, Bahrain, Oman, Jordan while the remaining others were
deployed in other Asian countries, Canada and Guam. Contributing to the city’s unemployment
problems are the returning OFWs with finished and non-renewed work contracts from abroad.
Some have returned as they have been maltreated and abused by employer, jailed for various
109
reasons/offenses, or repatriated due to armed conflicts/civil war in the country where they
worked from.
According to their job and skills, QC-OFWs deployed in foreign countries were ranked
accordingly: Domestic Cleaners and Helpers 17.00% (1,962), Manufacturing Laborers 6.79%
(783), Waiters 3.62% (418), Dancers and Choreographers 1.97% (227), Home Based Personal
Care Workers 1.59% (183), Nursing Professionals 1.58% (182), Musicians, Singers and
Composers 1.31% (151), Health Care Assistants 1.10% (127), and others.
Various Programs are continuously undertaken by the city on employment generation,
promotion and protection where such services are mostly lodged with the PESO. Among these
programs are: Jobs Fair/Jobs Referrals, Workers Hiring for Infrastructure Projects (WHIP),
Youth Employment Programs Summer Job, TUPAD, National Skills Registry System (a
comprehensive skill/job mapping and matching service facility), Retooling Assistance for
Employment of Returning OFWs, creation of a Migrants Resource Center and profiling of OFWs of
QC. The QC Small Business Development and Promotions Office (SBDPO) also undertakes
livelihood technology skills training (e.g. on production of processed food, recycled paper-based
products, cloth and personal care products, etc.) and entrepreneurship seminars. It also has the
Micro-Credit Program or Puhunang Pangkaunlaran ng Sikap Buhay (PPSB) another Livelihood
assistance program that provides financial assistance including assistance in the Formation of
Cooperatives (Cooperative Development Program).
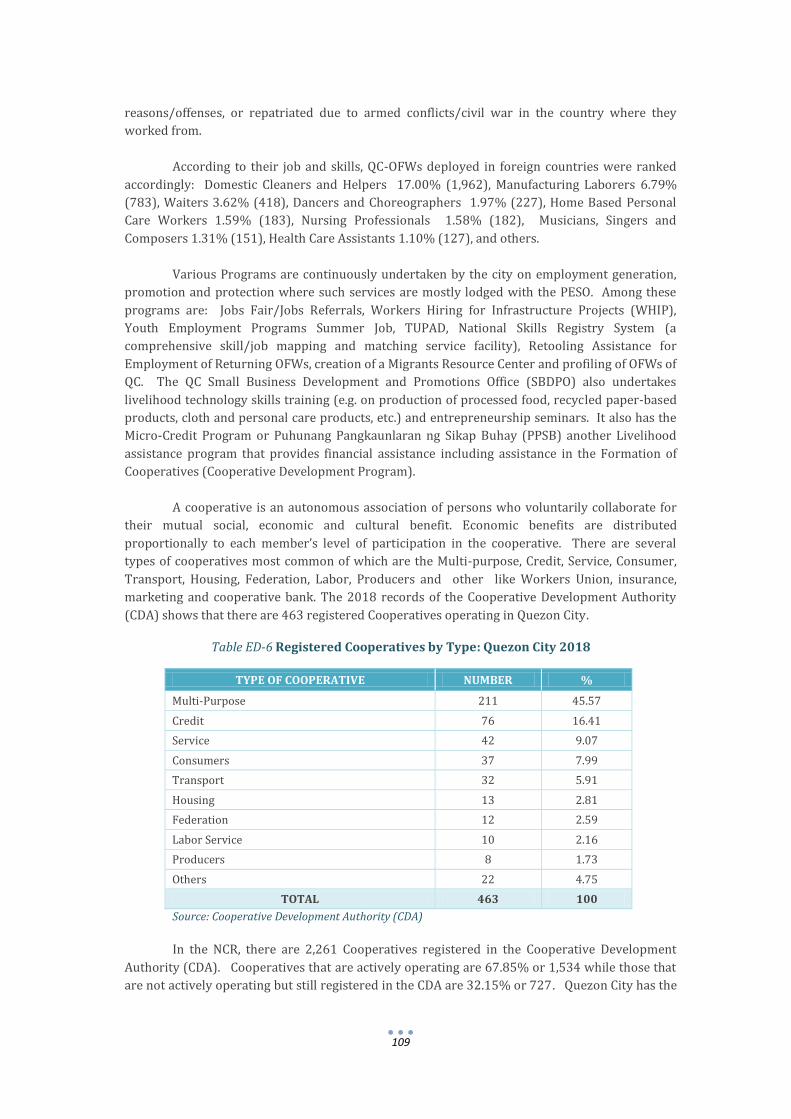
A cooperative is an autonomous association of persons who voluntarily collaborate for
their mutual social, economic and cultural benefit. Economic benefits are distributed
proportionally to each member’s level of participation in the cooperative. There are several
types of cooperatives most common of which are the Multi-purpose, Credit, Service, Consumer,
Transport, Housing, Federation, Labor, Producers and other like Workers Union, insurance,
marketing and cooperative bank. The 2018 records of the Cooperative Development Authority
(CDA) shows that there are 463 registered Cooperatives operating in Quezon City.
Table ED-6 Registered Cooperatives by Type: Quezon City 2018
TYPE OF COOPERATIVE NUMBER %
Multi-Purpose 211 45.57
Credit 76 16.41
Service 42 9.07
Consumers 37 7.99
Transport 32 5.91
Housing 13 2.81
Federation 12 2.59
Labor Service 10 2.16
Producers 8 1.73
Others 22 4.75
TOTAL 463 100
Source: Cooperative Development Authority (CDA)
In the NCR, there are 2,261 Cooperatives registered in the Cooperative Development
Authority (CDA). Cooperatives that are actively operating are 67.85% or 1,534 while those that
are not actively operating but still registered in the CDA are 32.15% or 727. Quezon City has the

110
highest number of registered cooperatives (active and inactive) with 29.68% of the NCR’s figure,
followed by Manila (13.36%), Makati (8.89%) and Pasig (6.90%).
4.2 FAMILY INCOME AND EXPENDITURES
The Family Income and Expenditure Survey (FIES) is a nationwide survey of households
conducted by the Philippine Statistics Authority (PSA) every three (3) years. The results of the
2015 FIES is presented below inasmuch as the results of 2018 data is expected to be released by
the second quarter of 2019. FIES is the main source of data on family income and expenditure,
which include among others, levels of consumption by item of expenditure as well as sources of
income in cash and in kind. The results of FIES provide information on the levels of living and
disparities in income of Filipino families, as well as their spending patterns.
4.2.1 Family Income
In 2015, Filipino families had an average monthly income of P22,250.00 based on the
results of the 2015 Family Income and Expenditures Survey (FIES) conducted by the Philippine
Statistics Authority (PSA). It increased by 13.6% from the average monthly income of P19,583.00
in the year 2012. On the other hand, families in the National Capital Region (NCR) earned an
average monthly income of P35,417.00 in 2015, increasing by 12.1% from the 2012 figure of
P31,583.00.
In the absence of more updated income statistics, NCR figures have been used to
represent that of the city in view that the population of the city makes up ¼ that of NCR. Even
with past data, it could be noted that the city’s figures were not far off or just followed closely
that of the region’s figures.
Table ED-7: Average Family Income, Expenditure and Savings
Philippines, NCR and Quezon City: 2003 – 2015
YEAR
AVERAGE MONTHLY
INCOME
AVERAGE MONTHLY
EXPENDITURE
AVERAGE MONTHLY
SAVINGS
Phils. NCR QC Phils. NCR QC Phils. NCR QC
2015 22,250 35,417 *** 17,917 29,083 *** 4,333 6,333 ***
2012 19,583 31,583 *** 16,083 27,083 *** 3,500 4,500 ***
2009 17,167 29,670 29,441 14,667 25,747 26,169 2,500 3,923 3,272
2006 14,394 25,916 *** 12,263 21,500 *** 2,131 4,416 ***
2003 12,324 22,204 *** 10,308 18,159 *** 2,016 4,045 ***
Source: PSA-FIES *** No city disaggregation for years 2003, 2006 and 2012 & 2015
Families were grouped and ranked into per capita income deciles. The richest decile
represents families belonging to the highest ten percent in terms of per capita income, while the
poorest decile represents families in the lowest ten percent.
In the Philippines from 2012 to 2015, average annual family income in all deciles
increased, the average ranged from Php86,000.00 for the first income decile (lowest 10 percent)
to Php786,000.00 for the tenth income decile (highest 10 percent) in 2015. The average annual
family income of the tenth decile in 2015 was about 9 times that of the first decile, while it was 10
times that of the first decile in 2012 (Table ED-5).

111
ANNUAL MONTHLY ANNUAL MONTHLY ANNUAL MONTHLY ANNUAL MONTHLY ANNUAL MONTHLY ANNUAL MONTHLY
First Decile 86,000 7,167 174,000 14,500 89,000 7,417 178,000 14,833 (3,000) (250) (4,000) (333)
Second Decile 114,000 9,500 223,000 18,583 110,000 9,167 212,000 17,667 4,000 333 11,000 917
Third Decile 133,000 11,083 260,000 21,667 122,000 10,167 241,000 20,083 11,000 917 19,000 1,583
Fourth Decile 156,000 13,000 282,000 23,500 140,000 11,667 251,000 20,917 16,000 1,333 31,000 2,583
Fifth Decile 182,000 15,167 330,000 27,500 161,000 13,417 284,000 23,667 21,000 1,750 46,000 3,833
Sixth Decile 218,000 18,167 362,000 30,167 189,000 15,750 306,000 25,500 29,000 2,417 56,000 4,667
Seventh Decile 259,000 21,583 411,000 34,250 217,000 18,083 344,000 28,667 42,000 3,500 67,000 5,583
Eighth Decile 320,000 26,667 487,000 40,583 260,000 21,667 398,000 33,167 60,000 5,000 89,000 7,417
Ninth Decile 415,000 34,583 601,000 50,083 326,000 27,167 475,000 39,583 89,000 7,417 126,000 10,500
Tenth Decile 786,000 65,500 1,120,000 93,333 534,000 44,500 799,000 66,583 252,000 21,000 321,000 26,750
Ratio of Tenth Decile
to First Decile
PHILIPPINES NCR
9.1 6.4 6.0 4.5
PHILIPPINES NCRPER CAPITAL
INCOME DECILE
INCOME EXPENDITURE SAVINGS
PHILIPPINES NCR
In the National Capital Region, average annual family income in all deciles also increased,
the average ranged from Php174,000.00 for the first income decile to Php1.12 Million for the
tenth decile. The average annual family income of the tenth decile was about 6 times that of the
first decile in the years 2012 and 2015.
Table ED-8 : Average Income, Average Expenditure and Average Savings of Families by Per
Capita Income Decile, Philippines and NCR 2015
Source: Philippine Statistics Authority (PSA)
Families in the poorest decile registered a negative monthly savings of Php250.00 and
Php333.00 in the Philippines and NCR, respectively. Families in the richest decile registered
monthly savings of Php21,000.00 and Php26,750.00 in the Philippines and NCR, respectively
According to the results from the 2015 FIES, the Gini coefficient, which is a measure of
income inequality within a population, was estimated at 0.4439 for 2015. The figure is slightly
lower than the 2012 ratio of 0.4605 which may indicate some improvement in the income
distribution among families. A Gini coefficient ranges from 0 to 1, with 0 indicating perfect
income equality among families, while a value of 1 indicates absolute income inequality.
Table ED-9: Gini Coefficient, Philippines and NCR: 2003-2015
YEAR PHILIPPINES NCR
2015 0.4439 0.3909
2012 0.4605 0.4028
2009 0.4484 0.3953
2006 0.4580 0.3988
2003 0.4605 0.4021
Source: Philippine Statistics Authority
Sources of Income
In terms of sources of income for families in the NCR and which would likely be
representative of Quezon City, majority or 68.2% of the families in the National Capital Region
rely on salaries/wages as their main source of income; 19.1% rely on other sources of income
which includes cash receipts from local and abroad, pension and retirement, dividends and
investments, house rental, interest income, etc.; and the remaining 12.7% rely on entrepreneurial
activities (wholesale and retail trade, small-scale manufacturing, transportation and
communication services, community, social and other services).

112
Wages and Salaries, 68.2%
Other Source of Income, 12.7%
Entrepreneurial
Activities, 19.1%
Figure ED-2 : Distribution of Families by Main Source of Income NCR 2015
4.2.2 Family Expenditure
Filipino families in 2015 had an average monthly expenditure of P17,917.00 increasing by
11.4% from the average monthly family expenditure of P16,083.00 in 2012. On the other hand,
average monthly expenditure in NCR was registered at P29,083.00 in 2015. It increased by 7.4%
from the average monthly expenditure of P27,083.00 in 2012.
In terms of pattern of expenditure, Filipino families spent about 41.9% on food (33.7%
spent on foods consumed at home and 8.2% regularly spent on foods consumed outside the
home), 12.2% on housing, 7.9% on water, electricity, gas and other fuels and 6.2% on
transportation. Other expenditure items include expenses on education, health, durable
furniture and equipment and special family occasion.
Table ED-10: Percent Distribution of Total Family Expenditure
by Expenditure Group: Philippines & NCR (2015)
Source: Philippine Statistics Authority (PSA)
EXPENDITURE ITEM PHILIPPINES NCR
Food expenditures 41.9 36.3 Alcoholic beverages 0.5 0.4 Tobacco 1.1 0.8 Other Vegetable-Based products 0.0 0.0 Clothing and Footwear 2.4 2.0 Furnishings and Routine Household Maintenance 2.5 2.8 Health 3.7 2.9 House Rent/Rental Value 12.2 18.2 Water, Electricity, Gas and Other Fuels 7.9 8.8 Transport 6.2 6.6 Communication 2.2 2.9 Recreation and Culture 0.8 0.8 Education 3.8 3.5 Accommodation Services 0.2 0.0 Miscellaneous Goods and Services 6.3 6.3 Durable Furniture and Equipment 2.5 1.5 Special Family Occasion 2.5 1.5 Other Expenditure 3.1 4.6
TOTAL 100.0 100.0

113
In the NCR, about 36.3% of the total annual expenditures was spent on food, 18.2% on
House Rental and about 8.8% was spent on basic utilities as water, electricity, gas and other fuels.
Other major expenditures include Transport (6.6%), Education (3.5%) and Health (2.9%).
Food and Poverty Thresholds
Food threshold is the minimum income required to meet the basic food needs, satisfying
the nutritional requirements set by the Food and Nutrition Research Institute (FNRI) to ensure
that one remains economically and socially productive. On the other hand, poverty threshold is
the minimum income required to meet the basic food and non-food needs such as clothing, fuel,
light and water, housing, rental of occupied dwelling units, transportation and communication,
health and education expenses, non-durable furnishing, household operations and personal care
and effects.
In the first semester of 2018, a family of five needed no less than PhP 7,337, on average, to
meet the family’s basic food needs for a month. This amount is the food threshold. On the other
hand, no less than Php10,481.00, on average, was needed to meet both basic food and non-food
needs of a family of five in a month. This amount is the poverty threshold. These are 11% higher
than the food and poverty thresholds from the first semester of 2015.
In the National Capital Region, first semester of 2018, a family of five needed at least
Php8,207.00 (monthly food threshold), on average, every month to meet the family’s basic food
needs and at least Php11,752.00 (monthly poverty threshold), on average, every month to meet
both basic food and non-food needs. Food and poverty threshold in NCR indicate increases of
about 11% from the first semester of 2015 to the first semester of 2018.
Table ED-11: Poverty and Food Thresholds ; Philippines and NCR: 2006, 2009, 2012 & 2015 and First Semester of 2015 and 2018
STATISTICS 2006 2009 2012 2015 2018
Full Year
First Semester
First Semester
Monthly Poverty Threshold: Philippines 5,566 7,030 7,890 9,064 9,064 10,481 National Capital Region (NCR) 6,541 8,011 8,477 10,420 10,420 11,752 Monthly Food Threshold: Philippines 3,878 4,908 5,513 6,329 6,600 7,337 National Capital Region 4,568 5,594 5,919 7,276 7,335 8,207 Source: Philippine Statistics Authority (PSA)
Poverty
Poverty incidence among Filipinos families in the first semester of 2018 was estimated at
16.1 percent. This is defined as the proportion of families whose income is below the poverty line
to the total number of families. This was estimated at 22.2 percent in the same period in 2015.
In the National Capital Region, poverty incidence among families increased by 0.3% in the
first semester of 2018 which was estimated at 4.9% from the 4.6% registered in the first
semester of 2015.
In Quezon City, poverty incidence dropped from 3.9% in the first semester of 2015 to only
3.5% in the same period in 2015.

114
The subsistence incidence among Filipino families was estimated at 6.2 percent in the
first semester of 2018. This is alternatively called as the proportion of Filipino families whose
incomes fall below the food threshold. In the same period in 2015, the proportion of families
who are food poor was recorded at 9.9 percent.
Subsistence incidence in NCR, on the other hand, registered an increase from 1.2% in the
first semester of 2015 to 1.65% in the first semester of 2018. Quezon City’s food poor also
registered an increase from 0.6% in the first semester of 2015 to 0.9% in the first semester of
2018.
Table E-12 : Poverty Incidence NCR, Philippines & Quezon City: 2006-First Semester 2018
2006 2009 2012
2015 2018 STATISTICS FULL
YEAR FIRST
SEMESTER FIRST
SEMESTER Poverty Incidence Among Families Philippines 21.0% 20.5% 19.7% 16.5% 22.2% 16.1% NCR 2.9% 2.4% 2.6% 2.7% 4.6% 4.9% Quezon City 3.2% 2.2% 1.9% 1.9% 3.9% 3.5% Poverty Incidence Among Population Philippines 26.6% 26.3% 25.2% 21.6% 27.6% 21.0% NCR 4.7% 3.6% 3.9% 3.9% 6.6% 6.6% Quezon City 4.9% 3.3% 2.4% 2.9% 5.8% 5.0% Subsistence Incidence Among Families Philippines 8.8% 7.9% 7.5% 5.7% 9.9% 6.2% NCR 0.5% 0.3% 0.3% 0.4% 1.2% 1.6% Quezon City 0.2% 0.3% 0.3% 0.1% 0.6% 0.9% Subsistence Incidence Among Population Philippines 12.0% 10.9% 10.4% 8.1% 13.0% 8.5% NCR 0.9% 0.5% 0.5% 0.7% 1.9% 2.0% Quezon City 0.3% 0.5% 0.4% 0.3% 1.0% 1.1% Source: Philippines Statistics Authority (PSA)
Minimum Wage
The new minimum wage rates for agricultural workers, firms in the manufacturing
sector with at most 10 workers, and firms in the retail as well as service sectors with at most 15
workers will earn at least Php500.00 daily, from the previous Php475.00. Non-agricultural
workers, meanwhile, will have a daily minimum wage of Php537.00 from Php512.00. Under
Wage Order No. 22, the Php10.00 cost of living allowance (COLA) will also become part of the
basic pay. Previously, the minimum basic pay ranged from P465 to P502, with an additional
Php10.00 COLA. The integration of COLA in the basic pay means bigger computations for
overtime pay and 13th month pay.
Table ED-13: CURRENT DAILY MINIMUM WAGE RATES National Capital Region (NCR), Per Wage Order No. NCR-22 (Effective: 22 November 2018)
SECTOR / INDUSTRY BASIC WAGE /
INTEGRATION OF COLA
BASIC WAGE INCREASE
NEW MINIMUM WAGE RATES
Non-Agriculture Php 512.00 Php 25.00 Php 537.00 Agriculture
Php 475.00 Php 25.00 Php 500.00
Retail Establishments Employing 15 workers or less Manufacturing establishments regularly employing less than 10 workers

115
4.3 FOOD SECURITY
Food Security “exists when all people, at all times, have physical and economic access to
sufficient, safe and nutritious food to meet their dietary needs and food preferences for an active
and healthy life”. The four (4) elements on the definition of food security are as follows: 1)
Availability - there must be adequate food supply to meet people’s needs; 2) Accessibility - it
considers people’s incomes/expenditures, markets and prices in achieving food security. 3)
Utilization - It is the way the body takes in the nutritional value of the food they consumed. 4)
Stability - it is having suitable food intake not only on a periodic basis but at all times.
The major sources of food supply come from the country’s Agricultural Sector: the
agricultural, fisheries, aqua-culture and forestry products. The country is therefore undertaking
great efforts to improve productivity of the sector. Food security is not all food but also having
access to clean water sources and sanitation facilities. Insufficient food consumption, its
deficiencies, imbalances in the consumption, the incapability of acquiring acceptable food result
to hunger or malnutrition. The national goal is to end hunger for all Filipinos.
With urbanization comes the challenges in food security. Metro Manila is a highly
urbanized region in the country with Quezon City as one of its most populated cities. Food
systems are required to ensure efficient and sustainable production, distribution and delivery of
goods from the farm to the metropolis or to all its local units.
4.3.1 Food Availability
As a highly urbanized city, with a very minimal agricultural activities to readily supply
food requirements, food is sourced by the city from nearby provinces. Agricultural produce are
brought to the city in bulk, at trading areas or “bagsakan” areas and sold mostly to wholesale
clients who then distributes said goods to other market outlets located in various areas in the
city. The trading area of the city is the Balintawak Cloverleaf Market and the Mega Q-Mart
located at EDSA. The distribution or retail outlets are: city’s eight (8) public markets, twenty
nine (29) private markets, and thirty one (31) talipapa. There are also now many other
available suppliers of basic goods and commodities/distribution outlets such as supermarkets,
mini marts, groceries strategically located in various areas of the city.
Table ED-14: Number of Public-Private-Talipapa/Satellite Markets with Occupied and Vacant Stalls , Quezon City by District: 2018
TYPE OF MARKET
NUMBER NUMBER OF STALL
DIST. 1 DIST. 2 DIST. 3 DIST. 4 DIST. 5 DIST. 6 TOTAL Public 8 52 - 727 2,512 - - 3,291 Private 29 1,317 1,937 858 541 638 892 6,183 Talipapa/Satellite 31 248 110 33 16 372 - 779
Total 68 1,617 2,047 1,618 3,069 1,010 892 10,253 Source: Market Development and Administration Department (MDAD)
Through the years, the number of private markets have decreased considering the
opening of the new and modern supermarkets and groceries (e.g. SM Supermarket/Hypermarket,
Robinson’s Supermarket, Savemore, Puregold, Robinsons etc.) which became a preference by
market-goers due to better and more convenient facilities that they offer. This has posed a
challenge to many operators of private wet and dry markets.
116
Food distribution in the city is also channeled through the numerous food outlets such
the neighborhood stores, restaurants and some 205 food establishments engaged in food
processing and 4 food manufacturing companies.
The city, in coordination with the national agencies, e.g. Department of Trade and
Industry, National Food Authority, Department of Agriculture, National Meat Inspection Service
(NMIS), etc., constantly controls and monitors operations on food supply and distribution in
order to stabilize its supply and demand.
On Rice
Rice is considered to be a staple food of the Filipinos. The major source of rice
distributed by the National Food Authority (NFA) particularly for the NCR are from top
producing provinces in Luzon namely: Pangasinan, Nueva Ecija, Tarlac, Pampanga, Bulacan,
Cagayan, Isabela and Mindoro. The country has been ranked as one of the top rice producers in
Aisa but data from the NFA, that in the past years when the country experienced deficit in
production, rice was imported from the following countries: Vietnam, Thailand and India to
ensure stability of supply. The country is working to becoming self-sufficient in rice production
for the coming years.
On Fish and Vegetables
Sources of fish sold in markets, flea markets, supermarkets in the city mainly come from
the Navotas Fish Port, with others coming from Cavite, Batangas, Quezon and as far as the
provinces in the Visayas and Mindanao.
Vegetables in the city are sourced mostly from the northern provinces in Luzon: Baguio,
Pangasinan, Isabel, Bulacan, and Pampanga. These are brought to city’s major
trading/”bagsakan” area at the Cloverleaf Balintawak Market which through the years became
known as a trading site for agricultural produce coming in from the north. Other trading areas
are the Mega Q- Mart. Other food retailers also go directly to the major sources for supply.
On Livestock and Poultry
Slaughtered meat are sourced from the city’s slaughterhouses. The live animals (hogs,
cattle, carabao, goats) brought in for slaughtering in the city’s abattoirs are mainly sourced from
nearby provinces Bulacan, Nueva Ecija, Batangas, etc. Some families are also engaged in
backyard livestock or poultry raising as their main source of income. The city has three (3)
existing slaughterhouses: Novaliches Slaughterhouse (the only accredited slaughterhouse of
the city by the NMIS), Labudahon Slaughterhouse and Mega Q- Mart Abbatoir–(a temporary
Slaughterhouse). There are also the non-NMIS accredited small slaughterhouse of the “lechonan”
operators at La Loma serving specifically the city’s lechon industry requirements. Chicken/fowls
on the other hand, are also sourced out from nearby provinces and brought in to various public
market stallholders for slaughtering. Quezon City does not have a city-owned slaughterhouse,
but all slaughterhouse operations in the city are monitored and inspected by its City Veterinary
Department (CVD) to see to that operations are in accordance with national and local regulation.
117
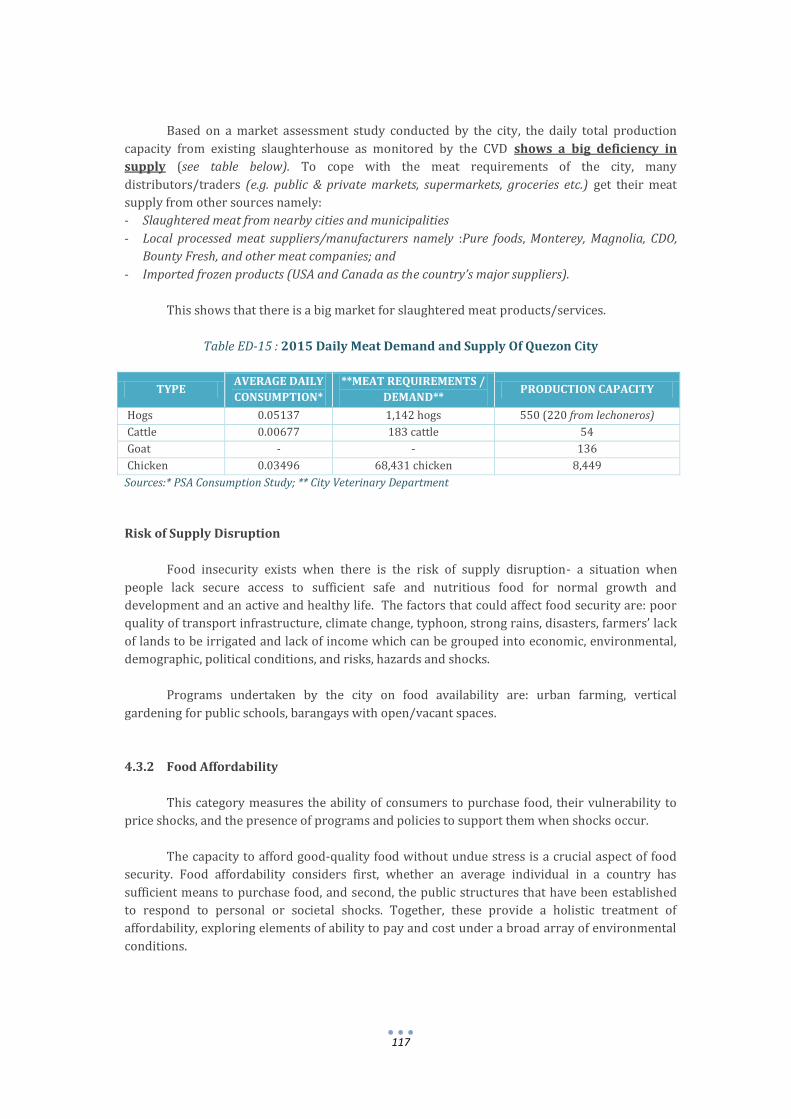
Based on a market assessment study conducted by the city, the daily total production
capacity from existing slaughterhouse as monitored by the CVD shows a big deficiency in
supply (see table below). To cope with the meat requirements of the city, many
distributors/traders (e.g. public & private markets, supermarkets, groceries etc.) get their meat
supply from other sources namely:
- Slaughtered meat from nearby cities and municipalities
- Local processed meat suppliers/manufacturers namely :Pure foods, Monterey, Magnolia, CDO,
Bounty Fresh, and other meat companies; and
- Imported frozen products (USA and Canada as the country’s major suppliers).
This shows that there is a big market for slaughtered meat products/services.
Table ED-15 : 2015 Daily Meat Demand and Supply Of Quezon City
TYPE AVERAGE DAILY
CONSUMPTION*
**MEAT REQUIREMENTS /
DEMAND** PRODUCTION CAPACITY
Hogs 0.05137 1,142 hogs 550 (220 from lechoneros)
Cattle 0.00677 183 cattle 54
Goat - - 136
Chicken 0.03496 68,431 chicken 8,449
Sources:* PSA Consumption Study; ** City Veterinary Department
Risk of Supply Disruption
Food insecurity exists when there is the risk of supply disruption- a situation when
people lack secure access to sufficient safe and nutritious food for normal growth and
development and an active and healthy life. The factors that could affect food security are: poor
quality of transport infrastructure, climate change, typhoon, strong rains, disasters, farmers’ lack
of lands to be irrigated and lack of income which can be grouped into economic, environmental,
demographic, political conditions, and risks, hazards and shocks.
Programs undertaken by the city on food availability are: urban farming, vertical
gardening for public schools, barangays with open/vacant spaces.
4.3.2 Food Affordability
This category measures the ability of consumers to purchase food, their vulnerability to
price shocks, and the presence of programs and policies to support them when shocks occur.
The capacity to afford good-quality food without undue stress is a crucial aspect of food
security. Food affordability considers first, whether an average individual in a country has
sufficient means to purchase food, and second, the public structures that have been established
to respond to personal or societal shocks. Together, these provide a holistic treatment of
affordability, exploring elements of ability to pay and cost under a broad array of environmental
conditions.

118
Food Consumption as a Share of Household Expenditure
This indicator captures the relative importance of food in household budgets. The lower
the share of household expenditure on food, the easier it is for a household to cope with price
increases and shocks.
Income plays an important role to food security. It is the determining factor of how much
food can be bought by the consumer household. When consumers’ income increase their choices
expand to include food quality. Food spending as percentage share to total expenditures
generally declines as income increases. In the Philippines, the average household earned Php
267,000 in 2015 (PSA FIES Survey). In the country, 41.9% of total spending is on food, while in
the NCR, 36.3% of income earned by families are spent on food alone. NCR estimates are also
used by QC in the absence of data in the PSA–FIES Survey. The big percentage being spent on
food just show that still many of the city’s families still belong to the low income group.
The QC Local Price Coordinating Council has been created for the proper efficient and
effective enforcement of the “price act” by virtue of RA 7581, The Price Act of 1991, (a national
policy that ensures the availability of basic necessities/commodities at reasonable at all times). It
protects consumers on price manipulation and other illegal acts on profiteering by some
businesses especially during times of emergency/calamities.
To make food supply (agricultural produce) also more affordable to residents, the city has
tied up with some neighboring provinces such as Ilocos Norte and the Department of Trade and
Industry (DTI) for a food caravan projects, where the farmers/food suppliers bring in directly to
the designated City Hall covered area their goods for immediate sale to residents on a regular
basis. This direct sale and omission of middlemen costs in the food supply system makes the food
supply readily available and more affordable to city residents. It hopes to expand this program
thru coordination most especially with sister cities.
4.3.3 Food Security, Safe, and Quality
Food security, safety and quality is a condition where foods are fit for human
consumption. Food and water must be edible and potable at all times. Security and protection of
human is basically dependent on the food we eat and water we intake. Comprehensive, intensive
and effective food control system are essential to protect and safeguard the health, safety and
welfare of the consumers. It is also critical to assure the security, safety and quality of foods
entering the country and local territories. The food regulatory agencies of both national and local
governments are responsible for setting food safety standards, regulating food establishments
and food business operators as well as the products they manufacture, offer for sale, or
distribute, by conducting inspections to ensure compliance with the law.
National and Local government agencies responsible for the implementation of laws on
food security, safety and quality with regulatory functions:
National Agencies:
National Food Authority (NFA) for rice, corn and other grains
National Meat Inspection Services (NMIS) for meats
Bureau of Fisheries and Aquatic Resources (BFAR) for fresh fish, and other sea foods including those
grown by aquaculture
Bureau of Animal Industry (BAI) for food derived from animals including eggs and honey production
National Dairy Authority (NDA) for milk production and post- harvest handling

119
Bureau of Plant and Industry (BPI) for plant foods
Philippine Coconut Authority (PCA) for fresh coconut
Sugar Regulatory Administration (SRA) for sugar cane production and marketing
Fertilizer & Pesticide Authority (FPA) for pesticides and fertilizers used in the production of plants and
animal foods
Others : Department of Health (DOH), Food & Drug Administration (FDA), Department of Trade and
Industry (DTI), Food development Center (FDC) under NFA, Bureau of Agricultural and Fisheries
standards (BAFPS), Bureau of Quarantine (BOQ), National Epidemiology Center (NEC), Research
Institute of Tropical Medicine (RITM), National Center for Disease Prevention and Control (NCDPC),
National Center for Health Promotion (NHCP)
Local Government Agencies:
Quezon City Health Department (QCHD)
Quezon City Veterinary Department (QCVD)
Market Development and Administration Department (MDAD)
In Quezon City, some issues and concerns on food security and safety which are
addressed are the following: sale of hot/double dead meats known as “botcha” in public and
private markets; distribution and sale of expired bottled and canned goods and others.
4.4 INDUSTRY AND SERVICE
The city’s economy continues to be dominated by small to medium-scale business
establishments engaged mostly in the distribution of finished products and in the provision of
basic services.
Table ED-16: Number of Registered New and Renewing Business Establishments: 2010-2018
YEAR NEW RENEWAL TOTAL GROWTH
RATE 2010 12,382 45,019 57,401 -
2011 12,765 48,567 61,332 6.85
2012 13,074 49,628 62,702 2.23
2013 13,417 51,098 64,515 2.89
2014 13,679 52,965 66,644 3.30
2015 12,107 54,989 67,096 0.68
2016 12,116 57,088 69,204 3.14
2017 12,368 59,961 72,329 4.52
2018 13,117 63,146 76,263 5.44
Source: Quezon City Information Technology Development Department (QC-ITDD)
As to industry type, registered businesses were classified using the Philippine Standard
Industry Classification (PSIC), the classification also used by the national agencies. The PSIC
provides three (3) major divisions namely: Agriculture, Industry and Services and further
subdivided into sub-classes/industries. Majority of businesses (about 91.01%) belong to the
Service Sector, while the Industry Sector has only 8.99% share of the total businesses. There are
no business operations that registered in the Agriculture Sector, the usual case in highly
urbanized cities. Furthermore, majority of city’s businesses are under the micro and small size
categories.

120
Table ED-17: Number of Registered Business Establishments by PSIC Type: 2011-2017
INDUSTRY CLASSIFICATION 2013 2014 2015 2016 2017 % to TOTAL
(2017) INDUSTRY 3,947 3,973 3,558 4,098 6,508 8.99 Electricity, Gas, Steam, and Air Conditioning Supply; Water Supply; Sewerage, Waste Management and Remediation Activities
5 5 13 7 - -
Construction 1,709 1,739 1,561 1,744 3,517 4.86 Manufacturing 2,233 2,229 1,984 2,347 2,991 4.13 SERVICE 60,568 62,671 63,438 65,105 65,821 91.01 Wholesale and Retail Trade; Repair of Motor Vehicles and Motorcycles
27,922 28,306 25,044
28,721 17,423 24.09
Transport and Storage Information and Communication
1,872 2,063 3,514 2,423 6,126 8.47
Accommodation and Food Service Activities 4,318 4,567 4,758 4,794 3,719 5.14 Finance and Insurance Activities 2,855 3,058 3,318 3,087 8,553 11.83 Real Estate Activities; Professional, Scientific and Technical Activities; Administrative and Support Service Activities
17,461 17,870 15,973 18,204 11,262 15.57
Education 919 1,028 985 1,047 1,960 2.71 Human Health and Social Work Activities 1,274 1,378 1,572 1,388 3,220 4.46 Arts, Entertainment and Recreation; Other Service Activities
3,947 4,401 8,274 5,441 13,558 18.74
Total 64,515 66,644 66,996 69,203 72,329 100.00
Source: QC-Information Technology Development Department (QC-ITDD)
Table ED-18: Number of Registered Business Establishments by PSIC Type and by District: 2017
INDUSTRY CLASSIFICATION 1 2 3 4 5 6 CITYWIDE TOTAL
INDUSTRY 1,072 1,028 783 620 801 793 1,411 6,508 Electricity, Gas, Steam, and Air Conditioning Supply
- - - - - - - -
Water Supply, Sewerage, Waste Management and Remediation Activities
- - - - - - - -
Construction 511 559 495 376 437 496 643 3,517 Manufacturing 561 469 288 244 364 297 768 2,991 SERVICE 8,697 11,497 13,377 7,975 5,125 4,352 16,798 65,821 Wholesale and Retail Trade; Repair of Motor Vehicles and Motorcycles
3,115 1,989 3,597 1,340 1,340 1,103 3,446 17,423
Transport and Storage 451 342 859 496 496 523 506 3,769 Information & Communication 73 83 155 217 217 236 1,446 2,357 Accommodation and Food Service Activities
817 115 647 569 569 195 1,024 3,719
Financial and Insurance Activities 1,261 946 2,989 329 329 528 1,773 8,553 Real Estate Activities 1,063 2,117 1,924 770 770 598 1,162 9,143 Professional, Scientific and Technical Activities; Administrative and Support Service Activities
108 268 147 303 303 445 585 2,119
Education 128 256 367 150 150 166 751 1,960 Human Health and Social Work Activities
338 1,087 323 198 198 88 805 3,220
Arts, Entertainment and Recreation 108 2,018 472 89 89 27 964 3,811 Other Service Activities 1,235 2,276 1,897 664 664 443 2,336 9,747
Total 9,769 12,525 14,160 8,595 5,926 5,145 18,209 72,329 Source: QC-Information Technology Development Department (QC-ITDD)
There has been an increasing trend in the number of registered businesses from 2010 to
2018. For 2018, registered businesses are broken down as follows – 13,117 new businesses and

121
63,146 renewing businesses totaling to 76,263, a 5.44% increase from the previous year. The
biggest increase in the number of registered businesses was in 2011, an increase of 6.85%.
Average annual growth rate of registered business establishments on said period is computed at
3.63%.
Although there is an average of 12,781 new businesses that come in and register, it could
be noted that the average annual increase in total number of businesses every year is only about
2,096 primarily attributed to the big annual number of non-renewing firms.
Table ED-19: Number and Percentage of Non-Renewing Business Establishments: 2010-2018
YEAR NEW RENEWAL TOTAL NON-
RENEWAL
% of NON-
RENEWED FIRMS
FROM NO. OF
RENEWED
BUSINESSES
% of NON-
RENEWED FIRMS
FROM TOTAL NO.
OF BUSINESSES
2009 10,474 43,277 53,751
2010 12,382 45,019 57,401 8,732 19.40 15.21
2011 12,765 48,567 61,332 8,834 18.19 14.40
2012 13,074 49,628 62,702 11,704 23.58 18.67
2013 13,417 51,098 64,515 11,604 22.71 17.99
2014 13,679 52,965 66,644 11,550 21.81 17.33
2015 12,107 54,989 67,096 11,655 21.20 17.37
2016 12,116 57,088 69,204 10,008 17.53 14.46
2017 12,368 59,961 72,329 9,243 15.42 12.78
2018 13,117 63,146 76,263 9,183 14.54 12.04
Average 12,781 53,607 66,387 10,279 19.37 15.58
Source: QC-ITDO
Every year, some 15.58% of the total registered businesses do not renew their permits in
the succeeding year. These non-renewing firms are those that have shut down operations due to
bankruptcy, mismanagement, etc. or those that may have just continued operations without
securing the required permits.
There are many businesses that may have shut down operations but have not
registered/declared retirement with the city due to the high cost of retiring a business (back
taxes are required to be paid) and create a tedious process as many documents have to be
submitted. From July 21, 2016 to December 2018, a total of 7,496 businesses or an average of
2,500 have declared retirement as per report from the Office of the City Treasurer.
Table ED- 20: Number of Retired Businesses: 2018
YEAR FULL PARTIAL TOTAL
2016 914 14 928
2017 2,958 35 2,993
2018 3,523 52 3,575
Total 6,995 101 7,496
The city government is therefore undertaking a great efforts not only in generating
growth in new investments but also maintaining if not sustaining growth of old investments thru
more improved and systematic business registration processing, provision of tax incentives,

122
conduct of inspections with apprehension of operators without permits (Suyod Buwis), and
better coordination with the barangays.
4.4.1 Services
Data for the year 2017 show that majority or 91% of registered businesses belong to the
Service Sector.
The biggest shares are those business firms engaged in the Wholesale/Retail Trade
activities which total to 17,423 or 24.09% of the total registered businesses. It is also the number
one business revenue source of the city and shown to have the highest increase amongst all
sectors in number in the last three (3) years. Such is evidenced by the existence of numerous
shopping malls where many retail stores operate. These malls include the five SM Malls, the
Ayala Malls (Trinoma, UP Town Center and Fairview Terraces), the Robinsons Mall (Fairview,
Magnolia and Galleria) and Ever-Gotesco Mall, Eton Centris, Gateway Mall and Fishermall, as well
as supermarkets and groceries/convenience stores located in various parts of the city. There are
also many home-based retail stores such as sari-sari stores, bakeries, carinderias mostly located
in a high density residential areas. Many of these establishments engaged in the
Wholesale/Retail Trade are concentrated in Districts 1 and 4.
The second major business type in the city is the Real Estate Activities; i.e. those engaged
in leasing of real properties, consultancy and law offices, janitorial/messengerial/labor services,
real estate broker and developer which registered a total of 9,143 and many of which are from
District 1 and 4 also. Those engaged In Financial and insurance activities (composed of banks,
pawnshops, money shops and financing and holding companies, etc.) with 8,553 ranked third
mostly found in District 3 & 1. The other succeeding types are the following: Arts, Entertainment
and Recreation (radio and TV networks, call centers etc.) with 3,811, Transport and Storage
(transport companies/operators, trucking/hauling services, forwarding/freight services.
Accommodation and Food Service activities mostly found in District 1, 3 & 4 at Banawe, Quezon
& West Avenues, SM North, Trinoma, Cubao Commercial Area, Eastwood City, SM Centerpoint
and South Triangle areas totaling to 3,719. The increasing numbers of BPO locators in the city
account for a big number of businesses in category.
The Human Health and Social Work activities (hospitals, clinics, laboratories, etc.) with
3,220 and Professional, Scientific and Technical Activities; Administrative and Support Service
Activities with 2,119, Information and Communication with 2,357 and lastly Education
(composed of the colleges, universities, vocational schools and other training institutions)that
recorded 1,960. Other Service activities (e.g. beauty salons, dress shops, tailoring shops, etc.) has
a total of 9,747 registered businesses.
4.4.2 Industry
The Industry Sector has only 8.99% share of the total businesses numbering to 6,508 in
2017. This is composed of Construction businesses (construction of buildings, site preparation
and development, Architectural and Engineering works, etc.) with 3,517 followed by the
Manufacturing businesses (printing/publishing, assembly of motor vehicles, fabrication of metal,
steel and aluminum products, etc.)
It could be noted that the manufacturing industry in particular are no longer growing in
number through the years due to a national policy on industry dispersal outside Metro Manila
during the 70s. Those Manufacturing businesses-labor intensive, clean industries not harmful to

123
the environment may however need to be revitalized and encouraged to grow due to economic
benefits that such industries entail. These are mostly located in the city’s traditional industrial
areas at District 5 and 6 – the Balintawak and Novaliches area.
Business Data from Other National Sources / Statistics
For comparative and information purposes on the city’s standing in distribution and
ranking of businesses in the country and in the region, the 2017 List of establishments, Census &
Technical Coordination Office, Philippine Statistics Authority data gathered and analyzed
showed that 20.99% of the total businesses in the Philippines are in the NCR. Top four (4) cities
with the highest number of businesses in the region are: Quezon City (39,777), Manila (36,965),
Caloocan (18,339) and Makati (16,304). Wholesale and Retail Trade; Repair of Motor vehicles
and Motorcycles activities and Accommodation and Food Services Activities are two (2)
businesses found dominating types similar to all four localities.
Table ED-21: Number of Business Establishments by PSIC: Top Five (5) Cities in NCR for 2017
PSIC CLASSIFICATION PHILIPPINES NCR QC Manila Caloocan Makati Valenzuela
Agriculture, Forestry and
Fishing
9,209 223 45 11 28 33 23
Mining and Quarrying 930 89 8 3 3 31 -
AGRICULTURE 10,139 312 53 14 31 64 24
Manufacturing 117,035 19,826 3,782 2,725 2,874 1,013 2,283
Electricity, Gas, Steam, and Air
Conditioning Supply
1,234 140 16 6 36 3
Water Supply, Sewerage,
Waste Management and
Remediation Activities
1,466 171 29 10 9 54
Construction 3,387 1,434 458 101 59 184 59
INDUSTRY 123,122 21,571 4,285 2,842 2,949 1,242 2,417
Wholesale and Retail Trade;
Repair of Motor Vehicles and
Motorcycles
424,061 81,631 15,687 17,290 2 4,962 4,922
Transportation and Storage 8,496 3,157 386 1,068 14 260 160
Accommodation and Food
Service Activities
121,821 25,118 5,701 4,648 2,100 2,210 1,626
Information and
Communication
35,730 8,054 1,199 1,666 1,088 785 503
Financial and Insurance
Activities
41,143 9,091 2,059 1,592 456 1,410 269
Real Estate Activities 9,748 4,238 782 671 177 881 293
Professional, Scientific and
Technical Activities
16,885 5,332 1,087 696 201 1,304 119
Administrative and Support
Service Activities
16,194 5,916 1,242 1,421 220 918 176
Education 17,504 4,239 1,183 661 371 322 149
Human Health and Social Work
Activities
27,422 7,504 1,944 1,334 589 669 294
Arts, Entertainment and
Recreation
14,956 2,356 525 425 238 120 125
Other Service Activities 57,500 15,615 3,644 2,637 1,573 1,157 756
SERVICE 791,460 172,251 35,439 34,109 15,359 14,998 9,366
Total 924,721 194,134 39,777 36,965 18,339 16,304 11,814
Source: 2017 List of Establishments, Census & Technical Coordination Office, Philippine Statistics Authority
From this same data, the locational quotient (LQ) was computed to get information on
which industries of the city are more unique, higher concentrated and have greater advantage

124
over the region. The Service Industry, which include Wholesale and Retail Trade,
Accommodation and Food Service Activities, Financial and Insurance Activities, Human Health
and Social Work Activities is considered to be the city’s highly concentrated industry.
Another business data source is the Business World Publication on the Top 1,000
Corporations in the Philippine Economy 2017. From this publication, majority or about 75% of
the top corporations in the country were shown to be located in the National Capital Region
(NCR) with Quezon City (111 firms) ranking second to Makati City (with 223 firms) in terms of
number of business establishments (mostly engaged in the Wholesale and retail activities).
Various efforts have been undertaken to improve services. Processes on business
registration has been simplified and made easier thru:
Existence of a Business-One-Stop-Shop (BOSS) which had reduced time and requirements in
securing business permits.
Improving the payment system of taxes & fees thru the opening of more satellite offices, use of
over-the-counter payments in accredited banks internet banking, automated teller machines
and mobile money service providers.
Operationalizing the Philippine Business Registry (PBR) which utilizes an online integrated
system connecting various concerned national government agencies (DTI, BIR, SEC, HDMF,
SSS and Philhealth) in the registration of new businesses. The QC government was also the
first LGU in the country to operationalize the PBR.
Passage/Implementation of the following:
- Ordinance No. SP-2219, S-2013, the QC Economic Development Incentives Code of 2013 to
encourage and to accelerate Inflow of investments – the entry, expansion, modernization
of the service and industry sectors in various areas of the city. It provided the creation of
an Economic Development and Investment Board (EDIB), the policy making body tasked to
promote, regulate and monitor investments in the city; and a Local Economic Investment
Promotions Office (LEIPO) that shall serve as the implementing arm/Technical secretariat
of the Board and coordinate the drafting of the QC Investment Priorities Plan and ensure
compliance with the plan.
- Ordinance adopting a Magna Carta for Micro Small Business Enterprises in QC (Ordinance
No. SP-2360, S-2014) with the following development objectives:
o Business environment (BE) – create an enabling business environment that is
conducive to the establishment, innovation, development and sustainable growth of
MSEs and entrepreneurship in the city;
o Access to Financing (A2F) – enable MSEs and entrepreneurs to conveniently access
appropriate and affordable financial services and assistance;
o Access to Markets (A2M) - enable MSEs and entrepreneurs to maintain their current
markets and penetrate new markets; and
o Productivity and Efficiency (P & E) – enable MSEs and entrepreneurs to be innovation
active and improve their capacities to develop, produce and deliver competitive
products and services for the local, national and international markets.
- Creation of the QC Small Business Development & Promotion Office (QC-SBDPO) –
Ordinance No. SP-2364, S-2014) – QC-SBDPO was created to serve as implementing arm of

125
the Micro and Small Enterprises Development Council (MSED Council) and shall also function
as the Technical Secretariat of the MSED Council.
City plus factors
The city continues to attract investors with its various plus factors, namely:
Expansive Land – it has 160 sq. kilometer urban landscape spread over one-fourth of
Metropolitan Manila.
Reasonably Priced Real Estate – real estate land value and taxes are lower compared to other
cities providing cost effective location.
Strategic Location - It is in the heart of Metro Manila; it is accessible from the major highways
and thoroughfares and mass transit system of Metro Manila
Young Manpower Pool – about 1/3 of the city’s population are less than 15 years old;
strengthening this young population are the numerous colleges/universities and training
centers which included the prestigious University of the Philippines, Ateneo de Manila,
Miriam College, etc.
Large Consumer Market – the city has the largest population in the country providing a big
consumer market for investors.
Other factors that are continuously being improved/ maintained:
Close private partnership with various Business sectors
Various strategies/ programs undertaken by the city to include efficient assistance services
(expeditious processing of business permits), good infrastructures, improved communication,
stable policies and provision of various incentives.
The city also makes available the following national and local incentives which largely applied
for firms that are registered with the Philippine Economic Zone Authority (PEZA), the Tourism
Infrastructure and Enterprise Zone Authority (TIEZA), and the Board of Investments (BOI).
National Incentives:
100% foreign equity in all investments except those reserved for Filipinos by mandate of the
Philippine Constitution;
Income Tax Holiday for six (6) years for pioneer firms and four (4) years to non-pioneer
firms;
Tax credit on raw materials, supplies and semi-manufactured products;
Special Investors’ Resident Visa;
Employment of foreign nationals;
Granting of Special Economic Zone status to tourism development zones and tourism estate
and other incentives provided for under the Special Economic Zone Act of 1995 (RA 7916);
and
Private sector participation thru the Public-Private-Partnership (PPP) arrangement with the
national implementing agencies and the local government units (LGUs).
Local Incentives:
10% discount on prompt annual payment of Business Taxes;
50% discount on business taxes to business enterprises with assistance of not more than P3M
(Barangay Micro Business Enterprises – BMBEs Law: RA No. 9178)

126
4.4.3 Tourism
Tourism is an important sector for the Philippine economy. It is currently the largest and
fastest growing industry in the world and has been utilized by countries and local governments
as one of the foundation of economy. In the year 2017, the travel and tourism industry in the
Philippines contributes almost eleven per cent (11%) to the Philippine Gross Domestic Product
(GDP). The Department of Tourism (DOT) recorded 6.62 million tourists visiting the country in
2017, the highest recorded tourist arrival data. It posted an 11% growth from the 5.96 million
visitors in 2016 in spite of the calamites that continue to hit the country. The strong performance
of the industry imprinted significant milestones in the Philippine history which attributed to the
intensified marketing campaigns. The influx of visitors during the Christmas holidays, the
international media exposure of the country during major international events such as the papal
visit of Pope Francis in January 2015, the country’s hosting of tourism events, the Miss Universe
pageant in January 2017 that help boost the country’s tourism arrivals to the country.
Table ED-22: Distribution of Tourist Arrivals by Type of Tourist, NCR and Philippines: 2009-2018
YEAR NCR PHILIPPINES GROWTH
RATE Foreign Domestic Total Foreign Domestic Total 2009 1,205,127 702,689 1,907,816 2,756,581 260,518 3,017,099 2010 1,480,871 815,604 2,296,475 3,239,960 280,511 3,520,471 16.68 2011 1,729,862 997,595 2,727,457 3,667,089 259,544 3,926,633 11.54 2012 1,533,450 909,212 2,442,662 4,019,167 253,644 4,272,811 8.82 2013 1,751,191 854,515 2,605,706 4,435,205 246,102 4,681,307 9.56 2014 1,122,860 748,379 1,871,239 4,582,072 251,296 4,833,368 3.25 2015 848,320 568,755 1,417,075 5,099,745 260,937 5,360,682 10.91 2016 245,138 249,545 494,683 5,719,356 247,649 5,967,005 11.31 2017 324,746 382,061 716,807 6,418,343 202,565 6,620,908 10.95 2018 6,984,808 142,870 7,127,678 7.65
Source: Department of Tourism (DOT)
In 2017, a total of 1.60 million South Koreans visited the Philippines. It is followed by
China, USA, Japan, Australia, Taiwan, Canada, United Kingdom, Singapore & Malaysia which grew
in number compared to previous years. In 2017, the country attracted 6,620,908 visitors and in
2018, the country welcomed a total of 7,127,768 arrivals, which hit the Seven Million mark. It had
shown that during the last 5 years (2015-2018) South Korea has been the largest source of
visitors to the Philippines.
The purposes of tourist visits were the following: to spend holidays, to visit friends and
relatives, for official/business trips, for educational/studies, religious and civic missions, for
convention, for incentives, for health/medical treatment/consultation, for shopping and others.
Quezon City as compared to its other major neighboring cities in the NCR gets only a
limited share of the region’s tourist market due to its distance to entry points (airport and
seaport), and existence of only few accommodation facilities, most importantly internationally
managed hotels. The construction of a Convention Center within the Quezon City Hall Compound
this year will be of great benefit for those who come to the city to host various
national/international summits, conferences, conventions and all kinds of events that require
large sitting capacity.
Quezon City has 42 registered hotels (with estimated 4,680 hotel rooms) mostly in the
standard & economy classification. It has five (5) existing resorts, 79 apartelles, 4 inns and 3
pension houses. In spite the big number of hotels, only thirteen (13) are accredited with the

127
(DOT) namely: Crown Plaza Galleria Manila, Novotel Manila, Seda Vertis North, Eastwood
Richmonde Hotel, Luxent Hotel, B Hotel – Quezon City, Hotel 99 Inc. – Cubao, Hotel Icon Timog,
Madison 101 Hotel & Tower, Microtel by Wyndham Acropolis, Microtel by Wyndham UP Techno
Hub, Oracle Hotel and Residences, and Soleste Suites.
Table ED- 23 Number of Hotels by Classification, Quezon City: 2018
Source: For NCR & Philippines – DOT; For Quezon City – Tourism Department
Based on the Tourism Research and Statistics Division, Office of the Tourism Planning
Research and Information Management, Department of Tourism, the average length of stay of
guests of accredited hotels in 2017 is 3.45 and an occupancy rate of 64.72% while the non-
accredited hotels in Metro Manila was 6.99 nights and occupancy rates of 64.51%. The overall
average occupancy rate of hotels in Metro Manila for 2017 was also placed at 64.72%, a little bit
lower compared to year 2016 which is 66.77%.
The Local Tourism Development Plan aims to transform the city into a “premier urban
destination and the showcase of sustainable urban tourism development in the Philippines”. It
identified tourism districts for development and promotion. These are areas with inherent
advantages and unique character which have become known for and particularly possessing
potentials of attracting tourists/visitors. Urban design, structural and aesthetics enhancement
specific to these areas shall be adopted to turn these areas into attractive and viable tourist
attractions. The nine (9) identified tourism district areas cited in Development Plan are as
follows: the Civic Center District, the Lifestyle District, the Eastwood City Cyberpark, the Knowledge
Community District, the Cubao Growth Center District, the Quezon City China Town, the La Loma
District, the Sergeant Esguerra Avenue District, and the Maginhawa Art and Food District. Out of
this, only three (3) was declared thru Ordinance No. SP-2439, s—2015 the Maginhawa Arts and
Food Hub, Quezon City Chinatown at Banawe Street (thru Ordinance No SP-2453 s-2015) and
Cubao Growth Center (Araneta Center (thru Ordinance No. 2796, s-2018). There is a need to
pursue the declaration of the other six (6) tourism Districts.
Tourism is considered a powerful growth engine in economic development. It produces
huge exchange movements and accommodates big investments. The city capitalizes on the
following tourism marketing points/assets:
QC as a Wellness Center
Quezon City is the only city in the Philippines with a large number of internationally
renowned specialty hospitals that can form the base of a thriving health and wellness industry. It
has the most number of hospitals, with the biggest bed capacity in the country. Its bed to
population ratio is 1:287 is above the required standard of 1:500. As of 2018, there are now
seventy one (71) hospitals in the city (17 government; 54 private) including the internationally
known St. Luke’s Medical Center (a 644-bed, international-standard hospital facility), Philippine
Heart Center (well equipped, specialty hospital in cardiovascular), National Kidney and
Transplant Institute (premier, ISO-certified facility for renal disease and organ transplant), Lung
Center (specialty hospital for pulmonary diseases) and the Philippine Orthopedic Hospital. The
CLASSIFICATION QUEZON CITY
De Luxe 3
1st Class 2
Standard 14
Economy 23
Total 42

128
city is also a pioneer in the stem cell therapy, the famous upscale medical treatment which is
available at NKTI and St. Luke’s Hospital. It has the abundance of wellness and physical fitness
centers, diagnostic, dental health and beauty clinics, rehabilitation centers, nursing homes, health
spas, and alternative healing centers.
Other hospital facilities in the city: the Providence Hospital at West Triangle,
Commonwealth Hospital and Medical Center at the Neopolitan Business Park, the Metro North
Medical Center at Mindanao Avenue, the World Citi at Aurora Boulevard and the newly improved
Fe del Mundo Medical Center at Banawe Street. Such development stimulates growth of medical
tourism in the city. Not only do these medical institutions provide a ready place to get good
medical care but they serve as grounds/site for new learnings/trainings or venue for summits, or
seminars in the medical field. Though the number of medical/hospital facilities has increased, the
quality of services however still needs to be greatly improved to face challenge in the global
competition.
Quezon City as ICT Capital
The ICT, with all its power to provide virtual travel experience and on-line impersonal
communication for the “Global Villagers”, provides tourism in person-to-world experience, a
window-shop to the world. Information Communication Technology (ICT) empowers tourism,
with the developed e-commerce system already taking over the entire country. Tourism finds an
effective marketing ally in ICT.
Business Process Outsourcing (BPO), continues to be one of the major economic drivers
of the country, in the NCR and in the city contributing greatly to Gross Domestic Product and
generation of employment. As of 2018 data, there are a total of 560 IT Parks and
Center/Buildings operating in the country and registered with the Philippine Economic Zone
Authority (PEZA). Majority or 313 of these firms are in the NCR. Makati has the most number of
IT Parks /Buildings (with 71); followed by Quezon City (with 56), and Pasig City (with 50). There
are other more strong competition arising in this industry from other cities in the region such as
Taguig (Global City), Mandaluyong, Pasay etc. .
Quezon City also, ranked number one in terms of declared area with the PEZA devoted to
IT operations with 202.8 hectares. The city’s biggest IT Parks are: the Eastwood City Cyberpark
(The first IT Park in the country), UP Science and Technology Park (North)/Ayala TechnoHub,
Eton Centris, Araneta Cyberpark and the Vertis North Ayala Park. Many IT developments have
also been integrated in the various mall complexes.
With the continuous growth of the IT industry in the city, employment is projected to
increase this year and the succeeding years. The most recent employment data gathered from the
different IT-related enterprises in Quezon City as of 2015 reached to a total of 372,000 persons
employed.
Recognizing the economic contributions of the Contact Center and Business Process
Industry, the QC-Information and Communication Technology–Global Service Outsourcing
(QC-ICT/GSO) Task Force was created to promote global services (outsourcing) industry to
generate investments and employment in the city. And as support to the industry, the city
provides talent development interventions to provide locators with the required competent
workforce (formulated with industry partners, other stakeholders and the Kor-Phil IT Training
Center).

129
Quezon City as Shopping Mecca of the Country
Quezon City can be called the shopping mecca of the country due to the existing big
shopping malls/complexes sitting center stage in practically every dense community cluster.
Among these are five (5) giant SM Malls, Robinson Malls, Ever Gotesco Mall, Gateway, the giant
Trinoma Shopping Complex, the Eastwood City Mall, Eton Centris Mall, the Ayala Fairview
Terraces Mall, the Walter Mart and the newly developed UP Town Center. All these shopping
Centers are of international standards and fit for tourist visitors. Inside these malls are excellent
recreational and entertainment facilities such as amusement centers, physical fitness centers,
modern cinemas and restaurants (from fine dining to fast food which fits the tourists’ pleasure).
The city is also home to other tourism facilities and activities that would also attract tourists:
Table ED-24: Famous Significant Historical Sites/ Landmarks in the City
HISTORICAL SITES LOCATION
Quezon Memorial Shrine QMC, Elliptical Road, Bgy. Central
Pugad Lawin Shrine Bgy. Bahay Toro
Mabuhay Rotunda Quezon Ave. corner E, Rodriguez Ave.
Batasan Pambansa Batasan Road
Tandang Sora Shrine Banlat Road, Bgy. Pasong Tamo
La Mesa Dam Lagro
Bantayog ng mga Bayani Along EDSA, Quezon Avenue
Camp Aguinaldo EDSA
Camp Crame EDSA
People Power Monument EDSA, Bgy. Ugong Norte
Gen. Lawton Monument Bgy. BagongSilangan
Balintawak Monument EDSA, Bgy. Balingasa
EDSA Shrine EDSA, Bgy. Ugong Norte
San Pedro Bautista Church Bgy. Damayan
Himlayan Pilipino Bgy. Pasong Tamo
Pres. Quezon Heritage House QMC, Elliptical Road, Bgy. Central
Sto. Domingo Church Quezon Avenue, Bgy. Sto. Domingo
Iglesia ni Cristo Central Complex Commonwealth Avenue, New Era
Araneta Coliseum Cubao, Bgy. Socorro
Philippine Nuclear Research Institute Commonwealth Avenue, Bgy. Culiat
La Loma Cockpit Bgy. N.S.Amoranto
Quezon City Hall Elliptical Road, Bgy. Central
Pres. Aquino Heritage House QC Circle
Ninoy Aquino Monument Quezon Avenue corner West Avenue

130
Festivals/Events
The city also hosts different festivals and activities where local and foreign visitors are
gaining interest. These events are cited in the succeeding table:
Table ED -25 Important Events/Festivals in Quezon City
ACTIVITY EVENT
Tandang Sora Birth Anniversary January 6
Chinese New Year February 1st week
Anniversary of People Power (EDSA 1&2) February 25
Flag Day March
Santacruzan / Flores de Mayo May
Lechon Festival 3rd Sunday May
Independence Day June 12
Birthday of Dr. Jose Rizal June 19
Death Anniversary of Pres. Manuel L. Quezon August 1
Birth Anniversary of Pres. Manuel L. Quezon August 19
Death Anniversary of Pres. Benigno Aquino August 21
Cry of Pugad Lawin August 23
Alay Lakad September (2nd Sunday)
Feast of La Naval October 8
Quezon City Foundation Day October 12
Birth Anniversary of Andres Bonifacio November 30
Battle of San Mateo December 19
Death Anniversary of Jose Rizal December 30
Sister-city Agreements
Tourists and potential investors are also expected to visit the city as a result of sister-city
agreements forged by city officials. The city has entered tie ups with sister cities within and
outside the country that promotes socio-economic and cultural exchange activities. The city
however is encourage to engage more ties with highly urbanized or more industrialized cites in
other countries to learn and gain advantage from the agreement.
The existing sister cities of Quezon City are as follows:
CITIES IN OTHER COUNTRIES LOCAL CITIES
Salt Lake City, Utah, USA Pura, Tarlak
Maui, Hawaii, USA Wao, Lanao Del Sur
Chiba City, Japan (Miyagi) Cotabato City
Taipei City, Taiwan General Santos City
Daly City, California, USA Banaybay, Davao Oriental
Agana, Guam, USA Puerto Princesa, Palawan
Fort Walton Beach, Florida, USA La Trinidad, Benguet
Kenosha City, Wisconsin, USA Sagada, Mountain Province
New Westminster, British Columbia, Canada Iloilo City
Shenyang City, People’s Republic of China Baler, Aurora
Republic of the Union of Myanmar, Yangon Region Roxas City, Capiz
The three (3) embassies in Quezon City: the Embassy of Columbia in Araneta Center,
Cubao, the Embassy of Guatemala in Barangay Blue Ridge and the Embassy of Cyprus in Barangay
South Triangle.


