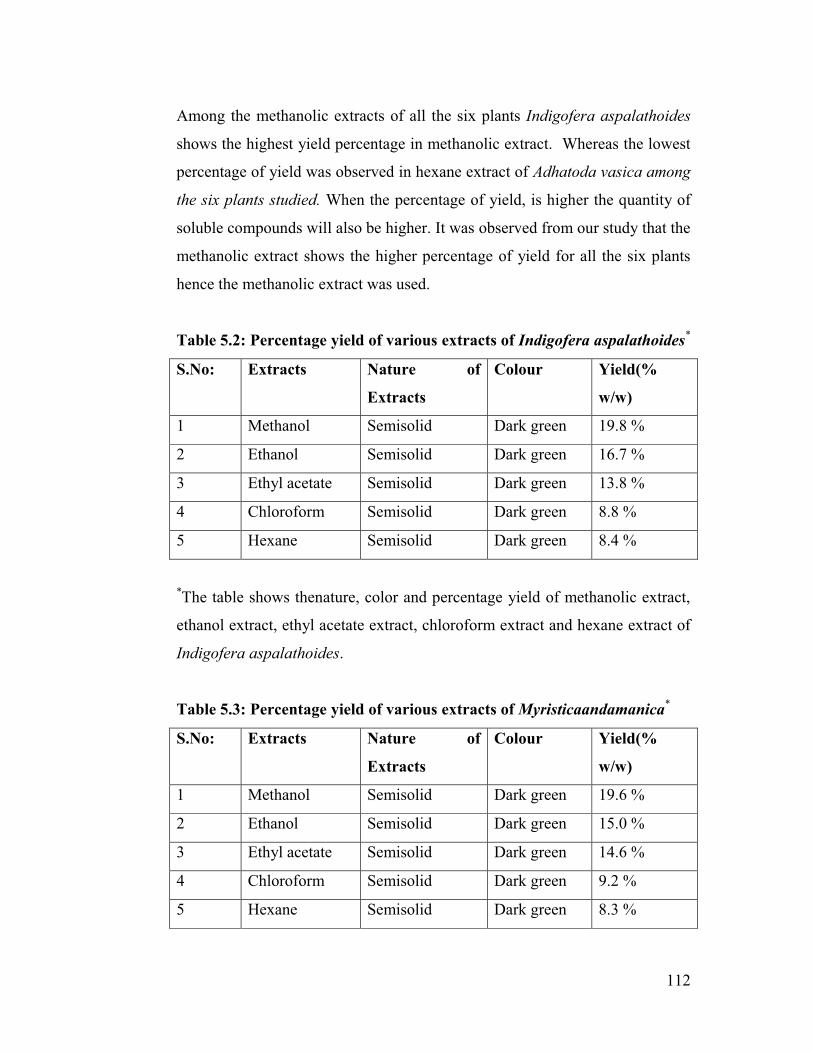
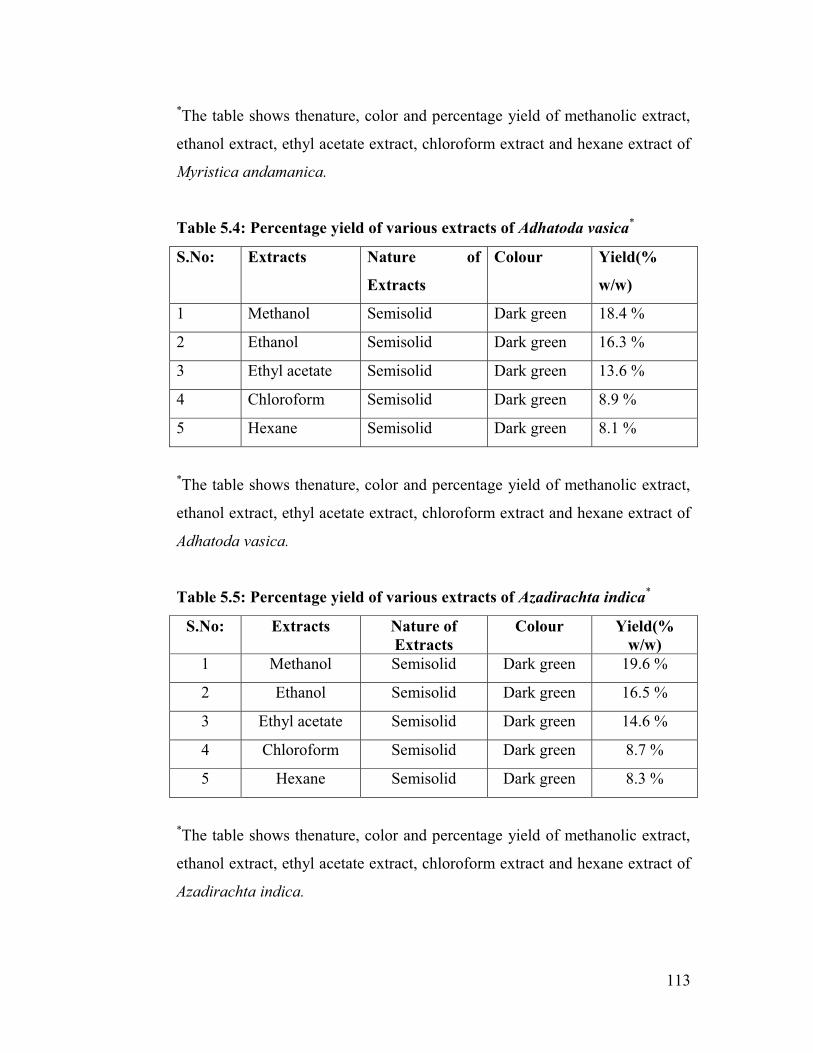
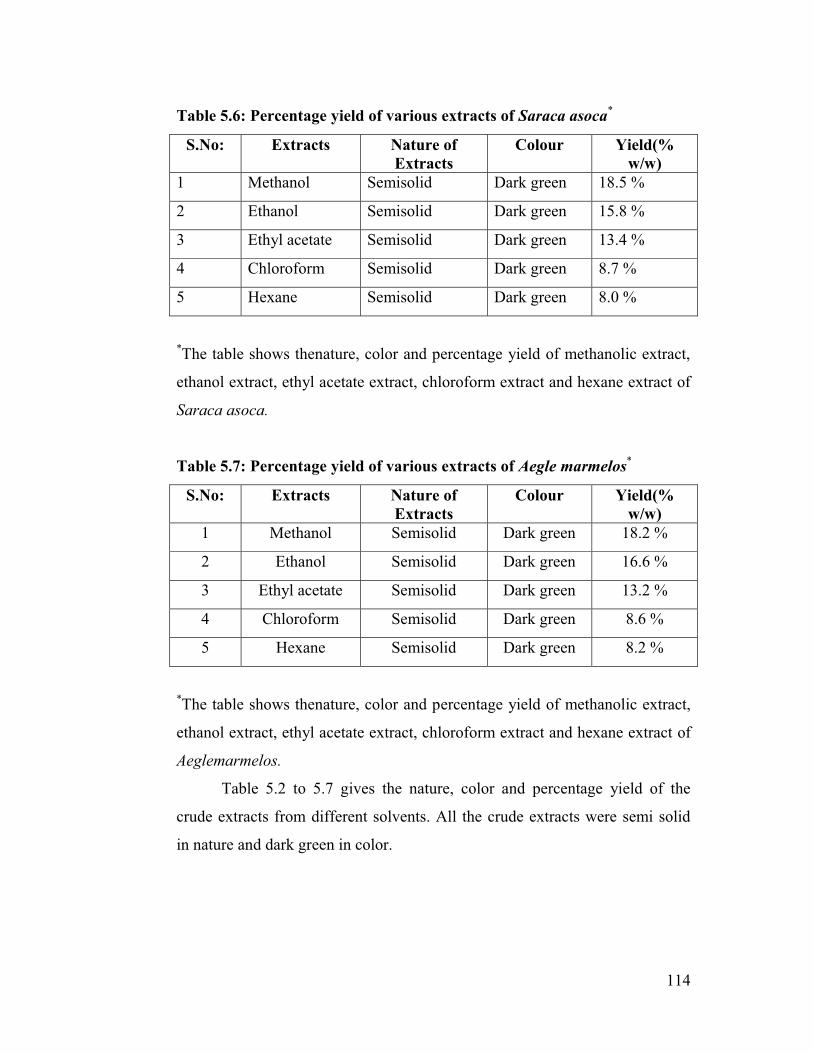
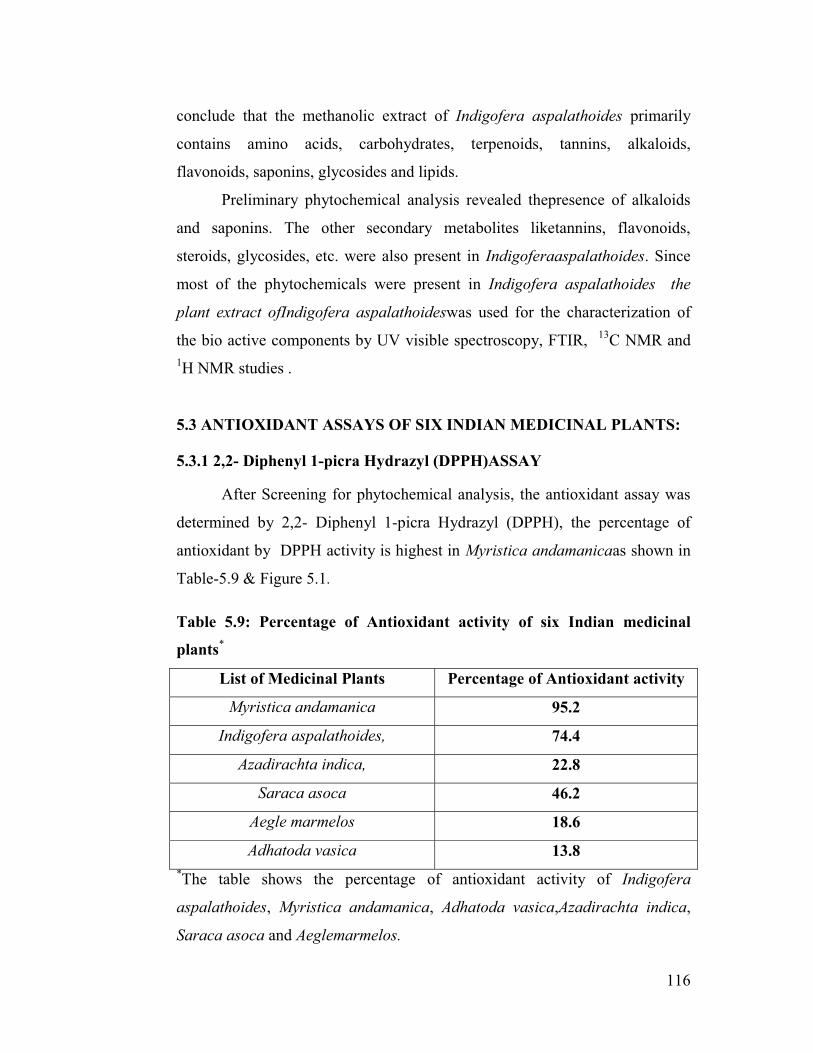
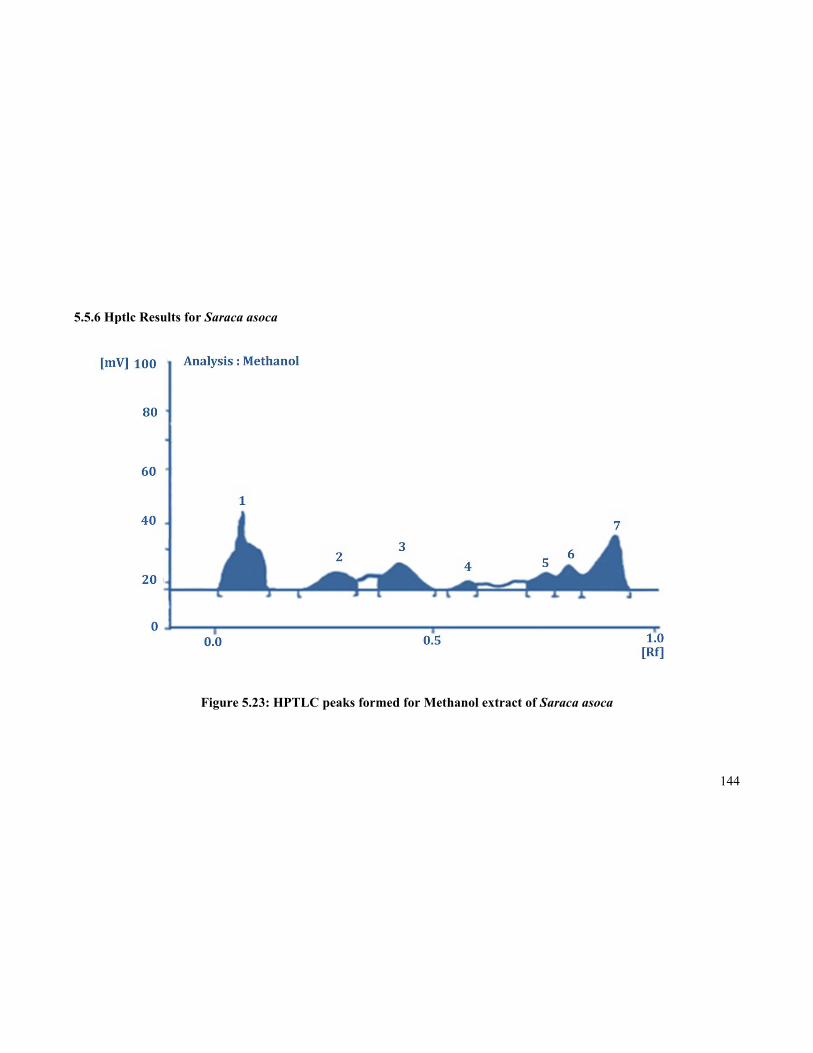
111 CHAPTER 5 5.0 RESULTS 5.1 PRELIMINARY PHYTOCHEMICAL INVESTIGATIONS 5.1.1 Percentage Yield The quantitative estimation of percentage yield of various crude extracts of Indigofera aspalathoides, Myristica andamanica, Adhatoda vasica,Azadirachta indica, Saraca asoca and Aeglemarmeloswas calculated, the results of the percentage yield is given in table 5.1 Table 5.1: Percentage yield of various extracts of six Indian medicinal plants * Extract Indigofera aspalathoides Myristica andamanica Adhatoda vasica Azadirachta indica Saraca asoca Aegle marmelos Methanol 19.8 % 19.6 % 18.4 % 19.6 % 18.5 % 18.2 % Ethanol 16.7 % 15.0 % 16.3 % 16.5 % 15.8 % 16.6 % Ethyl acetate 13.8 % 14.6 % 13.6 % 14.6 % 13.4 % 13.2 % Chloroform 8.8 % 9.2 % 8.9 % 8.7 % 8.7 % 8.6 % Hexane 8.4 % 8.3 % 8.1 % 8.3 % 8.0 % 8.2 % * The table shows thepercentage yield of methanolic extract, ethanol extract, ethyl acetate extract, chloroform extract and hexane extract of Indigofera aspalathoides, Myristica andamanica, Adhatoda vasica,Azadirachta indica, Saraca asoca and Aeglemarmelos. Comparing the percentage yield of the plant extracts it was observed that the methanolic extract gave the maximum amount of yield and the hexane extract gave the minimum amount of yield for all the six medicinal plants.
Transcript
111
CHAPTER 5
5.0 RESULTS
5.1 PRELIMINARY PHYTOCHEMICAL INVESTIGATIONS
5.1.1 Percentage Yield
The quantitative estimation of percentage yield of various crude
extracts of Indigofera aspalathoides, Myristica andamanica, Adhatoda
vasica,Azadirachta indica, Saraca asoca and Aeglemarmeloswas calculated,
the results of the percentage yield is given in table 5.1
Table 5.1: Percentage yield of various extracts of six Indian medicinal
5.6.1.1Reduction In Wound Area For Mice Treated With Indigofera aspalathoides
Figure 5.33:Reduction in wound areafor mice treated withIndigofera
aspalathoides
Figure 5.33:The figure shows reduction in wound area for mice in treatment
group compared to mice in positive control group and mice in negative control
group. This graph has been calculated for a span of 12 days. The x – axis denotes
the number of days and the y – axis denotes the wound area in sq.mm.
160
5.6.1.2Percentage of Wound Contraction in Mice Treated withIndigoferaaspalathoides
Figure 5.34:Percentage of wound contraction for mice treated with
Indigofera aspalathoides
Figure 5.34:The figure shows percentage of wound contraction for mice in
treatment group compared to mice in positive control group and mice in negative
control group. This graph has been calculated for a period of 12 days. The x - axis
denotes the number of days and the y - axis denotes the percentage of wound
contraction.
161
5.6.2.1 Reduction in Wound Area for Mice Treated with Myristica andamanica
Figure 5.35:Reduction in wound areafor mice treated
withMyristicaandamanica
Figure 5.35:The figure shows reduction in wound area for mice in treatment
group compared to mice in positive control group and mice in negative control
group. This graph has been calculated for a span of 12 days. The x – axis denotes
the number of days and the y – axis denotes the wound area in sq.mm.
162
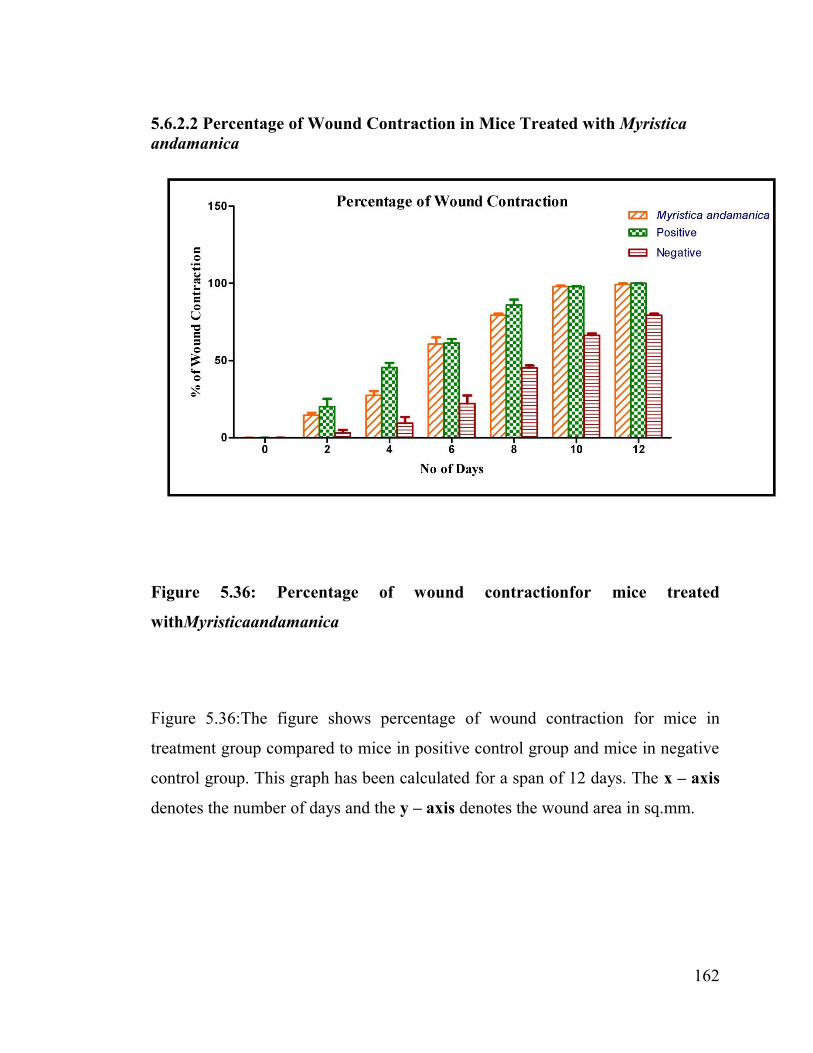
5.6.2.2 Percentage of Wound Contraction in Mice Treated with Myristicaandamanica
Figure 5.36: Percentage of wound contractionfor mice treated
withMyristicaandamanica
Figure 5.36:The figure shows percentage of wound contraction for mice in
treatment group compared to mice in positive control group and mice in negative
control group. This graph has been calculated for a span of 12 days. The x – axis
denotes the number of days and the y – axis denotes the wound area in sq.mm.
163
5.6.3.1Reduction in Wound Area for Mice Treated with Adhatoda vasica
Figure 5.37:Reduction in wound areafor mice treated withAdhatoda vasica
Figure 5.37:The figure shows reduction in wound area for mice in treatment
group compared to mice in positive control group and mice in negative control
group. This graph has been calculated for a span of 12 days. The x – axis denotes
the number of days and the y – axis denotes the wound area in sq.mm.
164
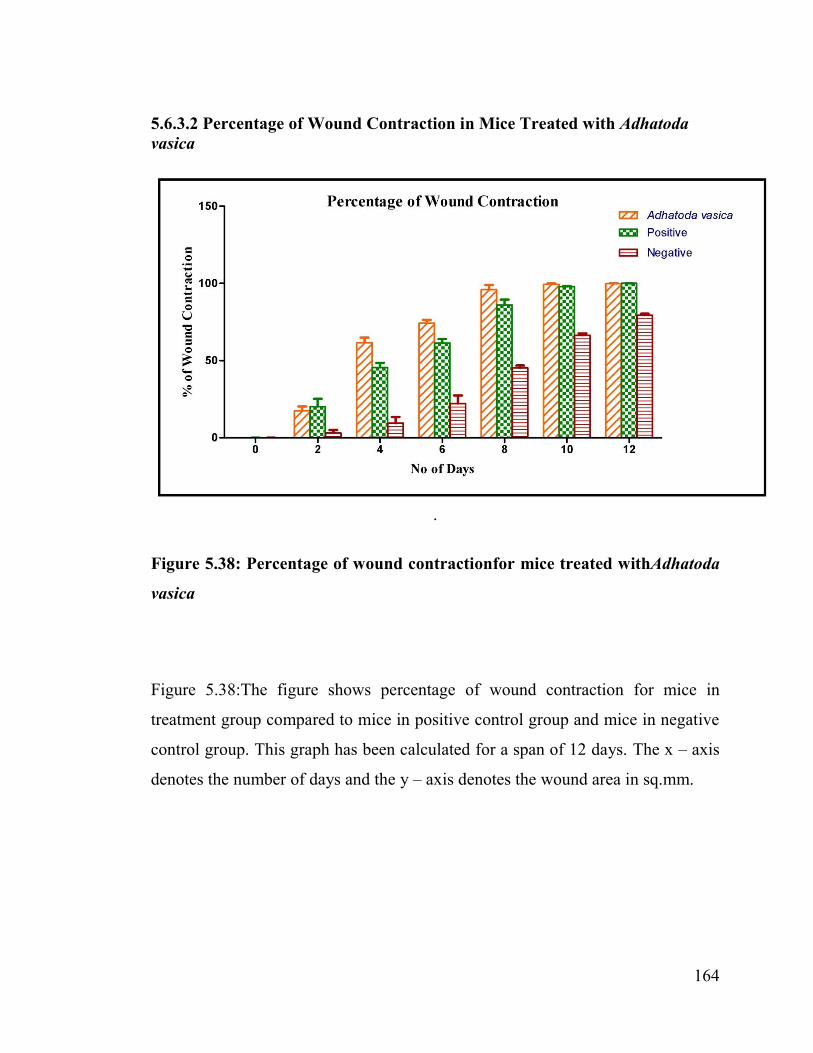
5.6.3.2 Percentage of Wound Contraction in Mice Treated with Adhatoda vasica
.
Figure 5.38: Percentage of wound contractionfor mice treated withAdhatoda
vasica
Figure 5.38:The figure shows percentage of wound contraction for mice in
treatment group compared to mice in positive control group and mice in negative
control group. This graph has been calculated for a span of 12 days. The x – axis
denotes the number of days and the y – axis denotes the wound area in sq.mm.
165
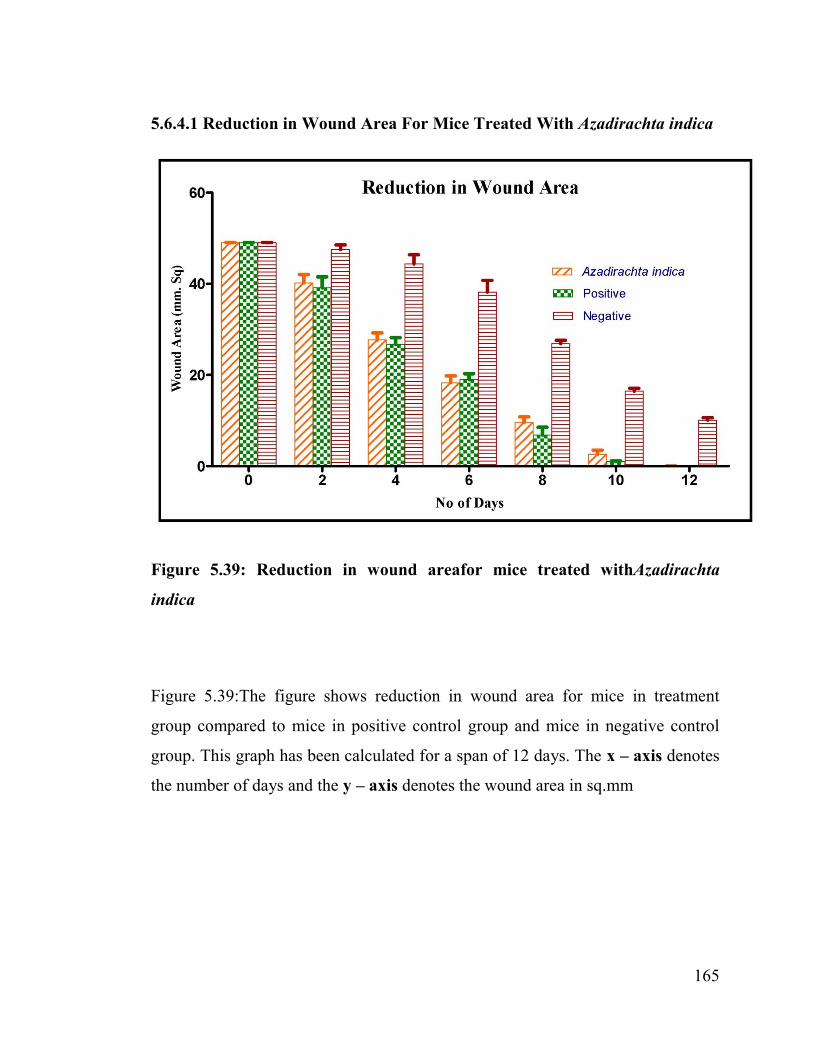
5.6.4.1 Reduction in Wound Area For Mice Treated With Azadirachta indica
Figure 5.39: Reduction in wound areafor mice treated withAzadirachta
indica
Figure 5.39:The figure shows reduction in wound area for mice in treatment
group compared to mice in positive control group and mice in negative control
group. This graph has been calculated for a span of 12 days. The x – axis denotes
the number of days and the y – axis denotes the wound area in sq.mm
166
5.6.4.2 Percentage Of Wound Contraction In Mice Treated With Azadirachta indica
Figure 5.40: Percentage of wound contractionfor mice treated
withAzadirachta indica
Figure 5.40:The figure shows percentage of wound contraction for mice in
treatment group compared to mice in positive control group and mice in negative
control group. This graph has been calculated for a span of 12 days. The x – axis
denotes the number of days and the y – axis denotes the wound area in sq.mm.
167
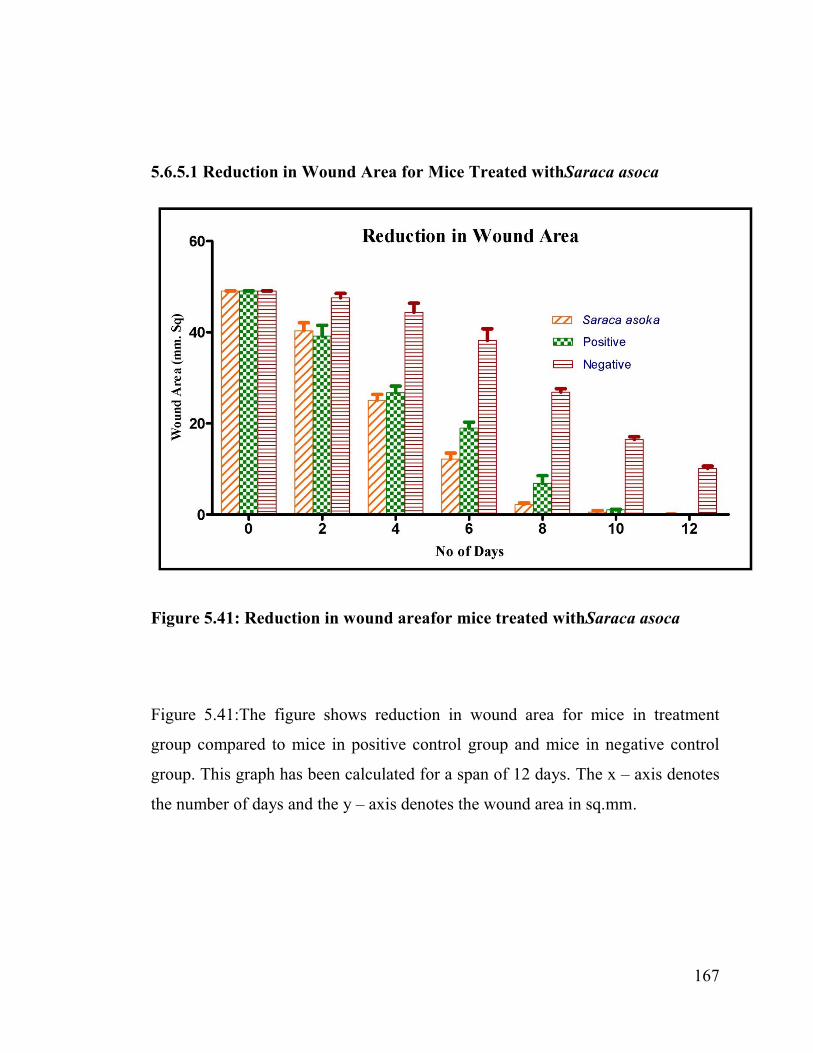
5.6.5.1 Reduction in Wound Area for Mice Treated withSaraca asoca
Figure 5.41: Reduction in wound areafor mice treated withSaraca asoca
Figure 5.41:The figure shows reduction in wound area for mice in treatment
group compared to mice in positive control group and mice in negative control
group. This graph has been calculated for a span of 12 days. The x – axis denotes
the number of days and the y – axis denotes the wound area in sq.mm.
168
5.6.5.2Percentage of Wound Contraction in Mice Treated with Saraca asoca
Figure 5.42: Percentage of wound contractionfor mice treated withSaraca
asoca
Figure 5.42:The figure shows percentage of wound contraction for mice in
treatment group compared to mice in positive control group and mice in negative
control group. This graph has been calculated for a span of 12 days. The x – axis
denotes the number of days and the y – axis denotes the wound area in sq.mm.
169
5.6.6.1 Reduction In Wound Area For Mice Treated With Aegle marmelos
Figure 5.43: Reduction in wound areafor mice treated withAegle marmelos
Figure 5.43:The figure shows reduction in wound area for mice in treatment
group compared to mice in positive control group and mice in negative control
group. This graph has been calculated for a span of 12 days. The x – axis denotes
the number of days and the y – axis denotes the wound area in sq.mm.
170
5.6.6.2 Percentage of Wound Contraction in Mice Treated With Aegle marmelos
Figure 5.44: Percentage of wound contractionfor mice treated withAegle
marmelos
Figure 5.44:The figure shows percentage of wound contraction for mice in
treatment group compared to mice in positive control group and mice in negative
control group. This graph has been calculated for a span of 12 days. The x – axis
denotes the number of days and the y – axis denotes the wound area in sq.mm.
171
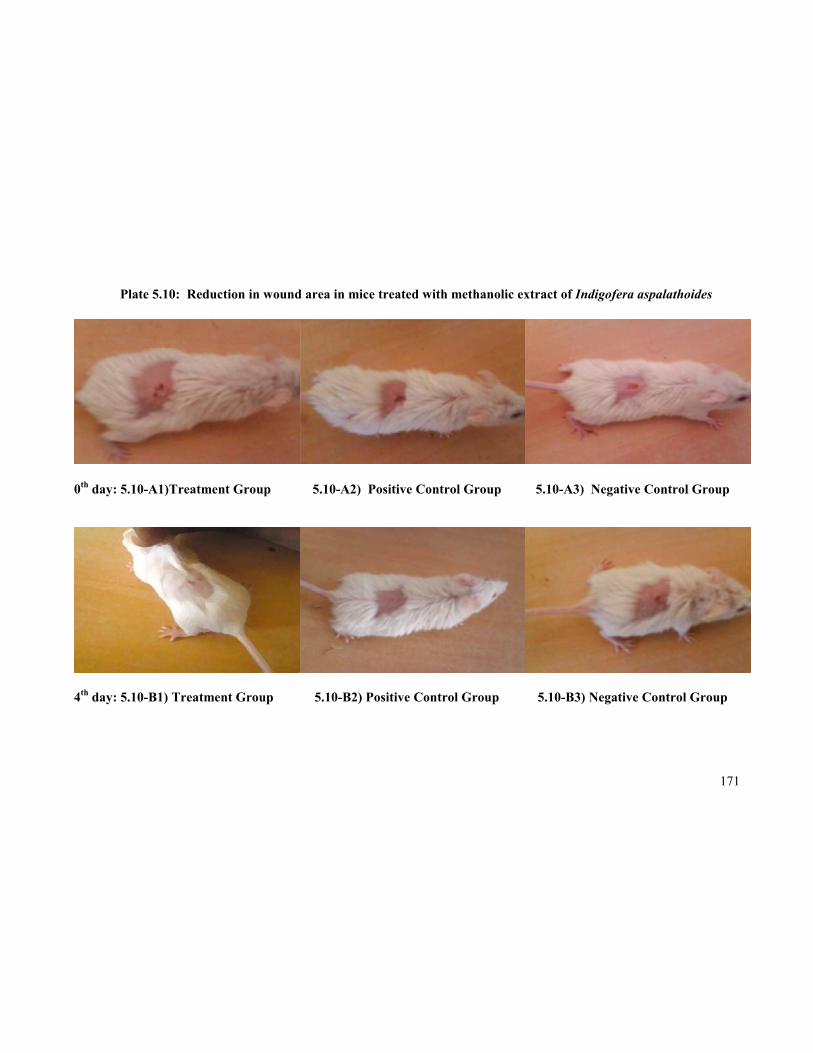
Plate 5.10: Reduction in wound area in mice treated with methanolic extract of Indigofera aspalathoides
0th day: 5.10-A1)Treatment Group 5.10-A2) Positive Control Group 5.10-A3) Negative Control Group
4th day: 5.10-B1) Treatment Group 5.10-B2) Positive Control Group 5.10-B3) Negative Control Group
172
8th day: 5.10-C1) Treatment Group 5.10-C2) Positive Control Group 5.10-C3) Negative Control Group
12th day: 5.10-D1) Treatment Group 5.10-D2) Positive Control Group 5.10-D3) Negative Control Group
Plate 5.10: The plates show reduction in wound area in mice treated with methanolic extract of Indigofera aspalathoides. The photos of mice were taken on the 0th day, 4th day, 8th day and 12th dayof the wound healing period of study.
173
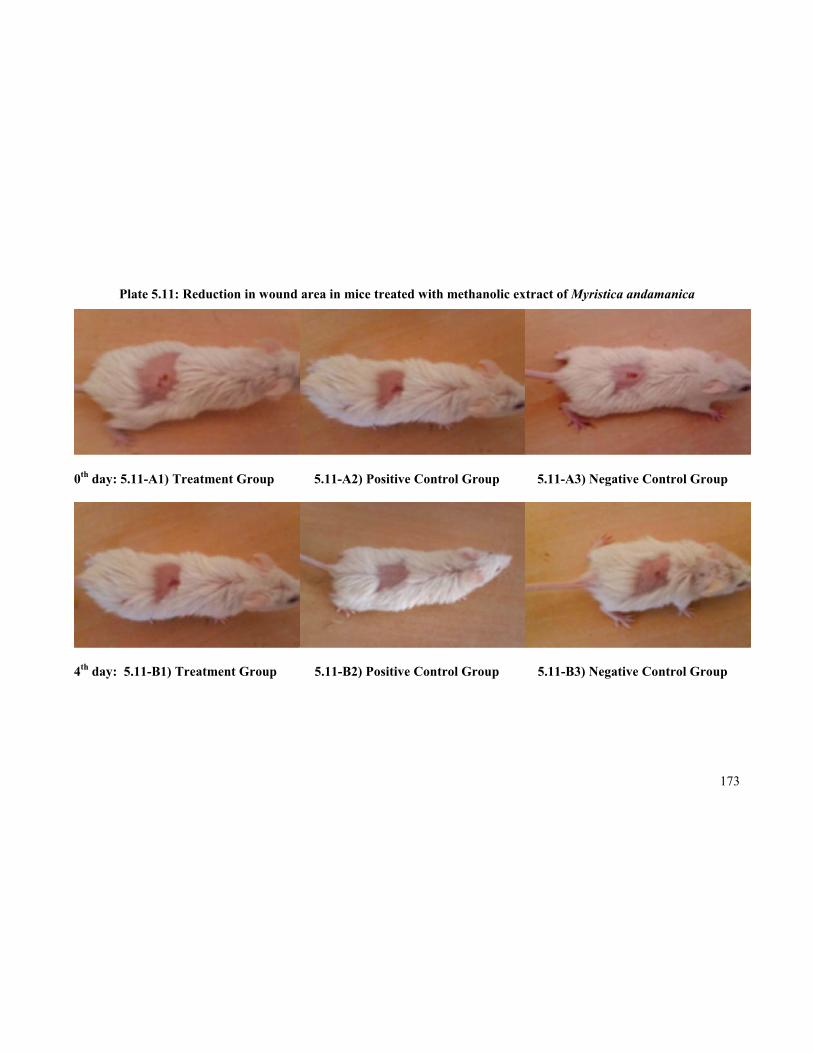
Plate 5.11: Reduction in wound area in mice treated with methanolic extract of Myristica andamanica
0th day: 5.11-A1) Treatment Group 5.11-A2) Positive Control Group 5.11-A3) Negative Control Group
4th day: 5.11-B1) Treatment Group 5.11-B2) Positive Control Group 5.11-B3) Negative Control Group
174
8th day: 5.11-C1) Treatment Group 5.11-C2) Positive Control Group 5.11-C3) Negative Control Group
12th day: 5.11-D1) Treatment Group 5.11-D2) Positive Control Group 5.11-D3) Negative Control Group
Plate 5.11: The plates show reduction in wound area in mice treated with methanolic extract of Myristica andamanica.
The photos of mice were taken on the 0th day, 4th day, 8th day and 12th dayof the wound healing period of study.
175
Plate 5.12: Reduction in wound area in mice treated with methanolic extract ofAdhatoda vasica
0th day: 5.12-A1) Treatment Group 5.12-A2) Positive Control Group 5.12-A3) Negative Control Group
4th day: 5.12-B1) Treatment Group 5.12-B2) Positive Control Group 5.12-B3) Negative Control Group
176
8th day: 5.12-C1) Treatment Group 5.12-C2) Positive Control Group 5.12-C3) Negative Control Group
12th day: 5.12-D1) Treatment Group 5.12-D2) Positive Control Group 5.12-D3) Negative Control Group
Plate 5.12: The plates show reduction in wound area in mice treated with methanolic extract of Adhatoda vasica.The photos of mice were taken on the 0th day, 4th day, 8th day and 12th dayof the wound healing period of study.
177
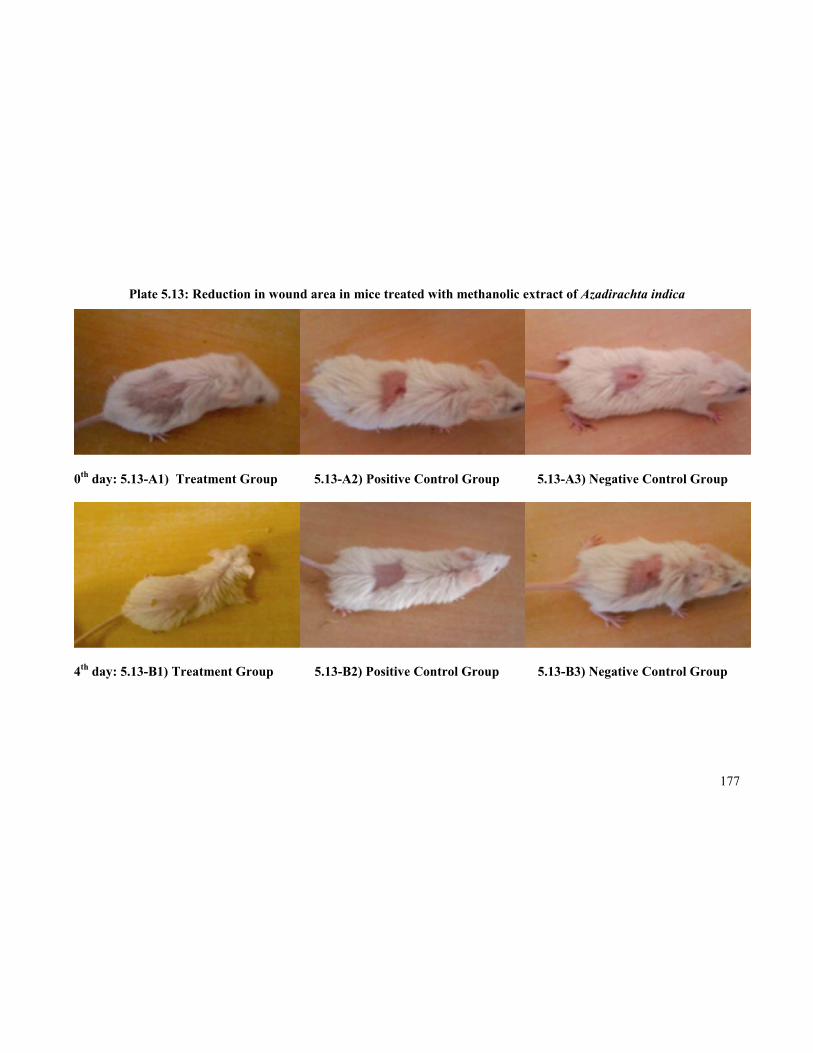
Plate 5.13: Reduction in wound area in mice treated with methanolic extract of Azadirachta indica
0th day: 5.13-A1) Treatment Group 5.13-A2) Positive Control Group 5.13-A3) Negative Control Group
4th day: 5.13-B1) Treatment Group 5.13-B2) Positive Control Group 5.13-B3) Negative Control Group
178
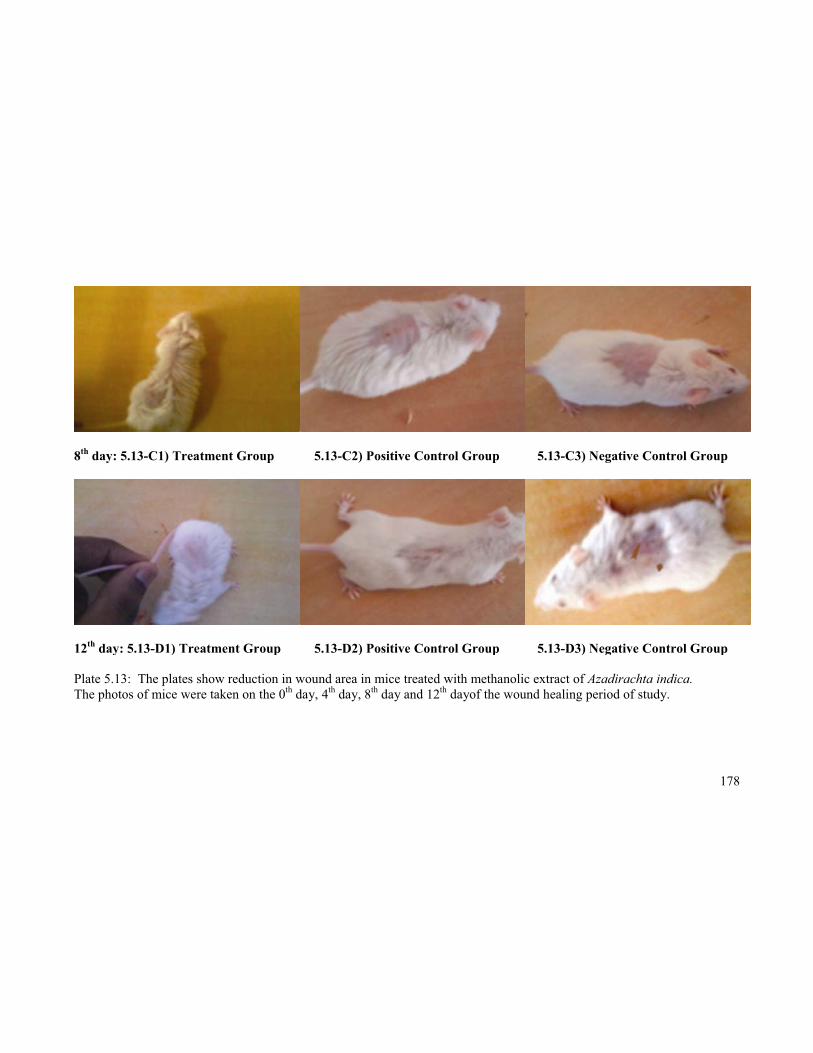
8th day: 5.13-C1) Treatment Group 5.13-C2) Positive Control Group 5.13-C3) Negative Control Group
12th day: 5.13-D1) Treatment Group 5.13-D2) Positive Control Group 5.13-D3) Negative Control Group
Plate 5.13: The plates show reduction in wound area in mice treated with methanolic extract of Azadirachta indica. The photos of mice were taken on the 0th day, 4th day, 8th day and 12th dayof the wound healing period of study.
179
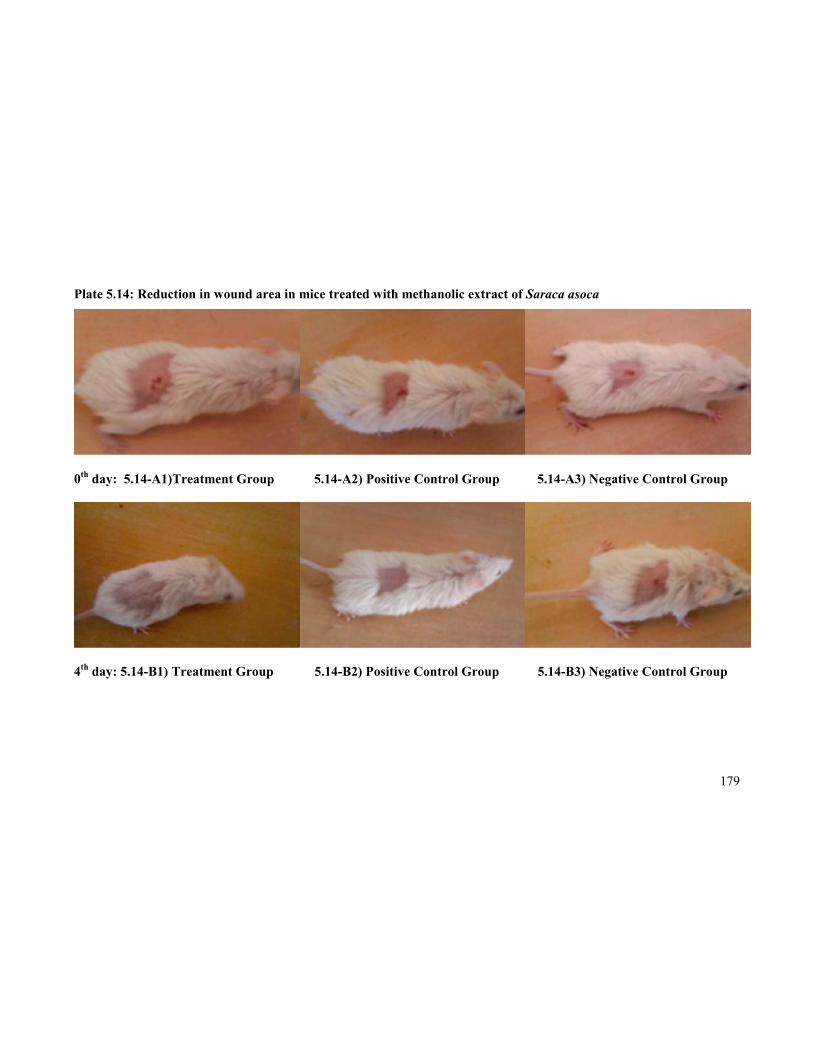
Plate 5.14: Reduction in wound area in mice treated with methanolic extract of Saraca asoca
0th day: 5.14-A1)Treatment Group 5.14-A2) Positive Control Group 5.14-A3) Negative Control Group
4th day: 5.14-B1) Treatment Group 5.14-B2) Positive Control Group 5.14-B3) Negative Control Group
180
8th day: 5.14-C1) Treatment Group 5.14-C2) Positive Control Group 5.14-C3) Negative Control Group
12th day: 5.14-D1) Treatment Group 5.14-D2) Positive Control Group 5.14-D3) Negative Control Group
Plate 5.14: The plates show reduction in wound area in mice treated with methanolic extract of Saraca asoca. The photos of mice were taken on the 0th day, 4th day, 8th day and 12th dayof the wound healing period of study.
181
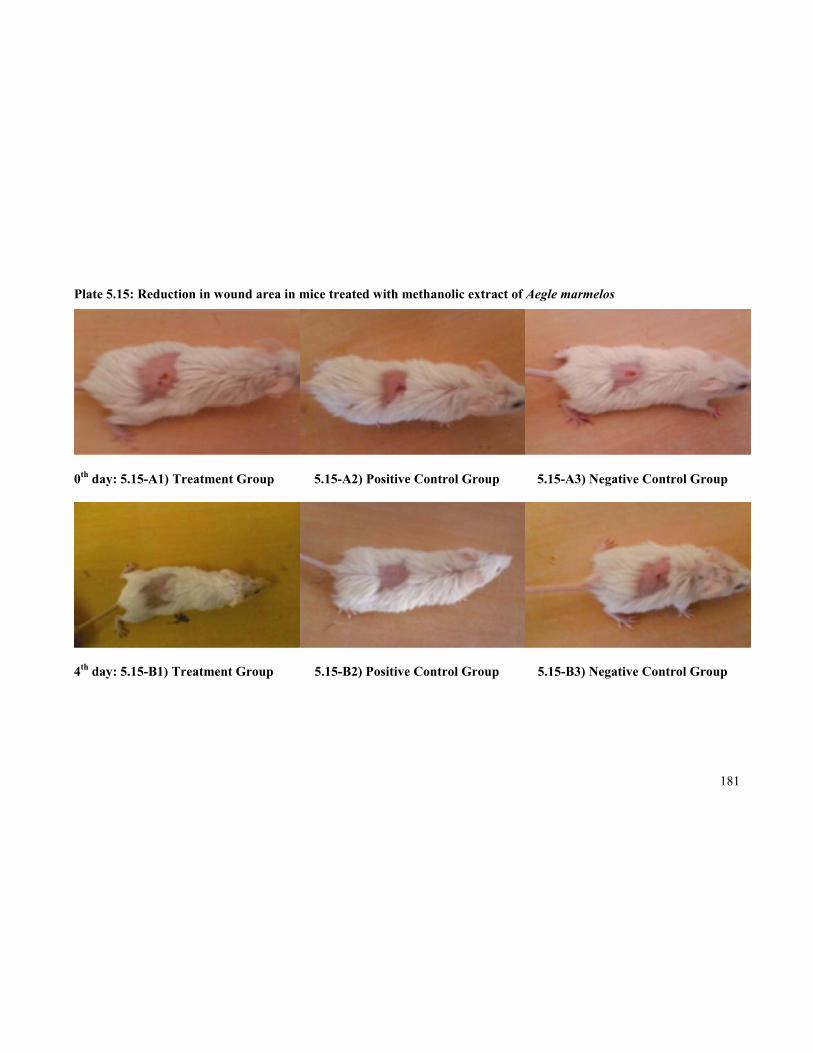
Plate 5.15: Reduction in wound area in mice treated with methanolic extract of Aegle marmelos
0th day: 5.15-A1) Treatment Group 5.15-A2) Positive Control Group 5.15-A3) Negative Control Group
4th day: 5.15-B1) Treatment Group 5.15-B2) Positive Control Group 5.15-B3) Negative Control Group
182
8th day: 5.15-C1) Treatment Group 5.15-C2) Positive Control Group 5.15-C3) Negative Control Group
12th day: 5.15-D1) Treatment Group 5.15-D2) Positive Control Group 5.15-D3) Negative Control Group
Plate 5.15: The plates show reduction in wound area in mice treated with methanolic extract of Aegle marmelos.The photos of mice were taken on the 0th day, 4th day, 8th day and 12th dayof the wound healing period of study.
183
Compared to the day 1 of wound healing, to the day 12 of wound healing
showed complete wound contraction and reduction in wounded area as seen in
Table 5.12 for all the methanolic extracts of the selected plants. On the 12th day
the positive control mice treated with Povidine iodine showed 100% wound
reduction while the negative control showed 80% wound reduction. But the
methanolic extracts treated animal showed above 99% and was equivalent to the
positive control. The methanolic extract of all the six selected medicinal plants
showed similar wound healing activity in 1% w/w of methanolic extract (Plate
5.10 to Plate 5.15: A1, A2, A3, B1, B2, B3, C1, C2, C3, D1, D2 and D3). This
wound healing activity was possible because of the presence of phenolics,
alkaloids, glycosides, flavonoids, tannins, anthraquinone and saponins present in
the extract which is shown in the phytochemical screening table (Table 5.8). The
presence of wound healing was also revealed from the table that the healing
process was slowly progressing from day 1 to day 12 which is shown as reduction
in wound area in Table 5.12 and in table 5.13 as percentage of wound
contraction. This was also well supported by our histopathological studies from
Plate 5.16 to Plate 5.21: A1, A2, A3, B1, B2, B3, C1, C2 and C3. The preliminary
phytochemical analysis of the crude extracts of the six selected Indian medicinal
plants indicated the presence of major phytochemical compounds,including
phenolics, alkaloids, glycosides, flavonoids, andtannins which may be responsible
forthe observed wound healing activities.
184
5.7 HISTOPATHOLOGICAL EXAMINATION
5.7.1 Histopathological Examination of Excised Tissues Treated withIndigofera aspalathoides
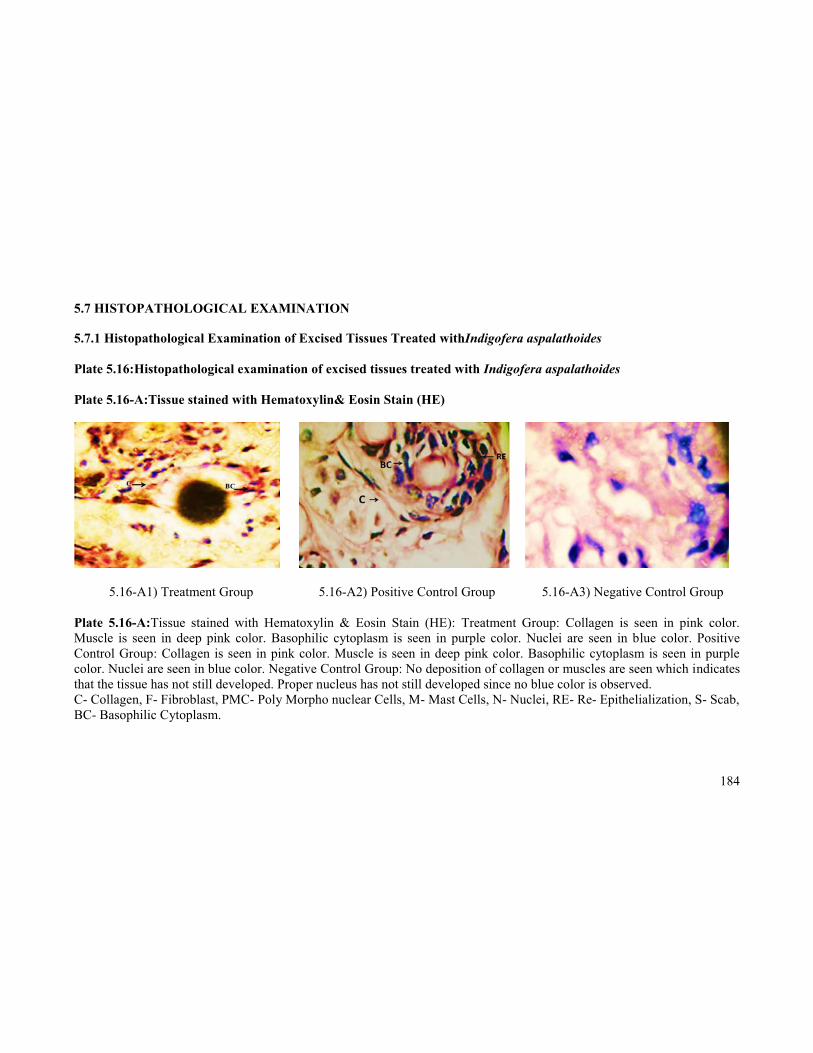
Plate 5.16:Histopathological examination of excised tissues treated with Indigofera aspalathoides
Plate 5.16-A:Tissue stained with Hematoxylin& Eosin Stain (HE)
5.16-A1) Treatment Group 5.16-A2) Positive Control Group 5.16-A3) Negative Control Group
Plate 5.16-A:Tissue stained with Hematoxylin & Eosin Stain (HE): Treatment Group: Collagen is seen in pink color. Muscle is seen in deep pink color. Basophilic cytoplasm is seen in purple color. Nuclei are seen in blue color. Positive Control Group: Collagen is seen in pink color. Muscle is seen in deep pink color. Basophilic cytoplasm is seen in purple color. Nuclei are seen in blue color. Negative Control Group: No deposition of collagen or muscles are seen which indicatesthat the tissue has not still developed. Proper nucleus has not still developed since no blue color is observed.C- Collagen, F- Fibroblast, PMC- Poly Morpho nuclear Cells, M- Mast Cells, N- Nuclei, RE- Re- Epithelialization, S- Scab,BC- Basophilic Cytoplasm.
185
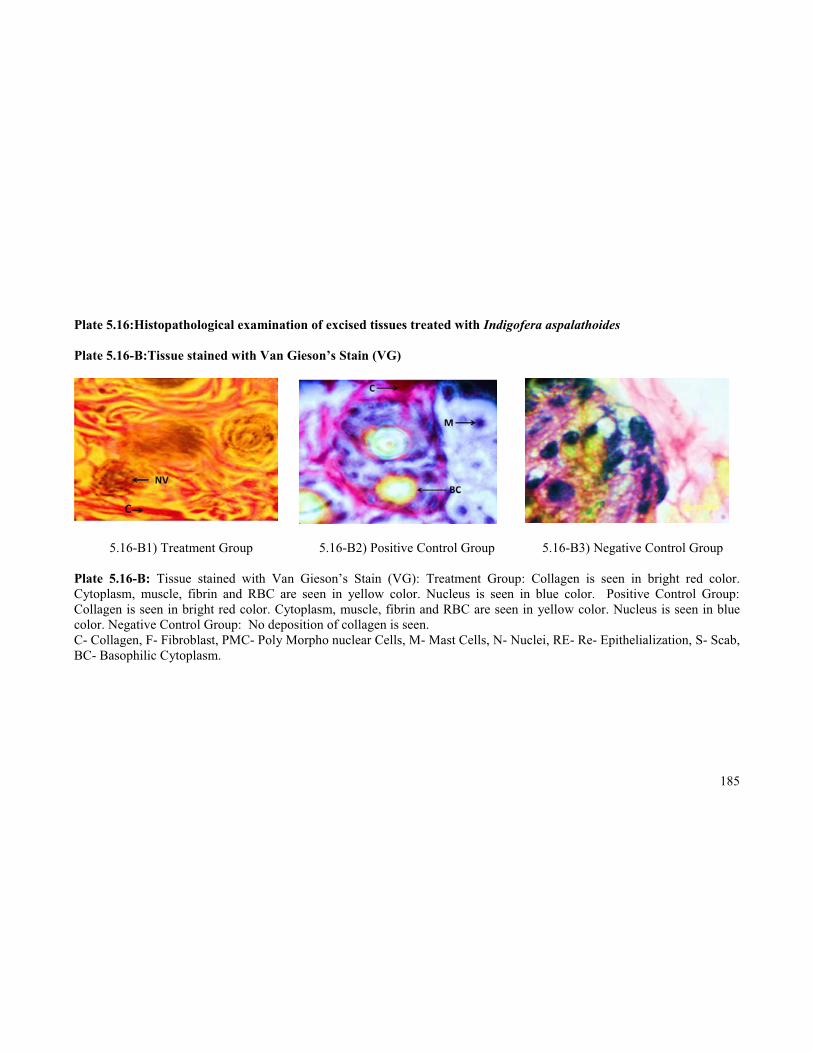
Plate 5.16:Histopathological examination of excised tissues treated with Indigofera aspalathoides
Plate 5.16-B:Tissue stained with Van Gieson’s Stain (VG)
5.16-B1) Treatment Group 5.16-B2) Positive Control Group 5.16-B3) Negative Control Group
Plate 5.16-B: Tissue stained with Van Gieson’s Stain (VG): Treatment Group: Collagen is seen in bright red color. Cytoplasm, muscle, fibrin and RBC are seen in yellow color. Nucleus is seen in blue color. Positive Control Group: Collagen is seen in bright red color. Cytoplasm, muscle, fibrin and RBC are seen in yellow color. Nucleus is seen in blue color. Negative Control Group: No deposition of collagen is seen.C- Collagen, F- Fibroblast, PMC- Poly Morpho nuclear Cells, M- Mast Cells, N- Nuclei, RE- Re- Epithelialization, S- Scab, BC- Basophilic Cytoplasm.
186
Plate 5.16:Histopathological examination of excised tissues treated with Indigofera aspalathoides
Plate 5.16-C:Tissue stained with Toluidine blue Stain (TB)
5.16-C1) Treatment Group 5.16-C2) Positive Control Group 5.16-C3) Negative Control Group
Plate 5.16-C: Tissue stained with Toluidine blue Stain (TB): Treatment Group: Mast cells are seen in blue color. Positive Control Group: Mast cells are seen in blue color. Negative Control Group: No mast cells are observed which indicates thattissue development has not started.C- Collagen, F- Fibroblast, PMC- Poly Morpho nuclear Cells, M- Mast Cells, N- Nuclei, RE- Re- Epithelialization, S- Scab, BC- Basophilic Cytoplasm.
187
5.7.2 Histopathological Examination of Excised Tissues Treated with Myristica andamanica
Plate 5.17:Histopathological examination of excised tissues treated withMyristica andamanica
Plate 5.17-A:Tissue stained with Hematoxylin& Eosin Stain (HE)
5.17-A1) Treatment Group 5.17-A2) Positive Control Group 5.17-A3) Negative Control Group
Plate 5.17-A: Tissue stained with Hematoxylin & Eosin Stain (HE): Treatment Group: Collagen is seen in pink color. Muscle is seen in deep pink color. Basophilic cytoplasm is seen in purple color. Nuclei are seen in blue color. Positive Control Group: Collagen is seen in pink color. Muscle is seen in deep pink color. Basophilic cytoplasm is seen in purple color. Nuclei are seen in blue color. Negative Control Group: No deposition of collagen or muscles are seen which indicatesthat the tissue has not still developed. Proper nucleus has not still developed since no blue color is observed.C- Collagen, F- Fibroblast, PMC- Poly Morpho nuclear Cells, M- Mast Cells, N- Nuclei, RE- Re- Epithelialization, S-Scab, BC- Basophilic Cytoplasm.
188
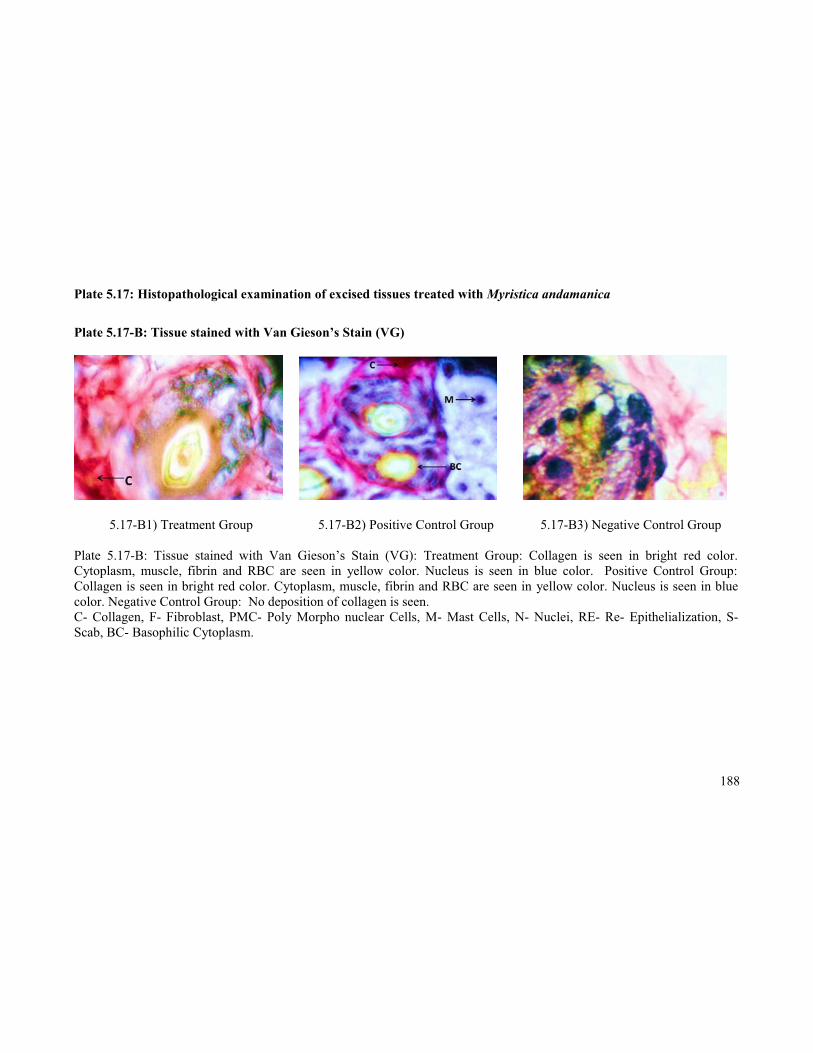
Plate 5.17: Histopathological examination of excised tissues treated with Myristica andamanica
Plate 5.17-B: Tissue stained with Van Gieson’s Stain (VG)
5.17-B1) Treatment Group 5.17-B2) Positive Control Group 5.17-B3) Negative Control Group
Plate 5.17-B: Tissue stained with Van Gieson’s Stain (VG): Treatment Group: Collagen is seen in bright red color. Cytoplasm, muscle, fibrin and RBC are seen in yellow color. Nucleus is seen in blue color. Positive Control Group: Collagen is seen in bright red color. Cytoplasm, muscle, fibrin and RBC are seen in yellow color. Nucleus is seen in blue color. Negative Control Group: No deposition of collagen is seen.C- Collagen, F- Fibroblast, PMC- Poly Morpho nuclear Cells, M- Mast Cells, N- Nuclei, RE- Re- Epithelialization, S-Scab, BC- Basophilic Cytoplasm.
189
Plate 5.17: Histopathological examination of excised tissues treated with Myristica andamanica
Plate 5.17-C: Tissue stained with Toluidine blue Stain (TB)
5.17-C1) Treatment Group 5.17-C2) Positive Control Group 5.17-C3) Negative Control Group
Plate 5.17-C: Tissue stained with Toluidine blue Stain (TB): Treatment Group: Mast cells are seen in blue color. Positive Control Group: Mast cells are seen in blue color. Negative Control Group: No mast cells are observed which indicates that tissue development has not started.C- Collagen, F- Fibroblast, PMC- Poly Morpho nuclear Cells, M- Mast Cells, N- Nuclei, RE- Re- Epithelialization, S- Scab, BC- Basophilic Cytoplasm.
190
5.7.3 Histopathological Examination of Excised Tissues Treated with Adhatoda vasica
Plate 5.18:Histopathological examination of excised tissues treated withAdhatoda vasica
Plate 5.18-A:Tissue stained with Hematoxylin& Eosin Stain (HE)
5.18-A1) Treatment Group 5.18-A2) Positive Control Group 5.18-A3) Negative Control Group
Plate 5.18-A: Tissue stained with Hematoxylin & Eosin Stain (HE): Treatment Group: Collagen is seen in pink color. Muscle is seen in deep pink color. Basophilic cytoplasm is seen in purple color. Nuclei are seen in blue color. Positive Control Group: Collagen is seen in pink color. Muscle is seen in deep pink color. Basophilic cytoplasm is seen in purple color. Nuclei are seen in blue color. Negative Control Group: No deposition of collagen or muscles are seen which indicates that the tissue has not still developed. Proper nucleus has not still developed since no blue color is observed.C- Collagen, F- Fibroblast, PMC- Poly Morpho nuclear Cells, M- Mast Cells, N- Nuclei, RE- Re- Epithelialization, S- Scab,BC- Basophilic Cytoplasm.
191
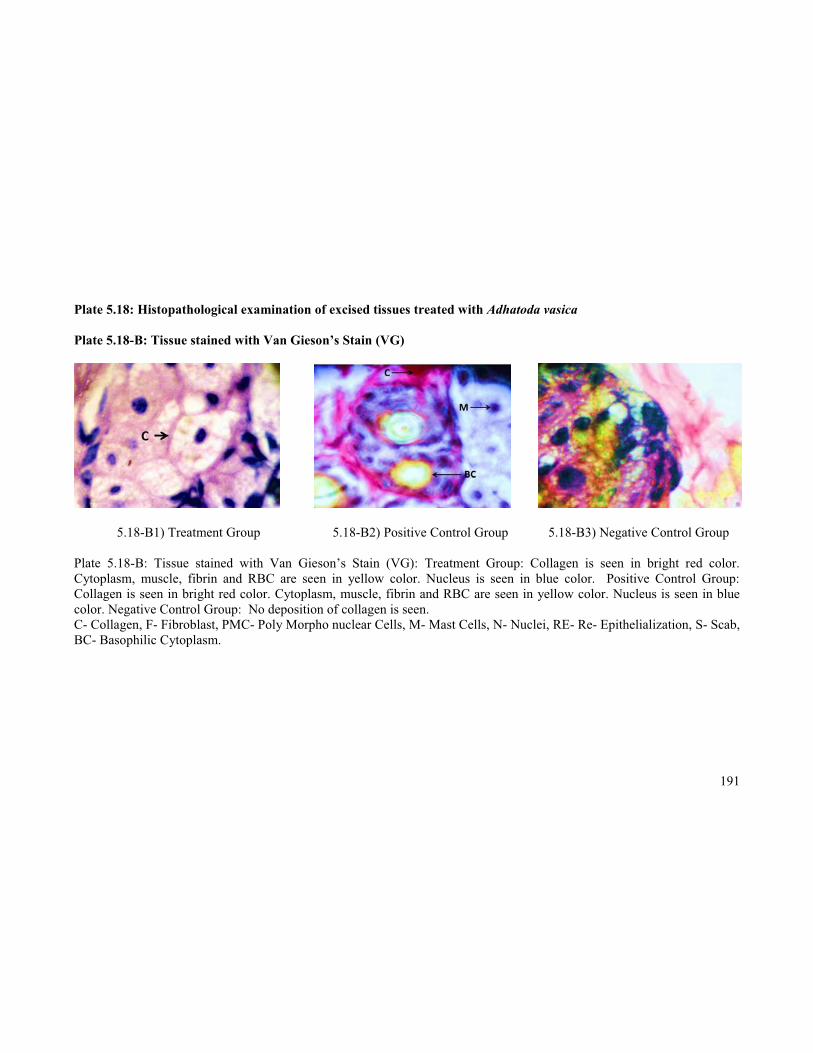
Plate 5.18: Histopathological examination of excised tissues treated with Adhatoda vasica
Plate 5.18-B: Tissue stained with Van Gieson’s Stain (VG)
5.18-B1) Treatment Group 5.18-B2) Positive Control Group 5.18-B3) Negative Control Group
Plate 5.18-B: Tissue stained with Van Gieson’s Stain (VG): Treatment Group: Collagen is seen in bright red color. Cytoplasm, muscle, fibrin and RBC are seen in yellow color. Nucleus is seen in blue color. Positive Control Group: Collagen is seen in bright red color. Cytoplasm, muscle, fibrin and RBC are seen in yellow color. Nucleus is seen in blue color. Negative Control Group: No deposition of collagen is seen.C- Collagen, F- Fibroblast, PMC- Poly Morpho nuclear Cells, M- Mast Cells, N- Nuclei, RE- Re- Epithelialization, S- Scab, BC- Basophilic Cytoplasm.
192
Plate 5.18: Histopathological examination of excised tissues treated with Adhatoda vasica
Plate 5.18-C: Tissue stained with Toluidine blue Stain (TB)
5.18-C1) Treatment Group 5.18-C2) Positive Control Group 5.18-C3) Negative Control Group
Plate 5.18-C: Tissue stained with Toluidine blue Stain (TB): Treatment Group: Mast cells are seen in blue color. Positive Control Group: Mast cells are seen in blue color. Negative Control Group: No mast cells are observed which indicates that tissue development has not started.C- Collagen, F- Fibroblast, PMC- Poly Morpho nuclear Cells, M- Mast Cells, N- Nuclei, RE- Re- Epithelialization, S- Scab, BC- Basophilic Cytoplasm.
193
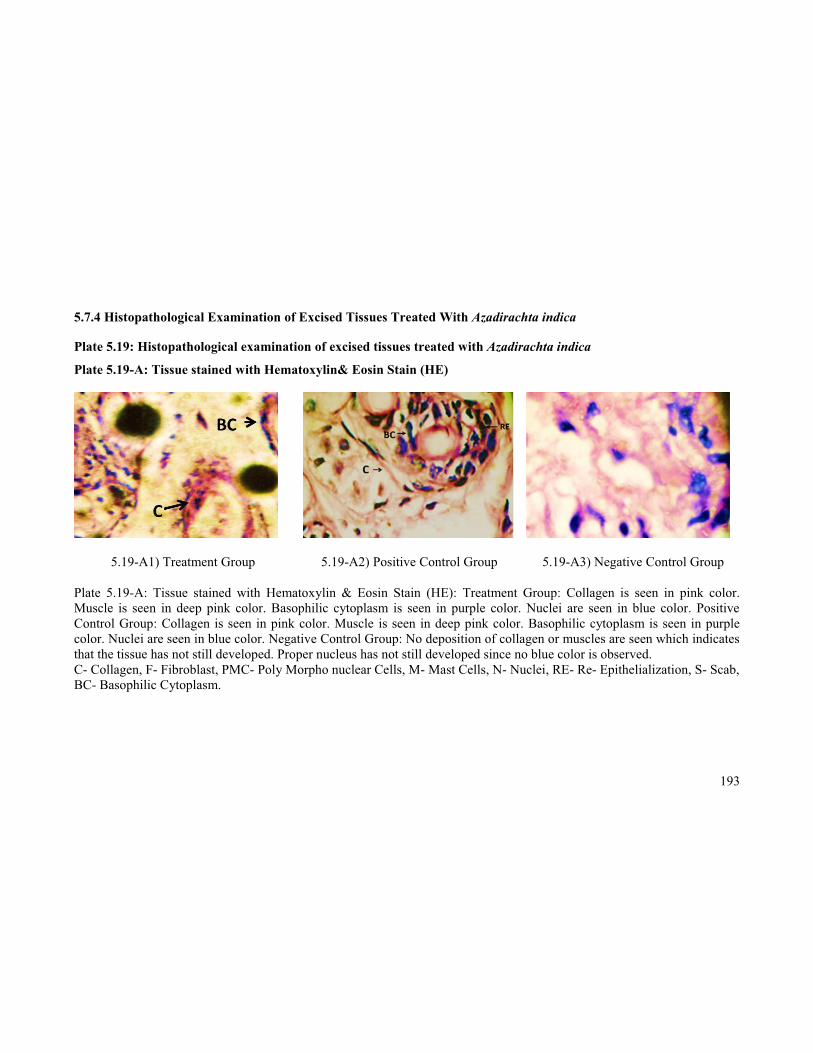
5.7.4 Histopathological Examination of Excised Tissues Treated With Azadirachta indica
Plate 5.19: Histopathological examination of excised tissues treated with Azadirachta indica
Plate 5.19-A: Tissue stained with Hematoxylin& Eosin Stain (HE)
5.19-A1) Treatment Group 5.19-A2) Positive Control Group 5.19-A3) Negative Control Group
Plate 5.19-A: Tissue stained with Hematoxylin & Eosin Stain (HE): Treatment Group: Collagen is seen in pink color. Muscle is seen in deep pink color. Basophilic cytoplasm is seen in purple color. Nuclei are seen in blue color. Positive Control Group: Collagen is seen in pink color. Muscle is seen in deep pink color. Basophilic cytoplasm is seen in purple color. Nuclei are seen in blue color. Negative Control Group: No deposition of collagen or muscles are seen which indicates that the tissue has not still developed. Proper nucleus has not still developed since no blue color is observed.C- Collagen, F- Fibroblast, PMC- Poly Morpho nuclear Cells, M- Mast Cells, N- Nuclei, RE- Re- Epithelialization, S- Scab,BC- Basophilic Cytoplasm.
194
Plate 5.19: Histopathological examination of excised tissues treated with Azadirachta indica
Plate 5.19-B: Tissue stained with Van Gieson’s Stain (VG)
5.19-B1) Treatment Group 5.19-B2) Positive Control Group 5.19-B3) Negative Control Group
Plate 5.19-B: Tissue stained with Van Gieson’s Stain (VG): Treatment Group: Collagen is seen in bright red color. Cytoplasm, muscle, fibrin and RBC are seen in yellow color. Nucleus is seen in blue color. Positive Control Group: Collagen is seen in bright red color. Cytoplasm, muscle, fibrin and RBC are seen in yellow color. Nucleus is seen in blue color. Negative Control Group: No deposition of collagen is seen.C- Collagen, F- Fibroblast, PMC- Poly Morpho nuclear Cells, M- Mast Cells, N- Nuclei, RE- Re- Epithelialization, S- Scab, BC- Basophilic Cytoplasm.
195
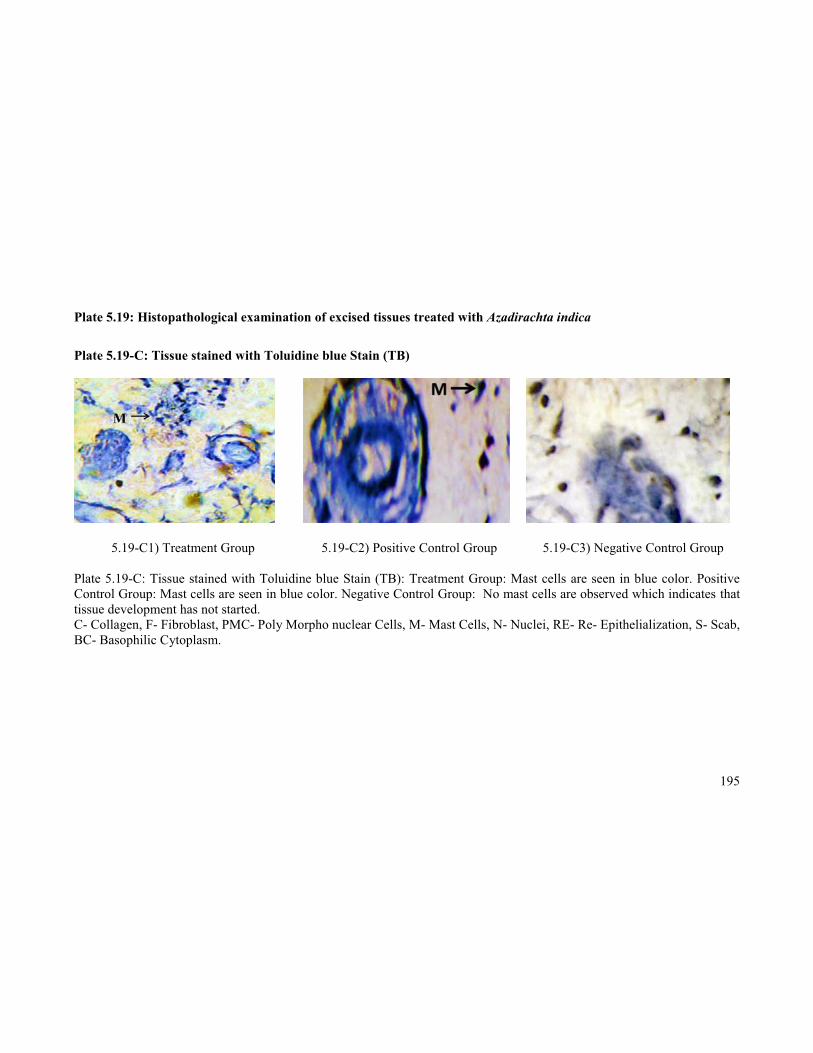
Plate 5.19: Histopathological examination of excised tissues treated with Azadirachta indica
Plate 5.19-C: Tissue stained with Toluidine blue Stain (TB)
5.19-C1) Treatment Group 5.19-C2) Positive Control Group 5.19-C3) Negative Control Group
Plate 5.19-C: Tissue stained with Toluidine blue Stain (TB): Treatment Group: Mast cells are seen in blue color. Positive Control Group: Mast cells are seen in blue color. Negative Control Group: No mast cells are observed which indicates thattissue development has not started.C- Collagen, F- Fibroblast, PMC- Poly Morpho nuclear Cells, M- Mast Cells, N- Nuclei, RE- Re- Epithelialization, S- Scab, BC- Basophilic Cytoplasm.
196
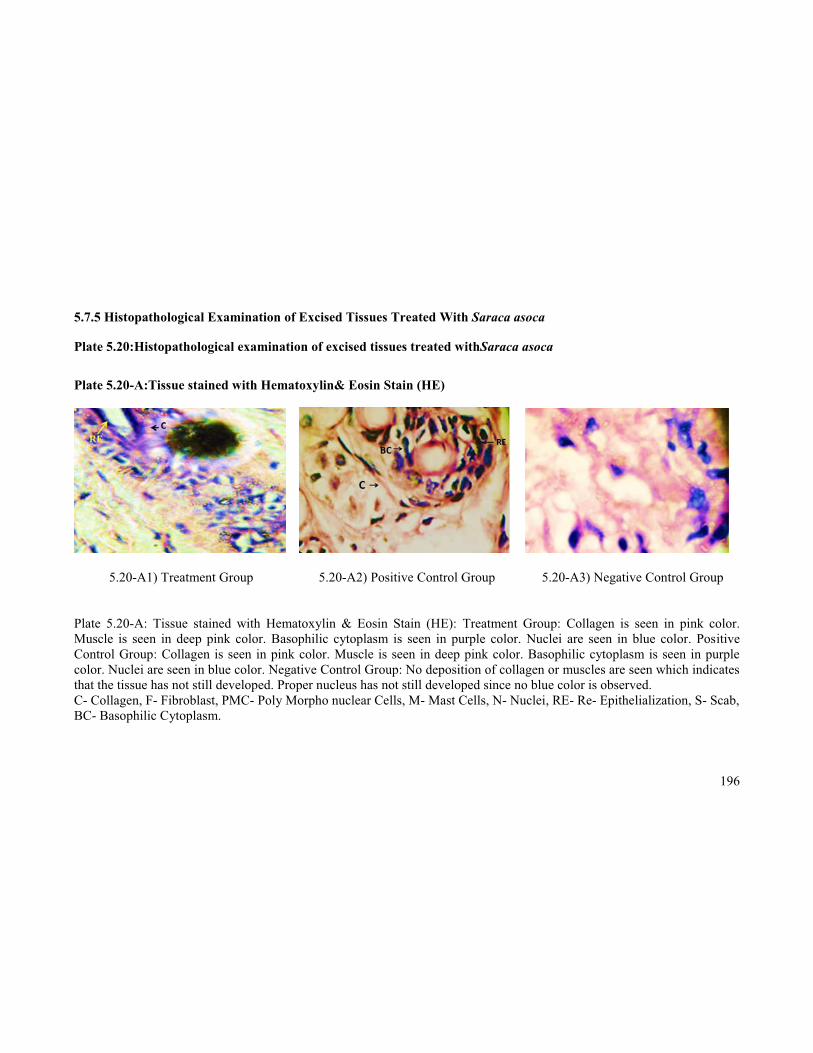
5.7.5 Histopathological Examination of Excised Tissues Treated With Saraca asoca
Plate 5.20:Histopathological examination of excised tissues treated withSaraca asoca
Plate 5.20-A:Tissue stained with Hematoxylin& Eosin Stain (HE)
5.20-A1) Treatment Group 5.20-A2) Positive Control Group 5.20-A3) Negative Control Group
Plate 5.20-A: Tissue stained with Hematoxylin & Eosin Stain (HE): Treatment Group: Collagen is seen in pink color. Muscle is seen in deep pink color. Basophilic cytoplasm is seen in purple color. Nuclei are seen in blue color. Positive Control Group: Collagen is seen in pink color. Muscle is seen in deep pink color. Basophilic cytoplasm is seen in purple color. Nuclei are seen in blue color. Negative Control Group: No deposition of collagen or muscles are seen which indicates that the tissue has not still developed. Proper nucleus has not still developed since no blue color is observed.C- Collagen, F- Fibroblast, PMC- Poly Morpho nuclear Cells, M- Mast Cells, N- Nuclei, RE- Re- Epithelialization, S- Scab,BC- Basophilic Cytoplasm.
197
Plate 5.20: Histopathological examination of excised tissues treated with Saraca asoca
Plate 5.20-B: Tissue stained with Van Gieson’s Stain (VG)
5.20-B1) Treatment Group 5.20-B2) Positive Control Group 5.20-B3) Negative Control Group
Plate 5.20-B: Tissue stained with Van Gieson’s Stain (VG): Treatment Group: Collagen is seen in bright red color. Cytoplasm, muscle, fibrin and RBC are seen in yellow color. Nucleus is seen in blue color. Positive Control Group: Collagen is seen in bright red color. Cytoplasm, muscle, fibrin and RBC are seen in yellow color. Nucleus is seen in blue color. Negative Control Group: No deposition of collagen is seen.C- Collagen, F- Fibroblast, PMC- Poly Morpho nuclear Cells, M- Mast Cells, N- Nuclei, RE- Re- Epithelialization, S- Scab, BC- Basophilic Cytoplasm.
198
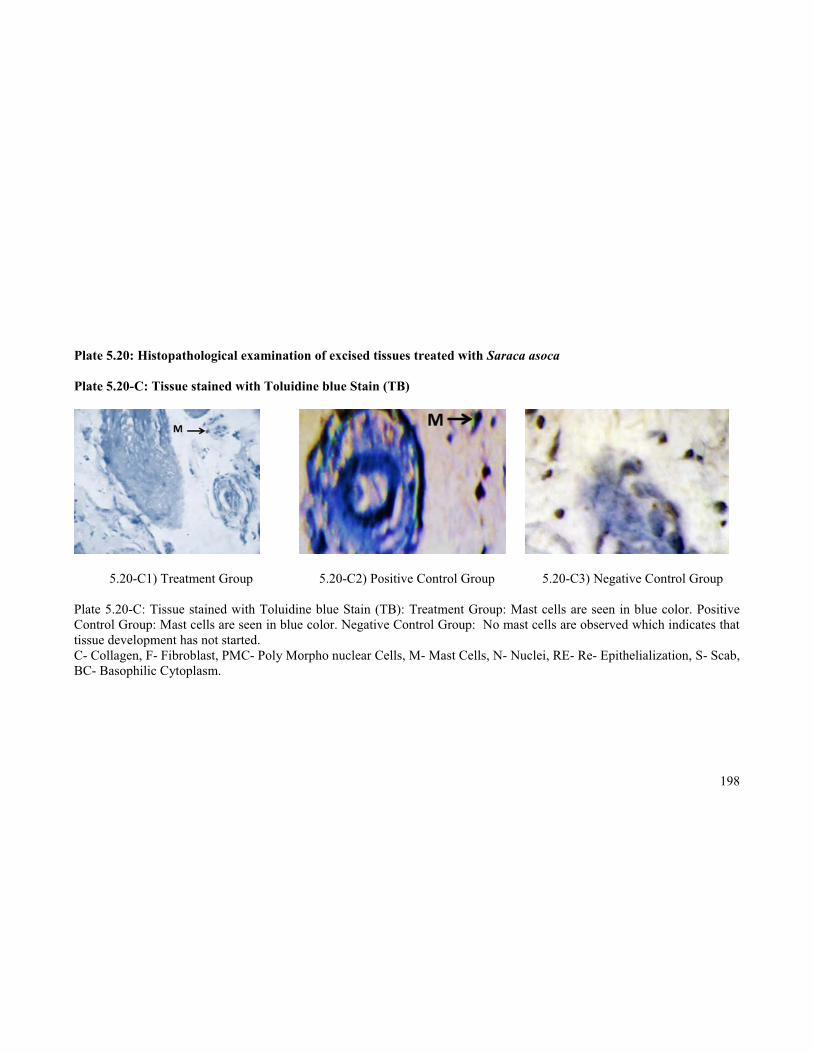
Plate 5.20: Histopathological examination of excised tissues treated with Saraca asoca
Plate 5.20-C: Tissue stained with Toluidine blue Stain (TB)
5.20-C1) Treatment Group 5.20-C2) Positive Control Group 5.20-C3) Negative Control Group
Plate 5.20-C: Tissue stained with Toluidine blue Stain (TB): Treatment Group: Mast cells are seen in blue color. Positive Control Group: Mast cells are seen in blue color. Negative Control Group: No mast cells are observed which indicates that tissue development has not started. C- Collagen, F- Fibroblast, PMC- Poly Morpho nuclear Cells, M- Mast Cells, N- Nuclei, RE- Re- Epithelialization, S- Scab, BC- Basophilic Cytoplasm.
199
5.7.6 Histopathological Examination of Excised Tissues Treated With Aegle marmelos
Plate 5.21:Histopathological examination of excised tissues treated withAegle marmelos
Plate 5.21-A:Tissue stained with Hematoxylin& Eosin Stain (HE)
5.21-A1) Treatment Group 5.21-A2) Positive Control Group 5.21-A3) Negative Control Group
Plate 5.21-A: Tissue stained with Hematoxylin & Eosin Stain (HE): Treatment Group: Collagen is seen in pink color. Muscle is seen in deep pink color. Basophilic cytoplasm is seen in purple color. Nuclei are seen in blue color. Positive Control Group: Collagen is seen in pink color. Muscle is seen in deep pink color. Basophilic cytoplasm is seen in purple color. Nuclei are seen in blue color. Negative Control Group: No deposition of collagen or muscles are seen which indicates that the tissue has not still developed. Proper nucleus has not still developed since no blue color is observed.C- Collagen, F- Fibroblast, PMC- Poly Morpho nuclear Cells, M- Mast Cells, N- Nuclei, RE- Re- Epithelialization, S- Scab,BC- Basophilic Cytoplasm.
200
Plate 5.21: Histopathological examination of excised tissues treated with Aegle marmelos
Plate 5.21-B: Tissue stained with Van Gieson’s Stain (VG)
5.21-B1) Treatment Group 5.21-B2) Positive Control Group 5.21-B3) Negative Control Group
Plate 5.21-B: Tissue stained with Van Gieson’s Stain (VG): Treatment Group: Collagen is seen in bright red color. Cytoplasm, muscle, fibrin and RBC are seen in yellow color. Nucleus is seen in blue color. Positive Control Group: Collagen is seen in bright red color. Cytoplasm, muscle, fibrin and RBC are seen in yellow color. Nucleus is seen in blue color. Negative Control Group: No deposition of collagen is seen.C- Collagen, F- Fibroblast, PMC- Poly Morpho nuclear Cells, M- Mast Cells, N- Nuclei, RE- Re- Epithelialization, S- Scab, BC- Basophilic Cytoplasm.
201
Plate 5.21: Histopathological examination of excised tissues treated with Aegle marmelos
Plate 5.21-C: Tissue stained with Toluidine blue Stain (TB)
5.21-C1) Treatment Group 5.21-C2) Positive Control Group 5.21-C3) Negative Control Group
Plate 5.21-C: Tissue stained with Toluidine blue Stain (TB): Treatment Group: Mast cells are seen in blue color. Positive Control Group: Mast cells are seen in blue color. Negative Control Group: No mast cells are observed which indicates that tissue development has not started.C- Collagen, F- Fibroblast, PMC- Poly Morpho nuclear Cells, M- Mast Cells, N- Nuclei, RE- Re- Epithelialization, S- Scab, BC- Basophilic Cytoplasm.
202
The tissues were stained for nucleus and collagen with Hematoxylin &
Eosin Stain in the treatment group as shown in plate 5.16-A1, 5.17-A1, 5.18-A1,
5.19-A1, 5.20-A1 and 5.21-A1 and positive control group as shown in plate 5.16-
A2, 5.17-A2, 5.18-A2, 5.19-A2, 5.20-A2, and 5.21-A2 which shows collagen in
pink color. Muscle fibres can be observed in deep pink color. Basophilic
cytoplasm is seen in purple color. The nucleus can be seen in blue color. The
formation of collagen and muscle fibres cannot be observed in the negative
control groupas shown in plate 5.16-A3, 5.17-A3, 5.18-A3, 5.19-A3, 5.20-A3 and
5.21-A3. The nucleus is also not formed properly.
The tissues were stained fornucleus, muscle fibres and collagen with Van
Gieson’s Stain in the treatment group as shown in plate 5.16-B1, 5.17-B1, 5.18-
B1, 5.19-B1, 5.20-B1 and 5.21-B1 and positive control group as shown in plate
5.16-B2, 5.17-B2, 5.18-B2, 5.19-B2, 5.20-B2 and 5.21-B2 which shows collagen
in bright red color. The cytoplasm, muscle fibres and fibrin is observed as yellow
color. The nucleus can be seen in blue color. But the formation of collagen and
nucleus cannot be observed in the negative control groupas shown in plate 5.16-
B3, 5.17-B3, 5.18-B3, 5.19-B3, 5.20-B3 and 5.21-B3.
The tissues were stained for mast cells with Toluidine blue Stain in the
treatment group as shown in plate 5.16-C1, 5.17-C1, 5.18-C1, 5.19-C1, 5.20-C1
and 5.21-C1 and as shown in plate 5.16-C2, 5.17-C2, 5.18-C2, 5.19-C2, 5.20-C2
and 5.21-C2 positive control group which shows mast cells in blue color.
Whereas, the mast cells cannot be observed in negative control groupas shown in
plate 5.16-C3, 5.17-C3, 5.18-C3, 5.19-C3, 5.20-C3 and 5.21-C3.
The result of the present study on wound healing activity indicated that the
methanolic extract of the six selected medicinal plants promotes wound healing in
experimental mice. This was demonstrated by a significant decrease in the
wound area and increase in the percentage of wound contraction. The increased
percentage of wound contraction in the methanolic extract treated mice may be
203
due to enhanced activity of fibroblasts in the regenerated wound tissues.
Myofibroblasts are believed to play a major role in the wound contraction by
exerting tension on the surrounding extracellular matrix and secreting
extracellular matrix proteins such as collagen to stabilize the contraction of
wound. Collagen is a major protein of the extracellular matrix and an important
component that ultimately contributes to the wound strength [281].
Angiogenesis is a critical component of wound healing process. Delayed
or aberrant revascularization at the site of wounds contributes to the etiology of
chronic wounds and prolonged and delayed wound healing process [282]. The
methanolic extract treatment on the wounds promoted angiogenesis in the mice as
is evident in the histopathological studies. Free radicals are generated at the site
of injury which impairs the healing process by causing damage to cellular
membranes, nucleotides, proteins and lipids [283].
The use of antioxidants has been shown to increase the wound healing
activity [115]. Flavonoids are efficient antioxidants that is capable of scavenging
the free radicals and has also been reported to play an important role on the
wound healing process in many animal models [284,285,286].
The present study on wound healing activities clearly indicates that the
methanolic extract of the selected medicinal plants promotes the wound healing
process in experimental mice. The treatment of the wounds with the plant extract
augmented the endogenous antioxidants and prevented the free radical mediated
tissue injury. The methanolic extract of the medicinal plants also played a vital
role in the angiogenesis, formation of the extracellular matrix and remodeling
phase of wound healing process in mice.
Wound healing is a very complex, multifactor sequence of events
involving several cellular and biochemical processes. The aim in these processes
is to regenerate and reconstruct the disrupted anatomical continuity and functional
204
status of the skin. Healing process, a natural body reaction to injury, initiates
immediately after wounding and occurs in four stages.
The first phase is coagulation which controls excessive blood loss from the
damaged vessels. The next stage of the healing process is inflammation and
debridement of wound followed by re-epithelialization which includes
proliferation, migration and differentiation of squamous epithelial cells of the
epidermis. In the final stage of the healing process collagen deposition and
remodeling occurs within the dermis.
The results showed wound healing and repair, accelerated by applying gel
of medicinal plant extract which was highlighted by the full thickness coverage of
the wound area by an organized epidermis.Study on animal models showed
enhanced rate of wound contraction and drastic reduction in healingtime than
control, which might be due to enhanced epitheliasation.
The treated woundafter 4 days itself exhibit marked dryness of wound
margins with tissue regeneration.However, histological evaluation showed that,
increased cellular infiltration from hematoxylin and eosin staining in treated cases
may be due to chemo tactic effect enhanced by the crude extract which mighthave
attracted inflammatory cells towards the wound site.
Increased cellular proliferation may be due to the mitogenic activity of the
plant extract, which might have significantly contributed to healing process. Early
dermal and epidermal regeneration in treated mice also confirmed that the extract
had a positive effect towards cellular proliferation, granular tissue formationand
epitheliasation.
The histopathological study revealed increased collagen deposition in the
treatment group as compared to the positive and the negative control group, as
confirmed by the Hematoxylin & Eosin Stain and also by Van Gieson’s Stain
205
5.8 ANTIGENOTOXIC ACTIVITY
Plate 5.22: Fish Erythrocytes of Control CellsPlate 5.22: The plate showsfish erythrocytes of control cells
Plate 5.23: Fish Erythrocytes showing the Micro nucleated and
Multinucleated Cells
Plate 5.23: The plate shows fish erythrocytes showing the micro nucleated and
multinucleated cells
1000 X
206
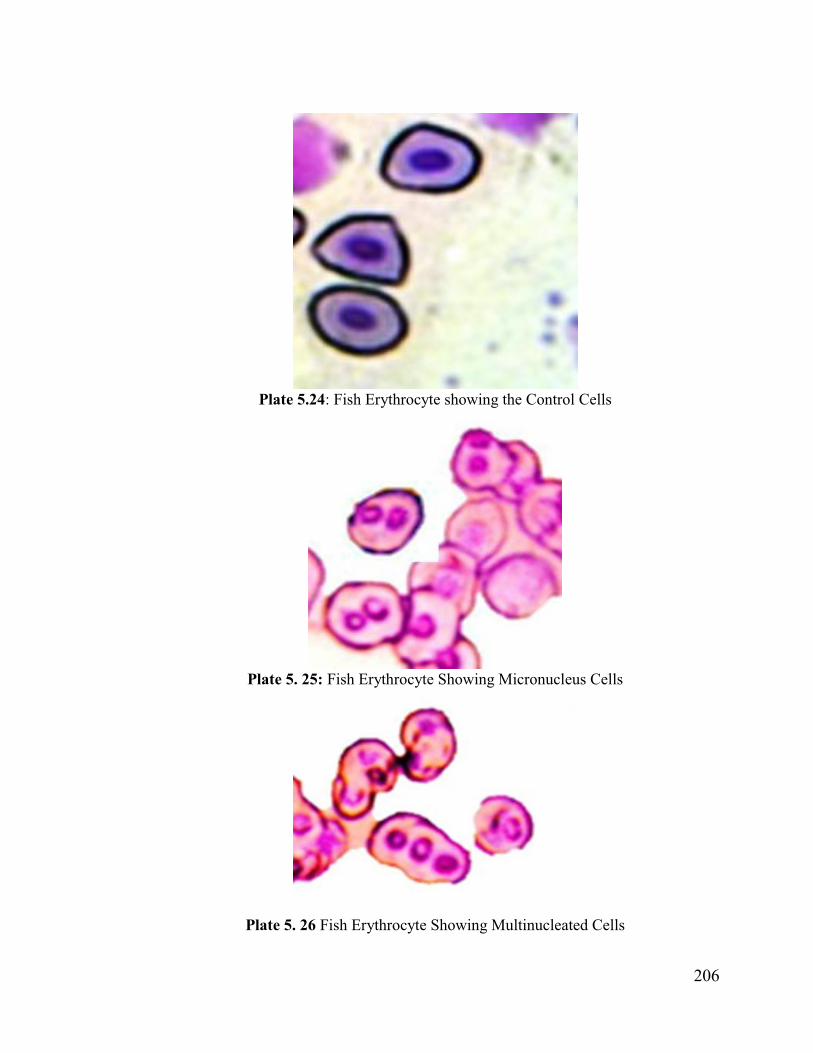
Plate 5.24: Fish Erythrocyte showing the Control Cells
Plate 5. 25: Fish Erythrocyte Showing Micronucleus Cells
Plate 5. 26 Fish Erythrocyte Showing Multinucleated Cells
207
5.8.1Micronucleus Assay 5.8.1.1 Micronucleus Assay for Pungasius pungasius treated with aqueousextract of Indigofera aspalathoides leaves
Table 5.14: Micronucleus assay for Pungasius pungasius treated with
aqueous extract of Indigofera aspalathoides leaves*
Sample 13.5 Gy 27 Gy% of
Micronucleated cells
% of Binucleated
cells
% of Multinucleated
cells
% of Micronucleated
cells
% of Binucleated
cells
% of Multinucleated
cells+ ve
control0.8 0.2 0.4 0.5 0.2 0.3
- ve
control11.5 4.7 1.2 15.1 7.4 5.3
10 ppm 3.1 1.5 1.3 10.1 3.3 2.1
*The table shows micronucleus assay for Pungasius pungasius treated with
aqueous extract of Indigofera aspalathoides leaves.
5.8.1.2 Micronucleus Assay for Pungasius pungasius treated with aqueousextract of Myristica Andamanica leaves
Table 5.15:Micronucleus assay for Pungasius pungasius treated with
aqueous extract of Myristica andamanica leaves*
Sample13.5 Gy 27 Gy
% of Micronucleated
cells
% of Binucleated
cells
% of Multinucleated
cells
% of Micronucleated
cells
% of Binucleated
cells
% of Multinucleated
cells+ ve control
1.2 0.3 0.4 1.5 0.2 0.6- ve control
11.5 2.8 1.7 15.5 4.2 3.210 ppm 3.7 2.2 0.6 3.1 1.8 0.2*The table shows the micronucleus assay for Pungasius pungasius treated with
aqueous extract of Myristica andamanica leaves.
208
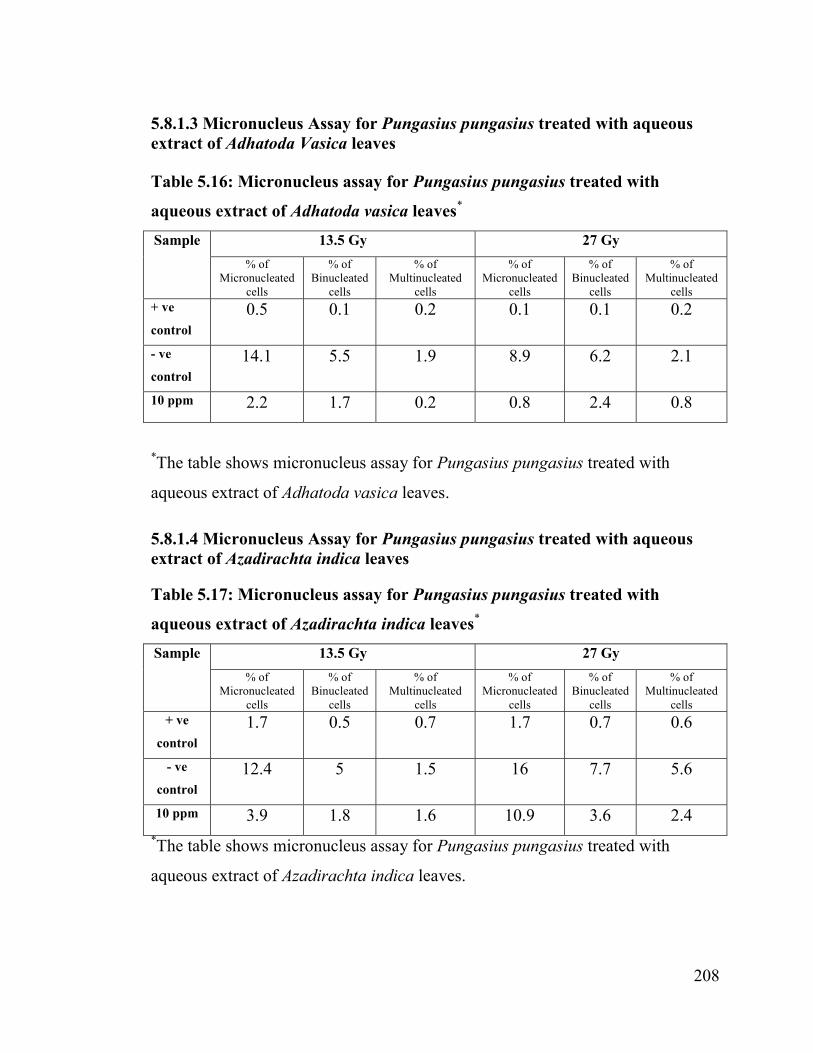
5.8.1.3 Micronucleus Assay for Pungasius pungasius treated with aqueousextract of Adhatoda Vasica leaves
Table 5.16: Micronucleus assay for Pungasius pungasius treated with
aqueous extract of Adhatoda vasica leaves*
Sample 13.5 Gy 27 Gy% of
Micronucleated cells
% of Binucleated
cells
% of Multinucleated
cells
% of Micronucleated
cells
% of Binucleated
cells
% of Multinucleated
cells+ ve
control0.5 0.1 0.2 0.1 0.1 0.2
- ve
control14.1 5.5 1.9 8.9 6.2 2.1
10 ppm 2.2 1.7 0.2 0.8 2.4 0.8
*The table shows micronucleus assay for Pungasius pungasius treated with
aqueous extract of Adhatoda vasica leaves.
5.8.1.4 Micronucleus Assay for Pungasius pungasius treated with aqueousextract of Azadirachta indica leaves
Table 5.17: Micronucleus assay for Pungasius pungasius treated with
aqueous extract of Azadirachta indica leaves*
Sample 13.5 Gy 27 Gy% of
Micronucleated cells
% of Binucleated
cells
% of Multinucleated
cells
% of Micronucleated
cells
% of Binucleated
cells
% of Multinucleated
cells+ ve
control1.7 0.5 0.7 1.7 0.7 0.6
- ve
control12.4 5 1.5 16 7.7 5.6
10 ppm 3.9 1.8 1.6 10.9 3.6 2.4*The table shows micronucleus assay for Pungasius pungasius treated with
aqueous extract of Azadirachta indica leaves.
209
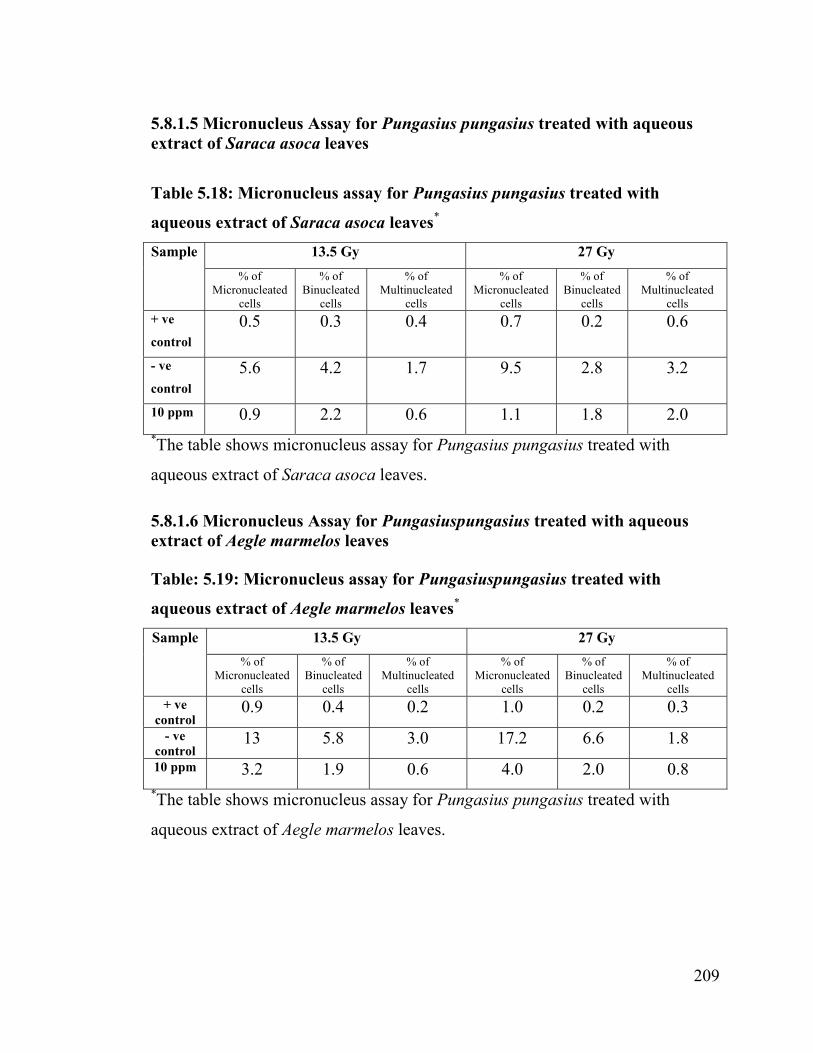
5.8.1.5 Micronucleus Assay for Pungasius pungasius treated with aqueousextract of Saraca asoca leaves
Table 5.18: Micronucleus assay for Pungasius pungasius treated with
aqueous extract of Saraca asoca leaves*
Sample 13.5 Gy 27 Gy% of
Micronucleated cells
% of Binucleated
cells
% of Multinucleated
cells
% of Micronucleated
cells
% of Binucleated
cells
% of Multinucleated
cells+ ve
control0.5 0.3 0.4 0.7 0.2 0.6
- ve
control5.6 4.2 1.7 9.5 2.8 3.2
10 ppm 0.9 2.2 0.6 1.1 1.8 2.0*The table shows micronucleus assay for Pungasius pungasius treated with
aqueous extract of Saraca asoca leaves.
5.8.1.6 Micronucleus Assay for Pungasiuspungasius treated with aqueousextract of Aegle marmelos leaves
Table: 5.19: Micronucleus assay for Pungasiuspungasius treated with
*The table shows micronucleus assay for Pungasius pungasius treated with
aqueous extract of Aegle marmelos leaves.
210
5.8.2 Enzymatic Assays 5.8.2.1 Oxidase Enzyme Test
The test batch solution of fish produced blue color immediately after the
addition of them to oxidase reagent discs. The control batch solution did not
produce any color change when added with the oxidase reagent discs (Plate 5.27).
Plate 5.27:Oxidase enzyme test
Plate 5.27: The plate shows Oxidase enzyme test for test and control.
5.8.2.2 Catalase Enzyme Test
The test batch smears of fish produced air bubbles immediately after the addition of them to catalase reagent. The control batch solution did not produce any air bubble when added with the catalase reagent (Plate 5.28).
Plate 5.28: Catalase enzyme test
Plate 5.28: The plate shows Catalase enzyme test for test and control.
211
5.9 ISOLATION AND PURIFICATION OF BIOACTIVE INGREDIENT FROM INDIGOFERA ASPALATHOIDES
5.9.1 Purification of Active Ingredient From Indigofera aspalathoides
• Column Chromatography Fractionation ratio:
Ethyl acetate: Hexane = 15:35
• TLC solvent ratio:
Ethyl acetate: Hexane = 2:8
• Rf : 9.2
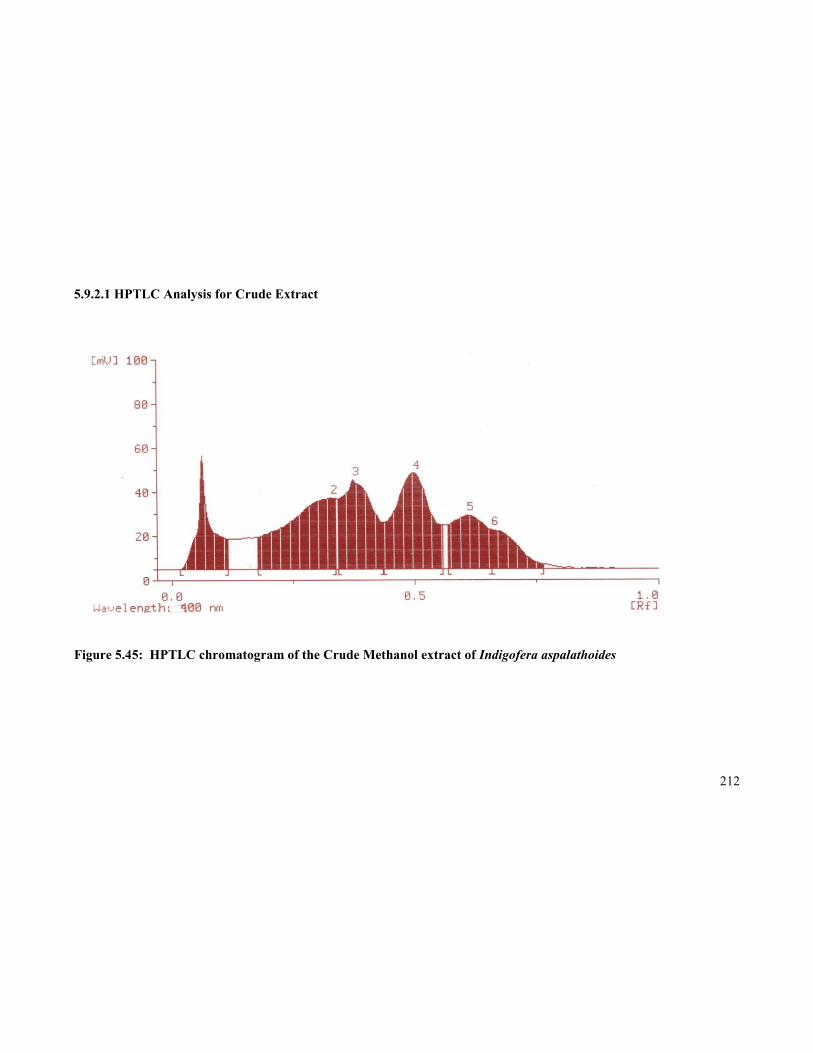
5.9.2 Results for The Purity Of The Active Ingredient Isolated From Indigofera aspalathoides
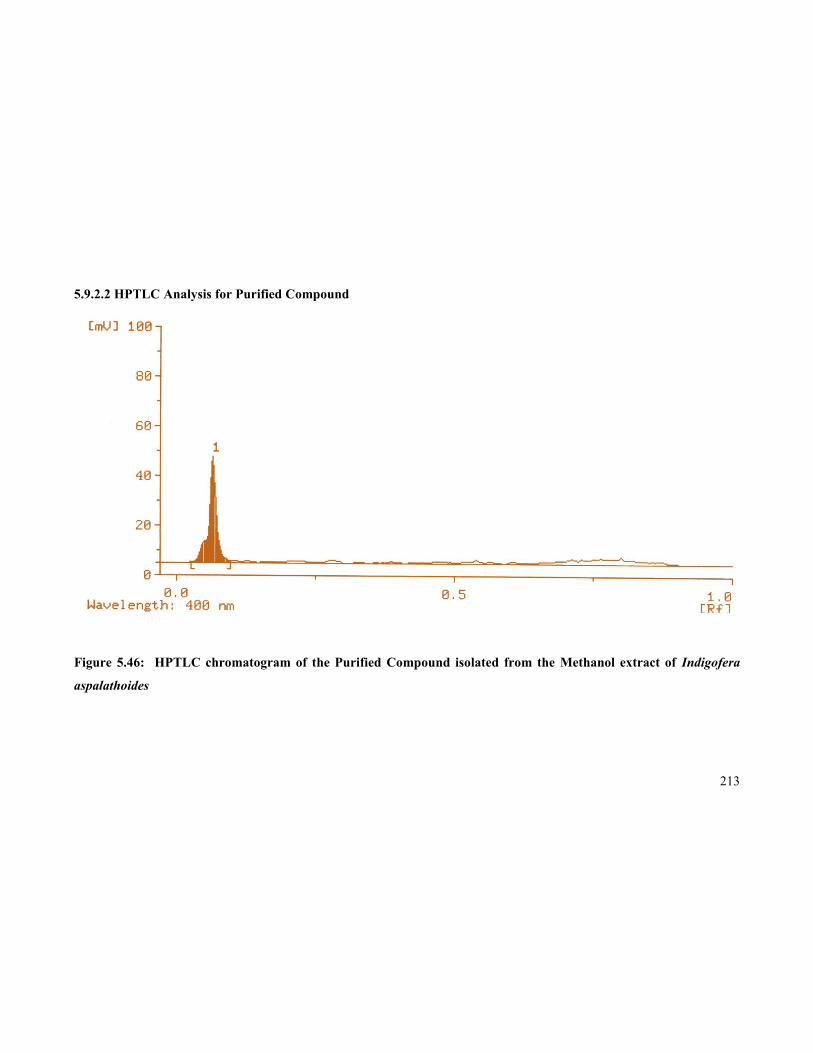
The purity of the isolated and purified bioactive compound was confirmed
after several HPTLC analysis was done and checked to obtain a single peak
without any contamination.
212
5.9.2.1 HPTLC Analysis for Crude Extract
Figure 5.45: HPTLC chromatogram of the Crude Methanol extract of Indigofera aspalathoides
213
5.9.2.2 HPTLC Analysis for Purified Compound
Figure 5.46: HPTLC chromatogram of the Purified Compound isolated from the Methanol extract of Indigofera
aspalathoides
214
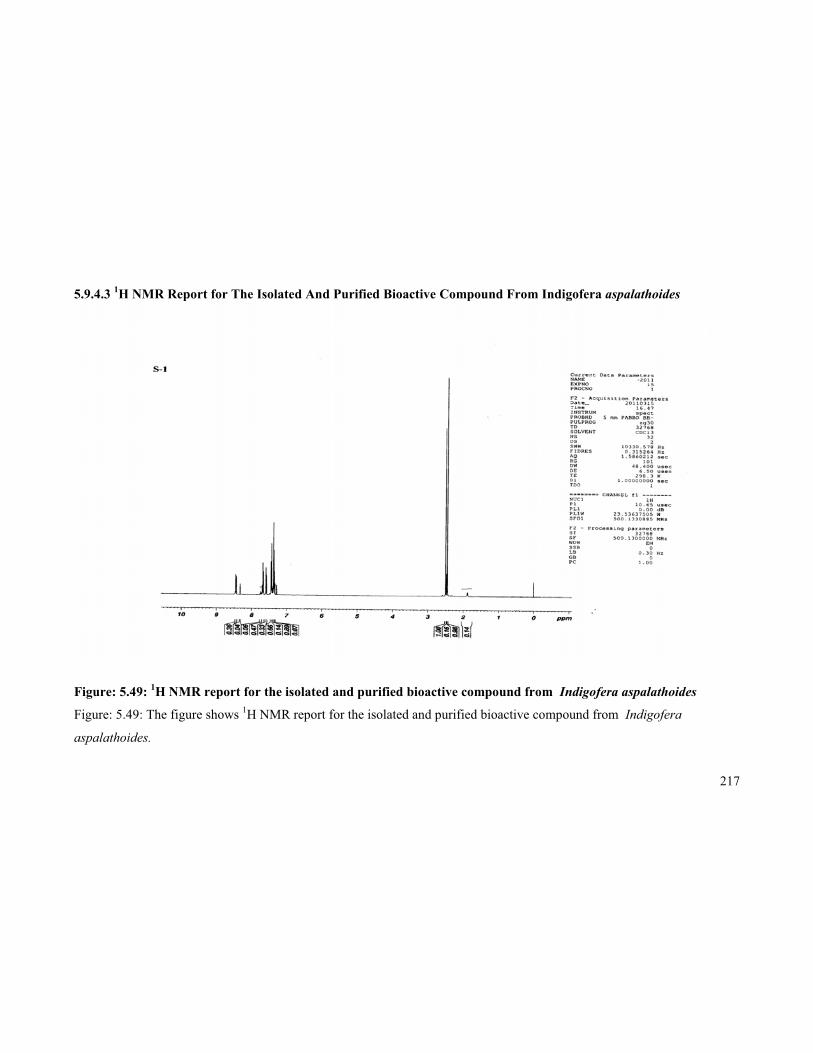
5.9.3 Identification of the Isolated and Purified Bioactive Compound
Identification of the isolated and purified bioactive ingredient from the
first peak was done using UV visible spectroscopy, FTIR spectroscopy, Mass
spectroscopy, 1H Nuclear Magnetic Resonance and 13C Nuclear Magnetic
Resonance.
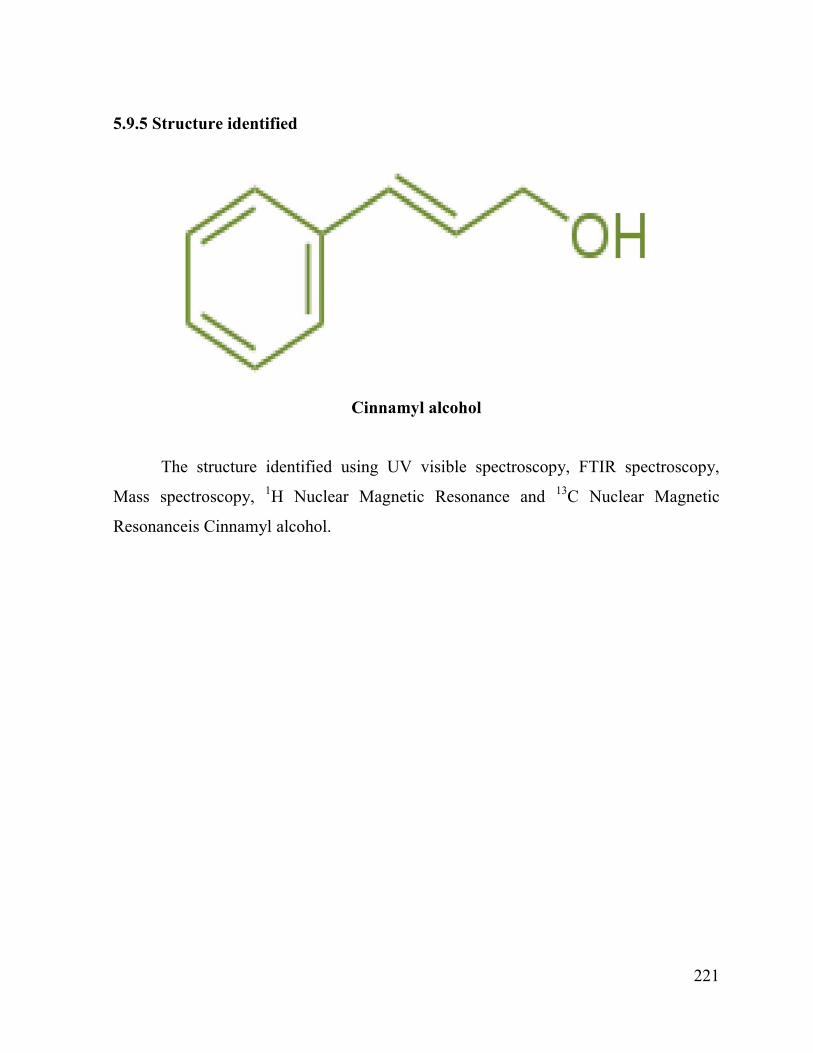
5.9.4 Structural Elucidation Of The Isolated And Purified Bioactive Compound From Indigofera aspalathoides
5.9.4.1 UV visible spectroscopy report for the isolated and purified bioactive compound from Indigofera aspalathoides
Figure 5.47: UV visible spectroscopy report for the isolated and purified
bioactive compound from Indigofera aspalathoides
Figure 5.47: The figure shows UV visible spectroscopy report for the isolated and
purified bioactive compound from Indigofera aspalathoides.
215
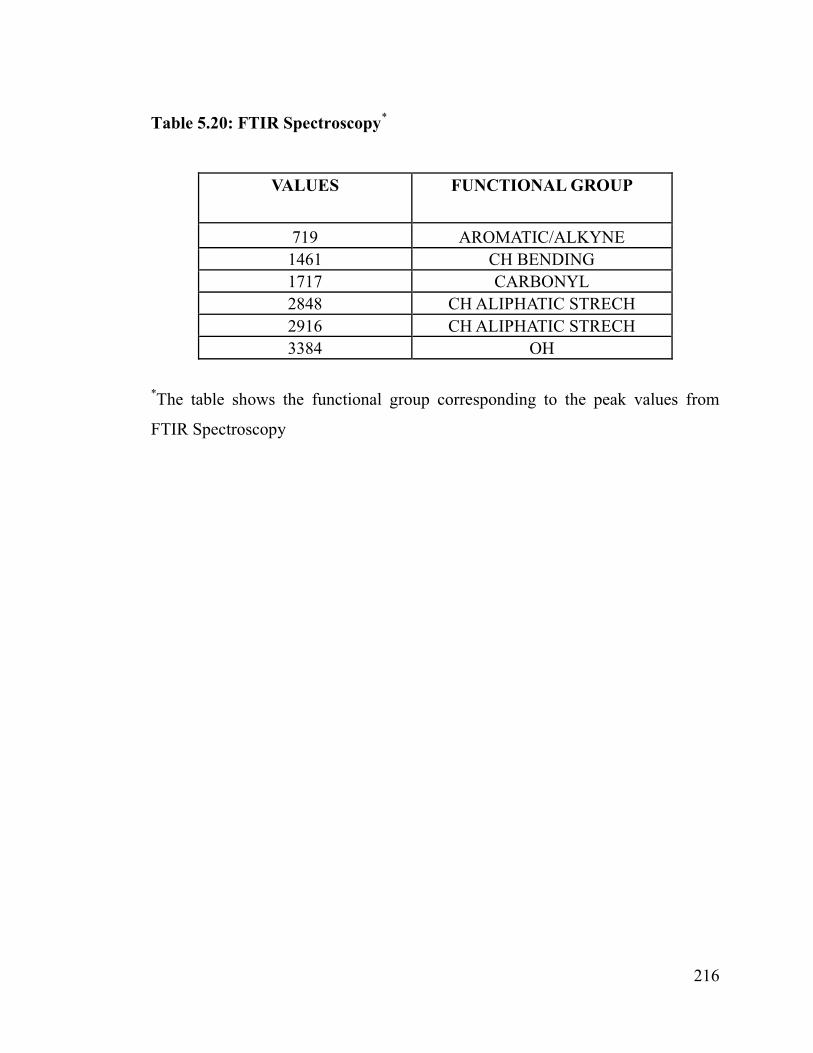
5.9.4.2 FTIR Spectroscopy Report for The Isolated and Purified Bioactive Compound from Indigofera aspalathoides
Figure 5.48: FTIR spectroscopy report for the isolated and purified bioactive compound from Indigofera
aspalathoides
Figure 5.48: The figure shows FTIR spectroscopy report for the isolated and purified bioactive compound from Indigofera aspalathoides.