1 Chapter 8 - Technology of Accident Analysis.wpd Rev. 6 November 22, 2009 21:29:50 vgs/wg Chapter 8 - Technology of Accident Analysis Introduction The previous Chapter summarized the safety issues, accident by accident, for a CANDU. This chapter describes the underlying science of accident behaviour. As with other engineering disciplines, the objective of nuclear engineering is to operate the plant as economically as possible consistent with public and worker safety and environmental protection. Since nuclear plants are capital-intensive, and the fuel is cheap, this means that there is a strong incentive to extract the maximum power from a given plant. This leads to the usual tradeoff of large margins and simple analysis, versus smaller (but adequate) margins and sophisticated analysis; given the cost of a nuclear plant, the second route always wins out and drives an increasing sophistication in accident analysis tools and methodology. The same tradeoff and resolution is true of course of all other fields of engineering - e.g., aeroplane design. In the early days of CANDU, for NPD and Douglas Point, the accident analysis was done by hand. Digital computers had barely made an impact on engineering, and as a result both performance and safety margins were (had to be) large, partly because of lack of experience and partly because of the simplifications which had to be made in order to do the calculations. The major areas of sub-optimization were in low fuel ratings, sub-cooled primary circuit conditions, low primary-side pressure etc. Nowadays almost no accidents are predicted using hand calculations - the physical models used in accidents have become far more detailed and are embedded in complex transient computer codes. To list all these codes and consider them as black boxes is not very useful. So in this Chapter we shall describe the basic science underlying each safety-related discipline, and present in simplified form the types of models used. We borrow heavily from notes by D. Meneley, J.T. Rogers and W. Garland. We shall not derive each model from first principles, having neither time nor space. The reader is referred to numerous textbooks for basic derivations. The purpose of the Chapter is therefore to highlight briefly the key physical models used in safety analysis so that the reader will recognize them in examining a topic in more depth. Reactor Physics We have already covered point kinetics in Chapter 3. Recall the basic kinetics equations:
The previous Chapter summarized the safety issues, accident by accident, for a CANDU. Thischapter describes the underlying science of accident behaviour. As with other engineeringdisciplines, the objective of nuclear engineering is to operate the plant as economically aspossible consistent with public and worker safety and environmental protection. Since nuclearplants are capital-intensive, and the fuel is cheap, this means that there is a strong incentive toextract the maximum power from a given plant. This leads to the usual tradeoff of large marginsand simple analysis, versus smaller (but adequate) margins and sophisticated analysis; given thecost of a nuclear plant, the second route always wins out and drives an increasing sophisticationin accident analysis tools and methodology. The same tradeoff and resolution is true of course ofall other fields of engineering - e.g., aeroplane design.
In the early days of CANDU, for NPD and Douglas Point, the accident analysis was done byhand. Digital computers had barely made an impact on engineering, and as a result bothperformance and safety margins were (had to be) large, partly because of lack of experience andpartly because of the simplifications which had to be made in order to do the calculations. Themajor areas of sub-optimization were in low fuel ratings, sub-cooled primary circuit conditions,low primary-side pressure etc. Nowadays almost no accidents are predicted using handcalculations - the physical models used in accidents have become far more detailed and areembedded in complex transient computer codes.
To list all these codes and consider them as black boxes is not very useful. So in this Chapter weshall describe the basic science underlying each safety-related discipline, and present insimplified form the types of models used. We borrow heavily from notes by D. Meneley, J.T.Rogers and W. Garland.
We shall not derive each model from first principles, having neither time nor space. The reader isreferred to numerous textbooks for basic derivations. The purpose of the Chapter is therefore tohighlight briefly the key physical models used in safety analysis so that the reader will recognizethem in examining a topic in more depth.
Reactor Physics
We have already covered point kinetics in Chapter 3. Recall the basic kinetics equations:
Unfortunately CANDUs cannot be considered point reactors. Strong spatial effects result fromflux tilts (especially for large LOCA, if only half the core is voided - as in CANDU 6), insertionof shutoff rods from the top of the reactor, etc. Thus in practice one must use three dimensionaldiffusion equations in conjunction with the point kinetics . The diffusion model tracks the1
neutrons as a flow through a medium, subject to scattering, absorption, and leakage. The basicdiffusion equation is one of continuity. Consider a volume V. The time rate of change of neutronswithin volume V must be equal to the rate at which they are produced within V minus the rate atwhich they are absorbed or escape from V. Thus if n(r, t) is the neutron density at (three-dimensional) point r and time t, then the continuity equation for V is
Let s(r,t) be the number of neutrons emitted per unit volume per unit time by sources at the pointr and time t. This is the source distribution function. Thus
Likewise the absorption rate is theproduct of the flux N(r,t) and the
aabsorption cross section E (r) integratedover V:
Finally the leakage component can bederived by defining the neutron currentdensity vector J(r,t) which measures thenet flow of neutrons in any givendirection. Let the vector n be a unitnormal vector pointing outward from the
surface A bounding V. The leakage rate from V is then:
Transforming this last equation from a surface to a volume integral, the continuity equationbecomes:
Since these are all over the same volume, we can remove the integral to get a point form of theequation of continuity:
Fick’s law states that the current density vector is proportional to the negative gradient of theflux. The proportionality constant is called the diffusion coefficient, D. Thus
The continuity equation, for uniformsystems with a single neutron velocity v(so that N=nv), becomes the neutrondiffusion equation:
Transient neutron diffusion, plus kinetics,is the basis of many of the physics codesused in accident analysis. Theseequations are solved with spatial finitedifferences methods, with the reactorcore broken up into many nodes, in each
Voiding in a high-flux region has more effect on neutron kinetics than voiding in a low-a
flux region, since the former case changes the speed and absorption of more neutrons. Hencelocal void is weighted by the local flux in order to get the core-wide effect..
of which the diffusion equation is applied at each time step.
For a LOCA, for example, time-dependent cross sections representing the coolant voidingtransient, fuel temperature transient, reactor control system action, and shutoff rod movement arethe driving functions for the transient in the flux. The average power transient for the reactor isextracted from the calculation, along with peaking factors for the hot channel, hot bundle and thehot element in the loop being analyzed. The system reactivity as a function of importance-weighted void fraction is also calculated. These data are used as input to a systema
thermohydraulics code. This code calculates the distribution of coolant void as a function of timefrom the pipe break, for each pass of the coolant loop. The importance-weighted average voidfraction calculated by the thermohydraulics code is combined with the pre-calculated reactivityfunction, and the cycle is iterated as necessary. Nowadays the thermohydraulics code and thephysics code can be combined into one calculation so that manual iteration is not necessary.
Our model is still missing some information. We indicated in Chapter 5 that shutting down areactor was not sufficient to remove all safety concerns: the decay heat must be removed. Thisheat comes from the radioactive decay of fission fragments, and obviously cannot be controlled.In principle it can be calculated from the power history: the composition of fission products canbe predicted at any time, their half-lives and decay chains are known, so that:
where:
dP (t) is the power produced by all decaying fission products at time t
in (t) is the number of atoms decaying per unit time of fission product i at time t
iE is the average energy produced by the decay of each atom of fission product i.
iThis is more complex than it seems, because n (t) will depend on the irradiation history, eachfission product may have more than one decay chain (with different energies), and there are manyfission products. In practice such a fundamental calculation is done as a reference assuming arapid shutdown after equilibrium operation. In most cases, the evolution of the accident (since itis short) does not materially change the decay power, so that the results from the fundamentalcalculation are fitted using a series of exponentials; and the curve fit is simply added to thefission power predicted by the physics codes. In exceptional cases, such as an accident occurringduring power manoeuvring, this will not be very accurate - but as with any analysis, an upper
bound can be assumed (e.g., assuming the decay power appropriate to prolonged steady-stateoperation at the maximum operating power level prior to the accident). Such a tradeoff betweensimplified assumptions which give a conservative bound to an answer, and more realisticassumptions which require more sophisticated analysis tools, is very common in safety analysis.Since safety analysis resources, like all other resources, are finite, part of the art of safety analysisis in judging when to use bounding assumptions, and when to use realistic complex models. Thedifficulty is, of course, that bounding models may lead to unnecessary restrictions on operation.
Fuel
Reactor fuel varies widely among different reactor types - for example many research reactors
2still use uranium metal fuel plates. Most water-cooled power reactors have solid UO fuel pins
2(UO is chosen because of its corrosion resistance at high temperature in water) surrounded by
2metal sheaths (clad) which contain any gaseous fission products released from the UO . We shallthus restrict the discussion to uranium oxide fuel.
The key safety parameters related to fuel are:• fuel sheath integrity• fission product inventory in (and release from) the fuel, and• fuel temperature
Prediction of fuel temperature in CANDU is important because:• it drives sheath temperature, and hence sheath integrity;• high fuel temperatures drive pressure-tube deformation rates• limited fuel melting can lead directly to fuel sheath failure; and• extensive melting can lead to pressure-tube failure• release of fission products from the fuel increases with fuel temperature• there is a reactivity feedback from fuel temperature, although it is very small in CANDU
Classic (somewhat more important in ACR-1000 and much more important (and muchlarger) in LWRs).
During normal operating conditions, all fission products are formed within the fuel grains; theyare trapped there (with the exception of a few which recoil directly into inter-grain and gas gaps)until they are released from the grains by diffusion. Those volatile fission products which arereleased form a gas mixture inside the fuel sheath. It is therefore useful to categorize fissionproducts into three groups: (a) bound inventory, (b) grain boundary inventory, and (c) gapinventory (recall Chapter 1).
The gap inventory includes the fission product gases in the pellet dishes, in the pellet/sheath gapand in the sheath end cap. If the fuel sheath fails, the gap inventory escapes quickly, the grain
boundary inventory much more slowly, and the bound inventory even more slowly. At relativelylow fuel temperatures the diffusion processes are very slow, so that almost all isotopes remain inthe grains. (An exception to this occurs when uranium dioxide is exposed to air at moderatetemperatures; in this case oxidation to higher states takes place and the grain structure isdestroyed. Much of the fission products are then released. Such a circumstance could occur afterfailure of an end-fitting and ejection of the channel contents into the reactor vault). Astemperature and fuel burnup increase the amount of fission gas in the gap increases, to amaximum of about 10% for typical CANDU operating conditions.
At any given burnup, a larger fraction of the fission product gases is released near the center ofthe pellet, where the temperature is highest. All volatile fission products tend to migrate downthe temperature gradient toward the outside of the pellet. Their diffusion is assisted by the factthat the pellet cracks under the influence of the temperature gradient; this cracking increases withfuel burnup and pellet centre temperature. At high burnup (and relatively low initial sintered fueldensity) a hole develops at the center of the fuel pellet.
In summary: (a) at low burnup or temperature, nearly all fission products are trapped in fuel grains, (b) fission products trapped at grain boundaries increase with temperature and burnup, (c) the gas gap inventory increases steadily with fuel temperature and burnup.
Fuel Element Temperatures
Steady-state heat conduction in one dimension is given by the equation2
where Q is the rate of heat transfer; A is the area through which heat is transferred; dT/dx is thetemperature gradient; k is the thermal conductivity. In terms of heat flux, q=Q/A,
Generalizing to three dimensions, and assuming energy is being produced in the medium at avolumetric rate H,
(Rate of change of internal energy) = (rate of energy release into medium) - (rate of energy lossfrom conduction)
where D is the density and c is the specific heat.
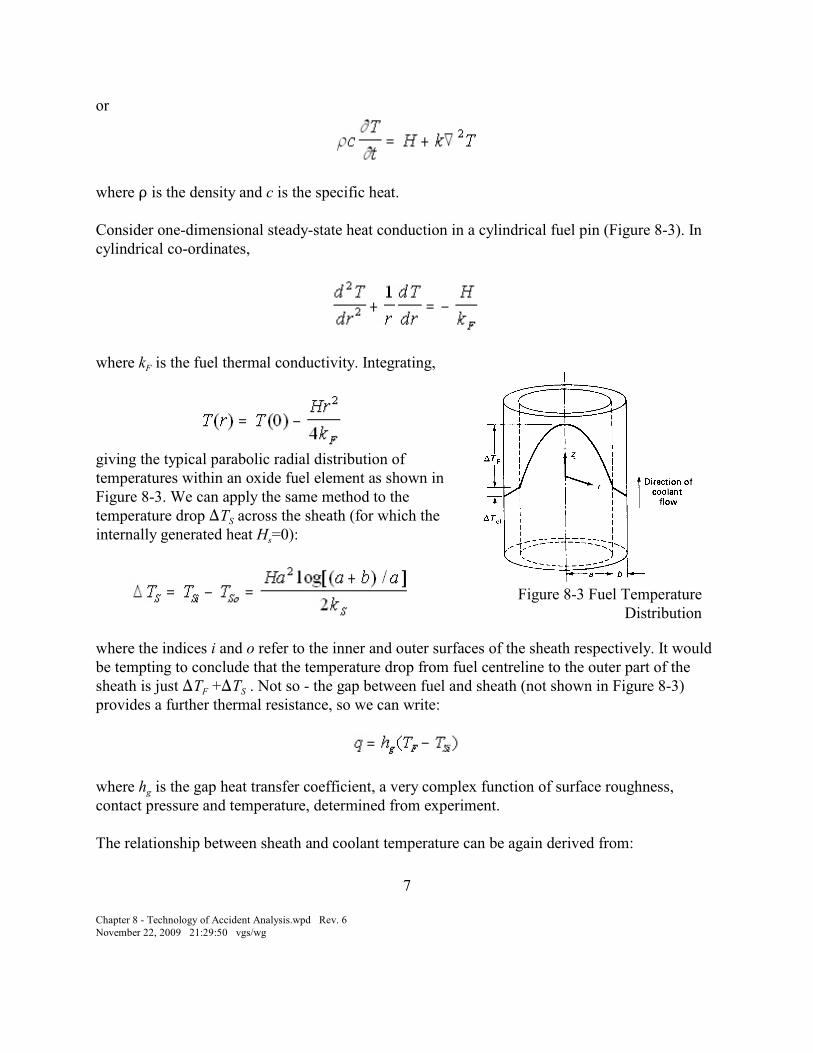
Consider one-dimensional steady-state heat conduction in a cylindrical fuel pin (Figure 8-3). Incylindrical co-ordinates,
Fwhere k is the fuel thermal conductivity. Integrating,
giving the typical parabolic radial distribution oftemperatures within an oxide fuel element as shown inFigure 8-3. We can apply the same method to the
Stemperature drop )T across the sheath (for which the
sinternally generated heat H =0):
where the indices i and o refer to the inner and outer surfaces of the sheath respectively. It wouldbe tempting to conclude that the temperature drop from fuel centreline to the outer part of the
F Ssheath is just )T +)T . Not so - the gap between fuel and sheath (not shown in Figure 8-3)provides a further thermal resistance, so we can write:
gwhere h is the gap heat transfer coefficient, a very complex function of surface roughness,contact pressure and temperature, determined from experiment.
The relationship between sheath and coolant temperature can be again derived from:
Cwhere q is the heat flux per unit area to the coolant; T is the coolant temperature; h is theconvective heat transfer coefficient. At steady state, all the heat produced in the fuel is transferred
to the coolant, so that for a length of element R,
so that
Typical values in CANDU fuel are:
Fk = 0.004 kW/m. Co
Sk = 0.017 kW/m. Co
gh = 7 - 60 kW/m . C2 o
a = 6.07 mmb = 0.42 mm.
Heat capacity does not enter the steady-state equations, but is important in transients. The valuesfor uranium dioxide and Zircaloy-4 are, respectively, 0.5 and 0.4 J/g-/C. The corresponding heatsof fusion are 27 and 42 J/g. The relatively large value of c and the high melting point (2840C) for
2UO represent important safety characteristics: typically one can almost double the stored energy,
2relative to the normal operating point, inside UO before it melts. Metal fuel, on the other hand,has little heat capacity and melts at a lower temperature; but has much higher thermal
2conductivity, typically ten times larger than UO .
Gas Pressure Inside Sheath
CANDU fuel has a “collapsible” fuel sheath, which creeps down plastically onto the pelletduring irradiation due to the excess external coolant pressure. The small enclosed gas space inthe element results in a high sensitivity of gas pressure to fuel sheath geometry. A small amountof fill gas is added to this space on assembly, so as to achieve the proper sheath stress distributionduring operation. As burnup increases, the gas pressure causes the sheath once again to lift offthe fuel; the gap heat transfer coefficient decreases because the sheath creeps away from the fuelpellet. This decrease leads to higher peak fuel temperature, greater fission gas release from the
fuel, and finally higher gas pressure. A new equilibrium point is reached.
In accident analysis, fuel codes must have good models of the transient behaviour of the gas gap,since it is the driving force for sheath strain.
Fuel Behaviour in Accidents
During normal operation a CANDU 6 core contains 4560 fuel bundles, each with its uniqueconditions of location, burnup, and power level. On initiation of accident conditions each willbehave differently depending on these parameters and the specific circumstances of the accidentsequence. The end objective of in-core accident analysis is to estimate the quantity,characteristics, and timing of fission products released to the containment space. Obviously, anumber of approximations will be required to obtain an estimate of this release. To introduce thistopic, consider the effects on fuel of three abnormal conditions which might be encounteredduring an accident; (a) overpower, (b) low coolant flow, and (c) loss of coolant.
Overpower
Sheaths might fail due to internal gas pressure or impingement of molten fuel, if the overpower issevere. The equation for the steady-state power level at which centerline melting begins can bederived from the radial heat conduction equation above, setting
meltT(0)=T =2840C.
If a sudden power increase is imposed, so that there is no time for additional heat removal, the
F meltmelting point is reached when an amount of energy is added given by C (T -T) for a local fuel
Fvolume, where C is the heat capacity.
Experiments in pulsed test reactors have been conducted to determine the fuel stored energylevels (when suddenly inserted) which lead to element rupture; in general, these are somewhatlower than those required to produce gross melting, especially for highly irradiated fuel.
2In severe overpower transients, the fuel rod can be destroyed due to the formation of UO vapourin the centre of the fuel; the vapour pressure blows the element apart. This was originally aconcern for control rod ejection accidents in light-water reactors; the threshold for such breakupwas established by the power burst tests mentioned above. It is known from the SL-1 accident,and is likely in Chernobyl, that the power pulses were sufficient to vaporize part of the fuel. Fuelvaporization is not relevant for design basis accidents in CANDU.
This term is used loosely toidentify a sudden drop insheath to coolant heattransfer coefficient whichoccurs when a “critical heatflux” is exceeded. Figure 8-4 shows the characteristic3
shape of the convective heattransfer curve for water as afunction of surface heatflux; this curve is drawn forsaturated liquid conditionsin the fluid. On dryout, thesheath surface temperaturejumps suddenly (from c to fin the figure) to the value atwhich the temperature change from sheath to coolant is sufficient to transfer the heat under thenew film boiling flow regime. In water under the conditions of pressure, enthalpy, and flowtypical of a modern PWR, this temperature change can be very large - dryout is roughlyequivalent, under these conditions, to “shutting off” the heat transfer from fuel to coolant, and isoften called “burnout”. Recalling Figure 8-3, with zero heat transfer the temperature distributionadjusts rapidly to a constant value approximately equal to the average fuel temperature beforedryout. This average is about 1000C. It will keep increasing rapidly if the reactor is not shutdown.
The effect of dryout is strongly dependent on the heat transfer regime of the coolant. Figure 8-5shows the various regimes as functions of surface heat flux and thermodynamic quality. Thisfigure represents a tube heated from the outside with flow on the inside. Occurrence of the FilmBoiling regime indicates a dry sheath (wall) surface. The heat flux is assumed constant along thetube.
Starting from subcooled boiling, at the left of the figure, vigorous saturated nucleate boilingoccurs as the average quality increases, thereby producing high turbulence. As a result the flowregime switches to annular, with a liquid film on the surface from which evaporation takes placeto the vapour core. On transition to film boiling the liquid is driven off the surface, leaving alayer of vapour. The liquid droplets then travel in the vapour flow until they eventually evaporatedue to heat transfer directly from the vapour. When the quality reaches unity, heat transfercontinues to superheated vapour in single-phase flow. From our point of view, the most
One can distinguish Critical Heat Flux (CHF), which is the onset of a dry spot on theb
sheath, from classical dryout, where the temperature takes a sharp jump
interesting transition is the one to film boiling, because it is here that the fuel sheath temperaturemay increase abruptly.
Dryout in a CANDU channel is not the same as in a PWR. PWRs run highly subcooled, so thatdryout occurs at low quality (mass fraction of steam) and at low steam velocities - thus the cladb
temperature rises rapidly. Most CANDUs, however, are designed so that in normal operationthere is a small amount of boiling (typically <4% quality - note that the void fraction, obviously,is higher than the mass fraction). Dryout in a CANDU channel therefore tends to occur when thevoid fraction is high, so that there is a high steam flow-rate which provides reasonable post-dryout heat transfer. This fact is very important to the setting of safety system trip margins - itmeans that it is relatively unimportant if limited dryout occurs somewhere in the core. Tripsetpoints therefore can be set somewhat higher from a safety point of view.
Figure 8-6 shows the location of the onset of dryout in an overpower accident for a typicalCANDU channel; the location is a tradeoff between the point of highest flux (typically in thecentre of the channel) and the point of lowest CHF, typically at the exit of the channel where thecoolant temperature and void fraction are highest. Question: what changes could you make to theflux shape to get more power out of the channel with the same margin to dryout? The moredifficult question is how you would effect such changes in flux shape.
The progressive effects of increasing and unterminated overpower are listed below: the timing,endpoint, and eventual consequences of this sequence are strongly dependent on the details of the
prior to pressure-tube failure)• Pressure tube balloon or burst• Heat transfer to moderator
Obviously overpower trip setpoints are chosen to terminate this sequence either before dryout, orafter limited time in dryout.
Low Coolant Flow
This type of accident is expected to occur once or more in the plant lifetime. The most commoncause is a loss of forced circulation, either due to a loss of Class IV electrical power or due to asingle pump trip or seizure. In a single channel, flow reduction could be due to debris in thechannel, or to a break in the inlet feeder. As in the overpower case, there is a flow/powermismatch; that is, more power is being produced in the fuel than can be removed by the coolant.The physical phenomena in the two cases are quite similar. Progressive effects of loss of flow arelisted below.
Low Coolant Flow: • Large increase in exit quality • Rise in reactor power (for a system-wide loss of flow, for CANDU Classic, due to
positive void reactivity)• Heat Transport System overpressure (if the loss of flow is system-wide)• Dryout• Similar remaining sequence as for overpower
For ACR, there can be an initial smaller rise in power due to the “checkerboard voiding”c
effect of differential voiding in adjacent channels even though the overall void reactivity isnegative
Again trip setpoints (e.g. on low flow or high pressure) are typically chosen to stop the sequenceearly on, either at onset of dryout or allowing only a limited period of time in dryout.
Loss of Coolant
This case has characteristics similar to both overpower and low coolant flow. Depending on thelocation and size of the pipe break, low flow occurs in some subset of the coolant channels in thecore. Loss of coolant results in a system low pressure, with resultant flashing of water in thechannels. The increase in quality leads to dryout and fuel overheating. The reactor power alsorises initially in CANDU Classic due to the positive coolant void reactivity .c
Large Loss of Coolant:• Rapid decrease in local saturation temperature• Flashing (rapid boiling) proceeds upstream from channel exit• Neutron overpower due to coolant voiding (terminated by shutdown)• Same fuel sequence as for overpower plus effect of sheath strain• Heat Transport System pumps cavitate when pressure is about equal to saturation
pressure at the pump inlet - flow drops rapidly
In some accidents channel behaviour under low flow conditions becomes important - e.g. smallLOCA just prior to trip; all LOCAs under low flow conditions once ECC has initiated; and theintact HTS loop post-LOCA, after the main HTS pumps are tripped. Because CANDU channelsare horizontal, under low flow conditions, particularly in two-phase flow, it is possible for theflow to separate into steam and water under the influence of gravity, so that steam flows alongthe top of the channel and water along the bottom. This obviously affects cooling of the upperpins in the fuel bundle. The onset of such flow stratification is determined either from thefundamental two-fluid codes or more usually using empirical correlations. Figure 8-7 (from J.T.Rogers) shows examples of stratification along with more complex flow regimes in horizontaland vertical pipes. A similar situation obtains in the horizontal headers, although the flow regimeis much more complex.
Fuel behaviour is more complex for a LOCA since the coolant pressure is decreasing. Since thefuel is generally heating up, this increases the gas pressure inside the sheath relative to the
coolant pressure, andcan force the sheath tostrain. A uniform strainof at least 5% will notlead to sheath failure;however greater strainscan lead to localinstability, ballooning,and failure (thesephenomena are lesslikely in CANDUbecause it takes verylittle sheath strain torelieve the gas pressure).The strain-rate equationsare complex functions ofmaterial composition,material state,temperature, irradiation,and transverse stress,and are determined fromexperiments. Typicallytheir form is as follows:
Define the transversestress across the sheathas:
where: P is the pressuredifferential across the tuber is the tube radiusw is the tube thickness
The strain rate is then expressed in terms similar to the following:
where A, B, k, l, m, n are determined from experiment; and T is temperature.
In all of these situations, the pressure tube can be overheated via conductive, convective, andradiative heat transfer from the hot fuel. If the channel pressure is high, the pressure tube mightburst; in most cases it will either balloon or sag to contact the calandria tube and transfer heat tothe moderator water. The equations for pressure-tube strain are, not surprisingly, similar to thosefor sheath strain.
Heat Transport System
In brief, the behaviour of the heat transport system is predicted by solving the equations of mass,energy and momentum conservation for non-equilibrium transient two-phase flow in a networkin one-dimension. “Two-phase” means that we consider steam and water. “Non-equilibrium”means that the steam and water phases, even in the same location, can have different pressures,temperatures, and flowrates. “Transient” means obviously that we want the behaviour as afunction of time. Current CANDU thermohydraulic codes are one-dimensional, althoughsometimes phenomenological two- or three- dimensional models are used for components suchas headers and channels. This limitation to one dimension is less of a problem for CANDUs thanit is for LWRs, with their large pressure vessel; thus 2D and 3D codes have been developed forLWRs. “Network” means we model parallel paths (e.g., fuel channels, ECC) and severalcomponents connected together at the same point (e.g., at the headers).
Much effort in developing codes to model the heat transport system lies in the following areas:• equations of state for the various phases• component models for steam generators, fuel channels, fuel, headers, secondary side,
valves, pumps etc.• correlations for pressure-drop, heat transfer (including CHF), flow regimes• efficient numerical solution schemes• plant controllers
Most thermohydraulic simulation codes for reactors break the circuit up into nodes containingmass and therefore energy, and links joining the nodes, characterized by flow, length, roughness,diameter etc. Mass and energy conservation equations are written for the nodes, and themomentum equation is written for the links. We shall show simplified examples here (onedimensional flow in a level pipe).
Figure 8-8 shows two nodes, i and j, connected by a link k. The mass conservation equation fornode i is:
Figure 8-8 - Link/node structure of thermohydraulics codes
kwhere W are all the mass flows into and out of node i from links k.
The conservation of momentum equation is applied to link k and is (ignoring gravity):
where for the link:
W is the mass flow in link k (in Figure 8-8, between nodes i and j)A is the flow areaP is the pressure in the nodes connected to the link
L is the lengthD is the hydraulic diameter(fL/D + k) is the friction factor
The first term is just Newton’s law applied to a fluid to which a pressure difference is applied;the second term is the loss due to friction. Terms for pumps and gravity can be added.
The conservation of energy is applied to each node i as follows:
The summations are the rates of energies coming into and out of node i due to mass transfer.
These three equations are applied to each phase. There are four unknowns, e.g., mass,momentum, temperature and pressure. The fourth equation needed is the equation of state foreach fluid, typically in the form of
In safety analysis codes, the equation of state is used in the form of massive detailed tables ofwater and steam properties, or fitted by correlations.
Fuel Channels
When we look at behaviour of fuel channels in accidents, we emphasize three basic disciplines:heat transfer, stress-strain behaviour, and hydrogen chemistry.
Heat transferHeat can be transferred from the fluid to the pressure tube by conduction and convection; andfrom the fuel to the pressure tube by conduction (if it sags into contact with the pressure tube). Athigh temperatures, the fuel can transfer heat to the pressure tube by radiation, characterized bythe Stefan-Boltzmann law,
where g is the emissivityT is temperature in degrees KelvinF is the Stefan-Boltzman constant (1.36 ×10 kilo-calories per metre -second-K)-4 2 4
the subscript f refers to fuel and PT to pressure-tube
A similar equation would apply to radiation from the pressure-tube and from the steam itself,although these tend to be small.
In practice radiation becomes important at sheath temperatures around 800C or more and is aboutequal to the decay power in the fuel around 1200-1400C. Also in practice the hard part isworking out the geometry: computer codes break the complex fuel bundle and pressure-tube into
(Footnotes are for caveats): Hydrogen can also be produced slowly in the long term byd
radiolysis (radiolytic decomposition) of ECC water as it circulates through the core.
This was the fear behind the ‘gas bubble’ within the reactor vessel during the Three Milee
Island accident. The concern was not burning within the vessel as there was no oxygen there. Thehydrogen which escaped to containment, which did contain oxygen, formed a flammable mixtureof 9% hydrogen and did indeed burn without serious consequences.
smaller pieces; calculate the “view factor” (how much of the pressure tube or neighbouring fuelelement each piece can “see”) for each piece; and calculate the radiation heat transfer piece bypiece.
Heat can also be transferred from the calandria tube to the moderator, which is significant afterpressure-tube contact (see below). The heat transfer characteristics follow a pool boiling curve,similar in concept to Figure 8-4. Limited patches of film boiling can be tolerated for short periodsafter contact; lengthy or extensive dryout will lead to calandria tube (and pressure tube) failure.
StrainIf the pressure tube heats up in excess of 800C or so, it will start to plastically deform and/or saguntil it either bursts or contacts the calandria tube. This has been discussed already. Generally atinternal pressures less than about 6 MPa the pressure tube will strain uniformly to contact thecalandria tube; at high pressures, it is more likely to rupture locally before contact.
HydrogenAt high temperatures, Zircaloy oxidizes in steam to produce heat and hydrogen:
This is a quadruple threat:• the hydrogen collects in containment (significant amounts of hydrogen can only be
produced by a LOCA with ECC failure ) and can, in the right circumstances, becomed
flammable;• the heat generated by the chemical reaction increases fuel and pressure tube temperatures;• the presence of a non-condensible gas in large quantities can impede ECC water, if the
operator tries to recover from an impairment of ECC by injecting water, late ; ande
• the formation of zirconium di-oxide embrittles the sheaths and pressure tubes so that theymay shatter if ECC is eventually restored.
Correlations of the reaction rate of steam and Zircaloy therefore form an essential part of fuel
The reaction rate becomes autocatalytic around 1400-1500C - that is, the heat it generates keepsthe chemical reaction going with no further heat input, much like a fire. In Light Water reactors,this is a major concern: the fuel elements are close together, so there is no place for the heat toradiate to. Thus US regulatory practice sets a strict limit on sheath temperature in a design basisaccident - namely 1200C - chosen so that there is little possibility of an autocatalytic reaction. InCANDU, the presence of the cold pressure tube less than a few centimetres from each fuelelement moderates the reaction; embrittlement is still a concern but the regulatory practicepermits calculation of actual oxidation rates and thicknesses, rather than setting a criterion basedon temperature alone.
Moderator
The modelling requirement with the moderator is to predict the transient local water temperatureat each point. The objective is to show that the local moderator subcooling at any location wherethe pressure-tube contacts the calandria tube in an accident is sufficient to prevent prolonged filmboiling on the outside of the calandria tube. The physical problem is therefore solution of three-dimensional fluid flow with heat addition in a porous medium - the medium is not continuousbecause of the presence of fuel channels, reactivity devices, etc. The mass, momentum andenergy equations described above are therefore generalized to three dimensions. Experimentalvalidation is of course a must, because of the complex geometry.
Moderator chemistry is another area of interest. In normal operation, the moderator containsdissolved deuterium gas and oxygen gas from the radiolysis of heavy water . Gases which comef
out of solution are normally recombined in the gas steam taken from the cover gas space abovethe moderator level; however chemistry upsets can cause the gases to come out of solutionquickly with the potential for burning or exploding (if there is an ignition source, which normallythere is not). This is of particular interest when the cover gas is open for maintenance since thenthere can be ignition sources.
In addition the gadolinium nitrate used in Shutdown System #2 can precipitate if the chemistrybecomes unfavourable.
Both such events have actually occurred, without any plant damage.
As far as fundamental equations are concerned, containment behaviour is governed by the samephysics as the heat transport system, with a few complications:1. the containment volume is usually compartmentalized and the flow within the larger
compartments is three-dimensional;2. there are a number of different fluids coexisting: air (normal contents of containment),
steam and water from a pipe break, and hydrogen if the sheaths are heavily oxidized;3. heat is added by the steam and hot water, and also by the radioactive decay of any fission
products carried into the containment atmosphere by the discharging fluid; heat isremoved by dousing (water sprays), condensation on containment and equipmentsurfaces, and by containment air coolers
4. the pressure can also be influenced by: use of the vacuum building (in multi-unit plants),leakage from containment through cracks, and by deliberate venting through filters.
Containment codes usually have sub-models for each of these phenomena.
Many containment codes also track the movement of fission products along with the other fluids.Fission products can exist as1. noble gases, which interact very little with water or surfaces;2. tritium oxide (specifically the mixed oxide DTO), from the coolant or moderator.
Obviously tritium oxide behaves similarly to steam and/or water, from the break or leak.It will leak through cracks but is far more likely to remain in the building in pools or onwet surfaces;
3. iodine, caesium, strontium, etc. which interact strongly with water (dissolve and ionize)and tend to plate out on surfaces;
4. actinides such as plutonium. These are released from the fuel in quantity only if the coreis massively destroyed.
Generally iodine-131 is the significant radioisotope of concern because of its short half-life (8.1days), high-energy gamma emission, and ability to get into the food chain through the followingroute:
- released from containment- deposits on grass- eaten by cows- excreted in milk- drunk by people.
The external (direct) dose from atmospheric release of iodine-131 can also be significant.
Fortunately, as long as the pH of water inside containment is high, iodine will stay dissolved init. This is easy to design for: for example on concept developed by AECL proposed that bags oftri-sodium-phosphate were to be stored in the reactor building basement; in an accident, they getflooded, the TSP dissolves, and keeps the pH high. However a fraction of the iodine will reactwith organic material in containment and form methyl iodide, which is volatile, not very soluble,and hard to capture on filters. In an accident any iodine-131 which does leak from containment istherefore likely to be in this chemical form.
Figure 8-9 from D. Meneley summarizes this discussion.
Figure 8-9
Fission Products, Atmospheric Dispersion and Dose
Fission Product Source Term
The fission product inventory in an operating reactor can be estimated as follows . Suppose that4
the reactor has been operating at a power of P MW. If the recoverable energy per fission is takento be 200 Mev, the total number of fissions occurring per second is
If the cumulative yield of the i fission product (the yield of the fission product itself plus theth
iyields of all its short lived precursors) is ( atoms per fission, then the rate of production of thisnuclide is
The activity at time t of that fission product while in the core of the reactor is
Expressed in Curies, this is
(If you feel more at home in Becquerels, remember that 1 Bq = 2.7 x 10 Ci, and 1 TBq = 10-11 12
Bq or 27 Ci. So to get this in TBq, divide by 27).
iIf the activity saturates in the time t, that is, if 8 >>1, equation 4 reduces to
Figure 8-10 gives the inventories of the most important noble gases and iodine fission productscomputed for a typical 1000 MWe (PWR) plant at the end of a fuel cycle.
The amount of a fission product available for release to the atmosphere can be estimated by
pwhere F is the fraction of the radio nuclide released from the fuel into the reactor containment
band F is the fraction of this that remains airborne and capable of escaping from the building.
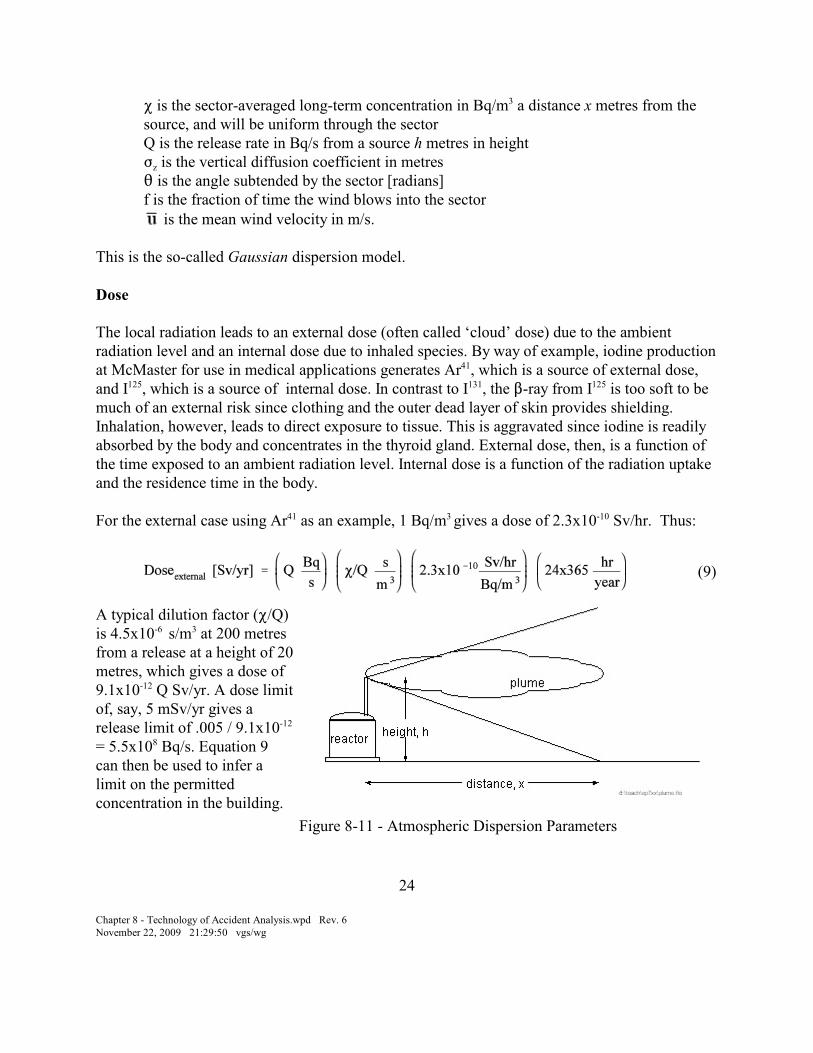
Consider a reactor containment after an accident, in which the concentration of a particularnuclide is C Bq/m . Assume a leak rate of V m / s into the atmosphere at a height h metres as3 3
shown in Figure 8-11 . The release rate Q is given by:
This release is dispersed into the surrounding area via the release plume. For a given weathercondition with wind velocity u and other data, a concentration of radioactivity at some distanceand direction from the source can be calculated from:
P is the sector-averaged long-term concentration in Bq/m a distance x metres from the3
source, and will be uniform through the sectorQ is the release rate in Bq/s from a source h metres in height
zF is the vertical diffusion coefficient in metres2 is the angle subtended by the sector [radians]f is the fraction of time the wind blows into the sector
is the mean wind velocity in m/s.
This is the so-called Gaussian dispersion model.
Dose
The local radiation leads to an external dose (often called ‘cloud’ dose) due to the ambientradiation level and an internal dose due to inhaled species. By way of example, iodine productionat McMaster for use in medical applications generates Ar , which is a source of external dose,41
and I , which is a source of internal dose. In contrast to I , the $-ray from I is too soft to be125 131 125
much of an external risk since clothing and the outer dead layer of skin provides shielding.Inhalation, however, leads to direct exposure to tissue. This is aggravated since iodine is readilyabsorbed by the body and concentrates in the thyroid gland. External dose, then, is a function ofthe time exposed to an ambient radiation level. Internal dose is a function of the radiation uptakeand the residence time in the body.
For the external case using Ar as an example, 1 Bq/m gives a dose of 2.3x10 Sv/hr. Thus:41 3 -10
A typical dilution factor (P/Q)is 4.5x10 s/m at 200 metres-6 3
from a release at a height of 20metres, which gives a dose of9.1x10 Q Sv/yr. A dose limit-12
For internal uptake of I , 1 Bq leads to 2x10 Sv. This is due to the integrated dose received,125 -6
which is a function of the dose level (Bq/time) and the residence time. The uptake rate is just theinhalation (volume) rate which is roughly 3.8 m /day for an infant. The dose is thus:3
Using the same dilution factor of (P/Q) = 4.5x10 s/m , the internal dose is 1.248x10 Q Sv. -6 3 -8
Thus a dose of 10:Sv is received for a release of
Details can be found in Canadian Standards Association Standard CSA-N288.1.
Much of the material in this chapter was based on lectures by D. Meneley. His permission to usethem is gratefully acknowledged. I have also used some good diagrams from T. Rogers.
Exercises
1. Calculate the average volumetric heat generation of the fuel in a 600MW CANDU at100% power. At what percentage power (assuming the same heat removal from the fuelas in normal operation) would the centre of the average pin melt?
2. Calculate the dose due to the release of 1000 Ci of Xenon-133 from a CANDU. Assumethe release is at 20m.high, and the receptor is 1 km. distant. Consult CSA-N288.1 for anymodels you need; assume a ‘reasonable’ dispersion factor as above.
3. Calculate the dose due to the release of 1000 Ci of Iodine-131 from a CANDU. Assumethe release is at 20m.high, and the receptor is 1 km. distant. Consult CSA-N288.1 for anymodels you need; assume a ‘reasonable’ dispersion factor as above.
4. How many grams does 1000 Ci of iodine-131 represent? (Hint: remember the half-life).
5. Calculate: (a) the amount of hydrogen produced by oxidation of 25% of the Zircaloy inthe sheaths in a CANDU (this is not untypical of a severe accident such as a LOCA +LOECC); (b) the amount of energy released (you will need to look up the heat ofreaction). (c)Assume this energy is released starting from 30 minutes after the accidentand ending two hours afterwards. Compare the energy to the decay heat produced in thesame time. (d) Now assume the hydrogen is transported into containment and burns.Calculate the energy produced by the burn. (e) Assuming the containment is a cylinder40m. high and 40m. in diameter, and that at the time of the hydrogen burn it is filled withair and steam at a pressure of 15 psig and a temperature of 120C, calculate the increase incontainment pressure (you will need to estimate the mass of air and water incontainment). (This exercise would make a good project)