759 CHAPTER 7.3 ENERGY 7.3.1 India ranks sixth in the world in terms of energy demand accounting for 3.5 per cent of world commercial energy demand in 2001. With a gross domestic product (GDP) growth of 8 per cent set for the Tenth Five-Year Plan, the energy demand is expected to grow at 5.2 per cent. Although, the commercial energy consumption has grown rapidly over the last two decades, a large part of India's population does not have access to it. At 479 kg of oil equivalent (kgoe), the per capita energy consumption is also low even compared to some of the developing countries. 7.3.2 India is fortunate to be endowed with both exhaustible (particularly coal) and renewable energy resources. Despite the resource potential and the significant rate of growth in energy supply over the last few decades, India faces serious energy shortages. This has led to reliance on increasing imports for meeting the demand of oil and coal. As per current projections, India's dependence on oil imports is expected to increase. The demand of natural gas also outpaces supply and efforts are being made to import natural gas in the form of liquefied natural gas (LNG) and piped gas. The power sector has also been experiencing severe shortages. 7.3.3 The Tenth Plan strategy for the sector includes increasing the production of coal and electricity, accelerated exploration for hydrocarbons, equity oil abroad, introduction of reforms through restructuring/deregulation of the energy sector to increase efficiency, demand management through introduction of energy efficient technologies/processes and appliances. The process of producing, transporting and consuming energy has a significant impact on the environment. Pollution abatement processes would form an important part of the development of energy sector. 7.3.4 In order to have an integrated energy approach and to meet the policy goals of economic efficiency, energy security, energy access and environment, the establishment of institutional links and coordinating mechanisms has been proposed. Energy Scenario 7.3.5 Primary commercial energy demand grew almost three-fold at an annual rate of 6 per cent between 1981 and 2001, to reach 314.7 million tonnes of oil equivalent (MTOE). In the case of China, primary commercial energy consumption has grown at an annual rate of 5.4 percent in the same period, even though its primary commercial energy consumption is at least twice as much as that of India. India's incremental energy demand for the next decade is projected to be among the highest in the world, spurred by sustained economic growth, rise in income levels and increased availability of goods and services. 7.3.6 India's commercial energy demand is expected to grow even more rapidly than in the past as it goes down the reform path in order to raise standards of living. A large part of India's population does not have access to commercial energy. The 479 kgoe per capita total energy consumption is only about 20 per cent of the global average in 1997 and compared poorly with the per capita consumption of Thailand (1,319 kgoe), Brazil (1,051 kgoe) and China (907 kgoe). Non-Commercial Energy Resources 7.3.7 More than 60 per cent of Indian households depend on traditional sources of energy like fuel wood, dung and crop residues for meeting their cooking and heating needs. Out of the total rural energy consumption, about 65 per cent is met from fuel wood. Fuel wood consumption during 2001-02 is estimated at 223 million tonnes, 180 million tonnes
Transcript
759
CHAPTER 7.3
ENERGY
7.3.1 India ranks sixth in the world in terms ofenergy demand accounting for 3.5 per cent ofworld commercial energy demand in 2001. Witha gross domestic product (GDP) growth of 8 percent set for the Tenth Five-Year Plan, the energydemand is expected to grow at 5.2 per cent.Although, the commercial energy consumptionhas grown rapidly over the last two decades, alarge part of India's population does not haveaccess to it. At 479 kg of oil equivalent (kgoe),the per capita energy consumption is also loweven compared to some of the developingcountries.
7.3.2 India is fortunate to be endowed with bothexhaustible (particularly coal) and renewable energyresources. Despite the resource potential and thesignificant rate of growth in energy supply over thelast few decades, India faces serious energyshortages. This has led to reliance on increasingimports for meeting the demand of oil and coal. Asper current projections, India's dependence on oilimports is expected to increase. The demand ofnatural gas also outpaces supply and efforts arebeing made to import natural gas in the form ofliquefied natural gas (LNG) and piped gas. Thepower sector has also been experiencing severeshortages.
7.3.3 The Tenth Plan strategy for the sectorincludes increasing the production of coal andelectricity, accelerated exploration forhydrocarbons, equity oil abroad, introduction ofreforms through restructuring/deregulation of theenergy sector to increase efficiency, demandmanagement through introduction of energyefficient technologies/processes and appliances.The process of producing, transporting andconsuming energy has a significant impact onthe environment. Pollution abatement processeswould form an important part of the developmentof energy sector.
7.3.4 In order to have an integrated energyapproach and to meet the policy goals of economicefficiency, energy security, energy access andenvironment, the establishment of institutional linksand coordinating mechanisms has been proposed.
Energy Scenario
7.3.5 Primary commercial energy demand grewalmost three-fold at an annual rate of 6 per centbetween 1981 and 2001, to reach 314.7 milliontonnes of oil equivalent (MTOE). In the case ofChina, primary commercial energy consumption hasgrown at an annual rate of 5.4 percent in the sameperiod, even though its primary commercial energyconsumption is at least twice as much as that ofIndia. India's incremental energy demand for thenext decade is projected to be among the highestin the world, spurred by sustained economic growth,rise in income levels and increased availability ofgoods and services.
7.3.6 India's commercial energy demand isexpected to grow even more rapidly than in the pastas it goes down the reform path in order to raisestandards of living. A large part of India's populationdoes not have access to commercial energy. The479 kgoe per capita total energy consumption isonly about 20 per cent of the global average in 1997and compared poorly with the per capitaconsumption of Thailand (1,319 kgoe), Brazil (1,051kgoe) and China (907 kgoe).
Non-Commercial Energy Resources
7.3.7 More than 60 per cent of Indian householdsdepend on traditional sources of energy like fuelwood, dung and crop residues for meeting theircooking and heating needs. Out of the total ruralenergy consumption, about 65 per cent is met fromfuel wood. Fuel wood consumption during 2001-02is estimated at 223 million tonnes, 180 million tonnes
TENTH FIVE YEAR PLAN 2002-07
760
of which is for household consumption and thebalance for cottage industry, big hotels etc. Theconsumption of animal dung and agro-waste isestimated at 130 million tonnes, which does notinclude the wet dung used for biogas plants. It isassumed that the wet dung used as manure is beingdiverted to biogas plants as these plants, in additionto providing a cleaner fuel, also supply enrichedmanure.
7.3.8 Even though there has been an impressiveincrease in the availability of the two petroleumbased domestic fuels - liquefied petroleum gas(LPG) and kerosene (SKO), they do not appear tohave made any significant dent in the pattern offuel consumption in the rural areas. To some extent,the biogas programme has made progress in ruralareas and it is estimated that about 3.2 million plantshave already been installed as on August 2001. TheNational Council for Applied Economic Research(NCAER), Delhi, has estimated the likely availabilityof gas from these plants during 2001-02 at 1,360million cubic meters.
Trends of Economic Growth and Energy Use
7.3.9 The average annual world economicgrowth in the 1997-2020 period is projected at
3.2 per cent, while the energy growth rate isestimated at 2.1 per cent per annum. This yieldsan elasticity of energy consumption at about 0.68per cent. In India's case, the elasticity was morethan unity for the 1953-2001 period. However,the elasticity for primary commercial energyconsumption for the 1991-2000 period is lessthan unity. This could be attributed to severalfactors such as the improvement in efficiency ofenergy use and the consequent lowering of theoverall energy intensity of the economy and thehigher share of hydrocarbons in the overallenergy mix. The projected requirement ofcommercial energy is estimated at about 412MTOE and 554 MTOE in the terminal years ofthe Tenth and Eleventh Plans respectively. Basedon the inputs of various working groups, thecommercial energy demand during the Tenth Planand Eleventh Plan is estimated to grow at anaverage rate of 6.6 per cent and 6.1 per centrespectively. Table 7.3.1 indicates the estimatedenergy demand in the terminal years of the Tenthand Eleventh Plans. However, the demand maybe less by 5 per cent and 10 per cent during 2006-07 and 2011-12 respectively due to increasinguse of information technology (IT) and prevalenceof e-commerce, which will mainly affect thedemand of energy in transport sector.
Table 7.3.1Estimated Energy Demand
Primary Fuel Unit Demand (in Original Units) Demand (MTOE)
2006-07 2011-12 2006-07 2011-12
Coal mt 460.50 620.00 190.00 254.93
Lignite mt 57.79 81.54 15.51 22.05
Oil mt 134.50 172.47 144.58 185.40
Natural gas BCM 47.45 64.00 42.70 57.60
Hydro Power BKwh 148.08 215.66 12.73 18.54
Nuclear Power BKwh 23.15 54.74 6.04 14.16
Wind Power BKwh 4.00 11.62 0.35 1.00
Total Commercial Energy 411.91 553.68
Non-Commercial Energy 151.30 170.25
Total Energy Demand 563.21 723.93
mt : Million Tonnes; BCM : Billion Cubic Meter; Bkwh : Billion kilo watt hour
ENERGY
761
International Experiences
Energy Policy Focus and Current Energy Policy Framework andObjectives for China :
3
ENERGY POLICY FOCUS IN CHINA1980s 1990s
• Coal accounts for 65-70 per cent of primary energy requirements
• Highest level of SO2emission in the world (~25 million tonnes in 2000)
• Energy consumption/ GDP four times that of US (1.2 toe/’000 US$ versus 0.3 toe/’000 US$ for US)
• Low import dependence – only 6% of total primary energy comes from non-indigenous sources
• Rapid increase in coal production to address severe shortage of energy supply driven by reforms-led economic growth
• Large number of township and village-run coal mines were set up
• Coal liberalisationinitiated:– Reduction in government subsidies– Price liberalisation/de-regulation
• Electricity sector reforms lead to capacity additions– Entry of non-state sector via build-
operate-transfer – Electricity supply meets demand in
most regions, with surplus in some areas
0
200
400
600
800
1981
1984
1987
1990
1993
1996
1999
Coal production in China
Million tonnes
113
179
245
1990 1995 2000
Power supply, China
GW
6
CHINA’s CURRENT ENERGY POLICY FRAMEWORK AND OBJECTIVES
Guiding principles Key features/policies
Structural adjustment of the energy industry
• Increase share of clean energy (including natural gas and clean coal)
• Set up 40-50 nuclear power plants – to account for 5% of total primary energy in 10-15 years
• Promote renewable energy (solar, wind, hydro) sources • Reduce/close number of small sub-scale loss making energy
(power generation, coal mining, oil refining) units
Energy efficiency
Energy security
• Strictly enforce energy consumption standards and technologies for new industrial capacities
• Build a more efficient national power grid (as-opposed to transporting coal from North to South/East)
• More market oriented reforms in the power sector– Separate power gencosfrom grid companies– Free competition in power generation
• Continue to pursue policy of self-reliance in energy supply, based primarily on domestic coal production, without sacrificing economic efficiency
• Increase the number of suppliers in oil to meet increased import requirements
Highlights of energy policy in tenth five-year plan (2001-05) in China
1. Upto 30% of primary energy
from imports is manageable
2. Imports should not be
greater than 10% of primary
energy needs
Two schools of thought on
energy security
Availability of Commercial Primary EnergyResources
7.3.10 India's energy use is mostly based onfossil fuels. Although the country has significantcoal and hydro resource potential, it is relativelypoor in oil and gas resources. As a result it hasto depend on imports to meet its energy supplies.
The geographical distribution of available primarycommercial energy sources in the country is quiteskewed, with 77 per cent of the hydro potentiallocated in the northern and north-eastern regionof the country. Similarly, about 70 per cent of thetotal coal reserves are located in the easternregion while most of the hydrocarbon reserveslie in the west.
TENTH FIVE YEAR PLAN 2002-07
762
Coal
7.3.11 The geological coal reserves of the countryare estimated at 220.98 billion tonnes (bt) as onJanuary 2001. Out of this, proven reserves are84.41 bt, while 98.55 bt are indicated reserves and38.02 bt are inferred reserves. Coal continues toremain the principal source of commercial energyaccounting for nearly 50 per cent of the totalsupplies. About 70 per cent of the power generatedis coal and lignite based and this trend is likely tocontinue in the foreseeable future.
7.3.12 India has an estimated 1000 billion cubicmeters of Coal Bed Methane (CBM), which is likelyto emerge as a new source of commercial energyin the country. A demonstration project is underimplementation with financial support from theGlobal Environment Facility (GEF) and the UnitedNations Development Programme (UNDP). In April2001, the Government announced a programmefor exploration and production of CBM. Under thefirst round of bidding, five CBM blocks have beenawarded to private companies. Apart from this,exploration work in two blocks has been awardedto two public sector undertakings (PSUs) onnomination basis. The successful implementationof these projects will facilitate exploitation of thisclean source of energy.
Lignite
7.3.13 The current estimates of geologicallignite reserves in India are 34.76 bt spread overTamil Nadu and Pondicherry (87.5 per cent),Rajasthan (6.9 per cent), Gujarat (4.9 per cent),Kerala (0.31 per cent) and Jammu and Kashmir
(0.37 per cent). The lignite deposits in thesouthern and western regions have emerged asan important source of fuel supply for states likeTamil Nadu, Rajasthan and Gujarat. Over theyears, considerable emphasis has been placedon the development of lignite for powergeneration. Lignite production is likely to increasefrom 24.3 million tonnes in 2001-02 to 55.96million tonnes in 2006-07.
Oil and Natural Gas
7.3.14 The latest estimates indicate that India hasaround 0.4 per cent of the world's proven reservesof crude oil. As against this, the domestic crudeconsumption is estimated at 2.8 per cent of theworld's consumption. The balance of recoverablereserves as estimated in the beginning of 2001 isplaced at 733.70 million tonnes (mt) of crude and749.65 billion cubic meters (BCM) of natural gas.The share of hydrocarbons in the primarycommercial energy consumption of the country hasbeen increasing over the years and is presentlyestimated at 44.9 per cent (36.0 per cent for oil and8.9 per cent for natural gas). The demand for oil islikely to increase further during the next twodecades. The transportation sector will be the maindriver for the projected increase in oil demand.Consequently import dependence for oil, which ispresently about 70 per cent, is likely to increasefurther during the Tenth and Eleventh Plans.
7.3.15 India has about 0.4 per cent of world'snatural gas reserves. Initially the gas reserves hadbeen developed largely for use as petrochemicalfeedstock and in the production of fertilisers, butgas is increasingly being used for power generation,
Table 7.3.2Regional Distribution of Primary Commercial Energy Resources
Region Coal (bt) Lignite (bt) Crude Oil (mt) Natural Gas (BCM) Hydro Power (TWH)
industrial applications and more recently in thetransport sector. Presently the share of powergeneration capacity based on gas is about 10 percent of the total installed capacity. The IndiaHydrocarbon Vision 2025 of the Governmentidentifies natural gas as the preferred fuel for thefuture and several options are being explored toincrease its supply capacity including buildingfacilities to handle imports of liquefied natural gas(LNG) and setting up of pipelines from major gasproducing countries. India is also reported to havesignificant deposits of gas hydrates. However, thetrue extent of this resource and its potential forcommercial exploitation is still being evaluated.
Hydro Electric Potential
7.3.16 The key advantage of hydroelectric poweris the ability to store energy and the flexibility of itsuse during peak load periods. India is endowed witheconomically viable hydro potential. The CentralElectricity Authority (CEA) has assessed India'shydro potential to be about 148,700 MW of installedcapacity. The hydroelectric capacity currently underoperation is about 26,000 MW and 16,083 MW isunder various stages of development. The CEA hasalso identified 56 sites for pumped storage schemeswith an estimated aggregate installed capacity of94,000 MW. In addition, a potential of 15,000 MWin terms of installed capacity is estimated from small,mini and micro hydel schemes.
Nuclear Resources
7.3.17 Nuclear energy has the potential to meetthe future needs of electricity demand in the country.The country has developed the capability to buildand operate nuclear power plants observing
international standards of safety. The currentinstalled capacity of nuclear power plants is 2,860MW accounting for 2.8 per cent of the total installedcapacity of the country. The Nuclear PowerCorporation of India Ltd. (NPCIL) proposes toincrease the installed capacity to 9,935 MW by 2011-12. The future strategies focus on a three-stagenuclear power programme for the optimal utilisationof the available nuclear energy resources. The firststage of 10,000 MW is based on pressurised heavywater reactor (PHWR) using indigenous naturaluranium resources. The second stage is proposedto be based on fast breeder reactor (FBR)technology using plutonium extracted byreprocessing of the spent fuel from the first stage.In the third stage, the country's vast thoriumresources will be utilised for power generation.
Renewable Sources of Energy
7.3.18 India is endowed with abundant naturaland renewable resources of energy viz., sun,wind and biomass. The country has been able toachieve significant capacity addition of 1,367 MWthrough wind farms and ranks fifth in the worldafter Germany, United States, Spain andDenmark in the generation of wind energy. Theavailable renewable resources need to beexploited by giving a commercial orientation,wherever possible. It may be necessary tocontinue with subsidies in the case of sociallyoriented programmes to meet the energyrequirements of rural areas, particularly, remotevillages, which may be difficult to service throughthe conventional power grid in the near future.Table 7.3.3 gives the available potential and theactual potential exploited till August 2001 forvarious renewable sources of energy.
Table 7.3.3Renewable Energy Sources Potential
Source/Technology Units Potential/Availability Potential Exploited
Biogas Plants Million 12 3.22
Biomass-based power MW 19,500 384
Efficient wood stoves Million 120 33.86
Solar Energy MW/Sq. Km 20 1.74
Small Hydro MW 15,000 1,398
Wind Energy MW 45,000 1,367
Energy Recovery from Wastes MW 1,700 16.2
TENTH FIVE YEAR PLAN 2002-07
764
7.3.19 Apart from these resources, the countryhas significant potential for ocean thermal, sea wavepower and tidal power.
TRENDS IN COMMERCIAL ENERGYPRODUCTION
7.3.20 The country has seen an expansion in totalenergy use during the last five decades, with a shiftfrom non-commercial to commercial sources ofenergy. Accordingly, the production of commercialsources of energy has increased significantly. Table7.3.4 indicates the trends in production of variousprimary commercial energy resources.
7.3.21 Coal production is likely to grow at anannual rate of 4.46 per cent in the Tenth Plan period(compared to 2.4 per cent annual growth rate duringthe Ninth Plan period) to touch 405 mt in the terminalyear, 2007. As against this, the coal demand in thatyear is estimated at 460.50 mt. Part of the gap isproposed to be met through import of both cokingand non-coking coal. About 70 per cent of theprojected demand is for public sector utilities. Asubstantial expansion in the domestic coalproduction is, therefore, needed to meet therequirements of the targeted generating capacityadditions envisaged during the Tenth and EleventhPlans.
7.3.22 The current domestic production of crudeoil caters to nearly 30 per cent of the demand andis likely to marginally increase from 32.03 mt in2001-02 to 33.97 mt in 2006-07. As against this,the demand for petroleum products, projected as
99.13 mt in 2001-02, is estimated to grow at therate of 5.7 per cent a year to touch 134.6 mt in theterminal year of the Tenth Plan and 172.5 mt in theterminal year of Eleventh Plan.
7.3.23 India's natural gas production reached alevel of 29.69 BCM in 2001-02. The projecteddomestic production of natural gas in 2007 is 37.62BCM. The country has been able to meet thedemand with the available domestic production tillrecently. However, the demand is likely to growrapidly in the near future. A number of projects forsetting up of LNG terminals have been approvedby the Government to bridge the demand-supplygap. Four LNG terminals at Dabhol, Dahej, Haziraand Cochin are in advanced stages of developmentand are likely to be completed by the end of theTenth Plan.
7.3.24 Significant hydro and nuclear generationcapacity is likely to be added during the Tenth Planperiod. The capacity addition programme includes16,083 MW from hydel power plants and 1,300 MWfrom nuclear power plants. In addition, 2,000 MWof energy is planned to be harnessed from windfarms.
7.3.25 Table 7.3.5 indicates the trends in primarycommercial energy supply from various sourcesbetween 1953-54 and 2001-02. Though coalproduction increased about three times from 114mt in 1980-81 to 325 mt in 2001-02, the share ofcoal in total energy supplies has declined from alevel of 58.9 per cent to 51.1 per cent. This couldbe partly due to the increase in the share of inferior
Table 7.3.4Trends in Commercial Energy Production
Units Production1960-61 1970-71 1980-81 1990-91 2001-02* 2006-07**
Coal mt 55.67 72.95 114.01 211.73 325.65 405.00
Lignite mt 0.05 3.39 4.80 14.07 24.30 55.96
Crude Oil mt 0.45 6.82 10.51 33.02 32.03 33.97
Natural Gas BCM - 1.44 2.35 1.79 29.69 37.62
Hydro Power Bkwh 7.84 25.25 46.54 71.66 82.80 103.49
Nuclear Power Bkwh - 2.42 3.00 6.14 16.92 19.30
Wind Power Bkwh - - - 0.03 1.70 4.00
* Anticipated, ** Projections for the terminal year of the Tenth Plan
ENERGY
765
grade coal in over-all coal production. The primaryreason, however, is that the share of hydrocarbonsin the total energy consumption of the country hasbeen increasing over the years and is currentlyestimated at 44.9 per cent as compared to 37.2 percent in 1980-81. Net energy related imports of 87.85MTOE in 2001-02 include the import of 75.43 mt ofcrude and petroleum products, 19.60 mt of coal and1.4 BKwh of electricity from Bhutan. The share ofnon-commercial sources in the total primary energysupply is 31.8 per cent in 2001-02, down from 53.1per cent in 1980-81.
Energy Imports
7.3.26 India is emerging as a large importer ofcrude and is planning to import LNG during theTenth Plan period. If the present trend continues,India's oil import dependency is likely to growbeyond the current level of 70 per cent. Futurestrategies should focus on increasing explorationactivities to enhance the level of recoverablereserves of the country.
7.3.27 Coal imports account for only about 5.6per cent of the total domestic consumption in thecurrent year. The steel sector has been importing
coking coal mainly for blending with domestic coalto obtain the desired quality for steel production.The cement industry and coastal power stations areimporting non-coking coal.
7.3.28 The share of primary energy imports in thetotal commercial energy supply is currentlyestimated at 29.41 per cent (Table 7.3.6) and is likelyto increase by the end of the Tenth Plan. This is amatter of concern from the point of view of energysecurity.
Energy Conservation
7.3.29 Energy efficiency or energy conservationis a multi-faceted activity involving four major sectors
Table 7.3.5Trends in Supply of Primary Commercial Energy
Commercial Energy Supply 26.25 42.82 60.33 99.82 183.12 298.67
Primary Non-Commercial Energy Supply 64.13 74.38 86.72 108.48 122.07 139.02
Total Primary Energy Supply 90.38 117.20 147.05 208.30 305.19 437.69
* Provisional
Table 7.3.6Share of Net Energy Imports in Primary
Commercial Energy Supply(%)
Year Coal POL* Electricity Total
1980-81 0.25 25.45 - 25.70
1990-91 2.22 15.56 0.07 17.85
2001-02 4.12 25.25 0.04 29.41
* Petroleum oil and lubricants
TENTH FIVE YEAR PLAN 2002-07
766
of the economy - industry, transport, agriculture anddomestic sectors. Although, energy conservationmeasures were initiated a decade back, they havenot yielded the desired results due to lack ofadequate focus on institutional arrangements todevise suitable incentives and disincentives backedby statutory power of enforcement.
7.3.30 During the Ninth Plan, a need was felt tohave an Energy Conservation Act and to establishan apex institution to effectively implement aprogramme of energy conservation. Accordingly, theEnergy Conservation Act, 2001 was passed whichmandates the setting up of a Bureau of EnergyEfficiency (BEE) that will introduce stringent energyconservation norms for energy generation, supplyand consumption. However, the enforcement ofpenalties stipulated in the Act have been kept inabeyance for five years during which time peoplewould be made aware of the economics and efficacyof the conservation of energy.
7.3.31 Appropriate supply side and demand sidemanagement strategies could achieve significantenergy savings. Diffusion of new high efficiencytechnologies in major energy intensive industries,and in energy conversion, transmission anddistribution can lead to a reduction in the energyintensity of the economy. For example, IntegratedGas Combined Cycle (IGCC) at 45 per centefficiency replacing a conventional pulverised coalplant at 36 per cent efficiency will save around 0.5Giga Joules (GJ) of primary energy for every oneGJ of electricity generated. In addition, propereconomic pricing of alternative energy sources cangreatly influence the pattern of energy consumptionand lead to energy efficiency. Efforts would be madeto benchmark the efficiency parameters of theenergy sub-sectors with the International Standards.
REFORMS IN THE ENERGY SECTOR
7.3.32 Reforms in the energy sector were initiatedto supplement the Government's efforts in thedevelopment of the sector and to make it moreefficient. The Government has been endeavouringto provide a policy environment that encouragesfree and fair competition in each element of theenergy value chain and attracts capital from allsources - public and private, domestic and foreign.
Encouraging such capital formation is crucial forIndia to meet its energy needs. Significant progresshas been made in establishing independent andtransparent regulatory authorities in the powersector to facilitate the rationalisation of electricitytariff as well as to encourage competition whileprotecting the interests of all stakeholders. TheGovernment also proposes to set up regulatoryauthorities for the coal and petroleum sector duringthe Tenth Plan period. There is a need to examinethe issue of a single regulatory authority for theenergy sector with a view to developing the desiredfuel-mix and related issues, in close association withsub-sector regulatory authorities.
7.3.33 The thrust of the reforms has been toderegulate the prices of commercial energyresources (which, until recently, were entirelyadministered), increase competition throughinstitutional, legislative and regulatory reforms andreduce subsidies. Although subsidies cannot becompletely eliminated, greater transparency can beachieved by transferring all subsidies to central orstate budgets and ensuring that the benefits ofsubsidies reach the targeted beneficiaries. Such anapproach will facilitate optimal and economicresource allocation and avoid distorting marketbased pricing.
THE PATH AHEAD
i) Create an Apex Committee on Energy(comprising the Ministers of Power, Coal,Petroleum and Natural Gas, Non-Conventional Energy Sources, Finance,External Affairs, Railways ,the Departmentof Atomic Energy, Planning Commission andothers as members ) with a secretariatconsisting of professionals/experts inenergy/economics/finance/management/legal areas to approve policy guidelines andoversee implementation on regular basis .Akey role of this committee should be tomanage the trade-offs between the divergentobjectives that could arise between thedifferent sub-sectors, ensuring, at all times,consistency with the high-level policygoals.These policy goals concern economicefficiency, energy security, access, and theenvironment.
ENERGY
767
ii) Accelerating the reform process in the energysector through :
Ø Restructuring and privatisation of publicsector undertakings.
Ø Tariff rationalisation in the power sector.
Ø Phasing out of subsidies in the energysector.
Ø Moving subsidies that cannot be eliminatedexplicitly to central/state budgets.
iii) Focussing on energy efficiency improvementthrough
Ø International benchmarking of energyproducing and consuming sectors
Ø Demand side management
Ø Develop a long-term (25 years) TechnologyVision-2025 for identified priority areas andtechnologies. Actively promote R&D onFast Breeder Reactor and thorium-basedtechnologies for nuclear power, solar, gashydrates, clean coal technologies, fuelcells etc.
iv) Effective strategies to address the concern ofenergy supply security. Possible optionsinclude maximising domestic production,diversifying the fuel mix and the source ofsupply, investing in equity oil/gas, creatingstrategic domestic reserves and maintaining amanageable level of import dependence.
v) Develop a national rehabilitation andresettlement policy to help accelerate thedevelopment of the hydro and coal sectors. Alarge number of hydro and coal projects havebeen facing implementation delays and costoverruns in the absence of such a policy. Boththese sectors are vital to meeting the country’sfuture energy needs.
vi) Develop environmental standards and enact atransparent regulatory and legislativeframework that allows easy enforcement ofthese standards.
vii) Concerted efforts to meet the energyrequirements of the rural areas at the lowesteconomic cost. The future policy initiatives,therefore, should focus on the development ofthe required infrastructure and continue to aimto provide universal access of commercial fuelsat affordable prices.
viii) Emphasis on preparing a time bound planfor people’s participation throughpanchayats, cooperatives, non-governmentorganisations (NGOs) and privateentrepreneurs in planning, operation andmaintenance, revenue collection andexpansion of local energy supply options toensure success.
ix) Development of alternative fuels such asCoal Bed Methane, MS-Ethanol blend,HSD - Ethanol blend, gas hydrates andfuel cells.
PETROLEUM AND NATURAL GAS SECTOR
4.5.34. The world energy consumption patternhas been changing over the years. Presently, theshare of oil in the world energy mix is 40 per centand that of gas is 23 per cent. The internationalenergy outlook projections indicate that thehydrocarbons will continue to cater to 68 per centof the total commercial world energy demandover the next two decades. The share of oil mayremain the same whereas that of natural gas maygo up as the latter is emerging as the preferredfeedstock and fuel since it is more environmentfriendly.
4.5.35 Against a 63 per cent supply of primarycommercial energy through hydrocarbons in theworld, in the case of India it is 44.9 per cent (36.0per cent for oil and 8.9 per cent for natural gas).There is limited scope for the increased use ofgas in India, unless some large reserves arediscovered or there is large-scale import. Thedemand for oil in the country over the next fiveyears is expected to grow at an annual averagerate of 3.6 per cent which will be higher than theaverage growth of around 2 per cent in the worldenergy demand.
TENTH FIVE YEAR PLAN 2002-07
768
REVIEW OF THE NINTH PLAN
7.3.36 The Ninth Plan envisaged acceleration ofexploration efforts, acquisition of acreage abroadfor equity oil, deregulation/rationalisation of theAdministered Pricing Mechanism (APM), import ofnatural gas in the form of LNG, creation of adequaterefining capacity and setting up of regulatorymechanism etc. as the thrust areas.
7.3.37 The physical and financial performanceof the energy sector during the Ninth Plan ispresented in Tables-7.3.7 and 7.3.8.
Demand/Consumption of Petroleum Products
7.3.38. The demand for petroleum products wasestimated at 104.80 mt during 2001-02 excludingthe liquid fuel requirement for power generation.During the first four years of the Ninth Plan, theconsumption of petroleum products grew at 5.8 per
cent. The consumption of petroleum productsduring 2001-02 is 100.43 million tonnes, therebyregistering a growth of about 4.9 per cent duringthe Ninth Plan period as against the target of 5.77per cent. The lower growth is mainly due toslowdown in the economy, improvement of roads(including construction of bridges and bypasses)and introduction of fuel-efficient vehicles.
Exploration and Development
7.3.39. Several measures were taken by theGovernment to intensify exploration and enhancehydrocarbon reserves. These included explorationand development of new fields, additionaldevelopment of existing fields, implementation ofenhanced/improved oil recovery schemes, inductionof specialised technology, enlisting the services ofinternational experts and encouraging participationof private and joint venture (JV) companies in theexploration programme, including the New
Table -7.3.7Physical Performance
Programme Eighth Ninth 1997 1998 1999 2000 2001 Likely %Plan Plan -98 -99 -2000 -01 -02 achievement of
Target 1997-02 targetActual Actual Actual Actual Actual Actual
# figure for the terminal year (1996-97) @Target in the terminal year of the Ninth Plan* Including private/joint venture contribution of 175 MTOE for five years
Note: Figures in the bracket are at 1996-97 prices.
ENERGY
769
Exploration Licensing Policy (NELP). The NELPprovided attractive incentives and a level playingfield to private parties who bid for exploration blocksunder an international competitive bidding process.In the first stage (NELP-I, January 1999), 48 blockswere offered for bidding. Out of these, 25 blockswere awarded. The Government has since signedproduction sharing contracts for 24 out of the 25blocks with national and private oil companies. Inthe second round (NELP-II, December 2000) 25blocks were offered for bidding and 23 blocksawarded to various companies. In the third round(NELP-III, March 2002) bids were invited for 27blocks - nine in deep water, seven in shallow waterand 11 in onland areas.
Hydrocarbon Reserves Accretion
7.3.40 During the Ninth Plan, considerableprogress has been made in the area of explorationof hydrocarbon resources. The physical parametersachieved, such as seismic survey (2D and 3D) andexploratory drilling are higher than the originaltargets. However, the in-place hydrocarbon reservefor the Ninth Plan is likely to be about 780 MTOE ofgas against the target of 865 MTOE. It was observedthat the accretion of reserves was mainly from theexisting and satellite discoveries. No new majordiscovery was made.
Crude Oil and Natural Gas Production
7.3.41 The main reasons for shortfall in oilproduction by the Oil and Natural Gas Corporation(ONGC) were the rescheduling of additionaldevelopment plan, non-commensurate drillingresults, delay in input mobilisation, and less thananticipated performance in a few fields. In the caseof private/JV fields, the shortfall is due to delayeddevelopment of a few fields.
Refining Capacity
7.3.42. The refining capacity in the country wastargeted to increase from 69.15 mt at thebeginning of the Ninth Plan (1997-98) to 113.95mt by the terminal year, 2001-02. It has touched116.07 mt by the end of the Ninth Plan. Thus,the country has achieved self-sufficiency inrefining capacity.
Imports of Crude Oil and Petroleum Products
7.3.43. The import of crude and petroleumproducts at the beginning of the Ninth Plan (1997-98) was to the tune of 34.49 mt and 18.6 mtrespectively. This increased to 39.81 mt of crudeand 18.09 mt of petroleum products in 1998-99 andfurther to 57.80 mt and 16.60 mt respectively during1999-2000. The increase in crude oil imports ismainly due to the commissioning of a private sectorrefinery by Reliance Petroleum Ltd. The import ofcrude oil during 2001-02 was 78.71 mt. The net exportof petroleum products in 2001-02 was 3.06 mt.
Dismantling of Administrative Price Mechanism(APM)
7.3.44 In November 1997, the timetable for thephased dismantling of APM was approved. Effective1 April 1998, the retention pricing concept for therefineries was abolished and the refinery gate priceswere fixed on import parity basis. The refining sectorwas delicensed in June 1998 and private and jointsector refineries were permitted to import crude oilfor their own use.
7.3.45 Customs duty on crude oil was reducedfrom 27 per cent to 10 per cent and customs dutyon products reduced from the maximum rate of 32per cent to 20 per cent. Import and export of furnaceoil and export of naphtha were decanalised in July1998 and export of petrol, diesel and aviation turbinefuel (ATF) were decanalised in October 1999.
7.3.46 Subsidy on kerosene under publicdistribution system and LPG for domestic cookingwas reduced in phases.
7.3.47 With the above-mentioned actions,reforms in the petroleum sector were carried forwardas scheduled, which facilitated dismantling of theAPM from 31 March 2002, opening the way for theentry of new players into marketing of transportationfuels.
Restructuring/Disinvestment
7.3.48. The Group on Hydrocarbon Vision -2025recommended that the oil PSUs be restructured tohave the required strength to compete with the
TENTH FIVE YEAR PLAN 2002-07
770
private sector firms, including multi nationalcompanies. In line with these recommendations,integration of stand-alone refining companies withthe marketing companies was completed by 31March, 2001 in the following manner:
l Chennai Petroleum Corporation Ltd.(CPCL) and Bongaigaon Refineries andPetrochemicals Ltd. (BRPL) were madesubsidiaries of Indian Oil Corporation Ltd.(IOC).
l Kochi Refineries Ltd. (KRL) andNumaligarh Refinery Ltd. (NRL) weremade subsidiaries of Bharat PetroleumCorporation Ltd. (BPCL).
l The entire Government shareholding inCPCL, BRPL and KRL, were divested infavour of IOC and BPCL respectively.
l In the case of NRL, the 19 per cent equityholding by IBP Co. Ltd. was divested toBPCL, Oil Industry Development Board(OIDB) and Oil India Limited (OIL) eachacquiring 10 per cent.
l The Government completed the strategicsale of 33.58 per cent of equity in IBP Co.Ltd. to IOC.
Environmental Management
7.3.49. Oil companies have implemented majorprogrammes for the upgradation of auto fuel (petroland diesel) quality during the Ninth Plan. Lead hasbeen removed from petrol in phases and from 1February 2000, only unleaded petrol is beingsupplied in the entire country. Petrol octane numberhas been increased and sulphur content reducedfrom 0.20 per cent max. to 0.10 per cent max. inthe entire country from 1 April 2000. In addition, thefour metro towns and the National Capital Region(NCR) are being supplied petrol of 0.05 per centmax. sulphur content. The sulphur content in dieselhas been reduced from 1.0 per cent max. to 0.25per cent max. in the entire country during the period1 April 1996 to 1 January 2000. In addition, in thefour metro towns, sulphur content in diesel has beenreduced to 0.05 per cent max. Diesel Cetane
number has been increased from 45 to 48 from 1April 2000. Improvements have been done in thedistillation specifications of diesel from 1 April 2000.The improvements in petrol and diesel quality hasfacilitated adoption of India 2000 (Euro-I equivalent)emission norms in the entire country and BharatStage-II (Euro-II equivalent) emission norms in the4 metros. For this purpose, an amount of Rs. 10,000crore was spent over the Plan period.
Ninth Plan Performance
l Reforms in petroleum sector were carriedforward as scheduled with the dismantlingof APM on 31 March 2002.
l Liberalisation of petroleum productmarketing in the country was done bynotifying guidelines for authorisation tomarket transportation fuels by privateparties.
l Up to 100 per cent foreign directinvestment (FDI) was permitted in therefining sector.
l Crude oil and natural gas production wasshort of target by 10 per cent and 2 percent respectively.
l Secured equity oil abroad by participatingin the oil and gas project in Vietnam and inSakhalin (Russia) and signing anagreement with Iraq for oil exploration.
l Hydrocarbon reserves accretion was belowtarget by 10 per cent.
l Significant discoveries of natural gas in theKrishna-Godavari deep-water area wasmade by ONGC and in the CambayOffshore area by a joint ventureconsortium.
l Two rounds of offer of exploration blocksunder NELP were completed in record timewith 47 blocks awarded to parties.
l Under the CBM policy, six blocks wereawarded for exploitation.
ENERGY
771
l Refining capacity targets were surpassed.At the same time, the import targets wereexceeded.
l Petroleum products consumption waslower by 6 per cent than the demandforecasts.
l Drive for alternative fuels gatheredmomentum with the introduction of autoLPG and setting up of ethanol-petrolblending projects in selected states.
l Significant achievement was made inintroducing cleaner fuels in major cities inline with international standards.
l Around 3,40,50,000 LPG enrolments weremade, thereby liquidating the entire waitinglist.
l Year-wise phasing out of subsidies was notin line with the Gazette notification.
l Lower Ninth Plan expenditure of Rs.49,407.77 crore against the approvedoutlay of Rs. 74,014.18 crore.
gas flaring by re-injection of gas to undergroundreservoirs, installation of waste heat recoverysystem, use of dual fuel/ natural gas engines toachieve substitution of diesel by low pressureassociated natural gas, use of solar poweredcathodic protection systems for pipelines and useof self loading types of skids for mounting rigequipment etc.
7.3.51. The oil refineries implemented energyconservation projects such as revamping andreplacing low efficiency furnaces and boilers,various methods for improved energy efficiencysuch as enhanced heat transfer system, use ofstate-of-the-art equipment, pinch technology, gasturbine based co-generation systems, low heatrecovery, stock monitoring systems to control flarelosses, periodic energy audits, advanced processcontrols apart from operational improvements andbetter house-keeping practices.
7.3.52. Refineries produced and sold high-gradelubricants under a phased action plan andconstantly upgraded lubricants in line with theinternational development to increase the life ofengines and lower the frequency of lubricantsreplacement.
7.3.53. At the consumer end, the PetroleumConservation Research Association (PCRA)undertook various sectoral programmes. Theseincluded the adoption of efficient engines and fuelefficient driving habits supplemented by trainingprogrammes in the transport sector; carrying outenergy audits and fuel oil diagnostic studies inindustries and promoting fuel-efficient practices inindustry; standardisation of fuel-efficient irrigationpump-sets in the agricultural sector anddevelopment of fuel-efficient domestic appliances.
Ninth Plan Outlays
7.3.54. The petroleum sector outlay for the NinthPlan was Rs. 74,014.18 crore. The estimatedexpenditure up to 2001-02 was Rs. 49,407.77 croreat prevailing prices during the various years andRs. 41,177.60 crore at 1996-97 prices representingutilisation of 66.75 per cent and 55.6 per centrespectively. The shortfall is mainly on account ofdelays in taking up the joint venture refinery projects.
Success Story in the Petroleum Sector
1. Dismantling of APM on 31 March, 2002 inline with Gazette notification.
2. Two rounds of NELP completed in recordtime.
3. Refining capacity targets surpassed.
4. Release of around 3.4 crore LPGconnections, thereby liquidating the entirewaiting list.
5. Secured equity oil abroad.
6. Introduction of auto LPG and setting up ofMS-Ethanol blending projects in selectedstates.
Conservation of Petroleum Products
7.3.50. Upstream oil companies adopted variousconservation methods. These include: reduction in
TENTH FIVE YEAR PLAN 2002-07
772
APPROACH TO TENTH PLAN
7.3.55. India's oil industry will have to play the roleof a 'frontline' industry in the country's marchtowards becoming an economic super power. Tosuccessfully fulfill this role, the industry will have tobecome internationally competitive and endeavourto become a global player. This will ensure thecountry's sustained prosperity and economicsecurity. The progress achieved so far provides thelaunching pad for gearing up the hydrocarbon sectorto meet the new challenges. The key elements ofthe comprehensive approach approved by theNational Development Council (NDC) for this sectorare detailed below.
7.3.56 “India Hydrocarbon Vision-2025” laysdown the framework of the approach and policiesthat shall guide this sector for the next 25 years.India's dependence on imported oil is increasing. Itis also likely that the use of gas for power generationwill increase rapidly in the coming years. Effortsshould be made to increase the indigenousproduction of oil and gas.
7.3.57 The NDC recognised that arbitraryadministrative restrictions on the consumption andimports of petroleum products are not the solutionand will only affect economic development. Thecorrect approach would be to allow the scarcity valueof such exhaustible natural resources to be reflectedin prices. This will create an incentive forconservation and efficient use of petroleumproducts. It envisaged that the APM for petroleumproducts would be dismantled and petroleum pricedetermination will shift to market based pricing atthe start of the Tenth Plan. Complete pricederegulation and operation of efficient markets inthe petroleum sector requires the establishment ofprudential rules and regulations by a statutoryregulatory authority. Therefore, the setting up ofregulatory mechanisms needs to be expedited, soas to ensure smooth transition from the APM regimeto a market-driven pricing mechanism.
7.3.58 At the same time, there is need to providefor oil security through strategic storage of crudeoil and petroleum products, diversification of oilimports and investing in equity oil abroad. In viewof the strategic importance of the oil sector in the
economy, oil PSUs need to be restructured so thatthey can compete with private and multinationalcompanies. Following restructuring, disinvestmentin or privatisation of some of these companiesthrough a transparent process should also beundertaken in the course of the Tenth Plan.
Thrust Areas for Tenth Plan
7.3.59 Keeping in view the above approach, thefollowing thrust areas have been identified for theTenth Plan:
i) Oil Security:
a) Acceleration of exploration efforts,especially in deep offshore and frontierareas
b) Improved oil recovery (IOR) / Enhancedoil recovery (EOR)
c) Equity oil and gas abroad
d) Strategic storage of crude oil
e) Alternate fuels
ii) Infrastructure Development:
a) Refining capacity
b) Regulatory mechanism to overseeconsumer interests
c) Marketing and distribution facilitiescommensurate with demand
iii) Efficiency Improvement:a) Benchmarking of the hydrocarbon sector
with international standardsb) Oil conservationc) Demand side management
iv) Environment and Quality Improvement:
v) Reforms:a) Dismantling of APMb) Restructuring/disinvestment
vi) Regulatory Mechanism:
vii) Plan Outlays:
The action plan for the above thrust areas is detailedbelow :
ENERGY
773
Demand of Petroleum Products
7.3.60. The demand of petroleum products inthe terminal year of the Tenth Plan (2006-07),based on a gross domestic product (GDP)growth rate of 8 per cent, was projected bythe Working Group on petroleum & NaturalGas as 134.6 mt. However, in view of the lowdemand of petroleum products in the last twoyears of Ninth Plan and the increasing shareof the service sector especially informationtechnology (IT) in GDP (with e-commercereducing transportation requirements), thedemand target may be 120.4 million tonnesfor 2006-07, resulting in a CAGR of 3.7 percent during the Plan period.
Production of Crude Oil and Natural Gas
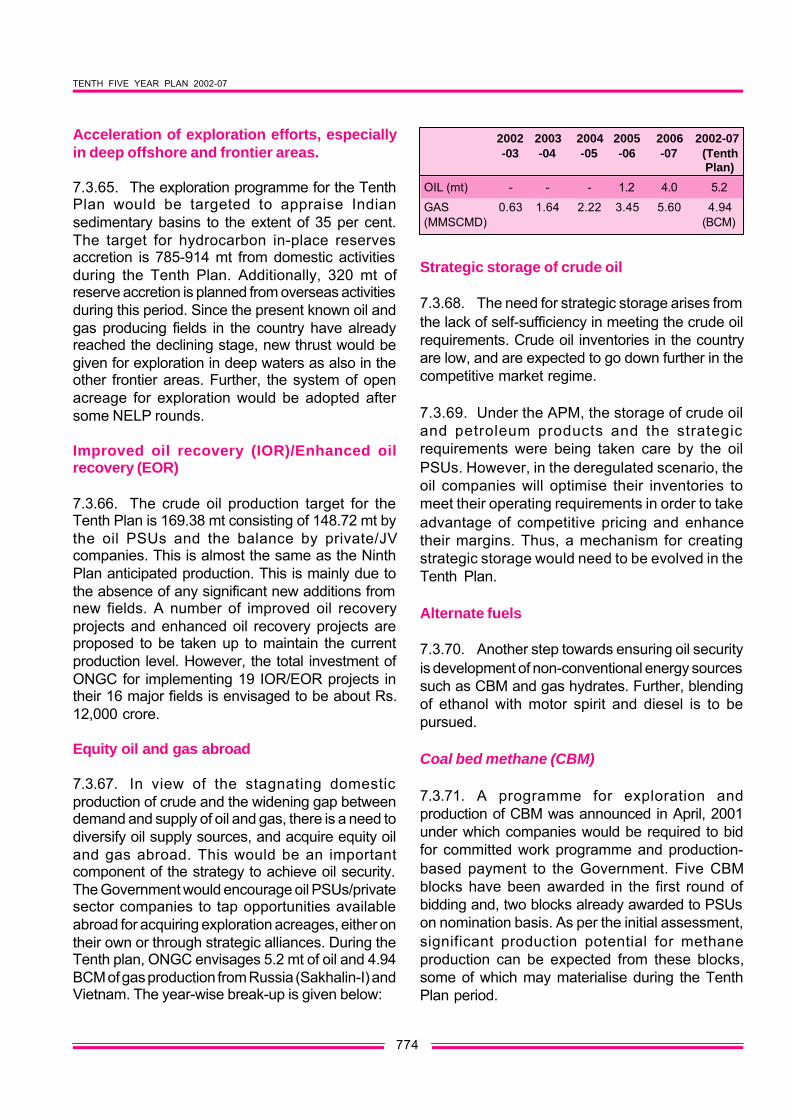
7.3.61 The cumulative production of crude andnatural gas are estimated at 169.38 mt and177.48 BCM during the Tenth Plan. The oil andgas production profile for the Tenth Plan is basedon the established reserve base and alsoconsidering key issues like the present status ofdifferent fields, the input implementationschedules and status of health of the reservoirs.The year-wise break-up is given in the Tables7.3.9 and 7.3.10.
Imports of LNG/Natural Gas
7.3.62. Import of LNG is on open generallicence (OGL). A number of projects for settingup of LNG terminals have been approved by theGovernment and three terminals are underconstruction. The fate of other terminals isuncertain because statutory clearances andother agreements/guarantees are yet to befinalised. Another terminal at Kochi may alsomature during the tenth plan. Considering thatfour terminals will be commissioned during theTenth Plan, the overall extent of imports by theterminal year could be in the range of 40-50mill ion standard cubic metres per day(MMSCMD).
7.3.63. Pipeline gas imports are economicallysuperior to LNG imports. However, the success oftransnational gas pipeline projects critically hingeson various geo-political considerations involvingsecurity of supply, transit and importing countriesetc. Initiatives have been taken for pipeline gasimports from various countries and some gassupplies may commence in latter part of the TenthPlan.
OIL SECURITY
7.3.64. The increasing imports of crude oil andthe proposed LNG imports during the Tenth Plan,high price volatility in the international markets anddisruption of supplies due to war etc. raise the issueof oil security. The strategy to address the oilsecurity concerns involves diversification of sourcesfor crude supplies, strategic storage andglobalisation measures to bring equity oil and gas/LNG from abroad. In view of this, the followingissues would be given priority during the Tenth Plan.
Table - 7.3.10Natural Gas Production
Million Standard Cubic Meters per Day (MMSCMD)
Organisation 2002-03 2003-04 2004-05 2005-06 2006-07 Total (BCM)
Acceleration of exploration efforts, especiallyin deep offshore and frontier areas.
7.3.65. The exploration programme for the TenthPlan would be targeted to appraise Indiansedimentary basins to the extent of 35 per cent.The target for hydrocarbon in-place reservesaccretion is 785-914 mt from domestic activitiesduring the Tenth Plan. Additionally, 320 mt ofreserve accretion is planned from overseas activitiesduring this period. Since the present known oil andgas producing fields in the country have alreadyreached the declining stage, new thrust would begiven for exploration in deep waters as also in theother frontier areas. Further, the system of openacreage for exploration would be adopted aftersome NELP rounds.
7.3.66. The crude oil production target for theTenth Plan is 169.38 mt consisting of 148.72 mt bythe oil PSUs and the balance by private/JVcompanies. This is almost the same as the NinthPlan anticipated production. This is mainly due tothe absence of any significant new additions fromnew fields. A number of improved oil recoveryprojects and enhanced oil recovery projects areproposed to be taken up to maintain the currentproduction level. However, the total investment ofONGC for implementing 19 IOR/EOR projects intheir 16 major fields is envisaged to be about Rs.12,000 crore.
Equity oil and gas abroad
7.3.67. In view of the stagnating domesticproduction of crude and the widening gap betweendemand and supply of oil and gas, there is a need todiversify oil supply sources, and acquire equity oiland gas abroad. This would be an importantcomponent of the strategy to achieve oil security.The Government would encourage oil PSUs/privatesector companies to tap opportunities availableabroad for acquiring exploration acreages, either ontheir own or through strategic alliances. During theTenth plan, ONGC envisages 5.2 mt of oil and 4.94BCM of gas production from Russia (Sakhalin-I) andVietnam. The year-wise break-up is given below:
Strategic storage of crude oil
7.3.68. The need for strategic storage arises fromthe lack of self-sufficiency in meeting the crude oilrequirements. Crude oil inventories in the countryare low, and are expected to go down further in thecompetitive market regime.
7.3.69. Under the APM, the storage of crude oiland petroleum products and the strategicrequirements were being taken care by the oilPSUs. However, in the deregulated scenario, theoil companies will optimise their inventories tomeet their operating requirements in order to takeadvantage of competitive pricing and enhancetheir margins. Thus, a mechanism for creatingstrategic storage would need to be evolved in theTenth Plan.
Alternate fuels
7.3.70. Another step towards ensuring oil securityis development of non-conventional energy sourcessuch as CBM and gas hydrates. Further, blendingof ethanol with motor spirit and diesel is to bepursued.
Coal bed methane (CBM)
7.3.71. A programme for exploration andproduction of CBM was announced in April, 2001under which companies would be required to bidfor committed work programme and production-based payment to the Government. Five CBMblocks have been awarded in the first round ofbidding and, two blocks already awarded to PSUson nomination basis. As per the initial assessment,significant production potential for methaneproduction can be expected from these blocks,some of which may materialise during the TenthPlan period.
7.3.72. On the basis of the positive feedback fromthe three pilot projects - two in Maharashtra andone in Uttar Pradesh, it has been decided tointroduce mandatorily ethanol blended petrol (5 percent gasohol) in the first phase in the eight sugar-producing states of Andhra Pradesh, Gujarat,Karnataka, Punjab, Haryana, Maharashtra, TamilNadu and Uttar Pradesh by the end of 2002 and inthe rest of the country in the second phase. Inaddition, an Inter-Ministerial Task Force has beenconstituted to prepare a roadmap to switch over toEthanol blending with diesel and also for 10 percent blending of ethanol with petrol.
Gas hydrates
7.3.73. The National Gas Hydrate Programme(NGHP) roadmap is being finalised. The draftroadmap envisages a number of activities like geo-scientific works and studies, laboratory studies,formulation of drilling technology and undertakingdrilling operations besides brainstorming for workingout the most appropriate production technologiesof gas from gas hydrates. All the activities connectedwith the NGHP are planned to be taken upconcurrently and pilot studies for the production ofgas from gas hydrate, if found feasible, are plannedby the end of the Tenth Plan.
INFRASTRUCTURE DEVELOPMENT
Refining capacity
7.3.74. Since the refinery sector has been de-licensed, it is not possible to correctly assess thefuture plans of refining capacity additions. Theprojection of total refining capacity materialisationduring the Tenth Plan would depend upon severalfactors including domestic demand, duty structurethat would affect import and export possibilities andrefining margins.
7.3.75. As to the actual materialisation of therefining capacity, based on the present indications,the following two scenarios are likely to emerge:
Scenario - I. Keeping in view the competitiveenvironment in the deregulated scenario, current low
refining margins, the slow down of the productdemand and the fact that the companies would needto make substantial investments in qualityupgradation projects, only expansion projects underimplementation may fructify during the Tenth Plan.Under this scenario, the refining capacity will increaseto around 138 million tonnes per annum (mtpa).
Scenario - II. If the product demand grows at ahigher rate, then in addition to the capacityexpansion projects under implementation, one ortwo new grass-root projects may also get completedduring the Tenth Plan, taking the refining capacityto around 155 mtpa at the end of the Plan period.
7.3.76. It is expected that the companies, basedon the trend in the demand growth, will review therefinery projects and rework the project completionschedules.
Regulatory mechanism to oversee consumerinterests
7.3.77. In the deregulated, market-determinedpricing scenario, when private companies (bothIndian and foreign) are allowed marketing oftransportation fuels, the degree of competition,enhanced efficiency of individual players and themarket location (urban, rural or remote) would setthe consumer prices. The emergence of differentialpricing across different locations based on the costof storage and distribution would enhance allocationefficiency, and encourage the establishment ofrefineries in economic consumption zones.However, certain remote and inaccessible areas ofthe country would require special attention, as thehigher prices of petroleum products in remote areaswould be detrimental to the overall development ofsuch regions. Hence, the Government would needto monitor the prices of petroleum products in thecountry in general and in the monopolistic marketsin particular. For this purpose an independentstatutory regulator for the downstream petroleumsector will be set up.
Marketing of products and distributionfacilities
7.3.78 The Government decided, through aresolution dated 8 March 2002 to authorise the
TENTH FIVE YEAR PLAN 2002-07
776
private sector to market transportation fuelsnamely motor spirit, high speed diesel, and ATF.So far, only public sector oil marketing companieswere having the authorisation to markettransportation fuels. The guidelines approved bythe Government, inter-alia, provide forauthorisation to market transportation fuels,conditional to a company investing or proposingto invest Rs. 2,000 crore in exploration andproduction, refining of oil and gas, pipelines andterminals. Such investment should work towardsadditionality of assets, and in the form of equity,equity-like instruments or debt with recourse tothe company.
EFFICIENCY IMPROVEMENT
Benchmarking of hydrocarbon sector
7.3.79 The hydrocarbon sector would bedeveloped as a globally competitive industry whichcould be benchmarked against the best in the worldthrough technology upgradation and capacitybuilding in all facets of the industry.
Oil conservation
7.3.80 Oil conserved through efficient utilisationcan be looked upon as a quicker, efficient andeconomic source of new energy. Any reductionin oil demand due to efficient utilisation wouldallow the diversion of this scarce resource toother pressing needs and new economicactivities.
7.3.81 Pending development of new energyresources and technology, there are tremendousopportunities for improving efficiency by adoptingmore efficient technologies available around theworld and also by using market-driven approaches,which have a powerful impact.
7.3.82 Thus, there is an urgent need to establisha system framework and approach to realise theoverall conservation potential. However, theexistence of market imperfections limit theireffectiveness. This calls for a regulatory approach,which includes setting of minimum standards andthe labeling for all types of efficient equipment andappliances.
Demand side management
7.3.83 In India, the emphasis has always beenon supply side management. However, demandside management needs to be pursued so as tominimise the overall cost. Demand sidemanagement in the oil sector implies minimisingthe oil intensity of the economy withoutcompromising on the pace of economicdevelopment.
7.3.84 The demand for petroleum products hasincreased rapidly during the last two decades. Sincethe transport sector consumes about 45 per centof oil in the country, demand managementmeasures should primarily be directed at this sector.These would involve shift of traffic from road to rail,introduction of mass transport and other publictransport in metropolitan cities and mandating fuelefficiency levels in transport vehicles.
ENVIRONMENT AND QUALITY IMPROVEMENT
7.3.85 Presently, the product quality requirementsin India are ahead of most of the countries in theAsia-Pacific and Middle East regions. In order toenable adoption of Bharat Stage-II vehicularemissions standards through out the country andEuro-III equivalent emission norms in seven megacities from April 2005, the quality of petrol and dieselwould need to be further improved. For this purpose,measures such as further reduction of sulphurcontent need to be taken in a time-bound manner.Accordingly, Indian refineries would need to investin secondary and tertiary processing facilities toensure that the quality of products conforms to theappropriate specifications.
REFORMS
Dismantling of APM
7.3.86 With the dismantling of APM from 1 April2002, the prices of all petroleum products havebecome market determined, with subsidy onkerosene under public distribution and LPG fordomestic cooking to be met from the fiscal budget.These subsidies, to be provided on a flat rate basis,will be phased out over three to five years duringthe Tenth Plan.
ENERGY
777
7.3.87 In the deregulated scenario, refinerieswill have to improve their efficiency to meet thechallenges of the competitive scenario. The fourrefineries (Digboi, Guwahati, Numaligarh andBongaigaon) in the North-Eastern region are ofsub-economic size compared to present dayminimum/threshold size of 9 mtpa. There is noscope for increasing their capacities due to lowconsumption of petroleum products in the regionand non-availability of crude oil from the North-East.
Restructuring/Disinvestment
7.3.88 The disinvestment process will be carriedforward in selected oil and gas PSUs during thePlan period to enhance competition and maximiseshareholder value.
REGULATORY MECHANISM
7.3.89 With the dismantling of APM, a regulatorymechanism will be established for the downstreamand natural gas sector. The regulatory mechanismwill oversee the functioning of the industry to ensurejust and fair competition that protects consumerinterest.
PLAN OUTLAYS
7.3.90 A public sector outlay for the Tenth Planhas been fixed at Rs. 96,041.19 crore. This consistsof Rs. 59,468.95 crore for exploration andproduction and Rs. 36,572.24 crore for the refiningand marketing sector. The company-wise outlaysare given in Annexure-7.3.1 and the project-wisebreak-up of the Tenth Plan outlay is given in theAppendix. In view of the low utilisation of plan fundsin Ninth Plan, all efforts should be made to stick tothe approved cost and time schedule for the projectsthrough regular monitoring so as to fully utilise theoutlay.
COAL
Role of Coal in Global Energy
7.3.91 Coal contributes to around 22 per cent ofthe total global primary energy consumption against40 per cent from oil, 23 per cent from gas, 7 percent from nuclear, 2 per cent from hydro and 6 percent from renewables. Around 38 per cent of totalworld electricity generation is based on coal. In thecase of India, the share of coal in the supply ofprimary commercial energy has been about 50 percent. About 70 percent of the power generated inIndia is coal and lignite based. The global hard coalconsumption in 2000 was 3,738 mt againstproduction of 3,639 mt. Coal demand grew by aboutone bt between 1980 and 2000. China is the largestproducer (1,171 mt) followed by the United States(899 mt) and India (310 mt). The major coal
THE PATH AHEAD
l Deregulation of the petroleum sector withdismantling of APM.
l Establishment of a regulatory authority forthe petroleum sector, including natural gas.
l Restructuring/disinvestment of oil and gasPSUs on a selective basis.
l Oil security through accelerated explorationactivities, diversification of sources, securingequity oil abroad and strategic storage of oil.
l Development of alternative fuels such asCBM, MS-Ethanol blend, and gas hydrates.
l Benchmarking of the hydrocarbon sector tointernational levels.
l Phasing out of subsidies. Subsidies, if any,to be routed through the Central Budget.
l Improvement of product quality in line withinternational standards.
l Emphasis on R&D for introduction of latesttechnology.
l Creating an enabling atmosphere fordevelopment of infrastructure facilities toachieve global competitiveness.
l To promote a greener and cleanerenvironment in the country by settingemission norms and product qualityspecifications.
TENTH FIVE YEAR PLAN 2002-07
778
exporters are Australia (186.8 mt), South Africa (70mt), Indonesia (56.8 mt), China (55.1 mt) and UnitedStates (53 mt). The major coal importers are Japan(145.3 mt), Republic of South Korea (61.7 mt),Chinese Taipei (45.4 mt), India (24.5 mt) and UnitedKingdom (23.5 mt).
7.3.92 Coal is a diverse and abundant source ofenergy. Most of the coal is consumed domesticallyand only 12 per cent of the world production is tradedinternationally. Coal will continue to play a key rolein the future global energy demand. Known coalreserves are spread over almost 100 countries andat current production levels, proven coal reservesare estimated to last for over 200 years. In contrast,proven oil and gas reserves are estimated to lastaround 40 and 60 years respectively at currentproduction levels.
7.3.93 Although combustion of coal producesenvironmental pollutants, this can be mitigated to alarge extent by the development/adoption of cleancoal technologies as they can substantially reducethe level of carbon dioxide emissions per unit ofenergy output. A 5 per cent conversion efficiencyimprovement in a coal-fired power plant brings morethan 10 per cent reduction in carbon dioxideemissions. A global response encouraging voluntaryactions on the part of industry and cooperationbetween industry and Government on this issue isrequired.
7.3.94 Coal is a relatively inexpensive sourceof energy compared to other fuels and coal pricesare more stable when compared to the morevolatile prices of oil and gas. Coal is easy andsafe to transport and offers enhanced securityof supply due to different and varied sources ofsupply. Levels of energy conversion efficiency inmodern coal plants can reach 45 per cent throughthe use of supercritical steam conditions. Thisimproves fuel efficiency and effective cleaningof flue gases.
Coal's Role in India's Energy Needs
7.3.95 Coal remains India's principal source formeeting its primary and secondary commercialenergy requirements. Of the 1,04,917.50 MW ofoverall installed power generation capacity in the
country (as on 31 March 2002), about 59,386MW is coal based and 2,745 MW is lignite based,totaling to 62,131 MW or 59 per cent. In the1970s,the coal sector was nationalised and emphasiswas laid on coal-based thermal power generationas the backbone of India's energy economy. Inthe past two decades, coal consumption grew atan annual rate of 5.7 per cent while coalproduction has grown at 5.1 per cent annually. In2000-01, coal production touched 313 mt (ofwhich about 96 per cent is from public sector)from 114 mt in 1980-81 and lignite productionreached 24.25 mt from 5.11 mt over the sameperiod.
7.3.96 Indigenous coal is likely to remain themost stable and least cost option for the bulk ofIndia's energy needs in the foreseeable future.This is so because coal based thermal powergeneration capacity has a shorter gestationperiod and lower specific investment costs whencompared to other locally available commercialenergy resources like nuclear or hydropower.Thus, there is need for concerted efforts for theoverall development of the sector in future Plans.Energy security concerns underscore the needto further develop indigenous coal production inthe foreseeable future.
ROLE OF COAL IN WORLD ENERGY
l Around 38 per cent of total world electricitygeneration is based on coal. In 1999,Indian coal’s share in electricity generationwas around 70 per cent against 56 percent in the case of United States, 80 percent in the case of China, 84 per cent inthe case of Australia, 90 per cent in thecase of South Africa, 51 per cent in thecase of Germany and Poland at 96 percent. Also, coal is a key input for the steeland cement industries.
l Coal will continue to play a key role in thefuture global energy demand.
l Indigenous coal will be the most stable andeconomical option for the bulk of India’senergy needs in the foreseeable future.
ENERGY
779
REVIEW OF NINTH PLAN
7.3.97 The Ninth Plan envisaged augmentingdomestic coal production with a long-termperspective in view of the sharply increasingdemand for the power sector through improvedproductivity, capacity utilisation, technologyadaptation, simplified project clearance procedures,improved project implementation, exploration,conservation etc. An important area of concern
related to restructuring the coal sector andfacilitating private sector participation in commercialcoal mining through necessary legislativeamendments. The Plan laid emphasis on clean coaltechnologies, science and technology in the coalindustry, development of CBM resources, andaugmentation of port and rail infrastructure facilitiesfor improved coal movement and development oflignite resources.
Ninth Plan Success Stories in the Coal Sector
l A total of 24 billion tonnes (bt) of incremental coal reserves and 25 bt of incremental lignite reserveshave been established through regional/promotional exploration during the Plan.
l Forty-seven new projects for a coal production capacity of 21.62 mt and one new lignite project fora production capacity of 3 mtpa have been sanctioned during the Plan.
l The incremental coal production during the Plan has been about 36 mt.
l The incremental coal consumption during the Plan has been about 53 mt.
l The incremental coal-based generation during the Plan has been 77.67 billion units (bu).
l The incremental lignite production from Neyveli Lignite Corporation (NLC) during the Plan hasbeen 1.05 mt.
l The incremental gross generation from NLC during the Plan has been 1.75 bu.
l The overall productivity in terms of Output per Manshift (OMS) increased from 1.86 tonne to 2.44tonne in Coal India Ltd (CIL) and 1.34 tonne to 1.55 tonne in Singareni Collieries Company Ltd(SCCL) during the Plan.
l A voluntary retirement scheme (VRS) was introduced for rationalising manpower. A total of 37,380employees availed VRS in Eastern Coalfields Ltd, Bharat Coking Coal Ltd, and Central CoalfiedsLtd during the Plan and the funds were provided through the National Renewal Fund/domesticbudgetary support.
l Under clean coal technologies, a demonstration project on Coal Bed Methane (CBM) extractionand utilisation has been taken up under coal sector S&T grants and UNDP/GEF funding.
l With deregulation of prices of remaining grades of coal with effect from 1 January 2000, the pricesof all grades of coal stand decontrolled.
l Based on the recommendations of High Level Committee to look into the problems of subsidenceand fire in Raniganj and Jharia coalfields, a Plan scheme, Rehabilitation, Control of Fire andSubsidence in Jharia and Raniganj Coalfields has been taken up for mitigation measures.
l In order to upgrade the proved coal reserves, particularly in the blocks outside the CIL commandarea, and to reduce time lag between allotment of coal mining blocks to the private entrepreneursand the coal mining operations, a Plan scheme, Detailed Drilling in Non-CIL Blocks has been takenup with budgetary support. About 2 bt of coal reserves have been established under this scheme.
l The Government has allowed securitisation of outstanding coal and power sale dues from SEBs tocoal companies. This is expected to yield results in the Tenth Plan.
TENTH FIVE YEAR PLAN 2002-07
780
Coal Demand
7.3.98 Sluggish economic growth and non-materialisation of new coal based thermal powergeneration capacity in the first two years of the NinthPlan has adversely affected coal demand. Coalconsumption registered a marginal growth of 2 percent during this period against the initially envisagedannual demand growth of 6.85 per cent in the NinthPlan. Thus, during the Mid-Term Appraisal of theNinth Plan, coal demand in the terminal year of thePlan was revised downwards from 412.20 mt to370.80 mt of raw coal implying an average annualcompounded growth of 4.6 per cent. However, theanticipated coal consumption of 348.43 mt(excluding 4.93 mt of washery middlings) in 2001-02 would imply a growth of only 3.32 per cent perannum in coal consumption against the revisedNinth Plan target of 4.6 per cent. This shortfall hasbeen mainly due to a 49 per cent slippage in additionof coal-based power generation capacity. As againsta target of 15,102 MW of incremental coal-basedgeneration capacity, only 7,680 MW (51 per cent)has been realised during the Ninth Plan.
7.3.99 Unlike earlier Plans, where the coal offtakemainly got affected due to transportation constraints,in the Ninth Plan, it was mainly affected due tofinancial constraints of state electricity boards(SEBs). The SEBs did not lift the linked quantitiesentirely and did not maintain the stipulated normsfor stocks at thermal power stations. Despite theslower growth in coal offtake by power plants, coal-based generation registered a growth of 5.2 percent during the Ninth Plan as a result of improvedplant performance. Offtake was also adverselyaffected because of import of non-coking coal bycement producers and coastal power plants. Suchimports became economical due to high railwayfreights for coal and incentives for cement exports.Besides, import of coking coal by the steel sectorincreased from 9.45 mt at the beginning of the NinthPlan to about 11 mt in the terminal year because ofthe lack of local coal supplies to meet the demand.
Coal Production
7.3.100 The slump in coal offtake had its effect oncoal production, which also suffered. The coalcompanies resorted to matching production to the
offtake to avoid piling up of pithead stocks. This, inturn, has necessitated downward revision of the coalproduction target in the terminal year of the NinthPlan from 370.60 mt to 328.86 mt, implying anaverage annual compound growth of 2.86 per centagainst the envisaged growth of 5.3 per cent. Theanticipated coal production of 325.65 mt in 2001-02 implies an average annual compound growth of2.4 per cent. It is to be noted that the anticipatedcoal production comprises of 4.10 mt from privatesector mines in Meghalaya, which was notconsidered at the time of the formulation of the NinthPlan.
7.3.101 Against an incremental coal production of56.37 mt achieved in the Eighth Plan, theincremental coal production envisaged in the NinthPlan was 84.94 mt. Of this, 60.04 mt was to comefrom new projects of PSUs [Coal India Ltd. (CIL)-55.71 mt and Singareni Collieries Co. Ltd. (SCCL)-4.33 mt] and 13 mt from new captive blocks. Asagainst this, the anticipated incremental coalproduction during the Ninth Plan was only 36.36mt. The capacity of the new projects sanctioned byCIL and SCCL till December 2000 was only 19.32mt (CIL-17.06 mt; SCCL-2.26 mt). Production fromthe captive blocks yielded only 4 mt.
7.3.102 This slow rate of capacity addition is likelyto affect the coal availability in the medium and longterm. This shortfall is likely to become more acuteas the gestation period for a coalmine isconsiderably longer than a power plant. Urgentsteps are needed to develop all projects identifiedin the Ninth Plan and to invite private sectorparticipation. Coal companies are reluctant to makeinvestments in new projects in the absence of firmfuel supply agreements (FSAs). Augmentation ofcoal production capacity to meet the coal demandin the Tenth Plan and beyond is expected to beseriously impacted in the absence of immediatecorrective actions.
4.5.103 The Ninth Plan physical and financialperformance is given in Table- 7.3.11.
Ninth Plan At A Glance
l Lower than expected economic growth andnon-materialisation of new coal-based
ENERGY
781
power generation capacity affected coalofftake and coal production.
l The slow rate of coal capacity additionduring the Plan will adversely affect thedomestic coal availability in case the coaldemand for power picks up in the TenthPlan and beyond.
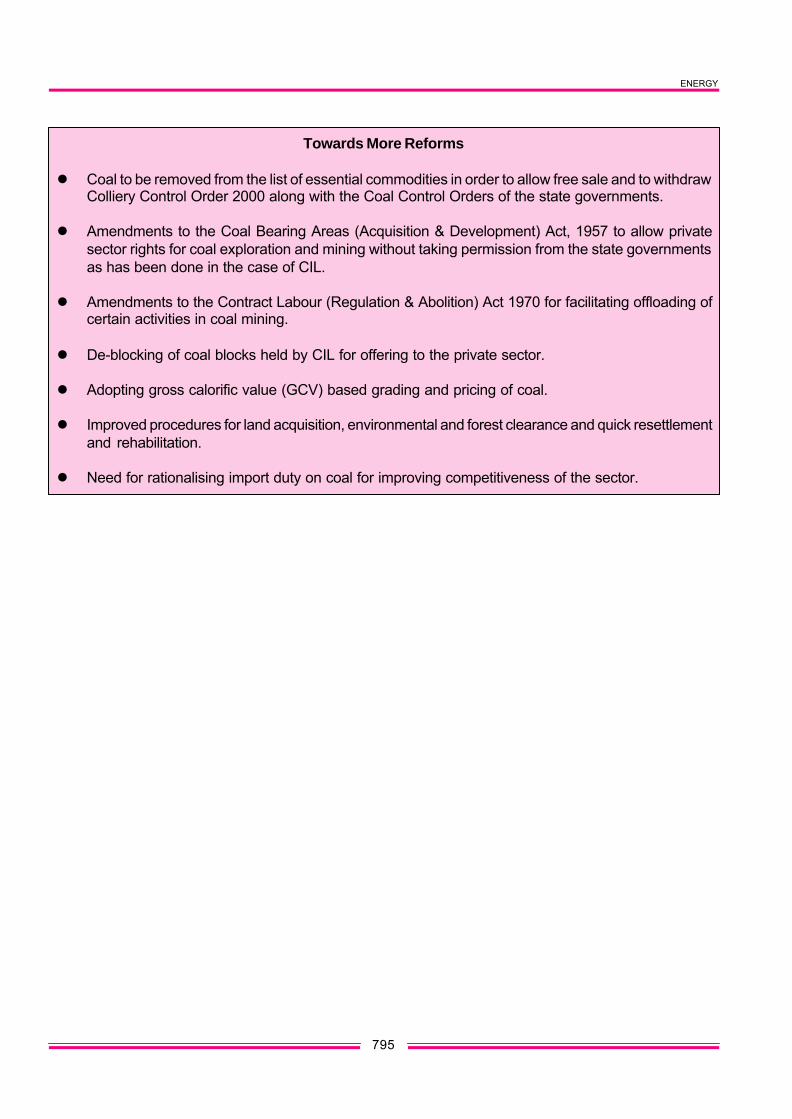
l The Bill to amend the Coal Mines(Nationalisation) Act, 1973 allowing privatesector in commercial coal mining is yet tobe approved.
l The setting up of a regulatory authority andallocation of coal blocks for exploration andexploitation has not taken place.
l Restructuring of CIL as envisaged has notbeen done.
l Though decontrol of coal prices hasimproved the financial health of the coal
companies, the revival of loss-making coalcompanies has not taken place.
l Voluntary retirement scheme is beingimplemented in loss-making coalcompanies for rationalising the manpowerand to improve their financial health.
l Detailed exploration in non-CIL blocks hasbeen taken up to upgrade proven coalreserves.
l The extractable coal reserves stand at 18bt only (21 per cent of the proved reservesof about 84 bt).
l Import dependence for coking coal in thecase of steel sector is on increase, asthe domestic supplies are not improving.Further, imports of non-coking coal arealso on the rise, particularly in coastalregions, due to high domestic freightrates.
Table-7.3.11Ninth Plan Physical & Financial Performance
Parameter Ninth Plan (2001-02) % ACGROriginal Mid- Annual Antici- Original Mid- Antici
Term Plan pated Term patedAppraisal Target Appraisal
Coal Production (mt) 370.60 328.86 322.73 325.65 5.34 2.86 2.40
Lignite Production (mt)
NLC 22.00 22.00 17.50 17.50 4.90 4.90 0.17
GMDC 10.00 NA NA 6.55
Rajasthan 13.00 NA NA 0.25
Total: 45.00 24.30
Promotional Expl. Cumm. IX P (m) 7,75,000 7,20,000 NA 6,59,000
Detailed Drilling 3,75,000 3,63,000 NA 2,76,000Non-CIL cumm IX P (m)
II. Financial (1997-02) (Rs.Cr.)
Coal & Lignite: 17575.23 17430.74 13130.31
NLC (Power) 1866.36 1713.00 1257.41
Total DOC: 19441.59 19143.74 14387.72
Note:- NLC - Neyveli Lignite Corporation Ltd.; GMDC - Gujarat Mineral Development Corporation Ltd.
TENTH FIVE YEAR PLAN 2002-07
782
l Constraints of land acquisition,rehabilitation, forestry and environmentalclearances, etc. continue to adverselyaffect implementation of coal projects.
l Unpaid dues from SEBs continue to riseand dent the financial health of the coaland lignite companies.
l Plan expenditure suffered as a result ofshortfall in internal resource generation.
7.3.104 Presently, about 57 per cent of the totalcoking coal produced in the country is being usedfor metallurgical purposes and the rest for powerand other industrial purposes. Though coking coalis meant for use in metallurgical purposes, the lowutilisation of available production in India is becauseof the poor quality of the coal, which is noteconomical to wash. The existing coking coalwasheries were designed to beneficiate coking coalof relatively easy to moderately difficult washabilitycharacteristics. Increased production from lowerseams containing poor quality coal, increasedproduction from mechanised opencast mines andincreased proportion of fines below 0.5 mm with noproper facilities to process and handle are comingin the way of the performance of coking coalwasheries.
7.3.105 The ash percentage in the washed cokingcoal is being maintained in the range of 18-20 percent. The yield of washeries has deterioratedconsiderably declining from 51 per cent in thebeginning of the Ninth Plan to about 43 per cent atthe end of the Plan period. Against a planned supplyof 12.26 mt of washed coking coal from CIL sources,the anticipated supply is only 5.19 mt. Some of thecoking coal washeries of CIL have been convertedfor washing non-coking coal, but the results havebeen mixed and technical problems persist.Washeries have thus remained uneconomical.
7.3.106 The Ninth Plan laid emphasis onbeneficiation of non-coking coal for supply to powerplants located beyond 700 km from pitheads. Coalbeneficiation was also emphasised to comply withthe directive of the Ministry of Environment andForests mandating use of coal containing not morethan 34 per cent ash in thermal power stations
located 1,000 km from pitheads and those locatedin urban/sensitive/critically polluted areas,irrespective of their distance except the pitheadplants. According to estimates by the Joint ApexCommittee constituted by the Ministry of Power toconsider the various aspects relating to the directiveof the Ministry of Environment and Forests, about90 mt is the requirement projected for such stations.However, the available capacity to wash non-cokingcoal in CIL is only about 10 mt from sevenwasheries. Though coal washing is open to privatesector participation, there have not been any takers.This is mainly because washeries are not permittedto sell washed coal directly to the consumers. It hasbeen proposed to supply blended coal to maintain34 per cent ash level but even this is not happening.The need to create additional capacity for washingand coal beneficiation continues.
Demand Supply Gap
7.3.107 The assessed raw coal demand of 354.29mt in 2001-02 was proposed to be met through adomestic production of 322.73 mt, a stock drawdown of 1.5 mt from CIL and import of 15.97 mt ofcoking coal for steel. This left a gap of 14.09 mt,which was proposed to be met from CIL and SCCLshould the demand pick up. As against this, theanticipated coal consumption/offtake of 348.43 mtin 2001-02 is proposed to be met through domesticproduction of 325.65 mt, likely coking coal importsof 10.80 mt with the balance being met throughimport of non-coking coal and stock draw down fromCIL.
Productivity
7.3.108 To improve the overall productivity of menand machinery certain steps like rationalisation ofmanpower through implementation of voluntaryretirement scheme (VRS), decommissioning ofuneconomic mines, prioritising the investmentprogramme, improving the utilisation of capitalintensive heavy earth moving machinery (HEMM),etc have been taken up during the Ninth Plan. As aresult, the overall productivity in CIL and SCCL,which was standing at 1.86 t [under ground (UG) -0.57 t; open cast (OC) - 5.12 t] and 1.34 t (UG -0.72 t; OC - 6.25 t) at the beginning of the NinthPlan has improved to 2.44 t (UG - 0.66 t; OC - 6.41
ENERGY
783
t) and 1.55 t (UG - 0.81 t; OC - 7.00 t) respectively.The improvement in output per manshift (OMS) isprimarily the result of improvements at opencastmines. The underground mines productivity needsto be further improved. In the case of HEMM, thenorms prescribed earlier by the Central MinePlanning and Design Institute Ltd. (CMPDIL) areunder review by a Committee of the Department ofCoal whose report is awaited.
Lignite
7.3.109 The Ninth Plan laid emphasis on lignitedevelopment in the country. An incremental lignite-based generation capacity of 995 MW wasenvisaged in the beginning of the Plan. As againstthis, 535 MW (54 per cent) has been realised. Inthe Neyveli Lignite Corporation (NLC), a ligniteproduction capacity of 4 mtpa through expansionof the existing Mine-I project for supplying lignite tothe 2x210 MW TPS-I Expansion project has nearlybeen achieved and a new project, namely, Mine-1Afor a capacity of 3 mtpa for supplying lignite to anindependent power project of 250 MW has beentaken up. The estimated demand for lignite in theterminal year of the Ninth Plan was 54.44 mt (TamilNadu 28.99 mt; Gujarat 9.50 mt; Rajasthan 14.90mt; and other states 1.05 mt) with a correspondingproduction of 45 mt (NLC-22 mt; GMDC-10 mt;Rajasthan-13 mt). The anticipated lignite productionfrom NLC in 2001-02 is 17.5 mt. The GMDC hasachieved a production of 5.82 mt (2000-01) whereasthe lignite production from Rajasthan has not takenoff and is hovering around 0.25 mt only.
Exploration
7.3.110 Reserves of coal are classified into threecategories, namely, 'proved', 'indicated' and'inferred'. `Regional exploration' is carried out formaking a general assessment of the 'geologicalresources' of coal under the 'inferred' and 'indicated'categories. Following the regional exploration,`detailed exploration' is carried out by the coalcompanies for upgradation of coal reserves into the'proved' category by accurately delineating thegeometry of coal seams and determining the qualityor grade of coal in potential coal blocks. Based onthe findings of detailed exploration, detailedgeological reports and project reports for coalmines
are formulated. The Geological Survey of India(GSI), under the Department of Mines, carries outregional exploration from its own funds.
7.3.111 The GSI is not in a position to allocatesufficient funds for regional exploration for coal andlignite. In order to accelerate the pace of regionalexploration, the subsequent detailed exploration fordesigning projects to exploit coal reserves to meetthe demand for coal during the Seventh Plan andafter, the Planning Commission set up a separatefund under a plan scheme, 'Regional/PromotionalExploration' within the budget of the Department ofCoal, in 1989-90. The fund was initially for SCCLareas only, and was subsequently extended to CILand NLC areas from 1991. The execution ofexploration work was initially undertaken by MineralExploration Corporation Ltd. (MECL) and wasextended to GSI from 1992-93. From September1999, CMPDIL has also been inducted as the thirdagency for promotional exploration for coal.
7.3.112 CIL and CMPDIL have identified the blocksretained by CIL as 'CIL Blocks' and those not to beretained by CIL as 'Non-CIL Blocks'. Until 1997-98,the CIL's subsidiaries were funding detailedexploration in all the blocks. Due to paucity of funds,the coal companies are not willing to fund thedetailed drilling in non-CIL blocks. Therefore, it wasdecided to fund this activity through budgetarysupport in order to reduce the time lag betweenallotment of mining blocks to private entrepreneursand coal mining operations and thus to reduce thegap between the demand and availability of coal.The Ninth Plan exploration programme is given inTable-7.3.12.
7.3.113 As against the coal reserve inventory of204.65 bt (bt) [proved - 72.73 bt; indicated - 89.84bt; inferred - 42.08 bt] at the beginning of theNinth Plan, the reserves of coal as on 1 January2001 stand at 220.98 bt [proved - 84.4 bt or 38per cent of total reserves); indicated - 98.5 bt (45per cent); inferred - 38.00 bt (17 per cent)]. Ofthe 84.4 bt of proved coal reserves, the estimatedextractable reserves are 17.96 bt (21 per cent)only. Similarly, the reserves of lignite in thecountry as on 1 January 2001 are estimated tobe 34.61 bt against 27.45 bt during the beginningof the Ninth Plan.
TENTH FIVE YEAR PLAN 2002-07
784
Project Implementation
7.3.114 Of the initially targeted coal productionof 350 mt from the coal PSUs in the Ninth Plan,60.04 mt was to come from new projects (CIL55.71 mt; SCCL 4.33 mt) and the balance fromexisting mines and ongoing projects. A review ofthe actual performance reveals that a capacityof only 21.62 mt in new projects has beensanctioned in CIL and SCCL till December 2001.The production from captive blocks has been 4mt against a target of 13 mt. This rate of capacityaddition would affect coal availability in the TenthPlan period and beyond. Land acquisition,forestry clearance, rehabilitation, equipmentsupplies, availability of funds, inadequategeological studies, improper project formulation,etc. continue to delay the implementation of coalprojects, de-ration of capacity of some projectsand some foreclosures. The decision of theDepartment of Coal to only undertake projectsyielding an internal rate of return (IRR) of 16 percent or more has also affected a number oftechnically viable coal projects. However, the
Department has reviewed this decision at the endof the Ninth Plan and lowered the IRR to 12 percent.
7.3.115 There are several instances of projects,which are formulated with low initial specificinvestments only to be revised subsequently withsignificant cost overruns and delays. While this initself is cause for concern, what is even moreworrisome are repeated instances of a third levelof revisions which essentially lower productionestimates for varying technical and non-technicalreasons resulting in even higher specific investmentcosts. This pattern appears consistently acrossprojects promoted by Eastern Coalfields Ltd. (ECL)and Bharat Coking Coal Ltd. (BCCL) and hindersproper assessment and utilisation of limitedresources. This establishes a need for reviewingproject formulation practices of the coal companies.
7.3.116 The problems of mutation and transfer ofland by state governments need to be addressedin the right perspective for meaningfulimplementation of coal projects. Similarly, grant/
Table-7.3.12Ninth Plan Exploration Programme
Type of Agency Ninth Plan Drilling Programme Reserves EstablishedExploration Target Anticipated (billion tonnes)
IV. Detailed Drilling CIL Areas Coal 13.5 8.04 20.02
SCCL Areas Coal 2.80 1.68 0.826
Others Coal 2.50 0.16 -
Sub-Total: Coal 18.80 9.88 20.85
ENERGY
785
renewal of lease by state governments also neededto be speeded up to reduce delays in the case ofnew projects. In spite of several recommendationsthat a single window system with specific timeframes needs to be established for environmentaland forestry clearances, it takes unduly long timefor new projects to get clearances. Further, chargingof the `expectation value' towards forest land bythe state governments is becoming a hurdle inproject implementation and coal companies arebeing made to pay huge amounts in this regardadding to the cost of the projects over and abovethe cost of afforestation.
Movement
7.3.117 The movement of raw coal and coalproducts by rail from CIL and SCCL has increasedfrom 165.07 mt (59 per cent of the total coal offtake)in 1996-97 to 181.33 mt (58 per cent of the totalcoal offtake) in 2001-02. The component of merrygo round (MGR) movement has increased from61.54 mt (22 per cent of the total coal offtake) inthe beginning of the Ninth Plan to 77.76 mt (24.9per cent of the total offtake) in the terminal year.Movement of coal by road in the beginning of thePlan was 50.90 mt (18.16 per cent of the total coalofftake) and has increased to 53.6 mt (17.2 per centof the total coal offtake). Coastal shipment of coalhas increased from 11.58 mt (4.1 per cent of thetotal coal offtake) in 1996-97 to 16.52 mt (5.3 percent of the total coal offtake) in 2001-02.
7.3.118 The Ninth Plan identified certain critical raillinks in potential coalfields and the Railways havetaken up most of these for implementation. It wasenvisaged to strengthen the port infrastructuralfacilities in the Ninth Plan for facilitating coal imports.The capacity of coal handling at ports has increasedfrom 8 mt at the beginning of the Ninth Plan to 44mt in the terminal year.
Science And Technology
7.3.119 Though research and development (R&D)has been a thrust area in the Ninth Plan, not muchof progress has taken place in this regard in thecoal sector. As a result, the outlays providedremained largely unutilised. However, two importantprojects, namely, CBM extraction in collaboration
with the UNDP and GEF and washing of low volatilemedium coking coal have been taken up fordemonstration under the coal sector science andtechnology grants.
Environmental Measures
7.3.120 The Ninth Plan had proposed a renewedthrust on improving the environmental conditionsin coal mining areas, particularly, to tackle fire andsubsidence problems in the Jharia and Raniganjcoalfields in Jharkhand and West Bengalrespectively. As per the recommendations of a highpowered committee of the Government of India, theDepartment of Coal has formulated a Master Planunder which a scheme 'Rehabilitation, Control ofFire and Subsidence in Jharia and RaniganjCoalfields' has been taken up for phasedimplementation.
Coal Bed Methane (CBM)
7.3.121 CBM is emerging as a new source ofcommercial energy in the country and a potentialof about 1,000 billion cum of CBM is estimated. TheNinth Plan laid emphasis on the exploration andexploitation of CBM. The policy for exploration andexploitation of CBM was approved in July 1997 andsteps taken to exploit CBM by awarding blocks toprivate parties. Further, a few companies haveattempted pilot testing for CBM in the country. TheONGC has been working on CBM exploration as aresearch and development project since 1994 andhas drilled six experimental wells - two in Durgapurin West Bengal and four in Jharia. The ONGC hasbeen given a block in the North Raniganj area forCBM exploration on nomination basis. TheGovernment has also approved exploration andexploitation of CBM in the Raniganj area by theGreat Eastern Energy Corporation Ltd. OIL has alsobeen awarded a block on nomination basis.
7.3.122 Further, in September 1999, theGovernment approved a demonstration project`Coalbed Methane Recovery and CommercialUtilisation' under the science and technology planof the Department of Coal. The project is beingjointly funded by the GEF/UNDP and theGovernment of India. The duration of the project isfive years and it is being implemented mainly by
TENTH FIVE YEAR PLAN 2002-07
786
CMDPIL with BCCL as the co-implementing agencyon behalf of the Department. The project sites areMoonidih and Sudamdih mines in BCCL in Jhariacoalfield.
Policy Measures
7.3.123 During the Ninth Plan, therecommendations of the Committee on 'IntegratedCoal Policy', 1996 were implemented by theGovernment. Coal prices have been deregulatedand the Coal Mines (Nationalisation) AmendmentBill, 2000 for permitting private sector in commercialcoal mining is before the Parliament. However,implementation of the other recommendations withregard to setting up of an independent body forallocation of coal blocks for exploration and mining,establishing a regulatory authority etc. arecontingent on the enactment of the Bill.
7.3.124 The Ninth Plan laid emphasis on makingthe coal sector competitive by restructuring the coalPSUs. It was proposed to give them more autonomyand to do away with the holding company structure.The capital restructuring of both CIL and SCCL wasdone at the beginning of the Ninth Plan and againduring the Ninth Plan. Some coal PSUs have startedposting profits and paying taxes and dividends tothe Government. However, some inherently sickcoal companies like ECL and BCCL could not berevived and are currently before the Bureau ofIndustrial and Financial Reconstruction (BIFR).More importantly, rationalisation of manpower hasbeen taken up by implementing the VRS in thesecoal companies. Of late, Central Coalfields Ltd.(CCL) has also started posting losses and the VRShas been extended to it as well. The proposal ofdoing away with the holding company structure hasnot been implemented in this case.
7.3.125 Unlike the earlier Plans, the Ninth Planstarted with a focus on reforms in the coal sector inline with the other sub-sectors of the energy sector.However, the delay in passing the Coal Mines(Nationalisation) Amendment Bill has negated theenvisaged benefits of private participation incommercial coal mining. During the Plan period,coal producers and consumers have startedentering into commercial coal supply agreementsand a cash and carry system of coal trade has
emerged. The prices of all grades of coal aredecontrolled and coal PSUs have been empoweredto fix the price of coal. However, in view of the factthat coal still remains under the EssentialCommodities Act, selling of coal by private partiesis not permitted. Coal imports have been kept underOGL and import duties have been significantlypruned in the Ninth Plan. The royalty rate on lignitehas been revised. Plans for reviving loss-makingcoal companies have been initiated andrationalisation of manpower is being done. TheGovernment has amended the 1979 Mining Policyfor Coal, which confined coal-bearing states tomining only non-coking coal in isolated patches.State governments can now mine either coking ornon-coking coals through their undertakings/companies on par with CIL.
Towards Reforms
During the Eighth Plan–l Private sector was allowed in captive coal
mining.l Coal was put on OGL and import duties
reduced significantly.l Financial restructuring of coal PSUs took
place for strengthening financial health anddoing away with budgetary support.
l Switching over to fuel supply agreements(FSAs) between coal companies andconsumers started.
l Partial disinvestment of NLC done.l FDI permitted in coal mining.During the Ninth Plan –l Coal prices decontrolled totally from 1
January 2000.l VRS introduced for rationalising manpower.l Removal of overburden by hired HEMM in
opencast mining projects taken up.l The 1979 Mining Policy for coal and lignite
was replaced. State governments of coalbearing states are now allowed to mine bothcoking and non-coking coal without anyrestriction through their undertakings/companies on par with Coal India Ltd.
l Joint ventures are permitted for coal projects.l Equipment manufacturers are involved in
7.3.126 The approved Ninth Plan outlay for coaland lignite was Rs.17,575.23 crore excludingRs.1,866.36 crore for the power component of NLC.However, during the Mid-Term Appraisal of the NinthPlan, it was revised to Rs.17,430.74 crore for coaland lignite and Rs.1,713 crore for NLC (Power).This included enhanced outlays for the Regional/Promotional Exploration scheme and DetailedDrilling in Non-CIL Blocks scheme. The outlay forVRS was also included in this as it was taken out ofNational Renewal Fund (NRF). The outlays of CILand SCCL have been revised downwards due toreduction in the coal production targets and thecapital restructuring package of SCCL, whichenvisaged recourse to offloading of overburdenremoval operations in their open cast mines insteadof doing the same by procuring HEMMdepartmentally. As a result, the capital cost of themajor ongoing open cast projects has gone downsignificantly, bringing down the overall outlay ofSCCL. The outlay for NLC (Mines) has slightlyincreased due to the committed expenditure forMine-1A and expansion projects of Mine-I and TPS-I. On the whole, the anticipated Plan expenditureof coal and lignite is about 74 per cent of the Planoutlay and that of NLC (Power) is about 67 per cent.
7.3.127 CIL was not provided any domesticbudgetary support from the beginning of the Planas per the capital restructuring package. SCCL hasalso stopped getting domestic budgetary supportfrom 2001-02 onwards consequent to its capitalrestructuring. CIL funded its investments mainlythrough their internal resources, a World Bank loanfor the Coal Sector Rehabilitation Project (CSRP)and other extra budgetary resources. However, theWorld Bank loan was discontinued after availingpart of it under Phase-I. NLC was provided domesticbudgetary support for implementing the Mine-1Aproject, which is linked to an independent powerproject. Other schemes of the coal sector, whichwere exclusively supported through domesticbudgetary support are Regional/PromotionalExploration, Science and Technology,Environmental Measures and Subsidence Control,Detailed Drilling in non-CIL Blocks, RehabilitationProject, IT and VRS. The scheme of RegulatoryFramework Review Project was taken up through
World Bank aid as a precondition for availing CSRPloan and has been completed.
APPROACH TO THE TENTH PLAN
7.3.128 Since coal will continue to remain theprincipal source of commercial energy in the countryfor the foreseeable future, all out efforts are neededfor rapid development of coal resources. Asubstantial expansion in domestic coal productionwill be needed if the power sector is to expand tosupport the targeted 8 per cent GDP growth. Sincethe gestation period of a coal mine is considerablylonger than that of power plants, planning for coalproduction should not only keep in mind therequirements of the Tenth Plan but also future Plans.In view of the significant role of coal in the energysecurity net of the country, it is important to bringout a long-term vision i.e. 'Vision 2025' for properdevelopment of the coal sector. Approval of the CoalMines (Nationalisation) Amendment Bill, 2000 byParliament will expedite the reform process in thecoal sector and help attract private investment inthis area. Simultaneously, it is important to amendcertain provisions of other statutes to overcome thehurdles in the way of private mining in notified tribalareas. The procedures for environmental clearancealso need to be greatly simplified so that potentialprivate investors have to deal with clear andtransparent rules. Similarly, amendments to labourlaws are equally important to offload certain miningactivities.
Coal Demand
7.3.129 As against the anticipated coal offtake/consumption of 348.43 mt of raw coal excluding4.93 mt of washery middlings during the terminalyear of the Ninth Plan, the demand in the terminalyear of the Tenth Plan has been estimated at 448.05mt excluding 5.24 mt of middlings. The estimatehas been worked out after discussions with majorconsuming sectors and with reference to theprojected coal-based thermal generation capacityaddition programme of 19,565 MW of the overallcapacity addition programme of 46,565 MWenvisaged in the Tenth Plan by the Ministry of Power.However, the Planning Commission has reviewedthe situation and on the basis of most likely capacityaddition, the overall capacity addition has been
TENTH FIVE YEAR PLAN 2002-07
788
revised downwards to 41,110 MW of which thecoal-based capacity addition is envisaged to be18,308 MW. Accordingly, the coal demand in 2006-07 has been revised to 460.50 mt excluding 5.24mt of washery middlings. This implies a compoundannual growth rate of 5.73 per cent for coal demandin the Tenth Plan against an anticipated growth of3.32 per cent during the Ninth Plan. Of this
estimated demand, 37.21 mt (8.1 per cent) is ofcoking coal for the steel sector and 423.29 mt (91.9per cent) is of non-coking coal. Sixty-nine percentof the total estimated demand is for power sectorutilities, 5.3 per cent for the cement sector, 6 percent for captive power and the remaining 11.6 percent is for other sectors. The sector-wise details ofcoal demand/offtake are given in Annexure-7.3.2.
Tenth Plan Thrust Areas
l Continuation of the reform process and facilitating private sector participation in commercial coalmining with a view to gaining access to latest technologies for coal exploration, production andutilisation and to raise competitiveness through competition.
l Restructuring of the coal sector by providing more autonomy to individual coal-producing companiesfor making them viable and enhancing their competitiveness.
l Setting up of a regulatory authority for resolving disputes and allocation of coal blocks both forexploration and exploitation.
l Rationalisation of rail freight rates for coal movement.
l Need for rationalising import duty on coal for improving competitiveness of the sector.
l Setting up a mechanism for expeditious clearance of dues from SEBs for improving the financialhealth of coal PSUs.
l Augmentation of the coal production capacity to meet the projected demand of the power sector inparticular and other end use sectors in general.
l Intensification of exploration and upgradation of coal reserves to the proven and recoverable categoryin the context of the energy security.
l Improvement of environmental aspects and promotion of clean coal technologies – beneficiation ofnon-coking coal for power generation; development of CBM; carbon dioxide sequestration; coalgasification; integrated gas combined cycle (IGCC) and fluidised bed combustion (FBC) route ofpower generation, development of slurry transportation, etc.
l Promoting washed coking coal with the adoption of better technologies and making domesticproducts competitive for the steel sector with a view to reducing import dependence.
l Development of port and rail infrastructure for coal movement and reducing dependence on roadtransportation and promoting other modes of coal transportation.
l Rapid development and utilisation of lignite resources both for power generation and industrialpurposes.
l Development of in-house research and development.
l Need for improving productivity and capacity utilisation.
l Pricing and grading of coal on gross calorific value (GCV).
ENERGY
789
7.3.130 The estimated demand for power isrelated to an incremental coal-based thermal powergeneration capacity addition programme of 18,308MW and a coal-based generation programme of452 billion units (BU) in 2006-07. Similarly, theestimated coal demand for captive powerconsidered a capacity of 8,671 MW. Coal demandfor steel is related to a hot metal productionprogramme of 25.59 mt in 2006-07. The envisageddemand for cement is related to a cementproduction programme of 153.5 mt in 2006-07.
7.3.131 However, the estimated coal demand forpower sector utilities will depend on variousclearances for new power projects by the end of2002-03, finalisation of fuel supply agreements withcoal companies and achievement of financialclosures by the proposed new power plants.
Coal Production
7.3.132 The coal production target in 2006-07 isset at 405 mt against an anticipated production of325.65 mt in 2001-02 implying annual compoundgrowth of 4.46 per cent in the Tenth Plan against2.4 per cent likely to be achieved during the NinthPlan. This comprises 350 mt from CIL, 36.13 mtfrom SCCL, 5.24 mt from Tata Iron and Steel Co.(TISCO now renamed Tata Steel), 2.4 mt from PSUslike Indian Iron and Steel Co. (IISCO), DamodarValley Corporation (DVC), Bihar State MineralDevelopment Corporation Ltd. (BSMDCL) etc., 6.73mt from captive block holders and 4.5 mt from theprivate sector in Meghalaya. The incremental coalproduction in the Tenth Plan is 79.35 mt against39.56 mt in the Ninth Plan. This comprises of 71 mtfrom CIL, 5.13 mt from SCCL and 3.22 mt fromothers. Of CIL's 71 mt, the major incrementalcontribution is from South Eastern Coalfields Ltd.(SECL) - 21.55 mt, Mahanadi Coalfields Ltd. (MCL)
- 21.5 mt, Northern Coalfields Ltd. (NCL) - 8.5 mtand Central Coalfields Ltd. (CCL) - 10.3 mt. Thecategory-wise coal production is given in Table-7.3.13.
7.3.133 Of the envisaged total coal production of386.13 mt from CIL and SCCL, 83.12 mt (CIL 79.11mt; SCCL 4.01 mt) or 22 per cent is to come fromnew mines to be taken up in the Tenth Plan (CILwill have 98 projects for a total capacity of 197.40mt and with an estimated capital investment ofRs.23,159.24 crore while SCCL will implement 17projects for a capacity of 4.13 mt and a capitalinvestment of Rs.2,116.96 crore). Unless theseprojects come up, it will be difficult to meet therequirements from domestic sources and thepreparedness of the coal companies in meeting thistarget needs to be ascertained. However, it will beprudent to concentrate on such projects whereaugmentation of coal production is feasible bymeans of marginal investments and within a shortergestation period with the use of existinginfrastructural facilities. The contribution fromcaptive blocks is only 2 per cent of the total targetedproduction of 405 mt. This shows there is an urgentneed to encourage private participation foraugmenting coal production from domestic sources.
7.3.134 The share of underground and open castproduction in CIL works out to 17 per cent and 83per cent respectively and 46 per cent and 54 percent respectively in the case of SCCL. Of CIL'sprojected underground production of 60.65 mt, 4.97mt is from mechanised longwall faces and 34.13mt from mechanised bord and pillar (B&P) workings.In SCCL, of the total 16.76 mt of projectedunderground production, 2.54 mt is planned frommechanised longwall faces and 3.12 mt frommechanised B&P workings. Although, the reservesamenable to open cast mining are being targeted
Table-7.3.13Categorywise Coal Production (million tonnes)
Category CIL SCCL TISCO/IISCO/DVC Captive Blocks Meghalaya Total
Existing 25.50 3.87 7.55 4.00 4.10 45.02
Completed 200.81 19.03 - - - 219.84
Ongoing 44.59 9.22 - - - 53.81
New 79.11 4.01 0.09 2.73 0.40 86.34
TOTAL: 350.00 36.13 7.64 6.73 4.50 405.00
TENTH FIVE YEAR PLAN 2002-07
790
due to low cost of production, quality concerns aregetting diluted. Open cast mines lead to degradationof the environment compared to underground minesand are not sustainable in the long run. The globaltrend is to opt for highly mechanised undergroundmines with economies of scale. In the long run,considering depletion of reserves amenable to opencast mining, environmental and qualityconsiderations, economies of scale etc., coalcompanies need to plan for a suitable mix of opencast and underground mines. Coal sector policiesand regulation will need to set up the right incentivesunder a deregulated environment for movement inthis direction.
7.3.135 The production of CIL comprises 22.58 mtof coking coal (6.5 per cent of total production) and327.32 mt of non-coking coal (93.5 per cent). Ofthe non-coking coal, 36 per cent is of superior gradeand 64 per cent is of inferior grade. In absoluteterms, the projected Tenth Plan target for CILcomprises 2.97 mt of incremental coking coalproduction, 14.9 mt of incremental superior gradenon-coking coal production and 53.03 mt ofincremental inferior grade non-coking coalproduction over the 2001-02 levels. In the case ofSCCL, the projected production target comprises55 per cent of superior grade non-coking coal and45 per cent of inferior grade non-coking coal.SCCL's production of superior grade non-cokingcoal is expected to rise by 7.01 mt, while that ofinferior grade non-coking coal is expected to declineby 1.88 mt over 2001-02 production levels. Thedetails of company-wise coal production are givenin Annexure-7.3.3.
7.3.136 As against the anticipated washed cokingcoal production of 5.19 mt from CIL in 2001-02, thetarget in 2006-07 is fixed at 5.96 mt. There is direneed to stem the declining production of washedcoking coal from domestic sources by undertakingmodernisation of all the coking coal washeries andconverting them into multi-product washeries suitingthe raw coal feed and specifications of the steelsector for improved financial viability. The financialimplication of the proposed import of 20 mt of cokingcoal by the steel sector in 2006-07 at current prices(Rs. 3,000 per tonne) would be in the range of Rs.5,000 crore to Rs. 6,000 crore in foreign exchangeterms. Washing of low volatile medium coking
(LVMC) coals, as has been suggested by a numberof committees, needs serious consideration in orderto reduce import dependence of washed cokingcoal.
7.3.137 Sizing of coal has significant influence onmaintaining quality. Uniformly-sized coal is beingdelivered wherever coal washing is taking place.However, for other stations where raw coal is beingused, the size of coal being delivered is mostly (-)200 mm. It is important to consider if coal grindingcould be done at pitheads instead of the thermalpower station end to avoid transportation ofunwanted material etc. and thus improving thequality of coal being delivered in case of new thermalpower stations. Further, in order to comply with therequirement of the Ministry of Environment andForests directive relating to ash content of coal usedin power generation, a number of non-coking coalwasheries would need to be set up in the TenthPlan.
Demand Supply
7.3.138 Since the domestic coal production in2006-07 is expected to touch only 405 mt againstan estimated coal demand of 460.50 mt excluding5.24 mt of washery middlings, this will leave a gapof 55.50 mt. This is proposed to be met throughimport of 17.18 mt of coking coal for the steel sectorand 3.3 mt of non-coking coal for the cement sector,which works out to 4.4 per cent of the estimatedcoal demand, 1.2 per cent less than imports in theNinth Plan. However, that still leaves a gap of about35.02 mt.
Coal Movement
7.3.139 Against an anticipated movement of181.33 mt coal and products by rail from CIL andSCCL in 2001-02, the projected coal movement byrail in 2006-07 is 221.62 mt. This implies a wagonrequirement of 25,789 four-wheeler wagons against21,099 four-wheeler wagons in the Ninth Plan. Thisrequirement is within the overall target of railmovement of 280 mt in 2006-07 envisaged by theMinistry of Railways. The coal movement by MGRis projected at 101.05 mt in the Tenth Plan againstan anticipated movement of 77.76 mt in the NinthPlan. Similarly the movement by road is estimated
ENERGY
791
at 67.34 mt against 53.6 mt in the Ninth Plan.Coastal shipment including rail-cum-sea route isprojected to be 17.37 mt against 16.52 in the NinthPlan.
The projected requirement of power in the TenthPlan for CIL and SCCL is 1236.61 mega voltamperes (MVA).
Productivity
7.3.141 Salaries and wages comprise the singlelargest component of the unit cost of coalproduction. Unless concerted efforts are madeto improve productivity, the unit cost of productioncannot be brought down and competitivenesscannot be improved. There is a need forbenchmarking the productivity with reference tointernational standards. The targeted OMS in2006-07 for CIL is 3.55 t (UG - 0.88 t; OC - 9.25t) and for SCCL 1.77 t (UG - 0.94 t; OC - 7.31 t).Some important steps to improve productivity andthe system capacity utilisation of coal mines are:scheduled equipment maintenance programme,utilisation of skilled manpower, training personnelto handle capital-intensive equipment, offloadingcertain activities, mechanisation of UGoperations, introduction of IT-based managementinformation systems and opting higher capacityHEMM etc.
EXPLORATION
Regional Exploration
7.3.142 For regional exploration during the TenthPlan, a drilling target of 1.83 lakh metres has beenset for coal and 0.21 lakh metres for lignite, totaling2.04 lakh metres. This regional exploration workwill be carried out by GSI with funding from theDepartment of Mines. A total coal reserve of about4.90 bt is envisaged to be established under thisprogramme.
Promotional Exploration
7.3.143 For promotional exploration during theTenth Plan, a drilling target of 6 lakh metres hasbeen set comprising 3.3 lakh metres for coal and2.7 lakh metres for lignite. About 994 sq. km. areawill be covered for coal and a reserve of 6.68 bt ofcoal is planned to be established during the TenthPlan. This work will be carried out by GSI, CMPDILand MECL with funding from the Department ofCoal.
Project Implementation
l Strengthen project formulation with firm geo-mining, technological and financialresources.
l Improve procedures for land acquisition,environment, forests, resettlement andrehabilitation.
l Depletion allowance for mines needs to beinitiated.
l Financing of coal projects must be basedon the strength of the cash flows of theprojects instead of company’s balance sheet.
l Technical auditing of coal and lignitereserves.
Infrastructure
7.3.140 In order to facilitate the smooth movementof coal in the Tenth Plan, certain critical rail linksare required to be completed. These are: Talcherto Paradip, a new rail link between Korba andPendra Road (SECL), rail link of Belpahar-Sardegaand Talcher-Bimalgarh (MCL) and development ofTori-Shivpuri link in the North Karanpura Coalfieldof CCL. To overcome the constraints of railmovement and to create competition in coalsupplies, it is desirable to create new coal-basedthermal generation capacity in coastal regions ofthe country. Similarly, the envisaged coal handlingcapacity at major ports in the Tenth Plan is 67.20mt against a capacity of 48.20 mt in the Ninth Plan.This includes the Ninth Plan spillover capacity of8.00 mt and a new capacity addition of 11.00 mt.The total projected land requirement for coal miningprojects of CIL and SCCL in the Tenth Plan is 53,924hectares (Ha) comprising 35,529 Ha of non-forestland (66 per cent) and 18,395 Ha of forest land (34per cent). Availability of this land is critical forrealising the projected coal production of 83.12 mtfrom new projects of CIL and SCCL in 2006-07.
TENTH FIVE YEAR PLAN 2002-07
792
Detailed Exploration
7.3.144 The mineable coal reserves required formeeting the Tenth Plan coal production programmehave already been established. The presentprogramme of detailed drilling to be carried outduring the Tenth Plan will establish mineable coalreserves required for the coal productionprogramme beyond the Eleventh Plan. In CIL areas,the target for detailed drilling programme for theTenth Plan is set as 6.13 lakh metres and 2.7 lakhmetres in SCCL areas. It is planned to establish9.16 bt of coal in CIL areas through this. About 1.01bt of coal reserves is expected to be established inSCCL areas. For lignite, a detailed drillingprogramme of 3.69 lakh metres has been plannedfor the Tenth Plan.
Detailed Exploration in Non-CIL Areas
7.3.145 For drilling in non-CIL areas, a target of2.13 lakh metres has been set for the Tenth Planwhich will lead to the establishment of 3.58 bt ofcoal reserves. This activity was taken up to explorethe blocks away from the CIL command areas asto keep the geological reports ready for potentialentrepreneurs.
Environmental Measures
7.3.146 Maintaining the environment in coalfieldsis critical for sustaining the projected coal productionlevels. The Tenth Plan will continue to lay emphasison the implementation of environmentalmanagement measures for mitigating the adverseeffects of coal mining like land degradation, mineeffluents, sound and air pollution etc for sustainabledevelopment of coal resources. The age-oldproblems of subsidence and fires in the mined-outareas of Raniganj and Jharia have been addressedby taking up of a number of schemes underEnvironmental Measures and Subsidence Control.Besides, schemes to rehabilitate the affected miningareas and persons in these coalfields have alsobeen taken up as per the recommendations of theHigh Level Committee of the Department of Coal.It has been decided to merge these schemes duringthe Tenth Plan for effective implementation.Cooperation of state governments is necessary forthe proper implementation of these schemes.
7.3.147 The power grade coals are high in ashcontent and suitable measures need to be taken todeal with it both at the despatch end i.e. pit headand the utilisation end i.e. thermal power stations.Beneficiation of non-coking coal for powergeneration and measures for utilisation of fly ashwould mitigate the adverse effects of the same onenvironment. As various sectors are involved in thisarea, it is desirable to constitute an Inter-MinisterialGroup to look in to the aspects of fly ash utilisationin the country.
Science And Technology (Research AndDevelopment)
7.3.148 Research and development in the coalsector is carried out under four thrust areas -production, productivity and safety; coalbeneficiation; coal utilisation; and environment &ecology. Formulation of schemes of science andtechnology needs to be more application-orientedrather than remaining confined to fundamentalresearch. Close interaction between researchinstitutions and industry is critical for the scienceand technology programme to be meaningful. Thethree-pronged approach envisaged in the Ninth Plan- coal science and technology programme underthe standing scientific research committee (SSRC),in-house research and development programmesof coal companies and inter-sectoral research-technology advisory committee (IS-STAC), wouldcontinue in the Tenth Plan. The major thrust areasfor the coal science and technology programme are- coal gasification, coal washing, beneficiation oflow volatile coking coals, coal liquefaction, fluidisedbed combustion, sequestration of carbon dioxidein the control of green house gas and extraction ofCBM, etc.
Information Technology
7.3.149 Some of the important areas identified forthe use of IT in the coal sector in the Tenth Plan are- introduction of Internet/Intranet technology,development of local area networks and wide areanetworks, development of a coal net project,introduction of geological information system (GIS)in selected mines, introduction of global positioningsystem (GPS) for improving the open cast projectproductivity, etc.
ENERGY
793
Voluntary Retirement Scheme
7.3.150 This scheme was introduced in the NinthPlan for improving the financial health of loss-making coal companies by rationalising manpowerthrough budgetary support. Initially, it was startedin ECL and BCCL and was later extended to CCL.A total of 44,400 employees (ECL - 19,200, BCCL- 19,200, CCL - 6,000) were planned to be retired.Against this, 37,380 persons (85 per cent) wereretired under this scheme during the Ninth Plan.The proposed target for Tenth Plan is retirement of15,500 persons (ECL - 4,000; BCCL - 9,000; CCL -2,500).
Lignite
7.3.151 The total reserves of lignite as on 1January 2001 stood at 34.6 bt spread over thestates of Tamil Nadu and Pondicherry (87.5 percent), Rajasthan (6.9 per cent), Gujarat (4.95 percent), Jammu & Kashmir (0.37 per cent) andKerala (0.31 per cent). Some lignite occurrenceshave also been reported in Andhra Pradesh,Karnataka, Maharashtra and Orissa. Theimportance of lignite as a source of energy in thewestern and southern regions increases, as itsoccurrences are far away from the coalfields.Therefore, the development of the ligniteresources needs to be continued vigorously as itcan contribute to energy supply where rail-transported coal is difficult/expensive to bereached.
7.3.152 The projected demand of lignite in 2006-07 is 57.79 mt, of which the demand for powergeneration is 49.34 mt (85.4 per cent) and othersectors 8.45 mt (14.6 per cent). A lignite-basedthermal generation capacity addition of 1,745 MWcomprising Rajasthan Barsingsar TPS of 250MW; Gujarat KLTPS Extension 75 MW; Akrimota250 MW; Tamil Nadu-NLC TPS I Expansion 420MW; TPS-II Expansion 500 MW and STCMS(Zero Unit) 250 MW has been envisaged in theTenth Plan by the Ministry of Power. As againstthis, the projected lignite production is 55.96 mt(Tamil Nadu- NLC 27 mt, Jayamkondam 3.2 mt,Srimushnam 3.48 mt; Gujarat - 15.8 mt;Rajasthan - 6.48 mt). In NLC, it is proposed toexpand the capacity of Mine-II from 10.5 mtpa to
15 mtpa for supplying lignite to the proposedexpansion of TPS-II from 1,470 MW to 1,970 MWby adding one unit of 500 MW. Further, one newproject namely Mine-III for a lignite productioncapacity of 8 mtpa for supplying lignite to TPS-IIIof 2x500 MW has also been proposed.
Coal Bed Methane (CBM)
7.3.153 The Tenth Plan will continue to layemphasis on development of CBM in view of itsimmense potential as a domestic source of cleancommercial energy. Further, carbon dioxidesequestration has been identified as an importantarea of development in the coal sector.
Outlay And Financing
7.3.154 An overall outlay of Rs. 31,591 crore hasbeen provided for the coal sector in the TenthPlan, including Rs. 8,007.64 crore for NLC(Power) comprising an internal and extrabudgetary resources (IEBR) of Rs.30,541 croreand a gross budgetary support (GBS) of Rs.1,050crore. This outlay is about 63 per cent more thanthe outlay provided in the Ninth Plan and about120 per cent more than the anticipatedexpenditure during the Ninth Plan. However, thesignificant change in the Tenth Plan is that thedomestic budgetary support (DBS), at Rs.1,034.52 crore, is about 51 per cent less thanthe provision of Rs. 2,109.93 crore in the NinthPlan. Including the component of externally aidedprojects of Rs.15.48 crore, the GBS provision isRs. 1,050 crore, which is 57 per cent less thanthe provision in the Ninth Plan. The outlaysrequired for the three PSUs under theDepartment of Coal are to be financed entirelythrough IEBR and DBS is not required. In thecase of SCCL, the entire outlay is proposed tobe met through internal resources. The DBS ofRs. 1,034.52 crore is exclusively meant forsupporting Plan schemes of the Department ofCoal. The outlay includes a requirement of Rs.425.06 crore for implementation of VRS. Thecompany-wise/scheme-wise outlays/expenditureis given in Table-7.3.14 and the year-wise detailsin Annexure-7.3.4. The schemewise break up ofTenth Plan outlay for Department of Coal is givenin the Appendix.
TENTH FIVE YEAR PLAN 2002-07
794
Safety and Welfare
7.3.155 Successive Plans have emphasised theimportance of safety and welfare of the coalmineworkers. During the Ninth Plan, certain importantareas for safety in coalmines had been identifiedand schemes relating to these are underimplementation. Some of the major thrust areasidentified for safety in coalmines for the Tenth Planare - (i) installation of environmental tele-monitoringsystems (ETMS) in mines; (ii) digitising mining plansat the area level for identification of water dangerfrom adjoining mines, checking correlation surveyand estimating thickness of barriers; (iii)replacement of timber support by steel support; (iv)improved self-rescuers; etc.
7.3.156 During the Tenth Plan, it is envisaged toincrease the housing satisfaction in the coalfieldsand water supply facilities to cover the additionalpopulation.
THE PATH AHEAD
Reforms
7.3.157 Reforms initiated earlier need to becontinued and intensified in the Tenth Plan.Expeditious passing of the pending Coal Mines(Nationalisation) Amendment Bill, 2000 forpermitting private sector in non-captive coalmining, restructuring of coal PSUs by windingup the holding company, CIL, and makingsubsidiary coal companies independent in orderto promote competit ion and improveperformance are some of the steps that needto be taken. Other issues that need to beaddressed are: setting up of an independentbody for al locating coal blocks for bothexploration and exploitation, install ing aregulatory authority/mechanism and undertakingall the required legislative amendments includingthat of labour laws, land acquisition, etc.
Total DOC: 19441.59 19143.74 3977.15 3127.69 14387.72 31591.00 3491.47
ENERGY
795
Towards More Reforms
l Coal to be removed from the list of essential commodities in order to allow free sale and to withdrawColliery Control Order 2000 along with the Coal Control Orders of the state governments.
l Amendments to the Coal Bearing Areas (Acquisition & Development) Act, 1957 to allow privatesector rights for coal exploration and mining without taking permission from the state governmentsas has been done in the case of CIL.
l Amendments to the Contract Labour (Regulation & Abolition) Act 1970 for facilitating offloading ofcertain activities in coal mining.
l De-blocking of coal blocks held by CIL for offering to the private sector.
l Adopting gross calorific value (GCV) based grading and pricing of coal.
l Improved procedures for land acquisition, environmental and forest clearance and quick resettlementand rehabilitation.
l Need for rationalising import duty on coal for improving competitiveness of the sector.
TENTH FIVE YEAR PLAN 2002-07
796
Annexure-7.3.1
Tenth Plan Outlay - Petroleum & Natural Gas Sector
Rs. Crore
Name of the Company Tenth Plan Outlay
A. Exploration & Production
1. Oil & Natural Gas Corporation Ltd.(ONGC) 46,968.95
2. Oil India Limited (OIL) 5,000.00
3. Gas Authority of India Ltd. (GAIL) 7,500.00
Sub-Total (A) 59,468.95
B. Refining & Marketing
1. Indian Oil Corporation (IOC) 18,001.44
2. Chennai Petroleum Corporation Ltd. (CPCL) 2,400.00
3. Bongaigaon Refinery & Petro Chemicals Ltd (BRPL) 100.00