CHAPTER IV DATA ANALYSIS AND RESEARCH FINDING 1.1 Data Analysis This research was done at the eight grade in SMP Cerdas Murni Tembung obtained from the test and data result which had been compiled by researcher. The data of this analysis were taken from the multiple choices test. The researcher was conducted in two classes. The exact number of the students in the class was 80 students. 4.1.1 The Students’ Ability at Comprehending Reading Material were Taught by Using Groupwork Method at Class A Lets’ see the following tables that show the students’ ability at comprehending reading material byusing groupwork method in pre-test and post-test. Table IV Students’ Score at Class A No Initial Name Pre-test Explanation Post-test Explanation 1 ABRA 50 Failed 60 Failed 2 ASM 70 Passed 80 Passed 3 AM 70 Passed 80 Passed 4 ATR 70 Passed 90 Passed 5 AC 80 Passed 90 Passed 6 ARS 60 Failed 70 Passed 7 ARA 80 Passed 90 Passed 8 AFH 30 Failed 40 Failed 9 DSP 70 Passed 90 Passed 10 DS 40 Failed 50 Failed 11 DF 80 Passed 90 Passed 12 EM 70 Passed 80 Passed 13 FM 70 Passed 80 Passed
Transcript
CHAPTER IV
DATA ANALYSIS AND RESEARCH FINDING
1.1 Data Analysis
This research was done at the eight grade in SMP Cerdas Murni Tembung obtained
from the test and data result which had been compiled by researcher.
The data of this analysis were taken from the multiple choices test. The researcher
was conducted in two classes. The exact number of the students in the class was 80 students.
4.1.1 The Students’ Ability at Comprehending Reading Material were Taught by Using
Groupwork Method at Class A
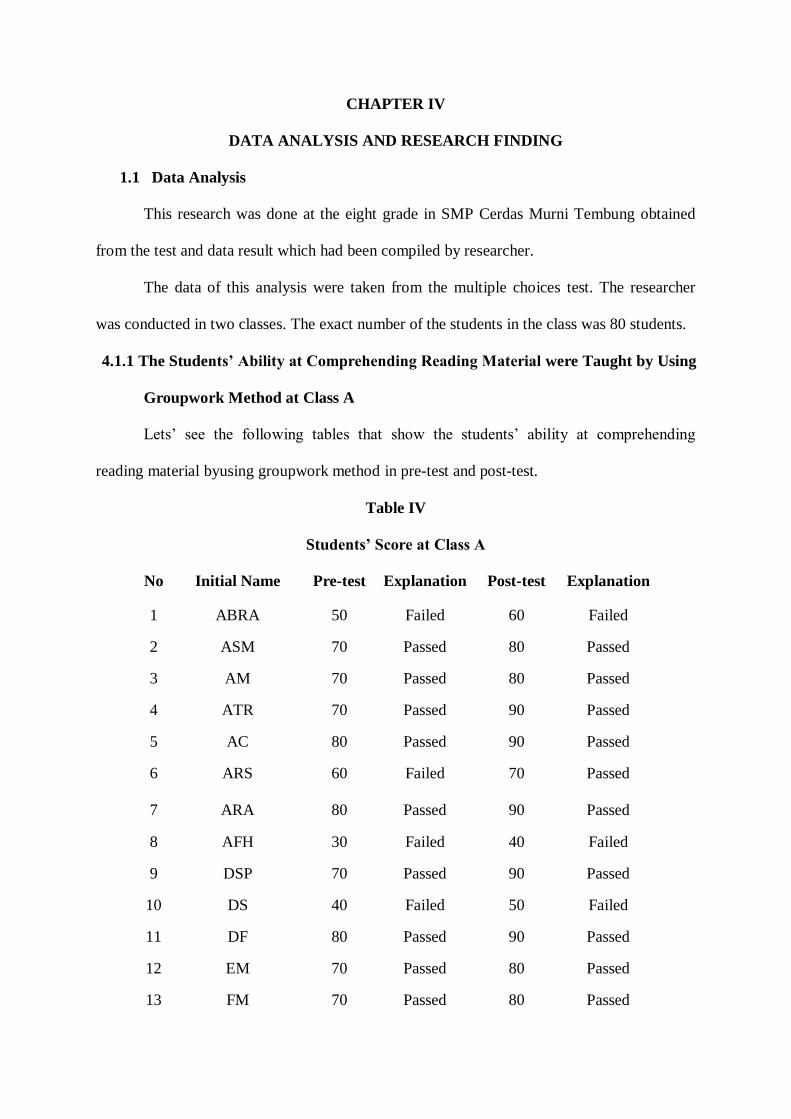
Lets’ see the following tables that show the students’ ability at comprehending
reading material byusing groupwork method in pre-test and post-test.
Table IV
Students’ Score at Class A
No Initial Name Pre-test Explanation Post-test Explanation
1 ABRA 50 Failed 60 Failed
2 ASM 70 Passed 80 Passed
3 AM 70 Passed 80 Passed
4 ATR 70 Passed 90 Passed
5 AC 80 Passed 90 Passed
6 ARS 60 Failed
70 Passed
7 ARA 80 Passed 90 Passed
8 AFH 30 Failed 40 Failed
9 DSP 70 Passed 90 Passed
10 DS 40 Failed 50 Failed
11 DF 80 Passed 90 Passed
12 EM 70 Passed 80 Passed
13 FM 70 Passed 80 Passed
14 GA 80 Passed 90 Passed
15 JNH 50 Failed 60 Failed
16 MR 70 Passed 90 Passed
17 MPA 80 Passed 90 Passed
18 MZ 80 Passed 90 Passed
19 MM 40 Failed 50 Failed
20 MRA 40 Failed 60 Failed
21 MSN 80 Passed 90 Passed
22 MZF 20 Failed 50 Failed
23 NYP 70 Passed 80 Passed
24 NPA 40 Failed 50 Failed
25 NVA 60 Failed 70 Passed
26 NN 30 Failed 60 Failed
27 NNH 80 Passed 90 Passed
28 PI 40 Failed 50 Failed
29 RA 80 Passed 90 Passed
30 RMIP 80 Passed 90 Passed
31 RAS 60 Failed 70 Passed
32 RK 20 Failed 50 Failed
33 SAP 70 Passed 80 Passed
34 SI 60 Failed 70 Passed
35 SNAT 90 Passed 100 Passed
36 SRP 50 Failed 80 Passed
37 SNF 50 Failed 60 Failed
38 SR 80 Passed 90 Passed
39 WI 70 Passed 80 Passed
40 ZF 80 Passed 100 Passed
Total 2490 16 failed
24 passed
3020 12 failed
28 passed
Average 62,25 75,5
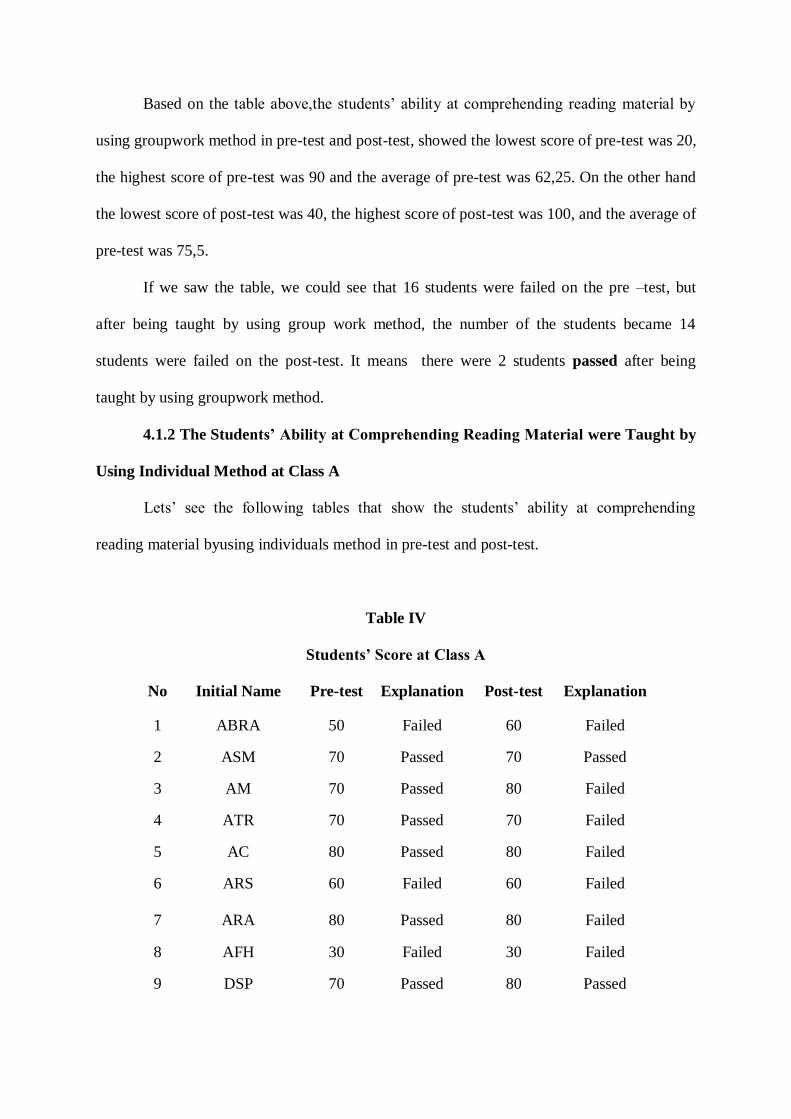
Based on the table above,the students’ ability at comprehending reading material by
using groupwork method in pre-test and post-test, showed the lowest score of pre-test was 20,
the highest score of pre-test was 90 and the average of pre-test was 62,25. On the other hand
the lowest score of post-test was 40, the highest score of post-test was 100, and the average of
pre-test was 75,5.
If we saw the table, we could see that 16 students were failed on the pre –test, but
after being taught by using group work method, the number of the students became 14
students were failed on the post-test. It means there were 2 students passed after being
taught by using groupwork method.
4.1.2 The Students’ Ability at Comprehending Reading Material were Taught by
Using Individual Method at Class A
Lets’ see the following tables that show the students’ ability at comprehending
reading material byusing individuals method in pre-test and post-test.
Table IV
Students’ Score at Class A
No Initial Name Pre-test Explanation Post-test Explanation
1 ABRA 50 Failed 60 Failed
2 ASM 70 Passed 70 Passed
3 AM 70 Passed 80 Failed
4 ATR 70 Passed 70 Failed
5 AC 80 Passed 80 Failed
6 ARS 60 Failed
60 Failed
7 ARA 80 Passed 80 Failed
8 AFH 30 Failed 30 Failed
9 DSP 70 Passed 80 Passed
10 DS 40 Failed 50 Failed
11 DF 80 Passed 80 Failed
12 EM 70 Passed 80 Failed
13 FM 70 Passed 70 Failed
14 GA 80 Passed 90 Failed
15 JNH 50 Failed 60 Failed
16 MR 70 Passed 70 Failed
17 MPA 80 Passed 80 Failed
18 MZ 80 Passed 70 Failed
19 MM 40 Failed 50 Failed
20 MRA 40 Failed 60 Failed
21 MSN 80 Passed 70 Passed
22 MZF 20 Failed 30 Failed
23 NYP 70 Passed 70 Failed
24 NPA 40 Failed 50 Failed
25 NVA 60 Failed 70 Failed
26 NN 30 Failed 30 Failed
27 NNH 80 Passed 80 Failed
28 PI 40 Failed 40 Failed
29 RA 80 Passed 80 Failed
30 RMIP 80 Passed 70 Failed
31 RAS 60 Failed 60 Failed
32 RK 20 Failed 40 Failed
33 SAP 70 Passed 80 Failed
34 SI 60 Failed 60 Failed
35 SNAT 90 Passed 90 Passed
36 SRP 50 Failed 40 Failed
37 SNF 50 Failed 60 Failed
38 SR 80 Passed 80 Passed
39 WI 70 Passed 70 Passed
40 ZF 80 Passed 80 Passed
Total 2490 16 failed
24 passed
2620 34 failed
6 passed
Average 62,25 65,5
Based on the table above,the students’ ability at comprehending reading material
byusing individuals method in pre-test and post-test. showed the lowest score of pre-test was
20, the highest score of pre-test was 90 and the average of pre-test was 62,25. On the other
hand the lowest score of post-test was 30, the highest score of post-test was 90, and the
average of pre-test was 65,5.
If we saw the table, we could see that 16 students were failed on the pre –test, but
after being taught by using individuals method, the number of the students became 34
students were failed on the post-test. It means there were 18 students failed after being
taught by using individuals.
4.1.2 The Students’ Ability At Comprehending Reading Material By Using Groupwork
Method at Class B
Table V
Students’ Score at Class B
No Initial Name Pre-test (t1) Explanation Post-test (t2) Explanation
1 AP 30 Failed 70 Passed
2 AFS 40 Failed 60 Failed
3 AO 50 Failed 80 Passed
4 AD 60 Failed 80 Passed
5 AM 50 Failed 80 Passed
6 AY 60 Failed 80 Passed
7 AA 30 Failed 50 Failed
8 AA 50 Failed 70 Passed
9 BS 30 Failed 70 Passed
10 DA 40 Failed 80 Passed
11 DAA 20 Failed 50 Failed
12 DAF 70 Passed 90 Passed
13 DAM 30 Failed 50 Failed
14 FF 30 Failed 60 Failed
15 GA 50 Failed 60 Failed
16 JA 30 Failed 40 Failed
17 MSF 60 Failed 80 Passed
18 MIS 60 Failed 70 Passed
19 MSL 50 Failed 60 Failed
20 MPA 30 Failed 50 Failed
21 MDP 40 Failed 80 Passed
22 MFS 40 Failed 60 Failed
23 MHA 50 Failed 80 Passed
24 NS 20 Failed 60 Failed
25 NF 50 Failed 70 Passed
26 NA 10 Failed 30 Failed
27 PJN 30 Failed 50 Failed
28 RR 40 Failed 80 Passed
29 RYR 40 Failed 70 Passed
30 RN 40 Failed 60 Failed
31 SS 30 Failed 50 Failed
32 SA 30 Failed 50 Failed
33 SAZ 50 Failed 70 Passed
34 SH 50 Failed 70 Passed
35 SNH 30 Failed 50 Failed
36 TS 30 Failed 50 Failed
37 TA 50 Failed 80 Passed
38 WA 50 Failed 70 Passed
39 YR 50 Failed 80 Passed
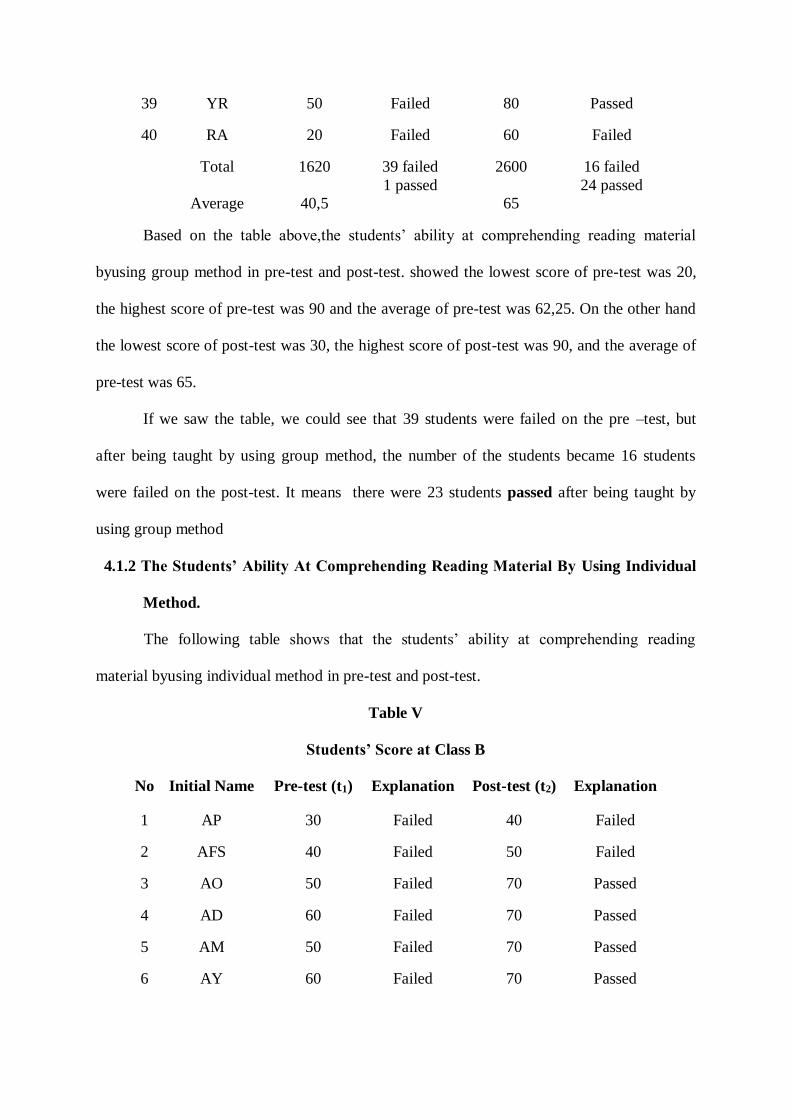
40 RA 20 Failed 60 Failed
Total 1620 39 failed
1 passed
2600 16 failed
24 passed
Average 40,5 65
Based on the table above,the students’ ability at comprehending reading material
byusing group method in pre-test and post-test. showed the lowest score of pre-test was 20,
the highest score of pre-test was 90 and the average of pre-test was 62,25. On the other hand
the lowest score of post-test was 30, the highest score of post-test was 90, and the average of
pre-test was 65.
If we saw the table, we could see that 39 students were failed on the pre –test, but
after being taught by using group method, the number of the students became 16 students
were failed on the post-test. It means there were 23 students passed after being taught by
using group method
4.1.2 The Students’ Ability At Comprehending Reading Material By Using Individual
Method.
The following table shows that the students’ ability at comprehending reading
material byusing individual method in pre-test and post-test.
Table V
Students’ Score at Class B
No Initial Name Pre-test (t1) Explanation Post-test (t2) Explanation
1 AP 30 Failed 40 Failed
2 AFS 40 Failed 50 Failed
3 AO 50 Failed 70 Passed
4 AD 60 Failed 70 Passed
5 AM 50 Failed 70 Passed
6 AY 60 Failed 70 Passed
7 AA 30 Failed 40 Failed
8 AA 50 Failed 60 Failed
9 BS 30 Failed 40 Failed
10 DA 40 Failed 80 Passed
11 DAA 20 Failed 40 Failed
12 DAF 70 Passed 80 Passed
13 DAM 30 Failed 40 Failed
14 FF 30 Failed 40 Failed
15 GA 50 Failed 60 Failed
16 JA 30 Failed 40 Failed
17 MSF 60 Failed 70 Passed
18 MIS 60 Failed 70 Passed
19 MSL 50 Failed 60 Failed
20 MPA 30 Failed 40 Failed
21 MDP 40 Failed 60 Failed
22 MFS 40 Failed 50 Failed
23 MHA 50 Failed 60 Failed
24 NS 20 Failed 60 Failed
25 NF 50 Failed 60 Failed
26 NA 10 Failed 20 Failed
27 PJN 30 Failed 40 Failed
28 RR 40 Failed 70 Passed
29 RYR 40 Failed 60 Failed
30 RN 40 Failed 60 Failed
31 SS 30 Failed 40 Failed
32 SA 30 Failed 40 Failed
33 SAZ 50 Failed 60 Failed
34 SH 50 Failed 60 Failed
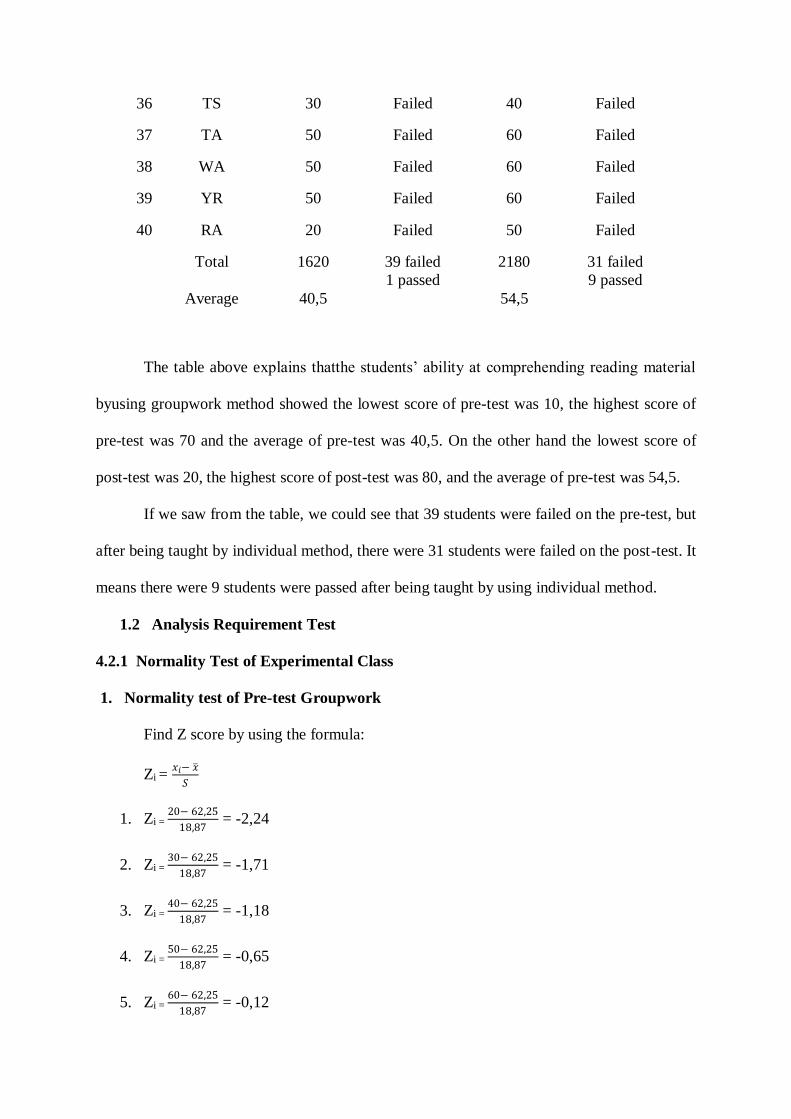
35 SNH 30 Failed 40 Failed
36 TS 30 Failed 40 Failed
37 TA 50 Failed 60 Failed
38 WA 50 Failed 60 Failed
39 YR 50 Failed 60 Failed
40 RA 20 Failed 50 Failed
Total 1620 39 failed
1 passed
2180 31 failed
9 passed
Average 40,5 54,5
The table above explains thatthe students’ ability at comprehending reading material
byusing groupwork method showed the lowest score of pre-test was 10, the highest score of
pre-test was 70 and the average of pre-test was 40,5. On the other hand the lowest score of
post-test was 20, the highest score of post-test was 80, and the average of pre-test was 54,5.
If we saw from the table, we could see that 39 students were failed on the pre-test, but
after being taught by individual method, there were 31 students were failed on the post-test. It
means there were 9 students were passed after being taught by using individual method.
1.2 Analysis Requirement Test
4.2.1 Normality Test of Experimental Class
1. Normality test of Pre-test Groupwork
Find Z score by using the formula:
Zi = 𝑥𝑖− �̅�
𝑆
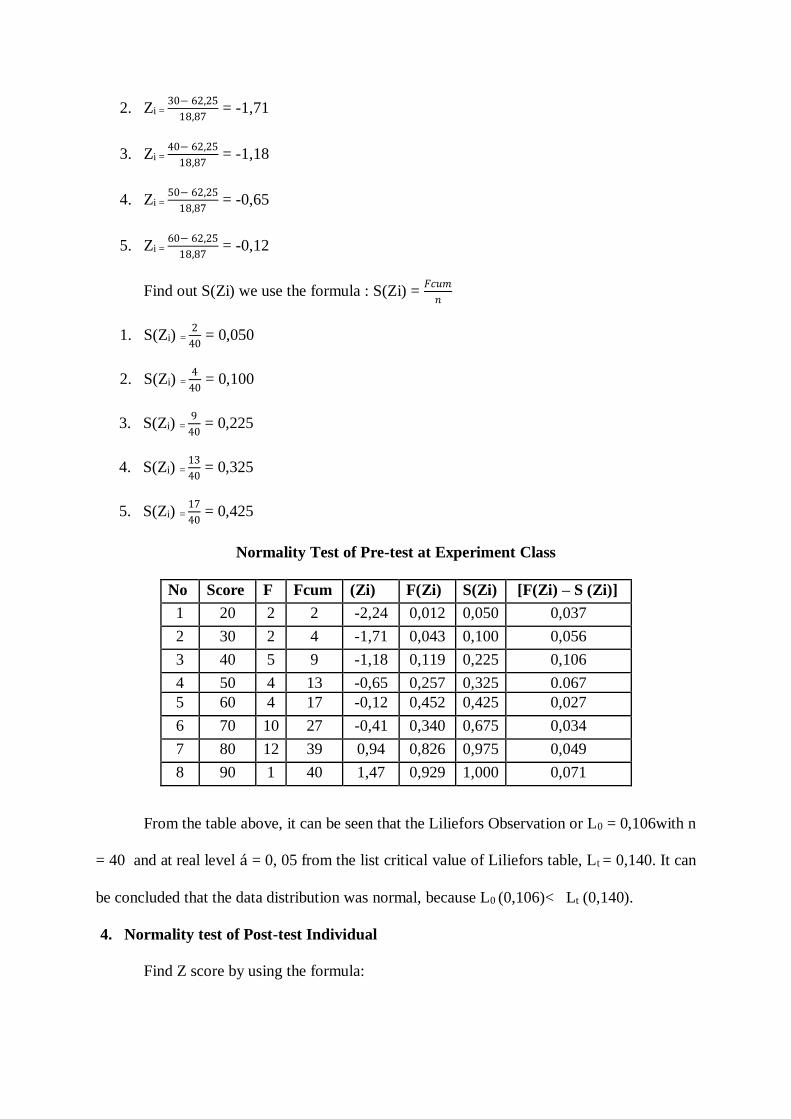
1. Zi = 20− 62,25
18,87 = -2,24
2. Zi = 30− 62,25
18,87 = -1,71
3. Zi = 40− 62,25
18,87 = -1,18
4. Zi = 50− 62,25
18,87 = -0,65
5. Zi = 60− 62,25
18,87 = -0,12
Find out S(Zi) we use the formula : S(Zi) = 𝐹𝑐𝑢𝑚
𝑛
1. S(Zi) = 2
40 = 0,050
2. S(Zi) = 4
40 = 0,100
3. S(Zi) = 9
40 = 0,225
4. S(Zi) = 13
40 = 0,325
5. S(Zi) = 17
40 = 0,425
Normality Test of Pre-test at Experiment Class
No Score F Fcum (Zi) F(Zi) S(Zi) [F(Zi) – S (Zi)]
1 20 2 2 -2,24 0,012 0,050 0,037
2 30 2 4 -1,71 0,043 0,100 0,056
3 40 5 9 -1,18 0,119 0,225 0,106
4 50 4 13 -0,65 0,257 0,325 0.067
5 60 4 17 -0,12 0,452 0,425 0,027
6 70 10 27 -0,41 0,340 0,675 0,034
7 80 12 39 0,94 0,826 0,975 0,049
8 90 1 40 1,47 0,929 1,000 0,071
From the table above, it can be seen that the Liliefors Observation or L0 = 0,106with n
= 40 and at real level 𝛼 = 0, 05 from the list critical value of Liliefors table, Lt = 0,140. It can
be concluded that the data distribution was normal, because L0 (0,106)< Lt (0,140).
2. Normality test of Post-test Gropwork
Find Z score by using the formula:
Zi = 𝑥𝑖− �̅�
𝑆
1. Zi = 40− 75,5
16,63 = -2,13
2. Zi = 50− 75,5
16,63 = -1,53
3. Zi = 60− 75,5
16,63 = -0,93
4. Zi = 70− 75,5
16,63 = -0,33
5. Zi = 80− 75,5
16,63 = 0,27
Find out S(Zi) we use the formula : S(Zi) = 𝐹𝑐𝑢𝑚
𝑛
1. S(Zi) = 1
40 = 0,025
2. S(Zi) = 6
40 = 0,150
3. S(Zi) = 12
40 = 0,300
4. S(Zi) = 16
40 = 0,400
5. S(Zi) = 24
40 = 0,600
Normality Test of Post-test at Experiment Class
No Score F Fcum (Zi) F(Zi) S(Zi) [F(Zi) – S (Zi)]
1 40 1 1 -2,13 0,016 0,025 0,0084
2 50 5 6 -1,53 0,063 0,150 0,087
3 60 6 12 -0,93 0,176 0,300 0,124
4 70 4 16 -0,33 0,370 0,400 0,030
5 80 8 24 0,27 0,606 0,600 0,006
6 90 14 38 0,87 0,807 0,950 0,110
7 100 2 40 1,47 0,929 1,000 0,071
From the table above, it can be seen that the Liliefors Observation or L0 = 0,124 with
n = 40 and at real level 𝛼 = 0, 05 from the list critical value of Liliefors table, Lt = 0,140. It
can be concluded that the data distribution was normal, because L0 (0,124)< Lt (0,140).
3. Normality test of Pre-test Individual
Find Z score by using the formula:
Zi = 𝑥𝑖− �̅�
𝑆
1. Zi = 20− 62,25
18,87 = -2,24
2. Zi = 30− 62,25
18,87 = -1,71
3. Zi = 40− 62,25
18,87 = -1,18
4. Zi = 50− 62,25
18,87 = -0,65
5. Zi = 60− 62,25
18,87 = -0,12
Find out S(Zi) we use the formula : S(Zi) = 𝐹𝑐𝑢𝑚
𝑛
1. S(Zi) = 2
40 = 0,050
2. S(Zi) = 4
40 = 0,100
3. S(Zi) = 9
40 = 0,225
4. S(Zi) = 13
40 = 0,325
5. S(Zi) = 17
40 = 0,425
Normality Test of Pre-test at Experiment Class
No Score F Fcum (Zi) F(Zi) S(Zi) [F(Zi) – S (Zi)]
1 20 2 2 -2,24 0,012 0,050 0,037
2 30 2 4 -1,71 0,043 0,100 0,056
3 40 5 9 -1,18 0,119 0,225 0,106
4 50 4 13 -0,65 0,257 0,325 0.067
5 60 4 17 -0,12 0,452 0,425 0,027
6 70 10 27 -0,41 0,340 0,675 0,034
7 80 12 39 0,94 0,826 0,975 0,049
8 90 1 40 1,47 0,929 1,000 0,071
From the table above, it can be seen that the Liliefors Observation or L0 = 0,106with n
= 40 and at real level á = 0, 05 from the list critical value of Liliefors table, Lt = 0,140. It can
be concluded that the data distribution was normal, because L0 (0,106)< Lt (0,140).
4. Normality test of Post-test Individual
Find Z score by using the formula:
Zi = 𝑥𝑖− �̅�
𝑆
1. Zi = 30− 65,5
16,47 = -2,15
2. Zi = 40− 65,5
16,47 = -1,54
3. Zi = 50− 65,5
16,47 = -0,94
4. Zi = 60− 65,5
16,47 = -0,33
5. Zi = 70− 65,5
16,47 = 0,27
6. Zi = 80− 65,5
16,47 = 0,88
Find out S(Zi) we use the formula : S(Zi) = 𝐹𝑐𝑢𝑚
𝑛
1. S(Zi) = 3
40 = 0,075
2. S(Zi) = 6
40 = 0,150
3. S(Zi) = 9
40 = 0,225
4. S(Zi) = 16
40 = 0,400
5. S(Zi) = 26
40 = 0,650
6. S(Zi) = 38
40 = 0,950
Normality Test of Post-test at Experiment Class
No Score F Fcum (Zi) F(Zi) S(Zi) [F(Zi) – S (Zi)]
1 30 3 3 -2,15 0,016 0,075 0,059
2 40 3 6 -1,54 0,061 0,150 0,089
3 50 3 9 -0,94 0,173 0,225 0,052
4 60 7 16 -0,33 0,369 0,400 0.031
5 70 10 26 0,27 0,610 0,650 0,040
6 80 12 38 0,88 0,860 0,950 0,090
7 90 2 40 1,48 0,932 1,000 0,068
From the table above, it can be seen that the Liliefors Observation or L0 = 0,090with n
= 40 and at real level á = 0, 05 from the list critical value of Liliefors table, Lt = 0,140. It can
be concluded that the data distribution was normal, because L0 (0,090)< Lt (0,140).
4.2.2 Normality Test of Control Class
1. Normality Test of Pre-test Groupwork
Find Z score by using by using the formula:
Zi = 𝑥𝑖− �̅�
𝑆
1. Zi = 10− 40,5
13,38 = -2,28
2. Zi = 20− 40,5
13,38 = -1,53
3. Zi = 30− 40,5
13,38 = -0,78
4. Zi = 40− 40,5
13,38 = -0,04
5. Zi = 50− 40,5
13,38 = 0,71
Find out S(Zi) we use the formula : S(Zi) = 𝐹𝑐𝑢𝑚
𝑛
1. S(Zi) = 1
40 = 0,025
2. S(Zi) = 4
40 = 0,100
3. S(Zi) = 16
40 = 0,400
4. S(Zi) = 23
40 = 0,575
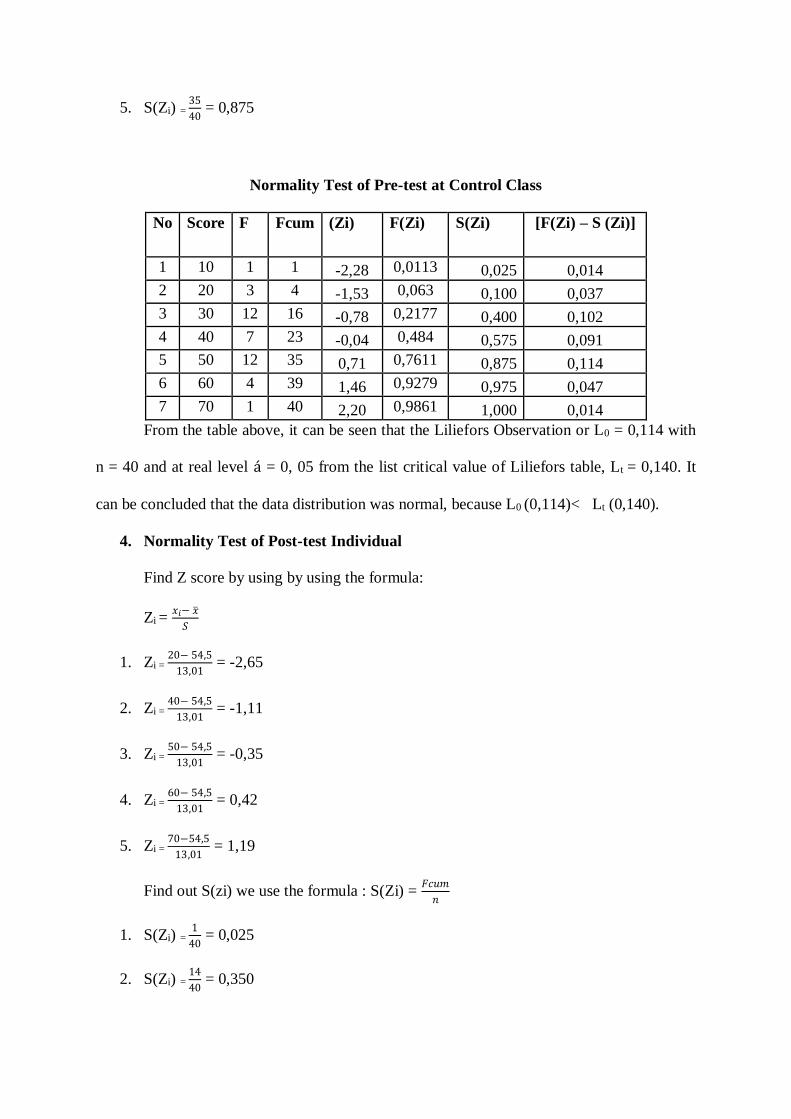
5. S(Zi) = 35
40 = 0,875
Normality Test of Pre-test at Control Class
No Score F Fcum (Zi) F(Zi) S(Zi) [F(Zi) – S (Zi)]
1 10 1 1 -2,28 0,0113 0,025 0,014
2 20 3 4 -1,53 0,063 0,100 0,037
3 30 12 16 -0,78 0,2177 0,400 0,102
4 40 7 23 -0,04 0,484 0,575 0,091
5 50 12 35 0,71 0,7611 0,875 0,114
6 60 4 39 1,46 0,9279 0,975 0,047
7 70 1 40 2,20 0,9861 1,000 0,014
From the table above, it can be seen that the Liliefors Observation or L0 = 0,114 with
n = 40 and at real level á = 0, 05 from the list critical value of Liliefors table, Lt = 0,140. It
can be concluded that the data distribution was normal, because L0 (0,114)< Lt (0,140).
2. Normality Test of Post-test Groupwork
Find Z score by using by using the formula:
Zi = 𝑥𝑖− �̅�
𝑆
1. Zi = 30− 65
10,25 = -3,41
2. Zi = 40− 65
10,25 = -2,43
3. Zi = 50− 65
10,25 = -1,46
4. Zi = 60− 65
10,25 = -0,48
5. Zi = 70−65
10,25 = 0,48
Find out S(zi) we use the formula : S(Zi) = 𝐹𝑐𝑢𝑚
𝑛
1. S(Zi) = 1
40 = 0,025
2. S(Zi) = 2
40 = 0,05
3. S(Zi) = 11
40 = 0,275
4. S(Zi) = 19
40 = 0,473
5. S(Zi) = 28
40 = 0,700
6. S(Zi) = 39
40 = 0,975
Normality Test of Post-test at Control Class
No Score F Fcum (Zi) F(Zi) S(Zi) [F(Zi) – S (Zi)]
1 30 1 1 -3,41 0,000 0,025 0,025
2 40 1 2 -2,43 0,007 0,050 0,043
3 50 9 11 -1,46 0,172 0,275 0,103
4 60 8 19 -0,48 0,343 0,475 0,132
5 70 9 28 0,48 0,687 0,700 0,013
6 80 11 38 1,46 0,928 0,975 0,047
7 90 1 40 2,43 1,000 1,000 0,007
From the table above, it can be seen that the Liliefors Observation or L0 = 0,132 with
n = 40 and at real level á = 0, 05 from the list critical value of Liliefors table, Lt = 0,140. It
can be concluded that the data distribution was normal, because L0 (0,132)< Lt (0,140).
3. Normality Test of Pre-test Individual
Find Z score by using by using the formula:
Zi = 𝑥𝑖− �̅�
𝑆
1. Zi = 10− 40,5
13,38 = -2,28
2. Zi = 20− 40,5
13,38 = -1,53
3. Zi = 30− 40,5
13,38 = -0,78
4. Zi = 40− 40,5
13,38 = -0,04
5. Zi = 50− 40,5
13,38 = 0,71
Find out S(Zi) we use the formula : S(Zi) = 𝐹𝑐𝑢𝑚
𝑛
1. S(Zi) = 1
40 = 0,025
2. S(Zi) = 4
40 = 0,100
3. S(Zi) = 16
40 = 0,400
4. S(Zi) = 23
40 = 0,575
5. S(Zi) = 35
40 = 0,875
Normality Test of Pre-test at Control Class
No Score F Fcum (Zi) F(Zi) S(Zi) [F(Zi) – S (Zi)]
1 10 1 1 -2,28 0,0113 0,025 0,014
2 20 3 4 -1,53 0,063 0,100 0,037
3 30 12 16 -0,78 0,2177 0,400 0,102
4 40 7 23 -0,04 0,484 0,575 0,091
5 50 12 35 0,71 0,7611 0,875 0,114
6 60 4 39 1,46 0,9279 0,975 0,047
7 70 1 40 2,20 0,9861 1,000 0,014
From the table above, it can be seen that the Liliefors Observation or L0 = 0,114 with
n = 40 and at real level á = 0, 05 from the list critical value of Liliefors table, Lt = 0,140. It
can be concluded that the data distribution was normal, because L0 (0,114)< Lt (0,140).
4. Normality Test of Post-test Individual
Find Z score by using by using the formula:
Zi = 𝑥𝑖− �̅�
𝑆
1. Zi = 20− 54,5
13,01 = -2,65
2. Zi = 40− 54,5
13,01 = -1,11
3. Zi = 50− 54,5
13,01 = -0,35
4. Zi = 60− 54,5
13,01 = 0,42
5. Zi = 70−54,5
13,01 = 1,19
Find out S(zi) we use the formula : S(Zi) = 𝐹𝑐𝑢𝑚
𝑛
1. S(Zi) = 1
40 = 0,025
2. S(Zi) = 14
40 = 0,350
3. S(Zi) = 17
40 = 0,425
4. S(Zi) = 31
40 = 0,775
5. S(Zi) = 38
40 = 0,950
Normality Test of Post-test at Control Class
No Score F Fcum (Zi) F(Zi) S(Zi) [F(Zi) – S (Zi)]
1 20 1 1 -2,65 0,0040 0,025 0,021
2 40 13 14 -1,11 0,1335 0,350 0,017
3 50 3 17 -0,35 0,3632 0,425 0,062
4 60 14 31 0,42 0,6628 0,775 0,112
5 70 7 38 1,19 0,8830 0,950 0,067
6 80 2 40 1,96 0,9744 1,000 0,026
From the table above, it can be seen that the Liliefors Observation or L0 = 0,112 with
n = 40 and at real level á = 0, 05 from the list critical value of Liliefors table, Lt = 0,112. It
can be concluded that the data distribution was normal, because L0 (0,112)< Lt (0,140).
4.2.2 Homogeneity Test
Homogeneity test used F-test to know what the samples come from the population
that homogenous or not.
A. Homogeneity Test of Pre-test Groupwork and Individual
2
2
2
1
S
SFh
Where : S12 = the biggest variant
S22 = the smallest variant
Based on the variants of both samples of pre-test found that:
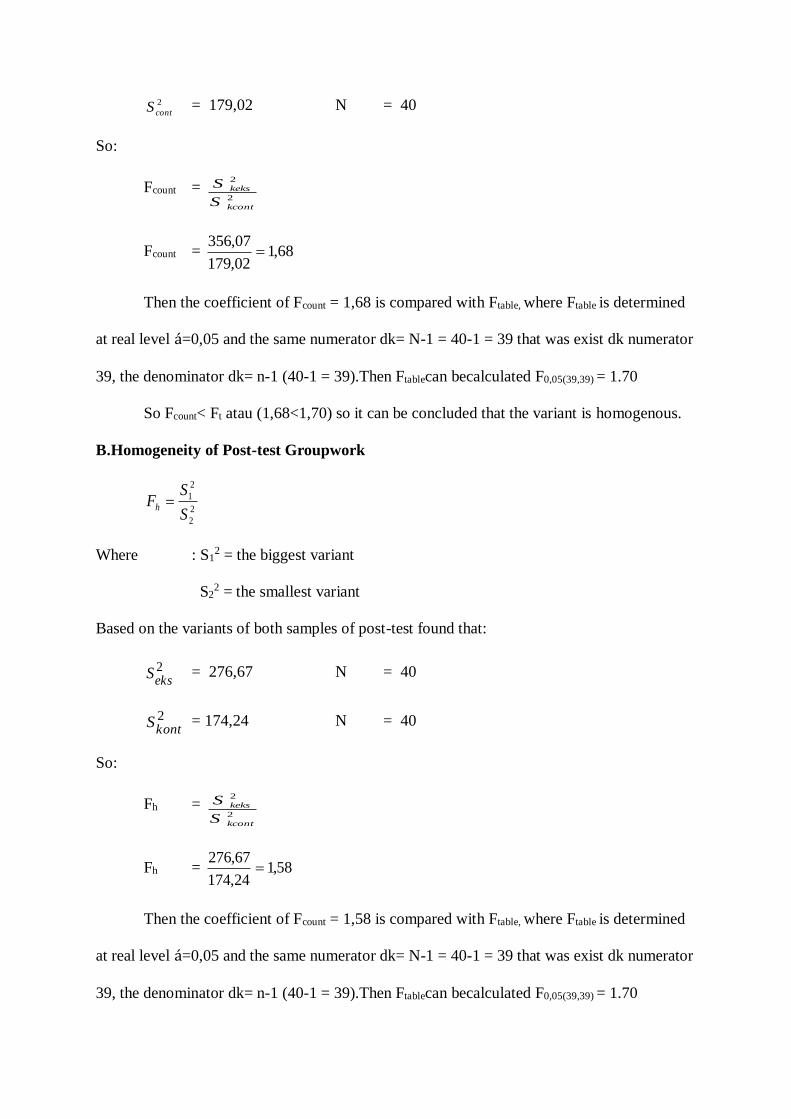
2
exS = 356,07 N = 40
2
contS = 179,02 N = 40
So:
Fcount = 2
2
kcont
keks
S
S
Fcount = 68,102,179
07,356
Then the coefficient of Fcount = 1,68 is compared with Ftable, where Ftable is determined
at real level á=0,05 and the same numerator dk= N-1 = 40-1 = 39 that was exist dk numerator