CHEMICAL INTERACTION OF NITRIC OXIDE AND HUMAN HEMOGLOBIN by Benjamin Peter Luchsinger A dissertation submitted in partial fulfillment of the requirements for the degree of Doctor of Philosophy in Chemistry MONTANA STATE UNIVERSITY Bozeman, Montana April 2004
Transcript
CHEMICAL INTERACTION OF NITRIC OXIDE
AND HUMAN HEMOGLOBIN
by
Benjamin Peter Luchsinger
A dissertation submitted in partial fulfillmentof the requirements for the degree
This (dissertation) has been read by each member of the thesis (dissertation)committee and has been found to be satisfactory regarding content, English usage,format, citations, bibliographic style, and consistency, and is ready for submission to theCollege of Graduate Studies.
David J. Singel
Approved for the Department of Chemistry and Biochemistry
Paul Grieco
Approved for the College of Graduate Studies
Bruce McLeod
iii
STATEMENT OF PERMISSION TO USE
In presenting this dissertation in partial fulfillment of the requirements for a doctoral
degree at Montana State University, I agree that the Library shall make it available to
borrowers under rules of the Library. I further agree that copying of this dissertation is
allowable only for scholarly purposes, consistent with “fair use” as prescribed in the U.S.
Copyright Law. Requests for extensive copying or reproduction of this dissertation
should be referred to Bell & Howell Information and Learning, 300 North Zeeb Road,
Ann Arbor, Michigan 48106, to whom I have granted “the exclusive right to reproduce
and distribute my dissertation in and from microform along with the non-exclusive right
to reproduce and distribute my abstract in any format in whole or in part.”
Benjamin Peter Luchsinger
April 19, 2004
iv
ACKNOWLEDGMENTS
"If I have seen a little further it is by standing on the shoulders of Giants."-- Isaac Newton
I acknowledge the help of Dr. Joseph Boneventura for early training in tonometermethods and in working with hemoglobin during a brief visit to Duke University MedicalSchool. Doing experiments with Andrew J. Gow, of the Stamler lab at Duke, while hevisited MSU was very stimulating. Hemoglobin used in this work was a generous gift ofApex Biochemicals (North Carolina) and was received with the help of Tim McMahon ofthe Stamler laboratory. I acknowledge the valuable experience of mentoringundergraduates from MSU and visitors through the NSF REU program including JasonRoach, Eric Rich, Elizabeth Williams, Lisa Lee, and Jay Stringer.
I acknowledge Melanie Rogers, Doreen Brown, and many others, from the Dooley group,for helping me get started on my biochemistry skills. I acknowledge assistance in someEPR experiments and in programming, and in valuable discussion with members of theSingel group from Dr. Dwight Schwartz, Eric Walter, and Elizabeth Williams.
I acknowledge my mother, Mary, for her loving kindness throughout the years. Iacknowledge Leslie Babich for without him I may not have graduated from college orattended graduate school. I thank him very much.
A very big thanks to Elizabeth M. Williams for helping me with the text of mydissertation.
I want to thank Jonathan S. Stamler for involving me in the study of SNO-hemoglobin. Iparticularly want to thank David J. Singel for being a great scientist and attempting topass on this greatness. Also, for letting me take research in the directions I was mostinterested in.
v
TABLE OF CONTENTS
1. INTRODUCTION.......................................................................................................1SNO-HEMOGLOBIN ......................................................................................................1DELIMITATION OF THESIS WORK ................................................................................12REFERENCES ..............................................................................................................14
2. THE OXYHEMOGLOBIN REACTION OF NITRIC OXIDE ..................................17ABSTRACT..................................................................................................................17INTRODUCTION...........................................................................................................17METHODS...................................................................................................................20
Reaction Product Analysis. ....................................................................................20NO Treatment of Hb. .............................................................................................22Titration of Normoxic Hb with NO........................................................................22Measurements of S-Nitroso-, Iron Nitrosyl-, and Met-Hb. .....................................23EPR Analysis.........................................................................................................23Measurement of Oxygen Saturation. ......................................................................23Extinction Coefficients. .........................................................................................24Modeling of UV-Visible Difference Spectra. .........................................................24
RESULTS AND DISCUSSION..........................................................................................25REFERENCES ..............................................................................................................36
3. ROUTES TO S-NITROSO-HEMOGLOBIN FORMATION WITH HEME REDOXAND PREFERENTIAL REACTIVITY IN THE β-SUBUNITS.............................39
ABSTRACT..................................................................................................................39INTRODUCTION...........................................................................................................40MATERIALS AND METHODS ........................................................................................41RESULTS ....................................................................................................................44
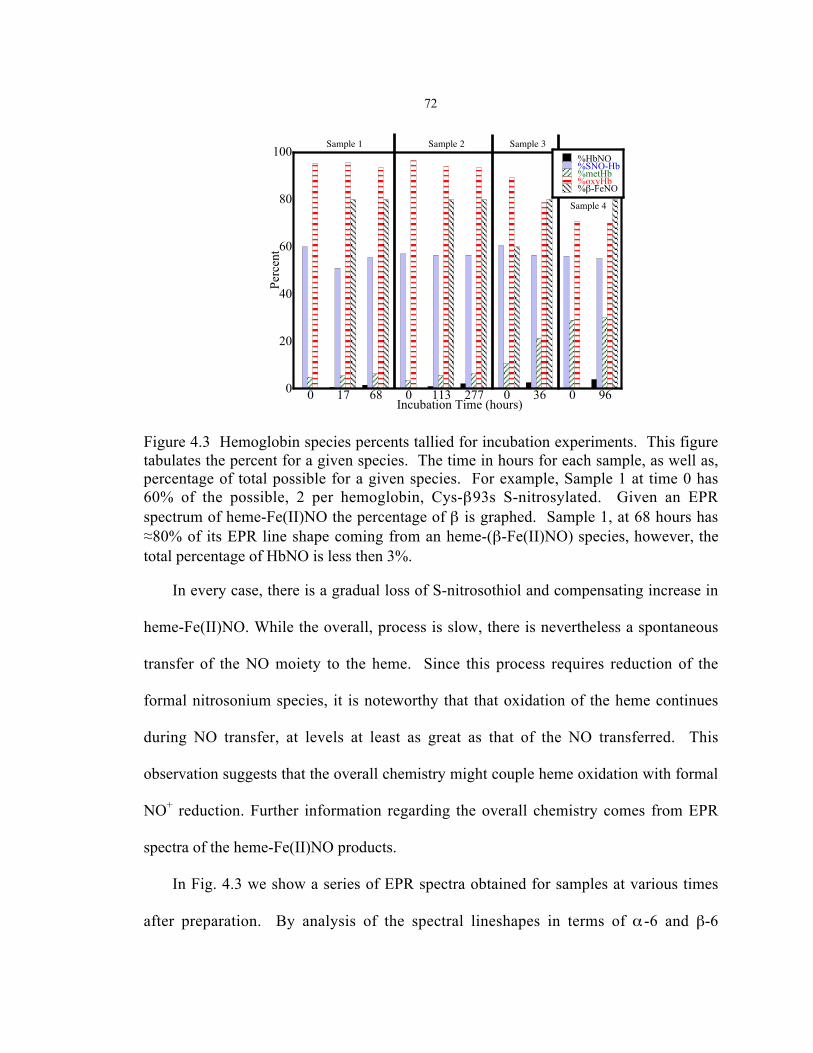
4. NITRIC OXIDE MIGRATION FROM CYS(β-93) TO β-HEME-IRON(II)NO ........67INTRODUCTION...........................................................................................................67MATERIALS AND METHODS ........................................................................................68EXPERIMENTS AND RESULTS.......................................................................................69
EPR characterization of SNO-hemoglobin .............................................................69Thiol-to-heme-transfer...........................................................................................70Heme-to-thiol transfer............................................................................................74
APPENDIX A ...........................................................................................................81NITRIC OXIDE IN THE HUMAN RESPIRATORY CYCLE ..............................81
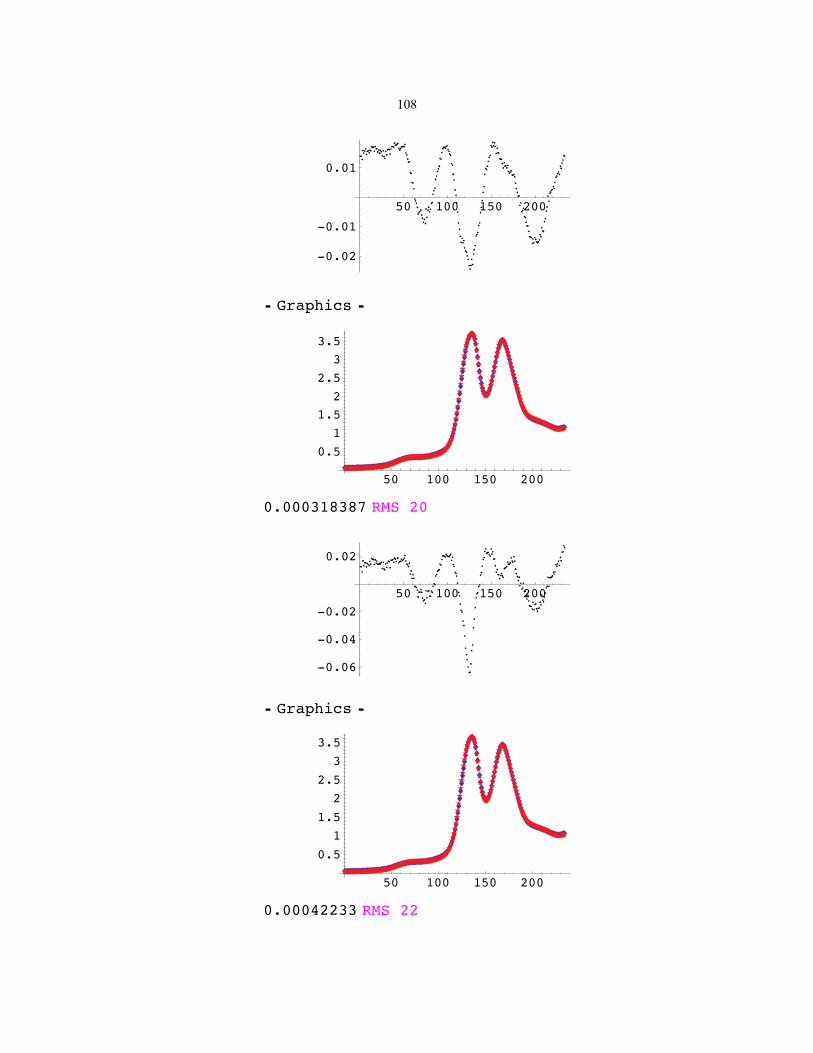
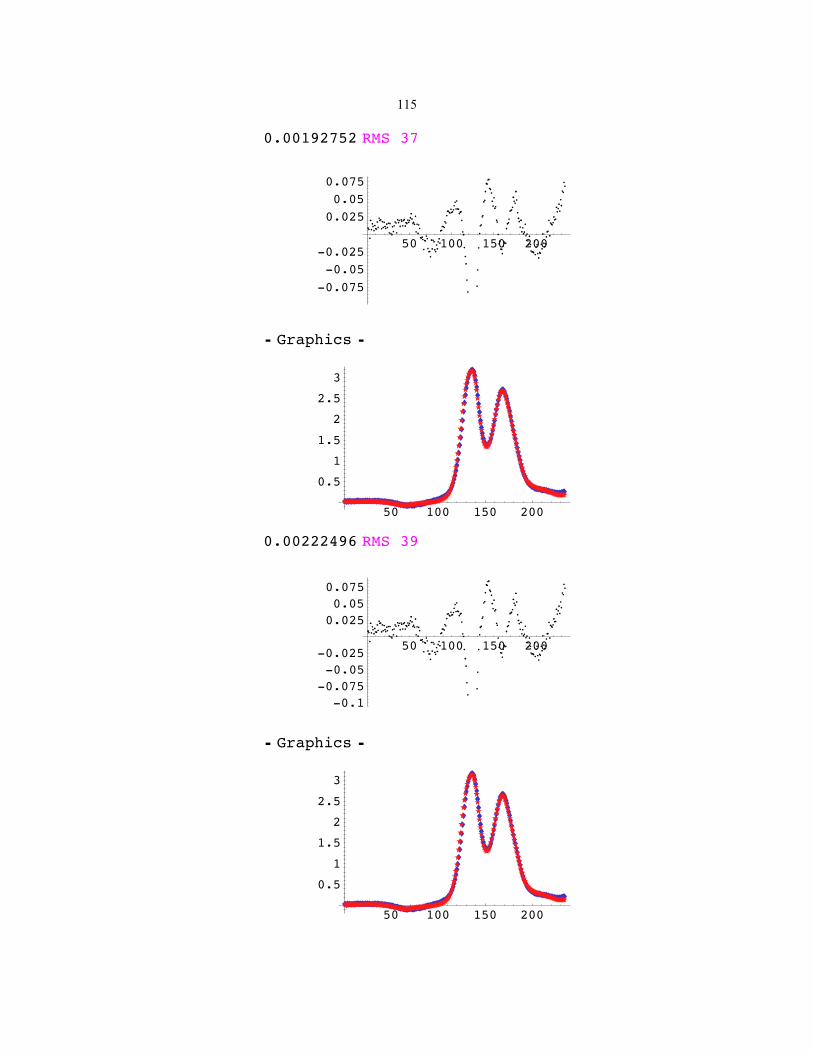
APPENDIX B ...........................................................................................................89UV/VIS DECOMPOSITION IN MATHEMATICA ............................................89
APPENDIX C ...........................................................................................................94TARGET FACTOR ANALYSIS IN MATHEMATICA ......................................94
vii
LIST OF FIGURES
Figure Page
2.1 Production of iron nitrosylHb by addition of NO to variously oxygenatedhemoglobin .....................................................................................................26
2.2 Production of metHb by reaction of NO is disfavored with increasingoxygen saturation ............................................................................................27
2.3 NO addition under normoxic conditions...........................................................292.4 S-nitrosoHb and iron nitrosylHb formed under various physiological
air-oxygenated conditions................................................................................323.1 Visible absorption spectra of species involved in the reductive nitrosylation
reaction ...........................................................................................................433.2 NO-group mass balance in the reductive nitrosylation of human met-Hb
with NO ..........................................................................................................463.3 EPR spectra of Fe(II)NO obtained by reductive nitrosylation of met-Hb
with NO ..........................................................................................................483.4 Kinetics of reductive nitrosylation in a deoxygenated solution . .......................523.5 Conversion of heme-Fe(II)NO centers to heme-Fe(III) and SNO-Hb . .............553.6 EPR spectra from Fe(II)NO and Fe(III) hemes obtained by exposure of
hemoglobin to nitrite .......................................................................................573.7 X-band EPR spectra of nitrosylhemoglobin spectral components .....................614.1 X-band EPR spectrum S-nitroso-nitrosylhemoglobin, (SNO)2-Hb(NO)4. .........704.2 UV/Vis and EPR spectra of SNO-oxyhemoglobin ...........................................714.3 Tabulation of hemoglobin composition during slow transfer of -NO from
hemoglobin thiol to heme ................................................................................724.4 EPR characterization of subunit preference of slow transfer of -NO from
hemoglobin thiol to heme.. ..............................................................................734.5 EPR spectra of hemoglobin incubated with nitritie during cycles of oxygenation
and deoxygenation...........................................................................................77
.
viii
ABSTRACT
In the past decade an entirely new areas of biomedical science have emerged with therecognition of the critical roles played by nitric oxide (NO) in biology. The discoveriesof the role of NO in the cardiovascular systems, where it participates in regulating thetone of blood vessels and the flow of blood, raised an intriguing biochemical problemabout the chemical interaction of NO and hemoglobin in blood. Historically,investigation of the interaction of NO and hemoglobin have suggested the formation ofheme-Fe(II)NO hemoglobin and nitrate. Neither of these products is considered to exhibitNO-related bioactivity, thus the reaction of NO with hemoglobin was thought to quenchthe bioactive potential of NO. In this thesis we explore the idea that these are not theonly two fates of NO in its interaction with hemoglobin. Product formation followingencounters of NO and hemoglobin under various conditions of oxygenation, oxidation,and NO/heme ratios are analyzed by UV/Vis optical spectroscopy, EPR (electronparamagnetic resonance) spectroscopy, and colorimetric chemical analyses. This batteryof methods enables quantification of the hemoglobin species: heme-Fe(II)NO (withdistribution over the hemoglobin subunits) heme-Fe(III)NO, oxyhemoglobin,methemoglobin, deoxyhemoglobin, S-nitrosohemoglobin (SNO-hemoglobin). Wepresent results that establish a previously unsuspected favoring of protein nitrosylation atheme and thiol positions in the reaction of oxyhemoglobin with NO. We demonstratecoupling of heme reduction/oxidation activity with thiol reactivity. We provide evidencefor transfer of the NO group from heme to thiol and vice versa. We demonstrateunprecedented subunit selectivity of interactions of NO with hemoglobin. Finally, wepresent results that highlight the nitrite reductase activity of hemoglobin whereby nitrite,which has a significant concentration in blood, is converted to bioavailable forms of NO.Overall, the in vitro chemistry reported here provides for a complete basis forrationalizing the in vivo biochemistry required for the hemoglobin/NO system to serve asregulator of blood flow.
CHEMICAL INTERACTION OF NITRIC OXIDE AND HUMAN HEMOGLOBINBenjamin Peter Luchsinger 2004
1
1. INTRODUCTION
SNO-Hemoglobin
Nitric oxide (NO) was named “Molecule of the Year” by Science magazine in 1992
(1). In 1998, NO research earned Robert F. Furchgott, Louis J. Ignarro, and Ferid Murad
the Nobel Prize in Physiology and Medicine. Though NO is structurally simple, it
possesses rich reaction chemistry. NO, a gas at room temperature, is rapidly diffusing in
solution, can be a neutral metal ligand, and has one unpaired electron. Adding an
electron to NO generates the nitroxyl anion (NO–) while removing an electron creates the
nitrosonium ion (NO+). Reactions involving these formal, redox-related species allow
NO to perform chemistry unique to this molecule (2). Only in the last decade has it
begun to be understood that this chemistry is central to a variety of diverse biological
processes.
For decades, NO was thought to exhibit only toxic effects on biological systems.
Certainly, excessive exposure to NO can have cytotoxic effects, and NO involvement in
pathophysiology of Huntington’s, Parkinson’s, arthritis, and diabetes has been shown (3).
Since the late 1980’s, however, essential physiological roles for NO have been
demonstrated (4). For instance, endogenous NO performs essential tasks in both
neurotransmission and the immune response of humans (5). One of the most intriguing
roles of NO in the body is that exhibited in the cardiovascular system. The 1998 Nobel
Prize recognized the discovery that the “endothelium-derived relaxing factor” (EDRF)
that participates in the regulation of blood vessel tone is in fact NO (6). Through earlier
2
studies involving nitroglycerin, it had been known that NO could act as vasodilatory
agent; NO is a product of the breakdown of nitroglycerin and other vasorelaxant drugs
(7). Identification of EDRF as NO, however, was the first evidence that NO is an
endogenously produced substance. The subsequent elucidation of the enzymatic
production of NO from L-arginine by NO-synthase (8) consolidated the current
understanding that NO is an endogenous mediator of vascular tone.
Even before the identity of EDRF was established, it was known that NO could
tightly bind the heme iron of hemoglobin (9). Hemoglobin was demonstrated as a
functional antagonist of EDRF (NO) (6, 10). The antagonistic behavior was exploited in
studies that demonstrated NO to be EDRF (6). Accordingly, the notion of a fundamental
biological activity of NO in the cardiovascular system is challenged by the fact that the
circulation and other biological environments contain numerous potential reactants, such
as hemoglobin, that can transform or quench NO biological activity (2). These reactions
primarily involve NO adduct formation with metal ions and reaction with oxygen species
(11) or oxidative activation to form nitrites including peroxynitrite (12, 13), and nitrates
(14, 15). Therefore, a primary question is: How can NO exert biological activity in the
cardiovascular system without being quenched by hemoglobin? This question has been
addressed on three complementary levels. Liao and co-workers have championed the
idea that owing to the flow of blood, the large red blood cells tend to remain centered in
the vessels and avoid the walls where NO is produced (16). Lancaster has shown that the
cellular packaging of the hemoglobin further inhibits its reaction with NO (17, 18).
Finally, and arguably most important is that the chemistry of NO includes the formation
of thionitrites, which not only maintain bioactivity, but are among the most potent
3
vasodilatory compounds known. More importantly, they are also, by far, the most
prevalent bioactive NO compounds in the blood, entailing both low-molecular weight
nitrosthiols derivatives of cysteine and glutathione, but also S-nitrosylated proteins, such
as S-nitrosalbumin (19).
Stamler and co-workers in 1996, discovered that, among the blood proteins that
sustain S-nitrosylation is hemoglobin. Specific cysteine residues of hemoglobin form S-
nitrsosthiols both in vivo and in vitro (20). In tetrameric human Hemoglobin, with two
α- and two β-subunits, S-nitrosylation occurs at a highly conserved cysteine residue –
Cys-β93 – in human hemoglobin. S-nitrosylated hemoglobin, or SNO-hemoglobin, has
further been characterized by mass-spectrometry (21) and x-ray crystallography (22).
Therefore, these observations provide direct evidence for a previously unsuspected
NO/Hemoglobin reaction channel, via S-nitrosylation, that is evidently competitive with
the Fe(II)-NO and nitrate forming reactions, in vivo. This observation again raises the
question of how and why this competition works.
S-nitrosylation of hemoglobin has been observed to be linked to the quaternary state
of hemoglobin. The NO is buried in the ligated R-state of hemoglobin, but exposed and
readily lost by transnitrosation in the T-state structure. Stamler et al. also demonstrated
the existence and variable nature of nitrosylated hemoglobin in vivo (20, 23).
Micromolar concentrations of nitrosylated hemoglobin – SNO-hemoglobin and
hemoglobin-Fe(II)NO – were found in blood with different distributions between the two
in arterial versus venous blood. During the arterial/venous transit the total number of NO
groups on hemoglobin (SNO-hemoglobin and hemoglobin-Fe(II)NO) remains
approximately constant under normal physiological conditions, but the relative amounts
4
of each species shifts in favor of SNO-hemoglobin in the arteries and heme-Fe(II)NO in
the veins. The reversible nature of SNO formation and release in this reaction maintains
availability of NO for vasorelaxant action and blood flow regulation (20, 24).
This connection between vasodilatory potential and hemoglobin oxygenation seemed
to be tailored made to answer a long-standing problem in human physiology. In the
microcirculation, blood flow is regulated by position-to-position variations in O2 content
which are coupled to local vasodilation and vasoconstriction. Decreases and increases in
the O2 content of blood are, thus, coupled to increases and decreases in blood flow and
vice versa. These responses, also known as hypoxic vasodilation and hyperoxic
vasoconstriction, respectively, provide a means by which blood flow is precisely matched
with the oxygen needs of the tissues (25-28). This autoregulation of blood flow is known
to be exerted through local modulation of arteriolar tone, thus implicating a role for NO
bioactivity. Until now, the detailed biochemical mechanism through which graded
changes in O2 content evoke the vascular responses remains a major unanswered question
in vascular physiology. Hemoglobin would appear to be an ideal O2 sensor in this
regulatory process as ambient oxygen tension is rapidly reflected in the oxygen-saturation
of hemoglobin, and especially since it is the O2 saturation of blood, rather than the
ambient pO2, that determines blood flow (26). The discovery of SNO-hemoglobin and its
allosterically controlled NO-bioactivity activity provides an attractive solution to this
problem.
Prevailing ideas about the chemistry of the hemoglobin interaction with NO,
however, present a conceptual roadblock for understanding the manner in which this
signal transduction occurs. To regulate oxygen dependent blood flow, hemoglobin in its
5
encounters with NO, must avoid generating the ostensible dead ends of nitrate and
unrecoverable heme-Fe(II)NO (29). There must be physiologically accessible routes to
SNO formation and release. What are the important factors: that govern the maintaining
of bioactivity in encounters of NO with hemoglobin; that steer reactions away from dead-
ends such as nitrate and re-activate putative dead-ends such as nitrosylated hemes; and
that enable the formation of SNO-hemoglobin? This thesis work is directed toward
answering these questions. The chemical mechanisms of SNO-hemoglobin formation, as
well as the cycling/interplay of NO between Cys-β93 and heme-Fe(II) in vivo remain to
be clarified. This thesis work primarily consists of elucidating possible reaction
pathways for the production and interchange between heme-Fe(II)NO, Cys-β93-NO, and
heme-Fe(III)NO forms of adult human hemoglobin (Hemoglobin Ao). First, the reaction
of oxyhemoglobin with NO is investigated. It is demonstrated that this reaction involves
more than a simple competition between nitrate and heme-nitrosyl forming reaction
channels. Bioavailable NO is not wholly consumed but is conserved, in part, through the
formation of SNO-hemoglobin. Second, reductive nitrosylation reactions are explored to
demonstrate and illuminate chemical mechanisms the establish connectivity between
redox of the heme and nitrosylation of thiol groups within the hemoglobin molecule. We
demonstrate that heme and NO redox work together in a variety of reactions to produce
SNO-hemoglobin. Finally, I investigate the role of nitrite in hemoglobin reactions and
demonstrate the preference for both heme and S-nitrosylation reactions on the β-subunits
of hemoglobin. Overall, I describe results that support the role of hemoglobin-nitrosyl
complexes as reservoirs, transporters, and producers of NO in the circulation.
6
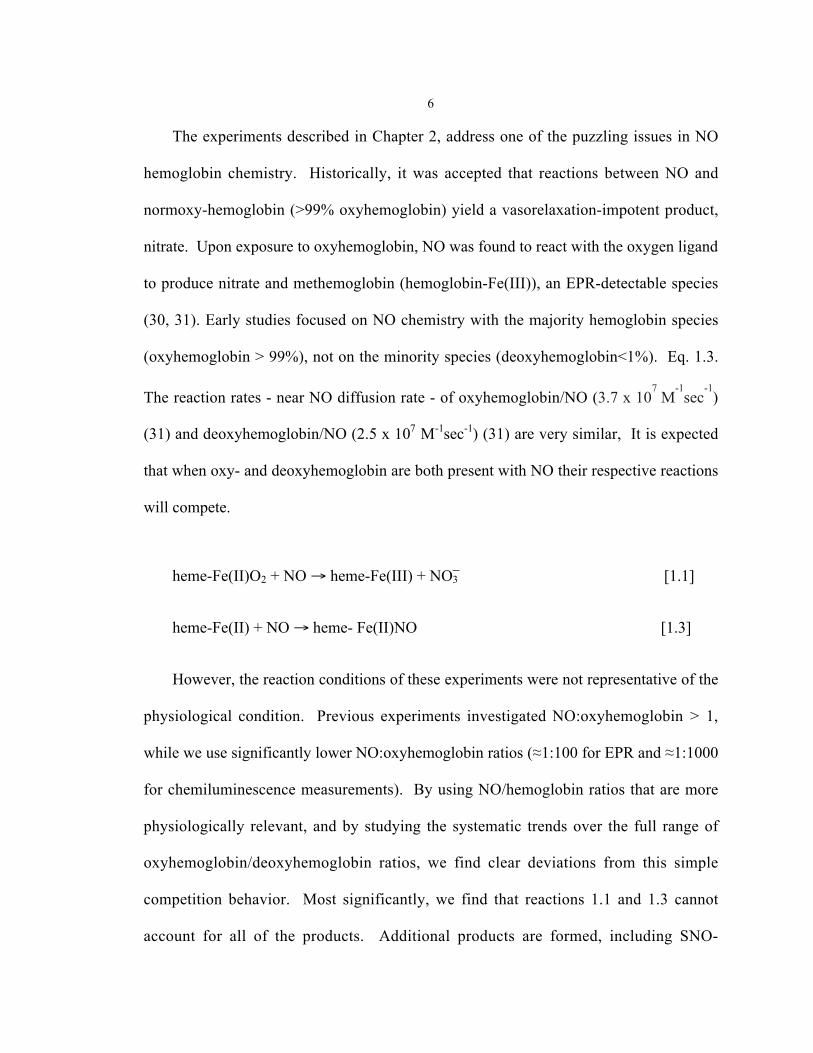
The experiments described in Chapter 2, address one of the puzzling issues in NO
hemoglobin chemistry. Historically, it was accepted that reactions between NO and
normoxy-hemoglobin (>99% oxyhemoglobin) yield a vasorelaxation-impotent product,
nitrate. Upon exposure to oxyhemoglobin, NO was found to react with the oxygen ligand
to produce nitrate and methemoglobin (hemoglobin-Fe(III)), an EPR-detectable species
(30, 31). Early studies focused on NO chemistry with the majority hemoglobin species
(oxyhemoglobin > 99%), not on the minority species (deoxyhemoglobin<1%). Eq. 1.3.
The reaction rates - near NO diffusion rate - of oxyhemoglobin/NO (3.7 x 10⁷
M-1
sec-1
)
(31) and deoxyhemoglobin/NO (2.5 x 10⁷ M-1sec-1) (31) are very similar, It is expected
that when oxy- and deoxyhemoglobin are both present with NO their respective reactions
will compete.
heme-Fe(II)O2 + NO → heme-Fe(III) + NO3 [1.1]
heme-Fe(II) + NO → heme- Fe(II)NO [1.3]
However, the reaction conditions of these experiments were not representative of the
The heme-Fe(II)NO+ species is in resonance with a nitrosylated methemoglobin species
as indicated in Equation 1.12:
heme-Fe(II)NO+ ↔ heme-Fe(III)NO [1.12]
11
The NO in the heme-Fe(III)NO species can undergo additional chemistry to create three
different products: nitrite, (Cys-β93)-SNO, and heme-Fe(II)NO through mechanisms
discussed in Chapter 4. These three products serve to create and preserve NO bioactivity
from nitrite. We report additional experiments involving cycles of
oxygenation/deoxygenation that demonstrate subunit selectivity. Each result presented in
this chapter points to a potential role for nitrite in regulation of vascular tone through
hemoglobin ligation intermediates.
In summary, the results presented in this doctoral thesis abolish the previously
accepted notion of hemoglobin as an NO sink. We demonstrate the formation of S-
nitrosylated hemoglobin – a species that maintains bioavailability of NO. We show that
even direct exposure of oxyhemoglobin to NO results in substantial formation of SNO
hemoglobin. We present results from experiments involving oxyhemoglobin,
deoxyhemoglobin, methemoglobin, and nitrosohemoglobin species with NO. The
chemistry we report herein possesses several novel features: a) the redox coupling
between the thiol and heme NO chemistry; b) unprecedented β-subunit selective
chemistry; and c) novel intra-molecular NO-group transfer chemistry. As a whole, the
chemistry of NO/hemoglobin reactions observed in vitro suggests a possible role of NO
and hemoglobin in regulation of vascular tone in vivo.
12
Delimitation of Thesis Work
The work reported in this thesis represents my contribution to a broader,
collaborative project involving members of the Singel group at Montana State University,
Bozeman, MT 59717 and the Stamler group at Duke University Medical Center,
Durham, NC 27710, USA.
Chapter 2 is a copy of a published article: Gow AJ, Luchsinger BP, Pawloski JR,
Singel DJ, Stamler JS. The oxyhemoglobin reaction of nitric oxide. Proc Natl Acad Sci U
S A. 1999 Aug 3;96(16):9027-32. The bulk of the work reported in chapter 2,
specifically the UV-Vis and EPR spectroscopy quantification of methemoglobin and
heme-Fe(II)NO reaction products as a function of Osat from 0 to ~85% was done by the
author at Montana State University. Reactions at very low NO levels and higher oxygen
saturations were done at Duke University Medical Center in the laboratory of Dr.
Jonathan S. Stamler by Dr. Andrew J. Gow. Red blood cell experiments were done at
Duke University Medical Center in the laboratory of Dr. Jonathan S. Stamler by Dr. John
R. Palowski.
Chapter 3 is a copy with some elaboration of experimental methods of the
publication: Luchsinger BP, Rich EN, Gow AJ, Williams EM, Stamler JS, Singel DJ.
Routes to S-nitroso-hemoglobin formation with heme redox and preferential reactivity in
the β-subunits. Proc Natl Acad Sci U S A. 2003 Jan 21;100(2):461-6. Some preliminary
work for this article was conducted by Dr. Andrew J. Gow and Eric N. Rich at Duke
University Medical Center. All of the measurements reported in detail were performed at
Montana State University by the author with assistance from Eric N. Rich and Elizabeth
13
M. Williams. SNO measurements after nitrite incubation were performed at Duke
University Medical Center.
All of the work summarized in Chapter 4 was performed at Montana State University
by the author. Some of these spectra were introduced into the publication that forms an
appendix to this thesis: McMahon TJ, Moon RE, Luchsinger BP, Carraway MS, Stone
AE, Stolp BW, Gow AJ, Pawloski JR, Watke P, Singel DJ, Piantadosi CA, Stamler JS.
Nitric oxide in the human respiratory cycle. Nat Med. 2002 Jul;8(7):711-7.
14
References
1. Culotta E, Koshland DE Jr. NO news is good news. (1992) Science. 258, 1862-1865.
2. Stamler JS, Singel DJ, Loscalzo J. Biochemistry of nitric oxide and its redox-activated forms. (1992) Science. 258, 1898-1902.
3. Wink DA, Hanbauer I, Grisham MB, Laval F, Nims RW, Laval J, Cook J, PacelliR, Liebmann J, Krishna M, Ford PC, Mitchell JB. Chemical biology of nitricoxide: regulation and protective and toxic mechanisms. (1996) Curr Top CellRegul. 34, 159-87.
4. Wink DA, Miranda KM, Katori T, Mancardi D, Thomas DD, Ridnour L, EspeyMG, Feelisch M, Colton CA, Fukuto JM, Pagliaro P, Kass DA, Paolocci N.Orthogonal properties of the redox siblings nitroxyl and nitric oxide in thecardiovascular system: a novel redox paradigm. (2003) Am J Physiol Heart CircPhysiol. 285, H2264-H2276.
5. Jacintho JD, Kovacic P. Neurotransmission and neurotoxicity by nitric oxide,catecholamines, and glutamate: unifying themes of reactive oxygen species andelectron transfer. (2003) Curr Med Chem. 10(24), 2693-2703.
6. Ignarro, LJ, Buga GM, Wood KS, Byrns RE, Chaudhuri G. Endothelium-derivedrelaxing factor produced and released from artery and vein is nitric oxide. (1987)Proc Natl Acad Sci U S A. 84, 9265-9269.
7. Murad F, Mittal CK, Arnold WP, Katsuki S, Kimura H. Guanylate cyclase:activation by azide, nitro compounds, nitric oxide, and hydroxyl radical andinhibition by hemoglobin and myoglobin. (1978) Adv Cyclic Nucleotide Res. 9,145-158.
8. Stuehr DJ. Structure-function aspects in the nitric oxide synthases. (1997) AnnuRev Pharmacol Toxicol. 37, 339-359.
9. Antonini E, Brunori M. (1971) in Hemoglobin and Myoglobin in Their Reactionswith Ligands, eds. Neuberger A & Tatum EL. (North-Holland, Amsterdam)
10. Palmer RM, Ferrige AG, Moncada S. Nitric oxide release accounts for thebiological activity of endothelium-derived relaxing factor. (1987) Nature. 327,524-526.
11. Saran M, Bors W. Pulse radiolysis for investigation of nitric oxide-relatedreactions. (1994) Meth Enzymol. 223, 21-35.
15
12. Beckman JS, Beckman TW, Chen J, Marshall PA, Freeman BA. Apparenthydroxyl radical production by peroxynitrite: implications for endothelial injuryfrom nitric oxide and superoxide. (1990) Proc Natl Acad Sci U S A. 87, 1620-1624.
13. Crow JP, Beckman JS. The role of peroxynitrite in nitric oxide-mediated toxicity.(1995) Curr Top Microbiol Immunol. 196, 57-73.
14. Gaston B. Nitric oxide and thiol groups. (1999) Biochim Biophys Acta. 1411,323-333.
15. Beckman JS, Carson M, Smith CD, Koppenol WH. ALS, SOD and peroxynitrite[letter]. (1993) Nature. 364, 584.
16. Liao JC, Hein TW, Vaughn MW, Huang KT, Kuo L. Intravascular flow decreaseserythrocyte consumption of nitric oxide. (1999) Proc Natl Acad Sci U S A. 96,8757-8761.
17. Liu X, Samouilov A, Lancaster JR Jr, Zweier JL. Nitric oxide uptake byerythrocytes is primarily limited by extracellular diffusion not membraneresistance. (2002) J Biol Chem. 277, 26194-26199.
18. Liao JC, Hein TW, Vaughn MW, Huang KT, Kuo L. Intravascular flowdecreases erythrocyte consumption of nitric oxide. (1999) Proc Natl Acad Sci U SA. 96, 8757-8761.
19. Foster MW, McMahon TJ, Stamler JS. S-nitrosylation in health and disease.(2003) Trends Mol Med. 9, 160-168.
24. Stamler JS, Simon SI, Osborn JA, Mullins ME, Omar J, Thomas M, Singel DJ,Localzo J. (1992) Proc Natl Acad Sci U S A. 89, 444-448.
16
25. Guyton AC, Ross JM, Carrier O, Walker JR. Evidence for tissue oxygen demandas the major factor causing autoregulation. (1964) Circ Res. 14-15, Suppl. 1: 60-60 (1964).
27. Gorczynski RJ, Duling BR. Role of oxygen in arteriolar functional vasodilation inhamster striated muscle. (1978) Am J Physiol. 235, H505-H515.
28. González-Alonso J, Richardson RS, Saltin B. Exercising skeletal muscle bloodflow in humans responds to reduction in arterial oxyhaemoglobin, but not toaltered free oxygen. (2001) J Physiol. 530, 331-341.
29. Yonetani T, Tsuneshige A, Zhou Y, Chen X. Electron paramagnetic resonanceand oxygen binding studies of α-nitrosyl hemoglobin. (1998) J Biol Chem. 273,20323-20333.
30. Doyle MP, Hoekstra JW. Oxidation of nitrogen oxides by bound dioxygen inhemoproteins. (1981) J Inorg Biochem. 14, 351-358.
31. Eich RF, Li T, Lemon DD, Doherty DH, Curry SR, Aitken JF, Mathews AJ,Johnson KA, Smith RD, Phillips GN Jr, Olson JS. Mechanism of NO-inducedoxidation of myoglobin and hemoglobin. (1996) Biochemistry. 35, 6976-6983.
32. Liu X, Miller MJ, Joshi MS, Sadowska-Krowicka H, Clark DA, Lancaster JR Jr.Diffusion-limited reaction of free nitric oxide with erythrocytes. (1998) J BiolChem. 273, 18709-18713; Joshi MS, Ferguson TB Jr, Han TH, Hyduke DR, LiaoJC, Rassaf T, Bryan N, Feelisch M, Lancaster JR Jr. Nitric oxide is consumed,rather than conserved, by reaction with oxyhemoglobin under physiologicalconditions. (2002) Proc Natl Acad Sci U S A. 99, 10341-10346.
33. Herold S, Rock G. Reactions of deoxy-, oxy-, and methemoglobin with nitrogenmonoxide. Mechanistic studies of the S-nitrosothiol formation under differentmixing conditions. (2003) J Biol Chem. 278, 6623-6634.
34. Palmerini CA, Saccardi C, Arienti G, Palombari R. Formation of nitrosothiolsfrom gaseous nitric oxide at pH 7.4. (2002) J Biochem Mol Toxicol. 16, 135-139.
35. Bunn HF, Forget BG. (1986) in Hemoglobin: Molecular, Genetic and ClinicalAspects, 1st ed., ed. Dyson J. (W. B. Saunders Company, Philadelphia, PA)
17
2. THE OXYHEMOGLOBIN REACTION OF NITRIC OXIDE
Abstract
The oxidation of nitric oxide (NO) to nitrate by oxyhemoglobin is a fundamental
reaction that shapes our understanding of NO biology. This reaction is considered to be
the major pathway for NO elimination from the body; it is the basis for a prevalent NO
assay; it is a critical feature in the modeling of NO diffusion in the circulatory system;
and it informs a variety of therapeutic applications, including NO inhalation therapy and
blood substitute design. Here we show that, under physiological conditions, this reaction
is of little significance. Instead, NO preferentially binds to the minor population of the
hemoglobin’s vacant hemes in a cooperative manner, nitrosylates hemoglobin thiols, or
reacts with liberated superoxide in solution. In the red blood cell, superoxide dismutase
eliminates superoxide, increasing the yield of S-nitrosohemoglobin and nitrosylated
hemes. Hemoglobin thus serves to regulate the chemistry of NO and maintain it in a
bioactive state. These results represent a reversal of the conventional view of
hemoglobin in NO biology and motivate a reconsideration of fundamental issues in NO
biochemistry and therapy.
Introduction
The chemistry of nitric oxide (NO) interactions with hemoglobin has served as a
ubiquitous model within the field of NO biochemistry. For example, the oxidative
interaction of NO with oxyhemoglobin (oxyHb) to produce nitrate is considered to be the
major route of NO catabolism (1–3) as well as a reliable method for assaying NO (4);
18
likewise the unique ability of NO to induce displacement of a trans-imidazole heme
ligand has been proposed as key to its activation of guanylyl cyclase (5). In the specific
realm of the cardiovascular system, these reactions: are fundamental elements of models
for NO diffusion (6, 7); played a crucial role in the identification of endothelium derived
relaxing factor (6–9); and inform a variety of therapeutic applications, including NO-
inhalation therapy (10, 11) and blood substitute design (12, 13).
Measurements of the rates of these reactions show that the NO-mediated oxidation of
oxyHb to methemoglobin (metHb) is kinetically competitive with the binding of NO to
unoccupied hemes in Hb—with specific rate constants of 3.7 x 10⁷ M-1 sec-1 and 2.6 x 10⁷
M-1 sec-1 respectively (14–16). The rates of NO oxidation of oxymyoglobin and NO
binding to ferrous myoglobin are also very similar (3.4 x 10⁷ M-1 sec-1 vs. 2.5 x 10⁷ M-1
sec-1) (16). Such a rapid route of NO metabolism is, however, difficult to reconcile with
mammalian NO production rates (17), which are orders of magnitude too low to sustain
physiological NO levels (10 nM − 1 µM) (7, 18–20), were NO to be freely consumed in
these reactions.1
Previous studies of the NO oxyHb reaction, however, had been performed with NO
concentrations 10-fold greater than protein (16). Under physiological conditions, the
concentration ratio is starkly different, with NO concentrations 1,000-fold lower than Hb
(20). Moreover, there is always a population of heme sites that are unoccupied. In
highly oxygenated Hb, as found in arterial blood, this population is small (≈1%) but is 1 The measured NO synthesis rate is 1.3 millimol per day for the average person (17). Tomaintain a basal NO concentration of 10 nm - 1 µM in vivo (6, 7, 18–20), 130 to 13,000mol of NO would be consumed per day in reaction with Hb (assuming kox = 3.7 x 10⁷ M-1
sec-1 (14), 5 L vascular volume). The hypothetical NO consumption rate, therefore, is105- to 107-fold greater than the actual production rate.
19
nevertheless in excess of NO. The influence of these vacant hemes, in the physiological
situation, cannot be ignored; they might successfully compete for NO with the much
larger fraction (≈99%) of oxygen-ligated hemes, if NO binding to hemes in oxyHb were
cooperative, that is, if NO addition rates were to increase with increasing oxygen
saturation. This possibility has not been raised in previous discussions of NO and Hb
chemistry (1–7, 16, 21–24). On the contrary, the demonstrated lack of cooperativity in
the binding of NO to deoxyhemoglobin (deoxyHb) (14)—which indicates that the
intrinsic NO addition rate constants do not change with NO saturation—implicitly shapes
the current perspective. It is important to recognize, however, that these results do not
imply that the NO addition rates to oxygenated Hb are similarly independent of the
oxygen saturation, and thus cannot be assumed to apply to the physiological situation. In
addition to these oxidation and addition reactions, recent studies (20, 25, 26) make it
clear that additional reactions, in particular S-nitrosylation, should be considered in any
assessment of the chemical interplay of NO and human Hb. The S-nitrosylation reaction
assumes particular importance inasmuch as it conserves, rather than consumes, NO
bioactivity.
In this article, we discuss the reactions that occur on exposure of Hb to NO at
relative concentrations that reflect the physiological situation. We show that the addition
of NO to oxyHb takes advantage of the cooperative effects of oxygen binding and thus
effectively competes with the oxidation reaction. We further find that at high oxygen
saturations, reactions that S-nitrosylate the protein occur to a significant extent. Taken as
a whole, these data indicate that the interaction of NO with oxyHb, rather than destroying
NO bioactivity as widely misapprehended, acts to preserve it—that Hb very cleverly
20
introduces new chemistry, when oxygen saturation is high, that limits oxidation and
channels the NO groups into products that preserve their bioactivity. This picture
represents a substantial reversal of the conventional thinking on the chemistry of Hb as it
pertains to NO biology and has fundamental implications for the general chemistry of
heme containing proteins.
Methods
Reaction Product Analysis.
To investigate the reaction of NO with oxyHb, we begin by adopting the
conventional viewpoint that: NO consumption involves a competition between the
oxidation reaction (Eq. 1) and the adduct-forming addition reaction (Eq. 2); and that the
specific rate constants for these reactions, namely kox and kadd, are independent of the
degree of oxygen saturation (Y) of the hemes.
Fe(II)O2 + NO → Fe(III) + NO 3 [1]
Fe(II) + NO → Fe(II)NO [2]
These two assumptions define a perspective of the NO reaction that we refer to as the
‘‘simple competition model.’’ Our analysis of the reaction products, as described in this
section, enables us to test the adequacy of this model for describing the chemistry and to
recognize and interpret deviations from the behavior implied by it.
In our experiments, NO is introduced as a limiting reagent in an amount substantially
smaller than the total amount of oxy- and deoxyhemes. On completion of the reaction,
the following relation can be shown to exist among the products:
(DTPA), pH 7.4. NO injections were made via a gas-tight Hamilton syringe with Teflon
seal. The concentration of NO in stock solutions was assayed by electrode and by a
Sievers 280 NO analyzer (Boulder, CO).
Titration of Normoxic Hb with NO.
Air-oxygenated Hb was titrated with 0.22 µM NO. Samples were analyzed
immediately after NO addition by UV-visible spectrophotometry; time between additions
varied from 3 to 5 min.
23
Measurements of S-Nitroso-, Iron Nitrosyl-, and Met-Hb.
Nitroso/nitrosyl derivatives of Hb were measured by using a photolysis-
chemiluminescence technique [6-fold excess HgCl2 over protein was added to displace S-
nitrosothiol (SNO) (26)]. Samples were kept on ice for a period of 5 min to 2 hr before
analyses. MetHb was monitored by UV-visible spectroscopy as the difference absorption
above the linear baseline (600–700 nm), and by EPR (below).
EPR Analysis.
EPR spectroscopy was carried out with samples in 4-mm i.d. fused silica tubes, at
76° K, on a Varian E-9 spectrometer. UV-visible spectra were taken after NO addition.
The sample was then placed in a deoxygenated EPR tube and plunged into liquid N2.
EPR spectra of nitrosylHb or dinitrosyl iron complexes (DNICs) were recorded in a
single 4-min scan over 400 G on a Varian E-9 spectrometer operating at 9.274 GHz, with
10-mW microwave power, 10–20 G amplitude of field modulation at 100 kHz, and time
constant of 0.250 sec. Spectra of high-spin metHb were recorded with a scan of 1,000 G,
20 G modulation amplitude, time constant of 0.128 sec, under otherwise identical
conditions. NitrosylHb was measured by double integration of EPR spectra and by
comparison to EPR spectra of Hb(NO)4 standardized with UV-visible spectroscopy. The
reproducibility of nitrosylHb measurements was estimated to be ±6% by repeated trials.
Measurement of Oxygen Saturation.
Oxygen saturation of Hb was verified by UV-visible spectroscopy by using a 1-mm
anaerobic cuvette.
24
Extinction Coefficients.
The extinction coefficient spectra of metHb, deoxyHb, iron nitrosylHb, and oxyHb
were generated from pure solutions of each species. HbA was diluted into PBS (pH 7.4)
to a known final heme concentration [as calculated by the pyridine-hemochromagen
method (23)]. MetHb was synthesized by adding excess K3Fe(CN)6. DeoxyHb was
measured after the addition of dithionite, and nitrosyl- and oxyHb were measured after
saturation with each ligand.
Modeling of UV-Visible Difference Spectra.
Difference spectra were obtained by subtracting the UV-visible spectrum of a given
sample before the addition of NO from those after. The simple competition model
discussed above predicts that such difference spectra could be approximated by a linear
combination of two standard difference spectra: an oxyHb minus metHb spectrum, which
gauges the progress of the NO oxidation reaction, and a deoxyHb minus iron nitrosylHb,
which gauges the NO addition reaction; the sum of the combining coefficients is fixed by
the mass balance ([NO]o). Standard difference spectra were obtained from UV-visible
spectra of authentic samples of metHb, oxyHb, nitrosylHb, and deoxyHb. We
determined combining coefficients by a least squares fitting procedure. Inasmuch as the
deoxy- and/ or oxyheme concentrations can decline during the competition, an additional
component (deoxyHb minus oxyHb) could be expected.
25
Results and Discussion
EPR spectroscopy was used to assess the formation of nitrosyl heme on addition of
NO to Hb preparations with oxygen saturations (Y) in the range 0–80% (typical EPR
spectra are shown in Fig. 2.1A and B). EPR signal intensities were used to quantify the
proportion of nitrosylated hemes relative to the NO initially added; the results of this
quantification are plotted vs. Y in Fig. 2.1C (10 mM phosphate) and D (100 mM
phosphate). The data obtained at high phosphate levels follow the behavior described by
Eq. 4, the solid curves through the data points are graphs of Eq. 4 with κ values for the
two depicted curves averaging 1.40 ± 0.06. The data obtained at the lower phosphate
level, however, exhibit a notable deviation from the simple model: they cross the
diagonal, thus showing a progressive overproduction of nitrosyl heme. Furthermore, the
limiting tangential slopes indicate that κ is decreasing with increasing Y. By empirical
curve fitting, we found that the data in Fig. 2.1 C are well described by a function of the
form (1 + Y)/(1 + cY) (c, a constant). (The solid lines in Fig. 2.1 C are graphs of this
function with least-squares best values of the parameter c). This functional form can be
assimilated to that of Eq. 4, provided κ is allowed to vary with Y [specifically, κ = (c –
1)(1 – Y)/(1 + Y)]. This result indicates that over the 0 to 80% range of oxygen
saturation, κ decreases 7-fold and suggests, by extrapolation, a 100-fold decrease at 90%
saturation. We attribute this variation in κ primarily to an increase in kadd,, as kox does
not vary by more than a factor of 2, as judged from the limiting slopes and the literature
values for kox (Y = 100%) and kadd (Y = 0%).
26
3100 3200 3300 3400
EPR
Sig
nal
Magnetic Field (Gauss)
A
3100 3200 3300 3400
EPR
Sig
nal
Magnetic Field (Gauss)
B
0
20
40
60
80
100
0 20 40 60 80 100O2 Saturation
HbN
O Y
ield
(%N
O a
dded
)
C
0
20
40
60
80
100
0 20 40 60 80 100O2 Saturation
HbN
O Y
ield
(%N
O ad
ded) D
Figure 2.1 Production of iron nitrosylHb by addition of NO to variously oxygenated Hb. (A)EPR spectra of iron-nitrosyl Hb derivatives formed by incubation of 19 µM NO with 393 µMHb at various degrees of oxygen saturation in 10 mM phosphate buffer, pH 7.4. The oxygensaturations for the largest through smallest EPR signals are 5.5, 32, 50, and 69%,respectively. Spectra show predominantly six coordinate α and β nitrosyl hemes, as typicallyobserved for Hb in R state. (B) EPR spectra of iron-nitrosyl Hb derivatives formed byincubation of 55 µM NO with 380 µM Hb at various degrees of oxygen saturation in 100 mMphosphate, pH 7.4. The oxygen saturations for the largest through smallest EPR signals are 1,15, 41, 60, and 80%, respectively. Spectra show a significant component of five coordinate anitrosyl hemes (triplet structure) associated with Hb in T state. (C) Trials conducted with Hbin 10 mM phosphate, pH 7.4. The symbols are experimental results and the solid linesrepresent a best fit to the functional form for cooperative NO binding. Open diamonds, 393µM Hb incubated with 19 µM NO; open circles, 350 µM Hb incubated with 15 µM NO plus0.05% borate (added to bring the buffer concentration to 100 mM as in D); open squares, 365µM Hb incubated with 15 µM NO and 1,190 units/ml SOD. (D) Trials conducted with Hb in100 mM phosphate, pH 7.4. The symbols are experimental results, and the lines represent abest fit to the functional form for simple competition between oxidation and NO additionreactions (Eq. 4). Filled circles, 380 µM Hb incubated with 55 µM NO; filled squares, 375µM Hb incubated with 7 µM NO. Application of the simple competition function to data of Cor the cooperativity function to data of D gives an order of magnitude increase in x2.
We also assessed the formation of oxidized ferric hemes with EPR (data not shown)
and UV-visible difference spectroscopy (Fig. 2.2). The results obtained from samples in
27
100 mM phosphate conform to the simple competition model: the dashed lines in the
figure, which are calculated from the curves depicted in Fig. 2.1D following Eq. 5, agree
extremely well with the experimental measurements. Experiments conducted in 10 mM
phosphate, however, show a stark deviation from the simple model behavior.
Qualitatively, the results show that heme oxidation never grossly exceeds heme
nitrosylation. Moreover, there is a progressive shortfall in the Fe(III) and Fe(II)NO
products. This shortfall is indicated by the departure of the experimental points (10 mM
phosphate) in Fig. 2.2, from the curves calculated from the curves depicted in Fig. 2.1D
following Eq. 5, and amounts to as much as ~20% of added [NO]o. This behavior
strongly suggests the presence of additional NO reaction pathways.
0
20
40
60
80
100
0 20 40 60 80 100O2 Saturation
HbN
O Y
ield
(%N
O ad
ded)
Figure 2.2 Production of metHb by reaction of NO is disfavored with increasing oxygensaturation. The samples used in Fig. 2.1 were assayed for metHb production by UV-visible difference spectroscopy. The data are normalized to added [NO]. As in Fig. 2.1,open diamonds, 10 mM phosphate; open circles, 10 mM phosphate plus borate; opensquares, 10 mM phosphate plus SOD; filled circles and filled squares, 100 mMphosphate. The dotted (10 mM phosphate) and dashed (100 mM phosphate) lines arecalculated by using Eq. 5 and Fe(II)NO yields in Fig. 2.1 C and D, respectively. Datashow metHb to be disfavored in low phosphate, particularly at high oxygen saturation.Deviations of the data points below the curves suggest the presence of additionalreactions for NO. Systematic deviations are most pronounced in low phosphate at highoxygen saturation-i.e., under physiological conditions.
28
In summary, we find that NO binding to oxyHb is cooperative; that oxidation to
ferric heme (metHb) is limited under physiological conditions; and that additional
chemistry is occurring in the more oxygenated Hb species that are prevalent in vivo. Our
findings might seem at odds with previous literature suggesting that NO binding to Hb is
noncooperative (14). The proper conclusion to draw from these prior studies, however, is
that NO (ligand) binding to nitrosylHb shows little cooperativity with varying NO-
saturation—a scenario of little physiological relevance, because NO is never the
dominant ligand in vivo. Our results reflect the physiological situation in which the
ligand, NO, binds to Hb with some degree of oxygen saturation. The functional behavior
in this situation is, not surprisingly, cooperative. In this regard, experiments of particular
interest are those conducted in the presence of high phosphate concentrations (100 mM),
which perturb the allosteric modulation of ligand affinity by disfavoring the relaxed [R
(oxy)] structure among the partially ligated hemoglobins, as evidenced by the hyperfine
structure in the EPR (Fig. 2.2) (27). Thus, normal T (deoxy)/R (oxy) interconversion in
Hb appears to be essential for ‘‘normal’’ NO function (Fig. 2.1 and 2.3). Taken together,
the EPR results demonstrate that when the oxygen-induced allosteric transition is
unhindered, NO binding to oxygenated Hb is cooperative—a situation that leads to
enhanced iron nitrosyl- and limited metHb formation.
To extend these results to arterial oxygen saturation (of ≈99%) and physiological NO
concentrations (≈1 µM), we used photolysis–chemiluminescence to measure nitrosyl
derivatives of Hb (Fig. 2.3 A). In these experiments, normoxic Hb is in excess of NO,
but NO is in excess of the vacant hemes, a scenario disfavoring NO addition. Our results
show that even at high oxygen saturation, a substantial fraction of the NO— rather than
29
forming nitrate by the oxidation reaction—forms chemiluminescence-detectable nitrosyl
derivatives. Of further interest, the yield of nitrosyl species increases with increasing
[Hb] up to a maximum of approximately 50% of NO added (relative to the [Hb] the
nitrosyl yield varies from 3 to 0.6%) (Fig. 2.3 A). In the simple competition model, the
fraction of nitrosylation products would be independent of protein concentration. These
results thus clearly demonstrate that additional reactions, beyond NO binding to vacant
hemes to form the nitrosyl-heme derivative, are occurring under these conditions.
Figure 2.3. NO addition under normoxic conditions (≈99% O2 saturation) producesnitrosylated Hb. (A) Nitrosyl content of oxyHb (10 mM phosphate/100 µM DTPA, pH7.4) after exposure to 1.2 µM NO, as measured by photolysis-chemiluminescence (26).Nitrosyl yield increases as a function of Hb concentration (P , 0.05). Solid symbols,absolute yield of NO bound to Hb (FeNO plus SNO); open symbols, percentage of NOadded. Data shown are the average of 7 to 19 experiments 6SE. (B) Standard differencespectra of metHb (solid line), deoxyHb (dotted line), and iron nitrosylHb (dashed line) vs.oxyHb (see Materials and Methods for conditions). (C) Difference spectra generatedfrom the exposure of NO to normoxic (≈99% oxygen sat.) Hb. NO was added (in 10aliquots totaling 2.2 µM) to 33 µM Hb in 100 mM phosphate (solid line) or 10 mMphosphate (dotted line) or 10 mM phosphate plus 0.05% borate (dashed line). Notably,the spectrum in 100 mM phosphate shows the formation of metHb (e.g., peak at 630 nm;see B for comparison); the spectrum in 10 mM phosphate shows formation of ironnitrosyl Hb and some metHb [e.g., peak at 595 nm (nitrosyl) and small peak at 630 nm
30
(met); see B for comparison]; and the spectrum in 10 mM phosphate plus borate showspredominantly iron nitrosylHb (e.g., peak at 595 nm; see B for comparison). (D)Calculated fits for difference spectra shown in C, demonstrating simple (noncooperative)competition between NO binding and oxidation reactions in high phosphate (solid line,95% metHb) and cooperative binding in low phosphate (dotted line, 54% iron nitrosylHb;only 50% of the added NO accounted for) and low phosphate plus borate (dashed line;85% iron nitrosylHb). Specifically, spectra in C were fitted, by a least-squares process,to either the simple competition model or the cooperativity model without a mass balanceconstraint.
To gain further insight into this chemistry, we used the discriminating power of
difference absorption spectroscopy. Difference spectra obtained by titration of
submicromolar concentrations of NO against 33 µM Hb in room air (99% O2 saturation)
are shown in Fig. 2.3 C; standard difference spectra of authentic met-, deoxy-, and
nitrosylHb relative to oxyHb are shown in Fig. 2.3 B. If the chemistry were to proceed
according to the simple model, then at Y = 99% the oxidation reaction would
predominate and the observed difference spectra would closely resemble the metHb
minus oxyHb standard difference spectrum. This behavior was observed only at high
phosphate concentrations (Fig. 2.3 C and D), consistent with the EPR results above. At
low phosphate concentrations, we found that the difference spectra point largely toward
the formation of nitrosylated heme: much of the difference spectrum can be accounted for
by the deoxyHb minus nitrosylHb standard spectrum (Fig. 2.3 C). To produce adequate
difference-spectrum simulations, it was necessary to include a deoxyHb minus oxyHb
component (presumably reflecting compensation for the nitrosylative loss of vacant
hemes), and, most significantly, to relax the mass-balance constraint: a measurable
fraction of [NO]o was not accounted in the Hb spectra (Fig. 2.3 C and D); the spectra
account for only 50% in low phosphate and 80% in low phosphate plus borate. Taken as
a whole, these data extend to normoxic conditions the conclusions made above, namely:
31
direct oxidation by NO is not the predominant reaction at low NO to heme ratios;
addition of NO to vacant hemes remains competitive; and further reaction pathways,
beyond oxidation and addition, must be occurring.
One additional species that could compete for NO is superoxide —liberated by the
autooxidation of oxygenated Hb (28). To examine this possibility, we repeated the
experiments detailed in Fig. 2.3 A in the presence of superoxide dismutase (SOD) (Fig.
2.4 A). At all concentrations of Hb used, the presence of SOD increased the yield of Hb
nitrosyl derivatives (i.e., total NO bound) to approximately 100% of [NO]o (Fig. 2.4 A).
Similarly, SOD led to increases in the yield of nitrosylated hemes detected in the EPR
experiments (Fig. 2.1 C). Evidently, under these conditions, superoxide is a significant
competitor for NO, or perhaps SOD alters the reactivity (oxidation and/or ligand binding)
of Hb. Interestingly, when these experiments were performed with stroma-free Hb, a
RBC preparation that contains normal levels of SOD, similar results were observed (Fig.
2.4 A). It is further notable that analogous effects on the nitrosyl yield—assessed by
EPR, chemiluminescence, and difference spectroscopy—were obtained when borate was
included in the buffer medium (Figs. 2.1 A, 2.2, and 2.3 C). Borate most likely exerts
this effect by altering the ligand on-rate for NO or the reactivity of the oxygen ligand
with NO, or perhaps the intrinsic autooxidation rate of Hb. Phosphate levels may also
influence these parameters.
32
Figure 2.4. S-nitrosoHb and iron nitrosylHb formed under various physiological air-oxygenated conditions. (A) SOD increases the yield of NO bound to Hb. Theexperiments in Fig. 2.3 A were repeated in the absence (solid line; 1.2 µM NO) orpresence (dashed line; 1.5 µM NO) of 1,190 units/ml of SOD, which enhances the yieldof nitrosyl species to approximately 100% of the NO added. Similar nitrosyl yields wereobtained by using stroma-free Hb (25 µM), which is enriched in endogenous SOD (opencircle). Data shown are the average of five to nine experiments 6SE. (B) EPR spectrumof a DNIC formed by exposure of oxyHb (≈99% sat; 3.93 µM) to NO (36 µM). (C) S-nitrosoHb and iron nitrosylHb formed by exposure of oxyHb (≈99% sat., 48 µM) to NO(1.2 µM). SNO (hatched bar) and FeNO (solid bar) were measured by photolysis-chemiluminesence (26). Data shown are the average of 12 experiments 6SE. (D)Measurement of intraerythrocytic S-nitrosoHb and iron nitrosylHb formed by exposure ofoxygenated RBCs (mean [Hb], 25 µM) to 1 µM NO. Isolation of Hb and measurementswere as previously described (26). Data are the mean of 12 experiments 6SE.
An important clue to additional reaction pathways comes from our analyses under
normoxic conditions: nitrosyl yields as high as 6% of Hb were observed by photolysis-
chemiluminesence, notwithstanding the fact that the proportion of heme vacancies is only
≈1%. These nitrosyl species, moreover, did not affect the UV-visible spectra. EPR of
samples under these conditions exhibit spectra similar to the DNICs exhaustively studied
by Vanin (29), albeit they account for a small percentage of NO added (Fig. 2.4 B).
33
DNICs are known to form from SNOs with which they exist in equilibrium (29). Indeed,
chemiluminesence analysis of the products formed on addition of 1.2 µM NO to 48 µM
oxyHb, which produces nitrosyl yields of approximately 500 nM (Figs. 2.1 A and 2.3 A),
show that ≈80% of this nitrosyl yield is SNO (Fig. 2.4 C). Moreover, treatment of
aerated RBCs with physiological concentrations of NO (1 µM) resulted in relatively high
improve blood flow to ischemic tissues (34), and increase glomerular filtration rate (35).
These discoveries have a strong bearing both on the way NO–heme interactions are
modeled and on our understanding of NO biology. The current view of the NO
interaction with Hb in vivo is derived from a model in which the elimination as NO3 is
dominant and NO release from Hb is inconsequential (1, 3, 4, 6, 7, 15, 16, 36). In reality,
Hb musters additional reaction pathways to keep the balance in favor of maintaining the
NO group in a bioactive state. These chemical reactions with thiols, metals, and
superoxide are the essential elements of the extended paradigm of NO biochemistry
presented some years ago (37).
Our results have important implications for rational design of blood substitutes, NO
scavengers, and therapeutic NO donors. Additionally, they predict that measurements of
NO with the oxyHb assay will tend to underestimate NO production, unless appropriate
precautions are taken, and more generally point to limitations of Hb-based approaches for
identification of NO bioactivity. Finally, these findings raise fundamental questions. For
example, nitrate remains the major metabolic product of NO in vivo, but the question now
arises as to its source. It is tempting to suggest the involvement of a heme protein that
can neither enforce the cooperativity of ligand binding, nor recruit the thiol reaction
pathway. These properties are exemplified in the bacterial flavohemoglobin whose
recently identified enzymatic function involves the oxidation of NO to nitrate (38, 39).
35
Whereas the primordial bacterial Hb is designed to metabolize NO (39), mammalian Hb
is designed to secure and deliver it (20, 25, 26). These observations suggest that the
molecular evolution of Hb was impacted by its NO-related functions.
36
References
1. Kelm, M. & Yoshida, K. (1996) in Metabolic Fate of Nitric Oxide and Related N-Oxides, eds. Feelisch, M. & Stamler, J. S. (Wiley, London) 1st Ed., pp. 47–58.
2. Pietraforte, D., Mallozzi, C., Scorza, G. & Minetti, M. (1995) Biochemistry 34,7177–7185.
3. Wennmalm, A., Benthin, G. & Petersson, A. S. (1992) Br. J. Pharmacol. 106,507–508.
4. Feelisch, M., Kubitzek, D. & Werringloer, J. (1996) in The Oxyhemoglobin Assay,eds. Feelisch, M. & Stamler, J. S. (Wiley, London) 1st Ed., pp. 455–478.
5. Traylor, T. G. & Sharma, V. S. (1992) Biochemistry 31, 2847–2849.
6. Liu, X., Miller, M. J., Joshi, M. S., Sadowska-Krowicka, H., Clark, D. A. &Lancaster, J. R., Jr. (1998) J. Biol. Chem. 273, 18709–18713.
7. Lancaster, J. R., Jr. (1994) Proc. Natl. Acad. Sci. USA 91, 8137–8141.
8. Palmer, R. M., Ferrige, A. G. & Moncada, S. (1987) Nature (London) 327, 524–526.
9. Ignarro, L. J., Buga, G. M., Wood, K. S., Byrns, R. E. & Chaudhuri, G. (1987) Proc.Natl. Acad. Sci. USA 84, 9265–9269.
10. Roissant, R., Falke, F. J., Lopez, F., Slama, K., Pison, U.&Zapol, W. M. (1993) NewEngl. J. Med. 328, 399–405.
11. Wessel, D. L., Adatia, I., Giglia, T. M., Thompson, J. E. & Kulik, T. J. (1993)Circulation 88, 2128–2138.
12. Alayash, A. I. & Cashon, R. E. (1995) Mol. Med. Today 1, 122–127.
13. Doherty, D. H., Doyle, M. P., Curry, S. R., Vali, R. J., Fattor, T. J., Olson, J. S. &Lemon, D. D. (1998) Nat. Biotechnol. 16, 672–676.
14. Cassoly, R. & Gibson, Q. H. (1975) J. Mol. Biol. 91, 301–313.
15. Doyle, M. P. & Hoekstra, J. W. (1981) J. Inorg. Chem. 14, 351–358.
16. Eich, R. F., Li, T., Lemon, D. D., Doherty, D. H., Curry, S. R., Aitken, J. F.,Mathews, A. J. X. J. K., Smith, R. D., Phillips, G. N., Jr. & Olson, J. S. (1996)Biochemistry 35, 6976–6983.
37
17. Castillo, L., Beaumier, L., Ajami, A. M. & Young, V. R. (1996) Proc. Natl. Acad.Sci. USA 93, 11460–11465.
18. Pinsky, D. J., Patton, S., Mesaros, S., Brovkovych, V., Kubaszewski, E., Grunfeld, S.& Malinski, T. (1997) Circ. Res. 81, 372–379.
19. Vallance, P., Patton, S., Bhagat, K., MacAllister, R., Radomski, Moncada, S. &Malinski, T. (1995) Lancet 346, 153–154.
20. Jia, L., Bonaventura, C., Bonaventura, J. & Stamler, J. S. (1996) Nature (London)380, 221–226.
21. Marletta, M. A., Tayeh, M. A. & Hevel, J. M. (1990) Biofactors 2, 219–225.
22. Moore, E. G. & Gibson, Q. H. (1976) J. Biol. Chem. 251, 2788–2794.
23. Antonini, E. & Brunori, M. (1971) Frontiers in Biology, eds. Neuberger, A. &Tatum, E. L. (North-Holland, Amsterdam) 21, p. 13.
24. Sharma, V. S., Traylor, T. G., Gardiner, R. & Mizukami, H. (1987) Biochemistry 26,3837–3843.
25. Gow, A. J. & Stamler, J. S. (1998) Nature (London) 391, 169–173.
26. Stamler, J. S., Jia, L., Eu, J. P., McMahon, T. J., Demchenko, I. T., Bonaventura, J.,Gernert, K. & Piantadosi, C. A. (1997) Science 276, 2034–2037.
27. Takahashi, Y., Kobayashi, H., Tanaka, N., Sato, T., Takizawa, N. & Tomita, T.(1998) Am. J. Physiol. 274, H349–H357.
28. Misra, H. P.&Fridovich, I. (1972) J. Biol. Chem. 247, 6960–6962.
29. Vanin, A. F., Malenkova, I. V.&Serezhenkov, V. A. (1997) Nitric Oxide 1, 191–203.
30. Hall, D. M., Buettner, G. R., Mathes, R. D. & Gisolfi, C. V. (1994) J. Appl. Physiol.77, 548–553.
31. Westfelt, U. N., Benthin, G., Lundin, S., Stenqvist, O. & Wennmalm, A. (1995) Br.J. Pharmacol. 114, 1621–1624.
32. Kermarrec, N., Zunic, P., Beloucif, S., Benessiano, J., Drouet, L. & Payen, D. (1998)Am. J. Respir. Crit. Care Med. 158, 833–839.
33. Head, C. A., Brugnara, C., Martinez-Ruiz, R., Kacmarek, R. M., Bridges, K. R.,Kuter, D., Bloch, K. D. & Zapol, W. M. (1997) J. Clin. Invest. 100, 1193–1198.
38
34. Fox-Robichaud, A., Payne, D., Hasan, S. U., Ostrovsky, L., Fairhead, T., Reinhrdt,P. & Kubes, P. (1998) J. Clin. Invest. 101, 2497–2505.
35. Troncy, E., Francoeur, M., Salazkin, I., Yang, F., Charbonneau, Leclerc, G., Vinay,P. & Blaise, G. (1997) Br. J. Anaesth. 79, 631–640.
36. Sharma, V. S. & Ranney, H. M. (1978) J. Biol. Chem. 253, 6467–6472.
37. Stamler, J. S., Singel, D. J. & Loscalzo, J. (1992) Science 258, 1898–1902.
38. Gardner, P. R., Gardner, A. M., Martin, L. A. & Salzman, A. L. (1998) Proc. Natl.Acad. Sci. USA 95, 10378–10383.
39. Hausladen, A., Gow, A. J. & Stamler, J. S. (1998) Proc. Natl. Acad. Sci. USA 95,14100–14105.
39
3. ROUTES TO S-NITROSO-HEMOGLOBIN FORMATION WITH HEME REDOXAND PREFERENTIAL REACTIVITY IN THE β-SUBUNITS
Abstract
Previous studies of the interactions of NO with human hemoglobin have implicated
the predominance of reaction channels that alternatively eliminate NO by converting it to
nitrate, or tightly complex it on the α-subunit ferrous hemes. Both channels could
effectively quench NO bioactivity. More recent work has raised the idea that NO groups
can efficiently transfer from the hemes to cysteine thiols within the β-subunit cys(β-93)
to form bioactive nitrosothiols. The regulation of NO function, through its chemical
position in the hemoglobin, is supported by response to oxygen and to redox agents that
modulate the molecular and electronic structure of the protein. In this article, we focus on
reactions in which Fe(III) hemes could provide the oxidative requirements of this NO-
group transfer chemistry. We report a detailed investigation of the reductive nitrosylation
of human met-Hb, in which we demonstrate the production of SNO-Hb through a heme-
Fe(III)NO intermediate. The production of SNO-Hb is strongly favored (over nitrite)
when NO is gradually introduced in limited total quantities; in this situation, moreover,
heme nitrosylation, occurs primarily within the β-subunits of the hemoglobin tetramer.
SNO-Hb can similarly be produced when Fe(II)NO hemes are subjected to mild
oxidation. The reaction of deoxygenated hemoglobin with limited quantities of nitrite,
leads to the production of β-subunit Fe(II)NO hemes, with SNO-Hb produced upon
subsequent oxygenation. The common theme of these reactions is the effective coupling
of heme-iron and NO redox chemistries. Collectively they establish a connectivity
40
between hemes and thiols in Hb, through which NO is readily dislodged from storage on
the heme to form bioactive SNO-Hb.
Introduction
The transfer of NO-groups within human hemoglobin from hemes to cys(β-93) thiols
to form a bioactive nitrosothiol represents a novel, intramolecular biochemistry that is
both of fundamental interest, and has considerable implications for understanding the
physiological effects of NO in the regulation of vascular tension and blood flow. A
requirement of this transfer, common to biological S-nitrosylation (1), is the redox
activation of the NO group (2). In this article, we report the results of experiments that
probe the idea that heme-iron valence change can support the oxidative requirements of
NO-group transfer, and thus efficiently lead to the production of SNO-Hb. As a model of
the reaction between ferric hemes and NO, the reductive nitrosylation of human
methemoglobin, is examined in detail. Product distribution assays reveal that SNO-Hb is
formed as a nitrosation product, which, moreover, is substantially favored over NO 2 when
NO is gradually introduced as a limiting reagent; furthermore, in this situation, heme
nitrosylation, occurs primarily within the β-subunits of the Hb tetramer. A kinetic
analysis unambiguously reveals the intermediacy of heme-Fe(III)NO in this reaction. To
extend our observations to reactions that could mimic this chemistry, but do not require
an accumulation of the methemoglobin reactant, we additionally examined oxidation of
Fe(II)NO in Hb as well as Hb reactions with nitrite. We report that SNO-Hb can
similarly be produced when Fe(II)NO species are subjected to mild oxidation. Further we
show that upon exposure to limited quantities of nitrite, oxy-Hb is unreactive, but deoxy-
41
Hb leads to the production of β-subunit Fe(II)NO hemes, with SNO-Hb produced upon
subsequent oxygenation. These reactions, which have common characteristic of coupling
of heme-iron valence change with NO chemistry, establish a connectivity between hemes
and thiols in Hb, through which NO is readily dislodged from storage on the heme to
form SNO-Hb, with selective processing in the β-subunits.
Materials and Methods
Solutions of human hemoglobin A0 (Apex Bioscience, NC) were prepared in either
100 mM HEPES or PBS, pH 7.4, as described previously, (3). Reductive nitrosylation
reactions were conducted by slowly delivering aliquots, via gas-tight Hamilton syringes,
to the methemoglobin solution at [NO]o/[heme] ratios varying nominally from 0.05 to
0.75 (where [NO]o is the initial concentration of the added NO). Solutions were mixed by
vortexing immediately upon the addition. In some experiments a succession of additions
was made, in the manner of a titration. The protein concentration was kept in excess of
75 µM in all experiments, to avoid substantial dissociation of Hb into dimers, and below
250 µM to maintain solution ideality. Reaction progress after each addition was
monitored by UV/VIS spectroscopy. The spectra were analyzed by decomposition of the
contributions from met-, Fe(II)NO-, and Fe(III)NO-Hb, by methods similar to those
described by us previously (3), and elaborated below. At selected time points, samples of
the reacting mixture were taken for further product analysis: samples were either frozen
by immersion in liquid nitrogen for characterization by EPR spectroscopy (4-7) or
directly analyzed for nitrite and for nitrosothiols by Greiss and Saville assays, following
previously described methods (3). EPR spectra were recorded with a Varian E-109 X-
42
band spectrometer that has been modified by the addition of a field-control unit obtained
through the University of Denver (8). Samples were immersed in liquid nitrogen during
the EPR measurements. The reactant/product analyses made prior to the completion of
the reaction were employed in the determination of the reaction kinetics. Gepasi (9) and
Dynafit (10) software was used in the kinetic analysis.
Other reactions and product analyses were carried out by analogous methods.
Reactions with nitrite were conducted by mixing oxyhemoglobin solutions (~ 4 mM in
heme), with sodium nitrite at ~100:1 heme:nitrite ratios. The solutions were allowed to
stand for minutes to hours, then deoxygenated by sparging with argon. Samples were
withdrawn just before or just after deoxygenation for product characterization. Hb(NO)4
oxidation was conducted in ~ 2 mM solutions with an excess of potassium ferricyanide;
the formation of products was followed by UV/VIS spectroscopy. Samples were
cleansed of low molecular weight species by centrifugation through a G-25 column, then
analyzed for products.
The procedure for decomposition of UV/VIS spectra, described previously (3), was
modified in the present study. We introduced, among the standards, the spectrum of
authentic heme-Fe(III)NO Hb. To obtain this standard spectrum the kinetic data obtained
in reductive nitrosylation experiments were subject to principal component analysis (11),
as described in detail elsewhere (12). The reference Fe(III)NO spectrum obtained by this
procedure is similar to the spectrum reported by Alayash et al. (13) that is largely
Hb[Fe(III)NO]4 (at pH 8) with apparent traces of unreacted met-hemes. The reference
spectra utilized are exhibited in Fig. 3.1.
43
0
4
8
12
16
500 550 600 650 700Wavelength (nm)
Ext
inct
ion
Coe
ffic
ient
(m
M-1
cm-1
)
Figure 3.1 Visible absorption spectra of species involved in the reductive nitrosylationreaction. Standard spectra, pH 7.4, of met-Hb (), Fe(II)NO-Hb (), and Fe(III)NO-Hb(). The methemoglobin and Fe(II) nitrosyl hemoglobin spectra are from authenticstandards; the Fe(III) nitrosyl hemoglobin spectrum was determined by using factoranalysis techniques and scaled as described in the text.
To improve the performance of the least-squares fitting routine used in the spectral
analysis, all reference and experimental spectra were numerically differentiated; the least-
squares fitting was done using these derivative spectra. We also augmented the
experimental and reference spectra to introduce constraints on the component
concentrations. Application of constraints proved useful, for example, in proscribing
non-physical, negative values for trace species.
44
EPR spectra of the samples generally included high and low spin methemoglobin
components (14), as well as a feature assignable to Fe(II)NO. In conventional first-
derivative EPR displays, the met-Hb signals have an effectively flat response in the
region of the Fe(II)NO feature. The latter spectra were analyzed, using a decomposition
procedure (analogous to that employed in the UV/VIS spectroscopy), involving two
components - corresponding to NO occupying alternatively β-subunits or α-subunits
(with six-fold coordination) (15-17). Hyperfine structure suggestive of penta-
coordination of the α-subunit Fe(II)NO hemes (15) was not observed in any EPR spectra.
Results
Reductive Nitrosylation Product Analysis. Although the reductive nitrosylation of
oxidized heme-proteins has been studied for over sixty years (18-24), the reaction of NO
with methemoglobin remains only partially understood. In the case of simple monomeric
heme-proteins, reductive nitrosylation has been most simply summarized by the equation:
a) heme-Fe(III) + NO(aq) ↔ heme-Fe(III)NO ↔ heme-Fe(II)NO+;
b) heme-Fe(II)NO+ + OH¯(aq) → heme-Fe(II) + H+(aq) + NO 2 (aq);
Figure 3.2 NO-group mass balance in the reductive nitrosylation of human met-Hb withNO. (top panel) The total amount of the reaction products – heme-Fe(II)NO, nitrite, andS-nitrosothiol is presented as a function of the amount of NO introduced. The symbols correspond to experimental determinations; the solid line represents the best, linear fit tothe experimental points (slope 1.06 ± 0.03; R=0.990). (bottom panel) Relative yields offerrous heme nitrosyl products and the S-nitrosothiol plus nitrite products versus the totalproduct yield. The symbols correspond to experimental determinations of ferrousheme nitrosyl; the solid line represents the best, linear fit to these experimental points(slope 0.51±0.01; R=0.996). The symbols correspond to experimental determinationsof S-nitrosothiol plus nitrite; the dashed line represents the best, linear fit to theseexperimental points (slope 0.51±0.02; R=0.992). Amounts are tabulated relative to theamount of heme present in the reaction medium. Product analysis was carried out asdescribed in the text.
47
Either pathway would presumably lead to the concomitant production of an
equivalent of heme-Fe(II), which is immediately converted to Fe(II)NO. To test this
idea, we compared the total concentration of the products to: a) the heme-Fe(II)NO
concentration; and b) the sum of the nitrite and nitrosothiol concentrations, as shown in
Fig. 3.2 (bottom). The correlations are essentially identical, and demonstrate that protein
nitrosothiol and nitrite are produced, in toto, on an equimolar basis with the nitrosyl
ferrous-heme: Fe(II)NO and nitrite plus nitrosothiol each account for half of the reacted
NO.
The factors that determine the distribution of products between nitrite versus protein
nitrosothiol remain to be more fully elucidated. We have observed that at low
[NO]o/[heme] ratios (less than ~0.1), protein nitrosothiol and ferrous nitrosyl heme
account for essentially all of the products. The preference for nitrosothiol is to be a
sharply decreasing function of the [NO]o/[heme] ratios: at ratios as small as 2, nitrite and
protein nitrosothiol are produced in essentially equal amounts. Further analysis of the
Fe(II)NO products by EPR spectroscopy reveal a striking and previously unrecognized
preference for nitrosylation of β-subunit hemes, as evidenced in the spectra shown in Fig.
3.3. We observed β - vs. α-subunit preferences ranging from ~7:1 to ~3:1 at
[NO]o/[heme] ratios varying from 0.05 to 0.75; while at [NO]o/[heme] ratios ≥ 2, the
(heme-Fe(II)NO)4 protein is obtained. The spectrum of this product, which of course
exhibits no subunit preference, is also shown in Fig. 3.3. The fundamental trends in
nitrite vs. protein nitrosothiol and β- vs. α-subunit preference are similar: strong
48
preferences are exhibited only at low [NO]o/[heme] ratios; at ratios > ~0.75 the relevant
product ratios approach unity.
As a check on the possibility that the product distributions are influenced by “bolus”
effects (30) associated with the addition of NO solutions, we conducted a series of
experiments in which NO was derived from the decomposition of limited amounts of the
nonoate DEA/NO (31), which was pre-mixed into the Hb solution. In these experiments,
reported in detail elsewhere (32), we also find a highly consistent preference for S-
nitrosylation over nitrite formation, and a β-subunit preference of the Fe(II)NO product.
3100 3200 3300 3400
α-subunit heme-Fe(II)NO
β-subunit heme-Fe(II)NO
Hb(NO)0.3
Hb(NO)4
EPR
Sign
al
Magnetic Field Strength (G)Figure 3.3 EPR spectra of Fe(II)NO obtained by reductive nitrosylation of met-Hb withNO. EPR spectra were obtained at 9.29 GHz, with 10 mW incident power, and with fieldmodulation of 10 G at 100 kHz. The external field was scanned over a range of 400 G in2 min with a detection time constant of 0.128 seconds. The experimental spectra shownwere obtained with samples reacted with [NO]o/[heme] ratios of: 0.2 (solid line), 2(dashed line). Reconstructions made as weighted combinations of α- and β-subunitspectra (dotted lines) are indistinguishable from the experimental spectra. The spectrum
49
obtained with a [NO]o/[heme] ratio of 0.2 reflects a β- vs. α-subunit preference of 88 ± 8% (variance between methods adapted from Refs. 18-22). The spectrum obtained with a[NO]o/[heme] ratio of 2 reflects equal a- and b-subunit populations in the (Fe(II)NO)4
protein. EPR signals from residual met-Hb lie outside the field range included in thespectra presented here.
Collectively, our results suggest that the reductive nitrosylation of human Hb, with
limiting amounts of NO, may most simply be considered to occur as a weighted sum of
independent subunit reactions. We assume that the α-subunits only generate nitrite, but
that β-subunits produce either nitrite or SNO. At progressively lower [NO]o/[heme]
ratios, β-subunit processing and SNO production is increasingly favored. At the very low
[NO]o/[heme] ratios characteristic of the physiological situation; the chemistry would
with nitrosothiol and β-subunit ferrous heme nitrosyl as the exclusive products of this
novel, sub-unit selective reaction.
The dominance of reaction (3) at low NO levels implies a substantial subunit
inequivalence in the binding of NO to form the ferric nitrosyl heme intermediate and/or
the subsequent reaction of that intermediate to form the products. Previous studies of the
NO binding to met-Hb (13, 24, 25) show that equilibrium favors the β-subunit only by a
factor of ~1.5. While the subunit dependence of Fe(III)NO reaction rates have not been
examined in detail, it has been noted that the reductive nitrosylation occurs “considerably
faster” with isolated β-chains (β-subunit tetrameric protein) than with α-chains (25). In
these previous studies, with NO present in excess, the reaction would presumably involve
50
Hb (Fe(III)NO)4 intermediates. At very low [NO]o/[heme] ratios, however, hybrids such
as α2(met)β(met)β(Fe(III)NO), would be the predominant initial reactive intermediates.
It is tempting to suggest that the differential reactivity of the various intermediates
mustered under different experimental conditions may play an important role in
governing the substantial product/subunit selectivity and its dependence on [NO]o/[heme]
ratios.
The observed chemistry rationalizes a number of observations made in previous
studies of this reaction. A fundamental issue is the lack of mass balance. Hoshino et al.
(24), recently reported that the reductive nitrosylation of methemoglobin, in excess NO,
yielded ~0.9 heme-Fe(II)NO (detected as nitrate after oxidation in air) but only about
~0.4 NO 2 per heme, even though hydroxide and water were considered as the only
nucleophiles. (For whale myoglobin (24), the product yields closely followed (Eq. 1)).
These observations likely reflect S-nitrosylation of Hb in competition with (and
independent of) hydroxide or other putative nitrosation targets. The product distribution
reported by Hoshino et al. (24), in fact very closely follow the stoichiometry expected for
a process that completes both α- and β-subunit reactions. The observation of Wade and
Castro (23) that met-Hb is extremely ineffective, as compared to, for example, horse
metmyoglobin, in promoting the apparent nitrosation of exogenous nucleophiles may, in
part, reflect interference from the nitrosothiol-forming reaction. Our results also clarify
certain observations of Addison and Stephanos (22), which were interpreted as indicating
that the protein product obtained by complete reductive nitrosylation of methemoglobin
is modified in the course of the reaction: Addison and Stephanos, however, suggested
that this modification entails nitrosation of a histidine or lysine rather than the thiol.
51
Finally, the variation of the levels of heme-Fe(II)NO hemoglobin complexes that have
been detected in blood by EPR methods (33-40), may be influenced by the levels of
heme-Fe(III)NO and other EPR undetectable species that can interchange with the heme
Fe(II)NO species under different methods of sample treatment.
Reductive Nitrosylation Kinetic Analysis.
As a check on the overall soundness of the decomposition analysis and on the role of
Fe(III)NO as an intermediate, we analyzed the UV/VIS spectra recorded before steady
state was reached, to obtain concentration versus time profiles, exhibited in Fig. 3.4 (top).
The data are analyzed with a de minimis model composed of: i) equilibrium uptake of NO
by met-Hb (Eq. 1, reaction a); ii) reduction of Fe(III)NO and formal loss of NO+ (Eq. 1
reaction b or Eq. 2); iii) uptake of NO by the reduced heme (Eq. 1 reaction c).
The solid lines in Fig. 3.4 (bottom) show traces calculated on the basis of the kinetic
model above, with parameter values obtained by least-squares adjustment. The quality of
the fit is similar in all of the measurements. We followed the kinetic behavior from
shortly after mixing to stationary phase in five samples at various buffer compositions
(PBS, HEPES, and 100 mM phosphate) and initial heme:NO ratios (3:1 to 1:1). As
detailed below we obtain a precise determination of the rate constant for the reduction
step (ii), but only a rough estimate of the equilibrium constant for step (i). The transfer of
NO to reduced hemes (step iii) is likewise only found to be extremely fast relative to step
(ii).
52
0
0.4
0.8
1.2
500 550 600 650 700Wavelength (nm)
Abs
orba
nce
Con
cent
ratio
n (µ
M)
0
300
600
900
1200
0 5 10 15 20Time (minutes)
heme-Fe(III)
heme-Fe(II)NO
heme-Fe(III)NO
Figure 3.4 Kinetics of reductive nitrosylation in a deoxygenated aqueous solutionprepared with met-Hb 1.2 mM in heme, 0.7 mM NO, 100 mM phosphate buffer, pH 7.4,and 150 mM NaCl. (Top panel) Time series of visible spectra of the reacting solution.Successive spectra were initiated at time intervals of 1 minute. The first spectrum wasrecorded 22 seconds after mixing the reagents. (Bottom panel) Concentration versus time.
53
In previous studies of met-heme interactions with NO in human Hb, Sharma et al.
(25) and Alayash et al. (13) used stopped-flow methods to elucidate the detailed behavior
of the initial binding step. Both groups reported equilibrium constants of ~3x10³ M-1, and
a subunit inequivalence in the reaction, with the β-subunit hemes exhibiting roughly five-
fold greater on- and off-rates than the α-subunit hemes. Ford and co-workers (24)
obtained an equilibrium constant of similar magnitude 13x103 M-1 by analyzing the effect
of [NO] on the reduction rate. Within this range, our kinetic analysis was insensitive to
the value of this equilibrium constant, and we opted to fix this parameter at 1.0 x10⁴ M-1
in the analysis. For the reduction step, the effective rate constant, first order in Fe(III)NO,
was reported as 0.0018 sec-1 (pH 7, 25 ºC), by Addison and Stephanos (22), and 0.00063
sec-1 (pH 7, 20 ºC) by Alayash et al. (13) Ford and co-workers (24) measured the rate as a
function of pH from which a value of 0.0019 sec-1 obtains at pH 7.4. The values that we
determine , range from 0.0012 ± 0.0001 sec-1 (PBS) to 0.0027 ± 0.0001 sec-1(HEPES,
100 mM phosphate), in good agreement with the previously determined values. The
overall quality of the analysis and its consistency with prior observations, provides strong
support for the procedure used, and thus identifies the central role of the Fe(III)NO
intermediate in this reaction.
Additional SNO-Hb Producing Reactions.
The salient feature of the reductive nitrosylation reaction is the coupling of met-
heme reduction with formal NO oxidation to trigger nitrosation. The signature of this
reaction in Hb, when the NO is limiting, is the SNO formation in the nitrosation reaction
and the β-subunit preference in the heme nitrosylation. This interplay of met-hemes with
54
NO could be approached by a number of different starting conditions, which might
nevertheless lead to the same set of products. In a physiological context, reactions which
do not require the presence of a pre-existing reservoir of met-Hb for reaction with
incident NO are of particular interest.
The activity of NO as an oxidant of hemoglobin, in both oxy- and deoxy-forms is
well-documented (3), (41). Accordingly, a sequence composed of an oxidative reaction
that forms met-Hb, followed by a reductive nitrosylation leading to SNO-Hb and
restoration of a reduced-heme, is in principle possible. In this scheme, heme-redox acts in
a cyclic fashion, with no met-Hb reservoir required. In a reaction with oxygenated Hb,
this sequence could lead to: a) SNO-production; b) the formation of a Fe(II)NO in an
amount that exceeds the number of originally available vacant Fe(II) centers – thus, an
apparent cooperativity in NO addition (3), (42), which stems from changes in vacant
heme concentrations during NO uptake, rather than favorable changes in rate or
equilibrium constants. This process could assume special significance for hemoglobins
repeatedly exposed to NO - for example, membrane-bound hemoglobins (43) exposed to
a slow flux of NO passing into a cell. The loss (to nitrate or nitroxyl) of one equivalent of
NO, in this scheme, would be circumvented if other oxidants were involved.
Accumulation of met-Hb would still not be required provided that the oxidation could
follow NO addition - that is, if the reaction entails the oxidation of Fe(II)NO.
To explore the feasibility of the latter process, we have initiated studies to assay the
production of SNO-Hb accompanying the oxidation of heme-Fe(II)NO species. In Fig.
3.5, we present results of experiments that show that Hb(NO)4 reacts in the presence of
excess ferricyanide to convert Fe(II)NO hemes to met-hemes, with approximately one
55
SNO-Hb produced for every two Fe(II)NO lost. Overall, this product distribution
suggests the formal oxidation of Fe(II)NO to a Fe(III)NO species that then reacts to form
S-nitrosothiol (or nitrite products), liberating a vacant heme-Fe(II), which, being more
easily oxidized than heme-Fe(II)NO (as the association equilibrium constant for NO and
heme-Fe(II) is much greater than for heme-Fe(III) and NO), readily accedes to oxidation
under these conditions.
0
0.2
0.4
0.6
0.8
1
0.40.60.81
[SNO-Hb] / [heme]
[heme-Fe(III)] / [heme]
[heme-Fe(II)NO]/[heme]
Rel
ativ
e Pr
oduc
t Yie
ld
Figure 3.5 Conversion of heme-Fe(II)NO centers to heme-Fe(III) and SNO-Hb uponexposure of Hb(NO)4 to ferricyanide. Samples of the reaction medium are withdrawn atvarious points in the course of the reaction for analysis of the amounts of heme-Fe(II)NO,heme-Fe(III), and nitrosothiol – relative to the total heme in the medium. The symbols (left scale) compare heme-Fe(III) production to heme-Fe(II)NO depletion; the solid linerepresents the best, linear fit to these experimental points (slope –1.15 ±0.01; intercept =1.14 ±0.01 ; R=0.9998) indicative of a one-to-one conversion of heme-Fe(II)NO to heme-Fe(III). The symbols compare experimental S-nitrosothiol production to heme-Fe(II)NO depletion; the dashed line represents the best, linear fit to these experimentalpoints (slope -0.50±0.11; intercept 0.46±0.07; R=0.96). Product analysis was carried outas described in the text.
The reaction of nitrite with hemoglobin provides a further route to the simultaneous
presentation of heme Fe(III) and NO (41, 44-46). The possible significance in the context
56
of nitric oxide biology has been thoughtfully considered by Reutov and Sorokina (47),
who posited that owing to the well-known nitrite reductase activity of hemoglobin, nitrite
could be considered an integral component of NO biochemistry, rather than a metabolic
dead-end. To examine this idea, and determine whether SNO-Hb is produced in this
interaction, we first incubated oxyhemoglobin with ~0.01 equivalents (on a per-heme
basis) of nitrite. No discernible changes were present in the EPR spectrum over a time
span of as much as 15 minutes. The only feature in the spectrum derived from the small
fraction (~1%) of met-heme in the oxy-Hb solution, which was not discernibly changed
by the nitrite addition. Deoxygenation of these mixtures after various incubation times
led to an immediate change in the EPR spectrum with roughly equal increases in met-
heme and heme-Fe(II)NO signals, as illustrated in Fig. 3.6 (top and bottom, respectively).
These results are consistent with the simple understanding of the nitrite reaction with
deoxy-Hb according to the following scheme (41, 44):
NO will ultimately lodge at available heme vacancies to form Fe(II)NO.
Interestingly, as we have reported elsewhere (43), oxygenation leads to elimination of the
Fe(II)NO and the formation of SNO-Hb – in effect the reverse of reaction (4), with
nitrosothiol formation (Eq. 2), rather than nitrite regeneration. Overall, this chemistry
reveals a catalytic role for Hb – in conjunction with its oxygenation/deoxygenation cycle
– in converting nitrite to the SNO-Hb.
57
900 1050 1200
EPR
Sign
al
Magnetic Field Strength (G)
3100 3200 3300 3400
EPR
Sign
al
Magnetic Field Strength (G)Figure 3.6 EPR spectra from Fe(II)NO and Fe(III) hemes obtained by exposure ofhemoglobin to nitrite. EPR spectra were obtained at 9.28 GHz, with 10 mW incidentpower, and with field modulation of 20 G at 100 kHz. The external field was scanned for4 min with a detection time constant of 0.128 seconds over to range: 800 – 1300 G todetect high-spin heme-Fe(III) (upper panel) or 3050 – 3450 G to detect heme-Fe(II)NO(lower panel). A spectrum of a sample of a neat, 3.8 mM oxyhemoglobin solution, frozenin liquid nitrogen is displayed () in both panels; the trace in the lower panel was used asa base-line for subtraction from subsequent scans. Spectra were subsequently obtainedfrom samples withdrawn from the solution after incubation with 37 µM nitrite for periodsof 5 (), 12 (), and 24 () min, followed by deoxygenation and freezing in liquidnitrogen (both panels). SNO-Hb is observed upon re-oxygenation of such samples. Aspectrum obtained without deoxygenation after an incubation time of 10 min () is alsoshown (upper panel).
58
Discussion
We have shown that NO can be transported from the heme binding site (distal
pocket) to the thiol of cys(β-93), which lies on the opposite face of the heme (next to the
proximal histidine residue). The production of SNO-Hb in this transfer can be supported
by heme-iron redox chemistry. When NO is limiting, SNO-Hb is the major product
formed in the reductive nitrosylation reaction, with preference for the β-subunits of
hemoglobin. We have also shown that SNO-Hb production rather generally accompanies
the formal interaction of NO and heme-Fe(III), regardless of the sequence of NO addition
and heme-oxidation – sequences including NO reaction with heme-Fe(III), oxidation of
heme-Fe(II)NO, or reaction of nitrite with deoxy-Hb in an oxygenation/deoxygenation
cycle.
The chemistry reported here has several implications of potential importance to NO
hemoglobin interactions in blood. Inasmuch as the NO-group is present in limited
concentrations, any reductive nitrosylation reaction would tend to process the NO-group
exclusively within the β-subunit. This subunit selective processing could provide a means
by which NO can avoid being trapped by the α-hemes to yield the five-coordinate α-
heme-Fe(II)NO complexes which could quench NO bioactivity (48). Moreover, the
results reveal a means by which the NO-group can be dislodged from heme-Fe(II)NO
complexes to make the nitrosothiol hemoglobin derivative: the perceived unfavorability
of NO dissociation from nitrosylated ferrous hemes (49), can be circumvented by
oxidation to the ferric heme-nitrosyl species, thus facilitating NO-group transfer to
59
protein thiol. In conjunction with this oxidation, reaction (4) depicts NO-group transfer
from a β-subunit heme species that holsters NO bioactivity (heme-Fe(II)NO) to one that
arms it (protein-SNO) for potential release via, for example, transfer to other thiols (50,
51). Inasmuch as NO is a potent oxidant of both oxy- and deoxy-Hb, the methemoglobin
requirement may be potentiated through NO itself, in a cycle of heme-
oxidation/reductive-nitrosylation, that does not require or involve any met-Hb
accumulation. The oxidative and NO-group requirements can also be supported by
interaction of heme vacancies with nitrite, as part of a greater NO-group biological
chemistry.
The results presented here clarify some issues relevant to SNO-Hb function raised in
several recent publications. Apparent cooperativity in the formation of heme-Fe(II)NO by
exposure of oxygenated hemoglobin to NO has been observed under certain conditions in
vivo by us, and in red blood cell preparations by Huang et al. (52) and Han et al. (53)
Moreover, while Huang et al. (52) suggest that their in vivo experiments do not show this
apparent cooperativity, the systematic differences between the experimental data and the
theoretical predictions indicate that while such effects are attenuated under their
conditions, an excess of heme-Fe(II)NO is produced, at higher oxygen saturations.
Preference for the β-subunits is evident in the Fe(II)NO EPR spectra presented in the
work of Huang et al. (52). The latter authors also measure SNO-production and obtain
nearly equivalent yields of Fe(II)NO and SNO-Hb under a variety of conditions. In
related experiments, Joshi et al. (30) fail to detect Fe(II)NO at very high oxygenation and
non-physiological NO levels. Notably, they do observe the production of SNO-Hb in
yields that are similar to those reported by Gow et al., (3) and are independent of the
60
manner of NO addition. The observations reported in all of these studies share features
that are common to the reductive nitrosylation chemistry reported here.
Han et al. (53) suggest, on the basis of the cyanide blocking experiments, that
reductive nitrosylation is not significant to the production of SNO-Hb. Their results,
however, only compel the conclusion that in the presence of high cyanide levels some
met-heme independent SNO-Hb production occurs. Our mechanistic conclusions are
supported by direct observations of all of the relevant chemical species, detailed material
balance, and global kinetic analysis – there is no ambiguity regarding the centrality of the
heme-Fe(III)NO intermediate.
Finally, it is worth pointing out that in the experiments of Han et al. (53) and Huang
et al. (52), very high protein concentrations are used. While this choice reflects the
concentrations within red blood cells, it can obscure the fundamental chemistry of
hemoglobin at the molecular level. Analysis of the chemical behavior of concentrated
protein solutions that is significantly depleted in the activity of water may require more
elaborate models for bolus and diffusion effects, and attention to chemical activities.
Ultimately, with a clearer picture of the relevant, molecule scale behavior of
hemoglobins, an integrated model of cardiovascular NO function, encompassing
molecular, cellular, and system wide variables may be developed.
Addendum
We determine the distribution of α and β heme nitrosylation products through factor
analysis of EPR spectra. EPR spectroscopy is selective for heme-Fe(II)NO (as well as
high- and low-spin methemoglobins), present as a minority among an EPR-silent
61
majority of oxy- or deoxyhemes. In addition to indicating the presence and quantity of
heme-Fe(II)NO species, EPR spectra of human Hemoglobin exhibit subunit-
inequivalences that make it possible to determine proportions of NO on the α- vs. β-
subunits by decomposition of the spectra according to their subunit contributions.
3100 3200 3300
Hb(NO)4
βΝΟαNOαΝΟ+βΝΟ
EPR
Sign
al
Magnetic Field Strength (Gauss)
EPR Spectra of Hb(NO)4and Isolated Subunits
•
*
Figure 3.7 X-band EPR spectrum of nitrosylhemoglobin spectral components termedβNO () and αNO (), from isolated subunits (6). The sum () of these spectralcomponents is seen to be identical to the EPR spectrum of Hb(NO)4. (). Asterisk (*),and bullet (•)mark spectral positions that feature the βNO or αNO species respectively.C) Ratio of * and • used for decomposition of SNO-oxyhemoglobin EPR spectra.
The subunit spectra (Fig. 3.7, αNO and βNO) clearly show distinctions, but the
composite spectrum formed simply by addition of the subunit spectra (Fig. 3.7,
αNO+βNO) is essentially identical to that of the tetrameric α2(NO)/β2(NO) hemoglobin
(Fig. 3.7, Hb(NO)4). (Asterisks mark the positions at which either the αNO (left) or βNO
(middle) species predominate). The “hybrids” α2(NO)/β2(deoxy) and α2(deoxy)/β2(NO)
were shown to exhibit spectra equivalent to those of the isolated αNO or βNO subunits,
62
respectively (14). Taken together, these results establish the current approach for
analyzing nitrosylhemoglobin EPR spectra which is directly applicable to Fe(II)NO
complexes in SNO-hemoglobin as S-nitrosylation affects neither the heme EPR or
UV/Vis spectra.
63
References
1. Stamler, J. S. (1994) Cell 78, 931-6.
2. Stamler, J. S., Singel, D. J. & Loscalzo, J. (1992) Science 258, 1898-902.
3. Gow, A. J., Luchsinger, B. P., Pawloski, J. R., Singel, D. J. & Stamler, J. S. (1999)Proc. Natl. Acad. Sci. USA 96, 9027-32.
4. Hille, R., Olson, J. S. & Palmer, G. (1979) J. Biol. Chem. 254, 12110-20.
5. Hille, R., Palmer, G. & Olson, J. S. (1977) J. Biol. Chem. 252, 403-405.
6. Reisberg, P., Olson, J. S. & Palmer, G. (1976) J. Biol. Chem. 251, 4379-83.
7. Taketa, F., Antholine, W. E. & Chen, J. Y. (1978) J. Biol. Chem. 253, 5448-51.
8. Quine, R. W., Eaton, G. R., Eaton, S. S., Koska, A. & Bowman, M. K. (1986) J.Magn. Reson. 69, 371–374.
9. Mendes, P. (1997) Trends Biochem. Sci. 22, 361-363.
10. Kuzmic, P. (1996) Anal. Biochem. 237, 260-273.
11. Malinowski, E. R. (1991) Factor Analysis in Chemistry (Wiley, New York).
12. We determined that, in all spectra, the deoxy- and oxy-Hb species were of negligibleconcentration. Singular value decomposition further indicated that the kineticvariation of the spectra involves two predominant components. This result isconsistent with a chemical process like (Eq. 1), in which - against a background ofexcess met-hemes - Fe(III)-nitrosyl hemes are effectively converted to Fe(II)-nitrosyland met-hemes. The presence of a third component that is relatively weak, but abovenoise, indicates that this framework is an approximation to the overall chemistry.Within this framework, we used target factor analysis to identify the authenticFe(III)nitrosyl-Hb spectrum. A test factor (11) composed of the difference betweenthe first kinetic trace (rich in Fe(III)nitrosyl-Hb) and an arbitrary linear combinationof Fe(II)nitrosyl- and met-Hb spectra was used to predict the hypotheticalFe(III)nitrosyl-Hb, consistent with each linear combination. To select the bestFe(III)nitrosyl-Hb spectrum from among these hypothetical spectra we employedthree criteria: the least-squares difference between the test and predicted vector isbelow a selected threshold; the predicted spectrum is non-negative at allwavelengths; the predicted spectrum is a monotonically decreasing function ofwavelength beyond 565 nm. In scaling the resultant spectrum, we took advantage ofthe quasi-isosbestic points at 516, 543, 554, 577 nm that are evidenced in theUV/VIS spectra during the kinetic runs. Within the chemical framework noted
64
above, the Fe(III)nitrosyl-Hb absorbance at these points must be approximatelyequal to the average of Fe(II)nitrosyl- and met-Hb spectra.
13. Alayash, A. I., Fratantoni, J. C., Bonaventura, C., Bonaventura, J. & Cashon, R. E.(1993) Arch. Biochem. Biophys. 303, 332-8.
14. Henry, Y. & Banerjee, R. (1970) J. Mol. Biol. 50, 99-110.
15. Kon, H. (1968) J. Biol. Chem. 243, 4350-7.
16. Shiga, T., Hwang, K. J. & Tyuma, I. (1969) Biochemistry 8, 378-83.
17. Henry, Y. & Banerjee, R. (1973) J. Mol. Biol. 73, 469-82.
18. Hartree, E. F. & Keilin, D. (1937) Nature 139, 548.
19. Chien, J. C. W. (1969) J. Am. Chem. Soc. 91, 2166-2168.
20. Ehrenberg, A. & Szczepkowski, T. W. (1960) Acta. Chemica. Scandinavica 14,1684-1692.
21. Wayland, B. B. & Olson, L. W. (1974) J. Am. Chem. Soc. 96, 6037-41.
22. Addison, A. W. & Stephanos, J. J. (1986) Biochemistry 25, 4104-13.
23. Wade, R. S. & Castro, C. E. (1990) Chem. Res. Toxicol. 3, 289-91.
24. Hoshino, M., Maeda, M., Konishi, R., Seki, H. & Ford, P. C. (1996) J. Am. Chem.Soc 118, 5702 -5707.
25. Sharma, V. S., Traylor, T. G., Gardiner, R. & Mizukami, H. (1987) Biochemistry 26,3837-43.
26. Jia, L., Bonaventura, C., Bonaventura, J. & Stamler, J. S. (1996) Nature 380, 221-6.
27. Stamler, J. S., Jia, L., Eu, J. P., McMahon, T. J., Demchenko, I. T., Bonaventura, J.,Gernert, K. & Piantadosi, C. A. (1997) Science 276, 2034-7.
28. Chan, N. L., Rogers, P. H. & Arnone, A. (1998) Biochemistry 37, 16459-64.
29. Ferranti, P., Malorni, A., Mamone, G., Sannolo, N. & Marino, G. (1997) FEBS Lett400, 19-24.
30. Joshi, M. S., Ferguson, T. B., Jr., Han, T. H., Hyduke, D. R., Liao, J. C., Rassaf, T.,Bryan, N., Feelisch, M. & Lancaster, J. R., Jr. (2002) Proc. Natl. Acad. Sci. USA 99,10341-6.
65
31. Keefer, L. K., Nims, R. W., Davies, K. M. & Wink, D. A. (1996) Methods Enzymol.268, 281-93.
32. Williams, E. M. (2001) (Middlebury College, Middlebury, VT).
33. Kosaka, H., Watanabe, M., Yoshihara, H., Harada, N. & Shiga, T. (1992) Biochem.Biophys. Res. Commun. 184, 1119-24.
34. Kosaka, H., Tanaka, S., Yoshii, T., Kumura, E., Seiyama, A. & Shiga, T. (1994)Biochem. Biophys. Res. Commun. 204, 1055-60.
35. Jacob, T. D., Nakayama, D. K., Seki, I., Exler, R., Lancaster, J. R., Jr., Sweetland,M. A., Yousem, S., Simmons, R. L., Billiar, T. R., Peitzman, A. B. & et al. (1994) J.Appl. Physiol. 76, 1794-801.
36. Romand, J. A., Pinsky, M. R., Firestone, L., Zar, H. A. & Lancaster, J. R., Jr. (1994)J. Appl. Physiol. 76, 1356-62.
37. Roccatello, D., Mengozzi, G., Alfieri, V., Pignone, E., Menegatti, E., Cavalli, G.,Cesano, G., Rossi, D., Formica, M., Inconis, T., Martina, G., Paradisi, L., Sena, L.M. & Piccoli, G. (1997) Nephrol. Dial. Transplant. 12, 292-7.
38. Weinberg, J. B., Gilkeson, G. S., Mason, R. P. & Chamulitrat, W. (1998) Free Radic.Biol. Med. 24, 191-6.
39. Takahashi, Y., Kobayashi, H., Tanaka, N., Sato, T., Takizawa, N. & Tomita, T.(1998) Am. J. Physiol. 274, H349-57.
40. Gladwin, M. T., Ognibene, F. P., Pannell, L. K., Nichols, J. S., Pease-Fye, M. E.,Shelhamer, J. H. & Schechter, A. N. (2000) Proc. Natl. Acad. Sci. USA 97, 9943-8.
41. Doyle, M. P., Pickering, R. A., DeWeert, T. M., Hoekstra, J. W. & Pater, D. (1981)J. Biol. Chem. 256, 12393-8.
42. Gow, A. J. & Stamler, J. S. (1998) Nature 391, 169-73.
43. McMahon, T. J., Moon, R. E., Luchsinger, B. P., Carraway, M. S., Stone, A. E.,Stolp, B. W., Gow, A. J., Pawloski, J. R., Watke, P., Singel, D. J., Piantadosi, C. A.& Stamler, J. S. (2002) Nat. Med. 8, 711-7.
44. Stepuro, I. I., Chaikovskaya, N. A., Solodunov, A. A. & Artsukevich, A. N. (1997)Biochemistry (Mosc) 62, 960-6.
45. Kosaka, H., Tyuma, I. & Imaizumi, K. (1983) Biomed. Biochim. Acta 42, S144-8.
46. Tomoda, A., Tsuji, A. & Yoneyama, Y. (1981) Biochem. J. 193, 169-79.
66
47. Reutov, V. P. & Sorokina, E. G. (1998) Biochemistry (Mosc) 63, 874-84.
48. Yonetani, T., Tsuneshige, A., Zhou, Y. & Chen, X. (1998) J. Biol. Chem. 273,20323-33.
49. Gibson, Q. H. & Roughton, F. J. W. (1957) Journ. Physiol. 136, 507-511.
50. McMahon, T. J., Exton Stone, A., Bonaventura, J., Singel, D. J. & Stamler, J. S.(2000) J. Biol. Chem. 275, 16738-45.
51. Pawloski, J. R., Hess, D. T. & Stamler, J. S. (2001) Nature 409, 622-6.
52. Huang, Z., Louderback, J. G., Goyal, M., Azizi, F., King, S. B. & Kim-Shapiro, D.B. (2001) Biochim. Biophys. Acta 1568, 252-60.
53. Han, T. H., Hyduke, D. R., Vaughn, M. W., Fukuto, J. M. & Liao, J. C. (2002) Proc.Natl. Acad. Sci. USA 99, 7763-8.
67
4. NITRIC OXIDE MIGRATION FROM CYS(β-93) TO β-HEME-IRON(II)NO
Introduction
The chemical interactions of nitric oxide and hemoglobin in the human respiratory
system were discussed in a recent publication with our collaborators at Duke University
Medical Center. This publication is included as Appendix A in this thesis. The major
part of the article describes studies of NO/hemoglobin chemistry in human subjects and
red blood cells at various oxygen conditions conducted at Duke University Medical
Center. It also gives a brief account of some in vitro experiments carried out by the
author at Montana State University that provides a basis for rationalizing some of the in
vivo findings. In particular, the experiments demonstrate apparent heme-to-thiol and
thiol-to-heme transfers of the NO group. In this Chapter, a more detailed account of
these experiments is provided. First, the results of several experiments which
demonstrate the slow, but spontaneous transfer of the NO moiety from the nitrosothiol on
SNO-hemoglobin to form heme-Fe(II)NO are reported. A noteworthy finding in these
experiments is the substantial preference for formation of the heme-Fe(II)NO on the β-
subunit of the hemoglobin. Secondly, the results of experiments carried out with oxygen
cycling are reported. In fresh samples of heme-Fe(II)NO formed by incubation of deoxy-
hemoglobin with nitrite the EPR spectrum of the heme-Fe(II)NO species disappears upon
oxygenation of the system, with concurrent formation of an unidentified free-radical. At
low NO levels, SNO-hemoglobin is also formed with the oxygenation. Upon re-
68
deoxygenation the radical signal disappears and remaining nitrite reacts to form heme-
Fe(II)NO. This cycle can be repeated until the nitrite is exhausted.
Materials and Methods
Materials and methods used for experiments in this chapter mainly follow the
procedures described in Chapters 2 and 3. SNO-hemoglobin Ao samples were prepared
by the method of Jia et al. (1), including separation of low-molecular weight reagents by
gel chromatography. Samples were characterized by UV/Vis and EPR spectroscopies in
a manner described in detail in Chapter 2. The spectra are simulated as linear
combinations of standard UV/Vis basis spectra. The coefficients of the linear
combination, which give the concentrations of each heme species, are found by
adjustment to give least-squares best agreement between the simulated and observed
spectra. Greiss and Saville assays, also detailed in Chapter 2, were used to detect
nitrosothiols (SNO-hemoglobin).
EPR spectroscopy is used to detect methemoglobin, determine the concentration of
nitrosyl hemoglobin, and determine the subunit distribution of the heme-Fe(II)NO by the
fraction of NO ligands associated with hemes of the α- vs. the β-subunits. Acquisition
parameters for the EPR experiments are as described previously (2). Absolute
concentrations were determined, with a reproducibility of ~90%, by comparison of the
double-integral of the EPR signals against Hb(NO)4 standards, the concentrations of
which were established by UV/Vis spectroscopy. Subunit distributions were determined
by a modification of the procedures used by Hille, Taketa, (3, 4), and Bemski and co-
workers (5). In their procedures, it is assumed that: the heme-Fe(II)NO EPR spectra in
69
tetrameric-hemoglobin is simply the sum of spectral contributions of complexes on the α
and β hemes, and the subunit spectra are identical to the spectra exhibited by nitrosyl
derivatives of the isolated subunits, illustrated in the addendum to Chapter 3 (6, 7)
(preparations that likely consist of β-tetramers (β-(heme-Fe(II)NO)4) and possibly α-
dimers (α-(heme-Fe(II)NO)2).
Experiments and Results
EPR characterization of SNO-hemoglobin
We first show that heme iron-nitrosyl EPR spectra are not perturbed by S-
nitrosylation of the globin, by comparing EPR spectra of Hb(NO)4 and (SNO)2-Hb(NO)4
samples, shown in Fig. 4.1. Cleary there is no significant distinction between the two
spectra. This correspondence justifies use of previously established methods for
determining the distribution of NO over the α- and β-subunit hemes in characterizing
SNO-hemoglobins and mixtures that include it (7).
70
3100 3200 3300 3400
(SNO)2-Hb(NO)4
Hb(NO)4
EPR
Sig
nal
Magnetic Field Strength (Gauss)
Figure 4.1 X-band EPR spectrum of nitrosylhemoglobin, (SNO)2-Hb(NO)4.
Thiol-to-heme-transfer
Hemoglobins that were nominally fully ligated with dioxygen ligands were S-
nitrosylated by exposure to an excess of (Cys-β93)-NO – which had been prepared by
reaction of cysteine in acidified nitrite. After incubation for ten minutes, the excess
reagent was removed by size-exclusion chromatography. Immediately after the
chromatography, and at time intervals extending to several days, the composition of the
sample was characterized by UV/Vis and EPR spectroscopy; the nitrosothiol content was
assayed by the Greiss and Saville colorimetric methods. The UV/Vis spectrum of a
typical SNO-oxyhemoglobin preparation (sample 3, vide infra) is shown in Fig. 4.2 A.
Least-squares analysis of the spectrum shows it to be a composite of oxy- and
methemoglobin spectra with 89% oxyhemoglobin, and 11% oxidized hemoglobin,
71
respectively, and a total concentration of 1.65 mM in heme. No significant population of
deoxyhemoglobin or heme-nitrosylhemoglobin was found in this sample by UV/Vis
spectroscopy. EPR spectroscopy of the sample showed only the methemoglobin. After
incubation at 4 °C for an interval of 4 days EPR spectrum shown in Fig 4.2 B was
obtained. This spectrum clearly shows in addition to methemoglobin signals a strong
signal from heme-Fe(II)NO.
0.00
0.10
0.20
0.30
500 550 600 650 700
Experimental SpectrumDecomposition
Abs
orba
nce
Wavelength (nm)
Spectrum from SNO-oxy Hb
89% oxyHb11% metHb
1000 2000 3000 4000
EPR
Sig
nal
Magnetic Field Strength (Gauss)
5.8 2.56 1.832.17
Aquomet Hb A
Hydroxylmet Hb A
Fe-Nitrosyl Hb A
EPR Spectrum from SNO-oxyHb
Figure 4.2 UV/Vis and EPR spectra of SNO-oxyhemoglobin (Sample 3 see Fig. 4.3). A)UV/Vis decomposition of Sample 3 at 0 hours. B) X-band 4000 Gauss wide EPRspectrum showing high spin (effective g1 = 5.8, S = 5/2) and low spin (g2 =5.8, S = 1/2)metHb, and β-heme-Fe(II)NO of sample 3 at 36 hours.
We conducted similar analyses on four different samples. A quantitative summary
of the results these experiments is given in the accompanying table. The summary shows
a different times after preparation the fraction of nitrosyl-, oxy- and of met-hemoglobin;
the fraction of the on the heme-Fe(II)NO on the β-subunit; and the fraction of thiols
nitrosylated.
A B
72
0
20
40
60
80
100
0 17 68 0 113 277 0 36 0 96
%HbNO%SNO-Hb%metHb%oxyHb%β-FeNO
Perc
ent
Incubation Time (hours)
Sample 1 Sample 2 Sample 3
Sample 4
Figure 4.3 Hemoglobin species percents tallied for incubation experiments. This figuretabulates the percent for a given species. The time in hours for each sample, as well as,percentage of total possible for a given species. For example, Sample 1 at time 0 has60% of the possible, 2 per hemoglobin, Cys-β93s S-nitrosylated. Given an EPRspectrum of heme-Fe(II)NO the percentage of β is graphed. Sample 1, at 68 hours has≈80% of its EPR line shape coming from an heme-(β-Fe(II)NO) species, however, thetotal percentage of HbNO is less then 3%.
In every case, there is a gradual loss of S-nitrosothiol and compensating increase in
heme-Fe(II)NO. While the overall, process is slow, there is nevertheless a spontaneous
transfer of the NO moiety to the heme. Since this process requires reduction of the
formal nitrosonium species, it is noteworthy that that oxidation of the heme continues
during NO transfer, at levels at least as great as that of the NO transferred. This
observation suggests that the overall chemistry might couple heme oxidation with formal
NO+ reduction. Further information regarding the overall chemistry comes from EPR
spectra of the heme-Fe(II)NO products.
In Fig. 4.3 we show a series of EPR spectra obtained for samples at various times
after preparation. By analysis of the spectral lineshapes in terms of α -6 and β-6
73
component spectra illustrated in the addendum to Chapter 3, we determine that the heme-
Fe(II)NO has a greater that >80% β character, that is at least two thirds of the heme-
Fe(II)NO in the sample occupy heme in the protein β-subunit.
3100 3200 3300
0 hours at 4˚C36 hours at 4˚C
EPR
Sig
nal
Magnetic Field Strength (Gauss)
EPR of SNO-oxyHb atTwo Incubation Times
3100 3200 3300 3400
β-Fe(II)NO (36 hours)
Hb(NO)4E
PR S
igna
l
Magnetic Field Strength (Gauss)
Figure 4.4 NO migrating on hemoglobin. A) Comparison of EPR spectra of sample 3 atincubation times of 0 and 36hours. B) Comparison of 36 hour spectrum with Hb(NO)4.
If the release of NO from SNO-hemoglobin occurred by limited homolysis, then the
generated NO would probably occupy α- and β-hemes equally. Such chemistry, apart
from leaving open the question of reduction of the implicated thiyl radical, cannot explain
the observed subunit specificity. We suggest that the reaction must involve a formal
transfer between (Cys-β93)-NO and an adjacent vacant β-subunit heme, with the
reducing equivalent supplied by electron transfer from another heme in the tetramer. The
process is likely potentiated by the known drive to form symmetric methemoglobin
hybrids: gradual oxidation of hemoglobin produce mainly fully oxidized methemoglobins
A B
74
and half-oxidized hybrids (8). Half-oxidized hybrids of hemoglobins with NO ligands
have also been reported as especially stable (9).
Overall, then we envision this reaction as occurring on hemoglobin tetramers with a
single oxidized heme, and three ligand-occupied hemes. On dynamical loss of the O2
ligand on an S-nitrosylated β-subunit, a coordinated electron-NO transfer leads to
formation of a β-subunit outfitted with thiolate and heme-Fe(III)NO; the latter species is
then deactivated by reduction coupled with oxidation of a neighboring heme. The overall
868µM deoxyheme + 263µM nitrite for 3min then vortex in air for 30seconds.
Continue cycling every 3minutes.
heme to nitrite ratio is 10:3
Wed, Mar 04, 1998 06:50 PM Samp:3000uL(880uM)dx heme+40uL(20mM nitrite) for 3min(sample 1huge HbNO(90uM))+ 3min in air, +3min dx,+ 3min ox,+3min dx,+3min ox,+1.7min dx(last sample in thisseries; cycle every 3min for 21min�dx sample#4(19.7min)3/4/98 Field:3250G Range:400G TConst:0.250 STime:4minModAmp:10G Gain:5000 MFreq:9.275GHz MPower:10mW Temp:77K
EPR
Sig
nal
Figure 4.5 Nitrite cycling experiment. 868 µM deoxyhemoglobin + 263 µM nitrite for 1minute (while the 1st minute elapses the first sample (“1min deoxy”) is taken from themain reaction vessel and put into an O2(g) purged EPR tube and frozen in N2(liq)). The1st sample is frozen at 1 minute. However, the rest of the sample reacts for an additional2 minutes; bringing the total deoxyhemoglobin + nitrite time to 3 minutes. At 3 minutesthe reaction vessel is then vortexed in air for 30 seconds and sits while sample 2 (“4minoxy”) is taken out and put into an EPR tube and frozen in N2(liq)); at a total oxygenatedtime of 1 minute. Total reaction time for the “4min oxy” sample is 4 minutes, 3 minutesas deoxyhemoglobin + nitrite and 1 minute as oxyhemoglobin. After sitting in air for atotal of 3 minutes (total reaction time is 6 minutes, 3minutes deoxyHb and 3 minutes asoxyHb) the reaction vessel is again deoxygenated by vortexing for 30 seconds in ultrahigh purity N2(g). The “7min deoxy” sample is then removed and added to an O2(g)purged EPR tube and frozen 1 minute after the just mentioned vortexing began. Thesesteps are repeating until the total reaction time is 20 minutes. It can be understood fromthis description that the sample freezing times are different from vortexing times. It isimportant to mention how sensitive the reaction conditions are for this experiment.
Subsequent to publication of these spectra (Appendix A) and our report detailed
SNO-hemoglobin formation through nitrite reactions with deoxy hemoglobin (Chapter
78
3). The idea that nitrite ion has a salutary biochemistry was considered by other
researchers. Gladwin and co-workers originally criticized these ideas are representing a
“nitrite” artifact(16), but now have changed their view completely and see nitrite as the
critical species in RBC induced vasodilation (17, 18). However, Gladwin and co-
workers (19) and Rifkind and co-workers (20) suggest that the heme-Fe(III)NO species
formed represents the active compound, which exerts its activity through release of NO.
Gladwin and co-workers (19) further suggest that since this species is formed only in the
reaction with deoxyhemoglobin, then the link between NO availability and tissue oxygen
level, required for modeling hypoxic vasodilation is met. The major difficulty with their
idea, however, is the abundance of vacant hemes in the deoxyhemoglobin that would
scavenge NO on ferrous hemes as quickly as it is released from the ferric hemes. In their
experiments sparging with argon is necessary for release of NO. In addition, there is no
basis as yet for any suggestion that heme-Fe(III)NO plays that unique role of SNO-
hemoglobin (21-23) in exhibiting a graded vasodilatory response as a function of oxygen
tension across the physiological oxygen gradient. Notably, both Rifkind (20) and
Galdwin (16, 24) report abundant SNO formation in their samples. Thus their
observations, taken as a whole, are entirely compatible with all of the ideas presented in
this thesis about SNO-hemoglobin in hypoxic vasodilation – in particular, its role in
transducing oxygen signals to dispense NO bioactivity, and its formation redox coupling
among NO and the heme and thiol groups of hemoglobin.
79
References
1. Jia, L., Bonaventura, C., Bonaventura, J. & Stamler, J. S. (1996) Nature 380, 221-6.
2. Gow, A. J., Luchsinger, B. P., Pawloski, J. R., Singel, D. J. & Stamler, J. S.(1999) Proc Natl Acad Sci U S A 96, 9027-32.
3. Hille, R., Olson, J. S. & Palmer, G. (1979) J Biol Chem 254, 12110-20.4. Taketa, F., Antholine, W. E. & Chen, J. Y. (1978) J Biol Chem 253, 5448-51.5. Louro, S. R., Ribeiro, P. C. & Bemski, G. (1981) Biochim Biophys Acta 670, 56-
63.6. Henry, Y. & Banerjee, R. (1973) J. Mol. Biol. 73, 469-82.7. Reisberg, P., Olson, J. S. & Palmer, G. (1976) J. Biol. Chem. 251, 4379-83.8. Mansouri, A. & Winterhalter, K. H. (1974) Biochemistry 13, 3311-4.9. Kruszyna, R., Kruszyna, H., Smith, R. P., Thron, C. D. & Wilcox, D. E. (1987) J
Pharmacol Exp Ther 241, 307-13.10. Ignarro, L. J., Fukuto, J. M., Griscavage, J. M., Rogers, N. E. & Byrns, R. E.
(1993) Proc Natl Acad Sci U S A 90, 8103-7.11. Spagnuolo, C., Rinelli, P., Coletta, M., Chiancone, E. & Ascoli, F. (1987)
Biochim Biophys Acta 911, 59-65.12. Smith, R. C., Gore, J. Z. & Doyle, M. P. (1991) Free Radic Biol Med 11, 373-7.13. Lissi, E. (1998) Free Radic Biol Med 24, 1535-6.14. Doyle, M. P., Pickering, R. A., DeWeert, T. M., Hoekstra, J. W. & Pater, D.
(1981) J Biol Chem 256, 12393-8.15. Reutov, V. P. & Sorokina, E. G. (1998) Biochemistry (Mosc) 63, 874-84.16. Xu, X., Cho, M., Spencer, N. Y., Patel, N., Huang, Z., Shields, H., King, S. B.,
Gladwin, M. T., Hogg, N. & Kim-Shapiro, D. B. (2003) Proc Natl Acad Sci U S A100, 11303-8.
17. Gladwin, M. T. (2004) J Clin Invest 113, 19-21.18. Gladwin, M. T. & Schechter, A. N. (2004) Circulation Research, 851-55.19. Cosby, K., Partovi, K. S., Crawford, J. H., Patel, R. P., Reiter, C. D., Martyr, S.,
Yang, B. K., Waclawiw, M. A., Zalos, G., Xu, X., Huang, K. T., Shields, H.,Kim-Shapiro, D. B., Schechter, A. N., Cannon, R. O., 3rd & Gladwin, M. T.(2003) Nat Med 9, 1498-505.
20. Nagababu, E., Ramasamy, S., Abernethy, D. R. & Rifkind, J. M. (2003) J BiolChem 278, 46349-56.
21. Stamler, J. S., Jia, L., Eu, J. P., McMahon, T. J., Demchenko, I. T., Bonaventura,J., Gernert, K. & Piantadosi, C. A. (1997) Science 276, 2034-7.
22. McMahon, T. J., Pawloski, J. R., Hess, D. T., Piantadosi, C. A., Luchsinger, B. P.,Singel, D. J. & Stamler, J. S. (2003) Blood 102, 410-1; author reply 412-3.
23. McMahon, T. J., Exton Stone, A., Bonaventura, J., Singel, D. J. & Stamler, J. S.(2000) J Biol Chem 275, 16738-45.
24. Gladwin, M. T., Lancaster, J. R., Jr., Freeman, B. A. & Schechter, A. N. (2003)Nat Med 9, 496-500.
Import@"êUsersêluchsingêDocumentsê Ph.D.êAll Data&Researchêmet + NOkineticsê met NO kinetics organizationê with Gepasi kinetic fitsêtargettesting all kinetic dataêPBS8-17 14x234 input T.csv"D;
= DiagonalMatrix@8L1, L2, L3<DL- = Inverse@LèèèDDimensionsARèèè †EDimensions@L-D8234, 3<83, 234<83, 3<r1 = Table@-j, 8j, 0.1 , 8 , 0.1<D; H*Table ramps met percent*LH*Table Dimension=HRed-Blue+GreenLGreen.Blue is 1 st #,Red is the last #,Green is the step-size.*L
dimenNumber817PBS, "Table"D;nnn = Get@"êUsersêluchsingêDocumentsêMathematica filesêdimenNumber817PBS.txt"D;H*need Dimension number. Export then Get is the way it worked.*L
96
H*middlenumber = nnn- 2*Lr2 = Table@-1, 8j, nnn<D; H*Table norms IINO*LDimensions@r2D;r3 = Table@5, 8j, nnn<D; H*Table normsêscales time series data to cannonical met,IINO*LDimensions@r3D;r123 = Table@8r1, r2, r3<D; H*0 th step. making test vector*LDimensions@r123Dmet = Import@"êUsersêluchsingêDocumentsêMathematica filesêmet234x1.csv", "List"D;IINO = Import@"êUsersêluchsingêDocumentsêMathematica filesêIINO234x1.csv",
"List"D;Datcol1 = SPE817PBSP1T; H*1 st spectrum from time series data*LDimensions@Datcol1DmetIINOSPE817PBS = 8met, IINO, Datcol1<; H*1 st step. making test vector*LDimensions@metIINOSPE817PBSDmetIINOEPS817PBS = Transpose@metIINOSPE817PBSD;H* 234 x3 2 nd step. making test vector*LDimensions@metIINOEPS817PBSDmetIINOIIINO1 = metIINOEPS817PBS.r123;H* 234 x3.r123 3 rd step. making test vector*LDimensions@metIINOIIINO1DmetIINOIIINO = Transpose@metIINOIIINO1D;H* 234 x1 4 th step. making test vector*LIIINO2 = Import@"êUsersêluchsingêDocumentsêMathematica filesêIIINOx.txt", "List"D;H*below is equation 3.127 from Factor Analysis in Chemistry, EdmundMalinowski,1991*L
metIINOSPE817PBS = 8met, IINO<;x̀metIINO = R
èèè.L- .R
èèè † .metIINO;
x̀IIINO1st = Rèèè.L- .R
èèè † .metIINOIIINOP1T;H*Blue is predicted vector, Red is test vector*Lx̀2 = R
èèè.L- .R
èèè † .metIINOIIINOP2T; H*Blue is predicted vector, Red is test vector*Lx̀3 = R
èèè.L- .R
èèè † .metIINOIIINOP3T;x̀4 = R
èèè.L- .R
èèè † .metIINOIIINOP4T;x̀5 = R
èèè.L- .R
èèè † .metIINOIIINOP5T;x̀6 = R
èèè.L- .R
èèè † .metIINOIIINOP6T;x̀7 = R
èèè.L- .R
èèè † .metIINOIIINOP7T;x̀8 = R
èèè.L- .R
èèè † .metIINOIIINOP8T;x̀9 = R
èèè.L- .R
èèè † .metIINOIIINOP9T;
97
x̀10 = Rèèè.L- .R
èèè † .metIINOIIINOP10T;x̀11 = R
èèè.L- .R
èèè † .metIINOIIINOP11T;x̀12 = R
èèè.L- .R
èèè † .metIINOIIINOP12T;x̀13 = R
èèè.L- .R
èèè † .metIINOIIINOP13T;x̀14 = R
èèè.L- .R
èèè † .metIINOIIINOP14T;x̀15 = R
èèè.L- .R
èèè † .metIINOIIINOP15T;x̀16 = R
èèè.L- .R
èèè † .metIINOIIINOP16T;x̀17 = R
èèè.L- .R
èèè † .metIINOIIINOP17T;x̀18 = R
èèè.L- .R
èèè † .metIINOIIINOP18T;x̀19 = R
èèè.L- .R
èèè † .metIINOIIINOP19T;x̀20 = R
èèè.L- .R
èèè † .metIINOIIINOP20T;x̀21 = R
èèè.L- .R
èèè † .metIINOIIINOP21T;x̀22 = R
èèè.L- .R
èèè † .metIINOIIINOP22T;x̀23 = R
èèè.L- .R
èèè † .metIINOIIINOP23T;x̀24 = R
èèè.L- .R
èèè † .metIINOIIINOP24T;x̀25 = R
èèè.L- .R
èèè † .metIINOIIINOP25T;x̀26 = R
èèè.L- .R
èèè † .metIINOIIINOP26T;x̀27 = R
èèè.L- .R
èèè † .metIINOIIINOP27T;x̀28 = R
èèè.L- .R
èèè † .metIINOIIINOP28T;x̀29 = R
èèè.L- .R
èèè † .metIINOIIINOP29T;x̀30 = R
èèè.L- .R
èèè † .metIINOIIINOP30T;x̀31 = R
èèè.L- .R
èèè † .metIINOIIINOP31T;x̀32 = R
èèè.L- .R
èèè † .metIINOIIINOP32T;x̀33 = R
èèè.L- .R
èèè † .metIINOIIINOP33T;x̀34 = R
èèè.L- .R
èèè † .metIINOIIINOP34T;x̀35 = R
èèè.L- .R
èèè † .metIINOIIINOP35T;x̀36 = R
èèè.L- .R
èèè † .metIINOIIINOP36T;x̀37 = R
èèè.L- .R
èèè † .metIINOIIINOP37T;x̀38 = R
èèè.L- .R
èèè † .metIINOIIINOP38T;x̀39 = R
èèè.L- .R
èèè † .metIINOIIINOP39T;x̀40 = R
èèè.L- .R
èèè † .metIINOIIINOP40T;x̀41 = R
èèè.L- .R
èèè † .metIINOIIINOP41T;x̀42 = R
èèè.L- .R
èèè † .metIINOIIINOP42T;x̀43 = R
èèè.L- .R
èèè † .metIINOIIINOP43T;x̀44 = R
èèè.L- .R
èèè † .metIINOIIINOP44T;
98
x̀45 = Rèèè.L- .R
èèè † .metIINOIIINOP45T;x̀46 = R
èèè.L- .R
èèè † .metIINOIIINOP46T;x̀47 = R
èèè.L- .R
èèè † .metIINOIIINOP47T;x̀48 = R
èèè.L- .R
èèè † .metIINOIIINOP48T;x̀49 = R
èèè.L- .R
èèè † .metIINOIIINOP49T;x̀50 = R
èèè.L- .R
èèè † .metIINOIIINOP50T;x̀51 = R
èèè.L- .R
èèè † .metIINOIIINOP51T;x̀52 = R
èèè.L- .R
èèè † .metIINOIIINOP52T;x̀53 = R
èèè.L- .R
èèè † .metIINOIIINOP53T;x̀54 = R
èèè.L- .R
èèè † .metIINOIIINOP54T;x̀55 = R
èèè.L- .R
èèè † .metIINOIIINOP55T;x̀56 = R
èèè.L- .R
èèè † .metIINOIIINOP56T;x̀57 = R
èèè.L- .R
èèè † .metIINOIIINOP57T;x̀58 = R
èèè.L- .R
èèè † .metIINOIIINOP58T;x̀59 = R
èèè.L- .R
èèè † .metIINOIIINOP59T;x̀60 = R
èèè.L- .R
èèè † .metIINOIIINOP60T;x̀61 = R
èèè.L- .R
èèè † .metIINOIIINOP61T;x̀62 = R
èèè.L- .R
èèè † .metIINOIIINOP62T;x̀63 = R
èèè.L- .R
èèè † .metIINOIIINOP63T;x̀64 = R
èèè.L- .R
èèè † .metIINOIIINOP64T;x̀65 = R
èèè.L- .R
èèè † .metIINOIIINOP65T;x̀66 = R
èèè.L- .R
èèè † .metIINOIIINOP66T;x̀67 = R
èèè.L- .R
èèè † .metIINOIIINOP67T;x̀68 = R
èèè.L- .R
èèè † .metIINOIIINOP68T;x̀69 = R
èèè.L- .R
èèè † .metIINOIIINOP69T;x̀70 = R
èèè.L- .R
èèè † .metIINOIIINOP70T;x̀71 = R
èèè.L- .R
èèè † .metIINOIIINOP71T;x̀72 = R
èèè.L- .R
èèè † .metIINOIIINOP72T;x̀73 = R
èèè.L- .R
èèè † .metIINOIIINOP73T;x̀74 = R
èèè.L- .R
èèè † .metIINOIIINOP74T;x̀IIINOlast = R
èèè.L- .R
èèè † .metIINOIIINOPnnnT;H*Blue is predicted vector, Red is test vector*LpredictedIIINOb = 8x̀29 , x̀30 , x̀31 , x̀32 , x̀33, x̀34, x̀35 <;Dimensions@predictedIIINObD;predictedIIINO = Transpose@predictedIIINObD;Dimensions@predictedIIINODExport@
99
"êUsersêluchsingêDocumentsê Ph.D.êAll Data&Researchêmet + NO kineticsê metNO kinetics organizationê with Gepasi kinetic fitsêtarget testing all kinetic dataêall 8-17PBS_movie_vary r1&r3êr3=5 #30-35.csv", predictedIIINO, "CSV"D;