CHEOPS-GOME: WP2.1: Study of Instrument Degradation Docnr: SRON-EOS/RP/05-018 Issue : Version 1, Revision 2 Date : 14th September 2005 Summary The goal of this study is to develop a method to quantify GOME degradation in the UV, where the focus is on the O3 profile wavelength range 270-330 nm. The approach followed is to compare GOME reflectivity spectra with simulated spectra using collocated independent measurements of O3, temperature and pressure. For this a vector radiative transfer model (RTM) was used to avoid errors introduced by the GOME polarisation correction algorithm, (degradation of) the GOME polarisation measurements and errors in the forward radiances introduced when using a scalar RTM. prepared department signature date J.M. Krijger SRON 14/09/2005 checked I. Aben SRON J. Landgraf SRON copies to A. Kaifel ZSW 27/09/2005 C. Zehner ESA 27/09/2005
Transcript
� � �
CHEOPS-GOME:
WP2.1: Study of Instrument Degradation
Docnr: SRON-EOS/RP/05-018Issue : Version 1, Revision 2Date : 14th September 2005
Summary
The goal of this study is to develop a method to quantify GOME degradation in the UV,where the focus is on the O3 profile wavelength range 270-330 nm. The approach followedis to compare GOME reflectivity spectra with simulated spectra using collocated independentmeasurements of O3, temperature and pressure. For this a vector radiative transfer model(RTM) was used to avoid errors introduced by the GOME polarisation correction algorithm,(degradation of) the GOME polarisation measurements and errors in the forward radiancesintroduced when using a scalar RTM.
prepared department signature date
J.M. Krijger SRON 14/09/2005
checked
I. Aben SRONJ. Landgraf SRON
copies to
A. Kaifel ZSW 27/09/2005C. Zehner ESA 27/09/2005
� � �Docnr: SRON-EOS/RP/05-018Issue : Version 1, Revision 2Date : 14th September 2005
� � �Docnr: SRON-EOS/RP/05-018Issue : Version 1, Revision 2Date : 14th September 2005
References
Aben, I., M. Eisinger, E. Hegels, R. Snel, and C. P. Tanzi, GDAQI final report, Report TN-GDAQI-003SR/2000 , ESA, 2000.
Azzam, M., R., and N. Bashara, Ellipsometry and Polarized Light , Elsevier, 1987.
Bass, A. M., and R. J. Paur, The ultraviolet cross-sections of ozone: I. The measurements ofatmospheric ozone, in Proceedings of the Quadrennial Ozone Symposium, pp. 606–616, D.Reidel Publ., Norwell, Mass., 1985.
Burrows, J. P., A. Dehn, B. Deters, S. Himmelmann, A. Richter, S. Voigt, and J. Orphal, Atmo-spheric remote-sensing reference data from GOME,: 2, Temperature-dependent absorptioncross sections of O3 in the 231-794 nm range, J. Quant. Spectrosc. Radiat. Transfer , 61 ,509–517, 1999.
de Haan, J., P. Bosma, and J. Hovenier, The adding method for multiple scattering calculationsof polarized light, Astron. Astrophys., 181 , 371–391, 1987.
Eisinger, J., M., J. Burrows, and A. Richter, Studies on the Precision of GOME Irradiance andRadiance Products and GOME Measurements of OClO and BrO over Antarctica, in GOMEGeophysical Validation Campaign, ESA WPP-108 , pp. 93–108, 1996.
Fortuin, J. P. F., and H. Kelder, An ozone climatology based on ozonesonde and satellite mea-surements, J. Geophys. Res., 103 , 31,709–31,734, 1998.
Grainger, J. F., and J. Ring, Anomalous Fraunhofer Line Profiles, Nat , 193 , 762–+, 1962.
Hasekamp, O., and J. Landgraf, Ozone profile retrieval from backscattered ultraviolet radiances:The inverse problem solved by regularization, J. Geophys. Res., 106 , 8077–8088, 2001.
Hasekamp, O., and J. Landgraf, A linearized vector radiative transfer model for atmospherictrace gas retrieval, J. Quant. Spectrosc. Radiat. Transfer , 75 , 221–238, 2002.
Hegels, E., D. Loyola, S. Hummel, S. Slijkhuis, and W. Thomas, Analysis of GOME/ERS-2Degradation and its impact on trace gas long-term monitoring, in ERS-ENVISAT Symposium”Looking down to Earth in the New Millennium”, pp. CD–ROM, 2000.
Koelemeijer, R. B. A., J. F. de Haan, and P. Stammes, A database of spectral surface reflectivityin the range 335-772 nm derived from 5.5 years of GOME observations, Journal of GeophysicalResearch (Atmospheres), 108 , 8–1, 2003.
Krijger, J. M., C. P. Tanzi, I. Aben, and F. Paul, Validation of GOME polarization measurementsby method of limiting atmospheres, Journal of Geophysical Research (Atmospheres), 110 ,7305–+, 2005.
Landgraf, J., O. Hasekamp, T. Trautmann, and M. Box, A linearized radiative transfer model forozone profile retrieval using the analytical forward-adjoint perturbation theory, J. Geophys.Res., 106 , 27,291–27,306, 2001.
J.M. Krijger : Page 2 of 23
� � �Docnr: SRON-EOS/RP/05-018Issue : Version 1, Revision 2Date : 14th September 2005
Landgraf, J., O. P. Hasekamp, R. van Deelen, and I. Aben, Rotational Raman scattering ofpolarized light in the Earth atmosphere: a vector radiative transfer model using the radiativetransfer perturbation theory approach, Journal of Quantitative Spectroscopy and RadiativeTransfer , 87 , 399–433, 2004.
Orphal, J., A critical review of the absorption cross-sections of o3 and no2 in the 240-790 nmregion. part i: Ozone, Technical Note MO-TN-ESA-GO-0302 , ESA, 2002.
Palik, E. D., Handbook of optical constants of solids, Academic Press Handbook Series, NewYork: Academic Press, 1985, edited by Palik, Edward D., 1985.
Peeters, P., and P. C. Simon, GOME solar irradiance validation using UARS SOLSTICE data,in ESA SP-414: Third ERS Symposium on Space at the service of our Environment , pp.697–+, 1997.
Peeters, P., G. Simon, G. Rottman, and T. Woods, UARS SOLSTICE Data as a calibrationand validation of GOME, in GOME Geophysical Validation Campaign, ESA WPP-108 , pp.75–83, 1996.
Slijkhuis, S., Cheops-gome study on seasonal effects on the ers-2/gome diffuser bsdf, ReportCH-TN-DLR-GO-0001 , DLR, 2004.
Snel, R., In-orbit optical degradation: GOME experience and SCIAMACHY prediction, inERS-ENVISAT Symposium ”Looking down to Earth in the New Millennium”, pp. CD–ROM,2000.
van der A, R. J., R. F. van Oss, A. J. M. Piters, J. P. F. Fortuin, Y. J. Meijer, and H. M. Kelder,Ozone profile retrieval from recalibrated Global Ozone Monitoring Experiment data, Journalof Geophysical Research (Atmospheres), 107 , 2–1, 2002.
Voigt, S., J. Orphal, and J. P. Burrows, UV-visible absorption cross-sections of NO2 and O3 atatmospheric temperatures and pressures by FTS, in Proceedings of the European Symposiumon Atmospheric Measurements From Space, pp. 471–475, Eur. Space Agency/Eur. Space Res.and Technol. Cent., Noordwijk, Netherlands, 1999.
J.M. Krijger : Page 3 of 23
� � �Docnr: SRON-EOS/RP/05-018Issue : Version 1, Revision 2Date : 14th September 2005
1 Introduction
1.1 Study rationale
Satellite-based passive remote sensing is commonly used to derive global information about thecomposition of the Earth’s atmosphere. Information about the total column or even verticalprofiles of different gases in the earth atmosphere can be obtained by measuring the radiance(intensity) spectrum of sunlight reflected by the Earth’s atmosphere, since these spectra containabsorption bands of gases present in the atmosphere, such as ozone. The Global Ozone Monitor-ing Experiment (GOME) is an operational space-based spectrometer that measures the radianceof reflected sunlight in the ultraviolet, visible and near-infrared wavelength range (240–800 nm)with modest spectral resolution (0.2–0.4 nm) (Burrows et al. 1999). GOME is on ESA’s secondEuropean Remote Sensing satellite (ERS-2) which was launched on 21 April 1995.
Comparison of the solar irradiance spectra measured by GOME through the lifetime of thesensor with early GOME solar irradiance spectra and other space instruments, showed thatthe pre-flight radiance parameters were no longer applicable to the GOME in-flight situation(Eisinger et al. 1996; Peeters et al. 1996; Peeters and Simon 1997; Aben et al. 2000; Hegelset al. 2000). The GOME sensor shows degradation in all wavelength regions due to damagesin its optical path. Most damage is done by hard UV light to the quartz-glass of prisms andlenses, but there might also be damage to coatings or to the detectors due to accumulation ofsome sort of contamination (dirt). In practice it is impossible to isolate all individual (optical)components as only the overall effect can be monitored through specific observations such as thedaily solar observations of GOME. Currently several changes in sensitivity of the instrument aresimultaneous monitored: degradation, geometric changes in optical paths, changes of coatings.
This study is carried out in the framework of the CHEOPS-GOME project: ”Climatologyof Height-resolved Earth Ozone and profiling Systems for GOME”.
1.2 Outline of this study
The goal of this study is to develop a method to quantify GOME degradation in the UV, wherethe focus is on the O3 profile wavelength range 270-330 nm. The approach followed is to compareGOME reflectivity spectra with simulated spectra using collocated independent measurementsof O3, temperature and pressure. For this a vector radiative transfer model (RTM) is used toavoid errors introduced by the GOME polarisation correction algorithm, (degradation of) theGOME polarisation measurements and errors in the forward radiances introduced when using ascalar RTM.
First we describe the radiative model in section 2. The different measurements (from GOMEand collocated independent measurements) are described in section 3. The reliability of theresults and the different error sources are discussed in section 4, following with the results insection 5. The main conclusions are summarized in section 6.
J.M. Krijger : Page 4 of 23
� � �Docnr: SRON-EOS/RP/05-018Issue : Version 1, Revision 2Date : 14th September 2005
2 Model Description
2.1 Radiative Model
In order to model the reflectance to compare with GOME measurements, it is necessary to usea radiative transfer model. The radiative transfer model developed at SRON solves the planeparallel radiative transfer equation using the Gauss-Seidel iterative method. Multiple scatter-ing and polarisation are fully included in the model. A detailed description of the model isgiven by Landgraf et al. (2001) for the scalar case and the extension to polarisation is describedby Hasekamp and Landgraf (2002). The inclusion of polarisation in the radiative transfer cal-culations omits errors of up to 10% in the UV on the radiance made by the commonly usedscalar radiative transfer models, that neglect polarisation properties of light. Another, advan-tage of a radiative transfer model including polarisation is that it allows a direct modelling ofthe polarisation sensitive GOME measurement using the Mueller matrix formalism. In this wayerrors of up to 8% in the GOME data processor polarisation correction and uncorrected separatedegradation effects of the Polarisation Monitoring Devices (Krijger et al. 2005) are omitted.
2.2 Studied wavelength range
GOME measures between 204–793 nm, however the low signal shortwave radiances measured byGOME below 270 nm do not allow a comparison of high enough signal/noise ratio with model-calculations. As such the focus here is on wavelengths above 270 nm. Towards longer wavelengthsthe solar light travels further through the atmosphere before being scattered (towards GOME)as ozone absorption decreases at longer wavelengths above 300 nm. As such physical parametersas surface albedo and aerosols have to be included in the calculations. These parameters varyover the globe and have to be known in order to include them in the calculations. The radiativetransfer model used does not include aerosols as no measured information about atmosphericaerosol content was available. By fitting the model spectra to the measured spectra at a specificwavelength range (here: 324–328 nm) an effective Lambertian reflectivity is derived for theseselected wavelengths, including both surface albedo and aerosols. The individual effect of bothparameters cannot be distinguished, while both parameters have a different behaviour overwavelength. In the RTM-model a constant effective reflectivity is assumed over wavelength,causing errors due to the ignoring of the different behaviour over wavelength. Therefore asensitivity study has been performed to estimate the effect of not accounting for aerosols andsurface albedo wavelength dependent behaviour in the model. This study showed that this effectalready becomes non-neglectable above 330 nm, which reduces the relevant wavelength rangefor this study to below 330 nm.
J.M. Krijger : Page 5 of 23
� � �Docnr: SRON-EOS/RP/05-018Issue : Version 1, Revision 2Date : 14th September 2005
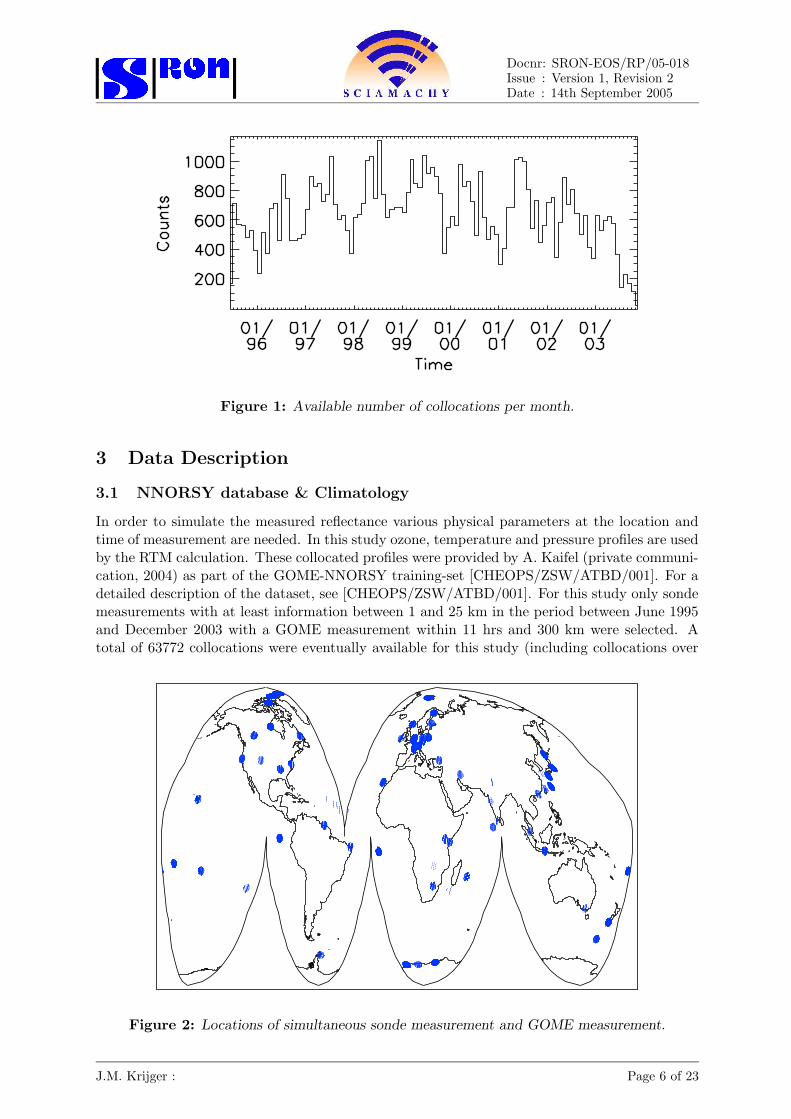
Figure 1: Available number of collocations per month.
3 Data Description
3.1 NNORSY database & Climatology
In order to simulate the measured reflectance various physical parameters at the location andtime of measurement are needed. In this study ozone, temperature and pressure profiles are usedby the RTM calculation. These collocated profiles were provided by A. Kaifel (private communi-cation, 2004) as part of the GOME-NNORSY training-set [CHEOPS/ZSW/ATBD/001]. For adetailed description of the dataset, see [CHEOPS/ZSW/ATBD/001]. For this study only sondemeasurements with at least information between 1 and 25 km in the period between June 1995and December 2003 with a GOME measurement within 11 hrs and 300 km were selected. Atotal of 63772 collocations were eventually available for this study (including collocations over
Figure 2: Locations of simultaneous sonde measurement and GOME measurement.
J.M. Krijger : Page 6 of 23
� � �Docnr: SRON-EOS/RP/05-018Issue : Version 1, Revision 2Date : 14th September 2005
clouded ground sites). Fig. 1 shows the number of collocation sonde sites available for eachmonth. See Fig. 2 for the locations of the measurements during the entire period.
All ozone profiles were provided on a 1-km resolution. As sondes become unreliable above30 km, the information was cut off above a randomly determined height between 25 and 30 km,in order to avoid any systematic effects. Above this cut off height, climatological ozone valuesare added from Fortuin and Kelder (1998) climatology and UKMO temperature profiles. Thetwo 1-km layers below the cut off height are replaced with an average of the sonde-measuredvalues and climatological values, in order to avoid jumps in the applied profiles. The groundpressure measured by the sonde is used to derive a pressure grid for the RTM-model.
3.2 GOME data
The GOME data used in this study was extracted with the DLR-GOME-data-extractor ver-sion 2.3 (Slijkhuis 1999). The period studied starts in May 1996 till December 2003. Themeasurements were corrected with the standard options (leakage, FPA, Fixed, Straylight, Nor-malized, Intensity), but no polarisation correction was applied as this is compensated with thepolarisation RTM calculations. Other options used, all improvements to earlier versions of theDLR-gome-data-extractor, are the performance of a wavelength cross-correlation, a correctionfor the Peltier Cooler effect and an improved BSDF correction (Slijkhuis 2004). During theperiod 2001-2002 the GOME data processor suffered from a problem that no new solar spectrawere written to the GOME data files. As such we used a special ESA dataset containing updatedand correct daily solar reference spectra during this period.
In order to increase signal-to-noise ratio the GOME instrument co-adds measurements atwavelengths below 283 nm over 12 sec, while measurements with wavelengths higher than 283 nmare integrated over 1.5 sec. For this study only ground pixels of 12 sec integration time are used,co-adding 1.5 sec ground-pixels ourselves where necessary.
3.3 Improvements to original approach
During this study several improvements were introduced to the available data and the RTM-model. The following figures illustrates how each new improvement changes the (sample) results.
• Fig. 3 shows the comparison between 21 (randomly chosen) GOME measurements in 1997and corresponding RTM-model calculations. In 1997 no degradation has earlier been detectedand as such a complete agreement between measurement and model-calculation is expected.
As the wavelengths around 300 nm are sensitive to the entire ozone profile, the variationaround 300 nm is likely due to a non-representative total ozone column. Therefore we decided toscale the ozone profiles with the total ozone column as provided by TEMIS 1. The results fromthis change are shown in Fig. 4. Clearly they are an improvement around 300 nm compared tothe original results in Fig. 3.
• The ratio between measured and calculated spectra show sharp residual absorption lines.This is caused by the Ring-effect (Grainger and Ring 1962), where absorption lines are filledby light scattered in wavelength and possibly small wavelength shifts. In order to correctfor this effect a residual-Ring spectrum was calculated on the GOME wavelength grid (Land-graf et al. 2004) An amplitude and a wavelength-offset were than fitted to match the pre-calculated residual-Ring spectrum to the difference between simulated and measured spectrum.All wavelength-offsets were smaller then a single GOME wavelength-bin. The pre-calculatedresidual-Ring spectrum (after wavelength-shift and amplitude multiplication) was then sub-tracted. To remove any remaining Ring-effect a smoothing over 3 GOME wavelength bins isperformed. The improvements are shown in Fig. 5.
1www.temis.nl
J.M. Krijger : Page 7 of 23
� � �Docnr: SRON-EOS/RP/05-018Issue : Version 1, Revision 2Date : 14th September 2005
Figure 3: Several (21) example ratios (GOME/simulation) as a function of wavelength betweenmeasured and simulated spectra during 1997.
• An unphysical feature shows up in the comparison spectrum between 310-330 nm. A
Figure 4: Similar as Fig. 3 but now each ozone column has been scaled with the total columnas provided by TEMIS.
J.M. Krijger : Page 8 of 23
� � �Docnr: SRON-EOS/RP/05-018Issue : Version 1, Revision 2Date : 14th September 2005
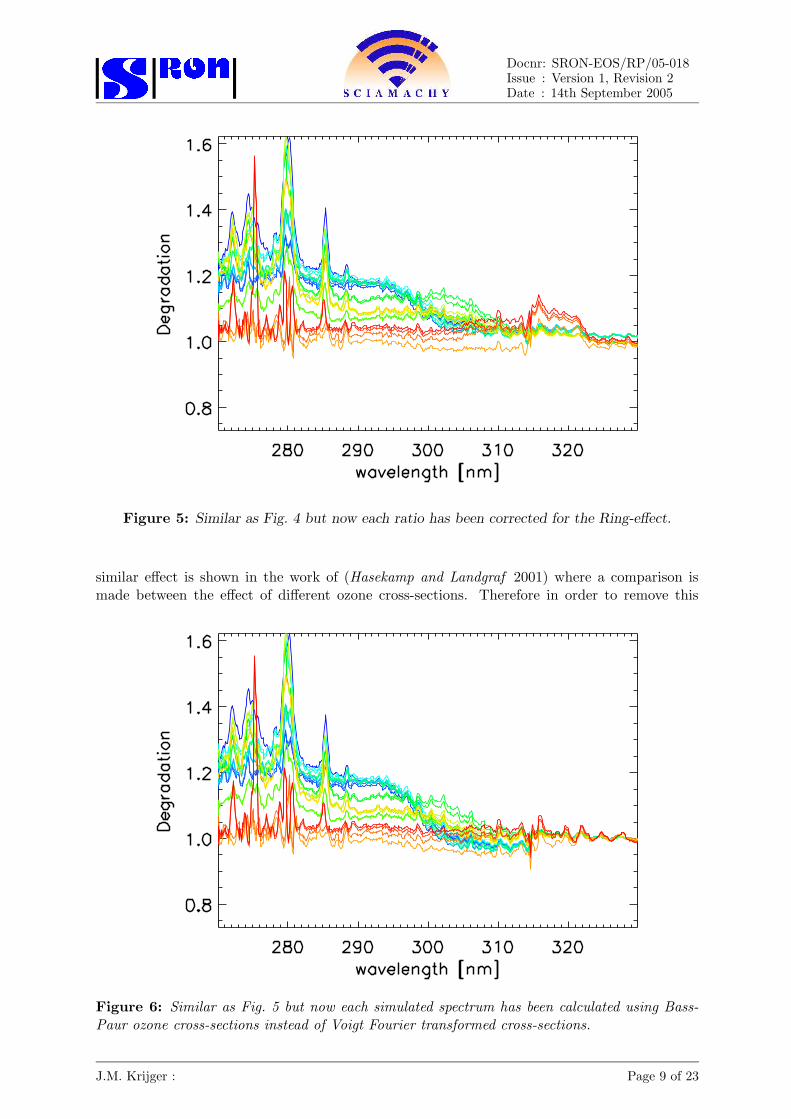
Figure 5: Similar as Fig. 4 but now each ratio has been corrected for the Ring-effect.
similar effect is shown in the work of (Hasekamp and Landgraf 2001) where a comparison ismade between the effect of different ozone cross-sections. Therefore in order to remove this
Figure 6: Similar as Fig. 5 but now each simulated spectrum has been calculated using Bass-Paur ozone cross-sections instead of Voigt Fourier transformed cross-sections.
J.M. Krijger : Page 9 of 23
� � �Docnr: SRON-EOS/RP/05-018Issue : Version 1, Revision 2Date : 14th September 2005
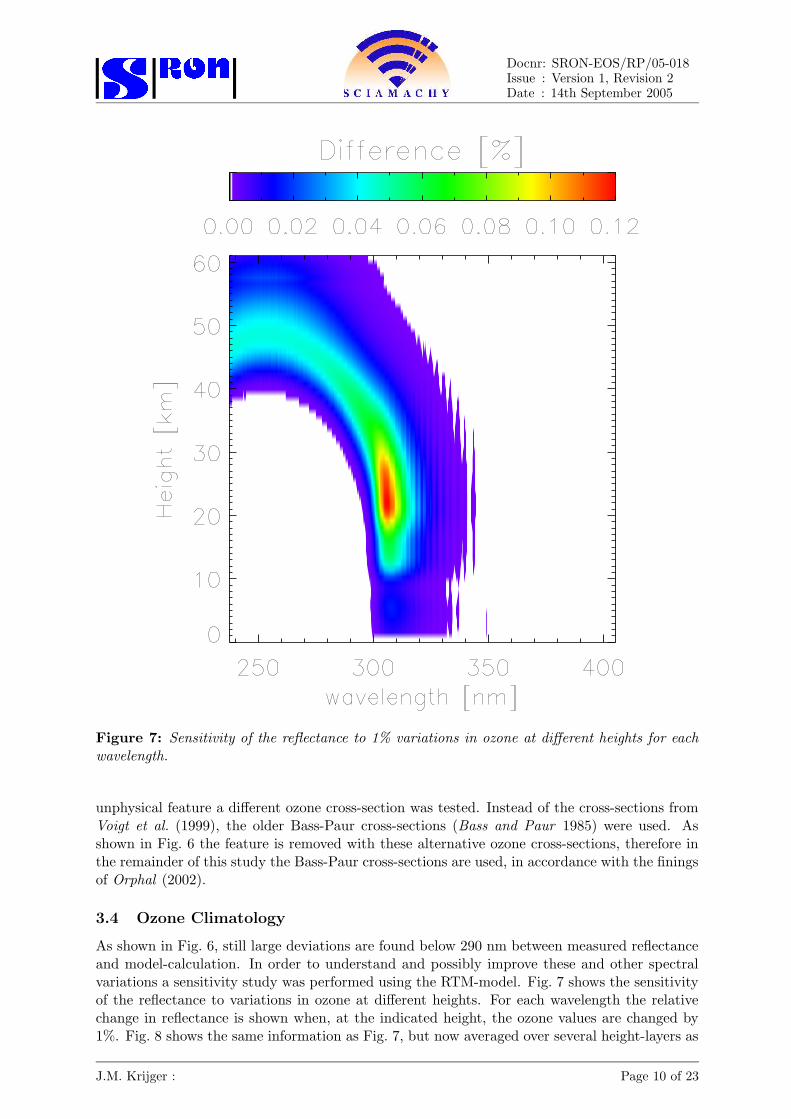
Figure 7: Sensitivity of the reflectance to 1% variations in ozone at different heights for eachwavelength.
unphysical feature a different ozone cross-section was tested. Instead of the cross-sections fromVoigt et al. (1999), the older Bass-Paur cross-sections (Bass and Paur 1985) were used. Asshown in Fig. 6 the feature is removed with these alternative ozone cross-sections, therefore inthe remainder of this study the Bass-Paur cross-sections are used, in accordance with the finingsof Orphal (2002).
3.4 Ozone Climatology
As shown in Fig. 6, still large deviations are found below 290 nm between measured reflectanceand model-calculation. In order to understand and possibly improve these and other spectralvariations a sensitivity study was performed using the RTM-model. Fig. 7 shows the sensitivityof the reflectance to variations in ozone at different heights. For each wavelength the relativechange in reflectance is shown when, at the indicated height, the ozone values are changed by1%. Fig. 8 shows the same information as Fig. 7, but now averaged over several height-layers as
J.M. Krijger : Page 10 of 23
� � �Docnr: SRON-EOS/RP/05-018Issue : Version 1, Revision 2Date : 14th September 2005
Figure 8: Sensitivity of the reflectance l to 1% variations in ozone at different columns for eachwavelength.
indicated in the legend. Several important conclusions for this study can be drawn from thesefigures. Above 350 nm the spectrum is completely insensitive to ozone, wavelengths between310 nm and 350 nm are somewhat sensitive to ozone at the ozone maximum. Wavelengthsbetween 310 nm and 290 nm are sensitive to the entire ozone profile, while wavelengths below290 nm are only sensitive to ozone above 35 km. A variation of 1% in the total ozone above35 km causes a variation of ∼0.55% in the reflectance. The ozone information at these heightsused in this study are solely from ozone climatology. The expected daily variation of ozone atthese heights is around 20%, while the variation within a GOME 12 sec integration ground-pixel (960×480 km2) is around the same amount. This ∼30% uncertainty in ozone at theseheights results in a variation of ∼17% in the resulting spectra. This combined with the ∼10%uncertainty of GOME at these wavelengths results in an uncertainty of ∼20% in any comparisonspectra below 290 nm. As the absolute amounts of ozone at these heights are very small, a verysmall absolute change will result in a large relative change.
In order to improve results at these wavelengths a case study was performed to use actualLIDAR measurements (which measures ozone in these higher layers of the atmosphere) instead.The resulting comparison spectra (a total of 57 collocated LIDAR measurements during 1997)are shown in Fig. 9. The LIDAR measurement were made available by Yasha Meijer, RIVM
J.M. Krijger : Page 11 of 23
� � �Docnr: SRON-EOS/RP/05-018Issue : Version 1, Revision 2Date : 14th September 2005
Figure 9: Ratio between 57 GOME and simulated spectra during 1997. The simulated spectrawere calculated using ozone profiles derived from LIDAR measurements.
(private communication, 2004). Only a slight improvement is seen. The low improvementis likely due to the fact that LIDAR measurements are taken at night, while GOME spectraare taken during day. As such the amount of ozone will have changed during the temporaldifference between LIDAR and GOME measurements. All other variations will also still bepresent. This improvement is not large enough to warrant the construction of a complete newLIDAR collocation database at this time.
Another case study was performed with triple-collocations (GOME, sonde and another ozonemeasuring satellite). The collocated ozone measurement of the upper layers of the atmosphereby SAGE, HALO or POEM, all dedicated ozone measurement satellites, was used instead ofclimatology above 30 km. These temporal and spatial collocated ozone measurements indeed im-proved the resulting comparison spectra, but regrettably too few triple collocations are availableto study any long-term variations.
In order to study the degradation of GOME the uncertainty below 290 nm has to be reduced.The only way this can be achieved, without improved ozone information above 30 km, is toincrease the number of comparison spectra and thus average out the variation. One methodto dramatically increase collocation is to not only include cloud-free collocated observations, asis traditionally done, but all collocations. The presence of any clouds is partly compensatedin the RTM model because of the fitting of an effective reflectivity at 325 nm. Note that forwavelengths shorter then 295 nm the light does not reach the surface due to ozone absorptionand is thus insensitive to the presence of clouds.
3.5 Degradation at 325 nm
The fitting of an effective reflectivity at 325 nm is used to compensate for various effects, likealbedo, aerosols and clouds. However the work of (Koelemeijer et al. 2003) showed alreadydegradation at 335 nm starting around the year 2000. Therefore it is likely that degradation
J.M. Krijger : Page 12 of 23
� � �Docnr: SRON-EOS/RP/05-018Issue : Version 1, Revision 2Date : 14th September 2005
Figure 10: Time series of fitted LER-values over the Libyan Desert (23◦-30◦N, 27◦-30◦E), at325 nm and 335 nm.
has also affected the 325 nm wavelength range during the studied period (1996-2003). By fitting
Figure 11: Degradation for different GOME viewing angles (assuming a constant LER) overthe Libyan Desert (23◦-30◦N, 27◦-30◦E), at 325 nm. The average for each time series is shownin orange.
J.M. Krijger : Page 13 of 23
� � �Docnr: SRON-EOS/RP/05-018Issue : Version 1, Revision 2Date : 14th September 2005
an effective reflectivity at wavelengths around 325 nm any degradation at these wavelengths iscompensated for, which is undesirable for this study. In order to determine the degradationat these wavelengths a study similar to Koelemeijer et al. (2003) was done by determining theeffective reflectivity over the Libyan Desert. The effective reflectivity of the Libyan Desert (23◦-30◦North, 27◦-30◦East) is very constant over time and the Libyan desesrt is rarely clouded. OnlyGOME channel 2 pixels (1.5 sec integration) are selected instead of the larger 12 sec integrationpixels. No backscan pixels were used. All GOME measurements over the Libyan Desert with acloud fraction smaller then 0.20, as provided by TEMIS, were selected and an effective reflectivityfit was made using the RTM-model. For ozone, temperature and pressure profiles the AFGLmid-latitude summer profiles were used. The ozone profile was scaled with the total ozonecolumn from TEMIS. Fig. 10 shows the effective reflectivities resulting from a fit at 335 nm and325 nm as a function of time. The results at 335 nm are identical to those found by Koelemeijeret al. (2003) and shows that degradation clearly starts around the year 2000. For the resultsat 325 nm, beside an offset, the temporal behaviour is the same, showing that degradationstarted around the same time for both wavelengths. These results show that fitting an effectivereflectivity to the measurements at 325 nm cannot be done without degradation correction. Byassuming the effective reflectivity of the Libyan Desert does not change with time, an averageeffective reflectivity before 1999 was determined and used for all model calculations to determinethe degradation at 325 nm by comparing measured with modelled reflectance at 325 nm. Theresults are shown in Fig. 11. No degradation is present until 1999. After 1999 degradation causesan overestimation of the GOME reflectance and a strong viewing angle dependent degradationis visible. However in the rest of this study only the longer integration (12 sec) pixels are used,which are 8 co-added 1.5 sec integration pixel. Backscan pixels use the same angles as East,Nadir and West and will thus have a similar angle-dependent degradation. Therefore the averagedegradation of East, Nadir and West viewing angles was determined and used in the remainderof this study to correct for degradation at 325 nm.
At special request from DLR also the degradation at 385 nm was determined with the samemethod, to avoid sharp transitions for degradation corrections beyond 325 nm.
J.M. Krijger : Page 14 of 23
� � �Docnr: SRON-EOS/RP/05-018Issue : Version 1, Revision 2Date : 14th September 2005
4 Error Sources Summary
Several key-issues determine the reliability of our results. However different issues affect differentwavelength ranges. A summary of the main error sources and their effect is provided here.
4.0.1 Accuracy RTM-model
The accuracy of the RTM-model affects all wavelengths and is thus important to quantify.Therefore the RTM-model has been compared with other models (de Haan et al. 1987) byHasekamp and Landgraf (2002). The accuracy of the model is better then 0.025% and as suchis one of the lowest uncertainty contributions in the final results. However no solar Fraunhoferlines are modelled and as such the Fe+, Mg+, Mg and Si lines around 276, 280, 285 and 288 nmrespectively cannot be trusted.
4.0.2 Accuracy GOME calibrations and corrections
In this study a ’perfect’ calibrated GOME spectra is assumed, with only degradation (and aninitial re-calibration) affecting the GOME measured spectra. The accuracy of GOME measuredspectra is around 1 % for wavelengths above 300 nm and increases up to 10 % for wavelengthsaround 270 nm.
4.0.3 Accuracy ozone sonde measurements
Any inaccuracy in the measured ozone will cause related deviations in the modelled spectrum.As such the accuracy of the ozone profiles used in the radiative transfer calculations is of greatimportance. In the collocations dataset used in this study many different sondes from differentresearch groups were included. As such the inaccuracy at a particular height of different sondesvaried between 1% and 5% for the heights below 25 km. However in this study all profiles arescaled with the measured total ozone column. As the total column is very accurate (<1%) theprofile errors are greatly reduced.
4.1 Ozone climatology
In this study ozone climatology is used for heights above 25–30 km, which affects mostly wave-lengths below 295 nm. Depending on how this climatology deviated from the actual ozoneprofiles, this introduces inaccuracies in the end-result. Unless there is a clear trend in the devi-ation we expect that by using the large collocation dataset individual deviation are reflected inthe standard deviation of the degradation correction. The deviation observed at the beginningof the mission between modelled and measured reflectances. This initial re-calibration cannot beexplained by statistical fluctuations. Biases in ozone climatology can cause this kind of deviationand have been suspected earlier (private communication, Landgraf 2005), but such a large biasin climatology would have been likely discovered earlier.
4.2 Effective reflectivity determination
In this study an effective reflectivity is fit to the measurement at 325 nm, which is then usedfor all wavelengths, as the effective reflectivity (aerosols, surface albedo, clouds) is assumedto be constant over wavelength. In order to avoid the wavelength dependence of the effectivereflectivity, this study has focussed on wavelengths below 330 nm. Wavelengths below 295 nmare very insensitive to ground reflectivity and thus do not suffer from any inaccuracy in theeffective reflectivity fit.
J.M. Krijger : Page 15 of 23
� � �Docnr: SRON-EOS/RP/05-018Issue : Version 1, Revision 2Date : 14th September 2005
4.3 Degradation 325 nm
The GOME instrument degradation is already at such a stage that the reflectance at 325 nmis already suffering from degradation. The study of the reflectivity of the Libyan Desert givesa method to correct for degradation at these wavelengths. However this correction has anuncertainty of a few percent, and is angle-dependent, while the final derived degradation isnot. The error introduced by ignoring the angle-dependence can be up to 10% (around January2001) for individual 1.5 sec measurements, but as the longer 12 sec are co-added this error isdramatically reduced to only a few percent. As the reflectivity is only a small part of the totalreflectance, the final error on the reflectance is estimated to be less then a percent. Howeverthis degradation is less important for ozone profile retrieval users, as the degradation is mostlycompensated by an albedo fit, used in most profile retrievals.
4.4 Accuracy Final Results
With so many different error sources, the final accuracy of each individual comparison spectrais not so high and hard to estimate. However as in this study several tens of thousands ofcollocations are employed, large number statistics apply to the results, such as the calculationof averages and their standard deviation with much higher significance. The uncertainty inthe determination of the average monthly degradation in the next section is less than 0.5% perwavelength bin apart from any systematic errors.
J.M. Krijger : Page 16 of 23
� � �Docnr: SRON-EOS/RP/05-018Issue : Version 1, Revision 2Date : 14th September 2005
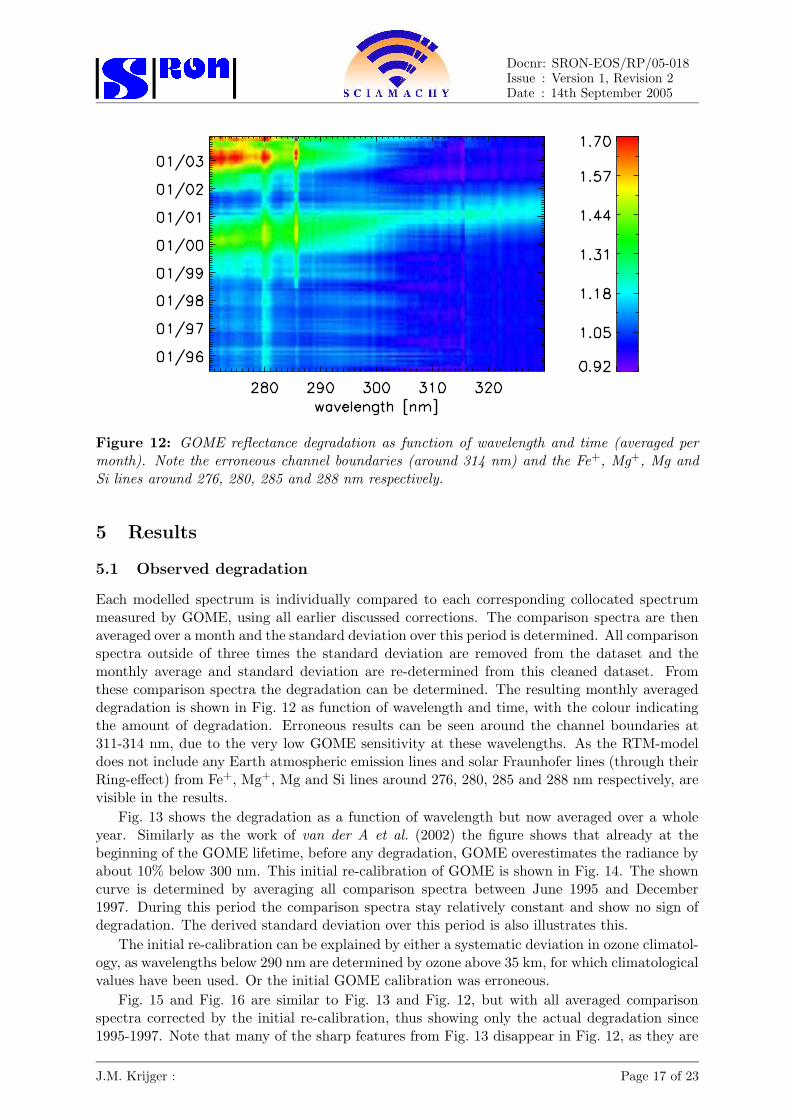
Figure 12: GOME reflectance degradation as function of wavelength and time (averaged permonth). Note the erroneous channel boundaries (around 314 nm) and the Fe+, Mg+, Mg andSi lines around 276, 280, 285 and 288 nm respectively.
5 Results
5.1 Observed degradation
Each modelled spectrum is individually compared to each corresponding collocated spectrummeasured by GOME, using all earlier discussed corrections. The comparison spectra are thenaveraged over a month and the standard deviation over this period is determined. All comparisonspectra outside of three times the standard deviation are removed from the dataset and themonthly average and standard deviation are re-determined from this cleaned dataset. Fromthese comparison spectra the degradation can be determined. The resulting monthly averageddegradation is shown in Fig. 12 as function of wavelength and time, with the colour indicatingthe amount of degradation. Erroneous results can be seen around the channel boundaries at311-314 nm, due to the very low GOME sensitivity at these wavelengths. As the RTM-modeldoes not include any Earth atmospheric emission lines and solar Fraunhofer lines (through theirRing-effect) from Fe+, Mg+, Mg and Si lines around 276, 280, 285 and 288 nm respectively, arevisible in the results.
Fig. 13 shows the degradation as a function of wavelength but now averaged over a wholeyear. Similarly as the work of van der A et al. (2002) the figure shows that already at thebeginning of the GOME lifetime, before any degradation, GOME overestimates the radiance byabout 10% below 300 nm. This initial re-calibration of GOME is shown in Fig. 14. The showncurve is determined by averaging all comparison spectra between June 1995 and December1997. During this period the comparison spectra stay relatively constant and show no sign ofdegradation. The derived standard deviation over this period is also illustrates this.
The initial re-calibration can be explained by either a systematic deviation in ozone climatol-ogy, as wavelengths below 290 nm are determined by ozone above 35 km, for which climatologicalvalues have been used. Or the initial GOME calibration was erroneous.
Fig. 15 and Fig. 16 are similar to Fig. 13 and Fig. 12, but with all averaged comparisonspectra corrected by the initial re-calibration, thus showing only the actual degradation since1995-1997. Note that many of the sharp features from Fig. 13 disappear in Fig. 12, as they are
J.M. Krijger : Page 17 of 23
� � �Docnr: SRON-EOS/RP/05-018Issue : Version 1, Revision 2Date : 14th September 2005
Figure 13: GOME reflectance degradation as function of wavelength and time. The degradationis averaged over a year and shown colour-coded as indicated in the legend. Note the erroneouschannel boundaries (around 314 nm) and the Fe+, Mg+, Mg and Si lines around 276, 280, 285and 288 nm respectively.
Figure 14: Initial correction for the radiometric calibration, determined over the period June1995 – Dec 1997. In black the standard deviation on the correction factor.
J.M. Krijger : Page 18 of 23
� � �Docnr: SRON-EOS/RP/05-018Issue : Version 1, Revision 2Date : 14th September 2005
Figure 15: GOME reflectance degradation as function of wavelength and time since June1995. (Similar as Fig. 13, but now each comparison spectra has been multiplied with the initialcorrection factor as shown in Fig. 14.)
divided out by the initial recalibration. This can be an indication that many of these featuresare GOME calibration problems, most likely calibration differences between Earth radiancesand solar irradiance. The remaining strong line is the result of the absorption line from Mg
Figure 16: Similar as Fig. 12, but now GOME reflectance degradation as function of wavelengthand time since June 1995. Each comparison spectra has been multiplied with the initial correctionfactor as shown in Fig. 14.
J.M. Krijger : Page 19 of 23
� � �Docnr: SRON-EOS/RP/05-018Issue : Version 1, Revision 2Date : 14th September 2005
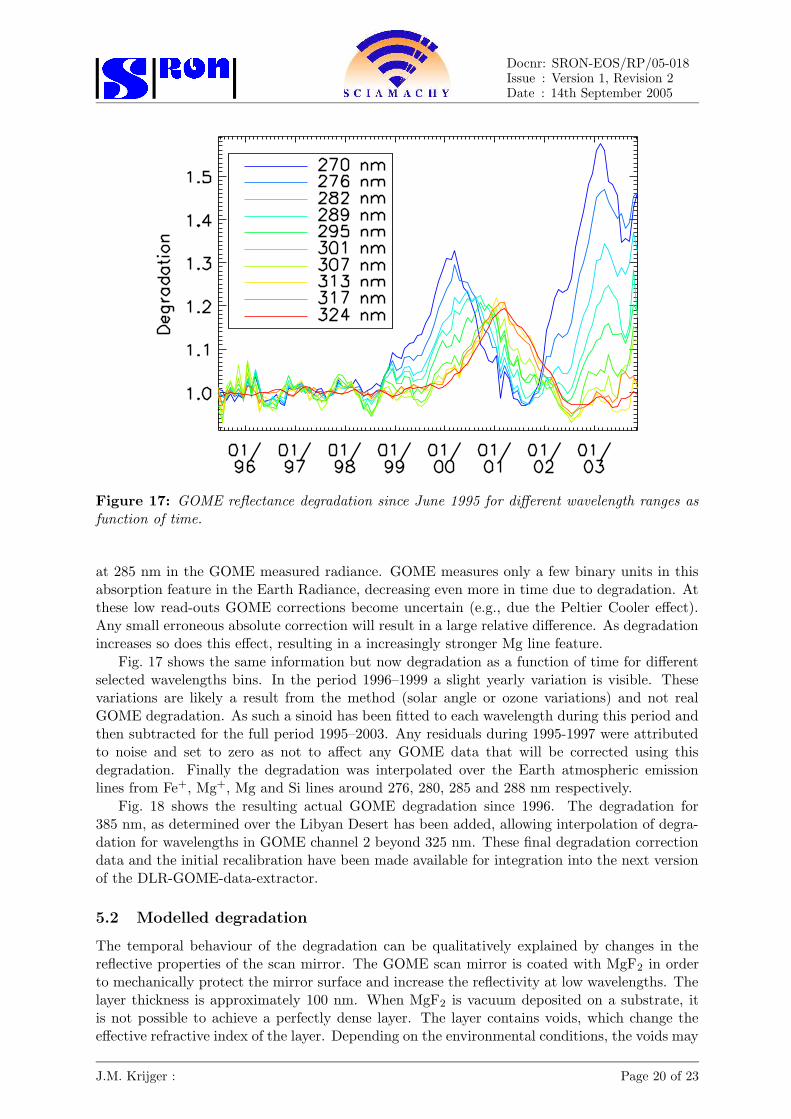
Figure 17: GOME reflectance degradation since June 1995 for different wavelength ranges asfunction of time.
at 285 nm in the GOME measured radiance. GOME measures only a few binary units in thisabsorption feature in the Earth Radiance, decreasing even more in time due to degradation. Atthese low read-outs GOME corrections become uncertain (e.g., due the Peltier Cooler effect).Any small erroneous absolute correction will result in a large relative difference. As degradationincreases so does this effect, resulting in a increasingly stronger Mg line feature.
Fig. 17 shows the same information but now degradation as a function of time for differentselected wavelengths bins. In the period 1996–1999 a slight yearly variation is visible. Thesevariations are likely a result from the method (solar angle or ozone variations) and not realGOME degradation. As such a sinoid has been fitted to each wavelength during this period andthen subtracted for the full period 1995–2003. Any residuals during 1995-1997 were attributedto noise and set to zero as not to affect any GOME data that will be corrected using thisdegradation. Finally the degradation was interpolated over the Earth atmospheric emissionlines from Fe+, Mg+, Mg and Si lines around 276, 280, 285 and 288 nm respectively.
Fig. 18 shows the resulting actual GOME degradation since 1996. The degradation for385 nm, as determined over the Libyan Desert has been added, allowing interpolation of degra-dation for wavelengths in GOME channel 2 beyond 325 nm. These final degradation correctiondata and the initial recalibration have been made available for integration into the next versionof the DLR-GOME-data-extractor.
5.2 Modelled degradation
The temporal behaviour of the degradation can be qualitatively explained by changes in thereflective properties of the scan mirror. The GOME scan mirror is coated with MgF2 in orderto mechanically protect the mirror surface and increase the reflectivity at low wavelengths. Thelayer thickness is approximately 100 nm. When MgF2 is vacuum deposited on a substrate, itis not possible to achieve a perfectly dense layer. The layer contains voids, which change theeffective refractive index of the layer. Depending on the environmental conditions, the voids may
J.M. Krijger : Page 20 of 23
� � �Docnr: SRON-EOS/RP/05-018Issue : Version 1, Revision 2Date : 14th September 2005
Figure 18: Similar for Fig. 17, but now with degradation for 385 nm added and removal ofyearly oscilations.
be filled with other substances, including absorbing materials. A model was constructed by (Snel2000) at SRON describing the mirror and coating optical properties. The degradation modelused for the scan mirror assumes a pure aluminium mirror, covered with a porous MgF2 layer.
Figure 19:
J.M. Krijger : Page 21 of 23
� � �Docnr: SRON-EOS/RP/05-018Issue : Version 1, Revision 2Date : 14th September 2005
The layer thickness and porosity are model parameters. Indices of refraction for aluminiumand MgF2 are taken from (Palik 1985). With the Fresnel equations (Azzam and Bashara 1987,e.g.,), the reflection coefficient can be calculated. The effective refractive index of the coating isa function of the porosity and the medium used to fill the pores with. Degradation is modelledby gradually filling the pores and then covering the mirror with a contaminant of choice.
Shown in Fig. 19 is the model degradation as a function of contaminant thickness for severalwavelengths. The MgF2 layer thickness was adjusted to 140 nm (somewhat more than the 100 nmthe mirror was supposedly coated with, but still reasonable). The density of the layer was set at80%. The contaminant used was molecular dirt. Note that the rate of contaminant depositioncan be varied over time. The case of (constant) linearly increasing contaminant thickness isshown. The similarity with Fig. 18 is striking. Both model and observations show temporalcyclic behaviour, with degradation increasing and decreasing over time. Also the behaviour fordifferent wavelengths (shorter wavelengths degrading before longer wavelengths) is found in bothmodel and observations.
Note that the modelled degradation ratio becomes smaller then 1, while this is never ob-served. Varying different model parameters does not change this. Therefore it is likely anotherdegradation factor beside mirror-contaminant is present.
J.M. Krijger : Page 22 of 23
� � �Docnr: SRON-EOS/RP/05-018Issue : Version 1, Revision 2Date : 14th September 2005
6 Summary
This work shows several important issues concerning the degradation of the GOME instrumentand the effect on the GOME reflectances.
– An initial offset was found, with measured reflectances in the UV below 300 nm overestimatedby around 10 %, already during the beginning of the mission when no degradation is expected.The exact cause could be either ozone climatology biases or GOME calibration problems. Webelieve the latter is the mostly prime cause.
– Significant degradation for the short UV wavelengths started in 1998, while in the beginningof 2000 degradation becomes also significant at wavelengths at least up to 335 nm.
– Degradation after January 2000 shows that the GOME degradation is viewing-angle depen-dent at wavelengths around 325-335 nm. Due to the co-adding of wavelengths shorter then283 nm in this study, this angle-dependence cannot be determined for shorter wavelengths.
– The effect of GOME degradation on the measured reflectances is apparently of a cyclic natureand can be qualitatively explained by a small dirt layer forming on the scan mirror.