19
China in 2030: The Future Demographic May 2010

China in 2030: The Future Demographic
May 2010
© Euromonitor International
2
Population and Homes
China in 2030: Summary
Summary
Population Past, Present and Future
Population Shift
Ageing
Men and Women in China
Births and Deaths
Diversity
Population by Ethnicity
Cities
Data

© Euromonitor International
3
Population and Homes
Summary
China in 2030
Population: 1,392 million
Median age: 42.0 years
Life expectancy: 77.1 years
0
5,000
10,000
15,000
20,000
25,000
30,000
0 10 20 30 40 50 60 70
„00
0
Population age shift: 2010-2030
2010 2030
Fastest-growing cities:
2010-2030
1. Tianjin
2. Shenyang
0% 20% 40% 60% 80% 100%
Non-Han population: 2030
Zhuang Manchu Tujia Hui Miao Uygur Yi
Mongolian Tibetan Dong Bouyei Yao Bai Other

© Euromonitor International
4
Population and Homes
• In 2030, the population of China will
reach 1.39 billion, an increase of 4.3%
from 2010. Growth will be mainly driven
by huge increases in the number of
those 60 and over. The population of this
age group will rise by more than 136
million in 2010-2030 – an increase of
68.9%. This group will account for
24.0% of total population by 2030.
• The heat chart shows two bands of red
and orange where the population bulges
will occur in 2030. The first refers to
those 40-43 years of age. This group will
number more than 101 million in 2030
and represent 7.3% of total population.
The second and larger group is made up
of those 56-67 years. In 2030, these
people will represent 18.8% of total
population and total nearly 262 million.
• Several groups will see a fall in their
numbers in 2010-2030. The number of
children 0-6 years will fall by 10.0 million
or 10.6% in 2010-2030. Meanwhile, the
population of teenagers and young
adults 14-24 years will drop by 37.9
million or 17.3%.
Population Past, Present and Future
China in 2030
Age Structure of the Population at a Glance: 1980-2030
(Each dot represents a single-year age group)
Source: Euromonitor International from national statistics/UN
Note: Reading the chart: This “heat chart” depicts changes in the age structure of the
population over time. Each dot represents the number of people in a specific (single
year) age group in a given year. Accordingly, a dark red dot shows the largest
concentration of people, by age, in a particular year while deep blue dots refer to the
lowest concentrations. The areas of red therefore represent a large potential market in
demographic terms.
„000

© Euromonitor International
5
Population and Homes
0
5,000
10,000
15,000
20,000
25,000
30,000
0 10 20 30 40 50 60 70
„00
0
Population by age: 2010 and 2030
2010 2030 94 million more 56-68
year olds in 2030
0
20
40
60
80
100
120
140
160
1980s1990s2000s2010s2020s
0
200,000
400,000
600,000
800,000
1,000,000
1,200,000
1,400,000
1,600,000
Po
pu
lation
Den
sity -
Pe
rson
s p
er
sq
kilo
me
tre
To
tal P
op
ula
tion
-„0
00
Total Population and Population Density: 1980s-2020s
Total population Population density
• China‟s population is rising decade by decade but at a decelerating rate and is expected to peak in 2027. The total
number will be growing at an average rate of 0.34% per year in 2010-2020 and just 0.07% in 2020-2030.
• Beijing‟s “one-child” policy is the centrepiece of the government‟s efforts at population control. The programme,
which has been in force for two decades, applies to less than half the total population but Chinese officials claim that
it has averted 400 million births. The policy restricts 35.9% of the population, mostly in large and medium-sized cities,
to one child. However, urban couples who are both only children can have two children. In rural areas consisting of
19 provinces, couples are allowed to have a second child if their first is a girl. This applies to 52.9% of the population.
In addition, more than 11% of the population, mostly minority groups, is free to have two or more children.
• Another factor slowing the rate of population growth is a steady decline in the number of childbearing women. In
2010-2030, the number of this group will shrink by 53.6 million or 15.0%.
Population Shift
China in 2030
Source: Euromonitor International from national statistics/UN

© Euromonitor International
6
Population and Homes
100
150
200
250
300
350
1980 1990 2000 2010 2020 2030
19
80
= 1
00
Growth indices: 1980-2030
Total
Population aged 65+
Population aged 80+
• China‟s population is steadily ageing. By 2030, the median age will reach 42.0 years – 3.2 years greater than in 2010
and 19.5 years more than in 1980.
• A very large jump in the population of those 70+ is expected in 2010-2030. The number in this age range will rise by
57.5 million or 68.6%. Much of this increase will occur among those 80 and over. The number of very elderly will
increase by 112% (nearly 24 million) in 2010-2030. According to the UN, China currently has the world‟s largest
number of very elderly and by 2050 it will have more people over the age of 60 than any other country.
• Beijing‟s aggressive efforts at population control, combined with a natural fall in birth rates, contribute to the
accelerated ageing process. However, steady improvements in healthcare are also a factor. In 2007, the WHO
ranked China‟s healthcare system as one of the world‟s worst – even lower than Haiti‟s. Faced with mounting
dissatisfaction, Chinese leaders have agreed to spend more than US$124 billion to subsidise coverage and improve
hospitals.
Ageing
China in 2030
0
50,000
100,000
150,000
200,000
250,000
300,000
350,000
400,000
1980 1990 2000 2010 2020 2030
„00
0
Population aged 0-14 and 65+:1980-2030
Population aged 65+ Population aged 0-14
Population 65+ overtakes
0-14 in 2029
Source: Euromonitor International from national statistics/UN
© Euromonitor International
7
Population and Homes
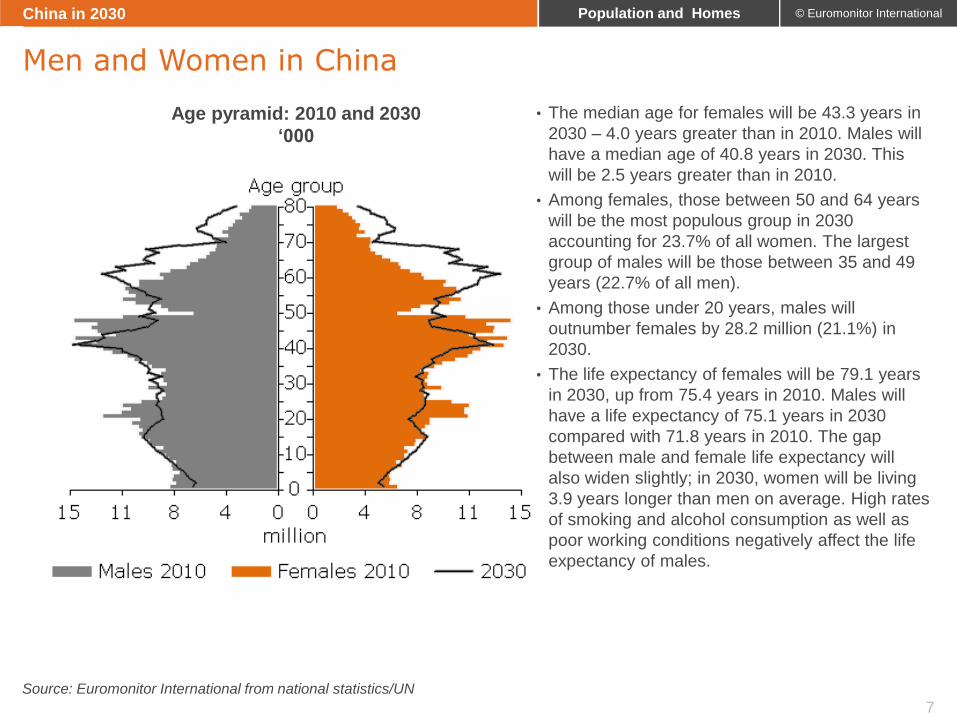
• The median age for females will be 43.3 years in
2030 – 4.0 years greater than in 2010. Males will
have a median age of 40.8 years in 2030. This
will be 2.5 years greater than in 2010.
• Among females, those between 50 and 64 years
will be the most populous group in 2030
accounting for 23.7% of all women. The largest
group of males will be those between 35 and 49
years (22.7% of all men).
• Among those under 20 years, males will
outnumber females by 28.2 million (21.1%) in
2030.
• The life expectancy of females will be 79.1 years
in 2030, up from 75.4 years in 2010. Males will
have a life expectancy of 75.1 years in 2030
compared with 71.8 years in 2010. The gap
between male and female life expectancy will
also widen slightly; in 2030, women will be living
3.9 years longer than men on average. High rates
of smoking and alcohol consumption as well as
poor working conditions negatively affect the life
expectancy of males.
Men and Women in China
China in 2030
Age pyramid: 2010 and 2030
‘000
Source: Euromonitor International from national statistics/UN
© Euromonitor International
8
Population and Homes
28.9 29.6 29.8 30.0
28.8
20.0
22.0
24.0
26.0
28.0
30.0
32.0
1980s 1990s 2000s 2010s 2020s
Ye
ars
Mean age at childbirth: 1980s-2020s
21.2
17.6
12.6 11.49.6
0
5
10
15
20
25
1980s 1990s 2000s 2010s 2020s
Pe
r „0
00
inh
ab
ita
nts
Birth rates: 1980s-2020s
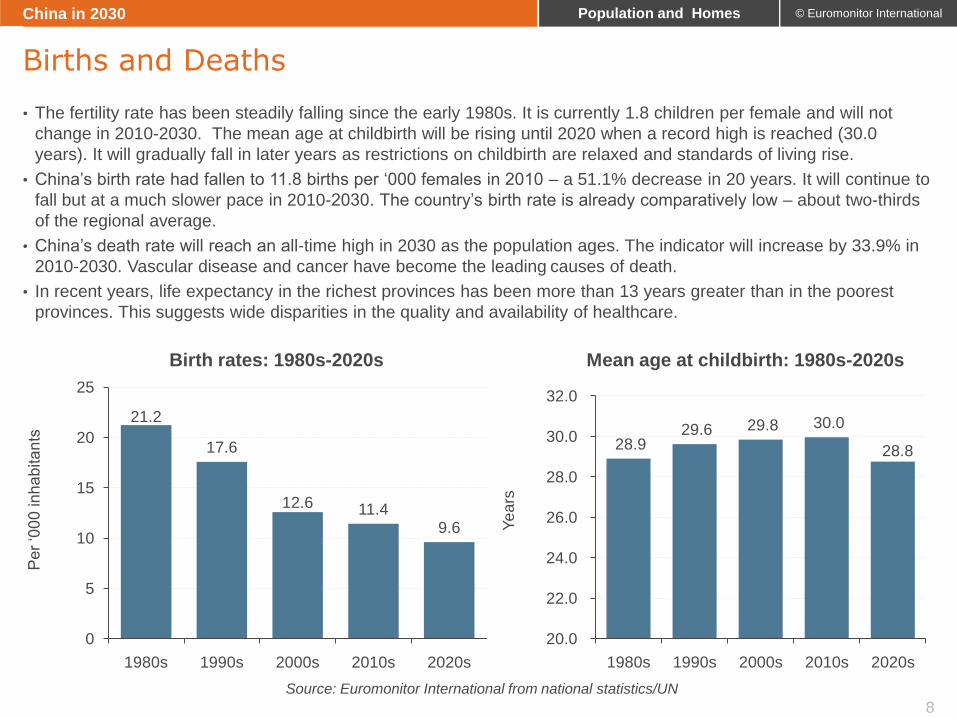
• The fertility rate has been steadily falling since the early 1980s. It is currently 1.8 children per female and will not
change in 2010-2030. The mean age at childbirth will be rising until 2020 when a record high is reached (30.0
years). It will gradually fall in later years as restrictions on childbirth are relaxed and standards of living rise.
• China‟s birth rate had fallen to 11.8 births per „000 females in 2010 – a 51.1% decrease in 20 years. It will continue to
fall but at a much slower pace in 2010-2030. The country‟s birth rate is already comparatively low – about two-thirds
of the regional average.
• China‟s death rate will reach an all-time high in 2030 as the population ages. The indicator will increase by 33.9% in
2010-2030. Vascular disease and cancer have become the leading causes of death.
• In recent years, life expectancy in the richest provinces has been more than 13 years greater than in the poorest
provinces. This suggests wide disparities in the quality and availability of healthcare.
Births and Deaths
China in 2030
Source: Euromonitor International from national statistics/UN
© Euromonitor International
9
Population and Homes
0
200,000
400,000
600,000
800,000
1,000,000
1,200,000
1,400,000
1,600,000
1980 1990 2000 2010 2020 2030
„00
0
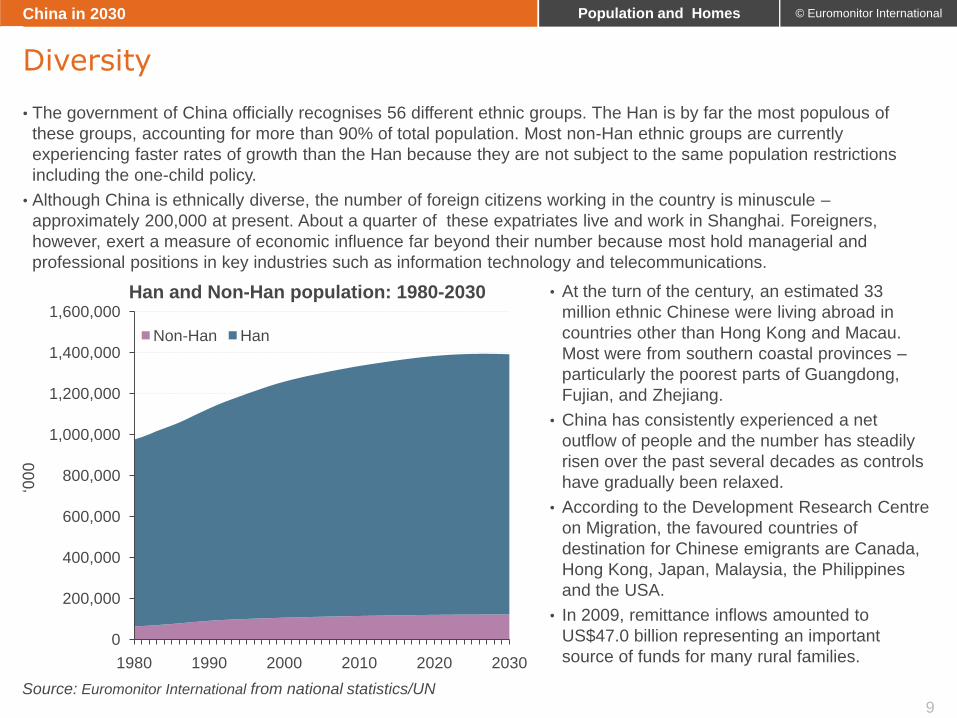
Han and Non-Han population: 1980-2030
Non-Han Han
• At the turn of the century, an estimated 33
million ethnic Chinese were living abroad in
countries other than Hong Kong and Macau.
Most were from southern coastal provinces –
particularly the poorest parts of Guangdong,
Fujian, and Zhejiang.
• China has consistently experienced a net
outflow of people and the number has steadily
risen over the past several decades as controls
have gradually been relaxed.
• According to the Development Research Centre
on Migration, the favoured countries of
destination for Chinese emigrants are Canada,
Hong Kong, Japan, Malaysia, the Philippines
and the USA.
• In 2009, remittance inflows amounted to
US$47.0 billion representing an important
source of funds for many rural families.
• The government of China officially recognises 56 different ethnic groups. The Han is by far the most populous of
these groups, accounting for more than 90% of total population. Most non-Han ethnic groups are currently
experiencing faster rates of growth than the Han because they are not subject to the same population restrictions
including the one-child policy.
• Although China is ethnically diverse, the number of foreign citizens working in the country is minuscule –
approximately 200,000 at present. About a quarter of these expatriates live and work in Shanghai. Foreigners,
however, exert a measure of economic influence far beyond their number because most hold managerial and
professional positions in key industries such as information technology and telecommunications.
Diversity
China in 2030
Source: Euromonitor International from national statistics/UN

© Euromonitor International
10
Population and Homes
0%
10%
20%
30%
40%
50%
60%
70%
80%
90%
100%
2010 2030
% o
f to
tal p
op
ula
tion
Non-Han population by ethnicity: 2010/2030Other
Bai
Yao
Bouyei
Dong
Tibetan
Mongolian
Yi
Uygur
Miao
Hui
Tujia
Manchu
Zhuang
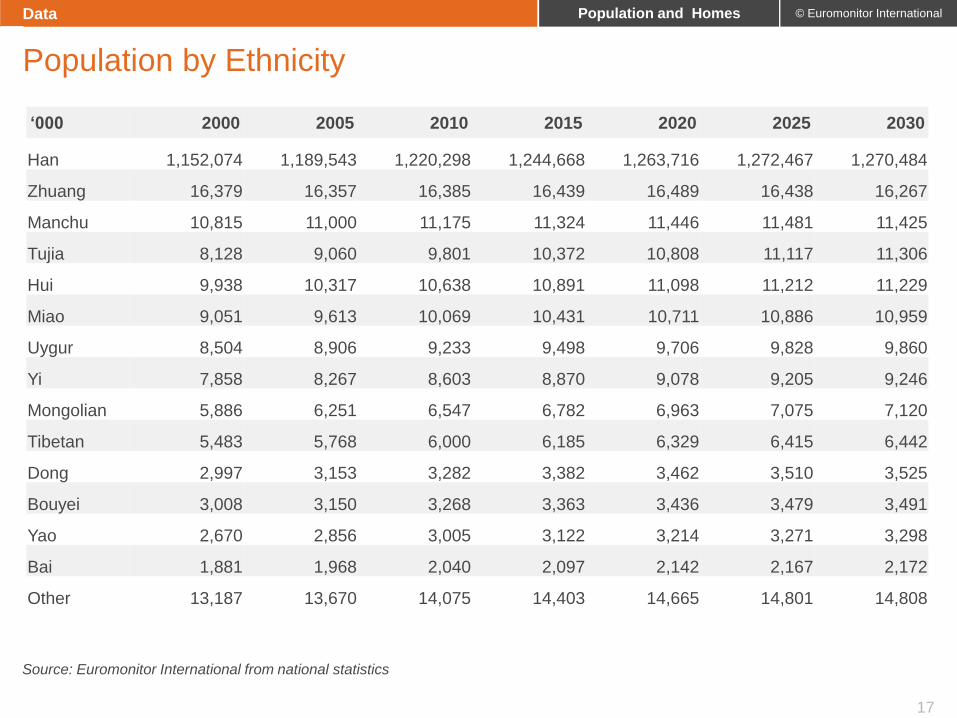
• The largest ethnic minorities include the Zhuang, Manchu, Tujia, Hui and Miao, each of which will number more than
10 million by 2030. Together, however, these 5 ethnic groups will account for just 4.4% of the total population (or 61.2
million) in 2030.
• The Zhuang are found mostly in southern China in the Guangxi Zhuang Autonomous Region. Smaller numbers live in
Yunnan, Guangdong and Hunan provinces. The Manchu are scattered throughout China, with a large number found
in Liaoning Province. The Tujia live mainly in the Wuling Mountains on the border between the Hunan, Hubei and
Guizhou provinces.The Hui are concentrated in northwestern China while the Miao are found mostly in southern
China.
Population by Ethnicity
China in 2030
Source: Euromonitor International from national statistics/UN
• Rates of growth among most ethnic minorities
are generally higher than that of the Han
because they have not been subject to forms of
population control – particularly the one-child
policy.
• Standard Mandarin is the official national spoken
language, although various autonomous and
special administrative regions have additional
official languages.
• Mandarin is spoken by 69.2% of the population
and its share will change very little over time.
Other popular languages include Wu, Cantonese
and Min. Presently, 14.9% of the population
speaks one of these three languages and in
2030 approximately 14.4% will speak them.
• At least 6 different family languages can be
identified among the many languages spoken in
China. Many of these languages are mutually
unintelligible.

© Euromonitor International
11
Population and Homes
• The pace of China‟s urbanisation is impressive.
In 1980, just 19.4% of China‟s total population
lived in urban areas. Today, the share is 47.6%
and in 2030 it will rise to 63.9%. At that time, the
country will have nearly 890 million urban
residents.
• Most of China‟s larger cities are located on or
near the coast. This development reflects the
country‟s heavy reliance on export-driven growth
– in particular the many industries and export
processing zones that have been established
along the coast and adjacent to Hong Kong.
Belatedly, Chinese planners are trying to alter the
existing pattern of migration by creating more
new industrial centres in inland cities.
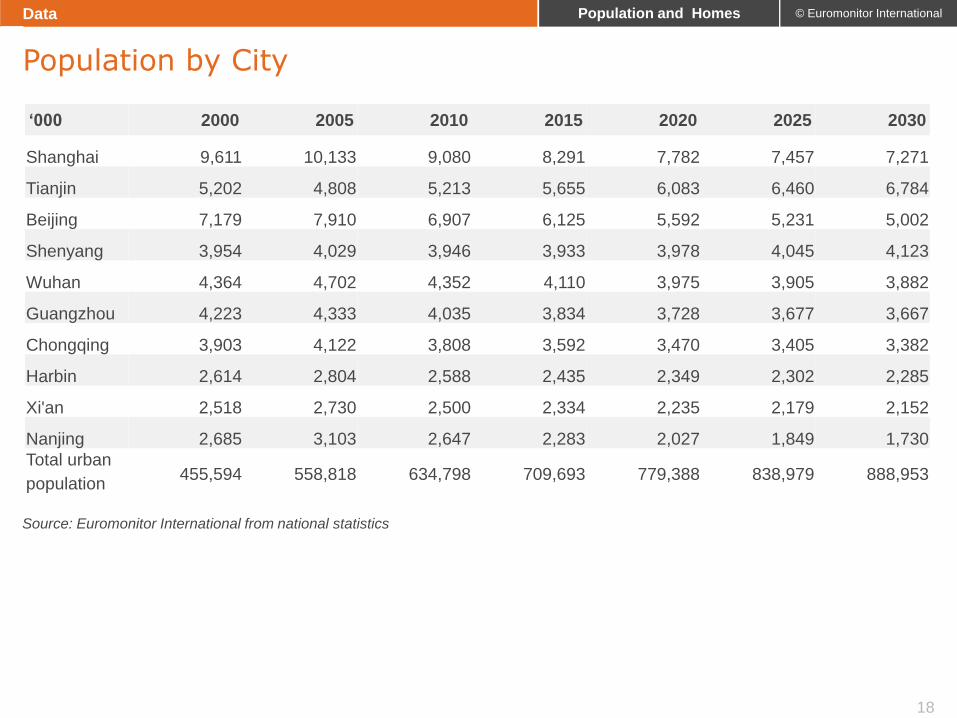
• Shanghai will still be China‟s largest city in 2030,
though its population has been falling since 2004.
In 2010, Shanghai has 1.4% of all urban
residents and by 2030 it will account for less than
1%. In fact eight of China‟s 10 largest cities will
see their numbers fall in 2010-2030. The
exceptions are Tianjin and Shenyang. It is the
rapid rise of “second-tier” cities that is changing
the urban landscape. These cities offer cheaper
costs for labour, land and energy. Their growth is
also driven by local and provincial officials who
are intent on attracting more investment and
export-oriented industries.
Cities
China in 2030
China’s 10 biggest cities: 2010/2020/2030
Source: Euromonitor International from national statistics

© Euromonitor International
12
Population and Homes
Data
Population by 5-Year Age Group
Male Population by 5-Year Age Group
Female Population by 5-Year Age Group
Vital Statistics
Population by Ethnicity
Population by City
© Euromonitor International
13
Population and Homes
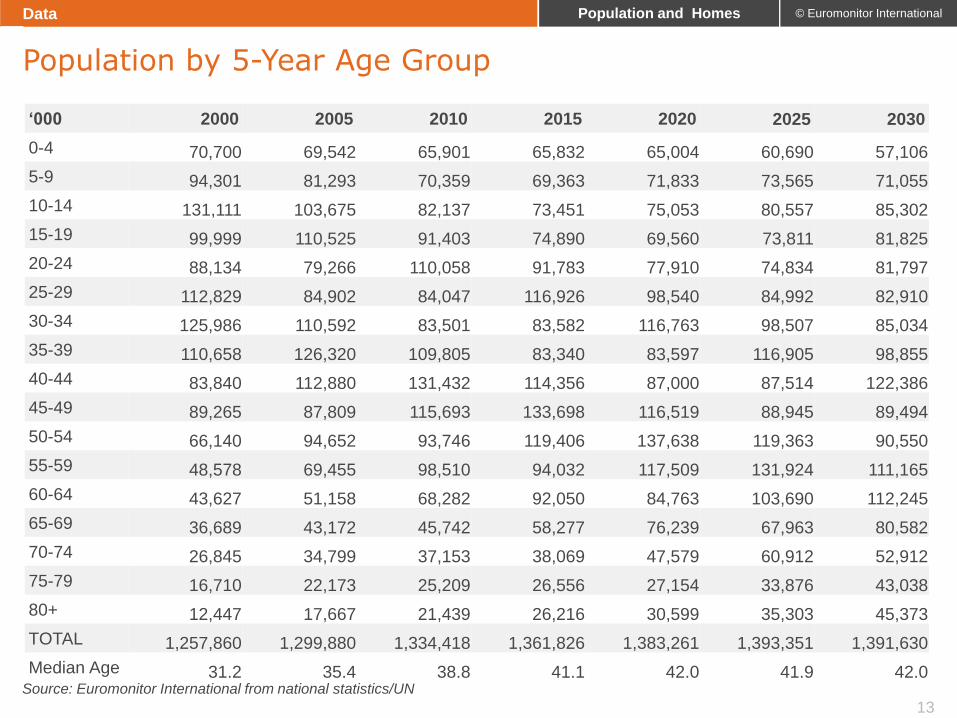
‘000 2000 2005 2010 2015 2020 2025 2030
0-4 70,700 69,542 65,901 65,832 65,004 60,690 57,106
5-9 94,301 81,293 70,359 69,363 71,833 73,565 71,055
10-14 131,111 103,675 82,137 73,451 75,053 80,557 85,302
15-19 99,999 110,525 91,403 74,890 69,560 73,811 81,825
20-24 88,134 79,266 110,058 91,783 77,910 74,834 81,797
25-29 112,829 84,902 84,047 116,926 98,540 84,992 82,910
30-34 125,986 110,592 83,501 83,582 116,763 98,507 85,034
35-39 110,658 126,320 109,805 83,340 83,597 116,905 98,855
40-44 83,840 112,880 131,432 114,356 87,000 87,514 122,386
45-49 89,265 87,809 115,693 133,698 116,519 88,945 89,494
50-54 66,140 94,652 93,746 119,406 137,638 119,363 90,550
55-59 48,578 69,455 98,510 94,032 117,509 131,924 111,165
60-64 43,627 51,158 68,282 92,050 84,763 103,690 112,245
65-69 36,689 43,172 45,742 58,277 76,239 67,963 80,582
70-74 26,845 34,799 37,153 38,069 47,579 60,912 52,912
75-79 16,710 22,173 25,209 26,556 27,154 33,876 43,038
80+ 12,447 17,667 21,439 26,216 30,599 35,303 45,373
TOTAL 1,257,860 1,299,880 1,334,418 1,361,826 1,383,261 1,393,351 1,391,630
Median Age 31.2 35.4 38.8 41.1 42.0 41.9 42.0
Population by 5-Year Age Group
Data
Source: Euromonitor International from national statistics/UN
© Euromonitor International
14
Population and Homes
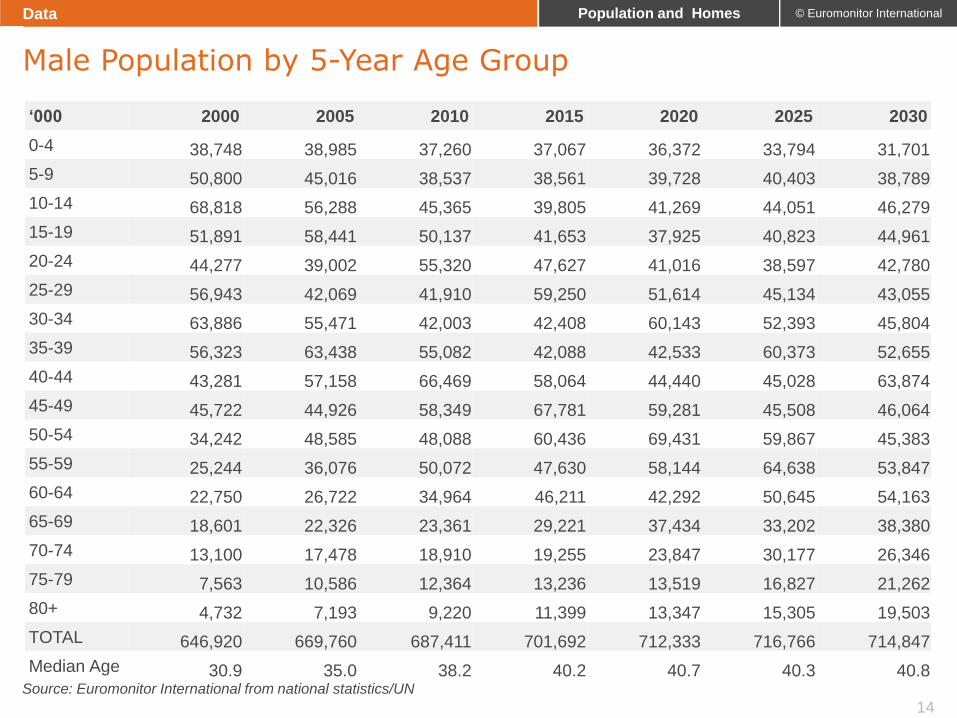
‘000 2000 2005 2010 2015 2020 2025 2030
0-4 38,748 38,985 37,260 37,067 36,372 33,794 31,701
5-9 50,800 45,016 38,537 38,561 39,728 40,403 38,789
10-14 68,818 56,288 45,365 39,805 41,269 44,051 46,279
15-19 51,891 58,441 50,137 41,653 37,925 40,823 44,961
20-24 44,277 39,002 55,320 47,627 41,016 38,597 42,780
25-29 56,943 42,069 41,910 59,250 51,614 45,134 43,055
30-34 63,886 55,471 42,003 42,408 60,143 52,393 45,804
35-39 56,323 63,438 55,082 42,088 42,533 60,373 52,655
40-44 43,281 57,158 66,469 58,064 44,440 45,028 63,874
45-49 45,722 44,926 58,349 67,781 59,281 45,508 46,064
50-54 34,242 48,585 48,088 60,436 69,431 59,867 45,383
55-59 25,244 36,076 50,072 47,630 58,144 64,638 53,847
60-64 22,750 26,722 34,964 46,211 42,292 50,645 54,163
65-69 18,601 22,326 23,361 29,221 37,434 33,202 38,380
70-74 13,100 17,478 18,910 19,255 23,847 30,177 26,346
75-79 7,563 10,586 12,364 13,236 13,519 16,827 21,262
80+ 4,732 7,193 9,220 11,399 13,347 15,305 19,503
TOTAL 646,920 669,760 687,411 701,692 712,333 716,766 714,847
Median Age 30.9 35.0 38.2 40.2 40.7 40.3 40.8
Male Population by 5-Year Age Group
Data
Source: Euromonitor International from national statistics/UN
© Euromonitor International
15
Population and Homes
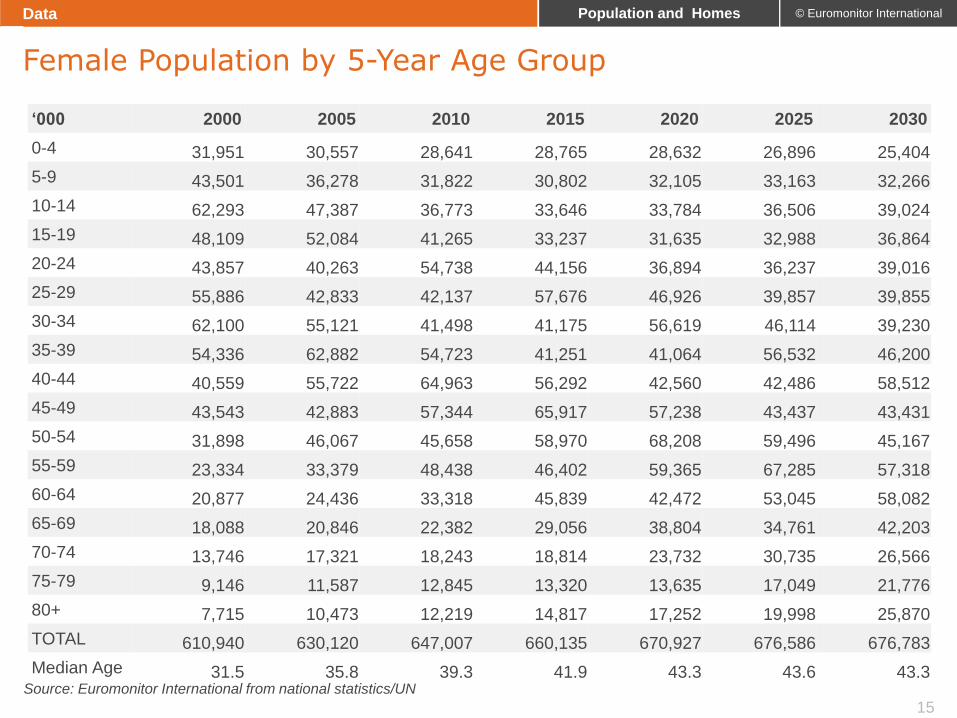
‘000 2000 2005 2010 2015 2020 2025 2030
0-4 31,951 30,557 28,641 28,765 28,632 26,896 25,404
5-9 43,501 36,278 31,822 30,802 32,105 33,163 32,266
10-14 62,293 47,387 36,773 33,646 33,784 36,506 39,024
15-19 48,109 52,084 41,265 33,237 31,635 32,988 36,864
20-24 43,857 40,263 54,738 44,156 36,894 36,237 39,016
25-29 55,886 42,833 42,137 57,676 46,926 39,857 39,855
30-34 62,100 55,121 41,498 41,175 56,619 46,114 39,230
35-39 54,336 62,882 54,723 41,251 41,064 56,532 46,200
40-44 40,559 55,722 64,963 56,292 42,560 42,486 58,512
45-49 43,543 42,883 57,344 65,917 57,238 43,437 43,431
50-54 31,898 46,067 45,658 58,970 68,208 59,496 45,167
55-59 23,334 33,379 48,438 46,402 59,365 67,285 57,318
60-64 20,877 24,436 33,318 45,839 42,472 53,045 58,082
65-69 18,088 20,846 22,382 29,056 38,804 34,761 42,203
70-74 13,746 17,321 18,243 18,814 23,732 30,735 26,566
75-79 9,146 11,587 12,845 13,320 13,635 17,049 21,776
80+ 7,715 10,473 12,219 14,817 17,252 19,998 25,870
TOTAL 610,940 630,120 647,007 660,135 670,927 676,586 676,783
Median Age 31.5 35.8 39.3 41.9 43.3 43.6 43.3
Female Population by 5-Year Age Group
Data
Source: Euromonitor International from national statistics/UN
© Euromonitor International
16
Population and Homes
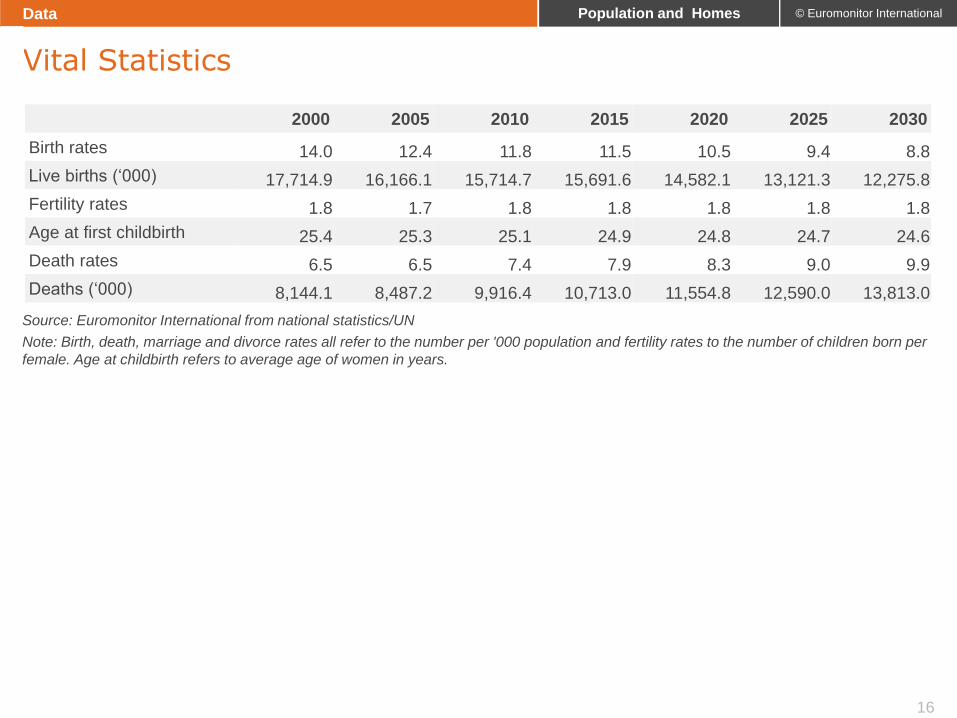
2000 2005 2010 2015 2020 2025 2030
Birth rates 14.0 12.4 11.8 11.5 10.5 9.4 8.8
Live births („000) 17,714.9 16,166.1 15,714.7 15,691.6 14,582.1 13,121.3 12,275.8
Fertility rates 1.8 1.7 1.8 1.8 1.8 1.8 1.8
Age at first childbirth 25.4 25.3 25.1 24.9 24.8 24.7 24.6
Death rates 6.5 6.5 7.4 7.9 8.3 9.0 9.9
Deaths („000) 8,144.1 8,487.2 9,916.4 10,713.0 11,554.8 12,590.0 13,813.0
Vital Statistics
Data
Source: Euromonitor International from national statistics/UN
Note: Birth, death, marriage and divorce rates all refer to the number per '000 population and fertility rates to the number of children born per
female. Age at childbirth refers to average age of women in years.
© Euromonitor International
17
Population and Homes
‘000 2000 2005 2010 2015 2020 2025 2030
Han 1,152,074 1,189,543 1,220,298 1,244,668 1,263,716 1,272,467 1,270,484
Zhuang 16,379 16,357 16,385 16,439 16,489 16,438 16,267
Manchu 10,815 11,000 11,175 11,324 11,446 11,481 11,425
Tujia 8,128 9,060 9,801 10,372 10,808 11,117 11,306
Hui 9,938 10,317 10,638 10,891 11,098 11,212 11,229
Miao 9,051 9,613 10,069 10,431 10,711 10,886 10,959
Uygur 8,504 8,906 9,233 9,498 9,706 9,828 9,860
Yi 7,858 8,267 8,603 8,870 9,078 9,205 9,246
Mongolian 5,886 6,251 6,547 6,782 6,963 7,075 7,120
Tibetan 5,483 5,768 6,000 6,185 6,329 6,415 6,442
Dong 2,997 3,153 3,282 3,382 3,462 3,510 3,525
Bouyei 3,008 3,150 3,268 3,363 3,436 3,479 3,491
Yao 2,670 2,856 3,005 3,122 3,214 3,271 3,298
Bai 1,881 1,968 2,040 2,097 2,142 2,167 2,172
Other 13,187 13,670 14,075 14,403 14,665 14,801 14,808
Population by Ethnicity
Data
Source: Euromonitor International from national statistics
© Euromonitor International
18
Population and Homes
Population by City
Data
‘000 2000 2005 2010 2015 2020 2025 2030
Shanghai 9,611 10,133 9,080 8,291 7,782 7,457 7,271
Tianjin 5,202 4,808 5,213 5,655 6,083 6,460 6,784
Beijing 7,179 7,910 6,907 6,125 5,592 5,231 5,002
Shenyang 3,954 4,029 3,946 3,933 3,978 4,045 4,123
Wuhan 4,364 4,702 4,352 4,110 3,975 3,905 3,882
Guangzhou 4,223 4,333 4,035 3,834 3,728 3,677 3,667
Chongqing 3,903 4,122 3,808 3,592 3,470 3,405 3,382
Harbin 2,614 2,804 2,588 2,435 2,349 2,302 2,285
Xi'an 2,518 2,730 2,500 2,334 2,235 2,179 2,152
Nanjing 2,685 3,103 2,647 2,283 2,027 1,849 1,730
Total urban
population 455,594 558,818 634,798 709,693 779,388 838,979 888,953
Source: Euromonitor International from national statistics

© Euromonitor International
19
Population and Homes
Global Briefings Global Company Profiles Country Market Insight Reports
Interactive Statistical Database Strategy Briefings Learn More
The state of the market globally and regionally, emerging trends and pressing industry issues: timely, relevant insight published every month.
The competitive positioning and strategic direction of the leading companies including uniquely sector-specific sales and share data.
The key drivers influencing the industry in each country; comprehensive coverage of supply-side and demand trends and how they shape the future outlook.
Market sizes, market shares, distribution channels and forecasts; the complete market analysed at levels of category detail beyond any other source.
Executive debate on the global trends changing the consumer markets of the future.
To find out more about Euromonitor International's complete range of business intelligence on industries, countries and consumers please visit www.euromonitor.com or contact your local Euromonitor International office:
London + 44 (0)20 7251 8024
Chicago +1 312 922 1115
Singapore +65 6429 0590
Shanghai +86 21 63726288
Vilnius +370 5 243 1577
Dubai +971 4 372 4363
Santiago +56 2 9157200
Experience more...
This research from Euromonitor International is part of a global strategic intelligence
system which offers a complete picture of the commercial environment . Also available
from Euromonitor International:


