GOVERNMENT OF ANDHRA PRADESH WATER RESOURES DEPARTMENT
CHINTHALAPUDI LIFT IRRIGATION SCHEME
FEASIBILITY REPORT
SUBMITTED TO
EXECUTIVE ENGINEER Indira Sagar Project, JANGAREDDYGUDEM West Godavari District. Andhra Pradesh.
MIEL-GAYATRI-ZVS-ITT CONSORTIUM
B-1, T.S.R. towers
Somajiguda
Hyderabad- 82
25
Feasibility Report
CHINTALAPUDI LIFT IRRIGATION SCHEME ON RIVER GODAVARI
NEAR TALLAPUDI (V) IN WEST GODAVARI DISTRICT.
SYNOPSIS
INTRODUCTION:
India is a developing country. The economic stagnation and vicious circle of Poverty
are slowly but steadily giving place to rapid economic activity and higher level of
income under the impact of economic planning. Agriculture forms are the backbone
of the Indian economy and occupy a place of pride. Andhra Pradesh with its
increasing population and finite land resources exerting pressure on agricultural
productivity. Hence, considerable importance is being given to provide additional
irrigation facilities to create more irrigation potential. .
The Chinthalapudi Lift Irrigation Scheme envisages pumping of 56 cumecs (1977.64
cusecs) of water from river Godavari in two stages to main canal and one lift is
proposed for storage at Jalleru reservoir on Right side of main canal to irrigate
upland areas. This project is located on Akhanda Godavari Right Bank at 21.00 Km
from Kovvur in West Godavari District of Andhra Pradesh. The scheme is a major
irrigation project conferring irrigation benefits to an extent of 80939 Ha (200000acres)
during Khariff season with an utilization of 402.850 M.Cum(15.50 TMC) in the 15
Upland Medals 1) Gopalapuram 2) Koyyakagudem 3) Buttaigudem 4) Jeelugumilli 5)
Chinthalapudi 6) T.Narsapuram 7) Lingapalem 8) Kamavarapukota 9) Pedavegi 10)
Jangareddygudem 11) DwarakaTirumala 12) Nallajerla of West Godavari and 13)
Vissannapeta 14) Chatrai and 15) Nuzvid of Krishna District Besides, the scheme
provides drinking water facilities to 6.65 lash population living in 160 villages enroute
canal and command area.
. The people in the proposed command area already are irrigating their lands tapping
waters from rain fed tanks or entirely depending upon rains. The failure of rains
results in frequent drought and distress conditions. There is no assured water supply
and the few bores drilled in the past few years are insufficient to meet the drinking
water facility and irrigation requirement. Due to lack of sufficient irrigation
development in the proposed ayacut, many Agricultural labour are suffering to get
their livelihood, forcing them to migrate to the urban areas for their survival and
25
hence this project will definitely help in improving the Socio-economic conditions of
people and all-round development of the area.
The scheme provides early benefits and avoids uncertain conditions and
backwardness of these areas.
SCOPE OF THE SCHEME:
The scope of the present scheme is broadly categorized into two components. The
first one consists of Head works i.e., construction of one pump house on A.G.R.B. to
accommodate 4 No’s of vertical turbine pumps, installation of pumps, delivery pipes,
pressure mains, construction of delivery cisterns and erection of electrical
substation. After a leading channel of a length of 12.300 km the Second stage Pump
House will be constructed to accommodate 4 No’s of vertical turbine pumps,
installation of pumps, delivery pipes, pressure mains, construction of delivery
cisterns and erection of electrical substation. The second one consists of excavation
of main canal, distributaries and field channels with CM&CD works including 1 No of
third stage pump house on main canal Right bank for formation of Jalleru Reservoir
to store 8.00 TMC of water.
LOCATION OF HEAD-WORKS :
The head works are proposed at Km 34.00 upstream of Sir Aurthur Cotton
Barrage at Dowlaiswaram, on Akhanda Godavari Left Bank near Tadipudi Village, of
Tallapudi Mandal of West Godavari District to draw 56 cumecs (1977.64 cusecs) of
water from river Godavari. The water from river Godavari is drawn through an
approach channel to the sump of pump house provided for the main canal.
The Co-Ordinates of the Proposed Head works site are as follows:
Latitude 170 8’ 59.7120 “N
Longitude 810 39’ 43.0380 “E
COMMUNICATION:
The Head works located near Tadipudi village of Tallapudi Mandal of West
Godavri District, A.P. The site can be approched by tavelling 28 Kms by Road on
Aakanda Godavari Right Bank from Rajhamundry city railway station East Godavari
Dist. The nearest town is Kovvuru which is well connected with neighbouring district
capitals and towns by roads and railway line.
25
CLIMATE:-
The climate is mostly hot and humid, with mostly a tropical climate and thereby, with
no distinct seasons. The mean maximum temperature is 36 °C. The hottest season is
from April to June, with temperature ranging from 34 °C to 48 °C -- with maximum of
51 °C recorded in May 2002 and May 2007. The coolest months are December and
January, when it is pleasant at 27 °C – 30 °C. There is a lot of rain due to the
monsoon and cyclonic storms in the Bay of Bengal.
TOPOGRAPHY:
The command area is gradually, sloping with vegetation and cultivable
patches of land. Sandy loamy, red soils with patches of Black cotton are the main
soils met within the command area. The command area is tolerably plain with
few mounds of high grounds. Topography of the area is gradually modulating with
an elevation difference of 20 to 30 M. Three major streams namely Jalleru,
Bineru and Yerra Kalva flow through the command area.
ECONOMIC CONDITION:
The ayacut proposed under this L.I.Scheme is a drought stricken area,
almost all the people are backward and below poverty Line. There is no other
skill on which the people of this region can depend upon for economic
development except irrigation, which is at very poor level. There are tanks in the
area fed by small catchments of their own. The vagaries of the rainfall and
frequent failure of monsoon make the tanks dry. Though every land under the
tanks is cultivated ayacut in these areas already brought under irrigation entirely
depends upon rains and therefore the crop production is not assured in most
cases. After construction of this scheme, the agriculture sector in the upland
areas of west godavari district will be developed remarkably and promotes the
Socio – Economic conditions. The green development in the vicinity will certainly
uplift the people living below poverty line by providing self employment, directly or
indirectly.
25
OCCUPATION:
The main occupation of the people is to work as agricultural labour and
satisfy with the wages they get during working season and starve during the rest
of the period. The agriculture Labour constitutes bulk of the population of all the
mandals. Small and marginal farmers and rural Artisans are in a limited number.
HYDROLOGY:
The River Godavari is the main source of the present proposed Lift
Irrigation Scheme. The River Godavari originates at Nasik in western Ghats. The
catchment area of the river is about 3, 12,882 Sq KM and runs 1,230 km before it
merges into the Bay of Bengal, at 80 km East of Rajahmundry town.
As per Bachawat Commission report 1979 the dependable annual flow in
river is 77.00 T.M. cum (2719.26TMC). The available 75% dependable yield of
Polavaram Project at its dam site as furnished in the project and approved by central
water commission is 969.67 TMC.
The total demand of Polavaram Project as furnished in the project report
is 15.08 TM.Cum (532.45 TMC) as against the available 75% dependable yield of
27.53 TM Cum. (972.2 TMC)
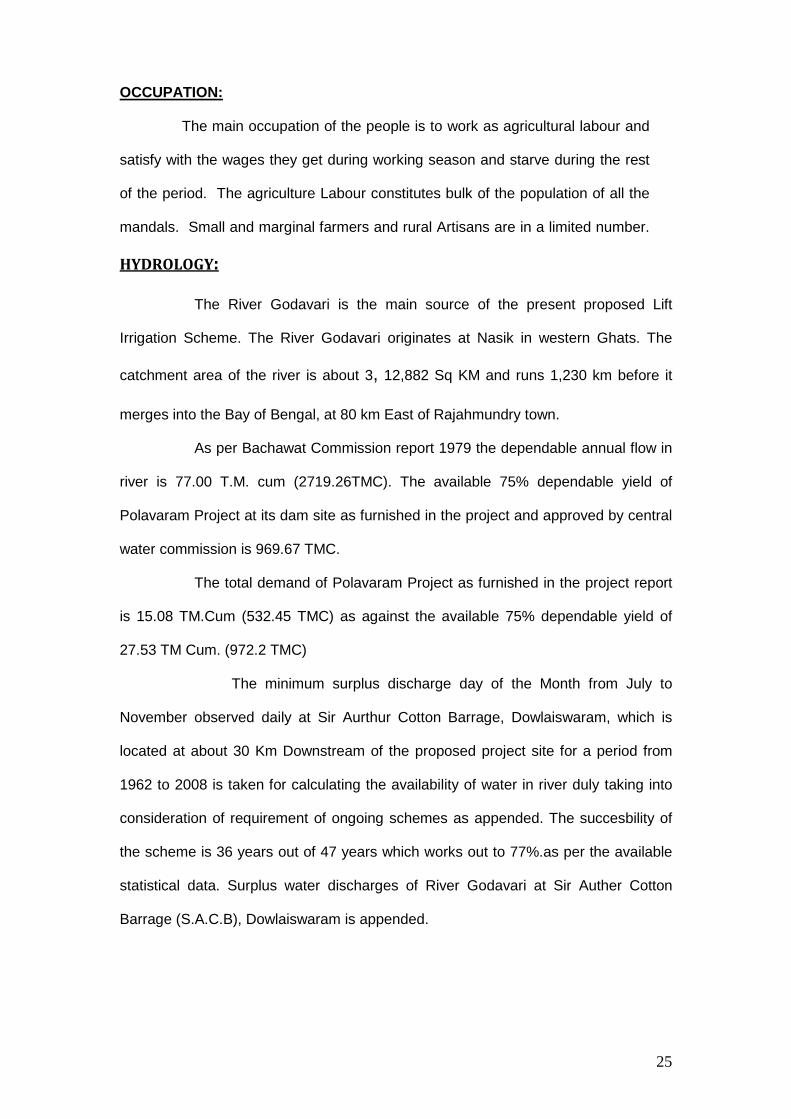
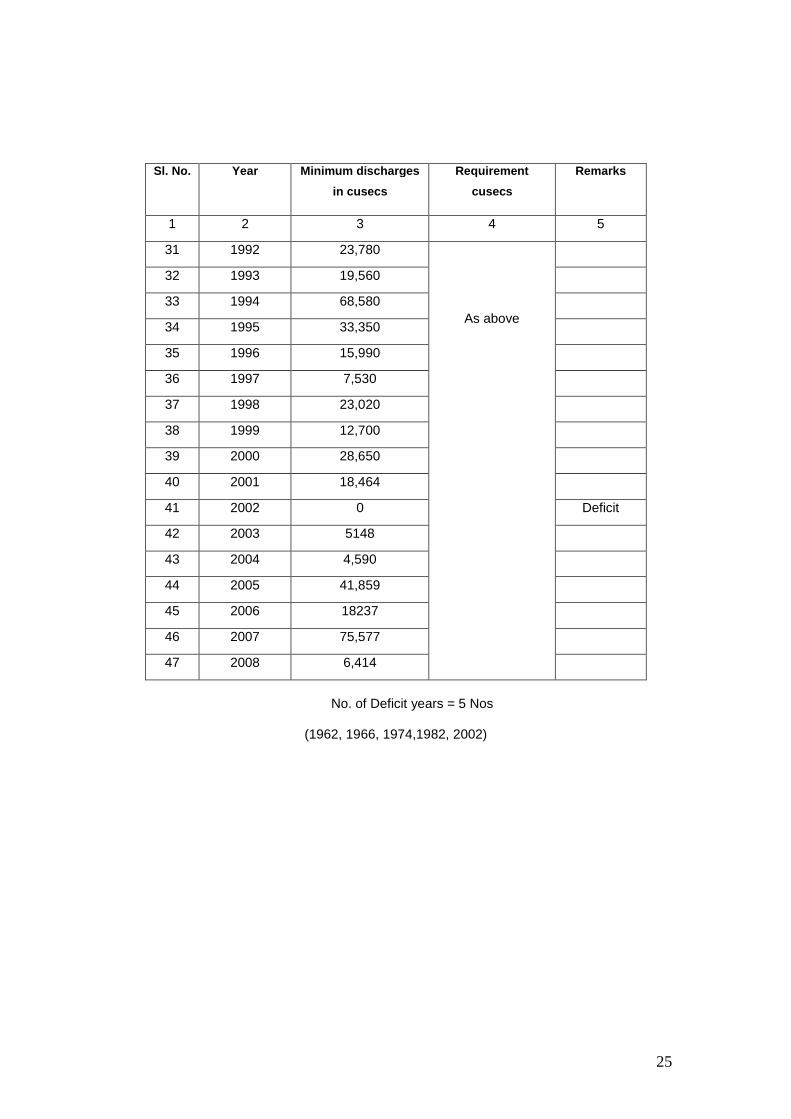
The minimum surplus discharge day of the Month from July to
November observed daily at Sir Aurthur Cotton Barrage, Dowlaiswaram, which is
located at about 30 Km Downstream of the proposed project site for a period from
1962 to 2008 is taken for calculating the availability of water in river duly taking into
consideration of requirement of ongoing schemes as appended. The succesbility of
the scheme is 36 years out of 47 years which works out to 77%.as per the available
statistical data. Surplus water discharges of River Godavari at Sir Auther Cotton
Barrage (S.A.C.B), Dowlaiswaram is appended.
25
EXISTING PRACTICE AND PROPOSED CROPPING PATTERN:
The ayacut under this scheme is under rain fed cultivation and bores.
The yield is very low due to uncertainty of rainfall. Paddy, ground nut, chillies, maize
are grown in these areas. Out of the total ayacut of a 80939 ha (200000) proposed
under this scheme, paddy is grown over an area of 20262 ac under rain fed tanks for
which 50% supplementation is proposed. The remaining ayacut is proposed as dry
crops that is chilies, ground nut and Maize.
The cropping pattern proposed under Chintalapudi lift irrigation scheme is
as follows.
1. Paddy ---- 8200 Ha (20262 Ac)
2. Groundnut ---- 32677 Ha (80745 Ac)
3. Chillies ---- 25994 Ha (64231 Ac)
4. Maize` --- 14068 Ha (34762 AC)
-------------------------------- Total: 80,939 Ha (200000 Ac) -------------------------------- The total demand of water including drinking water supply is about
0.54738 TM cum (15.50 TM cft)
GROSS IRRIGATION REQUIREMENT:
The gross irrigation requirement for the proposed cropping pattern of
80939 Ha (200000 Ac) of ayacut are arrived by modified “Penman method” and the
following are the influencing parameters.
1. Rainfall in the command area
2. Evapo – Transpiratation Operation values (E.T.O. Values)
3. Crop – Factors at different stages of crop (K.C. Values)
4. Base period
5. Deep percolation losses
6. Application efficiency (E.A.)
25
1. Rainfall in the command area:
Polavaram, Kovvuru, Jangareddygudem and Chintalapudi are the main
influencing rain gauge stations for the command area. The rainfall statistics are
available for a period of 33 years from 1974 to 2008. The monthly and monthly
average rainfall statistics are appended. The effective rainfall is computed from table
“Average monthly effective rain fall” as related to mean monthly and monthly
consumption use and 80% chance of rainfall is taken as dependable rainfall.
2. Evapo – Transpiration Operation values (ETO – values)
The Evapo Transpiration operation values calculated by the modified
Penman method as worked out for Polavaram project right main canal crop water
working tables in 1999 are adopted for the scheme and the same were reproduced
below.
Month E.T.O. values
July 4.986 per day
August 4.248 per day
September 4.317 per day
October 4.079 per day
November 3.951 per day
3. Crop factors at different stage of crops (KC values):
The crop factors for different crops at different stages are adopted as
furnished in F.A.O. – 33 (Food and Agriculture Organizations)
4. Base Period:
The period of crop from sowing to harvesting for the crops proposed in
the scheme are also adopted as specified in F.A.O. – 33 and they are shown below:
a) Paddy --- 138 days
b) Chillies --- 120 days
c) Groundnut --- 120 days
d) Maize --- 120 days
25
5. Deep percolation losses:
The deep percolation losses are normally accounted for the crops like
paddy where the plant requires standing water. For irrigated dry crops where moist
condition of soil are only to be maintained and deep percolation losses do not arise.
Further these deep percolation losses also depend upon the classification of soils
and seasonal variations. Thus deep percolation losses are accounted only for
paddy at the rate of 6.10 mm per day as adopted in Polavaram project as the soils in
the command area are red soils. No such losses are accounted for I.D. crops.
6. Application efficiency (EA)
The following percentages are adopted for the proposed crops towards
field application efficiency.
a) Paddy 85%
b) Chillies 65%
c) Groundnut 65%
d) Maize 65%
FORMATION OF JELLERU RESERVOIR:
The Scheme also envisages formation of a balancing reservoir to store
8.00 TMC of water by 3rd stage lift near Rowthugudem village West Godavari District.
(i) Sedimentation Rate in the Reservoir:
Sedimentation rate in the proposed site of Jelleru Reservoir was got
estimated by Deltaic Regional Centre National Institute of Hydrology, Kakinada, East
Godavari District. A.P. Sedimentation rate from the catchment of Jelleru Stream and
as well as from Godavari River lift water into Jelleru Reservoir were computed. The
total estimated sedimentation load into the proposed Jelleru Reservoir as furnished
by N.I.H is 0.0045725 TMC / Year. The detailed computation of sediment rate into
Jelleru Reservoir from Godavari Lift water as furnished by N.I.H in a table form is
appended.
25
(ii) Spill way:
It is proposed to construct an earth dam of length 4.50 km and ogee
crested spillway of Length 39m with 3 Nos of crest gates of size 11 m X 9 m. The
Crest Level of spill way is to be kept at +126.000m.
(iii) Reservoir Submergence:
The total area coming under reservoir submergence is 3284 Ha (Forest
and Non forest).
(iv) Forest Area:
The forest area likely to be submerged is 2235 Ha and forest area
required for formation of canal system is 469 Ha.
(v) Land and Habitation:
The total land (forest & Non forest) required for this scheme is
(approximately). The F.R.L of the Jalleru reservoir is fixed at +137.000. The total land
submerged is 3284 Ha and 4 Nos of villages to be rehabilitated completely.
INTER STATE ASPECTS:
There is no interstate aspects arise in this scheme as the Command
area under this Scheme lie entirely in Andhra Pradesh state only.
COST AND BENEFIT:
The cost of the Scheme is estimated to Rs. 170100.00 lakhs including
direct and indirect charges. The annual benefit of the scheme is Rs.14496.10 Lakhs.
Annual cost of the scheme works out to Rs. 9479.28 Lakhs with interest at 10% on
project cost, Rs.600 per Ha towards operation and maintenance cost of 80939 Ha
(2,00000 Ac), depreciation of head works at 1% of total cost of irrigation components
and maintenance of head works at 1.0 % cost of head works are taken into
consideration. The benefit cost ratio of the scheme is 1.53:1
25
CONCLUSION:
It is misfortune that when the second largest river in the Indian Union
flows almost hugging to the command area and when the sanction of, Project
involving formation of reservoir is being delayed for decades for one reason or other
there is no pronounced interest on major Lift Irrigation Schemes in these areas. This
is all together a different concept on projects from Northern states where lift irrigation
is almost on par with flow irrigation.
Recently one major irrigation scheme i.e., Chagalnadu Lift Irrigation scheme was
constructed in East Godavari Dist and running successfully to irrigate an ayacut of
14,164 ha (35,000 acrs). The entire ayacut of this scheme is also under the proposed
Polavaram Left Main canal. And also another major irrigation scheme i.e., Tadipudi
Lift irrigation scheme was constructed in West Godavari Dist to irrigate an ayacut of
83,599 Ha (2, 06,600 Acrs.).
The lift Irrigation scheme is proposed for the benefit of the small land holders living in
231 villages of upland and backward area of West Godavari district, and Krishna
district, this lift irrigation scheme is proposed. The proposed project helps in providing
assured water supply to the crops proposed. The agricultural productivity will improve
for up lift of the people who are below poverty line which will increase per capita
income and thereby social situations in this area will be improved.
The scheme also provides drinking water supply to a population of 6.80 lakhs people
and their cattle living in 160 villages those are now in search of water during summer
season to quench their thirst.
25
SALIENT FEATURES AT A GLANCE
1. Name of the Scheme : Chintalapudi Lift Irrigation 2. Location : On River Godavari at Km.25.50 of A.G.R.B Latitude 170 8’ 59.7120 “N
Longitude 810 39’ 43.0380 “E
3. Project Cost : Rs.1701.00 corers (1 works) 4. Ayacut : 80939 Ha (200000 Acres) 5. Demand : 15.50 TMC 6. Discharge : 56 Cumecs (1977.64 cusecs)
7. Static Head
Main Canal 1 st Stage : +28.00 M
2nd Stage : +80.00 M
8. Minimum draw down level : +12.00 M 9. Horse power and number of pumps (i). Head Works - First stage
a) Number of vertical turbine pumps : 4 No’s
b) HP of each pump : 6390 HP
c) Total HP : 25560 HP
Leading channel : 13.220 KM
(ii). Second stage
a) Number of vertical turbine pumps : 4 No’s
b) HP of each pump : 18252.50 HP
c) Total HP : 73010 HP
(iii). Third stage - Sub lift
a) Number of vertical turbine pumps : 2 No’s
b) HP of each pump : 3000 HP
c) Total HP : 6000 HP
25
10. Pressure Main Details : i. Pressure Main from Head Work pump- : 4 NOs of 3000 mm dia MS for a
House to leading channel cistern : Length of 2.85 km.
ii. Pressure Main from 2nd stage pump- : 4 NOs of 3000 mm dia MS for a
House to main canal cistern : Length of 3.25 km.
iii. Static from 3rd stage : 2 No’s of 3000 mm dia MS for a
Pump house to Reservoir : length of 1.400 km
11. Mandals Benefited : 15 Mandals. 12. Villages Benefited : 231 villages. 13. Power required : 28.00 MW+70.00 MW+12.60 MW = 110.60 MW 14. B.C. Ratio. : 1.53:1
15. Jalleru Reservoir
a) Gross storage : 10.574 TMC
b) Dead storage : 0.940 TMC
c) Live storage : 9.634 TMC
d) Full Reservoir Level : +137.000 m.
e) Crest Level : +126.000 m.
f) TBL : +140.000 m.
g) Sill level of OT sluice : +121.000 m.
25
STATEMENT SHOWING SURPLUS WATER DISCHARGES OF RI VER GODAVARI AT S.A.C.B.,DOWLAISWARAM FOR THE MONTH OF JULY
Sl. No. Year Minimum discharges
in cusecs
Requirement
cusecs
Remarks
1 2 3 4 5
1. 1962 394
Req
uire
men
t of w
ater
fo
r th
e pr
esen
t sch
eme
(+)
requ
irem
ent o
f wat
er fo
r P
ushk
ara
Lift
Irrig
atio
n S
chem
e, C
haga
lnad
u Li
ft
Irrig
atio
n sc
hem
e , T
adip
udi L
ift Ir
rigat
ion
sche
me
and
Vis
akha
patn
am In
dust
rial w
ater
sup
ply
sche
me
= 2
660
cuse
c
Deficit
2 9163 17,355
3. 1964 48,347
4. 1965 24,211
5 1966 599 Deficit
6 1967 95,538
7. 1968 25,538
8. 1969 3,00,200
9. 1970 87,000
10. 1971 53,600
11. 1972 13,230
12. 1973 15,200
13. 1974 400 Deficit
14. 1975 1,28,147
15. 1976 1,499
16. 1977 11,846
17. 1978 39,158
18. 1979 30,361
19. 1980 1,34,781
20. 1981 44,440
21. 1982 830 Deficit
22. 1983 51,270
23. 1984 1,485
24. 1985 15,286
25. 1986 7,536
26. 1987 4,306
27. 1988 69,180
28. 1989 93,290
29. 1990 1,22,400
30. 1991 16,540
25
No. of Deficit years = 5 Nos
(1962, 1966, 1974,1982, 2002)
Sl. No. Year Minimum discharges
in cusecs
Requirement
cusecs
Remarks
1 2 3 4 5
31 1992 23,780
As above
32 1993 19,560
33 1994 68,580
34 1995 33,350
35 1996 15,990
36 1997 7,530
37 1998 23,020
38 1999 12,700
39 2000 28,650
40 2001 18,464
41 2002 0 Deficit
42 2003 5148
43 2004 4,590
44 2005 41,859
45 2006 18237
46 2007 75,577
47 2008 6,414
25
STATEMENT SHOWING SURPLUS WATER DISCHARGES OF RI VER GODAVARI AT S.A.C.B.,DOWLAISWARAM FOR THE MONTH OF AUGUST
Sl. No. Year Minimum discharges
in cusecs
Requirement
cusecs
Remarks
1 2 3 4 5
1. 1962 1,35,742
Req
uire
men
t of w
ater
fo
r th
e pr
esen
t sch
eme
(+)
requ
irem
ent o
f wat
er fo
r P
ushk
ara
Lift
Irrig
atio
n S
chem
e, C
haga
lnad
u Li
ft
Irrig
atio
n sc
hem
e , T
adip
udi L
ift Ir
rigat
ion
sche
me
and
Vis
akha
patn
am In
dust
rial w
ater
sup
ply
sche
me
= 2
660
cuse
c
2 9163 3,17,820
3. 1964 1,73,610
4. 1965 39,871
5 1966 1,60,150
6 1967 2,194
7. 1968 85,000
8. 1969 1,68,700
9. 1970 1,95,800
10. 1971 1,34,200
11. 1972 1,310 Deficit
12. 1973 63,405
13. 1974 82,873
14. 1975 1,95,410
15. 1976 1,13,600
16. 1977 1,74,730
17. 1978 2,30,405
18. 1979 50,086
19. 1980 3,25,520
20. 1981 1,17,282
21. 1982 61,846
22. 1983 2,31,260
23. 1984 1,30,490
24. 1985 1,91,276
25. 1986 1,00,798
26. 1987 72,550
27. 1988 1,84,360
28. 1989 1,05,010
29. 1990 1,54,200
30. 1991 2,44,340
25
No. of Deficit years (1972) = 1 No
Sl. No. Year Minimum discharges
in cusecs
Requirement
cusecs
Remarks
1 2 3 4 5
31 1992 1,81,800
As above
32 1993 75,810
33 1994 2,34,830
34 1995 1,22,690
35 1996 1,77,550
36 1997 68,670
37 1998 1,96,240
38 1999 1,42,580
39 2000 92,290
40 2001 1,73,218
41 2002 15,655
42 2003 2,24,284
43 2004 1,07,216
44 2005 1,23,479
45 2006 2,07,465
46 2007 79,251
47 2008 1,00,556
25
STATEMENT SHOWING SURPLUS WATER DISCHARGES OF RI VER GODAVARI AT S.A.C.B.,DOWLAISWARAM FOR THE MONTH OF SEPTEMBER
Sl. No. Year Minimum discharges
in cusecs
Requirement
cusecs
Remarks
1 2 3 4 5
1. 1962 2,50,449
Req
uire
men
t of w
ater
fo
r th
e pr
esen
t sch
eme
(+)
requ
irem
ent o
f wat
er fo
r P
ushk
ara
Lift
Irrig
atio
n S
chem
e, C
haga
lnad
u Li
ft
Irrig
atio
n sc
hem
e , T
adip
udi L
ift Ir
rigat
ion
sche
me
and
Vis
akha
patn
am In
dust
rial w
ater
sup
ply
sche
me
= 2
660
cuse
c
2 9163 1,72.656
3. 1964 2,00,340
4. 1965 66,718
5 1966 92,559
6 1967 Not available
7. 1968 46,000
8. 1969 1,77,600
9. 1970 25,400
10. 1971 71,600
11. 1972 38,870
12. 1973 Not available
13. 1974 32,105
14. 1975 2,71,140
15. 1976 1,150 Deficit
16. 1977 73,910
17. 1978 1,02,050
18. 1979 22,726
19. 1980 3,63,870
20. 1981 1,37,061
21. 1982 80,927
22. 1983 2,74,930
23. 1984 30,319
24. 1985 1,19,417
25. 1986 11,862
26. 1987 53,520
27. 1988 2,55,970
28. 1989 1,44,780
29. 1990 1,27,200
30. 1991 82,270
25
No,of Deficit years (1976) = 1 No.
Sl. No. Year Minimum discharges
in cusecs
Requirement
cusecs
Remarks
1 2 3 4 5
31 1992 61,560
As above
32 1993 1,13,230
33 1994 1,13,150
34 1995 92,540
35 1996 1,13,930
36 1997 1,09,800
37 1998 1,87,600
38 1999 2,29,670
39 2000 83,108
40 2001 44,883
41 2002 16,409
42 2003 1,24,433
43 2004 53,167
44 2005 31,804
45 2006 2,07,731
46 2007 1,57,165
47 2008 91,769
25
STATEMENT SHOWING SURPLUS WATER DISCHARGES OF RI VER GODAVARI AT S.A.C.B.,DOWLAISWARAM FOR THE MONTH OF OCTOBER
Sl. No. Year Minimum discharges
in cusecs
Requirement
cusecs
Remarks
1 2 3 4 5
1. 1962 66,693
Req
uire
men
t of w
ater
fo
r th
e pr
esen
t sch
eme
(+)
requ
irem
ent o
f wat
er fo
r P
ushk
ara
Lift
Irrig
atio
n S
chem
e, C
haga
lnad
u Li
ft
Irrig
atio
n sc
hem
e , T
adip
udi L
ift Ir
rigat
ion
sche
me
and
Vis
akha
patn
am In
dust
rial w
ater
sup
ply
sche
me
= 2
660
cuse
c
2 9163 72,221
3. 1964 45,878
4. 1965 3,233
5 1966 9,773
6 1967 Not available
7. 1968 22,000
8. 1969 43,000
9. 1970 2,14,400
10. 1971 56,000
11. 1972 3,050
12. 1973 Not available
13. 1974 37,477
14. 1975 19,403
15. 1976 Not available
16. 1977 18,338
17. 1978 28,910
18. 1979 4,677
19. 1980 1,272
20. 1981 18,260
21. 1982 12,118
22. 1983 1,02,444
23. 1984 16,963
24. 1985 21,082
25. 1986 11,065
26. 1987 31,730
27. 1988 51,340
28. 1989 30,550
29. 1990 1,16,530
30. 1991 47,790
25
No. of Deficit Years: NIL
Sl. No. Year Minimum discharges in
cusecs
Requirement
cusecs
Remarks
1 2 3 4 5
31 1992 24,060
As above
32 1993 62,530
33 1994 58,750
34 1995 63,790
35 1996 33,930
36 1997 20,650
37 1998 84,340
38 1999 95,740
39 2000 13,341
40 2001 27,251
41 2002 4,784
42 2003 35,096
43 2004 7,012
44 2005 37,048
45 2006 13,439
46 2007 37,095
47 2008 6464
25
STATEMENT SHOWING SURPLUS WATER DISCHARGES OF RI VER GODAVARI AT S.A.C.B.,DOWLAISWARAM FOR THE MONTH OF NOVEMBER
Sl. No. Year Minimum discharges
in cusecs
Requirement
cusecs
Remarks
1 2 3 4 5
1. 1962 17,595
Req
uire
men
t of w
ater
fo
r th
e pr
esen
t sch
eme
(+)
requ
irem
ent o
f wat
er fo
r P
ushk
ara
Lift
Irrig
atio
n S
chem
e, C
haga
lnad
u
Lift
Irrig
atio
n sc
hem
e , T
adip
udi L
ift Ir
rigat
ion
sche
me
and
Vis
akha
patn
am In
dust
rial w
ater
sup
ply
sche
me
= 2
660
cuse
c
2 9163 13,486
3. 1964 16,910
4. 1965 2,222
5 1966 3,302
6 1967 Not avaialable
7. 1968 6,000
8. 1969 18,100
9. 1970 12,4-00
10. 1971 9,460
11. 1972 5,935
12. 1973 Not available
13. 1974 8,751
14. 1975 20,157
15. 1976 800 Deficit
16. 1977 11,330
17. 1978 12,157
18. 1979 4,150
19. 1980 7,450
20. 1981 2,115
21. 1982 5,485
22. 1983 7,405
23. 1984 700 Deficit
24. 1985 1,440 Deficit
25. 1986 5,850
26. 1987 31,670
27. 1988 23,670
28. 1989 19,830
29. 1990 24,130
25
No,of Deficit years = 5 Nos. (1976, 1984, 1985, 2000, 2002 )
Percentage of success of the scheme
No.of deficit Years 11 Nos (1962, 1966, 1967, 1972, 1974,1976,1982,1984,
1985, 2000, 2002)
Total No.of years 47 Nos
Percentage of successability = Total No.of years- No.of deficit years Total No.of years
= 47 – 11 = 76.59% or 77% 11
Sl. No. Year Minimum discharges
in cusecs
Requirement
cusecs
Remarks
1 2 3 4 5
30 1991 14,460
31 1992 3,700
As above
32 1993 14,480
33 1994 3,300
34 1995 14,740
35 1996 7,360
36 1997 17,790
37 1998 40,960
38 1999 21,670
39 2000 0 Deficit
40 2001 10005
41 2002 0 Deficit
42 2003 4,634
43 2004 4,163
44 2005 9,732
45 2006 9,356
46 2007 15,282
47 2008 4,636
25
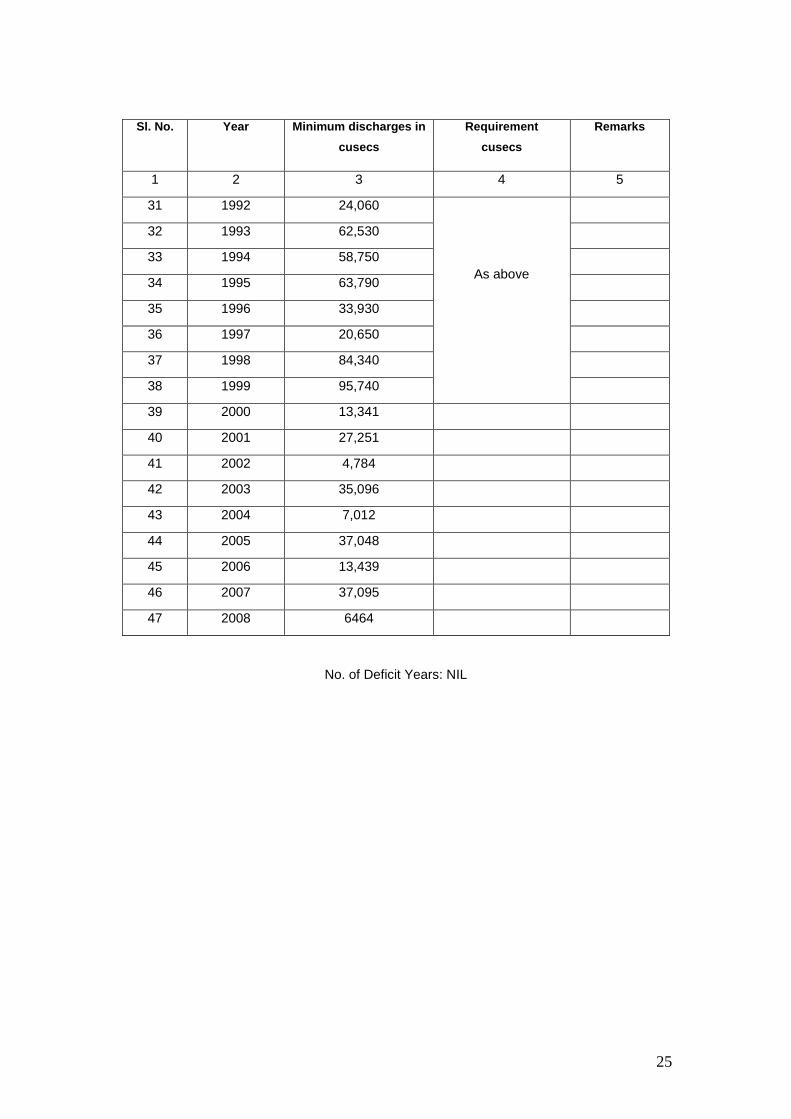
TABLE SHOWING DETAILED COMPUTATION OF SEDIMENT RATE INTO JALLERU RESERVIOIR FROM GODAVARI RIVER
Month Daily average sediment
concentration (g/l)
Monthly Sediment
load diverted along with discharge
(tones)
Volume of sediment
deposited in the reservoir during the
month (Cum) (assuming
the density of sediment
deposits in the reservoir as 1.4 tonnes
/ cum)
`Volume of sediment
deposited in the reservoir during 100
years (Million Cum)
Volume of sediment
deposited in the reservoir during 100
years (Thousand
Million Cu ft)
July 0.39200 29597.9443 21141.3888 2.1141 0.0746
August 0.48449 36581.3981 26129.5701 2.6129 0.0922
Sept 0.29527 22294.3495 15924.5354 1.5924 0.0561
Total 88473.6919 63195.4943 6.3195 0.2230 The estimated total sediment rate into the Jalleru Reservoir from its catchment area and lift water from Godavari river water is for next 75 and 100 years is around 0.34293 TMC and 0.45725 TMC respectively. If appropriate soil conservation measures like gully plugs, check dams and afforestation of degraded forest lands were adopted in the Jalleru reservoir catchment area, the rate of sediment would be further reduced.
STATEMENT SHOWING MONTHLY AVERAGE RAINFALL DATA IN MM FOR 34 YEARS OF STATIONS 1.POLAVARAM 2.KOVVUR
3.JANGAREDDYGUDEM 4.CHINTALAPUDI IN THE CAMMAND AREA OF CHINTALAPUDI LIFT IRRIGATION SCHEME.
Sl.No Year Jan Feb March April May June July August Sept Oct Nov Dec Total Remarks
1 1974 0 0 0.9 11.75 25.6 77.35 146.9 117.475 169.375 215.35 15.725 0
2 1975 0 0 0 3.275 43.1 137.75 132.8 251.8 217.175 164.575 12.95 0
3 1976 0 1.75 5 17.825 56.375 69.2 233.525 244.4 88.45 21.1 251.95 0
4 1977 0 0 6.425 43.325 38.35 95.4 172 151.3 52.75 79.95 167.5 0.75
5 1978 1.75 21.9 4.775 23.075 27.65 203.05 176.05 231.225 99.85 28.675 12 4.25
6 1979 0 61.775 0 20.4 80.55 56.25 90.325 63.35 234.95 60.1 96 2.55
7 1980 0 0 3 9.575 76.75 317.675 186 243.8 105.45 96.75 9.65 11.325
8 1981 0.4 0 19.1 10.65 28.525 104.675 306.25 229.85 220.375 46.95 2 6.5
9 1982 0 0 0 36.2 43.5 127.85 174.1 273.55 114 163.325 42.475 0
10 1983 2.55 10 0.95 1.9 248.8 120.5 219.35 486.4 398.325 359.4 2.95 18.45
11 1984 3 16.05 8 26.4 33.8 122.7 223.45 92.55 133.225 107.25 42.475 1.25
12 1985 37.55 6 0 41.6755 27.35 122.6 234.1 253.9 67.45 227.6 31.35 19.925
13 1986 17.2 12.95 0.75 1.55 37.65 80.7 112.925 473.05 112.65 105.7 20 0
14 1987 20.05 0 24.9 6.65 46.25 59.825 133.95 226.775 190.5 181.075 131.2 210.85
15 1988 0 9.1 3.45 100.05 92.25 27.2 533.55 220.85 685.475 108.95 0 0
16 1989 0 0 51.6 0 13.6 186.675 461.3 451.95 162.8 51.05 5.85 0
17 1990 16 78.05 101.9 6.3 513.4 93.05 138.15 243.8 164.3 173.875 22.25 4.25
18 1991 22.45 0 0 20.2 48.55 299.75 205.7 147.45 206.6 190.8 58.65 1.35
Total 120.95 217.58 230.75 379.25 1120.13 1921.80 3048.88 3309.15 2561.75 1715.10 621.33 44.90
Sl.No Year Jan Feb March April May June July August Sept Oct Nov Dec Total Remarks
Total 120.95 217.58 230.75 379.25 1120.13 1921.80 3048.88 3309.15 2561.75 1715.10 621.33 44.90
19 1992 11.25 0 0 0 52.55 96.95 177.3 181.95 135.725 95 28.45 0
20 1993 0 0 17.7 11.45 42.9 43.7 226 91.25 156.9 164.65 19.05 5.9
21 1994 6.4 13.65 0 39.825 35.5 68.5 266.8 190.575 98.5 299.2 4.15 0
22 1995 47.55 0 0 3.05 158.275 216.3 281.3 190.575 98.5 299.2 4.15 0
23 1996 0 0 2.8 3.3 34.15 278.875 370.15 229.45 173.1 151.55 85.75 1.8
24 1997 31.125 0 21.4 71.45 0 93.5 233.1 101.95 0 0 0 0
25 1998 0 0 0 0 0 0 0 0 0 0 0 0
26 1999 0 0 0 0 0 341.425 197.025 148.8 139.1 32.85 0
27 2000 0 0 0 0 0 0 0 0 0 0 0 0
28 2001 0 0 0 77.925 41.35 141.975 124.85 136.505 173.1 0 15.5 0
29 2002 0 0 0 2.85 25.725 72.2 48.25 272.025 69.975 223.9 0 0
30 2003 1.3 3.5 35.1 0 0 142.3 306.25 174.3 145.3 128.45 2.3 126.075
31 2004 0 14.525 0 12.9 22.95 150.35 192.1 291.4 116.9 97.85 6.35 0
32 2005 0 0 18.8 42.75 42.55 117.3 292 97.55 456.4 176.3 47.55 0.3
33 2006 0 0 22.85 55.1 70 122.15 109.75 349.05 223.45 126.05 26.25 0
34 2007 0 42.15 1.8 49.35 0 132.5 269.75 247.25 181.75 152 40.25 6.75
35 2008 12.75 9.25 17 27.75 78.75 143.75 305.85 371.95 141.65 46.9 45.55 0
Total 231.33 300.66 368.20 776.95 1724.83 3742.15 6593.76 6431.96 4881.80 3815.25 979.48 185.73 30032.08
Average 7.01 9.11 11.16 23.54 52.27 113.40 199.81 194.91 147.93 115.61 29.68 5.63 903.64
* For the year of 1998 and 2000 rain fall data not avilable