Submitted to: Roy F. Weston, Inc. Raritan Plaza I 4th Floor, Raritan Center Edison, NJ 08837-3616 Attention: Mr. Gary Buchanan (1 copy) Cife Systems, he SDMS Document 111440 TR-1170-6E BASELINE RISK ASSESSMENT- ECOLOGICAL RISK ASSESSMENT RI/FS Compliance Oversight for the Tri-Cities Barrel Superfund Site, Fenton, New York Prepared Under Program No. 1625 for Subcontract No. J-0755-G2 Under Prime Contract No. 68-W9-0022 for Weston Work Order No. 04200-017-091-0008-01 EPA Work Assignment No. 017-2P5V ICAIR Work Assignment No. 021625 Contact: Dr. Roy H. Reuter Telephone: (216)464-3291 January 6, 1997 301803
RI/FS Compliance Oversight for the Tri-Cities Barrel Superfund Site, Fenton, New York
Prepared Under
Program No. 1625
for
Subcontract No. J-0755-G2
Under
Prime Contract No. 68-W9-0022
for
Weston Work Order No. 04200-017-091-0008-01
EPA Work Assignment No. 017-2P5V
ICAIR Work Assignment No. 021625
Contact: Dr. Roy H. Reuter
Telephone: (216)464-3291
January 6, 1997
301803
ii
f I
TABLE OF CONTENTS
PAGE
LIST OF FIGURES ii
LIST OF TABLES iii
LIST OF ACRONYMS iv
1.0 INTRODUCTION 1-1
1.1 Site Background 1-1
1.2 Organization of This Rq)ort 1-4
2.0 PRELIMINARY PROBLEM FORMULATION 2-1
2.1 Site Description 2-1 2.2 Evaluation of Site Stressors 2-4
2.2.1 Chemical Stressors 2-4 2.2.2 Other Stressors 2-7
2.3 Selection of Contaminants of Potential Concem 2-7 2.4 Fate and Transport Mechanisms, Chemicals of Potential Concem . . . . . . . . 2-15
2.4.1 Contaminant Fate and Transport Processes 2-15 2.4.2 Importance of Fate and Transport Processes for Chemicals
of Potential Concem 2-17 2.4.3 Site-Specific Factors Affecting Contaminant Fate and Transport . . . 2-18 2.4.4 Summary 2-18
2.5 Potentially Exposed Habitats and Species 2-18
2.6 Exposure Pathway Analysis 2-24
3.0 PRELIMINARY EVALUATION OF ECOLOGICAL EFFECTS 3-1
3.1 Known Adverse Effects of Chemicals of Potential Concem 3-1 3.2 Phytotoxicity 3-7 3.3 Surface Water and Sediment Benchmarks 3-7 3.4 Bioaccumulation Potential 3-8
4.0 SCREENING-LEVEL RISK CALCULATIONS 4-1
4.1 Evaluation of Soil Toxicity to Terrestrial Plants 4-1 4.2 Evaluation of Invertebrate Toxicity . 4-3 4.3 Evaluation of Sediment Toxicity 4-3
i r08ai£804
TABLE OF CONTENTS - continued
PAGE
4.4 Evaluation of Surface Water Toxicity 4-10 4.5 Evaluation of Toxicity from Soil Ingestion 4-10 4.6 Evaluation of Transfer of Contaminants Through Food Chains 4-13 4.7 Uncertjunties 4-15 4.8 Selection of Endpoints 4-19
1-1 Site Location, Tri-Cities Barrel Site, Fenton, New York 1-2 1-2 Site Features, Tri-Cities Barrel Site, Fenton, New York 1-3 2-1 Approximate Wetland Boundaries, Tri-Cities Barrel Superfimd Site, Fenton,
New York 2-3 2-2 Remedial Investigation Sampling Locations 2-6 2-3 Vegetation Cover Types Tri-Cities Barrel Superfimd Site, Fenton, New York 2-19 2-4 Conceptual Site Model, Tri-Cities Barrel Site 2-26
'UMkkAli >. ¥mmmo5
4
11
1 I
u
f I
LIST OF TABLES
TABLE PAGE
2-1 Chemicals Never Detected at Tri-Cities Barrel 2-8 2-2 Chemicals of Potential Concem Quantitatively Evaluated 2-10 2-3 Chemicals of Potential Concem Qualitatively Evaluated 2-11 2-4 Chemical/Physical Properties of Contaminants of Potential Concem 2-12 2-5 Plant Communities Identified at the Tri-Cities Barrel Site 2-21 2-6 Wildlife Observations at the Tri-Cities Barrel Site 2-22 3-1 Oral NOAELs and LOAELs for Selected Mammalian Species 3-2 3-2 Summary of Avian Toxicity to Selected Chemicals of Concem 3-4 3-3 Summary of Toxicity Values for Terrestrial Invertebrates 3-5 3-4 Application of Uncertainty Factors and Tiieir Values Used to Derive
Ecological Toxicity Reference Values from Critical Toxicity Values 3-9 3-5 Summary of Phytotoxic Soil Concentrations 3-10 3-6 Benchmark Sediment Concentrations 3-11 3-7 State of New York Sediment Criteria 3-13 3-8 Ambient Water Quality Criteria 3-14 3-9 Bioconcentration Factors for Soil to Plant Uptake 3-15 3-10 Bioconcentration Potential by Soil Invertebrates for Selected Chemicals
of Potential Concem 3-17 3-11 Bioconcentration Factors for Chemicals of Potential Concem Detected
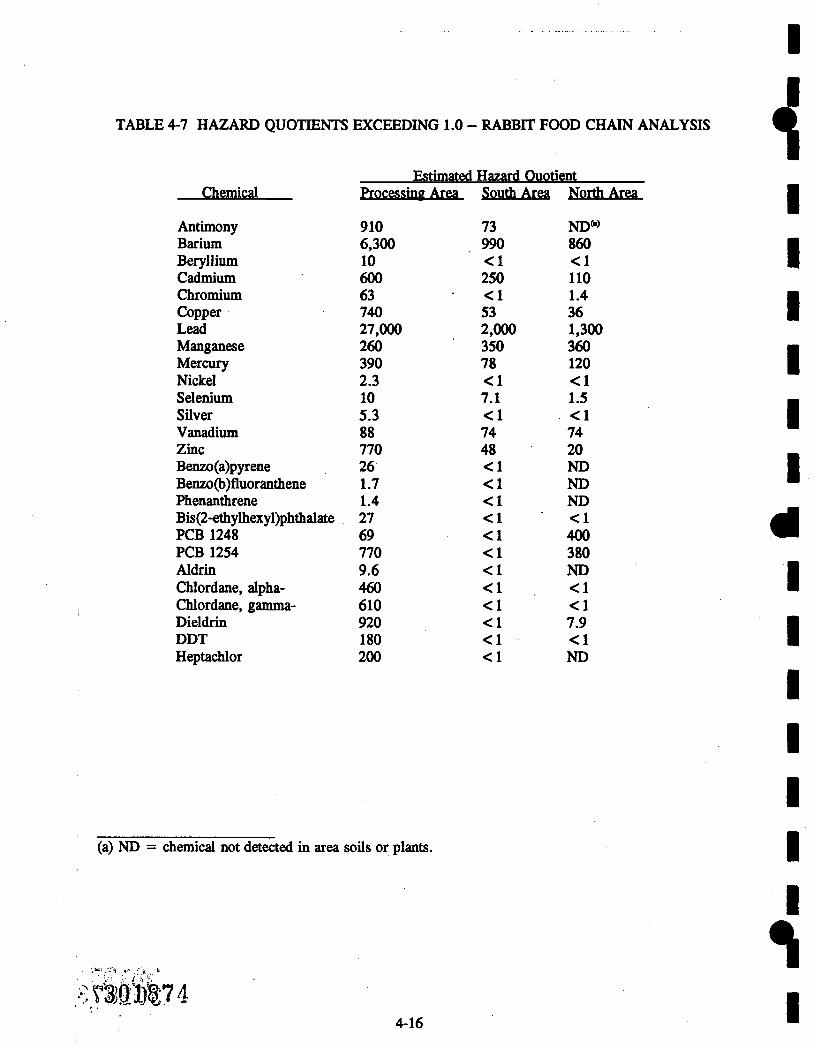
in Site Surface Waters . 3-19 3-12 Biomagnification Factors for Selected Chemicals of Potential Concem 3-20 4-1 Screening Analysis for Phytotoxicity 4-2 4-2 Screening Analysis for Invertebrate Toxicity 4-4 4-3 Exceedances of Sediment Benchmarks in the West Tributary 4-6 4-4 Exceedances of Sediment Benchmarks in the East Tributary 4-8 4-5 Exceedances of Sediment Benchmarks in North Pond Area 4-11 4-6 Soil Ingestion by Terrestrial Wildlife 4-12 4-7 Hazard Quotients Exceeding 1.0—Rabbit Food Chain Analysis 4-16 4-8 Hazard Quotients Exceeding 1.0-Robin Food Chain Analysis 4-18 5-1 Summary of Potential Concems-Inorganics 5-2 5-2 Summary of Potential Concems-Organics 5-3
Agency for Toxic Substances and Disease Registry Bioconcentration Factor Environmental Design & Research, PC Exposure Point Concentration Ecological Risk Assessment Effects Range-Low Effects Range-Median Hazard Quotient Interstate 88 Lethal Dose, 50% of the Test Population Lowest Effect Levd Lowest-Observed-Adverse-Effect Level No-Observed-Adverse-Effect Level No-Observed-Effect Concentration Polycyclic Aromatic Hydrocarbon Polychlorinated Biphenyl Risk Assessment Guidance for Superfimd Risk-Based Screening Concentration Remedial Investigation/Feasibility Study Severe Effect Level Sediment Quality Crit^ia Dioxin (2,3,7,8-Tetrachlorodibenzo-p-dioxin) Toxicity Reference Value Uncertainty Factor U.S. Environmental Protection Agency
4
30%|,|%07 •I
IV I
r I
1.0 INTRODUCTION
This ecological risk assessment (ERA) is an evaluation of potential adverse impacts on plants and animals other than humans and domesticated species from exposures to contaminants released as a result of waste handling and disposal activities at the Tri-Cities Barrel Site (Site) in Fenton, New York.
This evaluation, together with the human health evaluation, comprises ihc baseline risk assessment for the Site. By definition, a baseline risk assessment is limited to conditions under the no-action altemative, that is, in the absence of any remedial actions (including institutional controls) to control or mitigate releases.
The objective of an ERA is (1) to document whedier actual or potential ecological risks exist at a site, (2) to screen the contaminants present for those that might pose an ecological risk, thereby focusing fiirther efforts and (3) to generate information tiiat can be used in evaluating clean-up options.
The focus of this ERA is directed toward a preliminary problem formulation and ecological effects evaluation. These preliminary evaluations can then be used to determine either that there is littie or no ecological threat, or that the ERA should continue. If fiirther analysis or investigation is warranted by the conclusions of this preliminary assessment, assessment and measurement endpoints are selected in order to focus fiirtlier work. The screening-level analysis begins with an analysis of the environmental setting and the contaminants known to exist at the Site. Relevant fate and transport mechanisms are then evaluated along with the toxic mechanisms associated with each contaminant of potential ecological concem. For eadi of the likely con^lete exposure pathways, a screening-level ecotoxicity value or benchmark is developed for coii^)arison to maximum likely exposure levels. Conclusions drawn from these comparisons then form the basis for fiirther decisions regarding the need for cleanup in order to protect ecological resources.
The procedures used in this risk assessment are consistent witii U.S. Environmental Protection Agency (USEPA) guidance, including the Risk Assessment Guidance for Superfimd (RAGS), Volume n - Environmental Evaluation Manual (USEPA 1989a), Ecological Assessment of Hazardous Waste Sites: A Field and Laboratory Reference Manual (USEPA 1989b), die Framework for Ecological Risk Assessment (USEPA 1992a) and the Process for Designing and Conducting Ecological Risk Assessments (USEPA 1994). Additional USEPA guidance and other technical information are also used and are referenced where appropriate.
1.1 Site Background
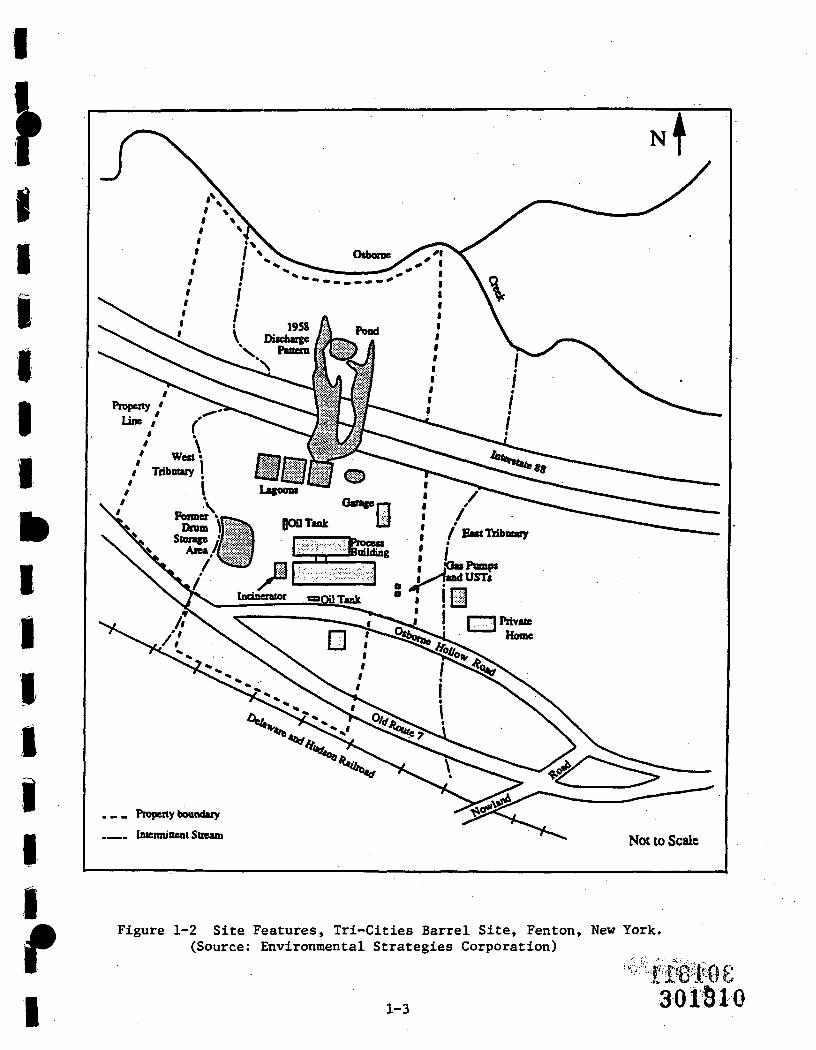
The Site is a former drum reclamation facility located in the town of Fenton, Broome County, New York. The Site is approximately five miles northeast of Binghamton, New York (Figure 1-1). The facility covers approximately 13 acres. The former operatmg area has been fenced. The site is bisected into a north and south section by Interstate 88 (1-88). Operationally, the Site can be divided into three distinct areas: the Processing Area, which contains the operating facility buildings; the South Area, which is an area containing stored drums south of Osbome Hollow Road; and the North Area, the approximately 10 acres north of 1-88 up to Osbome Creek. The Site is primarily rural and is bordered by residential areas, farmlands and woodlands. The locations and the features of the site areas are shown in Figure 1-2.
The Site was operated firom 1955 to 1992 as a cleaning and reconditioning plant for used 55-gallon drums. The dmms, used previously to transport chemicals, were cleaned and reconditioned using a combination of physical, chemical and mechanical, means, including incineration, partjUfljI^Sliag^ f .;,.
11 301808
I
Figure 1-1 Site Location, Tri-Cities Barrel Site, Fenton, New York. (Source: Environmental Strategies Corporation)
301809 1-2
M8f»€t:
n I
Ptopeity boundaiy
Intennineiit SBeain Not to Scale
I
Figure 1-2 Site Features, Tri-Cities Barrel Site, Fenton, New York. (Source: Environmental Strategies Corporation)
1-3 aoiSio
scraping and rinsing with sodium hydroxide solution. All operations of the site were discontinued in 1994. The site, therefore, is currentiy inactive and vacant.
1.2 Organization of This Report
In addition to this introduction, this rqport contains five other sections as follows:
2.0 Preliminary Problem Formulation . 3.0 Preliminary Evaluation of Ecological Effects
This section summarizes tiie first step in tiie development of an ERA, fomiulating tiie problem that needs to be addressed. Four issues are typically critical at a given site: the physical characteristics of tiie area, the contamination present, the fate and transport mechanisms of those contaminants and the pathways by which the contaminants could come in contact with ecological resources on or near the site. This section explores these issues in order to provide the necessary input in the decision to select assessment (and measurement) endpoints relevant to the Site that should be further evaluated.
2.1 Site Description
This section summarizes site information with respect to tiie physical characteristics of the site. The information in tiiis section was provided in tiie Remedial Investigation/Feasibility Study (RI/FS) Revised Work Plan (ESC 1992), Interim Site Summary Rqwrt (ESC 1994) and Contaminant Summary Report (ESC 1995a) prq)ared for the Site and observations made by Life Systems personnel during Site visits.
Physical Setting
The approximately 13-acre site is located in rural New York 5 miles northeast of Binghamton, adjacent to Old Route 7 in the town of Fenton, Broome County. The Processing Area lies between Old Route 7 and 1-88. This area contains a process buildmg, garage, incinerator, aboveground storage tanks and numerous piles of drums. A number of wastewater on-site lagoons have been drained and filled.
A drum storage area (South Area) lies south of the Processing Area, between Old Route 7 and Osbome Hollow Road. This area contains a storage buildrag and piles of drums.
The 10-acre area north of 1-88 extends north to Osbome Creek. This area contains a man-made, seasonal pond.
Topography
The land south of 1-88 is relatively flat. Nearer to 1-88 the land slopes gentiy towards the interstate and continues sloping north of 1-88 toward the creek. Osbome Creek itself has fairly ste^ banks. Elevations across the site range from 930 to 1,025 feet above mean sea level.
Climate
The climate of the Site area is considered "humid continental" and is categorized by severe winters and short, warm summers. Precipitation is evenly distributed throughout the year and since 1967 has averaged approximately 45 inches per year. The prevailing winds in the area are westerly, wifli a southwesterly component in the warmer months and a northwesterly component in the colder months. Average wind speed is approximately 10 mph.
f . I'lQllll •' i
2-1 - 3 0 1 8 1 2
Geologv
The Site lies on a till terrace mantied with a thin veneer of colluvium deposited during post-glacial times. The terrace is underlain by over 50 feet of dense silty clay tUl. Broome County is underlain by marine siltstones and shales of the Upper Devonian Sonyea Group. The group is approximately 450 feet tiiick.
Hydropeolop/
Groundwater in the vicinity of the Site is present in varying amounts in the alluvial/colluvial, glacially derived overburden and bedrock. Several confined and unconflned aquifers have been identified in northeastem Broome County. They include both large outwash-filled and small tributary valleys. The Site is less than 1.3 miles from the eastem edge of the Endicott-Johnson City Aquifer. Groundwater beneath the site ^pears to flow toward Osbome Creek (north/northwest).
Surface Water
The Site is located just south of Osbome Creek. The Creek flows west and joins the Chenango River at Port Crane, just over a mile west of the Site. The Chenango River joins tiie Susquehanna River at Binghamton (five miles west of the Site). Two small unnamed seasonal streams (the East and West Tributaries) on either edge of the Site receive runoff. These streams flow north to Osbome Creek. There is a man-made pond in the North Area that is also seasonal.
Vegetation
Most of the Site's North Area is heavily vegetated with both trees and shrubs. The South Area is heavily vegetated witii stands of weed species and woody shmbs. The Processing Area is highly physically disturbed and contains several imvegetated areas covered with gravel, coarse dirt or sand. The northeastem and northwestem borders of this area are dominated by large weed growth and stands of secondary growth trees.
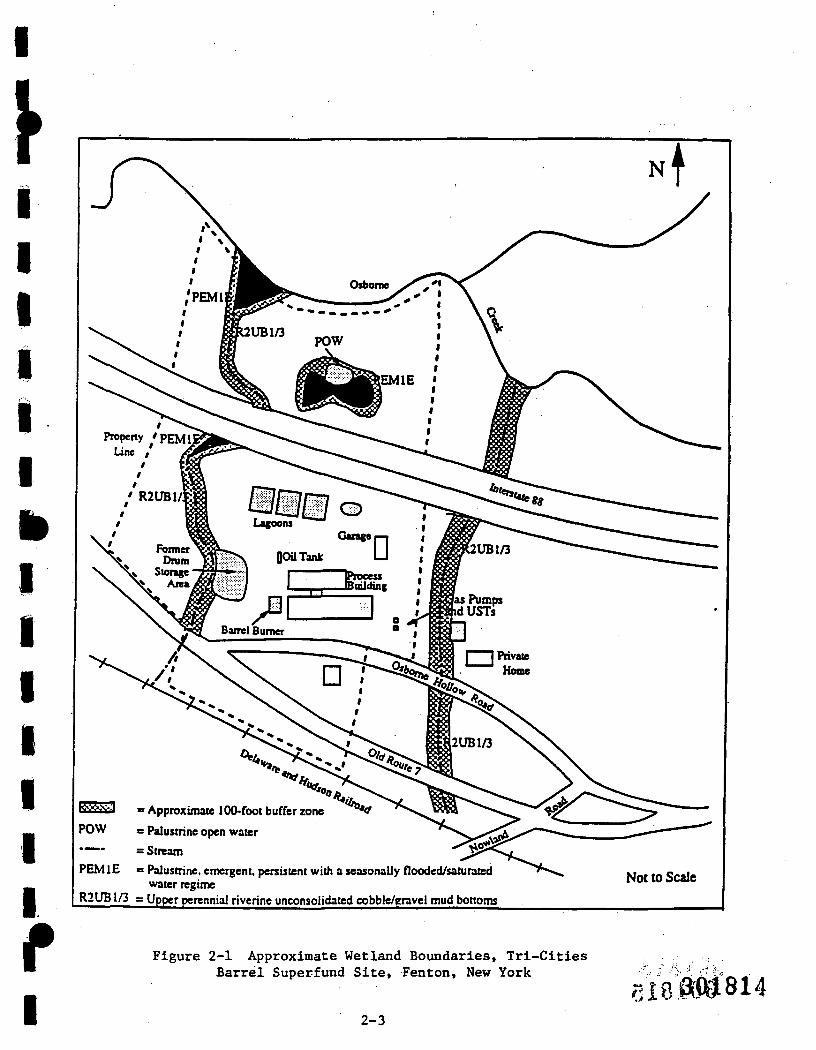
Wetiand vegetation is associated with both streams, Osbome Creek and the man-made pond. A wetiands delineation effort during the Phase I RI produced approximate wetiand boundaries as indicated in Figure 2-1.
Along the streams the associated wetiand systems are classified as upper perennial riverine. The bottoms of tiiese streams are unconsolidated cobble, gravel and mud. There are two emergent areas classified as palustrine, with a seasonally flooded or saturated water regime. These areas are south of 1-88, adjacent to the West Tributary and at the entrance of the West Tributary to Osbome Creek. The pond located north of 1-88 is classified as a palustrine open water area, and the low area adjacent to the open water is similar to the two emergent areas previously described.
301813
2-2
1 I
r
= Approximate lOO-foot buffer zone
POW s Palustrine open water
= Stream
PEMlE = Palustrine, emergent, persistent with a seasonally flooded/saturated water regime
I Figure 2-1 Approximate Wetland Boundaries, Tri-Cities
Barrel Superfund Site, Fenton, New York
2-3
5l8#Ca814
Land Use
The Site was once a farm and there are still agricultural parcels in the vicinity. Residences are located south of the Site along Osbome Hollow Road; tiie remaining area is rural cropland and woodland.
2.2 Evaluation of Site Stressors
A stressor is defined as any physical, chemical or biological entity that can induce an adverse effect that could encompass a range of disturbances from mortality in one individual or population to a loss of some ecosystem function. Two elements are therefore required for adverse ecological effects: there must be a stressor capable of inducing an adverse effect and secondly that stressor must co-occur with an ecological receptor long enough and at a sufficient level to result in that adverse response. The majority of stressors at hazardous waste sites are chemical stressors. The following sections summarize the chemical stressors detected in of the RI monitoring effort at the Site and other Site stressors that could be of concem.
2.2.1 Chemical Stressors
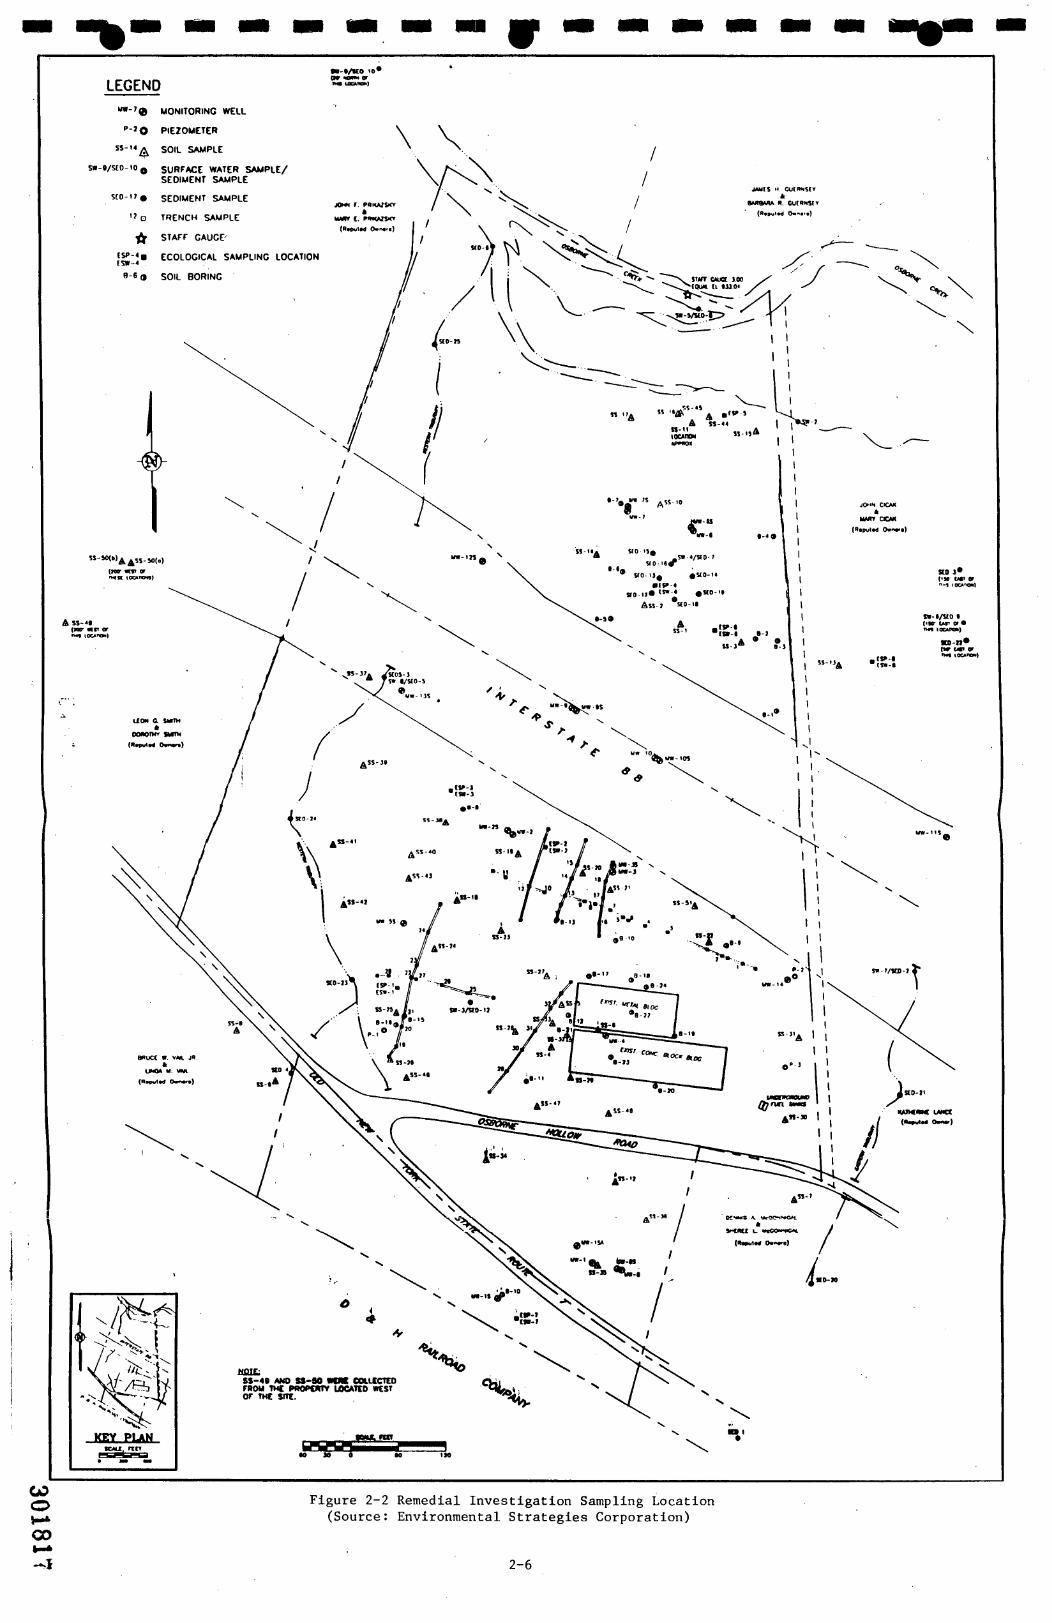
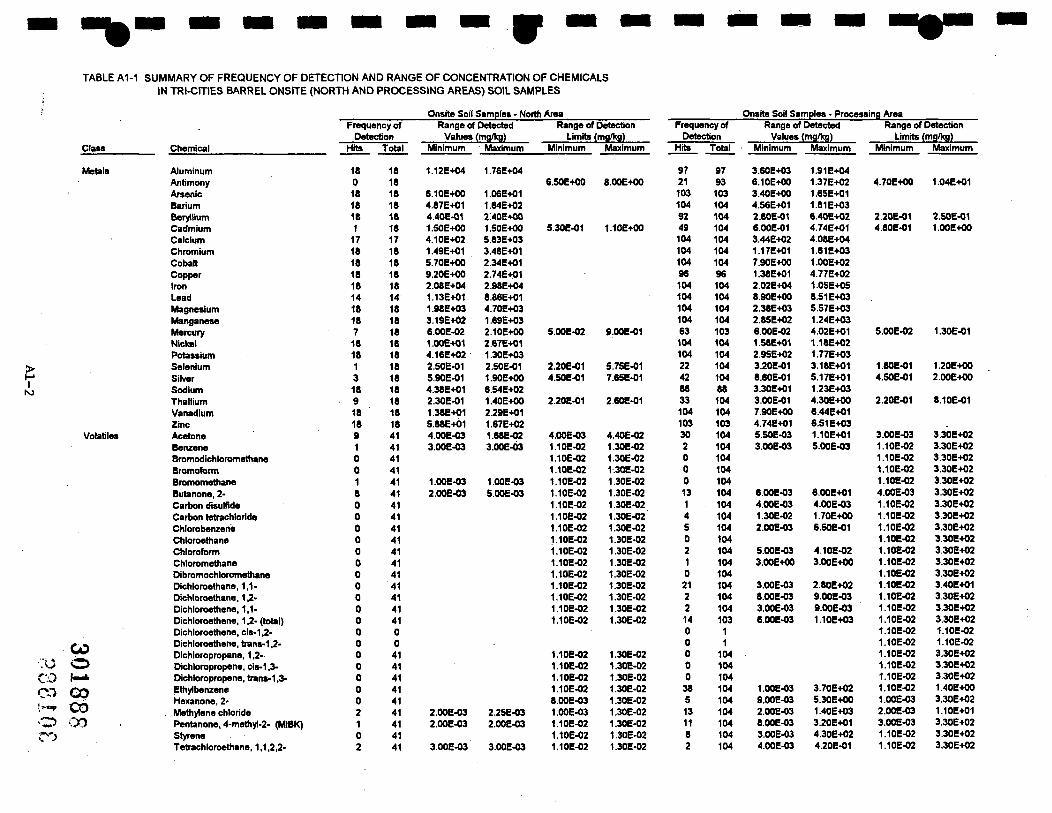
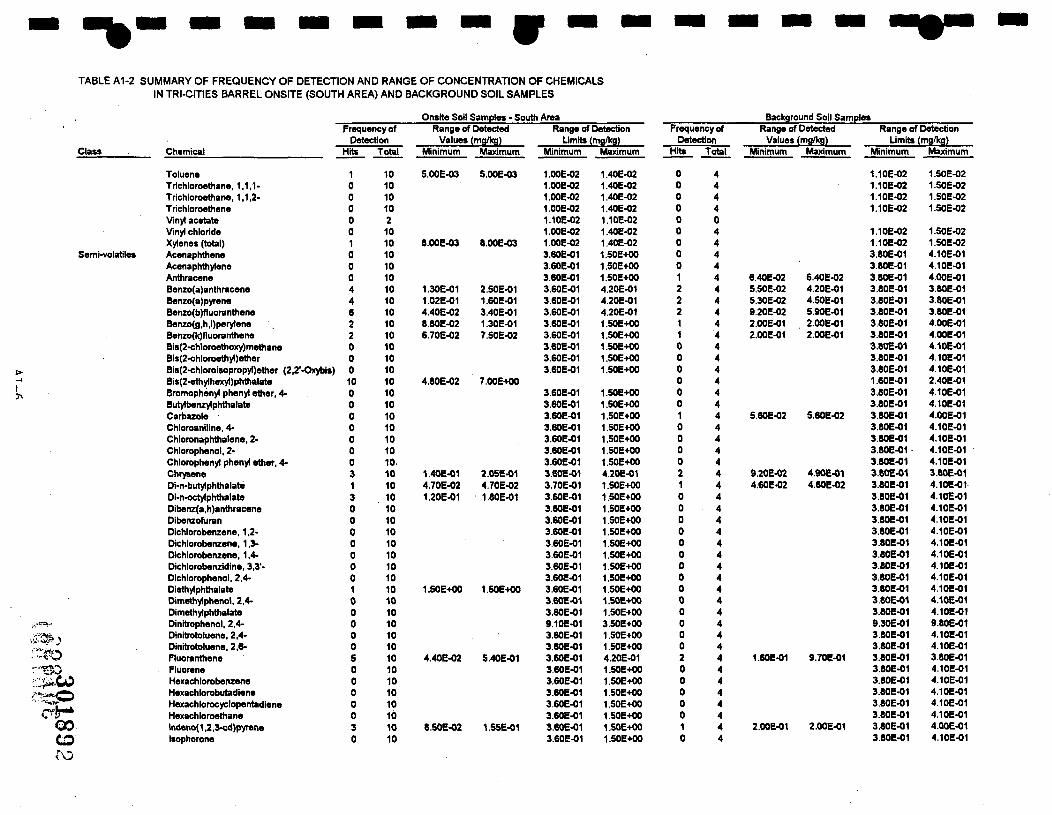
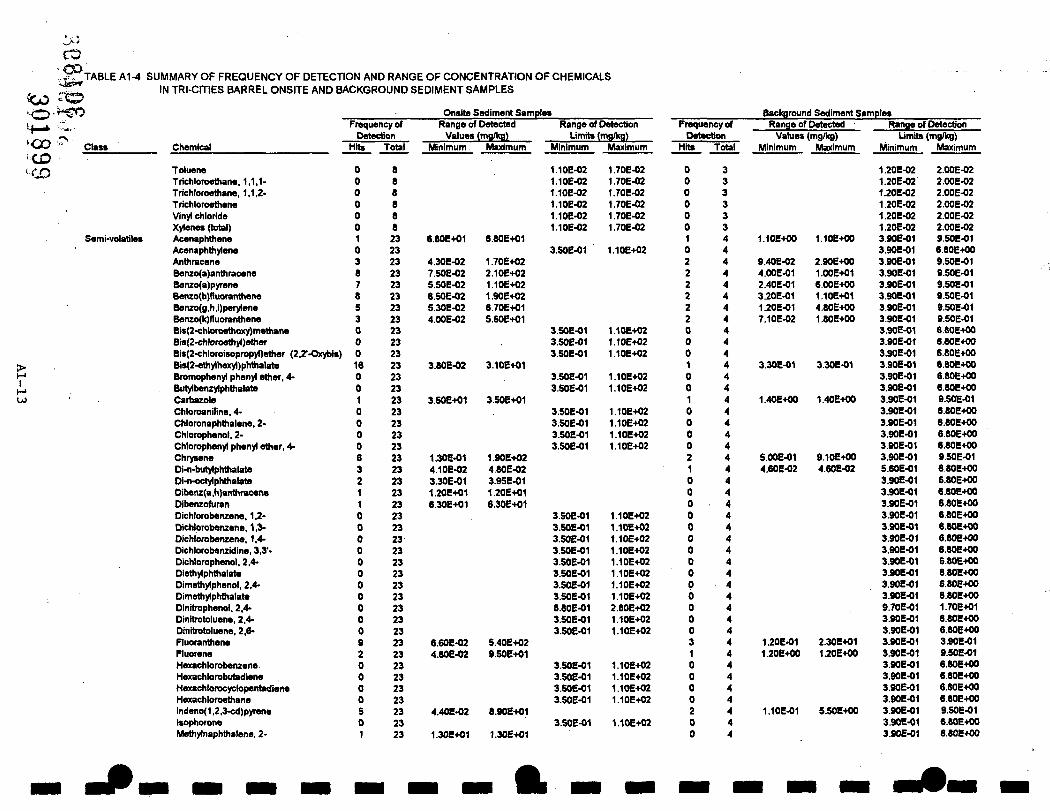
A total of 123 chemicals were detected at least once in samples collected from Site media. These sampling data are summarized in media-specific tables provided as Appendix 1 of this report. Media-specific sampling efforts and results are discussed in the following sections; more detailed descriptions of sampling efforts are described in ESC (1994, 1995a). Figure 2-2 provides sampling locations across the Site during all three phases of the investigation.
Soil and Trench Sampling
Both surficial and deeper soils were collected deliberately fi-om locations both north and south of 1-88 in areas where soils were stained, along drainage pathways and in known areas of disposal. The samples north of 1-88 were taken in the assumed historical drainage pattem. Sampling locations are indicated on Figure 2-2. Backgroimd soil samples were taken from south of Old Route 7 (SS-8,9 and B-ID) or west of the site boundary (SS-7). In Phase HI two additional backgroimd locations were sampled at an adjoinmg property west of tiie site (SS 49 and SS 50). Seven trenches were excavated in the Processing Area, primarily where excavated lagoons had been located historically.
Metals, volatile organic compounds, semivolatile organic compounds and a variety of pesticides and polychlorinated biphenyl compounds (PCBs) were detected in these soils samples. Dioxin (TCDD) was detected in the two surface soil samples taken in the vicinity of the incinerator. In general, contaminant levels were highest in the Processing Area when compared to levels in the North Area (see Table Al-l). Sample-by-sample results and data summaries for Phase I and Phase n efforts are presented in ESC (1994, 1995b).
Groundwater Sampling
Two rounds of sampling were conducted during the initial investigation phases on existing and newly constracted monitoring wells, including the out-of-service production well within the processing building. During Phase DI additional monitoring wells were installed and sampled in order to fiirther characterize groundwater in unconsolidated deposits and in the sand and gravel lenses. Twelve volatile organic compounds, twelve semi-volatile compounds and a polychlorinated biphenyl (PCB), Aroclor 1242, were detected in these samples in addition to almost all the inorganic analytes. Most
:Si»8l5 2 ^ I
r
of the organic compotmds were detected infrequentiy and at fairly low levels except for a number of volatiles detected at levels greater than 1 ppm. (see Table Al-3).
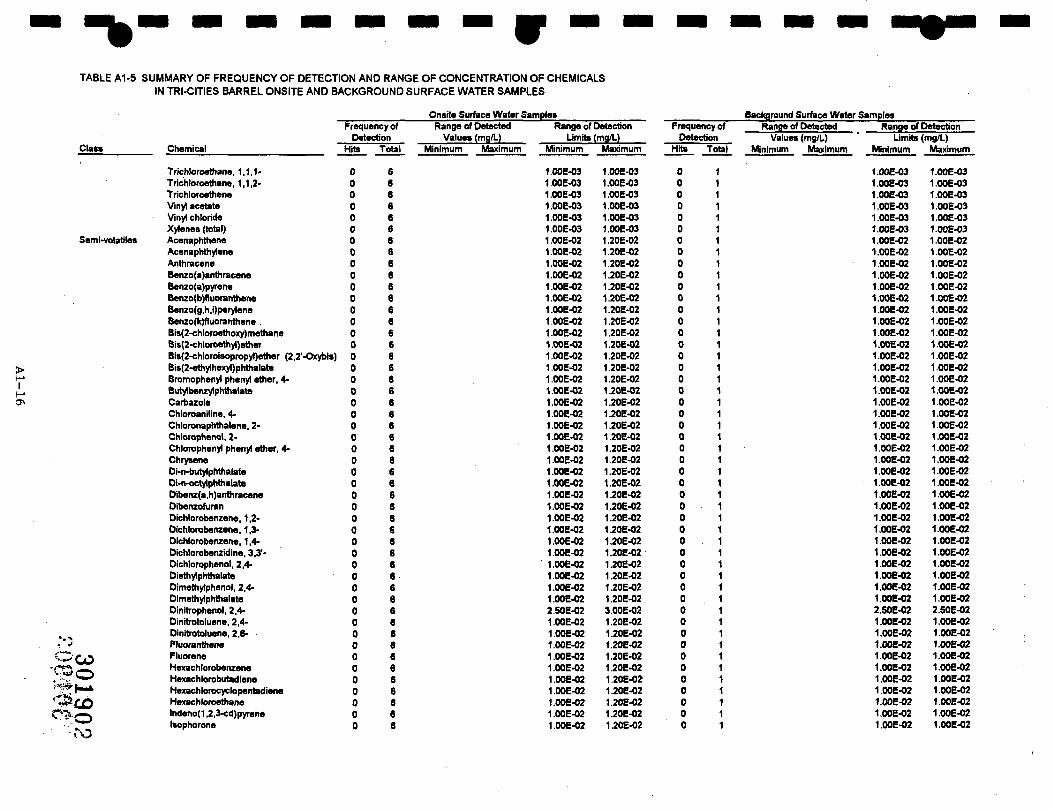
Surface Water and Sediment Sampling
Seven surface water samples and twenty-five sediment sanqiles were collected firom locations on or near the site (Figure 2-2). Locations included the two tributaries along the eastem and westem site borders, Osbome Creek and the man-made pond north of 1-88. During Phase m , additional sediment samples were taken at location SED5 to further assess pesticide concentrations in this area.
Three background sediment locations were designated at locations south of the site along the intermittent streams (SEDl, SED4 and SED20). Sediment san^les and an associated surface water sample were taken upstream of the site along Osbome Creek (SED 9, SED 25, SW6).
The only organic compounds detected in the surface water samples were alpha- and gamma-chlordane (0.034 to 0.043 ppb) and carbon disulfide (7 to 13 ppb). The chlordanes were detected at SW8, where the West Tributary meets 1-88. The carbon disulfide detections were in Osbome Creek, at locations SW5 and SW9.
Nine metals were deteaed in all surface water sanq)Ies (aluminum, barium, calcium, iron, magnesium, manganese, potassium, sodium and zinc). Lead was detected in only one sample (32 ppb) at location SW4, in the pond north of 1-88. However, many surface water sample results for lead were considered unusable by the data validators.
All metals were detected in sediment samples. Maximum concentrations ranged firom less than a ppm (for selenium and thallium) to much higher levels for aluminum and iron. Concentrations of inorganics in site sediments were very similar to those in background sediments. A variety of semivolatile organic compounds were detected at both site and background sediment locations, primarily polycyclic aromatic hydrocarbons (PAHs), pesticides and PCBs. The Phase m sediment samples (at SED 5) detected chlordanes, dieldrin, DDD, DDE and tiie PCB, Aroclor 1254.
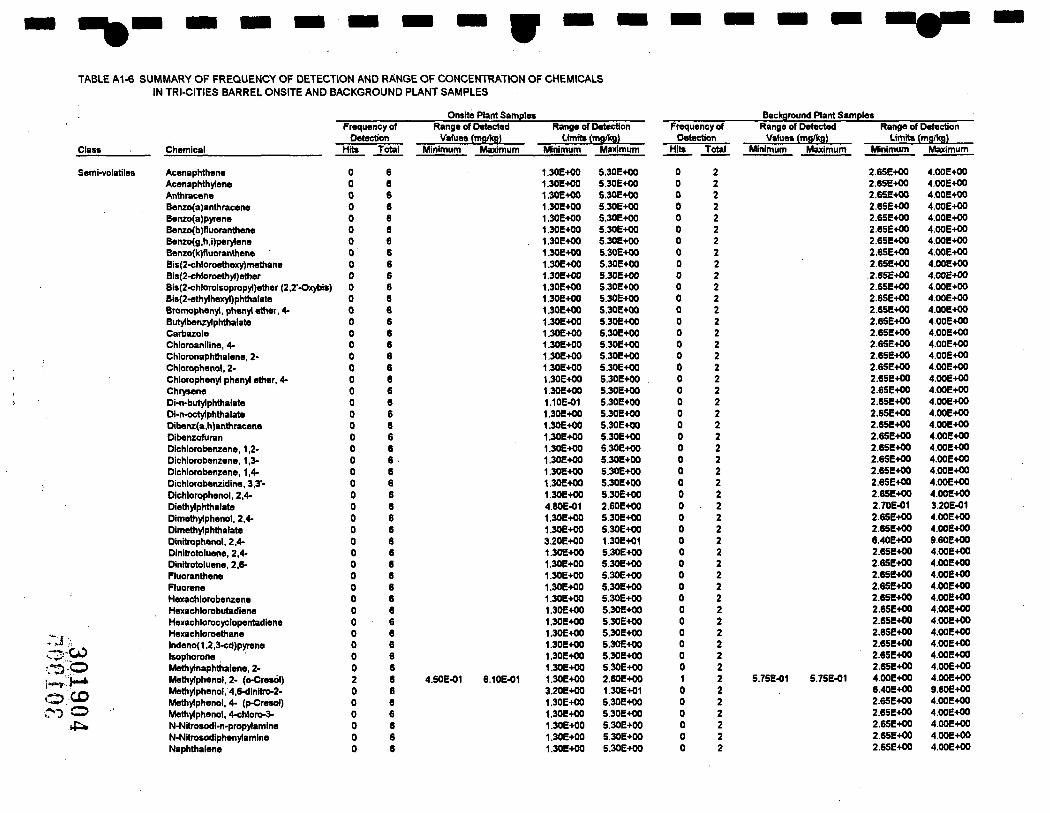
Plants
During Phase n , plant tissue samples were analyzed from six on-site and two background locations (Figure 2-2). Co-located soil samples were not obtained at plant sampling locations. Only organic analyses (SVOCs, PCBs and Pesticides) were performed. A cresol, 2-methyphenol, was detected in two site and one background sample (at ^^proximately 0.5 ppm). Two PCBs, 1248 and 1254, were detected in three of the on-site samples (two samples in the westem processing area (ESPl and 2) and one nortii of 1-88 (ESP 4)). Two pesticides (beta-BHC and 4,4'-DDT) were detected in a sample from the northwestem processing area (ESP3).
I 2-5 1!0 301816
Ill
f z L
iJ
o UJ
a. o z o 3
9
S
I
c o T
H
4J ^
v rt
c o
o O
.H
>
J 4J CO
bO
M
C
O
T
\ d
. .H
M
C
L O
B
U
tfl w
en (U
C
.H
O
60
T\
Q)
W
4-1 rt rt
00 M
•H
4-1
4J CO
tn Q
) r-(
>
« d
4J M
C
Q
) -H
e
rt c
•H
O
•O
H
0) .H
e
>
<u c erf
w
CS)
..
1 (U
C
N
O
u tt)
3
n o
3 W
6
0^
vD
1 C
N
tn
301817
f I
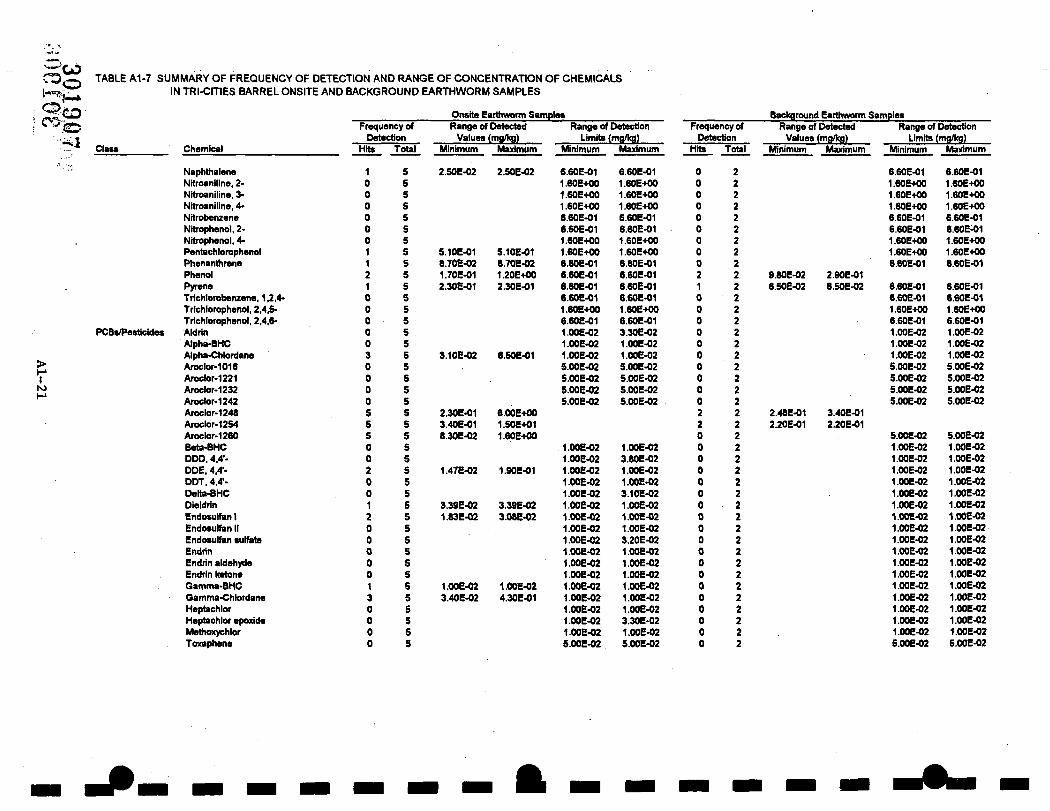
Earthworms
During Phase n, earthworms were collected from six on-site and two background locations (Figure 2-5). Co-located soil samples were not taken at these locations before analysis but locations were purposely selected in areas of high chemical concentration previously identified or, for background, in areas not affected by site operations. The earth worms were not depurated prior to analysis in order to represent chemical concentrations available in food for terrestrial wildlife. The sample locations were collocated with the sampling points selected for plant tissue collection. The samples were analyzed for organic analytes only (SVOCs, PCBs and Pesticides). Aroclors (PCBs) were detected in all samples (both site and background) and several pesticides (chlordanes, dieldrin, gamma-BHC, endosulfan) and phthalates were detected in earthworm tissue samples collected from site samples. Anthracene, benzo(a)pyrene, chrysene, naphthalene, pentachlorophenol and phenanthrene were only detected in the earthworm sample from location ESWl, in the southwestern portion of the processing area. Phenol and pyrene were detected in both on-site and background earthworm samples.
2.2.2 Otiier Stressors
There are two physical stressors at the Site that could be associated with adverse ecological effects. First, there has been considerable disturbance of the area both in its initial agricultural development and secondarily in its present condition as an industrial concem. Additionally, the construction of I-88 considerably altered the physical characteristics of the area. Both agricultural and industrial land uses are likely to have had significant impact on available habitat for ecological receptors.
Secondly, the intermittent nature of the two streams and the pond is likely to affect the long-term establishment of aquatic populations. While the impacts of these stressors are not evaluated in this report, they must be acknowledged. It must be recognized that these other stressors can be the cause of or be contributing to impacts on ecological receptors at this site.
2.3 Selection of Contaminants of Potential Concem
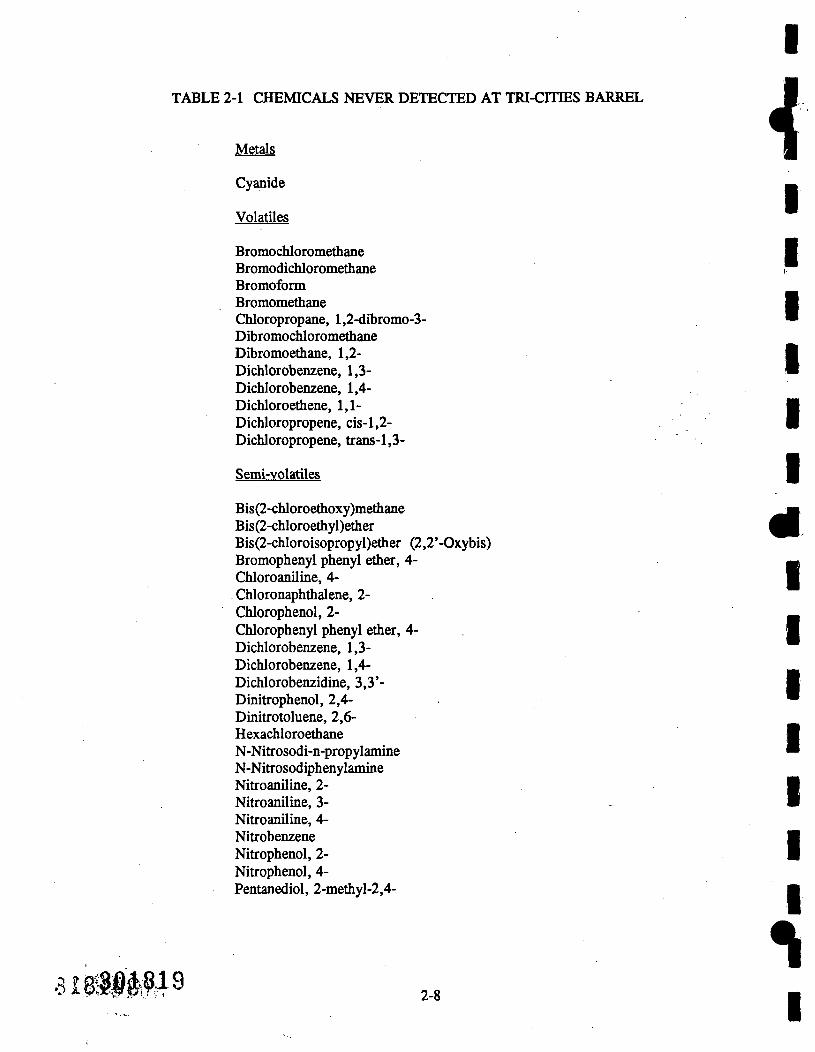
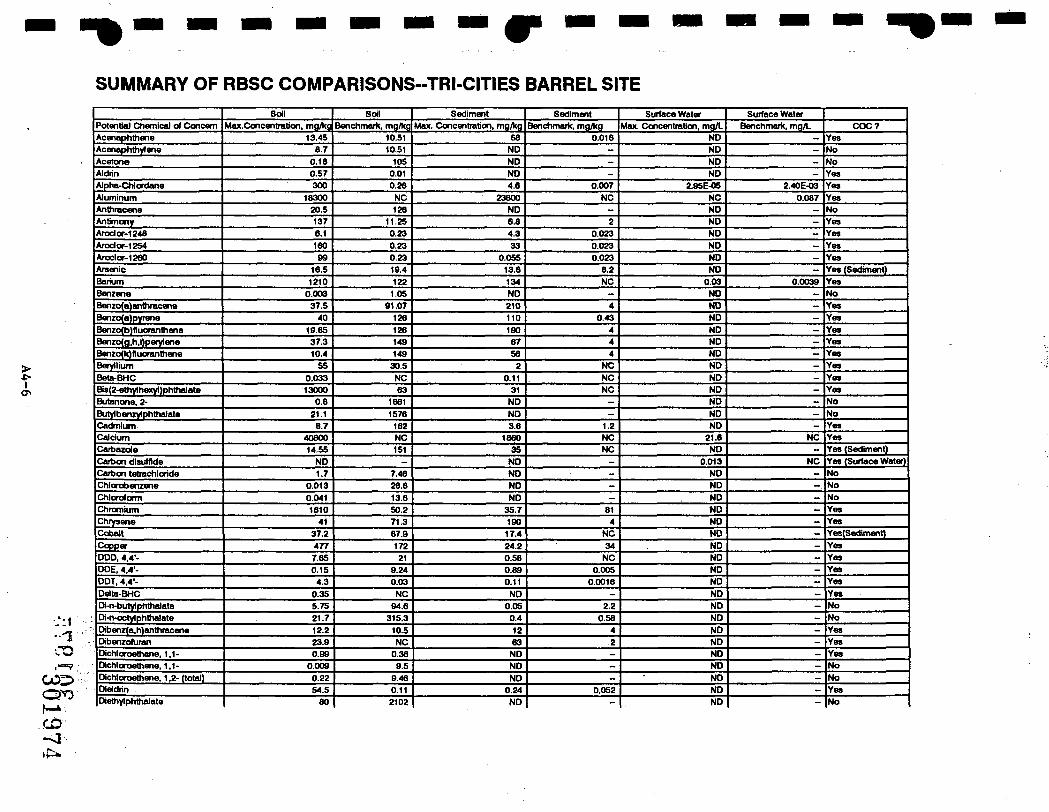
Contaminants of potential ecological concem are chemicals present at the Site that could pose a risk of adverse impacts to exposed ecological resources. The selection of these chemicals is based mainly on the results of chemical analyses conducted during the RI process. Analytical data were initially evaluated against quality control parameters to detennine their usability for risk assessment purposes (Life Systems 1995). Any chemical detected in at least one site sample was considered a candidate for inclusion. Table 2-1 lists chemicals eliminated from consideration because they were never detected at the Site. Other chemicals were further eliminated because they were present at levels below a risk-based screening concentration (RBSC).
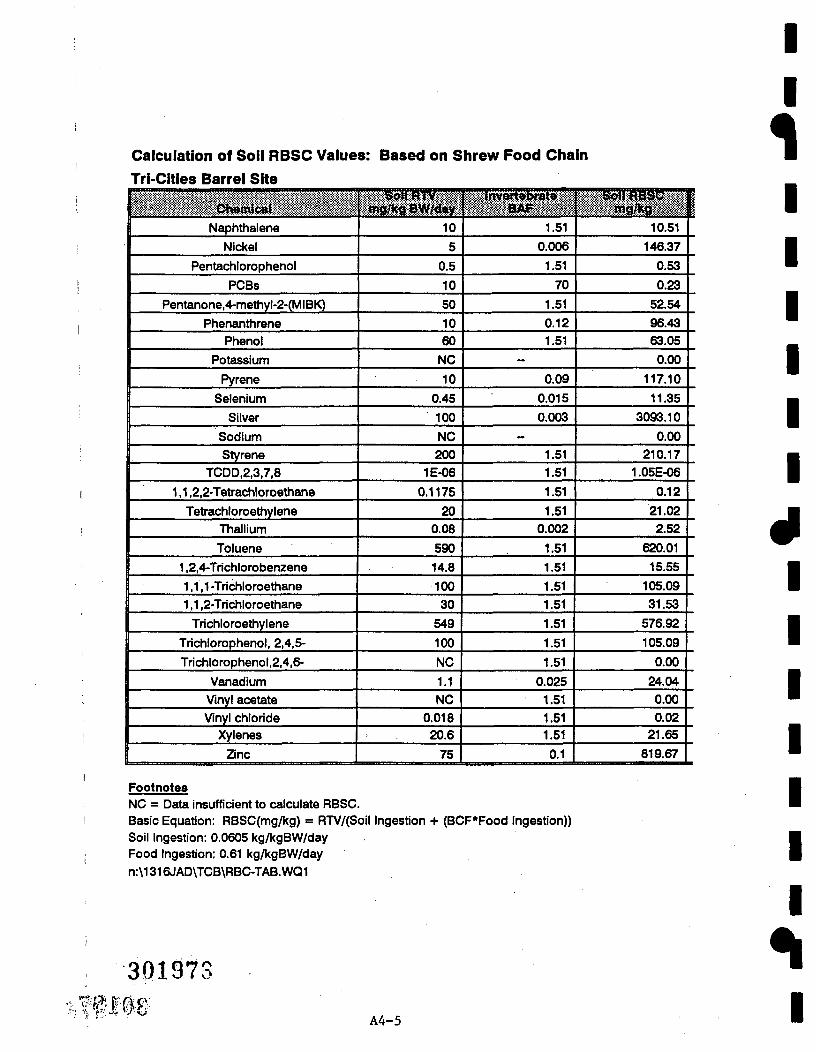
The objective of risk-based screening is to determine whether or not the Site analytical data collected during the RI indicate an impact at a level that could pose a concem to an ecological receptor . The screening compares maximum chemical concentrations against an RBSC (or benchmark) conservatively developed on a medium-by-medium basis. At this Site, the following methodologies were used to determine RBSCs:
• Soil: RBSC values were calculated based on a shrew food chain exposure model.
ei.8.s§l8i8 2-7
TABLE 2-1 CHEMICALS NEVER DETECTED AT TRI-CITIES BARREL
• Surface Water: The USEPA chronic ambient water quality values or values calculated using the Great Lakes Water Quality Initiative Tier II methodology were utilized (USEPA 1996). These values are protective of a wide variety of aquatic organisms.
• Sediment: Chemical specific sediment quality screening benchmarks were selected from USEPA's Sediment Quality Criteria or effects ranges published in the literature (Long & Morgan 1991; Persaud et al. 1993).
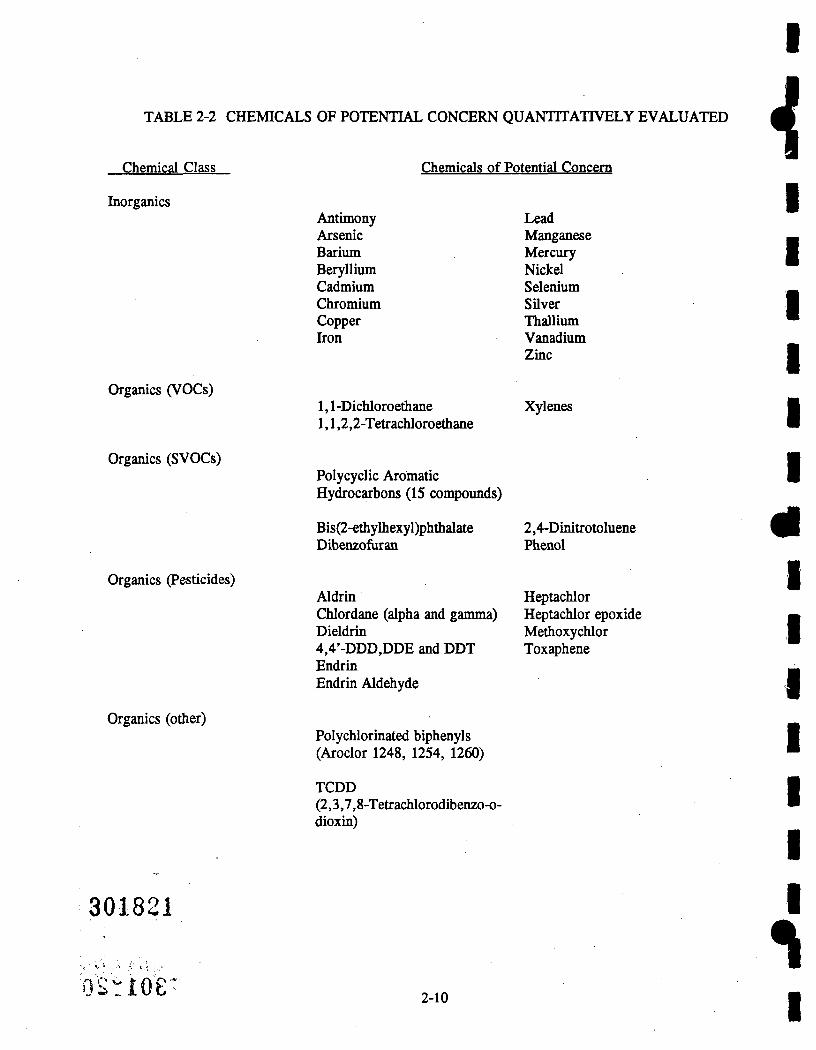
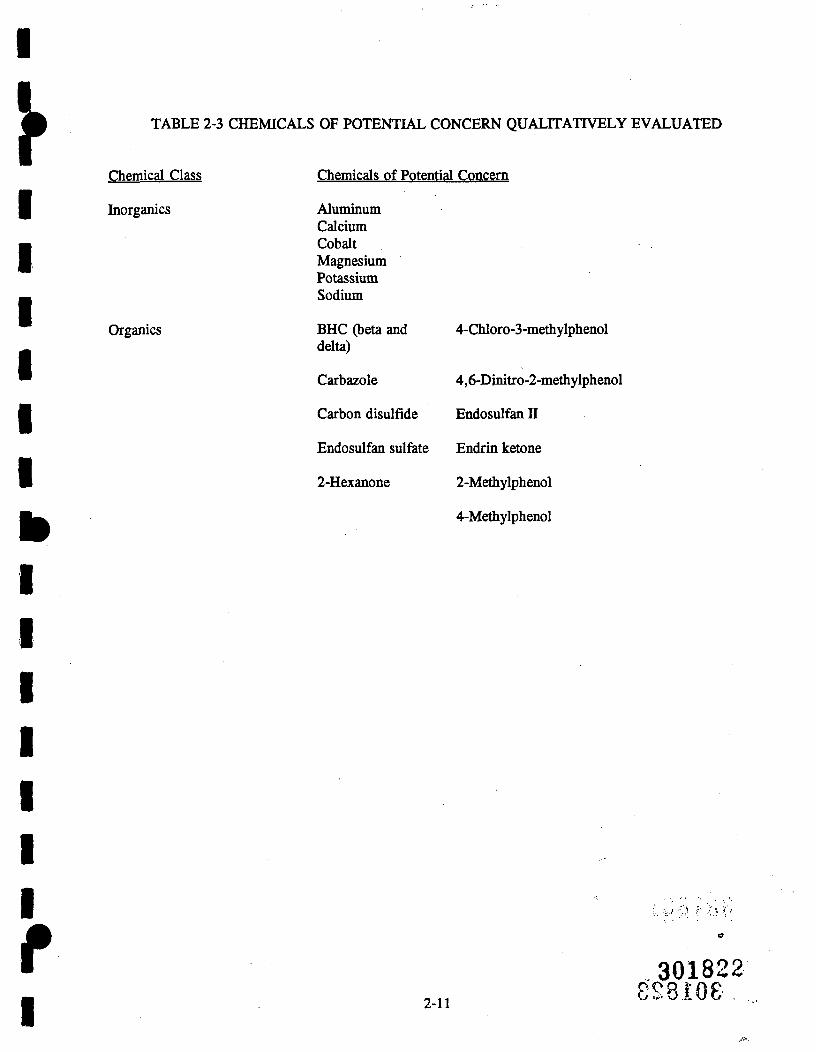
The RBSC values utilized in this comparison and the maximum soil concentrations (fi-om 0-2 ft.) are detailed in Appendix 4. It must be noted that not every chemical can be evaluated via this process since benchmarks are not available for every chemical in every medium sampled. Table 2-2 summarizes the chemicals that exceeded benchmarks in at least one medium and are therefore quantitatively evaluated in this risk assessment as a chemical of potential concern. Table 2-3 summarizes chemicals that could not be evaluated via this screening process, since a benchmark is not available for at least one medium in which the chemical was detected. These chemicals are qualitatively considered chemicals of potential concern.
r I 2-9
I.28I08
M)i#20
TABLE 2-2 CHEMICALS OF POTENTIAL CONCERN QUANTITATIVELY EVALUATED
Chemical Class
Inorganics
Organics (VOCs)
Organics (SVOCs)
Organics (Pesticides)
Organics (other)
Chemicals of P
Antimony Arsenic Barhim Beryllium Cadmium Chromium Copper Iron
1,1-Dichloroethane 1,1,2,2-Teti:achloroetiiane
Polycyclic Aromatic Hydrocarbons (15 compoimds)
Bis(2-etiiylhexyl)phflialate Dibenzofiiran
Aldrm Chlordane (alpha and gamma) Dieldrin 4,4'-DDD,DDE and DDT Endrin Endrin Aldehyde
6.5E-06 1.5E-07 1.8E-07 2.0E-07 3.0E-04 2.6E+06 NA 2E-01
7.7E-05 4.9E-04
7.4E-10
Temp
20C 20C 25C 25C 25C 20C NA 25C
25C 25C
25C
Henry's Law, atin-m /mol
6.8E-05 5.1E-04 4.6E-07 4E-07 1.48E-03 3.16E-06 NA 4.89E-03
2.7E-03 3.5E-03
2. IE-03
Koc
4.4E+06 2.4E+05 1.7E+03 NA 1.2E+04 2.2E+02 NA 9.6E+02
4.1E+05 4.4E+05
4.6E+06
Log Kow
5.69 6.19 3.5 5.6 4.40 3.65 4.68 3.3
6.47 6.11
6.64
2.4 Fate and Transport Mechanisms. Chemicals of Potential Concem
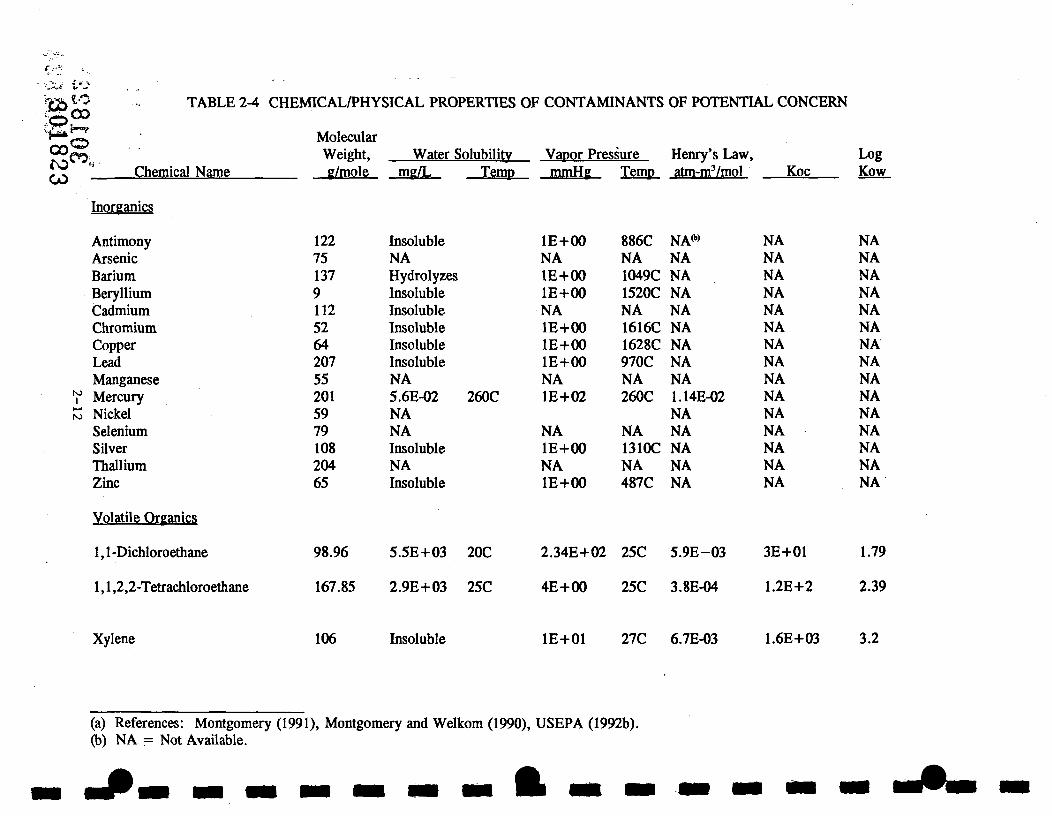
Contaminant release, transport and fate are influenced by both contaminant-specific physical and chemical properties and the characteristics of the site. This section provides a brief discussion of the fate and transport processes likely to be important at this site, the physical and chemical properties of each chemical of concem, and the site characteristics that are expected to influence movement and fate of contaminants selected for evaluation in this ERA. The following information has been developed fi-om a variety of reference sources including Bodek et al. (1988), Dragun (1988), Lyman et al. (1982), Mabey et al. (1982), Manahan (1991), Ney (1990), USEPA (1987a) and (1988) and Verschuren (1984). Table 2-4 summarizes the physical and chemical properties of each chemical of potential concem.
2.4.1 Contaminant Fate and Transport Processes
Volatilization
Volatilization is a phase change reaction that transfers a chemical from water or soil to air. Vapor pressure is a chemical property that governs volatilization. Chemicals with a high vapor pressure (i.e., greater than 0.01 mm Hg) are likely to volatilize into air readily. Henry's Law Constant, another measure of the degree of volatility, is a fimction of molecular weight, solubility and vapor pressure. This constant, expressed in units of atm-m'/mole, indicates low volatility in the range of IE'07 to lE-05 and moderate volatility in the range of lE-05 to IE-03. Most of tiie chemicals of potential concem at the Site are expected to demonstrate low or moderate volatility, with the exception of 1,1-dichloroethane, 1,1,2,2-tetrachloroethane and xylene (Table 2-4). These three chemicals are expected to be highly volatile. The rate of volatilization is influenced by a variety of factors, including polarity and functional groups within the molecule, molecular weight, temperature, wind speed and soil conditions.
Photolvsis/Photodecomposition
Photolysis is the alteration of a chemical molecule due to absorption of light. It is particularly important in aqueous and atmospheric environments, and less so on soil surfaces. Photodecomposition can occur as a result of energy transfer from molecules that have absorbed solar radiation. The significance of these reactions varies with latitude, temperature and climate.
Hydrolvsis
Hydrolysis occurs when the bonds of an organic compound, dissolved in water, break and new bonds are formed with OH" and H^. The rate at which this process occurs is dependent on the chemical concentration, temperature and pH. Compounds most susceptible to hydrolysis reactions are amides, amines, esters, carbamates and alkyl halides. This is an important mechanism in the environment for the breakdown of a parent compound. The rate of hydrolysis, if known, is a predictable measure of persistence of a chemical in the environment.
Oxidation/Reduction Reactions
Oxidation is the loss of electrons from a chemical; reduction involves gaining electrons. These H reactions are strongly influenced by the electrical (redox) potential of the surrounding medium.
f
Dehalogenation
Dehalogenation is the loss of a halogen (e.g., chlorine, bromine) from a chemical. Reductive dehalogenation is the loss of a halogen with the simultaneous gain of a hydrogen atom. This is an important degradation process for chlorinated organic compounds.
Diffusion and Dispersion
Difiiision is the movement of a chemical along a concentration gradient. This generally is an important transport process: gaseous contaminants move firom soil pores at depth to the soil surface by difftision.
Adsorption
Adsorption of chemicals to soils is generally an important process at sites. Adsorption to soil organic matter occurs through both nonionic and ionic reactions. The rate and extent of adsorption is a function of a number of variables including the organic content of the soil, the cation exchange capacity, temperature and pH. It is unportant to note that chemicals adsorbed to soil particles are unlikely to be leached by water but could be leached by other solvents, by soil movement or if the capacity of the soil to hold water has been reached. Highly water soluble chemicals are less strongly adsorbed to soils, leach rapidly from soil and are less likely to volatilize.
A measure of a chemical's ability to adsorb to soil organic carbon is the Koc. In general, chemicals with a low Koc (less than IE+03) will not adsorb to soil organic carbon. Conversely, chemicals with ^ a high Koc (greater than IE+04) will tend to adsorb. Table 2-4 indicates that virtually all the ^ M organic chemicals of potential concem have Koc values greater than IE+04, with the exception of the ^ ^ volatile compounds. It therefore is expected that these chemicals detected in Site soils are not likely to be very mobile.
Biodegradation
Biodegradation is the breakdown of organic compounds by microorganisms. The rate of biodegradation is a function of the size and composition of microbial populations, temperature, substrate concentration, availability of an energy source (e.g., carbon), essential nutrients and water and the organic content of soil. Biodegradation can indkectiy affect the fate and transport of inorganic chemicals through immobilization and changes in either or both the pH and redox potential of the medium. Chemicals that are highly biodegradable are usually highly water soluble and do not adsorb to soil but leach from it.
Biological Uptake
Biological uptake occurs when plants and animals are exposed to contaminants and take them up into their tissues. The chemicals can subsequentiy undergo metabolism or storage, which allows the chemical to accumulate in higher trophic organisms (bioaccumulation).
Bioaccumulation is a key consideration in determining whether food-chain contamination can occur. The tendency of a chemical to bioaccumulate can be predicted by inspection of both water solubility and the octanol water partition coefficient (Kow). The Kow of a chemical indicates how it distributes between octanol, an immiscible organic solvent that acts as a surrogate compound for fat, and water at equilibrium. This ratio is then an index of the tendency of a chemical to accumulate in animal fat (lipophilicity).
' -%«% .... I •t
t
Chemicals that can be considered strong bioaccumulators are those whose water solubility is low (less than 10 mg/L) and whose Kow and Koc are high (greater than lE+03 and lE+04, respectively). Of the chemicals identified at the Site, the PAHs, PCBs, phthalates, pesticides and dioxin can be considered strong bioaccumulators (Table 2-4).
2.4.2 Importance of Fate and Transport Processes for Chemicals of Potential Concem
Inorganics
The inorganic contaminants at the Site are metals. Speciation is the dominant characteristic of this group that affects fate and transport. Speciation strongly influences metal solubility and transport in surface waters and the tendency to adsorb to soil and s^iments.
A number of envu-onmental characteristics affect the fate and transport of metals, includmg:
• Other ions that enhance or limit mobility via competitive complex formation • The pH of the medium • The cation exchange capacity of the medium • The presence of humic substances, silicates, hydrous oxides and carbonate minerals • Oxidizing or reducing conditions • Microbial populations
I
Because of the complexity of reactions that characterize the metal contaminants at a site, it is difficult to predict either the species present or the specific fate and transport processes that are relevant.
Volatile Organic Compounds
This group of compounds includes 1,1-dichloroethane, 1,1,2,2-tetrachloroethane and xylenes. As indicated in Table 2-4 these compoimds are relatively mobile and can be expected to migrate readily to surface water, groundwater or air.
Semi-Volatile Organic Compounds
The mobility of the semivolatile organic compounds is expected to be relatively low. The PAHs are high molecular weight compounds that are typically immobile in soil but can be transported to surface waters by erosion, runoff and overland flow. There they are expected to be deposited in sediments and move downstream due to scouring of sediments. These compounds generally resist biodegradation by microbes, but are metabolized by higher plant and animal forms. Photolysis of PAHs to more toxic compounds can occur in aquatic environments. The phthalates are somewhat mobile, but are not likely to strongly biodegrade or bioaccumulate. The pesticides are relatively immobile due to adsorption to soil and sediment. There is a strong potential for these to bioaccumulate via food chain transfer. Photolysis is likely to be an important process for some of the pesticides. The PCBs are large nonpolar molecules with high Koc and Kow values. Thus, adsorption and bioconcentration are important fate processes for this group. These contaminants are expected to be immobilized in soil and not transported in solution by groundwater or surface water to any significant extent. Transport as suspended sediments is likely to be important at the Site.
Dioxin was analyzed and detected in two soil samples in the vicinity of the incinerator. This chemical, like the PCBs and pesticides, is fairly immobile in soils and not only bioaccumulates but biomagnifies. Further characterization on the extent of dioxin contamination has not been done; therefore it is unknown whetiier this contaminant has been transported beyond the incmerator area. ''
2-17 9 ^ ^
2.4.3 Site-Specific Factors Affecting Contaminant Fate and Transport
There are several environmental features of the Site that are expected to influence the fate and transport of contaminants. The presence of the two intermittent streams represent seasonally important transport pathways for movement of contaminants to the off-site surface waters of Osbome Creek. The amount and variability (daily and seasonally) of precipitation received at the Site would determine the significance of transport of contaminants both by leaching and by suspended and dissolved forms in surface water.
2.4.4 Summary
Based on the monitormg data collected durmg both phases of tiie RI, it appears that the dominant fate and transport processes involve adsorption. Chemicals detected in both surface and deep soils appear to be relatively immobile, although some contaminants have been transported to groundwater (volatile organics, pesticides, PCB 1242). The contammants in soil have reached stream sedunents, probably by overland flow or mnoff. For the most part these chemicals appear to be sequestered in sediments, although chlordane was detected in one surface water sample. The presence of multiple chemicals with high Kow values in soils and sediments suggests that food chain transfer is possible at this Site.
2.5 Potentially Exposed Habitats and Species
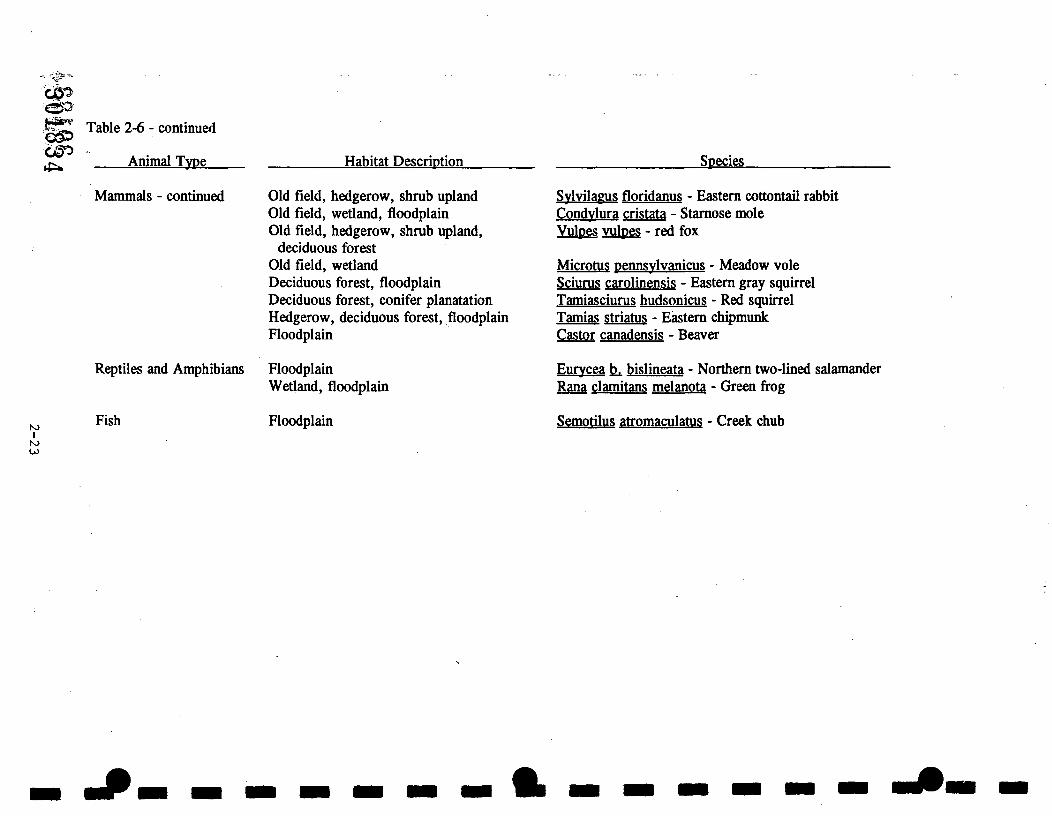
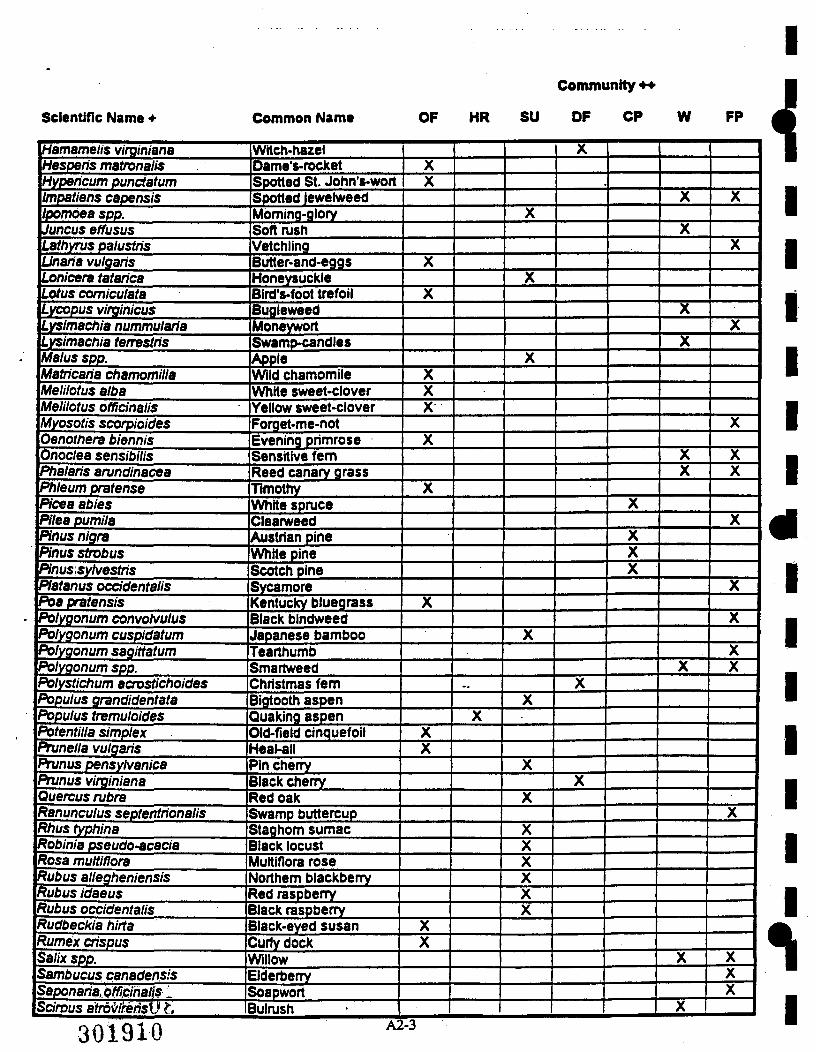
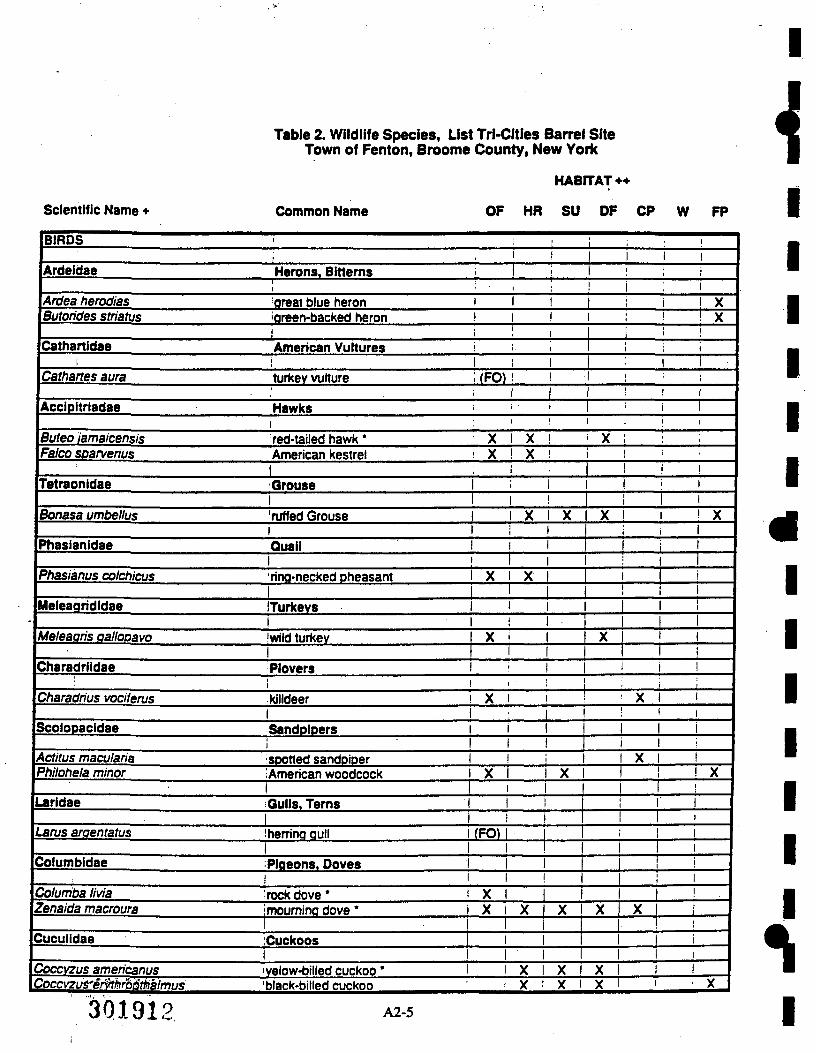
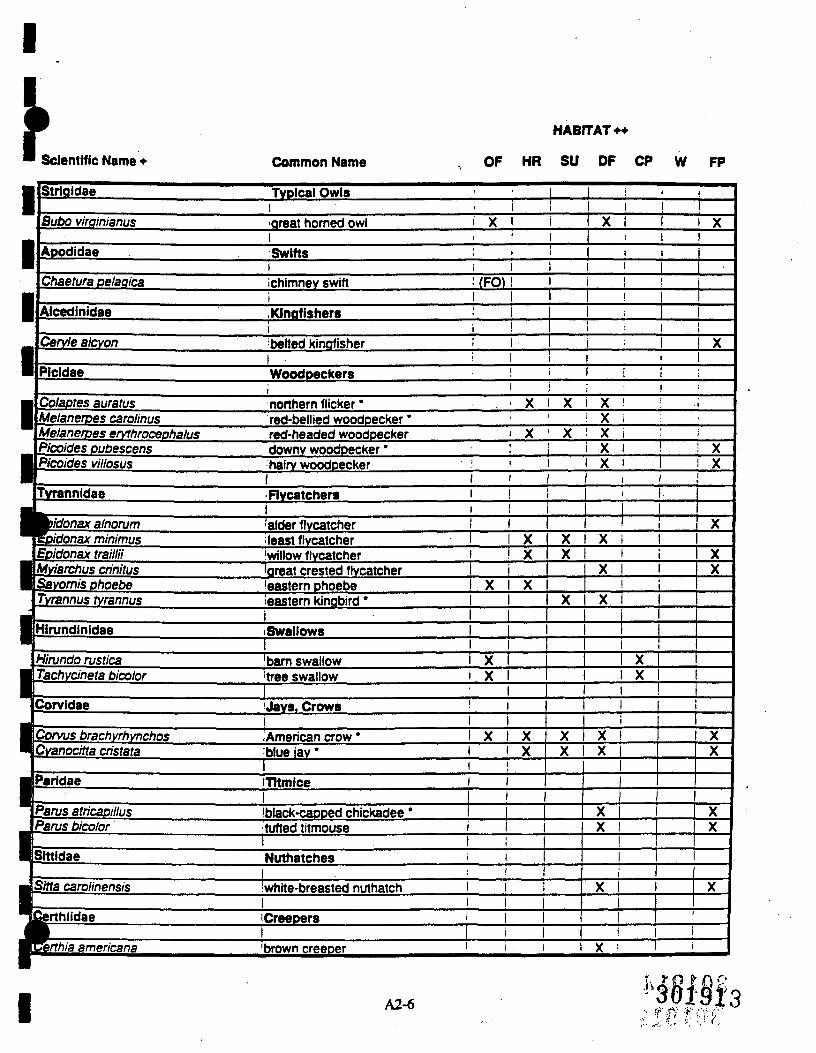
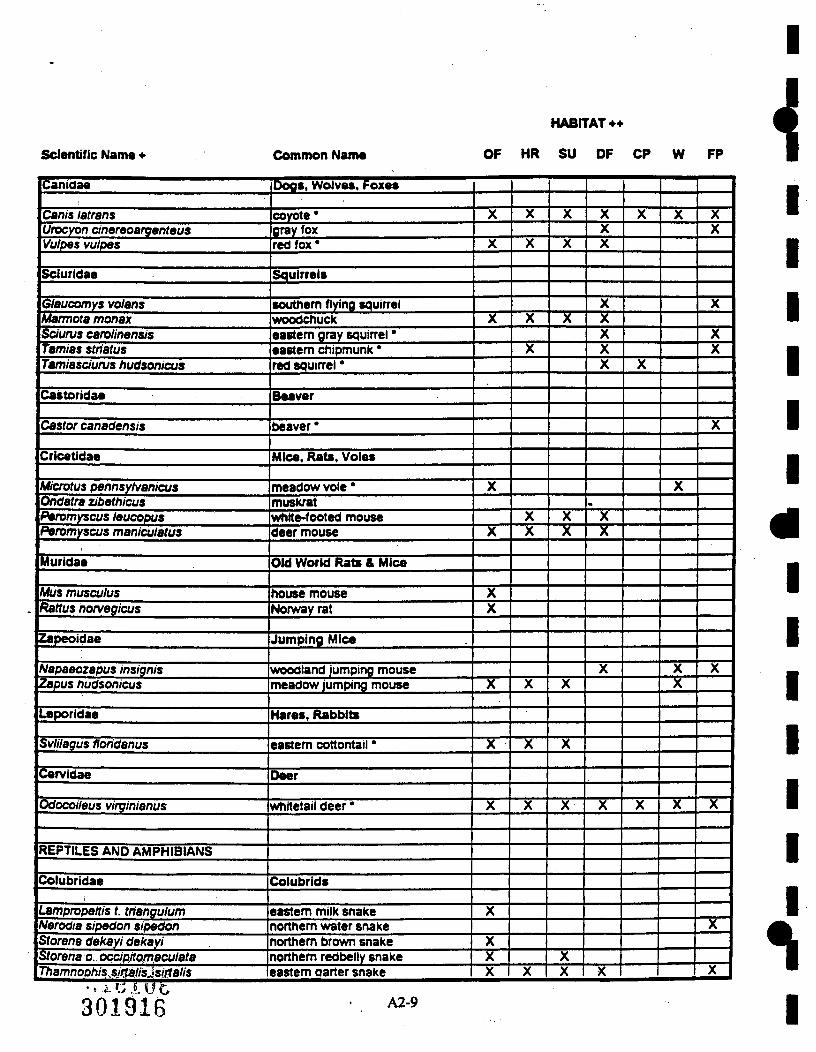
In September 1994 a vegetation and wildlife survey was conducted by Environmental Design & Research, PC (ED&R) for the purpose of identifying vegetative cover, recording wildlife observations and collecting biological samples (ESC 1995b). During that effort five plant communities were delineated within and near the Site (Figure 2-3). These plant communities are summarized in Table 2-5; the wildlife observed during the survey are summarized by these communities in Table 2-6. Complete listings of plant and wildlife species prepared by ED&R are contained in Appendix 2. The information fi-om the survey (ED&R 1995) is described in the following sections.
A total of 118 different plant species were documented on site. The plant communities are dominated by common native and non-native species. No State or Federally listed or proposed endangered or threatened plant species was observed on site nor are any likely to occur (ESC 1995b). The Site has been too disturbed over its history and the conditions conducive to rare plant species are not present. Approximately 126 different wildlife species are considered likely to occur on site; 33 were observed during the survey. All of the wildlife observed or expected to occur in these habitats are common to New York State. No rare, threatened or endangered species were observed nor are they expected to occur on site (NYSDEC 1995). The eastem bluebkd ("Sialia sialis) is listed by NYSDEC as a species of special concem. Occurrence of this species on the Site is unlikely since suitable on-site nesting sites (tree cavities, nest boxes) are not present.
Deciduous Forest
A small (0.6-acre) area along the northem portions of the site is categorized as a deciduous forest dominated by sugar maple (Acer saccharum) and beech (Fagus grandifolia). Other species commonly associated with this type of community include basswood fTilia americana) and black cherry (Prunus serotina). There are smaller tress and shmbs associated with the forest and a variety of common plant species are part of the groundlayer in this area (Aralia nudicaulis. Aster divaricatus. Eupatorium mgosum. Dryopteris intermediay
' • ^ M ' ' il29 2-18 I
This forested area produces botii nuts and fruits that are eaten by a number of wildlife species including birds, deer, squirrels and small mammals. Fallen deadwood in the area serves not only as
ft I 2-19
Figure 2-3 Vegetation Cover Types Tri-Cities Barrel Superfund Site, Fenton, New York (Source: Environmental Strategies Corporation) notaOitSSO
r
cover but provides feeding and foraging sites for small mammals and birds. The value of this habitat could be significant despite its small size.
Conifer Plantation
Along the Site's westem edge, both north and south of 1-88, are evergreen plantings primarily consisting of white spruce (Picea abies) and several other conifer species (Pinus sylvestris. Pinus nigra. Pinus strobus). This area covers approximately 1.7 acres of the Site. The plantation canopy is dense enough to prevent development of a groundlayer. The edge of the plantations contain sprace seedlings, tree saplings and deciduous shmbs as well as old field species.
The dense plantations provide limited habitats to birds because of the lack of understory vegetation. The areas do provide thermal and escape cover for whitetail deer and eastem cottontail and limited food sources (seeds) for red squirrels. The proximity of the plantations to shmb thickets and herbaceous openings do enhance the cover value of the area for a variety of mammals and burds.
Shmb Upland/Old Field
Nearly three quarters of the Site is successional old field and shmbland communities. These communities exist because of the industrial barrel processing activities. They are considered highly disturbed habitats. The old field areas are dominated by common herbaceous species including Canada goldenrod (Solidago canadensis). Kentucky bluegrass fPoa pratensis). clover (Melilotus alba and Melilotus officinalis). Queen Anne's lace (Daucus carota) and wild strawberry (Fragaria virginiana). The dense shmb upland areas are dominated by gray dogwood (Comus foemina). raspberry species and a variety of shrubby plants (Rhus typhina. Rosa multiflora. Syringa vulgaris. Lonicera tatarica). The shmb and old field boundaries are not always distinct. Many old field species occur within and along the edges of the shmb upland areas, while a number of shmb species are scattered within old field areas.
The shmbs and vines in the shmb upland habitat produce berries that provide food for mammals and birds. Hedgerows in these areas provide food and cover as well as travel corridors for whitetail deer, woodchuck, opossum, red fox and the eastem cottontail. The old field areas provide smgmg grounds and feeding areas for a number of bu-d species. The herbaceous vegetation provides not only food but supports the insect populations for several insectivorous songburds. The open meadow area also provides huntmg areas for birds of prey such as the red-tailed hawk (Buteo jamaicensis). the great homed owl (Bubo virginianus) and the American kestrel (Falco sparverius).
I S;E03 :«831
2-20
•ycb m
cfoy
TABLE 2-5 PLANT COMMUNITIES IDENTIFIED AT THE TRI-CITIES BARREL SITE<''>
Community
Deciduous Forest
Area, Acres
0.6
Conifer Plantation 1.7
Location
North of 1-88
Westem - north & soutii of 1-88
Dominant Species
Acer sacchamm - Sugar maple Fagus grandidenta - Beech
Picea abies - White spmce
NJ I
N5
Shmb Upland/Old Field/Hedgerow
Stream/Floodplain 1.2
Wetiand
11.1 Most of Processing Area, South Area Herbaceous: Solidago canadensis - Canada goldenrod Poa pratensis - Kentucky bluegrass Melilotus alba - White sweet-clover Melilotus officinalis - Yellow sweet-clover Fragaria virginiana - Wild strawberry Daucus carota - Queen Anne's lace
Fish Floodplain Semotilus atromaculatus - Creek chub
a
f
h
f I
The presence of stractures in the highly disturbed areas of the site provide cover for snakes, toads and small mammals. Thus areas proximate to buildings or stractures provide forage areas for raptors and other mammalian predators.
Stream and Floodplain
Although there is no vegetation within the boundaries of either tributary or Osbome Creek, there is a well-defined floodplain along the creek. The floodplain is dominated by sycamore (Platanus occidentalis) and Japanese bamboo (Polygonum cuspidatum). The groundlayer species in this area include smartweeds, tearthumb, blackbindweed, moneywort, swamp buttercup, garlic mustard, soap wort and beggar-ticks. Shrabs along the tributaries mclude silky and gray dogwood (Comus amomum. Comus foemina) and willows. The ground vegetation includes forget-me-not (Myosotis scorpioides). blue vervain (Verbena hastata), Joe-pye weed (Eupatorium maculatum). boneset (Eupatorium perfoliatum). tearthumb (Polygonum sagittatum) and New England aster (Aster novae-angliae).
Although this area is a relatively small portion of the site (8%), it does represent habitat of significant value primarily because of the presence of water. Osbome Creek supports fish species including white sucker, common shiner and creek chub. In addition beaver are very active in the area. The floodplain area shrabs provide food and cover for a variety of bird and mammalian species. Intermittent surface water bodies (i.e., the tributaries) can provide seasonal habitat for breeding amphibians such as the American toad (Bufo americanus) and the northem spring peeper (Pseudacris c. cracifer).
Wetiand
The wetiand just south of 1-88 where the West Tributary flows under the highway is dominated by cattail. The wetiand associated with the man-made pond North of 1-88 is similar to a shallow emergent marsh. The dominant vegetation includes sedges, smartweeds and rashes.
Along with providing a limited source of water, wetiands support abundant insect populations for songbirds. The areas on the Site, however, do not appear to support typical marsh wildlife includmg waterfowl, wading birds or muskrat (ED&R 1995).
2.6 Exposure Pathway Analysis
The purpose of the exposure pathway analysis is to determine what exposure pathways are complete at the Site in order to focus the risk assessment on pathways where ecological resources are co-located with contamination. An exposure pathway describes the course of contaminant movement from a source to an exposed organism. A complete exposure pathway, therefore, usually consists of the following:
• A source and mechanism of chemical release • A transport medium • An exposure point (environmental medium and location) where an exposed population
contacts the contaminant • An exposure route by which the chemical enters the exposed organism's body or tissue
Only complete or potentially complete exposure patiiways need to be evaluated in order to determine the potential for ecological threats posed by the Site. A conceptual site model (Figure 2-4) was developed with existing site information summarizes the likely exposure pathways at the Site.
2-24
Sources. Releases and Transport Mechanisms
During industrial activities at the Site, leaks and spills probably occurred during dram handling activities, which led to release of contaminants to the surrounding soils. Disposal of wastewater from dram cleanmg and reconditioning activities durectiy to the ground surface or to unlined lagoons would also contribute to soil contamination. Opeiration of the incinerator probably generated releases, especially of particulates, that redeposited in the general site vicinity.
Contaminant migration subsequentiy occurred via movement of leachate or particulate matter from surface or subsurface soil into groundwater. While there is no information on the presence of seeps where groundwater might reach Osbome Creek, contaminants in groundwater could be discharged into the surface water of Osbome Creek and partition to the sediments or remain in the water column. The primary contaminants in groundwater are VOCs. These chemicals were not detected in surface water or sediment, nor would they be expected to. If VOCs are being transported to surface water bodies, it is likely that they are volatilizing and, thus, do not represent a significant route of exposure. Additionally, contaminants can enter the surface water through ranoff from surface soil to the
intermittent streams on site. Particulates in surface water can settle to the sediments and adsorbed contaminants on sediments can redistribute to the water column. Contaminated sediments and surface water can be further transported to downstream areas and eventually reach Osbome Creek.
Contaminants that persist in soils can be taken up by the roots of vegetation thereby entermg the herbivore food chain. Invertebrates living within the soil can also accumulate soil contaminants, thus entering the food chain for animals that feed on them.
Some organic contaminants are expected to volatilize from either soil or water, although this is not likely to be a dominant release mechanism. Fugitive dust emissions are not likely to be important at this site given the vegetative cover in most Site areas.
Exposure Points
There are a variety of organisms that could be potentially exposed to contaminated media at tiie Site. They include:
Plants growing in contaminated soil Soil and aquatic invertebrates Transient and resident wildlife (amphibians, reptiles, mammals and birds) Fish in Osbome Creek
Terrestrial populations can come in contact with contaminated surface soils in any of the three areas of the Site (the Processing Area, the South Area, the North Area) and could certainly forage across these broad areas. For the purposes of this risk assessment, however, the maximum concentrations of
1
4
• " ? ^ r-'iSi ^ y tiS. n-^ii T ^ H
J Kjr V-- .»l. w^ «> Z - Z J ^ H
Pttnary Secondary P i t a i r r Rcteaic gccsndai7 Rdeau Tcrdaiy Sowrce Mechanhm Sogrce Mechanbm Soorct
Poteadtfy l i p o i r t Icoloclcal Popuhtfoni Releasc/TraMport Ispotnrc Ixpafsrc
> ftUnwy it not ootnpklB; OMlwlian not loqubod. « Mh»By i» Of ooJd be uJiiHikle; howc^g. pahoayjodgBd to be miliar. > fttlwioy il or oould be comffale; petlwy judged to be eignificail.
I I I I I I I I I I I I I I I I I I I I I IHIIII I I—
liaiiiiSiii
the chemicals of potential concem detected m shallow (i.e., 0-2 feet) soils was used to represent each exposure point. This is an extremely conservative position, since it assumes that an animal will be consistentiy exposed to the maximum concentration at a given sampling point, even though terrestrial populations are expected to randomly visit across site areas within a given home range. This conservatism is required by USEPA (1995) and when combined with assumptions regarding bioavailability (100%) and area use factors (100%) results in very conservative estunates of potential risk. This methodology assures that it is unlikely that the preliminary screening developed in this risk assessment would miss potential ecological threats.
Aquatic populations can come in contact with surface water and sediments in the tributaries, Osbome Creek and in the man-made pond in the North Area. Exposure point concentrations were not calculated for these media. Analysis of risk for these exposure points was accomplished on a location-by-location basis.
Exposure Routes
The relevant exposure routes at the Site include:
^
•
Direct contact with and absorption of contaminants in surface water, sediment and soil Uptake of contaminants from soil plants, invertebrates) Ingestion of contaminated surface water, sediment and soil Ingestion of contaminated organisms, both plants and animals (food chain accumulation)
Given the chemicals of potential concem, then: likely fate and transport and the levels of contamination across site media, it is likely that the pathways of major importance are those involving ^ m food chain accumulation. Inhalation of volatiles and dermal contact witii soil are likely to be minor ^ H pathways for terrestrial receptors when compared to food cham accumulation. The intermittent nature of the tributaries, and the fact that contamination does not appear to have reached Osbome Creek suggest that surface water pathways could be relatively minor. Due, however, to the highly hydrophobic nature of contaminants that have entered the tributaries via runoff, exposures to sedunents could be significant.
30183B y
2-27 I
p
b
f I
3.0 PRELIMINARY EVALUATION OF ECOLOGICAL EFFECTS
There are a variety of potential ecological adverse effects that can be related to chemical contamination at the Site. These can be arranged hierarchically, with impacts to individual exposed organisms at the bottom and adverse effects accumulating at higher levels of ecological organization.
Potential adverse impacts to individual organisms (e.g., terrestrial or aquatic vegetation and wildlife) exposed to contaminants of potential ecological concem include the following:
• Direct toxicity (reduced survival, increased mortality) • Sublethal effects (physiological changes, reduced growth and reproduction, tissue
anomalies, etc.) • Changes in behavior due to the presence of contaminants (including site avoidance) • Increased susceptibility to predation and disease as a result of sublethal effects.
As highly lipophilic contaminants move to higher trophic levels via bioaccumulation and biomagnification, toxic effects can become apparent to other organisms that do not come in durect contact with site contamination.
Indirect effects at higher levels of ecological organization could result from adverse effects at the mdividual level. These include:
• Adverse changes in population characteristics of resident species • Adverse changes in species composition, species diversity and food web complexity • Reduced biomass and productivity
The following sections summarize information on potential hazards associated with the contaminants detected at the Site that have been identified as chemicals of potential ecological concem.
3.1 Known Adverse Effects of Chemicals of Potential Concem
Information on the adverse effects due to exposure to each chemical of potential concem is summarized on a chemical-by-chemical basis in Appendix 3. In most instances adverse effects information for the common wildlife species observed or expected to use the Site is generally lacking for the chemicals of potential concem. Therefore the toxicity data for common test organisms are used as surrogates. The data in Appendix 3 includes dose (intake) levels that either cause no adverse effect (NOAEL) or the lowest dose observed to cause an adverse effect (LOAEL) in a laboratory animal, usually a rat or mouse. For illustration purposes these data for typical mammalian species are summarized in Table 3-1. It is apparent from this summary table that the Site contaminants are capable of providing an array of toxic effects in ranges of dose levels that cover many orders of magnitude.
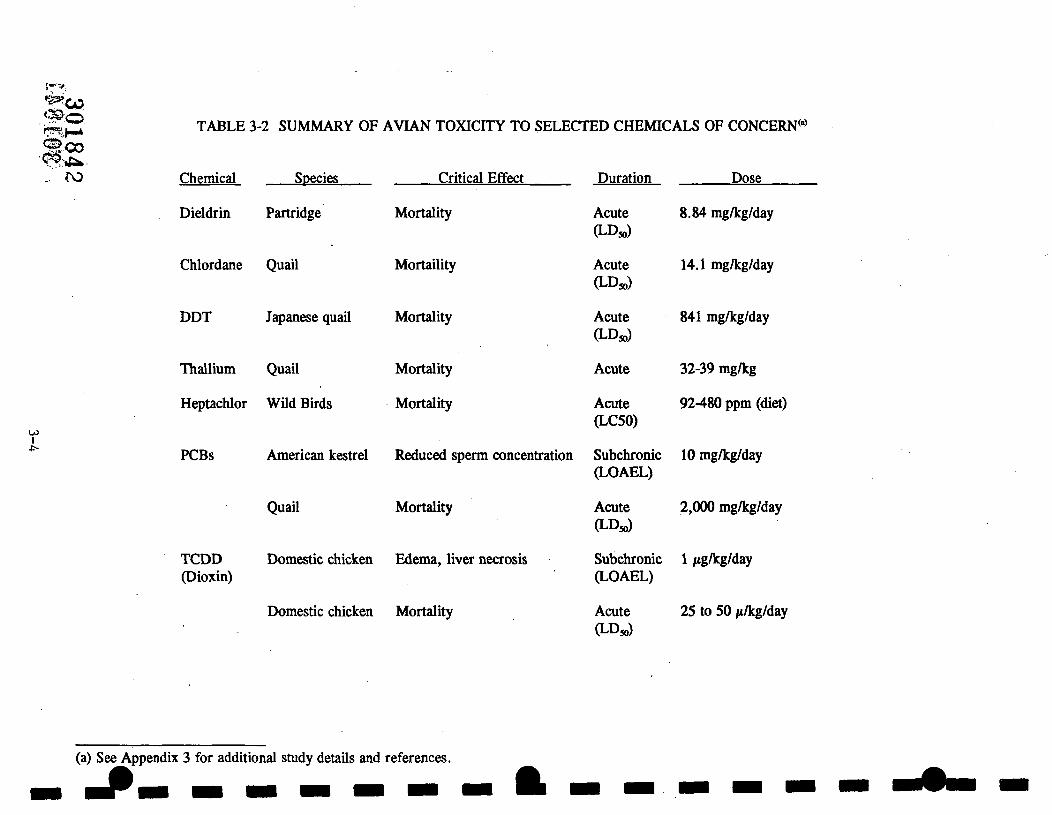
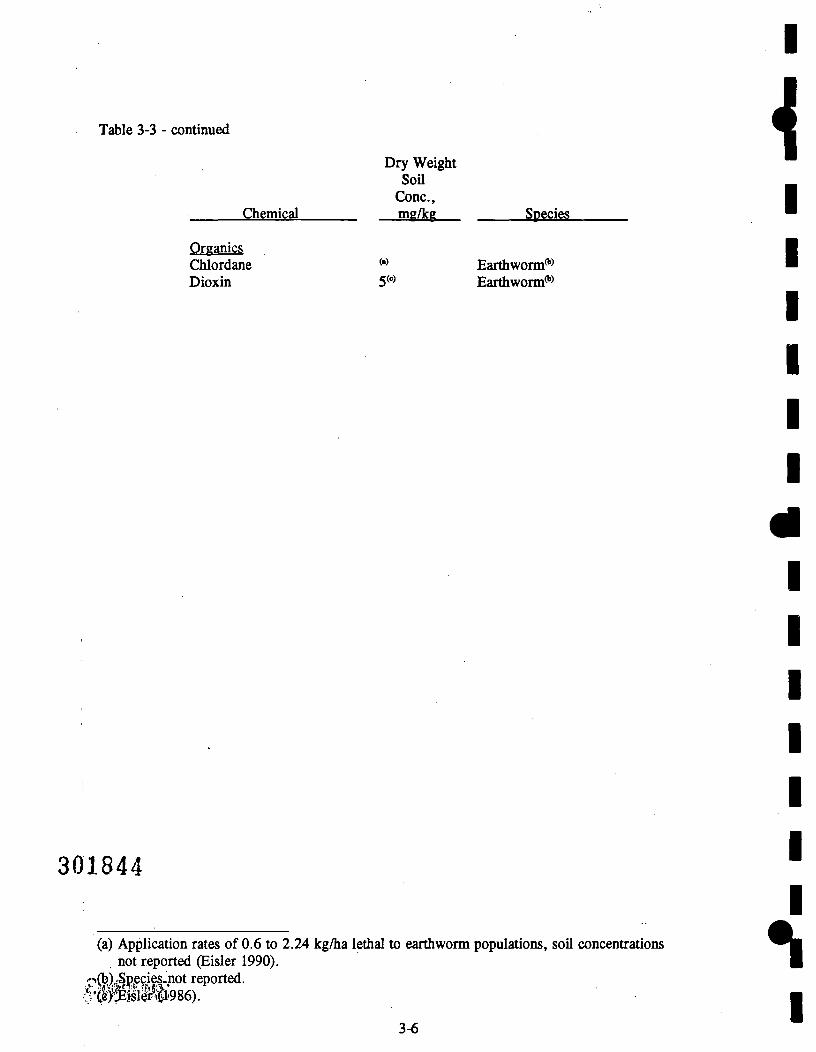
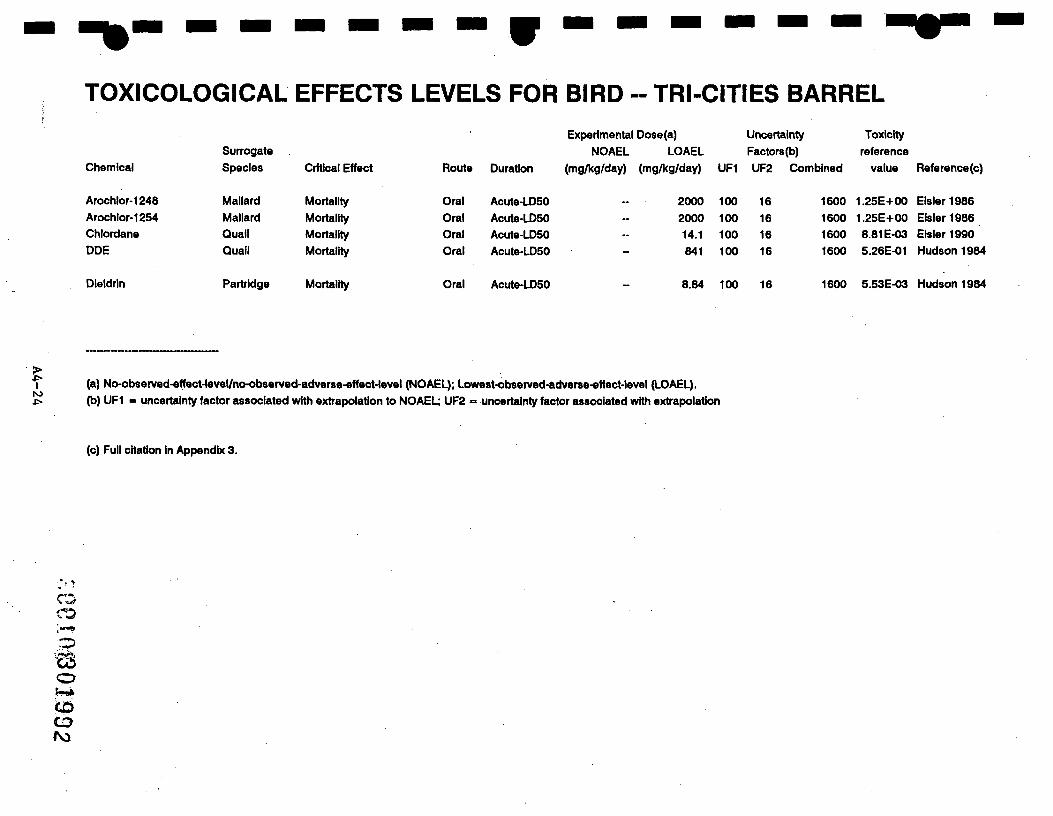
Toxic effect data are even more sparse for nonmammalian species. Limited data for certain avian species are summarized in Table 3-2. For the most part these data report lethal doses (LDjo) and information is generally lacking on long-term, chronic effects for most of the chemicals of ecological concern. For many terrestrial mvertebrates even the most basic data on lethal concentrations is lacking. Table 3-3 summarizes information on the highest levels of contaminants found to cause no adverse effect in experimients utilizing soil and sediment invertebrates. '•^••'^C^% ^ ^ i S ; ' mm
3-1
coo
1 ho
TABLE 3-1 ORAL NOAEI„S AND LOAELS FOR SELECTED MAMMALIAN SPECIES^'^
\ (a) Application rates of 0.6 to 2.24 kg/ha lethal to earthworm populations, soil concentrations
not reported (Eisler 1990). C^Ql)il?F?ifl"Pot reported. $'<iSill 5986). I
3-6
r I
Development of Wildlife Toxicity Reference Values
Because both species-specific toxicity information and chronic studies are often lacking, it is necessary to develop toxicity reference values based on available toxicity information. This requires extrapolation, not only from acute or subchronic studies to long-term no-effect levels, but species-to-species extrapolations. This is accomplished by the ^plication of uncertainty factors to reported literature levels that are LDjo values, NOAELs or LOAELs. The methodology proposed by Ford et al. (1992) or similar schemes can be used to calculate a toxicity reference value for terrestrial wildlife. Ford et al. (1992) applies an uncertainty factor from 5 to 100 to calculate a chronic NOAEL from reported literature levels. Uncertainty factors of two (each) are then utilized to account for intraspecies variation, species, genus, family/order and threatened or endangered species extrapolations. The literature value is thus divided by the product of all uncertainty factors (from 2 to 3,2(X)). Table 3-4 provides additional information on the Ford et al. (1992) methodology adapted for use in this assessment.
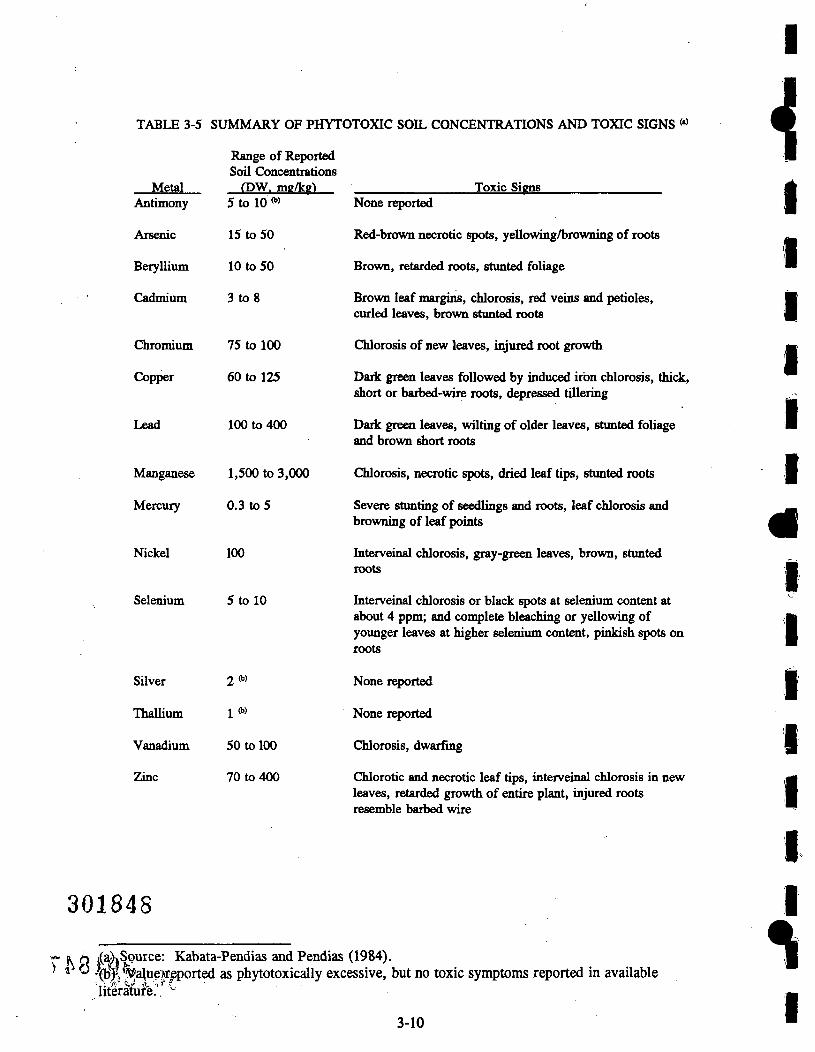
3.2 Phytotoxicity
There is limited information regarding the toxicity of the chemicals of potential ecological concem to plant species growmg on the Site. Phytotoxic levels of inorganic chemicals that can produce symptoms of toxicity in plants have been reported in similar species. Table 3-5 summarizes those levels and the accompanying symptoms observed in common cultivars, primarily agricultural crops.
The information on effects of organic chemicals present in toxic waste on plants growing in "wild" or old field communities is virtually unknown. '
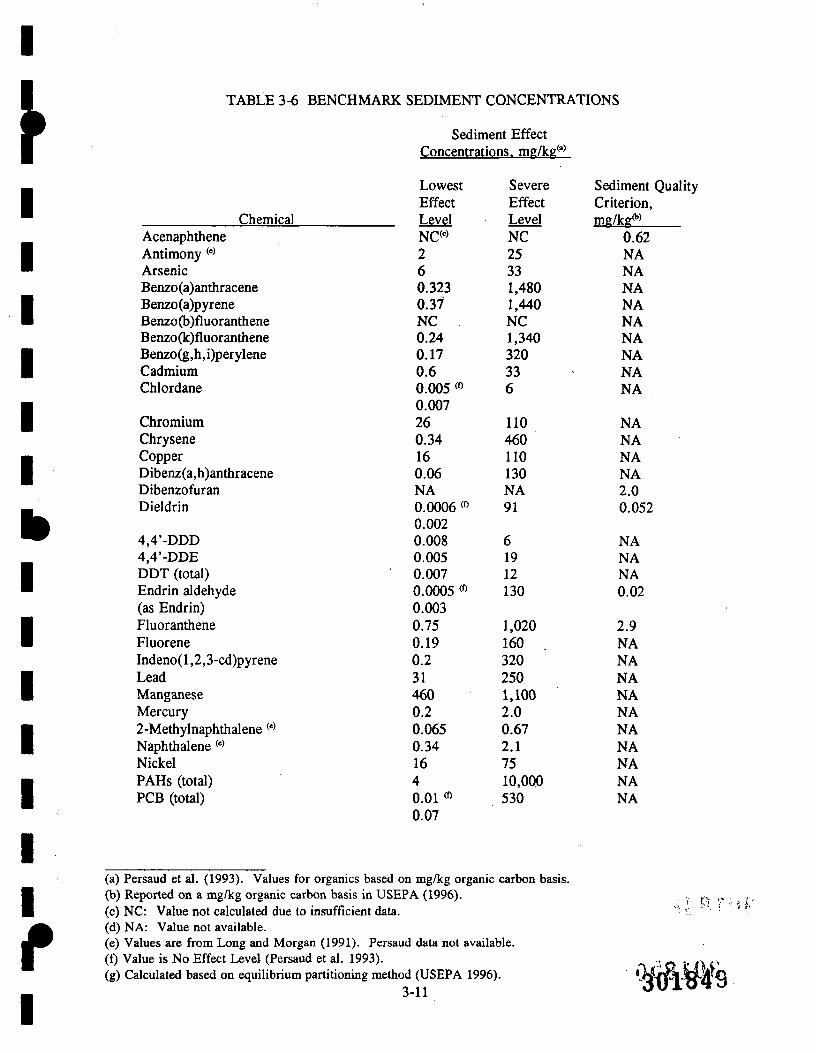
3.3 Surface Water and Sediment Benchmarks
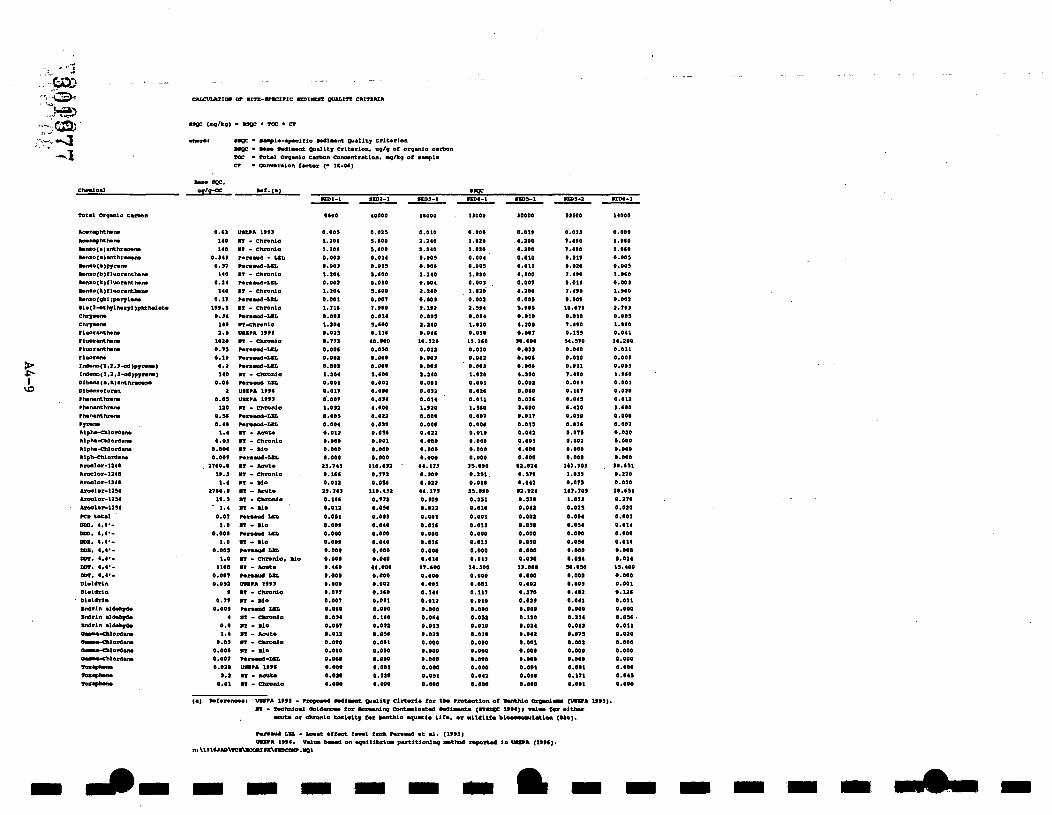
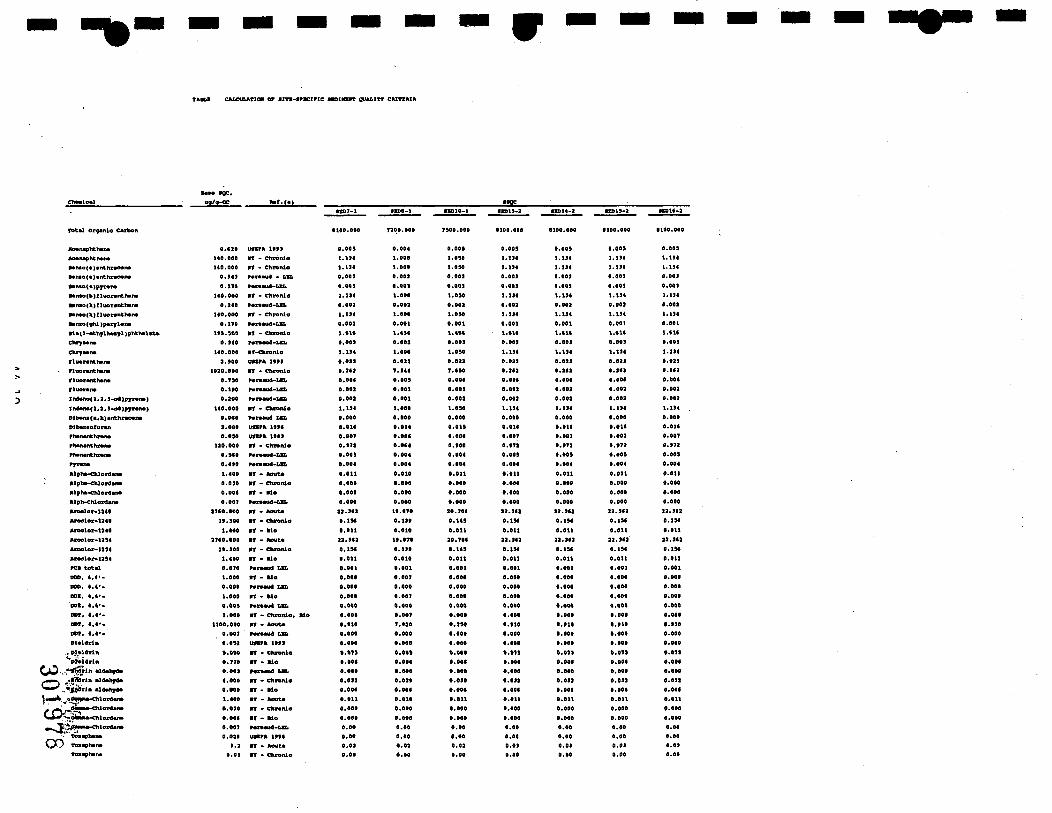
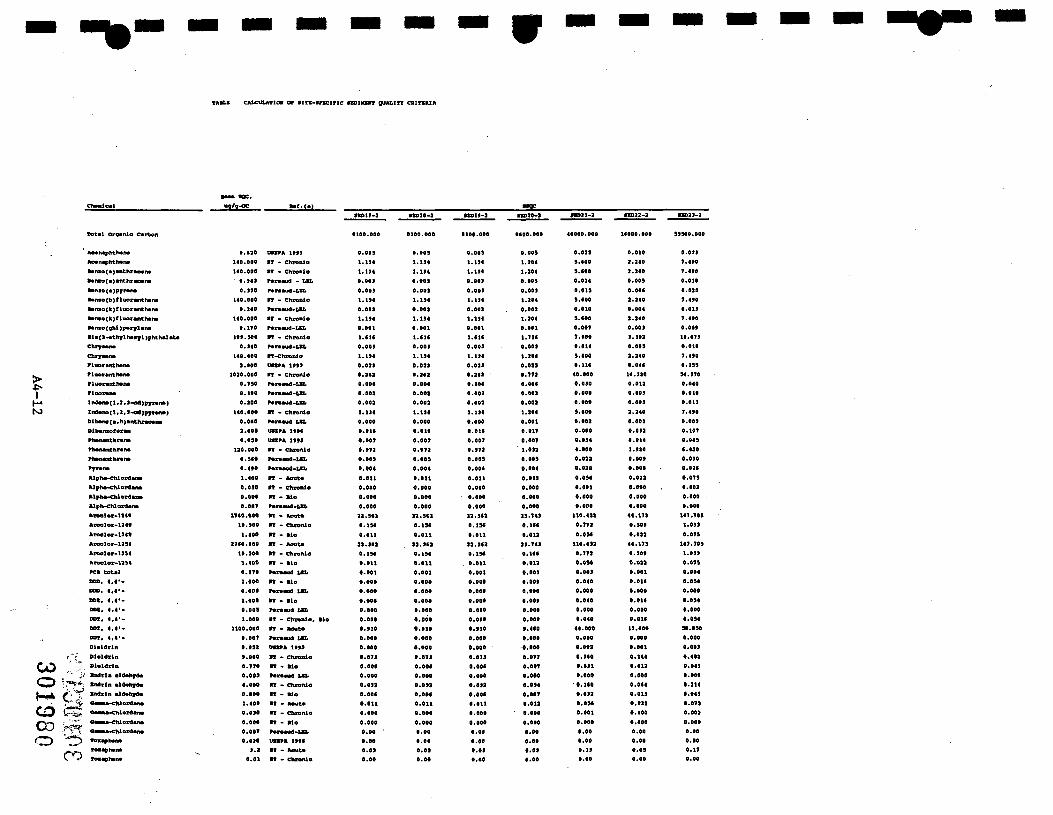
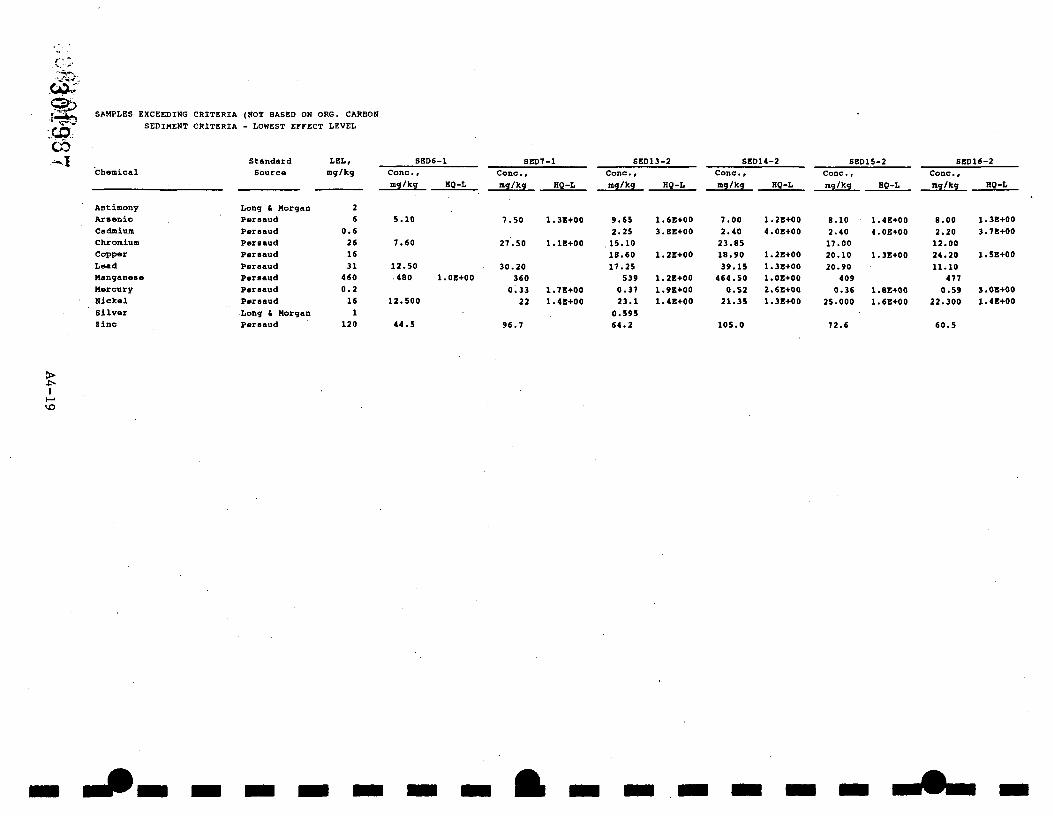
Benchmark contaminant levels that could produce toxic effects in aquatic organisms have been developed for both sediments and water. Several efforts have been made to summarize and determine the levels of contamination in sediment that result in biological effects. Persaud et al. (1993) developed a set of guidelines for use by the Ontario Ministry of the Envu-onment and Energy. This guideline established three levels of effect. The No Effect Level is the level at which the chemicals do not affect fish or benthic organisms. At this level, it is assumed that there is no transfer through the food chain and no water quality effects are expected. The Lowest Effect Level indicates a contamination level that has no effect on the majority of benthic organisms; the Severe Effect Level indicates that the sediment is heavily polluted and is likely to affect the health of benthic communities. The development of these values utilizes a battery of methodologies including partitioning approaches and effects-based threshold approaches utilizing multiple observations and species. Table 3-6 summarizes these values. The values for organic compounds are reported on a mg/kg organic carbon basis and are subsequentiy adjusted for Site comparisons based on reported organic carbon measurements from the Remedial Investigation.
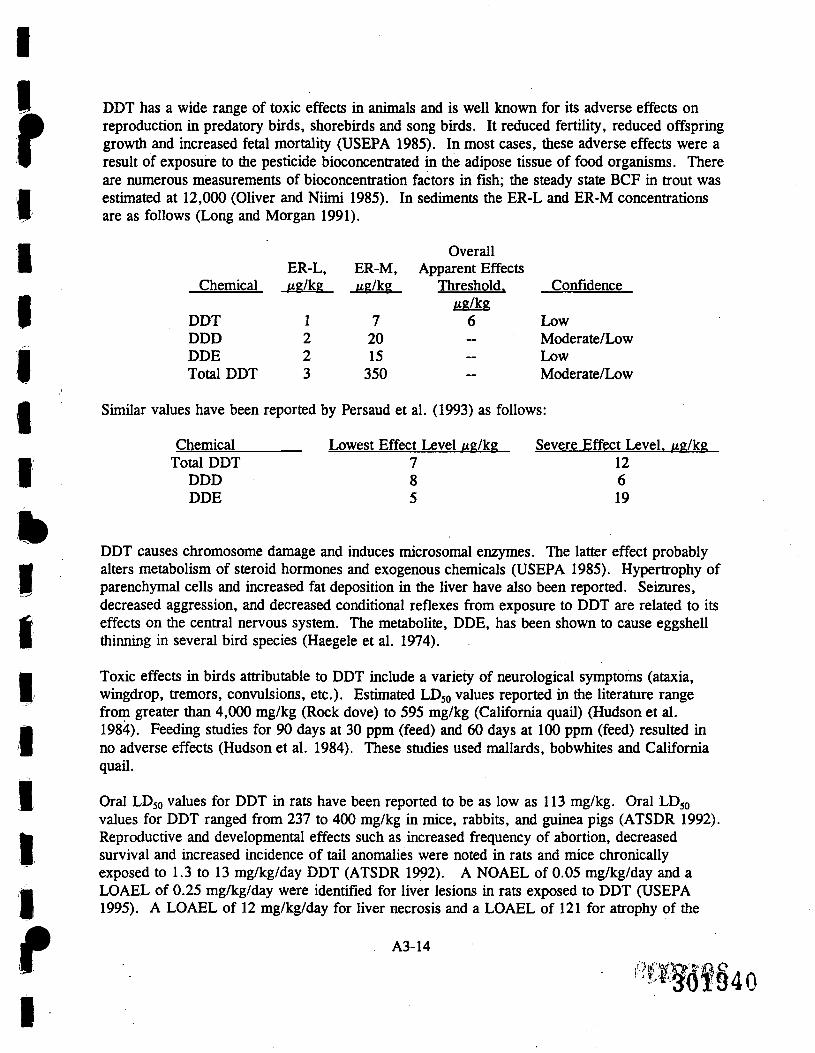
In a sunilar effort, sediment concentrations were developed for evaluating biological effects of sediment contamination by the National Oceanic and Atmospheric Administration from data collected for the National Status and Trends Program (Long and Morgan 1991). Two of these concentrations, the Effects Range-Low (ER-L) and Effects Range-Median (ER-M) represent, respectively, the lower lOth percentile and 50th percentile concentrations of the range over which adverse effects have been observed at contaminated sites. The benchmark sediment concentrations are based on a wide range of adverse biological effects (acute and chronic toxicity, organism abundance) m a diverse group of organisms occurring in marine, estuarine and freshwater environments. These values, for chemicals not included in Persaud et al. (1993), are listed in Table 3-6. QQ CI T (^>t!^
3-7
In addition, the USEPA has developed sediment quality criteria (SQC) for four of the chemicals of potential concem: acenaphthene, fluoranthene, phenanthrene and dieldrin (USEPA 1993a,b,c,d). The criteria are intended to be used to assess the severity and extent of contamination for protection of aquatic organisms. A similar approach has been used by USEPA (1996) to develop a criteria for toxaphene. These values are also included in Table 3-6, on a mg/kg organic carbon basis. The State of New York (NYSDEC 1994) uses this methodology to develop sediment criteria for nonpolar organic compounds or classes of compounds (Table 3-7). These criteria are developed for acute and chronic protection of benthic aquatic life and for wildlife bioaccumulation using State of New York water quality criteria and assumptions regardmg residues of the chemical in the tissues of piscivorous wildlife.
Table 3-8 summarizes ambient water quality criteria and New York water quality standards for the protection of freshwater aquatic life for those chemicals detected in site surface waters. Some of these criteria are dependent on water hardness.
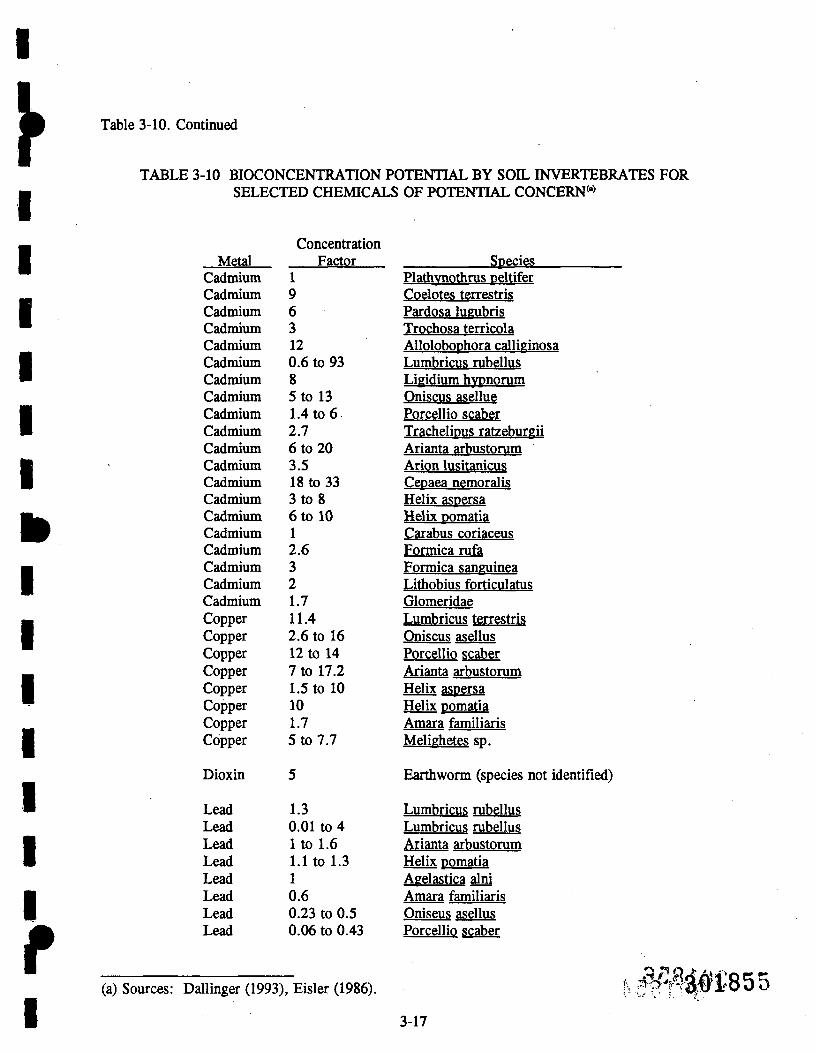
3.4 Bioaccumulation Potential
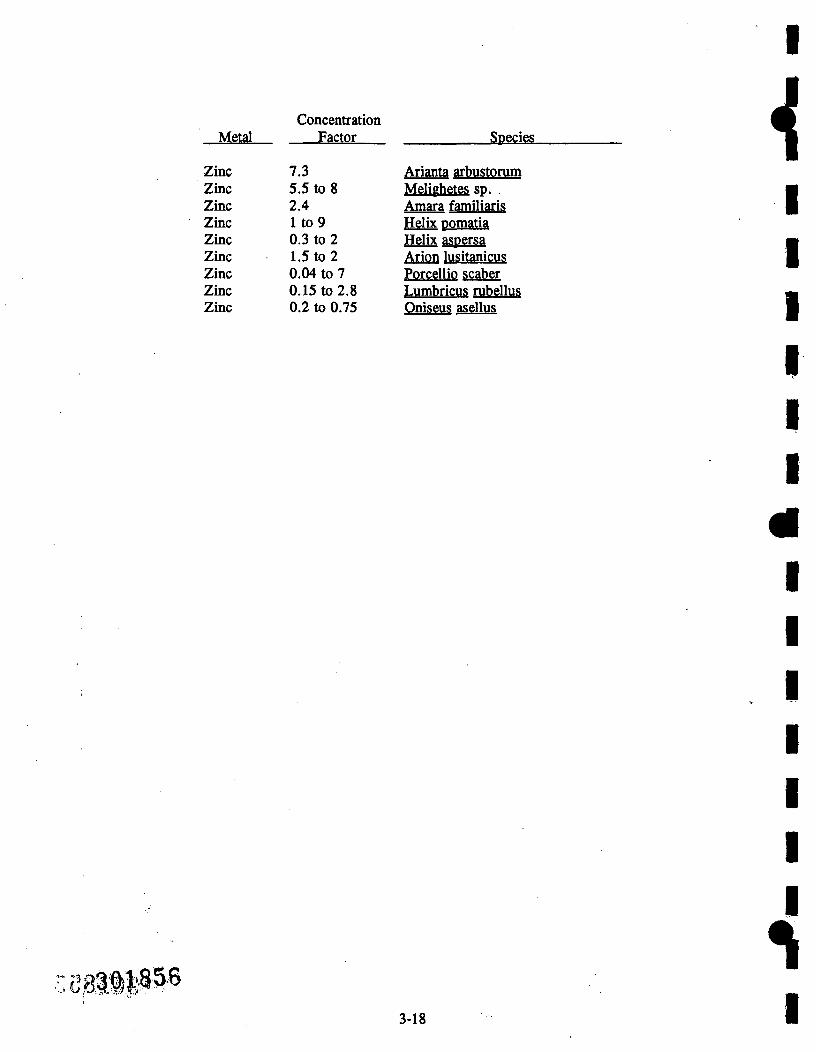
Limited information is available on bioaccumulation factors for soil mvertebrates. Table 3-10 summarizes available information for a few chemicals of potential concem. Table 3-11 provides uptake ratios by aquatic organisms for those chemicals of concem detected in Site surface waters.
I I I I I The process by which an organism takes up chemicals from a contaminated medium is termed
bioaccumulation. Thus toxic effects can occur in organisms that are not durectiy exposed to contaminated site media. The bioaccumulation process can occur in a variety of modes (e.g., soil to _, plants, soil to invertebrates, surface water to aquatic organisms). In general bioaccumulation occurs M to a greater extent in aquatic systems than in terrestrial ones.
The chemicals of potential concem bioaccumulate to varying degrees. For the most part uptake rates Mm into plant material are not available for many chemicals. There is experimental evidence, however, ^ ™ indicating that some organic compounds are very good bioaccumulators. In the case of dioxin. Young (1981) measured dioxin levels in roots at levels very similar to soil levels (a BCF of 1.0). • Bell (1992) collected samples of soil and plants from a hazardous site in Missouri and reported BCFs • rangmg from 0.1 in Taraxicum officinale to 16 in Festuca rabra. The uptake of PAHs into plants has been measured and is dependent on molecular size. However, plants are capable of reducing complex aromatic compounds into simpler units. It is not known if these metabolites are more or less toxic than the parent compounds. Table 3-9 summarizes predicted soil-to-plant uptake factors for the chemicals of potential concem calculated by using a regression equation developed by Travis and Arms (1988) and Briggs et al. (1982). In general, these uptake factors are fairly low for many organic compounds and nonessential inorganic chemicals.
I i I I
Some chemicals tend to accumulate to higher concentrations at higher levels in the food web. Table 3-12 summarizes information on the biomagnification potential of selected chemicals of ^ potential concem into higher trophic level organisms. • There appears to be a significant potential for bioaccumulation and biomagnification through the food _ chain at tiie Site. Garten and Trabalk (1983) concluded that organic chemicals with K^ values • greater than 3.5 significantiy bioaccumulate from food in mammals and birds. Inspection of * Table 2-4 indicates that most organic chemicals of potential ecological concem at the Site can be Qonsidered potential bioaccumulators. The detections of PCBs, pesticides and some PAHs in Site
.-• O eattiiiworm and plant samples indicate that bioaccumulation is occurring.
^301846 3-8 I
TABLE 3-4 APPLICATION OF UNCERTAINTY FACTORS AND THEIR VALUES USED TO DERIVE ECOLOGICAL TOXICITY REFERENCE VALUES
FROM CRITICAL TOXICITY VALUES *'
1. Application
Usmg the method of Ford et al. (1992), the uncertainty in estimating a wildlife toxicity reference value (TRV) is dominated by endpoint differences between toxicity tests using laboratory animals (test species) and chronic NOAEL dosage regimes (UFl) and phylogenetic differences between the test and target species (UF2). The product of these two uncertainty factors (UFl x UF2) results m a total uncertainty factor by which the experimental dosage is divided to obtain tiie TRV.
Selenium 5 to 10 Interveinal chlorosis or black spots at selenium content at about 4 ppm; and complete bleaching or yellowing of yoimger leaves at higher selenium content, pinkish spots on roots
SUver
Thallium
Vanadium
Zinc
2 <••'
I (b)
50 to 100
70 to 400
None reported
None rqxjrted
Chlorosis, dwarfing
Chlorotic and necrotic leaf tips, interveinal chlorosis in new leaves, retarded growth of entire plant, injured roots resemble barbed wire
301848
•«- & A j(a)|Source: Kabata-Pendias and Pendias (1984). ' i O -'(b^'^a|ue>reported as phytotoxically excessive, but no toxic symptoms reported m available
(a) Persaud et al. (1993). Values for organics based on mg/kg organic carbon basis. (b) Reported on a mg/kg organic carbon basis in USEPA (1996). (c) NC: Value not calculated due to insufficient data. (d) NA: Value not available. (e) Values are from Long and Morgan (1991). Persaud data not available. (f) Value is No Effect Level (Persaud et al. 1993). (g) Calculated based on equilibrium partitioning method (USEPA 1996).
3-11
I' f' r * i y
%wfe
Table 3-6 - continued
Chemical Phenanthrene Pyrene Silver («> Toxaphene Zinc
Sediment Effect Concentrations, mg/kg^^^
Lowest Severe Effect Effect Level Level 0.56 950 0.49 850 1 2.2 NA NA 120 820
(a) Source: NYSDEC (1994). (b) Reported value on a mg/kg organic carbon basis. (c) Value also applies to benzo(a)anthracene, benzo(b)fluoranthene, benzo(k)fluoranthene, chrysene and indeno(l,2,3-cd)pyrene. (d) Value is Lowest Effect Level established for metals contamination. (e) Value is Severe Effect Level established for metals contamination. ,•.5 i'.« •.•U>i, i*^-i-^ ' :
(a) Source: USEPA (1995). (b) Source: NYCRR (1991), for Class C waters. (c) Value not available. (d) Values are hardness dependent (100 mg/L CaCOj used). (e) Value calculated usmg Great Lakes Water Quality Initiative Tier n methodology (USEPA 1996).
.3#IM ' k
3-14 I
TABLE 3-9 BIOCONCENTRATION FACTORS FOR SOIL TO PLANT UPTAKE*'
(a) References: For inorganics values are from Baes et al. (1984), adjusted for wet weight. For organics, calculated from Travis and Arms (1988) and Briggs et al. (1982). See the Human, ^ r<. .>. Health Evaluation, Appendix 3 (Life Systems 1995) for detailed calculations. Ii S 8 ^'tfP'^ " ' '
1 9 6 3 12 0.6 to 93 8 5 to 13 1.4 to 6 2.7 6 to 20 3.5 18 to 33 3 to8 6 to 10 1 2.6 3 2 1.7 11.4 2.6 to 16 12 to 14 7 to 17.2 1.5 to 10 10 1.7 5 to 7.7
5
1.3 0.01 to 4 I to 1.6 1.1 to 1.3 1 0.6 0.23 to 0.5 0.06 to 0.43
TABLE 3-12 BIOMAGNIFICATION FACTORS FOR SELECTED CHEMICALS OF POTENTIAL CONCERN*'
Biomagnification Factor*' Chemical
Aldrin
Chlordane
DDT
Dieldrin
Heptachlor
Beef
2.0
0.1 to 0.5
0.9
1.6 to 3.0
0.4 to 0.6
Swine
1.4 to 3.8
0.3 to 0.9
0.4
0.8 to 2.7
0.4 to 0.5
Sheep
—
0.8
—
—
TCDD (dioxm) 3.5
(a) Source: Kenaga (1980). (b) Defined as the ratio of the chemical concentration in consumer to the concentration of the
chemical in the food.
1 ';'?:'tv.':. 3-20 I
f I
4.0 SCREENING-LEVEL RISK CALCULATIONS
A combination of ^proaches is necessary in order to evaluate the potential for adverse effects to ecological receptors that could be exposed to chemicals of potential ecological concem at the Site. Each ^proach listed below combines a complete exposure pathway described in Section 2.6 with an ecotoxicity value or benchmark as described in Section 3.0. The resulting analysis indicates the potential for ecological risk at the Site and provides the information for endpoint selection.
The hazard quotient (HQ) methodology is used to interpret the results of most of the approaches presented in tiiis screening risk assessment. An HQ is the ratio of a potential exposure level to an ecotoxicity value or benchmark and is expressed as follow:
Both the environmental concentration and the benchmark concentration are expressed in the same matrix of concem (i.e., food, water, etc.). An HQ greater than 1.0 indicates that the contaminant concentration is at a level where adverse effects are likely to occur. Since there is considerable uncertainty in both terms of the equation, the HQ model should be viewed more as a "pass-fail" criterion in tiiis preliminary, screening evaluation rather than a strict quantitative expression of risk.
For the Site, six approaches were selected to evaluate the risk potential of the complete exposure pathways. These are:
• Comparison of measured soil concentrations to soil concentrations known to be phytotoxic
• Comparison of measured soil concentrations to soil levels known to be toxic to invertebrates
• Comparison of measured sediment concentrations to sediment levels known to be toxic to aquatic populations
• Comparison of measured surface water concentrations to surface water levels known to be toxic to aquatic populations
• Comparison of contaminants ingested from soU by wildlife to toxic intake levels
• Evaluation of the bioaccumulation of soil contaminants through the likely food chains at the Site by estunating intakes of contaminated food to levels toxic to the consumer
4.1 Evaluation of Soil Toxicity to Terrestrial Plants
The potential for phytotoxic effects in plants growing in soil contaminated with inorganic and organic contaminants at the Site was examined by comparing soil concentrations reported in the literature as toxic to plants (Table 3-5). If the concentration of a chemical in a site soil sample is less than a literature phytotoxic concentration, no adverse impacts related to phytotoxicity are expected at that location. Table 4-1 presents the results of this comparison, utilizing the maximum concentrations detected in a Site area soil sample (0 to 2-ft)ot depth). It should be noted that the detectiofiJRmit| *;S
4-1 Ocatli5[;59
TABLE 4-1 SCREENING ANALYSIS FOR PHYTOTOXICITY
Toxic Soil Maximum Site Soil Concentration, mg/kg^' Chemical
(a) From all soil samples (0-2 ft.) collected in each area duimg Phases I - m of the RI. (b) Indicates an HQ > 1.0, based on higher end of range if level expressed as a range. (c) ND = Antunony not detected in samples from this area (detection limit 6.5 to 7.6 mg/kg). (d) Maximum site concentration falls within phytotoxic range.
\
•cSo^fiiiifRn 4-2 I
f
antimony (6 to 7 ppm) is within the range of reported phytotoxically excessive soil levels (5 to 10 ppm). There is, therefore, some uncertainty about the actual levels of antimony that could be present in soil samples reported by the laboratory as nondetects. There does not appear to be any relevant information concerning phytotoxic levels for most organic compounds. Therefore, screening-level estimates cannot be developed for organic chemicals of potential concern. -
There is a potential for plants growing in Site soil locations to exhibit the signs of phytoxicity for each metal evaluated except selenium, nickel and vanadium. Most exceedances occur in the Processing Area and are not widespread, but sporadic. For instance, arsenic and beryllium concentrations exceed the phytotoxic level in only two locations in the Processing Area. Chromiimi, zinc, mercury and lead exceedances were somewhat more widespread (10, 38, 19, and 15 samples, respectively). Antimony was detected in 38 Processing Area samples above the reported phytotoxic level (the lowest detected value was 5.8 ppm).
In South Area soils antimony, cadmium, lead, manganese, mercury, silver and zinc appear to be of concern. In North Area soils only manganese, mercury, thallium and zinc were reported at levels that could be considered phytotoxic.
The ecological survey undertaken at the site did not document any observed areas of stressed vegetation. With the exception of the area near the buildings, vegetative cover appeared to be healthy. The physical dismrbances associated with the industrial/commercial activities in the Processing Area would be a more likely significant stressor than the chemical soil contamination.
4.2 Evaluation of Invertebrate Toxicity
Soil invertebrates (worms, snails, slugs, insects, mites, etc.) are important components of terrestrial communities. Although there are no survey data available on the presence of soil invertebrates, literature values are available for some of the chemicals of potential ecological concern to evaluate the potential for toxic effects to soil invertebrates likely to be present at the Site.
Seven metals, chlordane and dioxin are known to be toxic to soil invertebrates. No information was found in the literature on invertebrate toxicity to other chemicals of concern. Table 3-3 listed the highest soil concentrations that produced no adverse effects in laboratory experiments. A comparison was made between these soil NOEC and concentrations in site soil samples (Table 4-2).
The results of this comparison indicate that lead, chromium and zinc were detected in Site soils at levels that exceed the highest reported NOEC concentrations. There is considerable uncertainty regarding the tme, realistic no-effect levels of these metals in Site soils, especially since bioavailability and other soil parameters are important factors to consider in invertebrate toxicity. The NOEC value reported for chromium is extremely low and niay not be representative of site soil conditions (versus laboratory conditions). Bioassay soil studies utilizing indigenous soil invertebrates and Site soils would be needed to confirm the potential toxicity indicated by this simple comparison.
4.3 Evaluation of Sediment Toxicity
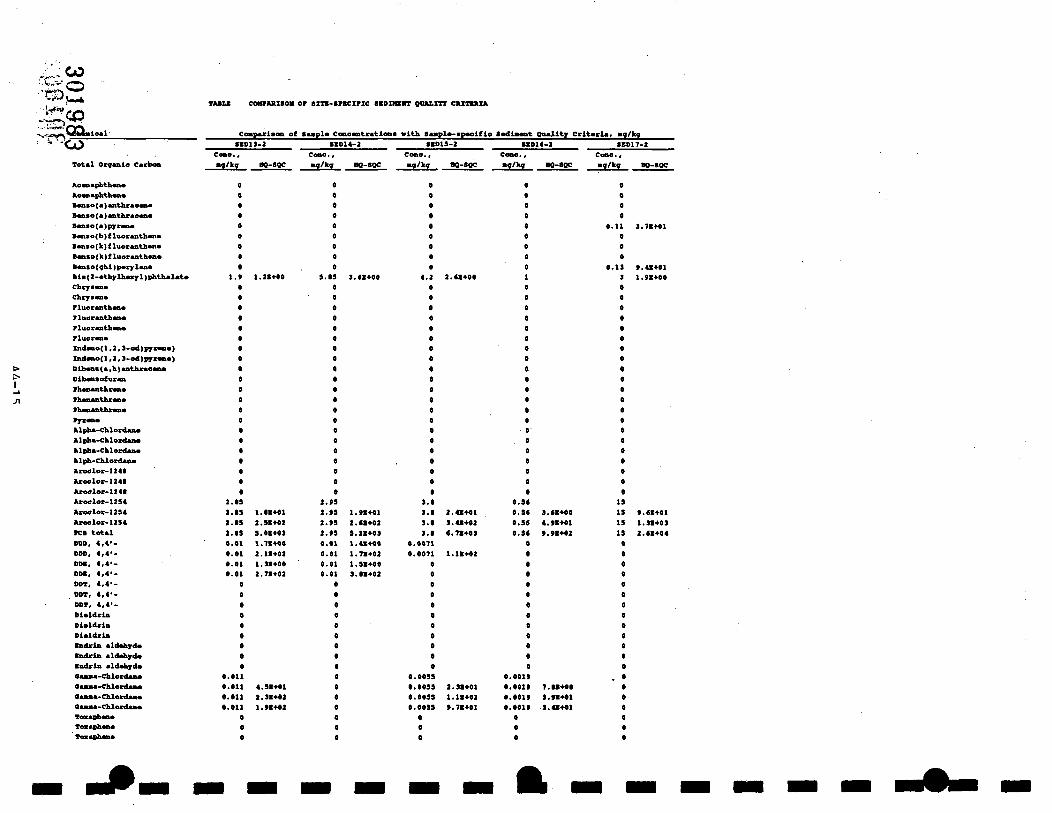
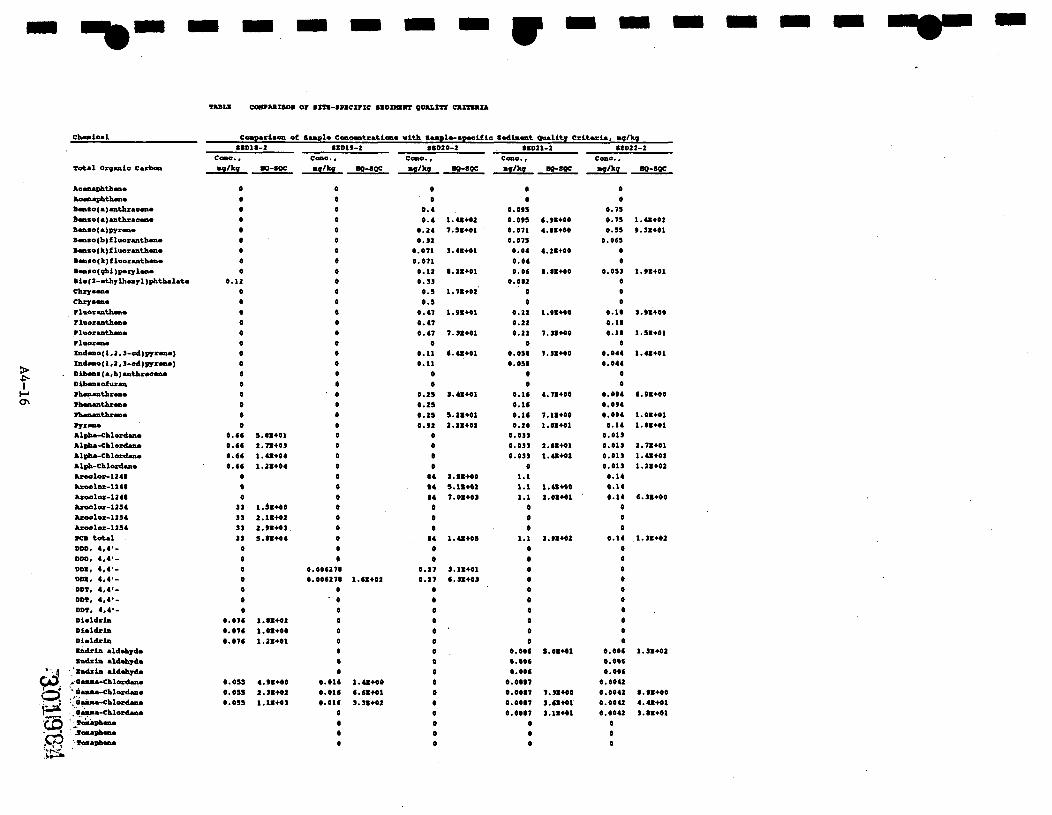
As described in Section 3.3, sediment benchmark concentrations have been developed by several groups including the USEPA, Ontario Environment and New York State for some chemicals of potential concern. These sediment benchmark concentrations were compared to individual sediment samples collected in all Phases of the RI. For most organic compounds, site-specific criteria must be calculated based on a sample-by-sample basis utilizing sample-specific organic carbon measurements. Site concentrations below the benchmarks are expected to result in no adverse biological effects in
I 4-3 ;.^30186t
I TABLE 4-2 SCREENING ANALYSIS FOR INVERTEBRATE TOXICITY
Maximum Site Soil Concentration. mg/kg<" Chemical
Cadmium
Chromium
Copper
Lead
Mercury
Nickel
Zmc
Dioxin
NOEC. mg/kg
0.97 to 154
1
25 to 2,608
100 to 1,096
0.12 to 10
100-1,000
100 to 1,000
5
Processing Area
8.7*'
1,610*'
480*'
8,500*'
7.1*'
71
6,500*'
1.9E-04
Soutii Area
3.4*'
21*'
34*'
140*'
1.4*'
27
410<*
NA<«
NprtiiArea
1.5*'
35*'
23
89
2.1*'
27
170*'
NA
(a) From all soil samples (0-2 ft.) collected in each area during Phase I-in of the RI. (b) Indicates maximum site concentration falls witiiin tiie range of NOECs. (c) Indicates an HI > 1.0, based on the high end of the NOEC range. (d) NA = Chemical not analyzed. Dioxin analyzed only in soils from Processing Area near
former incinerator.
44
•k I
r
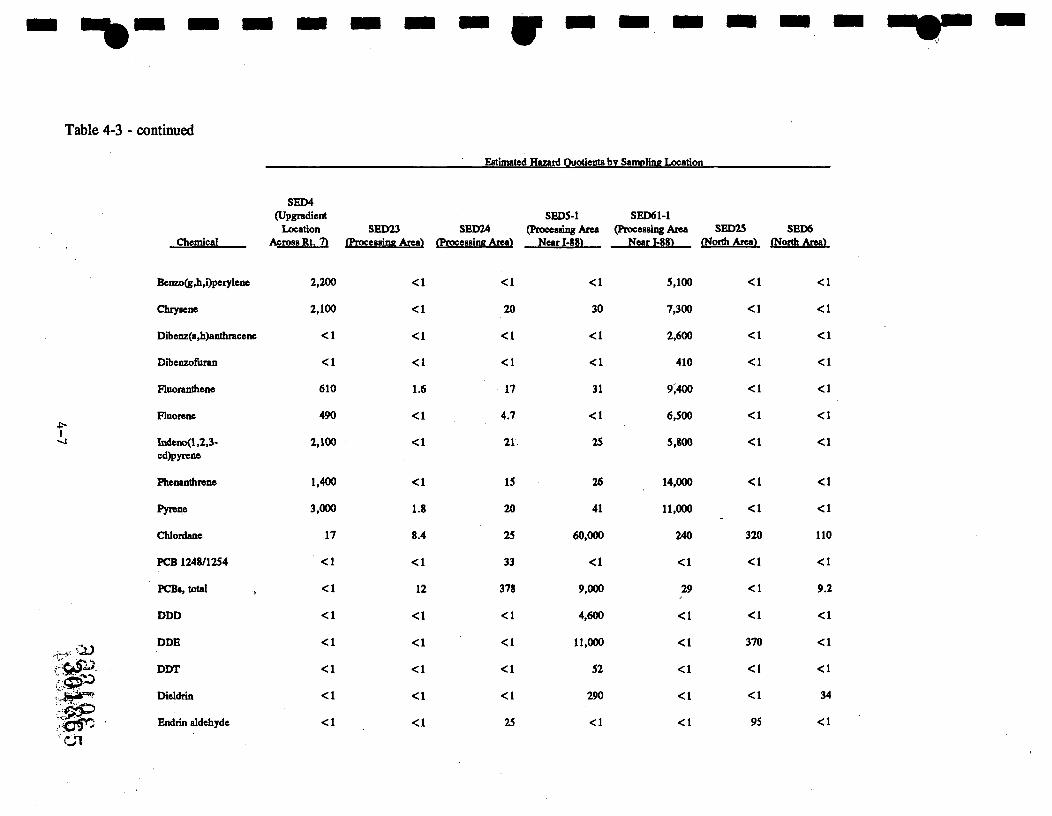
exposed organisms. Sediment concentrations that exceed calculated benchmark values (i.e., the HQ is greater than one) could pose a risk to exposed benthic organisms. Sample-specific SQC calculations are included in Appendix 4. Total organic carbon measurements, needed for the calculations, were not reported with Phase II sediment sampling analyses. Surrogate organic carbon values were selected from relevant Phase I samples, and those values are documented in Appendix 4. Each chemical of potential concern was compared to each relevant sediment benchmark, and an HQ calculated. Exceedances are included in worksheets in Appendix 4. Hazard quotients above 1.0 are discussed below on a surface water body basis.
West Tributary The intermittent stream designated as the West Tributary flows north toward Osbome Creek, through the Processing Area. Hazard quotients calculated at sediment locations in this stream are summarized in Table 4-3. Exceedances of manganese, mercury, zinc, several PAHs and chlordane were estimated for sediment benchmarks at the location designated as background (SED4). It appears that this sampling location is impacted by other sources since the levels of PAHs in the sediment do not appear to be site-related. The levels of PAHs drop dramatically downstream and do not increase as the stream passes through the Processing Area. The potential for toxicity to aquatic organisms increases further downstream due to pesticides, mercury and PCBs. Estimated HQ values for chlordane, dieldrin and PCBs remain elevated even at SED6, the last sampling location before the stream enters Osborne Creek.
There is some concern that the duplicate pair at SED5/SED61-1 are very diffferent. The sampling contractor, ESC, has indicated that the variable results are due to the nonhomogeneity of the medium. However, an additional sample taken at the SED5 location during Phase II is very similar to the sediment sample taken in Phase I and is very different from SED61-1. Table 4-3 reports SED61-1 separately and reports the highest estimated HQ values from the SED5 location regardless of the investigative phase. The analytical results from the Phase III samples at this location generally detected higher levels of chlordane, PCBs, dieldrin, DDE and DDD than in the previous phases.
East Tributary The intermittent stream designated as the East Tributary flows north toward Osborne Creek, east of the site. Hazard quotients calculated for sampling locations in this stream are summarized in Table 4-4. Hazard quotients estimated at the sampling location designated as SEDl (upstream of the Site) were below 1.0 for all chemicals except arsenic, manganese, mercury, nickel and fluoranthene. At the next downstream location, SED20 (between Old Route 7 and Osbome Hollow Road), there is some concern for toxicity to aquatic organisms due to the presence of several inorganics, PAHs, PCBs and DDE in the sediments. This portion of the stream drains a former junkyard. Downstream of this location the concentrations of all chemicals of concern in sediments generally decrease. At SED3, the last sampling location before the stream enters Osborne Creek, the HQ values clearly exceeding 1.0 are for certain PAHs, total PCBs and chlordane.
North Pond Area The man-made pond in the North Area does not always contain surface water and is not drained by other streams. There is no information collected on whether it supports any aquatic populations, although it likely does. Nonetheless, the samples taken in this pond area and from the surrounding wetiand were evaluated as if they were sediments. The highest HQ values estimated were for PCBs
1 4-5
^
TABLE 4-3 EXCEEDANCES OF SEDIMENT BENCHMARKS IN THE WEST TRIBUTARY
> ^ " Estimated Hazard Quotients by Sampling Location
I CJv
SED4 (Upgradient SED5-1 SED61-1
Location SED23 SED24 (Processing Area (Processing Area SED25 SED6 Chemical
Arsenic
Antimony
Cadmium
Copper
Lead
Manganese
Mercury
Nickel
Silver
Zinc
Acenaphthene
Benzo(a)anthracene
Benzo(a)pyrene
Benzo(b)fluoranthene
Benzo(k)fluoranthene
Across Rt. 7)
1.1
< 1
< 1
< 1
< 1
2.6
1.2
1.2
< 1
1.1
140
2,200
1,200
6
580
(Processing Area)
1.9
< 1
4.5
1.2
< I
2.6
2.0
1.3
< 1
< 1
< 1
< 1
< 1
< 1
< 1
(Processing Area)
1.7
<1
3
<1
< 1
3
2.7
1.3
<1
< 1
< 1
15
21
7.6
< 1
Near 1-88)
1.4
< 1
6
1.4
1.5
1.7
9.5
1.4
1.6
< 1
< 1
30
17
< 1
< 1
Near 1-88)
1.7
< 1
<1
<1
1.5
<1
1.8
1.3
< 1
< 1
1,400
8,000
3,900
18
3,000
(North Area)
1.8
3.4
5
1.2
< 1
1.9
1.1
1.4
1.2
< 1
< 1
< 1
< 1
< 1
< 1
(North Area)
< 1
<1
< 1
<1
< 1
< 1
< 1
< 1
< 1
< 1
< 1
< 1
< 1
< 1
< 1
continued-
Table 4-3 - continued
Estimated Hazard Quotients by Sampling Location
I
m •'en
Chemical
Benzo(g,h,i)peiyIene
Chrysene
Dibenz(a,h)anthracene
Dibenzofuran
Fluoranthene
Fluorene
Iiideno(l,2,3-cd)pyrene
Phenanthrene
Pyrene
Chlordane
PCB 1248/1254
PCBs, total
DDD
DDE
DDT
Dieldrin
Endrin aldehyde
Across Rt. 7)
2,200
2,100
<1
<1
610
490
2,100
1,400
3,000
17
<1
<1
<1
<1
<1
<1
<1
SED4 (Upgradient SED5-1 SED61-1
Location SED23 SED24 (Processing Ana (Processing Area SED25 SED6 acessing Area) (Processing Area) Near 1-88) Near 1-88) (Norfi Area) (North Area)
<1
<1
<1
<1
1.6
<1
<1
<1
1.8
8.4
<1
12
<1
<1
<1
<1
<1
<1
20
<1
<1
17
4.7
21
15
20
25
33
378
<1
<1
<1
<1
25
<1
30
<1
<1
31
<1
25
26
41
60,000
<1
9,000
4,600
11,000
52
290
<1
5,100
7,300
2,600
410
9;400
6,500
5,800
14,000
11,000
240
<1
29
<1
<1
<1
<1
<1
<1
<1
<1
<1
<1
<1
<1
<1
<1
320
<1
<1
<1
370
<1
<1
95
<1
<1
<1
<1
<1
<1
<1
<1
<1
110
<1
9.2
<1
<1
<1
34
<1
Ceo
TABLE 4-4 EXCEEDANCES OF SEDIMENT BENCHMARKS IN THE EAST TRIBUTARY
and chlordane, in virtually every sample (Table 4-5). Dieldrin and DDE/DDD are present at levels of concern for potential resident aquatic species and terrestrial receptors that feed on them. HQ values estimated for metals and bis(2-ethyhexyl)phthalate are slightly elevated in some samples.
Osborne Creek Calculated HQ values for manganese and nickel slightiy exceed 1.0 for SED 10, taken from Osborne Creek, downstream of the site. The level of managanese at SED9 (656 mg/kg), the background sediment sample for Osborne Creek was slightiy higher than at SED 10 (574 mg/kg). No information is available regarding possible upstream sources.
It must be noted that many of the site-specific sediment criteria calculated for several pesticides and for PCBs are below the achieved analytical detection limit. Exceedances at locations where these chemicals were not reported as detected by the laboratory were therefore not evaluated with respect to the calculation of a hazard quotient.
4.4 Evaluation of Surface Water Toxicity
Twelve inorganic and two organic chemicals were detected in surface water samples collected during Phase I (Appendix 1, Table Al-5). Chlordane (both isomers) was detected at surface water location SW8. This sample location is in the West Tributary just south of 1-88. When compared to USEPA Ambient Water Quality Criteria for chronic exposures, the level of chlordane in this sample result would correspond to an HQ of approximately 15. Carbon disulfide was detected in two locations, SW5 and SW9. Both these locations are in Osbome Creek. There is no surface water benchmark available for this compound.
Barium is the only inorganic chemical that exceeds its surface water benchmark in all surface water samples, including the background sample taken in Osborne Creek at location SW6. The highest estimated HQ value is 9; the HQ at the background location is 4. Iron and aluminum sample results exceeded their respective benchmarks in one or two samples, respectively. Calculated HQ values were below ten. At sample location SW2, located in a reach of Osborne Creek, the surface water result for mercury exceeded the benchmark (HQ of 26).
The water quality criteria for two of the inorganics detected in surface water (lead, zinc) are hardness dependent. Sample-specific criteria were calculated based on hardness measurements reported in Phase I. These criteria were exceeded for lead and zinc only at location SW4 (in the North Area pond). Hazard quotients for these chemicals were all below 10.
There is some uncertainty associated with the evaluation of copper, antimony and lead. Many of the surface water measurements were considered unusable data (i.e., R-qualified) and those analyses were not repeated. In addition, the detection limits for some chemicals (e.g., selenium) are higher than the benchmark. Thus there is some uncertainty as to whether a chemical is present at a level higher than the associated benchmark.
4.5 Evaluation of Toxicity from Soil Ingestion
Wildlife ingest soil either inadvertentiy or deliberately. If substantial amounts are ingested, and contaminant levels are high enough, then this pathway can become important. Most soil ingestion by wildlife expected to be present at the Site occurs while feeding. Birds that feed on earthworms or other invertebrates will also ingest soil adhering to body or contained within the body of the invertebrate. Herbivores can ingest soil adhering to plant leaves and roots. Beyer et al. (1991)
-evaiuated.a,number of wildlife species in order to determine the percentage of their diet that was
4-10
1
4
I
TABLE 4-5 EXCEEDANCES OF SEDIMENT BENCHMARKS IN NORTH POND AREA
Estimated Hazard Quotients by Sampling Location
Chemical
Arsenic
Cadmium
Chromium
Copper
Lead
Manganese
Mercury
Nickel
Silver
Zinc
Bis(2-ethylhexyl)phthalate
PCB 1248
PCB 1254
PCB, total
Chlordane
D D I ^
D D ^
SED7 (Pond)
1.3
< 1
1.1
<1
< 1
< 1
1.7
.1-4
< 1
< 1
19
380
170
11,000
1,100
< 1
< 1
SED 13 (Pond)
1.6
3.8
< 1
1.2
< 1
1.2
1.9
1-4
< 1
< 1
1.2
< 1
250
5,000
230
210
270
SED 14 (Pond)
1.2
4
<1
1.2
1.3
<1
2.6
1.3
< 1
< 1
3.6
< 1
260
5,200
< 1
170
300
SED15 (Pond)
1.4
4
<1
1.3
<1
<1
1.8
1.6
<1
<1
2.6
<1
340
6,700
110
110
<1
SED 16 (Pond)"'
1.3
3.7
<1
1.5
<1
< 1
3
1.4
< 1
< 1
< 1
< 1
49
990
39
< 1
< 1
SED 17 (Wetland)
1.1
3.7
< 1
< 1
1.2
4
5
< 1
< 1
< 1
1.9
< 1
1,300
26,000
< 1
< 1
< 1
SED 18 (Wetland)
2.3
5
1.4
<1
1.9
4.8
3.1
1.2
< 1
1.6
< 1
< 1
2,900
58,000
12,000
<1
< 1
SED19 (Wetland)
1.5
3.8
< 1
1.2
< 1
1.3
5
1.4
1.1
< 1
< 1
< 1
< 1
< 1
330
<1
160
(a) This sample taken at a depth of 2 to 3 ft.
TABLE 4-6 SOIL INGESTION BY TERRESTRIAL WILDLIFE<'>
Animal
Woodcock
Raccoon
Rabbit
Red fox
Woodchuck
White-footed mouse
Meadow vole
Soil as a Fraction of Diet. %
10.4
9.4
6.3
2.8
<2
<2
<2
1
4
301870
(a) Source: USEPA (1993e)
4-12 I
t
b
f I
comprised of soil. This work concluded that shorebirds feeding on invertebrates in sandy beach areas consumed the most (30%) and herbivores were generally the lowest ingesters of soil (<2%). Soil burrowers were not associated with a higher rate of soil ingestion. Table 4-6 lists the estimated percentage of soil in the diet of several wildlife species observed at the Site, or expected to utilize the Site. These estimates range from 2-10%, with the herbivore, rabbit, falling ^proximately in the middle of the range. This pathway, utilizing the rabbit as a surrogate species, was evaluated in conjunction with the food chain pathway described in the following section.
4.6 Evaluation of Transfer of Contaminants Through Terrestrial Food Chains
Information presented in Section 3.0 indicates that several chemicals of potential ecological concem selected for the Site can enter terrestrial food chains by plant or invertebrate uptake. These plants and invertebrates can subsequentiy be ingested by higher trophic level consumers. As part of this screening-level analysis two simplistic food chains were selected for evaluation: (1) soil-plant-herbivore and (2) soil-plant and earthworm-omnivore bird. The herbivore food (diain includes soil ingestion as a percentage of diet. These two food chains i^pear to be operational at the Site and the fact that certain chemicals were detected in plant and earthworm samples indicates that some trophic level transfer is occurring.
Herbivore Food Chain
This food chain consists of a rabbit (eastem cottontail, Sylvilagus floridanus) consuming plant material and associated soils while feeding in areas where shallow soils were sampled during the RI. A daily intake was calculated and compared to a toxicity reference value. This simplistic ^proach does not address ingestion of contaminants in other media, nor does it take into consideration any additive effects of the contaminants. The daily intake was calculated by the following:
DI - t < ^ ^ ^ ^ - ^ ^ ^ - ^ J ^ t C ^ ^ ^ ^ ^ ^ ^ ^ (2) BW
where:
DI = Daily intake of contaminant, mg/kg/day C,oQ = Concentration of contaminant in soil, mg/kg
Cphrt = Concentration of contaminant in plant material, mg/kg, dry weight FR = Feeding rate, kg/day (dry weight) FI, = Fraction of feeding rate that is soil FIp = Fraction of feedmg rate that is plant material
BW = Body weight, kg
The followmg assumptions were made in order to calculate the daily intake of contaminants:
• Rabbit weight - I kg (Burt and Grossenheider 1964)
• Area use factor - 1 (assumes all consumption of vegetation occurs in the site area evahiated), USEPA (1994). ••• V 3 1 ;. i
• Daily food constunption - 0.087 kg dry weight/day. Based on allometric models of feeding rates for wildlife, eutherian mammals, herbivores (Suter 1993)
.3M871 t-13 -.T8I0C
• The fraction of feeding rate tiiat is soil is 0.06 (USEPA 1993e). Therefore, the fraction of feeding rate that is plant material is 0.94.
The concentrations in soil used were the maximum chemical concentrations (0-2 ft. d^th) in each area under evaluation (i.e., Processing Area, North Area, Soutii Area). The concentrations in plants were the maxunum measured concentrations in site plant samples in each area. Since these san: )les were not analyzed for inorganics or dioxin, the soil to vegetation (leafy portion) BCF values from Table 3-7 were applied to the soil concentrations in order to calculate a concentration in plants. Toxicity reference values were calculated for the rabbit according to the methodology presented in Ford et al. (1992). Detailed intake calculations and the subsequent HQ values are provided m Appendix 4.
The screening-level calculations suggest that several metals, pesticides and PCBs pose a hazard to herbivorous mammals at this site. Table 4-7 summarizes estimated HQ values that exceeded 1.0. Levels of eight metals (barium, cadmium, copper, lead, manganese, mercury, selenium and zinc) are of concem in all three areas evaluated. Of these, lead HQs are significantiy higher than any other contaminant of potential concem. In the Processing Area, all metals evaluated in this food chain analysis produced HQ values greater than one. Beryllium, nickel, silver and chromium do not appear to be of concem, however, in either the North or South areas.
Organic compounds appear to be a concem in both the Processing Area and the North Area. In the Processing Area, several PAHs, PCBs and pesticides were detected in soils and plants at levels that result m an estimated HQ well above 1.0. In the North Area, only PCBs and dieldrin appear to be of some concem.
The extent to which contaminants of concem transfer to trophic levels higher than a primary herbivore was not determined. Further plant and animal tissue sampling would have to be done to estimate consumption, transfer and accumulation of chemicals in specific resident populations.
Omnivore Food Chain
An omnivore food chain consisting of a songbird (American robin, Turdus migratorius) eating a diet of both fruits and invertebrates was also evaluated. The levels of contaminants in botii food sources were taken from plant and earthworm samples collected during Phase n of the RI. The maximum value of each chemical detected in either plant or earthworm samples was utilized. A daily intake was calculated by the following:
DI ( C , x F R x D F p . ( C , x F R x D F J (3^ BW
where: DI = Daily intake of the contaminant, mg/kg/day
Concenfration of contaminant m plant material, mg/kg, dry weight Concenfration of contammant in earthworms, mg/kg, dry wei^t Feeding rate, kg/day (dry weight) Dietary fraction composed of plant fruits Dietary fraction composed of worms Body weight, kg
4-14
1
4
1 I
f
In order to calculate an intake, tiie following assumptions were made:
• Body weight of tiie bird - 0.080 kg (USEPA 1993)
• The total diet of the bird comes from the Site, and the animal feeds randomly across all Site areas.
• Daily food consum$>tion - 0.006 kg dry weight.' Based on allomefric models of feeding rates for wildlife, passerine burds (Suter 1993)
• The makeup of a robin's diet over three seasons is {^proximately 55% fruit and 45% wonn (USEPA 1993). Thus, DF, = 0.55 and DF^ = 0.45.
Acceptable daily intakes (toxicity reference values) were calculated from avian LDJQ data, utilizing the methodology of Ford et al. (1992). These values and the detailed calculations are provided in Appendix 4.
Table 4-8 summarizes HQ values in excess of 1.0 for this food chain analysis. Results indicate that food chain fransfers are occurring and could be affecting bird populations utilizing the Site. The estimated HQ values range from 3.5 for PCB 1248 to 86 for total chlordanes.
Aquatic Food Chains
Uptake of chemicals of potential ecological concem in surface water and sediment by aquatic organisms is also possible. Of the chemicals detected in Site surface waters, chlordane would be the most likely to accumulate m the tissues of aquatic organisms (Table 3-11). Likewise, the pesticides and PCBs detected in sediments can be transferred via bioaccumulation in aquatic species.
The extent of uptake of contaminants in aquatic organisms and the potential for adverse impacts as a result of bioconcenfration or biomagnification was not determined in this preliminary analysis. No information has been collected regarding the benthic communities in eitiier fributary or in Osbome Creek. The most recent information regarding fish populations in Osbome Creek is over 40 years old (ED&R 1995). Tissue concentrations in aquatic organisms would be needed to determine whether chemicals of potential concem are elevated over tissue concentrations in organisms living in a reference location, unaffected by the Site.
4.7 Uncertainties
There are uncertainties associated with any risk characterization. The major factors confributing to uncertainty in this preliminary screening analysis include the following.
Selection of Chemicals of Potential Ecological Concem
Over 1(X) chemicals were detected in various media at the Site. Many otiier chemicals were detected as tentatively identified compounds, whose identities and concentrations are uncertain. In order to focus the risk characterization, some chemicals were eliminated utilizing a medium-specific, risk-based concentration screen. To some extent, risks are additive and tiie elimination of these chemicals from risk calculations underestimates risk to some unknown extent. The magnitude of this underestimation is not known.
(a) ND = chemical not detected in area soils or plants.
•'•i « > . r > . . . ^
:oriiiit74 4-16
y I
f
f
Chemicals Not Evaluated
Over 20 chemicals detected in site media were not quantitatively evaluated either in the RBSC comparison or in specific risk calculations. This is primarily because data are not available regarding ecotoxicity. Not evaluating these chemicals underestimates risk by some unknown amount.
Estimates of Exposure
The extent to which organisms utilize the Site is a major uncertainty. While some areas provide suitable habitat for terrestrial wildlife, some areas are highly disturbed and of minimal habitat value. The extent to which the wildlife actually come in contact with contaminated site areas would significantly affect risk estimates. For instance, in each food chain analysis an area use factor was conseryatively assumed to be one. That is, it was assumed the rabbit, or robin foraged only on site and only from the areas sampled during the RI. In addition, maximum chemical concentrations were utilized as required by USEPA. This combination results in highly conservative estimates of intakes. For any Processing Area analysis it is highly unlikely that any animal could find sufficient food sources to forage at the extent assumed in these analyses.
Soil samples were taken in many instances from a two-foot depth. Utilizing these samples could underestimate hazard quotients if contamination decreased with depth since terrestrial receptors are more likely to be exposed in the near surface (to 1 foot) depth.
It was assumed that the plant material collected and analyzed from Site locations was representative of the herbivorous portion of the songbird's diet or 94% of the rabbit's diet. It is not clear how much of this sampled material was fruit and how much was leafy material. Since a number of chemicals could concentrate at higher levels in fruit rather than leafy portions of the plant, the intake levels are somewhat uncertain for both food chain analyses. Biological samples were not analyzed for all chemicals of potential ecological concern (e.g., metals, dioxin). If those chemicals were present in plant tissue, then intakes could be underestimated to some unknown degree. Similar uncertainties are associated with the estimates of daily contaminant intakes from earthworms.
Bioavailability (assumed to be 100%) is also a major uncertainty in interpreting the potential for adverse biological effects from exposure estimates based on measurements of bulk chemical concentrations in environmental media. Bioassays, which can directly measure bioavailability have not been conducted on any Site media. Thus, risk estimates could be overestimated by some unknown amount if the chemicals in Site media are less bioavailable than the chemicals utilized in the respective toxicological studies. This is especially tme for metals. For example, the lead detected across the site may be in a form which is not bioavailable to resident species, thus decreasing its toxicity to on-site ecological receptors.
Estimates of Toxicity
There is very limited information regarding the phytotoxicity potential of most chemicals of potential concern. In addition, the plant species present on site are not the species generally utilized in phytotoxicity experiments. Evidence of stressed vegetation, however, was not reported in the Site survey except in areas of high physical disturbance. Nonetheless, there is uncertainty involved in determining whether any plant species on site are being adversely affected by soil contamination. Likewise, little data are available concerning the toxicity of most chemicals of concern to soil invertebrates. The NOEC values utilized in this risk assessment were available only for certain metals and dioxin. It is not known if all of the reported species are indeed present at the Site or are representative of Site soil invertebrates.
The uncertainty associated with the use of surrogate laboratory species to predict toxic effects in terrestrial wildlife has been accoimted for to some extent in the application of uncertainty factors to r^orted NOAELs and LOAELs. Until toxicological studies are conducted with wildlife species, these values could be over- or underestimating the potential for adverse effects. In some cases (e.g., the effects of PAHs on birds), no toxicity reference value could be located and therefore risks could not be estimated. The lack of toxicity reference values is a considerable source of tmcertainty. The possibility exists that the potential for risk to some ecological receptors from certain chemicals of potential concem has been unaccotmted for.
Sediment benchmark concentrations are statistical indicators derived from a data base of measured sediment concentrations associated with a wide variety of adverse biological effects observed at numerous contanunated sites. In many cases, more than one chenucal contributed to observed effects at these sites. This suggests a certain amount of synergism, which may or may not be present at the Site. In addition, the Site conditions could be very different from site conditions used to develop benchmark values. Thus, the use of sediment benchmark concentrations is likely to overestimate the risk of impacts to organisms exposed to contaminated sediment at the Site. On tiie other hand, the equilibrium partitioning model used to calculate some sediment quality criteria does not accoimt for any synergism among contaminants.
4.8 Selection of Endpoints
An assessment endpoint is an explicit expression of the environmental value that is to be protected (USEPA 1992a). Measurement endpoints are measurable responses to a sfressor that are related to tiie valued characteristics chosen as the assessment endpoints (USEPA 1992a). These endpoints are selected based on the particular circumstances at an individual site. These conditions have been described in this r^ort and include:
• The contaminants present at the Site and their concentrations
• The toxicity of these contaminants to ecological populations present or expected to use the Site
• The potentially complete exposure pathways at the Site
Based on this screening analysis the followmg assessment endpoints are relevant at the Site:
• The integrity of invertebrate and mammalian populations directiy exposed to Site soils
• The integrity of wildlife populations primarily bird and mammalian populations) that may be exposed to Site contaminants through their food chains
• The integrity of the stream community
In order to evaluate these assessment endpoints the following measurement endpoints are chosen:
• Toxicity of site soils to indigenous invertebrate populations
• Toxicity of contaminated food sources to Site consumers
• The diversity and density of benthic communities as compared to similar sfream areas unaffected by the Site
4-19 m^ B*s
• The toxicity of contaminated sediments to benthic communities
I
4-20 I
I I p I I I I I I
I I I I I I I f I
5.0 CONCLUSIONS
Screening evaluations of chemical contamination in environmental media at the Site indicate that a potential for the threat of adverse impacts could occur for exposed ecological receptors based on toxicity hazards either directly or indirectly (through food chain accumulation).
Tables 5-1 and 5-2 summarize the potential concerns posed by inorganic or organic chemical contaminants. The primary concern is for chemicals that are strong bioaccumulators detected in the Site soils and entering the food chain where bioaccumulation and biomagnification can occur. On a chemical and site area basis the major concerns include:
• Lead in Processing Area soils
• Pesticides, primarily chlordane, in Processing Area soils and the sediments in the West and East Tributaries and in the North Pond Area
• PAHs in West Tributary sediments
• PAHs and PCBs in East Tributary sediments
• PCBs in Processing Area and North Area soils and sediments
It is recognized that the ecological evaluations in this assessment demonstrate what could be considered "worst-case" conditions. The assumptions regarding use of each area by wildlife and the use of the maximum concentration of chemicals to represent an entire area result in extremely conservative estimates of hazard quotients. In addition, although the Processing Area is extremely contaminated it is also incapable, in its present condition, of supporting wildlife habitat. Thus, although the soils appear to be toxic to likely ecological receptors, it is unlikely that these areas would be able to support sufficient forage. Should the area be abandoned and revegetation occur, these habitat conditions could change. The North and South areas, which not as disturbed, could be capable of supporting a limited wildlife population.
Despite the inherent uncertainties in evaluating potential ecological effects, the fact remains that chemicals predicted to be strong bioaccumulators have been taken up both by plants and earthworms. Site-specific samples indicate that pesticides and PCBs are entering terrestrial food chains. The potential for ecological effects to observed wildlife is indeed possible.
The aquatic system is likewise of limited ecological value. The two tributaries that flow through the property are intermittent. While the sediments are contaminated at levels indicative of effects to benthic organisms, there is no site-specific information on what communities are in these water bodies. There is also evidence that upgradient sources are affecting stream quality.
The preliminary, screening evaluations in this assessment suggest the threat of adverse impacts to potential ecological receptors. While additional evaluations (e.g., sediment toxicity testing, invertebrate toxicity testing, etc.) could serve to define risk estimates with more accuracy, there is sufficient evidence to conclude that the potential for ecological threats at this Site are significant and deserve remedial consideration.
m>. 5-1
JC^
I NJ
Chemical
Aluminum Antimony Arsenic Barium Beryllium Cadmium Chromium Copper Iron Lead Manganese Mercury Nickel Selenium Silver Thallium Vanadium Zinc
TABLE 5-1 SUMM.
Phytotoxicity*^
NE('> ® —
NE ~ ~ — ~
NE ® ~ ~ ~ ~
® 0 ~
®
ARY OF POTEN
Invertebrate Toxicity
NE NE NE NE NE NE 0 0 ® ® NE ~
NE ® ~
NE NE NE NE ®
TIAL CHEMICAL CONCERNS -
Food Chain Herbivore
NE 0 ® ® NE 0 0 0 ~
NE ® ®® NE 0 0 0 0 ® 0 0 0 ~ ~ . ~ ~
® 0 0
Omnivore*^
NE NE NE NE NE NE NE NE NE NE NE NE NE NE NE NE NE NE
- INORGANICS "'
Aquatic Toxicity Sediment
NE ~
NE NE NE ~ ~
NE ~ ~
® ~
NE
NE NE —
Surface Water
. . C O
~
NE ~
NE NE NE NE „
~ ~
® NE NE NE NE NE —
(a) "®" indicates an estimated environmental level higher than a threshold level for effects. Multiple symbols indicate the relative magnitude of the exceedance.
(b) Omnivore food chain not evaluated for inorganics. (c) NE = Chemical not evaluated via this analysis. (d) "~" = indicates environmental level or intake is less than toxicity reference value or HQ analysis indicates minimal concern.
w
TABLE 5-2 SUMMARY OF CHEMICAL CONCERNS - ORGANICS "'
co: (a)"®" indicates an estimated envhonmental level higher than a threshold level for effects. Multiple symbols indicate the relative magnitude of the exceedance.
(b) NE = Chemical not evaluated via this analysis. (c) "~" indicates environmental level or intake is less than toxicity reference value or HQ analysis indicated minimal concem.
r
h
e I
6.0 REFERENCES
ATSDR. 1992. Agency for Toxic Substances and Disease Registry. Toxicological profile for chlordane. Draft. Atianta, GA: Agency for Toxic Substances and Disease Registry.
Baes C, Sharp RD, Sjoreen AL, Shor RW. 1984. A review and analysis of parameters for assessing transport of environmentally released radionuclides through agriculture. Oak Ridge, TN: Oak Ridge National Laboratory. DE85-000287.
Bell RM. 1992. Higher plant accumulation of organic pollutants from soil. Liverpool UK: University of Liverpool. Cooperative agreement CR 812845 witii USEPA. EPA/600/R-92/128.
Beyer NJ, Conner E, Gerould S. 1991. Survey of soil ingestion by wildlife. Draft. Laurel, MD: U.S. D^artinent of the Interior. Fish and Wildlife Service.
Bodek I, Lyman WJ, Reehl WF, Rosenblatt DH. 1988. Environmental morganic chemistry. Properties, processes and estimation methods. New York, NY: Pergamon Press.
Boemgen JG, Shacklette HT. 1981. Chemical analyses of soils and other surficial materials of the conterminous United States. U.S. Department of the Interior. Geological Survey. R^ort 81-197.
Briggs C, Bromilow RH, Evans AA. 1982. Relationships between lipophilicity and root uptake and franslocation of nonionized chemicals by barley. Pesticide Science 13:495-504.
Burt WH, (jrossenheider RP. 1964, A field guide to the mammals. Boston, MA: Houghton Mifflin Company.
Dallinger R. 1993. Strategies of metal detoxification in terrestrial invertebrates. M: Ecotoxicity of metals in invertebrates. R. Dallinger and P.S. Rambow, Eds. Boca Raton, FL: Lewis Publishers.
Dragun J. 1988. The soil chemistry of hazardous materials. Silver Spring, MD: Hazardous Materials Confrol Research Institute.
ED&R. 1995. Environmental Design & Research, P.C. Vegetation and wildlife inventory. Tri-Cities Barrel superfund site. Town of Fenton, Broome County, New York. East Syracuse, NY: Environmental Design & Research, P.C.
Eisler R. 1990. Chlordane hazards to fish, wildlife and invertebrates. A synoptic review. Washington, DC: U.S. D^artment of tiie Interior, Fish and Wildlife Service. Biological Report 85(1.21).
Eisler R. 1986. Dioxin hazards to fish, wildlife and invertebrates. A synoptic review. Laurel, MD: U.S. Department of the Interior, Fish and Wildlife Service. Biological Rqiort 85(1.8).
ESC. 1995b. Environmental Strategies Corporation. Fish and wildlife inqiact analysis. Tri-Cities Barrel superfimd site. Fenton, New York. Miime^>olis, MN: Environmental Sfrategies Corporation.
ESC. 1994. Environmental Sfrategies Corporation. Interim site summary r^)Ort for tiie phase I remedial investigation. Tri-Cities Barrel superfimd site. Fenton, New York. Pittsburgh, PA: Environmental Strategies Corporation.
ESC. 1992. Environmental Sfrategies Corporation. Remedial investigation/feasibility study for the Tri-Cities Barrel Site in Fenton, New York. Revised Work Plan (Revision No. 5). Pittsburgh, PA: Environmental Sfrategies Corporation.
Ford KL, Appldians FM, Ober R. 1992. Development of toxicity reference values for terresttial wildlife, fa: Proceedings of HMCRI Superfimd '92. December 1-3, 1992. Greenbelt, MD: Hazardous Materials Confrol Resources Institute, pp. 803-812.
Garten CT, Trabalka JR. 1983. Evaluation of models for predictmg terrestrial food cham b^avior. Environ. Sci. Technol. 17:590.
Kabata-Pendias A, Pendias H. 1984. Trace elements in soil and plants. Boca Raton, FL: CRC Press, Inc.
Kenaga EE. 1980. Correlation of bioconcenfration factors of chemicals in aquatic and terresfrial organisms with their physical and chemical properties. Env. Sci. Tech. 14:553-556.
Life Systems. 1995. Baseline risk assessment - human health evaluation. RI/FS compliance oversight for the Tri-Cities Barrel superfimd site, Fenton, New York. Cleveland, OH: Life Systems, Inc. TR-1170-5.
Long ER, Morgan LG. 1991. The potential for biological effects of sedunent-sorbed contaminants tested in the national status and frends program. Seattie, WA: National Oceanic and Atmospheric Administration. NOAA Technical Memorandum NOS OMA 52.
Lyman WJ, Reehl WF, Rosenblatt DH. 1982. Handbook of chemical property estimation metiiods. Environmental bdiavior of organic compounds. New York, NY: Mc(jraw-Hill Book Company.
Mabey WR, Smith JH, Podoll RT, et al. 1982. Aquatic fate process data for organic priority pollutants. Final Draft Report. Washington, DC: U.S. Environmental Protection Agency..
Manahan SE. 1991. Envuronmental chemistry. Chelsea, ME: Lewis Publishers.
Montgomery JH. 1991. Groundwater chemicals desk reference. Volume 2. Chelsea, MI: Lewis Publishers.
Montgomery JH and Welkom LM. 1990. Groundwater chemicals desk reference. Chelsea, MI: Lewis Publishers.
Ney RE Jr. 1990. Where did that chemical go? A practical guide to chemical fate and fransport in the environment. New York, NY: Van Nosfrand Reinhold.
1
4
M3ai!f" 6-2 I
f
h
f I
NYCRR. 1991. New York Codes, Rules and Regulations. New York water classifications and quality standards. Titie 6 - Environmental Conservation. Parts 701 and 703.
NYSDEC. 1995. Threatened and endangered species in tiie town of Fenton, Broome County, New York. Letter to Monique H. Posner. Latham, NY: New York State Dq)artment of Envhonmental Conservation. Wildlife Resources Center. January 1995.
NYSDEC. 1994. New York State Department of Environmental Conservation. Division of Fish and Wildlife. Technical guidance for screening contaminated sediments. New York State D^artment of Environmental Conservation. July.
Persaud D, Jaagumagi R, Hayton A. 1993. Guidelines for the protection and management of aquatic sediment quality in Ontario. Ontario Ministry of the Environment and Energy. ISBN 0-7729-9248-7.
Suter GW. 1993. Ecological risk assessment. Chelsea, MI: Lewis Publishers.
Travis CC, Arms A. 1988. Bioconcentration of organics in beef, milk and vegetation. Environ. Sci. Technol. 22:271-274.
USEPA. 1995. U.S. Environmental Protection Agency. Integrated Risk Information System (IRIS). Data refrieval on Tri-Cities Barrel chemicals of potential concem, March 1995.
USEPA. 1994. U.S. Environmental Protection Agency. Ecological risk assessment guidance for Superfimd: process for designing and conducting ecological risk assessments. Edison NY. USEPA Environmental Response Team. Review Draft.
USEPA 1993a. U.S. Environmental Protection Agency. Office of Science and Technology. Sediment quality criteria for protection of benthic organisms: acen^hthene. Washington, DC: U.S. Environmental Protection Agency.
USEPA 1993b. U.S. Environmental Protection Agency. Office of Science and Technology. Proposed sedunent quality criteria for protection of bentiiic organisms: dieldrin. Washington, DC: U.S. Environmental Protection Agency.
USEPA 1993c. U.S. Environmental Protection Agency. Office of Science and Technology. Sediment quality criteria for protection of benthic organisms: fluoranthene. Washington, DC: U.S. Environmental Protection Agency.
USEPA 1993d. U.S. Envuronmental Protection Agency. Office of Science and Technology. Proposed sediment quality criteria for protection of benthic organisms: phenanthrene. Washmgton, DC: U.S. Environmental Protection Agency.
USEPA. 1993e. U.S. Envhonmental Protection Agency. Office of Research and Development. Wildlife exposure factors handbook. Volumes I and n. Washington, DC: U.S. Environmental Protection Agency. EPA/600/R-93/187a and EPA/600/R-93/187b. ."; 3 Q f fl ^
30iBS4fV 6-3
USEPA. 1992a. U.S. Environmental Protection Agency. Risk Assessment Forum. Framework for ecological risk assessment. Washington, DC: U.S. Environmental Protection Agency. EPA/630/R-92/001.
USEPA. 1992b. U.S. Envfronmental Protection Agency. Office of Solid Waste. Handbook of RCRA ground-water monitormg constituents: Chemical and physical properties. (40 CFR Part 264, Appendix 9.) Washington, DC: U.S. Envuronmental Protection Agency.
USEPA. 1992c. U.S. Environmental Protection Agency. Office of Solid Waste and Emergency Response. Supplemental guidance to RAGS: Calculatmg the concentration term. Washington, DC: U.S. Environmental Protection Agency. OSWER No. 9285.7-081.
USEPA 1989a. U.S. Environmental Protection Agency. Office of Emergency and Remedial Response. Risk assessment guidance for Superfimd. Volume n. Environmental evaluation manual. Interun final. Washington, DC: U.S. Environmental Protection Agency. EPA/540/1-89/001.
USEPA 1989b. U.S. Environmental Protection Agency. Ecological assessment of hazardous waste sites: A field and laboratory manual. Washington, DC: U.S. Environmental Protection Agency. EPA/600/3-8/013.
USEPA. 1988. U.S. Environmental Protection Agency. Office of Remedial Response. Superfund exposure assessment manual. Washington, DC: U.S. Environmental Protection Agency. EPA/540/1-88/001.
USEPA. 1987a. U.S. Environmental Protection Agency. Processes, coefficients and models for sunulating toxic organics and heavy metals in surface waters. Athens, GA: U.S. Environmental Protection Agency. EPA/600/3-87/015.
USEPA. 1987b. U.S. Environmental Protection Agency. Ambient water quality criteria for zinc. Washington, DC: U.S. Environmental Protection Agency. EPA-440/5-87-003.
USEPA, 1985. U.S. Environmental Protection Agency. Ambient water quality criteria for lead. Washington, DC: U.S. Environmental Protection Agency. EPA-440/5-84-027.
USEPA. 1984. U.S. Envuronmental Protection Agency. Ambient water quality criteria for mercury. Washmgton, DC: U.S. Environmental Protection Agency. EPA-440/5-84-026.
USEPA. 1980. U.S. Environmental Protection Agency. Ambient water quality criteria for chlordane. Washmgton, DC: U.S. Envuronmental Protection Agency. EPA-440/5-80-027.
van Sfraalen NM. 1993. Soil and sediment quality criteria derived from invertebrate toxicity data, fe: Ecotoxicity of metals in invertebrates. R. Dallinger and P.S. Rainbow, Eds. Boca Raton, FL: Lewis Publishers.
Verschueren K. 1984. Handbook of environmental data on organic chemicals. 2nd ed. New York, NY: Van Nostrand Reinhold.
1
4
• k K r3Q1885 _. 'isoioe I
6-4
f Yoimg AL. 1981. Long-term studies on the persistence and movement of TCDD in a natural ecosystem. In: Tucker RE, Young AL, Gray AP, eds. Human and environmental risks of chlorinated dioxins and related compotmds. New York, NY: Plenum Press.
i»
f ,-•«• f ' . ' i ;'-?*l -/^
I 301886
6-5
APPENDIX 1
MONITORING DATA SUMMARY TABLES
TABLE PAGE Al-l Summary of Frequency of Detection and Range of
Concentration of Chemicals in Tri-Cities Barrel On-Site Soil Samples - North and Processing Area Al-2
Al-2 Summary of Frequency of Detection and Range of Concentration of Chemicals in Tri-Cities Barrel Soil Samples Onsite (South Area) and Background Al-5
Al-3 Summary of Frequency of Detection and Range of Concentration of Chemicals in Tri-Cities Barrel On-Site and Background Groundwater Samples Al-8
A1-4 Summary of Frequency of Detection and Raiige of Concentration of Chemicals in Tri-Cities Barrel On-Site and Background Sediment Samples Al-12
Al-5 Summary of Frequency of Detection and Range of Concentration of Chemicals in Tri-Cities Barrel On-Site and Background Surface Water Samples Al-15
A1-6 Summary of Frequency of Detection and Range of Concentration of Chemicals in Tri-Cities Barrel On-Site and Background Plant Samples Al-18
A1-7 Summary of Frequency of Detection and Range of Concentration of Chemical in Tri-Cities Barrel On-Site and Background Earthworm Samples Al-20
r Al-l
30188'
I
TABLE A1-1 SUMMARY OF FREQUENCY OF DETECTION AND RANGE OF CONCENTRATION OF CHEMICALS IN TRI-CrriES BARREL ONSPFE (NORTH AND PROCESSING AREAS) SOIL SAMPLES
Onsrte Sort Samptet - North Area Onsite Soil Sample* - Processing Area
TABLE A1-1 SUMMARY OF FREQUENCY OF DETECTION AND RANGE OF CONCENTRATION OF CHEMICALS IN TRI-CITIES BARREL ONSITE (NORTH AND PROCESSING AREAS) SOIL SAMPLES
Onsite Soil Samples - North Area Onsite Soil Samples - Processing Area
TABLE Al-2 SUMMARY OF FREQUENCY OF DETECTION AND RANGE OF CONCENTRATION OF CHEMICALS IN TRI-CrriES BARREL ONSITE (SOUTH AREA) AND BACKGROUND SOIL SAMPLES
Onsite Soil Samples - South Area Background Soil Samples
TABLE A1-3 SUMMARY OF FREQUENCY OF DETECTION AND RANGE OF CONCENTRATION OF CHEMICALS ..^qj IN TRI-CITIES BARREL ONSPTE AND BACKGROUND GROUNDWATER SAMPLES
CO Onsite Groundwater Samples Background Groundwater Samples
5 ; ^ T A B L E A1-4 SUMMARY OF FREQUENCY OF DETECT ON AND RANGE OF CONCENTRATION OF CHEMICALS ' : ^ Z IN TRI-CITIES BARREL ONSITE AND BACKGROUND SEDIMENT SAMPLES i O
C£fc TABLE A1-5 SUMMARY OF FREQUENCY OF DETECTION AND RANGE OF CONCENTRATION OF CHEMICALS IN TRI-CITIES BARREL ONSITE AND BACKGROUND SURFACE WATER SAMPLES
TABLE A l - 5 SUMMARY OF FREQUENCY OF DETECTION AND RANGE OF CONCENTRATION OF CHEMICALS IN TRI-CITIES BARREL ONSITE AND BACKGROUND SURFACE WATER SAMPLES
Witch-hazel Dama's-rocket Spotted St. John's-wort Spotted Jewelweed Morning-glory Soft rush Vetchling Butter-and-eggs Honeysuckle Bird's-foot trefoil Bugleweed Moneywort Swamp-candles Apple Wild chamomile White sweet-clover Yellow sweet-clover Forget-me-not Evening primrose Sensitive fem Reed canary grass Timothy White spruce Clearweed Austrian pine White pine Scotch pine Sycamore Kentucky bluegrass Black bindweed Japanese bamboo Tearthumb Smartweed Christmas fem Bigtooth aspen Quaking aspen Old-field cinquefoil Heal-all Pin cherry Black cheny Red oak Swamp buttercup Staghom sumac Black locust Multiflora rose Northem blackberry Red raspberry Black raspberry Black-eyed susan Curiy dock Willow Eldert)erry Soapwort Bulrush
Foxtail Canada goldenrod Lad/s-tresses Hardhack Ulac Basswood White clover Red clover Nanow-leaf cattail American elm Slender nettle Highbush bluebeny Moth mullein Mullein Blue vervain Nannyberry River crape
X X
X X
X X
(t.
nomenclature as per Mitchell (1986)
Old Field Hedgerow Shrub Upland Deciduous Forest Conifer Plantation Wetland Floodplain
X
X
X
X X
X
X X
X
X
X
X
X X X
X
f I
A2^ 301911
Scientific Name <••
Table 2. Wildlife Species, List Tri-Citles Barrel Site Town of Fenton, Broome County, New York
Common Name
HABITAT ••«•
OF HR SU DF CP W FP
BIRDS ' : 1 ; > . 1 ! 1 1 1 1
Ardeidae Herons, Bitterns I i 1 ! ; 1 1 1 i i • , ; ! i : i 1 Ardea herodias Butorides striatus
qreat blue heron 'oreen-backed heron
1 1 .__
I i 1 1 1 X 1 1 I ! ! X
! 1 ! 1
Cathartidae American Vultures 1 I
i ! I l l Cathartes aura turkey vulture ;(F0) !
i ' ' 1 i t
: 1 1 1 i 1
i 1 1 1 i ! 1 1 Accipitriadae Hawks 1 •• : ' 1 i 1 1 1
northern flicker • . • X i X i X i ; red-bellied woodpecker • ' i X i red-headed woodpecker i X ' X ^ X i downy woodpecker * 1 j i X i \ X hairy woodpecker ' i I X i 1 i X
1 1 i I I ( ! 1 'Rvcatchers I 1 1 1 1' 1 1 1 i 1 1 1 ''alder flycatcher 1 1 'least flycatcher 1 X 'willow flycatcher I ! X iqreat crested flycatcher 1 i leastern Phoebe 1 X 1 X ieastem kinabird * 1 1 \ I I
Hirundlnidae iSwallows 1 1 1 i 1
Hirundo rustica Tactiycineta bicolor
'bam swallow i X 1 'tree swallow i X 1 1 • 1
Corvidae iJavs. Crows 1 1 1 1
Corvus brachyrhynchos Cyanocitta cristata
American CTOW 1 X 1 X ibiueiav* 1 i X 1 1 !
Paridae ITItmice i 1 1 1
Parus atricapillus Parus bicolor
black-capped chickadee * 1 1 1 _
tufted titmouse i 1 I \ t i l
Smidae
Sitta carolinensis
^rthiidae m Terthia americana
Nuthatches I 1
1 ! ! X 1 X i 1 X I 1 i
X
X
X 1 1 1 i
X 1 1
1 1 1 1 1 ! 1 X
' X
X X
1 X 1 1 1 1 ! 1 i
X 1 X 1 X 1
! 1 White-breasted nuthatch 1 1 1
1 I I Creepers 1
I I I brown creeper _.. i i i 1
X 1 X 1
I
1
1 1 X
1 1 1 1 1
X 1 1
1
X
X X
X
• 1 1 1 1 1
X 1 1 1
A2-6 • : f rvi<
Scientific Name * Common Name
HABITAT-f*
OF HR SU DF CP W FP
*
:
i
I
Trooiodvtidae Wrens i i 1 . 1
Troalodytes aedon house wren i
I 1 1
X 1 X i i l l
Mimidae Mimic Thrushes i 1 1
1 I I I iDumetella carolinensis \Mimus polyalottos Toxostoma rufum
oray catbird* 1 1 X northern mockinqbird i brown thrasher I
Semotilus atromaculatus creek chub * Rhinicthys cataractae ilongnose dace
1 1 1 • ' 1 1 1 1 1 : 1 1 1 i 1 1 1 X 1 1 1 ; 1 X
Exoglossum maxillingua cutlips minnow 1 I i 1 i i 1 X Notropis comutus icommon shiner 1 1 i 1 i : i X Campstoma anomalum j stone roller Clinostomus elonaatus Iredsidedace
1 1 i . ; 1 X 1 ' 1 i ! 1 X
Footnotes: Sdentific nomenclature as per AOU, 1983. (birds) Burt and Grossenhekler, 1976. (mammals) Collins, 1990. (reptiles and amphitxans)
'T^vs -5if-< fi :'|oc-<*Uii j - ' s f *.«*.s4- ; c^ 5a,v;4^,^ S ^ r l ^ ^ : r # , ^ 5 H . / ^ 3 + r - c e . +
OOnccp/^S oT Tr^vi'f' .: foef-v*! lo-/vQi £jfx-5-|- • O " • ;•• " " ^
h j
M
S.
)
com abdt abdt-COQ
. Vbdt
coa cots con -j cors-rare COIft-
• 1 1 1 1
uCt
I 1
I
f
NEW YORK STATE DEPARTMENT OF ENVIRONMENTAL CONSERVATION Wildlife Resources Center 700 Troy-Schenectady Road Latham, NY 12110-2400
Langdon Marsh Commissioner
January 6, 1995
Monique H, Posner Life Systems, Inc. 24755 Highpoint Road Cleveland, Ohio 44122
Dear Dr. Posner:
We have reviewed the New York Natural Heritage Program files with respect to your recent request for biological information concerning the Ecological Risk Assessment for the USEPA under CERCLA, area as indicated on your enclosed map, located in the Town of Fenton, Broome County, New York State.
We did not identify any potential impacts on endangered, threatened, or special concern wildlife species, rare plant, animal or natural community occurrences, or other significant habitats.
The absence of data does not necessarily mean that rare or endangered elements, natural communities or other significant habitats do not exist on or adjacent to the proposed site, but rather that our files currently do not contain any information which indicates the presence of these. Our files are continually growing as new habitats and occurrences of rare species and communities are discovered. In most cases, site-specific or comprehensive surveys for plant and animal occurrences have not been conducted. For these reasons, we cannot provide a definitive statement on the presence or absence of species, habitats or communities. This information should not be substituted for on-site surveys that may be required for environmental assessment.
This response applies only to known occurrences of rare animals, plants and natural communities and/or significant wildlife habitats. You should contact our regional office, Division of Regulatory Affairs, at the address on the enclosed list for information regarding any regulated areas or permits that may be required (e.g.. regulated wetlands) under state law.
If this proposed project is still active one year from now we recommend that you contact us again so that we can update this response.
Sincerely, Information Services NY Natural Heritage Program
Encs. cc: Reg. 7, Wildlife Mgr.
Reg. 7, Fisheries Mgr.
I A2-16 i^'mr-mo^ i» * r ^ J .
Neyy York State Department of Environmental Conservation Wildlife Resources Center Information Services 700 Troy-Schenectady Road Uthaa. New York 12110-2400 Thorn.. C. Joriing
September 27. 1993 Comml..lon.r
Joseph T. McNally /F^/^F^^7 Environmental Strategies Corp. -./ \/ 4 Penn Center West, Suite 315 Pittsburgh, PA 15276
Dear Mr. McNally:
Ue have reviewed the New York Natural Heritage Program files with respect to your recent request for biological data conceming the Trl-Cltles Barrel Superfund site, as indicated on your enclosed map, located in t:he Town of Fenton, Broome.County. At this time our database contains no infonnation on the ecological communities at this site. This information can be obtained only by a field survey.
We did not Identify any potential impacts on endangered, threatened, or special concem vildlife species, rare plant, anlfflal or natural community occurrences, or other significant habitant habitats.
The absence of data does not necessarily mean chat rare or endangered elements, natural communities or other significant habitats do not exist on or adjacent to the proposed site, but rather that our files currently do not contain any Information which Indicates the presence of these. Our files are continually growing as new habitats and occurrences of rare species and com-nunltles are discovered. In most cases, site-specific or comprehensive surveys for plant and animal occurrences have not been conducted. For these reasons, we cannot provide a definitive statement on the presence or absence of species, habitats or communities. This Information should not be substituted for on-site surveys that may be required for environmental assessment.
This respon5e applies only to known occurrences of rare animals, plants and natural communities and/or significant wildlife habitats. You should contact our regional office. Division of Regulatory Affairs, at the address on the enclosed list for information regarding any regulated areas or permits that may be required (e.g., regulated wetlands) under state law.
If this proposed project is still active one year from now we recommend that you contact us again so that we can update this response.
Sincerely, ..^ ^
Nancy D^ls-Rlccl. Info Mgmt Asst. NY Natural Heritage Program,
1 Enc. cc: Reg. 7. Wildlife. Mgr ..;::••, H r t n
I
r I
United States Department of the Interior AMEWC
nSH AND WILDUFE SERVICE 3817 Luker Road "•
Cortland, New York 13045
•M
October 14. 1994 1 . : 1334 -Il \ \ \
Ms. Barbara C. Reuter Environmental Design & Research 6007 Fair Lake Drive East Syracuse, NY 13057-1253
Dear Ms. Reuter:
This responds to your letter of September 14, 1994, requesting information on the presence of endangered or threatened species in the vicinity of the Tii-cities Barrel Superfund site, Town of Fenton, Broome County, New York.
Except for occasional transient individuals, no Federally listed or proposed endangered or threatened species under our jurisdiction are known to exist in the project.impact area. Therefore, no Biological Assessment or further Section 7 consultation under the Endangered Species Act (87 Stat. 884, as amended; 16 U.S.C. 1531 et seq.) is required with the U.S. Fish and Wildlife Service (Service). Should project plans change, or if additional information on listed or proposed species becomes available, this determination may be reconsidered.
The above comments pertaining to endangered species under our jurisdiction are provided pursuant to the Endangered Species Act. This response does not preclude additional Service comments under the Fish and Wildlife Coordination Act or other legislation.
For additional information on fish and wildlife resources or State-listed species, we suggest you contact:
. New York State Department of New York State Department of Environmental Conservation Environmental Conservation
Region 7 Wildlife Resources Center - Information Serv. 1285 Fisher Avenue New York Natural Heritage Program Cortland, NY 13045-1090 700 Troy-Schenectady Road (607)753-3095 Latham, NY 12110-2400
(518) 783-3932
The National Wetlands Inventory (NWI) map of the Chenango Forks Quadrangle indicates that there may be wetlands in the project vicinity. However, while the NWI maps are reasonably accurate, they should not be used in lieu of field surveys for determining the presence of wetlands or delineating wetland boundaries for Federal regulatory purposes.
^'-'*^'^8f'925 A2-18
Work in certain waters and wetlands of the United States may require a permit from the U.S. Army Corps of Engineers (Corps). If a permit is required, in reviewing the application pursuant to the Fish and Wildlife Coordination Act, the Service may concur, with or without stipulations, or recommend denial of the pennit depending upon the potential adverse impacts on fish and wildlife resources associated with project implementation. The need for a Corps permit may be determined by contacting Mr. Paul Leuchner, Chief, Regulatory Branch, U.S. Army Corps of Engineers, 1776 Niagara Street, Buffalo, NY 14207 (telephone: r716] 879-4321).
If you have any questions regarding this letter, contact Tom McCartney at (607) 753-9334.
Sincerely^ ^ .
ACTING FOR
David A. Stilwell Acting Field Supervisor
cc: NYSDEC, Cortland, NY (Regulatory Affain) NYSDEC, Latham, NY COE, Buffalo, NY EPA, Chief, Marine & WeUands Protection Branch, New York, NY
Aldrin is a persistent pesticide that is very toxic to aquatic and terrestrial animals (USEPA 1985). It degrades to dieldrin, another pesticide, under normal environmental conditions and by animal metabolism. Exposure to aldrin is reported to produce adverse biochemical and metabolic effects in a variety of aquatic species (Kline et al. 1987). Aldrin is acutely toxic to freshwater aquatic life at low concentrations. Acute toxicity in freshwater fish is associated with LCjo values that range from 1 to 46 fig/L.. The acute water quality criterion for aldrin is 3.0 A g/L. The bioconcentration factor for aquatic organisms ranges from IE+03 to 1 E+04 (USEPA 1985). The ER-L for dieldrin in sediments is 0.02 Mg/kg and the ER-M is 8 fig/kg (Long and Morgan 1991). Persaud et al. (1993) report a lowest effect level for both compounds of 0.000 /xg/kg and severe effect levels of 8 and 91 for aldrin and dieldrin, respectively.
Aldrin is acutely toxic to mammals, with oral LDjo values of 39 to 60 mg/kg and dermal LD50 values of 60 to 100 mg/kg in rats (ATSDR 1993). Large-scale kills of terresttial wildlife have been associated with aldrin-treated areas (USEPA 1985). Liver toxicity and central nervous system abnormalities are chronic effects attributed to aldrin/dieldrin (USEPA 1985). Chronic oral exposure to 0.025-0.05 mg/kg/day aldrin or dieldrin produced liver lesions in rats (USEPA 1995). Tremors or convulsion have been observed in mice and rats following chronic exposure to 0.33 to 2.5 mg/kg/day aldrin or dieldrin (ATSDR 1993). Decreased fertility, effects on gestation and increased fetal death are observed reproductive effects. Teratogenic effects include skeletal anomalies, webbed foot and cleft palate (USEPA 1985).
In a two-year chronic study, rats were fed dieldrin at dietary concentrations ranging from 0.1 to 10 ppm (Walker et al. 1969). At the end of the study, females at the two highest dosing levels had increased liver weights and liver-to-body-weight ratios. Focal proliferation and hyperplasia also were observed in liver parenchymal cells. This study identified a NOAEL of 5E-03 mg/kg/day and a LOAEL of 5E-02 mg/kg/day (USEPA 1995).
Aldrin and dieldrin are carcinogenic in rats and mice, producing a higher incidence of liver tumors at low doses (USEPA 1985). Various strains of mice of both sexes have been used in oral carcinogenic studies for dieldrin (USEPA 1995). All studies produced liver carcinomas.
References:
ATSDR. 1993. Agency for Toxic Substances and Disease Registry. Toxicological profile for aldrin/dieldrin. Atlanta, GA: Agency for Toxic Substances and Disease Registry.
Kline ER, Mattson VR, Pickering QH, Spehar DL, Stephan CE. 1987. Effects of pollution on freshwater organisms. J. WPCF 59:539-572.
Long ER, Morgan LG. 1991. The potential for biological effects of sediment-sorbed contaminants tested in the national status and trends program. Seattle, WA: National Oceanic and Atmospheric Administration. NOAA Technical Memorandum NOS OMA 52.
A3-2 . . ^
301928
Persaud D., Jaagumagi, R. and Hayton R. 1993. Guidelines for the Protection and Management of Aquatic Sediment Quality in Ontario. Ontario Ministry of the Environment. ISBN 0-729-9248-7.
USEPA. 1995. U.S. Environmental Protection Agency. Integrated Risk Information System (IRIS). March 1995 retrieval.
USEPA. 1985. U.S. Environmental Protection Agency. Chemical, physical and biological properties of compounds present at hazardous waste sites. Washington, DC: U.S. Environmental Protection Agency, Office of Waste Programs Enforcement. September 27, 1985.
2.0 ANTIMONY
References:
ATSDR. 1992. Agency for Toxic Substances and Disease Registry. Toxicological profile for antimony. Atlanta, GA: Agency for Toxic Substances and Disease Registry.
USEPA. 1995. U.S. Environmental Protection Agency. Integrated Risk Information System. March 1995 retrieval.
Environmental Protection Agency, Office of Waste Programs Enforcement. September 27, 1985
A3-3 3Dii929
I I i
Antimony has a relatively low toxicity in aquatic organisms. The LCJQ and EC50 for Daphnia ^ magna and the fathead minnow range from 9,000 to 21,900 ^g/L (USEPA 1985). Chronic M values for these two species are 5,400 /.ig/L and 1,600 /ig/L, respectively. Antimony inhibits the synthesis of chlorophyll a in freshwater alga Selenastrum capricomutum with an EC50 of a | 610 fig/L (USEPA 1985). Antimony does not appear to bioconcentrate in fish and aquatic • organism to any significant extent. Bioconcentration factors for antimony reportedly range from 0.15 to 390 (ATSDR 1992). The ER-L concentration for antimony in sediments is 2 mg/kg; the — ER-M is 25 mg/kg (Long and Morgan 1991). I
No information on the toxicity of antimony to wildlife or domestic animals was located. Animal ^ ^ toxicity studies indicated functional changes in electrocardiogram patterns and histopathological ^ K evidence of myocardial structural damage. LOAELs of 0.262 to 0.35 mg/kg/day were identified ^ ^ in rats and mice for hematological efrects (decreased nonfastmg serum glucose and increased ^ serum cholesterol) and decreased longevity after chronic oral exposure to potassiimi antimony » tartrate (ATSDR 1992; USEPA 1995). Various antimony compounds (antimony trioxide, antimony trichloride and antimony pentachloride) can be mutagenic (USEPA 1985). Inhalation ^ studies in laboratory rats indicated that antimony trioxide can produce lung tumors. M
I I
Long ER, Morgan LG. 1991. The potential for biological effects of sediment-sorbed ^ contaminants tested in the national status and trends program. Seattie, WA: National Oceanic _ and Atmospheric Administration. NOAA Technical Memorandum NOS OMA 52, M
I USEPA. 1985. U.S. Environmental Protection Agency. Chemical, physical and biological properties of compounds present at hazardous waste sites. Washington, DC: U.S. ' • F.nvirnnmpntnl Prntpot inn A0«>nrv Offiri* nf Was tp P r n a r a m s Pnfnrrp.mpnf .^pnfemhpr 77 1Q8S W
I
I I I I I
I I I I I I
f I
3.0 BARIUM
There is littie evidence that barium sulfate (barite) is toxic to aquatic organisms. Concentrations of 10 to 100 /iM barium inhibited growth and growth associated processes in bacteria, fungi, moss and algae (USEPA 1980). Concentrations of up to 7,500 ppm barite did not kill oysters or estuarine fish and crustaceans after up to 96 hours of exposure (Daugherty 1951). Grantham and Sloan (1975) found that sailfin mollies (Poeulia latipinna) had no mortality after exposure to 100,000 ppm barite for 96 hours. Bioconcentration factors ranging from 100 to 260 have been reported for brown algae, plankton and marine animals (USEPA 1980).
Data conceming the toxicity of barium in terrestrial wildlife were not located. However, studies in laboratory animals indicate that barium can adversely affect blood pressure and survival. Oral LD50 values ranging from 132 to 277 mg/kg have been reported for rats (ATSDR 1992). Chronic oral exposures of mice to 0.95 mg/kg/day resulted in decreased life expectancy (ATSDR 1992). Increased blood pressure has been reported in rats ingesting doses of 0.5 mg/kg/day or higher, but no increase was observed below a dose of 0.054 mg/kg/day (Perry et al. 1983). Rats exposed to barium at up to 31.5 mg/kg/day for up to 13 weeks showed no conclusive signs of toxicity (Tardiff et al. 1980). Blood pressure was not measured in this study. RTECS (1987) reports oral LD50 for barium carbonate of 200 mg/kg (mice) and 418 mg/kg (rats), but no toxic effects were noted in the studies. Barium chloride appears to show greater acute toxicity in mammals, with oral LD50 values of 70 mg/kg (mouse), 76 mg/kg (guinea pig), 118 mg/kg (rat) and 170 mg/kg (rabbit). Toxic effects were not reported in RTECS (1987). RTECS (1987) contained no acute or chronic mammalian toxicity data for barium sulfate. Small doses of barium sulfate administered orally (less than 60 mg/kg) are likely to be as bioavailable as barium chloride (Keifer 1989). A NOAEL of 0.054 mg/kg/day and a LOAEL of 0.54 mg/kg/day were reported for rats administered barium chloride by the oral route (ATSDR 1992). The critical effect in this study was increased blood pressure, with myocardial pathophysiologic and metabolic changes occurring at higher levels (ATSDR 1992).
Terrestrial plants do not appear to bioconcentrate barium to any significant extent, however this has not been fially smdied (ATSDR 1992).
References:
ATSDR. 1992. Agency for Toxic Substances and Disease Registry. Toxicological profile for barium. Aflanta, GA: Agency for Toxic Substances and Disease Registry.
Daugherty FM Jr. 1951. Effects of some chemicals used in oil well drilling on marine animals. Sewage and Industrial Wastes, 23:1282-1287.
Grantham CK and Sloan JP. 1975. Toxicity smdy. Drilling fluid chemicals on aquatic life. In: Environmental aspects of chemical use in oil well-drilling operations. Conference Proceedings, May. Houston, TX: Report No. EPA-560/1-75-004. U.S. Environmental Protection Agency, p. 103-110.
'" rCOXM .,
I Perry HM, Kopp SF, Erlanger MW, Perry EF. 1983. Cardiovascular effects of chronic bariiun ingestion. In: Hemphill DD, ed. Trace substances in environmental health-XVII. Proceedings of University of Missouri's 17th annual conference of trace substances in environmental health. Columbia, MO: University of Missouri Press.
Keifer LC. 1989. Bioavailability/absorption review of barium sulfate in response to a petition to delist the material from the toxic emissions inventory. Washington, DC: U.S. Enviroimiental Protection Agency. Memorandum to Flora Chow dated September 8, 1989.
RTECS. 1987. Registry of toxic effects of chemical substances, 1985-1986 edition. Volume 1. Washington, DC: U.S. Government Printing Office.
Tardiff RG, Robinson M, Uhner NS. 1980. Subchronic oral toxicity of BaClz in rats. J. Environ. Pathol. Toxicol. 4:267-275.
USEPA. 1980. U.S. Environmental Protection Agency. Water quality criteria for barium and compounds. Cincinnati, OH: U.S. Environmental Protection Agency.
4.0 BERYLLIUM
The toxicity of beryllium to aquatic wildlife is dependent on water hardness. In general, the toxicity of beryllium decreases as water hardness increases. Acute and chronic toxicity values for Daphnia magna were reported to be 2,500 and 5.3 /itg/L (water hardness = 220 mg CaCOj/L) (USEPA 1985). Acute toxicity values for fathead minnows range from 150 to 20,000 /ig/L (water hardness = 20 to 400 /ig CaCOj/L) (USEPA 1985). Beryllium does not bioconcentrate to any significant extent in aquatic organisms. Bioconcentration factors typically range from 19 to 100 for beryllium in aquatic species (ATSDR 1993).
Rachitic bone changes have been noted in poultry and livestock exposed to food and water containing 0.125% beryllium carbonate (USEPA 1985). Studies in laboratory animals indicate that beryllium is toxic by both inhalation and oral routes of exposure. Chronic inhalation exposure to 0.006 to 0.62 mg/m' beryllium produced a number of respiratory effects including inflammation, proliferation, fibrosis and granulomas in the lungs of rats, hamsters and monkeys (ATSDR 1993). An increased incidence of lung tumors has been noted in rats and monkeys following chronic inhalation exposure to beryllium. Oral exposure to 10 to 121 mg/kg/day beryllium produced rickets in rats (ATSDR 1993). Glucosuria was noted in rats exposed to 0.65 mg/kg/day for 3.2 years (ATSDR 1993). Other studies reported no adverse effects in rats and mice chronically exposed via drinking water to 0.54 to 0.8 mg/kg/day (ATSDR 1993, USEPA 1995).
References:
ATSDR. 1993. Agency for Toxic Substances and Disease Registry. Toxicological profile for beryllium. Atianta, GA: Agency for Toxic Substances and Disease Registry.
.. 301931 ^'^
4
\
k
f
USEPA. 1995. U.S. Environmental Protection Agency. Integrated Risk Information System (IRIS). March 1995 retrieval.
USEPA. 1985. U.S. Environmental Protection Agency. Chemical, physical and biological properties of compounds present at hazardous waste sites. Washington, DC: U.S. Environmental Protection Agency, Office of Waste Programs Enforcement. September 27, 1985.
5.0 BIS(2-ETHYLHEXYL)PHTHALATE
Bis(2-ethylhexyl)phthalate has a relatively low toxicity in freshwater. The acute median effect concentration for Daphnia magna ranged from 1,000 to 11,100 /xg/L (USEPA 1985). However, reproductive impairment occurred in Daphnia magna at concentrations as low as 3 /xg/L. The LCjo concentrations for the midge, scud and bluegill exceeded 18,000 /xg/L, 32,000 /xg/L and 770,000 /ig/L, respectively. These values exceed the water solubility of the chemical (USEPA 1985). Therefore, bis(2-ethylhexyl)phthalate could have toxic effects in chronically exposed freshwater aquatic life, but is unlikely to pose a hazard to aquatic life under acute exposure conditions. Bioconcentration of bis(2-ethylhexyl)phthalate has been reported in aquatic organisms. Bioconcentration factors for invertebrates and fish reportedly range from 54 to 2,700 (ATSDR 1993).
Data regarding the toxicity of bis(2-ethylhexyl)phthalate in terrestrial wildlife were not located. However, studies in laboratory animals indicate that exposure to bis(2-ethylhexyl)phthalate can produce a variety of effects. Oral LDJQ values of 30,600 to 33,900 mg/kg have been reported in rats and rabbits following single exposures, and 2,000 mg/kg/day for 5- to 7-day exposures (ATSDR 1993). Oral exposure results in teratogenic, fetotoxic and other reproductive effects, including testicular changes, in rats and mice. In a 102-week rat smdy, inhibition of spermatogenesis and tubular atrophy were observed at 10 mg/kg/day. Mice exhibited a decrease in fertility following subchronic exposure to 130 mg/kg/day (ATSDR 1993). A NOAEL of 13 mg/kg/day was reported in this smdy. Signs of teratogenicity were observed in mice exposed to 91 mg/kg/day during gestation (ATSDR 1993). Chronic exposure to high levels of the chemical by the oral route cause increased liver and kidney weight and retardation in growth in laboratory animals (USEPA 1985). A LOAEL of 19 mg/kg/day was identified for increased liver weight in guinea pigs (USEPA 1995). Toxicity by the dermal route has not been observed (USEPA 1985). Rats and mice exposed to bis(2-ethylhexyl)phthalate by the oral route experienced an increased incidence of hepatocellular carcinomas or neoplastic nodules (USEPA 1985).
References:
ATSDR. 1993. Agency for Toxic Substances and Disease Registry. Toxicological profile for di(2-ethylhexyl)phthalate. Aflanta, GA: Agency for Toxic Substances and Disease Registry.
USEPA. 1995. U.S. Environmental Protection Agency. Integrated Risk Information System (IRIS). March 1995 retrieval.
A3-6
I 'Ct'CJA'tQOg
USEPA. 1985. U.S. Environmental Protection Agency. Chemical, physical and biological properties of compounds present at hazardous waste sites. Washington, DC: U.S. Environmental Protection Agency, Office of Waste Programs Enforcement. September 27, 1985.
6.0 CADMIUM
The primary adverse effect on freshwater plants from cadmium exposure is growth reduction. Growth reduction occurred in diatoms and green algae (Chlorella and Selenastrum spp.) at cadmium concentrations ranging from 2 to 250 /xg/L. Reduction in frond number occurred in freshwater ferns and duckweed at 10 /xg/L (USEPA 1980). The acute toxicity of cadmium to freshwater organisms ranges from 1.0 to 73,500 /ig/L for fish and from 3.5 to 28,000 /xg/L for invertebrates. Cladocerans are the most sensitive invertebrates with toxicity values (LC50) of about 30-60 /tg/L. Rotifers are somewhat more resistant with acute LC50 values of 200-500 /xg/L. Mayflies and stoneflies are the most resistant with acute LC50 values of about 20,000 /xg/L. Cadmium toxicity in fish varies greafly among species wifli salmon, rainbow trout and brook trout having acute LCJQ values of 1 to about 29 /xg/L and goldfish, fathead minnows and sunfish having LCJQ values between 2,100 and 66,000 /xg/L (USEPA 1980). Spehar et al. (1978) reported a whole body bioconcentration factor of 1,750 for Phvsa in a 28-day exposure. Bioconcentration factors for cadmium in freshwater fish range from 3 for brook trout muscle to 12,400 for mosquitofish (whole body) (USEPA 1980). Persaud et al. (1993) report a lowest effect level for cadmium in sediments of 0.6 mg/kg and a severe effect level of 10 mg/kg.
Waterfowl are relatively resistant to short-term exposure to cadmium (Eisler 1985). Ducks produce large amounts of metallothionems which bind heavy metals, thus reducing cadmium's toxicity potential (Brown et al. 1977). Chronic effects have been observed in mallard ducklings fed 20 ppm dietary cadmium for 12 weeks, including disruption of blood chemistry and development of kidney lesions (Cain et al. 1983). Behavioral effects in young American black ducks have been associated wifli 4 ppm dietary cadmium fed to parents. Symptoms included hyperresponsiveness and altered avoidance behavior (Heinz and Haseltine 1983). The potential for bioaccumulation of cadmium is high. A diet of 200 ppm cadmium for 13 weeks resulted in accumulations in both the liver (110 ppm fresh weight (FW)) and kidney (134 ppm FW) of drake mallards (White and Finley 1978). Similarly, 20 ppm dietary cadmium for 12 weeks produced concentrations of 42 ppm in the liver of mallard ducklings (Cain et al. 1983).
Laboratory smdies indicate that cadmium is acutely toxic to animals. An LC50 value of 33 mg/m^ and LD50 values ranging from 95.5 to 330 mg/kg were reported in rats and mice for acute inhalation and oral exposures, respectively (ATSDR 1991). An LD50 value of 101 mg/kg was reported for chickens acutely exposed to cadmium (RTECS 1993). Inhalation exposures to 0.2 to 6.5 mg Cd/w? produced pulmonary inflammation, edema and emphysema in rats (ATSDR 1991). Lung mmors were observed in rats chronically exposed to 0.013-0.03 mg/m^ (ATSDR 1991). Oral exposure of rats and mice to cadmium for intermediate and chronic durations produced malformations at doses of 1.9-40 mg/kg/day, testicular necrosis at doses of 14-100 mg/kg/day, decreased fertility at doses of 1.9-10 mg/kg/day, anemia at doses of 1.4-15 mg/kg/day, and renal mbule damage at doses of 1.8-14 mg/kg/day (ATSDR 1991). No reproductive effects were noted in dogs exposed to 0.75 mg/kg/day cadmium (ATSDR 1991). A LOAEL of 0.11 mg/kg/day was reported for increased blood pressure in rabbits subchronically exposed to
A3-7
I I I I I 1 4 I I I I f I I
I
i
cadmium (ATSDR 1991). Similarly, a NOAEL of 0.004 mg/kg/day and a LOAEL of 0.014 mg/kg/day were identified in rats for flie same effect (ATSDR 1991).
References:
ATSDR. 1991. Agency for Toxic Substances and Disease Registry. Toxicological profile for cadmium (draft). Aflanta, GA: Agency for Toxic Substances and Disease Registry.
Brown DA, Bawden CA, Chatel KW, Parsons TR. 1977. The wildlife community of lona Island jetty, Vancouver, BC, and heavy metal pollution effects. Environ. Conserv. 4:213-216.
Cain BW, Sileo L, Frarson JC, Moore J. 1983. Effects of dietary cadmium on mallard ducklings. Environ. Res. 32:286-297.
Eisler R. 1985. Cadmium effects to fish, wildlife and invertebrates: A synoptic review. U.S. Fish and Wild. SeiV. Biol. Rep. 85(1.2)
Heinz GH, Haseltine SD. 1983. Altered avoidance behavior of young black ducks fed cadmium. Environ. Toxicol. Chem. 2:419-421.
Persaud D,, Jaagumagi, R. and Hayton R. 1993. Guidelines for the Protection and Management of Aquatic Sediment Quality in Ontario. Ontario Ministry of the Environment. ISBN 0-7729-9248-7.
RTECS. 1993. Registry of Toxic Effects of Chemical Substances. National Instimte for Occupational Safety and Health.
Spehar RL et al. 1978. Toxicity and bioaccumulation of cadmium and lead in aquatic invertebrates. Environ. Pollut. 15:195.
USEPA. 1980. U.S. Environmental Protection Agency. Office of Water Regulations and Standards. Ambient water quality criteria for cadmium. PB81-117368.
7.0 CHLORDANE
Chlordane is toxic to aquatic species at relatively low concentrations. Acute and chronic toxicity values for freshwater species are 2.4 and 0.17 /tg/L, respectively (USEPA 1985). Chlordane shows a strong tendency for bioconcentration in aquatic organisms. Bioconcentration factors of 200 to 55,900 and 18,500 have been reported for bacteria and rainbow trout, respectively (ATSDR 1992). The ER-L concentration for chlordane in sediments is 0.5 /xg/kg; tiie ER-M is 6 /xg/kg (Long and Morgan 1991). Persaud et al. (1993) report no effect, lowest effect and severe effect levels of 0.005, 0.007 and 6 mg/kg, respectively.
Little information is available concerning the toxicity of chlordane to terrestrial wildlife. Chlordane is readily absorbed by warm-blooded animals through skin, diet and inhalation. Certain soil invertebrates appear to be sensitive to the toxic effects of chlordane (USEPA 1985).
A3-8 ;^-r C i (•••>,
934
Chlordane has been applied extensively to control invertebrate soil pests. At rates of 0.6 to 2.24 kg/ha, sensitive nontarget species, such as earthworms are adversely affected (Eisler 1990). At 13 kg/ha, earthworm metabolism was affected within two weeks and remained depressed for five years; at 80 kg/ha significant mortality was observed within four days (NRCC 1975). At lower application levels (1 to 2 kg/ha), chlordane was leflial to fly and beefle larvae and other soil invertebrates (WHO 1984).
In laboratory animals, oral LDJQ values reportedly range from 137 mg/kg in rats to 1,720 mg/kg in hamsters (ATSDR 1992). The primary effects of chlordane involve the reproductive, neurological and hepatic systems. Decreased fertility was noted in rats subchronically exposed to 16 mg/kg/day (ATSDR 1992). Tremors and convulsions have been observed in rats and mice exposed to 5 to 12.1 mg/kg/day in feed for subchronic and chronic durations, respectively (ATSDR 1992). A NOAEL of 0.055 mg/kg/day and a LOAEL of 0.273 mg/kg/day were identified in female rats for liver hypertrophy (USEPA 1995). Rats were fed technical grade chlordane at dietary levels from 0 to 25 ppm for 130 weeks.
Chlordane has produced liver tumors in mice following chronic oral exposures (ATSDR 1992). In general, food cham biomagnification is low except in some marine mammals. Biomagnification of chlordane-related compounds was studied in an arctic food chain (cod-seal-polar bear). Muir et al. (1988) found an overall biomagnification factor of 42, but both chlordane isomers decreased at higher trophic levels, with only oxychlordane present in the polar bears. The metabolite, oxychlordane, is more toxic and persistent than the parent compound (Eisler 1990).
References:
ATSDR. 1992. Agency for Toxic Substances and Disease Registry. Toxicological profile for chlordane. Draft. Aflanta, GA: Agency for Toxic Substances and Disease Registry.
Eisler R. 1990. Chlordane hazards to fish, wildlife and invertebrates. A synoptic review. Washmgton, DC: U.S. Department of tiie Interior, Fish and Wildlife Service: Biological Report 85(1.21).
Long ER, Morgan LG. 1991. The potential for biological effects of sediment-sorbed contaminants tested in flie national stams and trends program. Seattle, WA: National Oceanic and Atmospheric Administration. NOAA Technical Memorandum NOS OMA 52.
Muir DC, Norstrom RU, Simon M. 1988. Organochlorine contaminants in arctic marine compounds. Env. Sci. Tech. 22:1071-1079.
A3-9
I LD50 values ranging from 25 to 50 mg/kg have been reported for a number of wild bird species B (USEPA 1985). Signs of chlordane toxicity in birds include sluggishness, drooped eyelids, ^ { fluffed feathers, convulsions and other neurotoxicological symptoms (Eisler 1990). Toxic effects are attributed primarily to chlordane metabolites, oxychlordane and (to a lesser extent) heptachlor epoxide (Stickel et al. 1979). Oxychlordane residues in brain tissue of approximately 5 mg/kg (fresh weight) were considered within the lethal zone.
CKIW'
i I I I
4 I I I I I I
I
I
I»
f
NRCC. 1975. National Research Council of Canada. Chlordane: its effects on Canadian ecosystems and its chemistry. Nat. Res. Counc. Can. Publ. NRCC 14094.
Persaud D., Jaagumagi, R. and Hayton R. 1993. Guidelines for flie Protection and Management of Aquatic Sediment Quality in Ontario. Ontario Ministry of the Environment and Energy. ISBN 0-7729-9248-7.
Stickel LF, Stickel WH, McArfliur RD, Hughes DL. 1979. Chlordane in birds: a smdy of lethal residues and loss rates. In: Deichmann WB. ed. Toxicology and occupational medicine. New York, NY: Elsevier/Norfli Holland.
USEPA. 1995. U.S. Environmental Protection Agency. Integrated Risk Information System (IRIS). March 1995 rettieval.
USEPA. 1985. U.S. Environmental Protection Agency. Chemical, physical and biological properties of compounds present at hazardous waste sites. Washington, DC: U.S. Environmental Protection Agency, Office of Waste Programs Enforcement. September 27, 1985.
WHO. 1984. World Healtii Organization. Chlordane Environmental Healfli Criteria 34. Geneva Switzerland: World Health Organization.
8.0 CHROMIUM
Aquatic species are sensitive to both valence states of chromium, Cr(III) (trivalent) and Cr(VI) (hexavalent). For trivalent chromium, toxicity is greater in soft water than in hard water. In soft water, LCJQ values for Cr(in) range from 2,000 /xg/L (mayfly) to 64,000 /xg/L (caddisfly) (USEPA 1984). In fish, LCjo values range from 3,300 /xg/L (guppy, soft water) to 71,900 /xg/L (bluegill, hard water). Chronic values of 1,000 /xg/L (fathead minnow) and 66 /xg/L (Daphnia) were reported in life cycle tests. A concentration of 9,900 /xg/L inhibited root growth in one freshwater plant species. For Cr(VI), acute aquatic data indicate that invertebrate species are more sensitive than most fish (USEPA 1984, Eisler 1986). An amphipod crustacean was the most acutely sensitive (67 /ig/L). Chronic toxicity values for trout were 265 /xg/L and 1,900 fig/L for the fathead minnow. Hexavalent chromium has been reported to reduce growth in sahnon (at 16 /xg/L) and reduce life span and fecundity in Daphnia (10 /xg/L). Chromium is not expected to bioaccumulate in the aquatic food chain. A bioconcentration factor of 1 was reported for rainbow trout, whereas bioconcentration factors ranging from 86 to 192 were reported for oysters, mussels and clams (ATSDR 1993). The ER-L concentration for chromium in sediments is 80 mg/kg is the ER-M is 145 mg/kg (Long and Morgan 1991). Persaud et al. (1993) report lowest effect and severe effect levels of 26 and 110 mg/kg, respectively.
Chromium is essential for regulating carbohydrate metabolism in mammals. There are reports of deficiencies described in the literature in rats, guinea pigs and monkeys (Eisler 1986). Data regarding the toxicity of chromium in terrestrial wildlife were not located. There are litfle data on toxicity of chromium to terrestrial invertebrates. A concentration of 10 to 15 mg/L of hexavalent chromium in irrigation water was letiial to earthworms (Eisler 1986). Acute and chronic effects of chromium to birds is primarily caused by the hexavalent form. Male domestic
A3-10
I se
chickens fed 100 ppm of Cr(VI) in their diet (32 days) showed no adverse effects; however, teratogenic effects were reported when chicken eggs were injected with Cr(VI) during incubation (Eisler 1986). Smdies in laboratory animals indicate tiiat chromium can produce a number of effects. Oral LD50 values have been reported in rats, ranging from 13 to 811 mg/kg for Cr(VI) and 183 to 2,365 mg/kg for Cr(in) (ATSDR 1993). Reproductive effects (decreased gT spermatogenesis, increased fetal resorptions) and developmental effects (reduced ossification, • increased incidence of gross anomalies) have been observed in mice following subchronic exposures to 3.5 to 57 mg/kg/day (ATSDR 1993). A NOAEL of 2.4 mg/kg/day was identified ^ , for rats chronically exposed to Cr(VI) (USEPA 1995). Similar no-effect levels have been • reported in dogs. Groups of male and female rats were fed varying levels of chromic oxide baked in bread over 840 days. No effects were seen at any dose level (Ivankovic and m Preussmann 1973). The NOAEL for Cr(III) established in tiiis smdy was 1,468 mg/kg/day I (USEPA 1995).
An increased mcidence of lung mmors have been observed in mice and rats exposed via I inhalation of chromium (VI) dusts. '-,,
Bioconcentration of chromium in terrestrial plants and animals does not appear to be significant • (ATSDR 1993). *
References:
ATSDR. 1993. Agency for Toxic Substances and Disease Registry. Toxicological profile for chromium. Aflanta, GA: Agency for Toxic Substances and Disease Registry.
I il
0
Eisler R. 1986. Chromium hazards to fish, wildlife, and invertebrates: A synoptic review. ^ U.S. Fish and Wildlife Service, U.S. Department of the Interior, Laurel, MD: U.S. Department • of flie Interior. ^ Ivankovic S, Preussmann R. 1975. Absence of toxic and carcinogenic effects after • administration of high doses of chronic oxide pigment in subacute and long-term feeding experiments in rats. Food Cosmet. Toxicol. 13:347-351. ^
Long ER, Morgan LG. 1991. The potential for biological effects of sediment-sorbed " contaminants tested in the national stams and trends program. Seattie, WA: National Oceanic ^ and Atmospheric Administration. NOAA Technical Memorandum NOS OMA 52. I
Persaud D., Jaagumagi, R. and Hayton R. 1993. Guidelines for the Protection and Management of Aquatic Sediment (Quality in Ontario. Ontario Ministry of the Environment. ISBN 0-7729-9248-7.
USEPA. 1984. U.S. Environmental Protection Agency. Ambient water quality criteria for chromium. Washington, DC: U.S. Environmental Protection Agency. EPA 440/5-84-029.
A3-11
I USEPA. 1995. U.S. Environmental Protection Agency. Integrated Risk Information System I (IRIS). March 1995 rettieval. "
I
I
I t
f 1
9.0 COPPER
Aquatic plants, invertebrates and fish are sensitive to the toxic effects of copper. The toxicity of copper to aquatic organisms is affected by various environmental conditions. Copper toxicity decreases as the hardness of the water increases. Total organic carbon also reduces copper toxicity, probably due to complexation. Copper toxicity and inhibitory effects towards aquatic plants are well known (USEPA 1985b). Some plants excrete chelating agents to lower the concentration of the cupric ion, the biologically active species.
Acute toxicity values in hard water range from 6.5 /xg/L for Daphnia magna to 10,200 /xg/L for flie bluegill. Among benthic invertebrates, Phvsa spp. (snails) were very sensitive to copper concentrations greater than 35 /xg/L (USEPA 1985b). Sediment copper concentrations greater than 681 mg/kg inhibited growth or were lethal to a variety of freshwater invertebrates (Cairns et al. 1984, Malveg et al. 1984). Insects are more resistant to flie toxic effects of copper than are some of the other invertebrate species.
The chronic toxicity values for freshwater species range from 3.9 /xg/L for brook trout to 60 /xg/L for northern pike (USEPA 1985b). Concend-ations as low as 6.1 /xg/L and 3.9 /ig/L caused chronic toxicity in some invertebrates and fish species, respectively. Among coldwater fish, salmon and trout displayed adverse effects at copper concentrations as low as 4 /xg/L. Warmwater fish are generally one to three orders of magnimde more resistant than sahnonids. An acute toxicity of 42.5 /xg/L of copper for rainbow trout at a water hardness of 50 mg/L was reported (USEPA 1985b). Acutely toxic effects of copper in bluegill sunfish occur at copper concentrations greater than 1,000 /xg/L at 50 mg/L hardness. In a smdy by McKim et al. (1978) copper concentrations of 23.0 and 20.8 /ig/L (water hardness of 44.5 mg CaCOs) had no effect on early-eyed and late-eyed brown trout embryos, respectively. Significant chronic toxicity, however, was noted at 46.5 /xg/L and 43.8 /tg/L for each embryo classification. It is expected that acute toxicity to brown trout would occur at copper concentrations considerably greater than the chronic toxicity values discussed above. The bioconcentration factor for copper in bluegill is zero (USEPA 1985b). In other fish, bioconcentration factors for copper typically range from 10 to 100, indicating a relatively low potential for bioconcentration (ATSDR 1990). However, in some molluscs, particularly oysters, the bioconcentration factor for copper may be as high as 30,000 (ATSDR 1990). Persaud et al. 1993 identified lowest and severe effect levels of copper in sediment at 16 and 110 mg/kg, respectively.
Acute exposures to 254 or 2,200 mg/kg copper was lethal to pigeons and quail, respectively (RTECS 1993). Copper toxicity has been demonstrated in sheep and swine. Acute poisoning occurred in sheep at a dose of approximately 200 mg/kg (USEPA 1985a). Copper salts act directiy on the gastrointestinal tract causing gastroenteritis, shock and death. Chronic exposure to excess copper causes absorption and accumulation of copper in the liver (USEPA 1985a). A sudden, acute hemolytic crisis can develop under these exposure conditions. A copper intake of 1.5 g/day over a period of 30 days was fatal in many breeds of sheep (USEPA 1985a). A dietary dose of 250 mg/kg copper caused toxicosis with hypochromic microcytic anemia, jaundice and marked increases in liver and serum copper levels in swine, unless zinc and iron levels were increased (USEPA 1985a). Once removed from the diet, copper was rapidly eliminated by swine (USEPA 1985a). Increased mortality was noted in the offspring of mink following exposure to
A3-12
•^>'Ilif^l938
3 mg Cu/kg/day for 50 weeks (ATSDR 1990). There is no evidence of copper biomagnification through food chain trophic levels. The bioconcentration of copper in earthworms and rabbits does not appear to be significant (ATSDR 1990).
Laboratory smdies in rats and mice indicate that copper exposure affects the liver, survival and development. Hepatitis and liver necrosis were noted in rats exposed to 7.9 to 300 mg/kg/day for intermediate durations (ATSDR 1990). An increased incidence of malformations and increased mortality were observed in the offspring of mice exposed to 104 to 155 mg/kg/day (ATSDR 1990). Increased mortality was noted in mice chronically exposed to 4.2 mg/kg/day (ATSDR 1990).
References:
ATSDR. 1990. Agency for Toxic Substances and Disease Registry. Toxicological profile for copper. Aflanta, GA: Agency for Toxic Substances and Disease Registry.
Cairns MA, Nebeker AV, Gakstatter JA, Griffis WL. 1984. Toxicity of copper-spiked sedimenters to freshwater invertebrates. Environ. Toxicol. Chem. 3:435-445.
Malveg KW, Schuytema GS, Gaksratter JH, Krawczyk DF. 1984. Toxicity of sediments from three metal-contaminated areas. Environ. Toxicol. Chem. 3:279-291.
McKim JM, Eaton JG, Holcombe GW. 1978. Metal toxicity to embryos and larvae of eight freshwater fish - II: Copper. Bull. Environ. Contam. Toxicol. 19:608-616.
Persaud D., Jaagumagi, R. and Hayton R. 1993. Guidelines for the Protection and Management of Aquatic Sediment Quality in Ontario. Ontario Ministry of the Environment. ISBN 0-7729-9248-7.
RTECS. 1993. Registry of Toxic Effects of Chemical Substances. National Instimte for Occupational Safety and Health.
USEPA. 1985a. U.S. Environmental Protection Agency. Chemical, physical and biological properties of compounds present at hazardous waste sites. Washington, DC: U.S. Environmental Protection Agency, Office of Waste Programs Enforcement. September 27, 1985.
USEPA. 1985b. U.S. Environmental Protection Agency. Office of Water Regulations and Standards. Ambient water quality criteria for copper. Washington, DC: U.S. Environmental Protection Agency. EPA 440/5-84-031.
10.0 DDD, DDE AND DDT
DDT was a widely used insecticide banned for use in the United States in 1972. DDD and DDE occur as contaminants, breakdown products and metabolites of DDT (ATSDR 1992). Both DDT and DDE bioconcentrate and biomagnify in the food chain.
A3-13
4
1 t
f DDT has a wide range of toxic effects in animals and is well known for its adverse effects on reproduction in predatory birds, shorebirds and song birds. It reduced fertility, reduced offspring growth and increased fetal mortality (USEPA 1985). In most cases, these adverse effects were a result of exposure to the pesticide bioconcentrated in the adipose tissue of food organisms. There are numerous measurements of bioconcentration factors in fish; the steady state BCF in trout was estimated at 12,000 (Oliver and Niimi 1985). In sediments the ER-L and ER-M concentrations are as follows (Long and Morgan 1991).
Chemical
DDT DDD DDE Total DDT
ER-L, jxg/kg_
1 2 2 3
ER-M, jxg/kg_
7 20 15
350
Overall Apparent Effects
Threshold. ixg/kg
6
Confidence
Low Moderate/Low Low Moderate/Low
Similar values have been reported by Persaud et al. (1993) as follows:
Chemical
h
Total DDT DDD DDE
Lowest Effect Level /tg/kg 7 8 5
Severe Effect Level, /xg/kg 12 6 19
DDT causes chromosome damage and induces microsomal enzymes. The latter effect probably alters metabolism of steroid hormones and exogenous chemicals (USEPA 1985). Hypertrophy of parenchymal cells and increased fat deposition in the liver have also been reported. Seizures, decreased aggression, and decreased conditional reflexes from exposure to DDT are related to its effects on the central nervous system. The metabolite, DDE, has been shown to cause eggshell thinning in several bird species (Haegele et al. 1974).
Toxic effects in birds attributable to DDT include a variety of neurological symptoms (ataxia, wingdrop, tremors, convulsions, etc.). Estimated LDjo values reported in the literamre range from greater than 4,000 mg/kg (Rock dove) to 595 mg/kg (California quail) (Hudson et al. 1984). Feeding smdies for 90 days at 30 ppm (feed) and 60 days at 100 ppm (feed) resulted in no adverse effects (Hudson et al. 1984). These smdies used mallards, bobwhites and California quail.
f I
Oral LD50 values for DDT in rats have been reported to be as low as 113 mg/kg. Oral LD50 values for DDT ranged from 237 to 400 mg/kg in mice, rabbits, and guinea pigs (ATSDR 1992). Reproductive and developmental effects such as increased frequency of abortion, decreased survival and increased incidence of tail anomalies were noted in rats and mice chronically exposed to 1.3 to 13 mg/kg/day DDT (ATSDR 1992). A NOAEL of 0.05 mg/kg/day and a LOAEL of 0.25 mg/kg/day were identified for liver lesions in rats exposed to DDT (USEPA 1995). A LOAEL of 12 mg/kg/day for liver necrosis and a LOAEL of 121 for attophy of the
A3-14
'fM 6> i40
tiiymus were identified in rats for DDE and DDD, respectively (ATSDR 1992). Exposure to these pesticides caused liver tumors, lung tumors and lymphomas in mice and rats.
References:
ATSDR. 1992. Agency for Toxic Substances and Disease Registry. Toxicological profile for DDT, DDE, and DDD. Draft. Aflanta, GA: Agency for Toxic Substances and Disease Registry.
Hudson RH, Tucker RK, Haegele MA. 1984. Handbook of toxicity of pesticides to wildlife. Second edition. Washington, DC: U.S. Department of flie Interior. Fish and Wildlife Service. Resource Publication 153.
Haegele MA, Hudson RH. 1974. Eggshell thinning and residues in mallards one year after DDE exposure. Arch. Environ. Contam. Toxicol. 2:356-363.
Long ER, Morgan LG. 1991. The potential for biological effects of sediment-sorbed contaminants tested in the national stams and trends program. Seattie, WA: National Oceanic and Atmospheric Administration. NOAA Technical Memorandum NOS OMA 52.
Oliver B, Niimi A. 1985. Bioconcentration factors of some halogenated organics for rainbow O-out: limitations in their use for prediction of environmental residues. Environ. Sci. Technol. 19:842-849.
Persaud D., Jaagumagi, R. and Hayton R. 1993. Guidelines for the Protection and Management of Aquatic Sediment Quality in Ontario. Ontario Ministry of the Environment and Energy. ISBN 0-7729-9248-7.
USEPA. 1995. U.S. Environmental Protection Agency. Integrated Risk Information System (IRIS). March 1995 retrieval.
USEPA. 1985. U.S. Environmental Protection Agency. Chemical, physical and biological properties of compounds present at hazardous waste sites. Washington, DC: U.S. Environmental Protection Agency, Office of Waste Programs Enforcement. September 27, 1985.
11.0 DIBENZOFURAN
Data regarding the toxicity of dibenzofuran to aquatic or terrestrial wildlife, or laboratory animals were not located. Based on an equilibrium partitioning method, a Sediment Ecotox Threshold of 2 mg/kg has been calculated (USEPA 1996).
Reference:
USEPA. 1996. U.S. Environmental Protection Agency Ecotox Thresholds. ECO Update. January 1996. EPA 540/F-95/038.
's4S#n A3-15
1
4
I
f
h
f
12.0 1,1-DICHLOROETHANE
No data on the toxicity of 1,1-dichloroethane to aquatic,or terrestrial wildlife were located. USEPA (1995) reports a NOAEL of rats of 115 mg/kg/day. This value is based on an inhalation to oral route-to-route extrapolation.
Reference:
USEPA. 1995. U.S. Environmental Protection Agency. Health effects assessment summary tables (HEAST).
13.0 2,4-DINITROTOLUENE
No data on toxicity of 2,4-dinitrotoluene to aquatic or terrestrial wildlife were located. Toxicological smdies in laboratory animals identified a NOAEL of 10 mg/kg/day in chronically exposed dogs (USEPA 1995).
Reference:
USEPA. 1995. U.S. Environmental Protection Agency. Integrated Risk Information System (IRIS). March 1995 retrieval.
14.0 ENDRIN/ENDRIN ALDEHYDE/ENDRIN KETONE
Endrin is an organochlorine pesticide which is no longer used in the United States. Endrin aldehyde and endrin ketone are metabolites and breakdown products of endrin. Litfle is known regarding the toxicity of endrin aldehyde and endrin ketone. Based on strucmral similarities, the effects of endrin aldehyde and ketone are likely to be similar to those of endrin. However, since aldehydes and ketones are generally less persistent than the parent compound, flie toxicity of endrin aldehyde and ketone are likely to be less than that of endrin.
Endrin is very toxic to aquatic organisms. Acute toxicity values for freshwater species typically range from 0.15 to 2.1 /xg/L. Fish tend to be more sensitive than invertebrates to the effects of endrin (Clement Associates 1985). Persaud et al. (1993) have identified no, lowest and severe effect levels for endrm in sediment of 0.5 mg/kg, 3 mg/kg and 130 mg/kg, respectively
Endrin is toxic to terrestrial wildlife as it has been used as a rodenticide and avicide (Clement Associates 1985). Subletiial exposures may produce behavior abnormalities, postnatal mortality and fetal death (Clement Associates 1985). Laboratory smdies have reported acute oral LD50 values ranging from 5.3 to 5.6 mg/kg in rats (ATSDR 1989). The liver, kidney and nervous system appear to be the primary targets of chronic endrin toxicity. Degeneration of the kidney and liver have been observed in rats and dogs exposed to 0.13-0.625 mg/kg/day (ATSDR 1989). Convulsions were reported in rats and dogs chronically exposed to 0.2-1.25 mg/kg/day (ATSDR 1989). A NOAEL of 0.025 mg/kg/day and a LOAEL of 0.05 mg/kg/day were identified in dogs for liver lesions and convulsions (USEPA 1993).
A3-16
I 94 Z
References:
ATSDR. 1989. Agency for Toxic Substances and Disease Registry. Toxicological Profile for endrin and endrin aldehyde. Aflanta, GA: Agency for Toxic Substances and Disease Registry.
Clement Associates. 1985. Clement Associates, Inc. Chemical, physical and biological properties of compounds present at hazardous waste sites. Final Report. Arlington, VA: Clement Associates, Inc.
Persaud D., Jaagumagi, R. and Hayton R. 1993. Guidelines for the Protection and Management of Aquatic Sediment Quality in Ontario. Ontario Ministry of the Environment and Energy. ISBN 0-7729-9248-7.
USEPA. 1993. U.S. Environmental Protection Agency. Integrated Risk Information System (IRIS).
15.0 IRON
Iron is an essential element in animals and plants (Clement Associates 1985). Ingestion of excess amounts of kon produces toxic effects in experimental animals, including gastrointestinal effects, blood disorders, pneumonitis, convulsions, and hepatic toxicity. In crayfish exposed to elevated levels of iron, accumulation is highest in the gut (Alikhan et al. 1990).
Persaud et al. (1993) identified a lowest effect level of 2% iron in sediment and a severe effect level of 40%. Data are not adequate to characterize iron toxicity for wildlife (Clement Associates 1985).
References:
Alikhan MA, Bagatto G, Shaheen Z. 1990. The crayfish as a "biological indicator" of aquatic contamination by heavy metals. Water Res., 24:1069-1076.
Clement Associates. 1985. Clement Associates, Inc. Chemical, physical and biological properties of compounds present at hazardous waste sites. Final Report. Arlington, VA: Clement Associates, Inc.
Persaud D., Jaagumagi, R. and Hayton R. 1993. Guidelines for the Protection and Management of Aquatic Sediment Quality in Ontario. Ontario Ministry of the Environment and Energy. ISBN 0-7729-9248-7.
16.0 HEPTACHLOR/HEPTACHLOR EPOXIDE
Heptachlor and heptachlor epoxide are very similar in strucmre. The chemical strucmre of heptachlor epoxide includes an epoxide ring on carbons 2 and 3, which is not present in heptachlor. Heptachlor epoxide is a metabolite and degradation product of heptachlor and is generally regarded as the more toxic of the two.
A3-17
mM^^^^
\
4
\
I
f
b
f I
Heptachlor and heptachlor epoxide are toxic to aquatic organisms at low concentrations. Acute toxicity values for freshwater species typically range from 0.9-78 /xg/L for invertebrates and 13.1-320 /xg/L for fish (Clement Associates 1985). Chronic toxicity values of 1.26 and 1.58 /xg/L have been reported for fathead minnows and sheepshead minnows, respectively (Clement Associates 1985). Botii heptachlor and heptachlor epoxide have a high potential for bioconcentration and biomagnification in aquatic food chains. Bioconcentration factors of 851-2,330 have been estimated for heptachlor epoxide in oysters, mussels and clams (ATSDR 1991). Persaud et al. (1993) identified lowest and severe effect levels for heptachlor epoxide in sediments of 0.005 and 5 mg/kg, respectively.
Use of heptachlor has been linked to increases in mortality in terrestrial birds and mammals. Oral LC50 values to range from 92 to 480 ppm in the diet for some species of wild birds (Clement Associates 1985). Smdies in laboratory animals indicate that heptachlor and heptachlor epoxide are neurotoxic and hepatotoxic. Oral exposure to 2-10 mg/kg/day for intermediate durations produced liver necrosis, steatosis and inflammation in mice and rats (ATSDR 1991). A NOAEL of 0.15 mg/kg/day heptachlor and LEL of 0.25 mg/kg/day heptachlor were identified for increased liver weight in rats (USEPA 1993). Similarly, an LEL of 0.0125 mg/kg/day heptachlor epoxide was identified for increased liver-to-body weight ratio in dogs (USEPA 1993). Doses of 6-13 mg/kg/day produced hyperexcitability, incoordination, ataxia, tremors and self-mutilation in mice and miiflc (ATSDR 1991). Chronic oral exposure to heptachlor and heptachlor epoxide are associated with increased incidence of liver tumors (ATSDR 1991). Biomagnification of heptachlor and heptachlor epoxide is expected to be significant in terrestrial species.
References:
ATSDR. 1991. Agency for Toxic Substances and Disease Registry. Toxicological profile for heptachlor/heptachlor epoxide (Draft). Aflanta, GA: Agency for Toxic Substances and Disease Registry.
Clement Associates. 1985. Clement Associates, Inc. Chemical, physical, and biological properties of compounds present at hazardous waste sites. Final Report. Arlington, VA: Clement Associates, Inc.
Persaud D., Jaagumagi, R. and Hyaton R. 1993. Guidelines for the Protection and Management of Aquatic Sedimen Quality in Ontario. Ontario Ministry of the Environment and Energy. ISBN 0-7729-9248-7.
USEPA. 1993. U.S. Environmental Protection Agency. Integrated Risk Information System (IRIS).
17.0 LEAD
Lead (Pb) has no known essential or beneficial function in living organisms, and its toxic effects have been well documented in aquatic organisms. Lead exposure can be to morganic lead or organolead compounds. In general, organolead compounds are more toxic to aquatic species than
1 inorganic lead compounds (Eisler 1988). In addition, tetraalkyl lead compounds tend to be more toxic than trialkyl compounds, and ethyl derivatives tend to be more toxic than methyl derivatives (Eisler 1988).
Comparatively high concentrations (greater than 500 /ig/L) of lead are necessary to adversely affect aquatic plants (USEPA 1985). Excessive lead exposure to plants causes reduced photosynthesis, cell division and water uptake. For example, 24-hour exposure to 4,140 /xg Pb/L lead was lethal to alga (C reinhardii) (Eisler 1988). Immobilization was noted in alga (M. aurugmosa) exposed to 450 /xg Pb/L for 8 days (USEPA 1985). Acute exposure (3-hour) bioconcentration factors for lead in alga (C. reinhardii) were relatively small (20 to 26) (Eisler 1988). However, 28-day bioconcentration factors in alga, S^ capricomumm exposed to 5 to 50 Hg Pb/L, ranged from 26,000 to 92,000 (Eisler 1988).
The acute toxicity of lead to invertebrates is dependent on water hardness. Acute (96-hour) LQQ values ranging from 612 to 1,910 /xg Pb/L were reported for daphnids (D . magna) in water ranging from 54 to 152 mg/L in hardness (USEPA 1985). Species vary greafly in their response to the effects from acute exposure to lead (Eisler 1988). For example, isopods are much less sensitive to lead than daphnids. Adverse effects (decreased reproduction) were observed in daphnids (D^ magna) chronically exposed (19 to 21 days) to 1 to 30 /xg Pb/L. Lifetime exposure of snails (L palustris) to 19 to 54 fig Pb/L produced significant mortality, decreased biomass, and decreased hatching success. Bioconcentration factors ranging from 1,000 to 9,000 have been reported for freshwater invertebrates exposed to lead for 28 days. The ER-L and ER-M concentrations for lead in sediments are 35 and 110 mg/kg, respectively. The overall apparent effects threshold is 300 mg/kg (Long and Morgan 1991).
Signs of lead toxicity in fish include spinal curvature, decreased mobility, caudal fin degeneration, destruction of respiratory epithelium and widespread enzyme abnormalities. Lethality occurred in fish following exposure to concentrations ranging from 4,100 /xg/L for brook trout (S^ fontinalis) to about 460,000 /xg/L (water hardness = 360 mg CaCOa/L) for fafliead minnow (R. promelas). Exposure to lead concentrations ranging from 10 to 300 /xg Pb/L for 30 days decreased aminolevulinic acid dehydratase (ALAD) activity by 21 to 86% in rainbow trout (Si gairdneri) (Eisler 1988), whereas a 32-week exposure to 13 /ig Pb/L caused anemia in this species (Hodson et al. 1978). A 7-day bioconcentration factor for tetramethyl lead of 726 was reported in rainbow trout (Sj, gairdineri) (Eisler 1988). Lead is not biomagnified in aquatic food chains (ATSDR 1993). Persaud et al. (1993) identified lowest and severe effect levels for lead in sediment of 31 and 250 mg/kg, respectively.
Lead decreases growth, photosynthesis, mitosis and water absorption in terrestrial plants (Eisler 1988). Concentrations of 500 mg Pb/kg soil or 300 mg Pb/kg foliage decreased pollen and seed germination by 90% and 87%, respectively, in roadside weeds (Cassia spp.). Some adverse effects were observed at concentrations as low as 12 to 312 mg Pb/kg soil or 55 to 97 mg Pb/kg foliage. Biomagnification of lead from vegetation does not appear to be significant in terrestrial food chains (Eisler 1988).
4
I
f
b
I
Concentrations of 12,800 mg Pb/kg soil litter decreased survival when fed to woodlice (Porcellio scaber) for 64 weeks or 2 generations (Eisler 1988). There is no evidence for the biomagnification of lead in the dung beefle (Eisler 1988).
With the exception of some alkyl lead compounds, lead poisoning flirough bioaccumulation is not believed to occur (Eisler 1988). Chronic and acute lead toxicity in birds varies according to species, age and chemical form of lead ingested. Young birds are more sensitive to lead poisoning than adults (Hoffrnan et al. 1985). Subchronic exposure of American kestrels to 50 mg/kg/day reduced blood ALAD levels by 80% (Eisler 1988). However, this effect was not observed in kestrels exposed to 10 mg/kg/day.
Smdies in laboratory rodents indicate that lead is toxic following inhalation and oral exposure. Mild signs of toxicity (decreased ALAD activity, increased liver and lung weight, decreased thymus and spleen weight) were noted in rats and mice exposed to 1 to 1.6 mg Pb/m^ for 3 to 4 weeks (ATSDR 1993). The lowest dose expected to cause death in guinea pigs ranges from 313 to 20,500 mg/kg for various lead compounds (Sax 1984). Oral exposure to sublethal doses of lead produced neurological, reproductive, developmental, and mmorigenic effects in laboratory animals. Neurological effects (impaired coordination, increased activity, altered behavior, decreased learning) have been observed in rats exposed to 0.01 to 19.2 mg/kg/day (ATSDR 1993). No neurological effects were observed in rats subchronically exposed to 0.002 mg/kg/day. Developmental effects (behavior changes, delayed righting reflex, delayed onset of puberty) were noted in rats and mice following exposure to 0.7 to 608 mg/kg/day (ATSDR 1993). Reproductive effects (impotence, testicular atrophy, irregular estrus) were observed in rats exposed to 0.01 to 90 mg/kg/day (ATSDR 1993). A NOAEL of 0.002 mg/kg/day and a LOAEL of 0.01 mg/kg/day were identified in rats for degeneration of testicular cells.
Chronic lead poisoning was evident in dogs exposed to 0.32 mg/kg/day (Eisler 1988). Chronic oral exposure to 27 to 83.2 mg/kg/day lead produced renal mmors in rats and mice (ATSDR 1993). There is no evidence for the biomagnification of lead in terrestrial food chains (ATSDR 1993; Eisler 1988).
References:
ATSDR. 1993. Agency for Toxic Substances and Disease Registry. Toxicological profile for lead. Aflanta, GA: Agency for Toxic Substances and Disease Registry.
Eisler R, 1988. Lead hazards to fish, wildlife and invertebrates: A synoptic review. U.S. Fish and Wildlife Service, U.S. Department of the Interior, Laurel, MD: U.S. Department of the Interior.
Hoffman DJ., Franson, JC, Pattee OH, Bunck CM, Anderson A. 1985. Survival, growtii and accumulation of ingested lead in nesfling American kestrels (Falco sparverius). Arch. Environ. Contam. Toxicol. 14:89-94.
A3-20 j > i ; . P$§46
Long ER, Morgan LG. 1991. The potential for biological effects of sediment-sorbed contaminants tested in the national stams and trends program. Seatfle, WA: National Oceanic and Atmospheric Administration. Technical Memorandum NOS OMA 52.
Persaud D., Jaagumagi, R. and Hayton R. 1993. Guidelines for the Protection and Management of Aquatic Sediment Quality in Ontario. Ontario Ministry of the Environment and Energy. ISBN 0-7729-9248-7.
Sax NI. 1984. Dangerous properties of industrial materials. 6fli edition. New York, NY: Van Nostran Reinhold Co, 2641.
USEPA. 1985. U.S. Environmental Protection Agency. Office of Water Regulations and Standards. Ambient water quality criteria for lead. Washington, DC: U.S. Environmental Protection Agency. PB85-227437.
18.0 MANGANESE
Manganese LCJQ values of 16 mg/L and 300 mg/L have been reported for oyster embryos Crassostrea virginica and the softshell clam Mva arenaria. respectively (Clement Associates 1985). Manganese may bioconcentrate in some aquatic organisms. Estimates of bioconcentration factors range from 2,500-6,300 for phytoplankton, 300-5,500 for algae, 800-830 for mussels and 35-930 for fish (ATSDR 1992). In crayfish exposed to elevated levels of manganese, accumulation was highest in the gut (Alikhan et al. 1990). Persaud et al. (1993) have identified lowest and severe effect levels for manganese in sediment of 460 and 1,100 mg/kg, respectively. Data are not adequate to characterize the chronic toxicity of manganese to aquatic wildlife.
Data regarding the toxicity of manganese in terrestrial wildlife were not located. However, laboratory smdies have reported LD50 values ranging from 410 to 820 mg/kg manganese for rats (ATSDR 1992). The principal target of manganese toxicity appears to be the central nervous system. Effects such as ataxia, changes in activity and changes in neurotransmitter levels were noted in rats and mice exposed to 14-2,300 mg/kg/day manganese (ATSDR 1992). Neuronal degeneration was observed in rats subchronically exposed to 1 mg/kg/day manganese (ATSDR 1992). A LOAEL of 25 mg/kg/day was noted for neurological effects in monkeys (ATSDR 1992). Manganese salts produce tumors in mice (by injection) (Clement Associates 1985). Some manganese compounds exhibit mutagenic activity, but do not appear to be teratogenic. Fibrotic changes have been observed in the lungs of rabbits exposed to manganese dust by inhalation.
References:
Alikhan MA, Bagatto G, Shaheen Z. 1990. The crayfish as a "biological indicator" of aquatic contamination by heavy metals. Water Res., 24:1069-1076,
ATSDR. 1992. Agency for Toxic Substances and Disease Registry. Toxicological profile for manganese (draft). Aflanta, GA: Agency for Toxic Substances and Disease Registry.
.:4|Mi47 .
1
4
\
I
f
Persaud D., Jaagumagi, R. and Hayton R. 1993. Guidelines for tiie Protection and Management of Aquatic Sediment (Quality in Ontario. Ontario Ministry of the Environment and Energy. ISBN 0-7729-9248-7.
Clement Associates. 1985. Clement Associates, Inc. Chemical, physical and biological properties of compounds present at hazardous waste sites. Final Report. Arlington, VA: Clement Associates, Inc.
19.0 MERCURY
Mercury (Hg) and mercury compounds have no known biological function and their presence in living organisms is potentially adverse. Forms of mercury which are of relatively low toxicity can become more toxic by chemical alteration, either within ecosystems or organisms. Methylmercury is bioconcentrated in organisms and biomagnified in food chains. Mercury is recognized as one of the most toxic metals in aquatic ecosystems (USEPA 1985b). Aquatic insects are generally among the more resistant animal groups to acute concentrations of mercury while cladocerans are the most sensitive (Eisler 1987, USEPA 1985b).
Freshwater plants vary greafly in their sensitivity to mercury with toxicity values ranging from 10 /xg/L for methylmercury to 1,000 /ig/L for inorganic mercury (mercury (II)). Similarly, the bioconcentration factor for mercury (II) is 4,994, and bioconcentration factors for methylmercury range from 4,000 to 85,000 (USEPA 1985b).
Concentrations of mercury salts that are toxic to saltwater and freshwater fish range from less than 0.1 /xg/L to about 2{)0 /xg/L. Toxicity is dependent upon the developmental stage of the organism as well as various environmental conditions such as temperamre and salinity. Organisms tend to be most sensitive to the toxic effects of mercury during early development. Tests in rainbow trout indicate that methyhnercuric chloride is ten times more toxic flian mercuric chloride.
Acute toxicity values for inorganic mercury range from 0.02 /xg/L (crayfish) to 2,000 /xg/L (caddisfly larvae). LCjo values in freshwater crustaceans (crayfish, cladocerans and scud) range from about 2 to 10 /xg Hg/L. For the various amphibians (embryo-larva) evaluated, the sensitivity to acute mercury toxicity varied considerably, ranging from an LC50 of 1.3 /xg Hg/L for the narrow-mouth toad to 107.5 /ig Hg/L for the marbled salamander (Eisler 1987). Chronic values for Daphnia and brook trout were 1.0 and 0.52 /ig/L, respectively for methylmercury (monomethylmercury).
Mercury exposure results in serious sublethal effects at relatively low concentrations. Mercury has been shown to be mutagenic, teratogenic and carcinogenic. In addition, mercury can affect numerous systems within an organism and result in adverse affects on reproduction, metabolism, behavior, and sensory parameters. Adverse sublethal effects from mercury have been observed at 0.03 to 0.1 /xg Hg/L in aquatic organisms and at 50 to 50() fig Hg/kg in the diet in mammals (Eisler 1987). The principal sublethal effects of acute mercury poisoning in fish include respiratory distress, loss of equilibrium and lethargy. Indications of chronic mercury poisoning include loss of appetite, brain lesions, cataracts, dismrbed feeding behavior and movement
A3-22
mu I
ATSDR. 1992. Agency for Toxic Substances and Disease Registry. Toxicological profile for mercury. Draft. Aflanta, GA: Agency for Toxic Substances and Disease Registry.
A3-23
1 abnormalities (Eisler 1987). The ER-L concentration of mercury in sediments is 0.15 mg/kg; the ER-M is 1.3 mg/kg (Long and Morgan 1991). Persaud et al (1993) identified similar values: a lowest effect level of 2 mg/kg and a severe effects level of 2 mg/kg.
Bioconcentration factors for mercury are high since uptake of the compound is fast and elimination is slow. A wide range of bioconcentration factors (from 250 to 60,(X)0) has been observed, with differences due to species and the type of measurement. Residual mercury in fish dying from acute exposure to mercury ranged from 26 to 68 mg/kg (fresh weight) in liver, 16 to 20 mg/kg in brain and 5 to 7 mg/kg in whole body (Eisler 1987).
Inorganic mercury was toxic to all earthworms exposed for 60 days at 5.0 mg/kg and to half of all exposed earthworms at 0.79 mg/kg (USEPA 1985b). Metallic mercury and insoluble mercurous salts are relatively nontoxic to animals due to their inability to be absorbed, however, alkytaiercury compounds are very well absorbed from the gastrointestinal tract (90 percent). Environmental contamination is primarily a problem of methylmercury compounds, particularly in fish but also from the ingestion of seed grain or animals fed grain treated with alkylmercury compounds (Lu et al. 1972). The acutely toxic oral doses of organic mercury compounds (ethyl, methyl and phenyl) ranged from 2.2 to 31.0 mg/kg for most birds (Eisler 1987). Doses of 26.6 mg/kg/day were lethal to quail (RTECS 1993). Harmful effects were observed in birds exposed to dietary levels of 50 /xg/kg to 500 /xg/kg or a daily intake of 640 /xg/kg/day (Eisler 1987).
Lethal doses of mercury in sensitive mammals range from 0.1 to 0.5 mg/kg body weight (single-dose) and 1.0-5.0 mg/kg (dietary) (Eisler 1987). An LDjo of 17.88 mg/kg body weight _ _ was reported in mule deer (Hudson et al. 1984). Mefliylmercury is much more toxic than ^ m inorganic mercury and irreversibly destroys central nervous system tissues. The principal ^ ^ adverse effects from the exposure of adult mammals to mercury are to the kidney; whereas damage to brain tissue is the principal adverse effect in developing mammals. Lethal doses of mercury ranged from 0.1 to 0.5 mg/kg body weight or 1.0 to 5.0 mg/kg in the diet. Small mammals such as dogs, cats, mink and otter are more sensitive to the effects of mercury tiian are large mammals such as mule deer. The reason for this difference in sensitivity has not been thoroughly elucidated but is likely due to differences in metabolic rates (Eisler 1987).
Methylmercury caused embryotoxicity and teratogenicity in a variety of experimental animals (USEPA 1985a). Experimental animals exposed to organic mercury compounds experienced toxic effects in tiie gonads, heart, liver, pancreas and gastrointestinal tract. The endocrine, immunocompetent and central nervous systems were also involved (USEPA 1985a). A NOAEL of 0.23 mg/kg/day and a LOAEL of 0.46 mg/kg/day were reported for histological changes in the kidney in rats exposed to inorganic mercury by the oral route for six months (ATSDR 1992). Suppression of the immune system was observed in mice subchronically exposed to 2.9 mg/kg/day, but not to 0.6 mg/kg/day (ATSDR 1992).
References:
^
I
t
fc
f
Eisler R. 1987. Mercury hazards to fish, wildlife and invertebrates: a synoptic review. U.S. Fish and Wildlife Service, U.S. Department of the Interior, Laurel, MD: U.S. Department of the Interior. a
Hudson RH, Tucker RK, Haegele MA. 1984. Handbook of toxicity of pesticides to wildlife. U.S. Fish and Wildlife Service, U.S. Department of tiie Interior. Washington, DC: U.S. Department of the Interior.
Long ER, Morgan LG. 1991. The potential for biological effects of sediment-sorbed contaminants tested in tiie national stams and trends program. Seatfle, WA: National Oceanic and Atmospheric Administration. NOAA Technical Memorandum NOS OMA 52.
Lu FC, Berteau PE, Craig DL. 1972. The toxicity of mercury in man and animals. In: Mercury contamination in man and his environment. Intemational Atomic Agency, Vienna.
Persaud D., Jaagumagi, R. and Hayton R. 1993. Guidelines for the Protection and Management of Aquatic Sediment (Quality in Ontario. Ontario Ministry of the Environment and Energy.. ISBN 0-7729-9248-7.
RTECS. 1993. Registry for Toxic Effects of Chemical Substances. National Instimte for Occupational Safety and Health.
USEPA. 1985a. U.S. Environmental Protection Agency. Chemical, physical and biological properties of compounds present at hazardous waste sites. Washington, DC: U.S. Environmental Protection Agency, Office of Waste Programs Enforcement. September 27, 1985.
USEPA. 1985b. U.S. Environmental Protection Agency. Office of Water Regulations and Standards, Ambient water quality criteria for mercury. Washington, DC: U.S. Enviroiunental Protection Agency. PB85-227452.
20.0 METHOXYCHLOR
Methoxychlor is acutely toxic to aquatic species. LC50 values for shrimp, crab and crayfish reportedly range from 0.42-1.05 /xg/L (HSDB 1992). Bioconcentration factors have been reported for stoneflies (348-1,130), snails (5,000-8,570), clams (1,500), and minnows (113-8,300) (ATSDR 1992).
Methoxychlor is not very acutely toxic to terrestrial wildlife. No mortality was observed in a variety of bird species exposed to 5,000 ppm methoxychlor in the diet for five days (HSDB 1992). However, smdies in laboratory animals indicate that methoxychlor produces neurological effects at large doses, and reproductive effects at lower doses. Tremors and convulsions were observed in dogs exposed to 2,000 mg/kg/day for an intermediate-duration (ATSDR 1992). Owning to the estrogenic activity of contaminants and metabolites of methoxychlor, doses of 25-1,400 mg/kg/day have produced a number of reproductive effects in rats and mice (ATSDR 1992). These effects generally include accelerated pubertal development, abnormal estrus and decreased fertility in female animals, and testicular atrophy and decreased fertility in male
A3-24
I
animals. A LOAEL of 25 mg/kg/day was identified for accelerated pubertal development in female rats (Gray et al. 1989).
References:
ATSDR. 1992. Agency for Toxic Substances and Disease Registry. Toxicological profile for Methoxychlor (Draft). Aflanta, GA: Agency for Toxic Substances and Disease Registry.
Gray LE, Otsby JS, Ferrell JM, Rehnberg G, Linder R, Cooper R, Goldman J, Slott V, Laskey J. 1989. A dose-response analysis of methoxychlor-induced alterations of reproductive development and function in the rat. Fund. Appl. Toxicol. 12:92-108.
HSDB. 1992. Hazardous Substances Data Bank. National Library of Medicine, National Toxicology Information Program, Befliesda, MD.
21.0 2-METHYLPHENOL/4-METHYLPHENOL
2-Methylphenol (2-MP) and 4-methylphenol (4-MP) are also known as o-cresol and p-cresol, respectively.
Cresols are toxic to aquatic wildlife. The LDJQ value for 2-MP and 4-MP in the alga Scenedesmus is 40 mg/L for both isomers (Clement Associates 1985). The threshold limit for trout embryos is 2 mg/L for 2-MP and 7 mg/L for 4-MP (Clement Associates 1985). A bioconcentration factor of 14.1 for 2-MP suggests that cresols do not bioconcentrate in aquatic organisms to any significant extent (ATSDR 1990).
Data regarding the toxicity of cresols in terrestrial wildlife were not located. Laboratory smdies indicate that exposure to cresols adversely affects the central nervous system and body weight gain. Signs of neurotoxicity such as tremors, convulsions and coma have been noted in rats following acute and subchronic exposure to 175-600 mg/kg/day 2-MP or 4-MP. A LOAEL of 50 mg/kg/day was identified in rats for central nervous system stimulation. No LOAEL value was defined (ATSDR 1990). Decreased body weight gain was noted in rats and mink following doses of 600 mg/kg/day and 105 mg/kg/day, respectively (ATSDR 1990). Cresols are not expected to bioconcentrate in terrestrial animals to any significant extent (ATSDR 1990).
References:
ATSDR. 1990. Agency for Toxic Substances and Disease Registry. Toxicological profile for cresols: o-cresol, p-cresol, m-cresol (Draft). Aflanta, GA: Agency for Toxic Substances and Disease Registry.
Clement Associates. 1985. Clement Associates, Inc. Chemical, physical and biological properties of compounds present at hazardous waste sites. Final Report. Arlington, VA: Clement Associates, Inc.
A3-25
1
4
\
I
b
t
22.0 NICKEL
The toxicity of nickel to aquatic organisms depends on water hardness, with higher toxicity in softer water. Fresh water algae experienced reduced growth at nickel concentrations as low as 100 /xg/L (USEPA 1980). Acute toxicity values range from 510 /xg/L for Daphnia magna to 46,200 /xg/L for the banded killifish at similar hardness levels (Clement Associates 1985). Chronic toxicity is also highly variable. Chronic toxicity values of 14.8 /xg/L for Daphnia magna in soft water and 530 /xg/L for the fathead minnow in hard water have been reported (Clement Associates 1985). The ER-L for nickel in sediments is 30 mg/kg (Long and Morgan 1991). Based on bioconcenttation factors of 40-100 and 100-259 for nickel in and invertebrates, respectively, bioaccumulation in aquatic organisms does not occur to any significant extent (ATSDR 1991). Persaud et al. 1993 reported a lowest effect level of 16 mg/kg and a severe effect level of 75 mg/kg.
Data regarding the toxicity of nickel in terrestrial wildlife were not located. Smdies in laboratory animals indicate that exposure to nickel produce a wide variety of effects. Inhalation exposure to 0.2 to 3.6 mg Ni/m-' resulted in pneumonia, emaciation, atrophy of the liver, spleen and lymphnodes and testicular degeneration in rats and mice (ATSDR 1991). Chronic exposure to nickel subsulfide dusts produced lung tumors in rats (ATSDR 1991). Oral LD50 values for nickel compounds range from 66-136 mg Ni/day in rats and mice. Repeated oral exposure to doses ranging from 8.5 to 150 mg Ni/kg/day produced sperm abnormalities, ulcerative gastritis, renal mbule damage, neurological symptoms and increased mortality in mice and rats (ATSDR 1991). Mice exhibited sperm abnormalities following acute exposure to 23 mg/kg/day (ATSDR 1991). Hyperglycemia and decreased body weight gain were observed in rats exposed to 0.35 mg/kg/day (ATSDR 1991). Dogs exhibited a low hematocrit and histopathological changes in the lungs following chronic oral exposure to 62.5 mg/kg/day, but not to 25 mg/kg/day (ATSDR 1991). A NOAEL of 5 mg/kg/day and a LOAEL of 50 mg/kg/day were noted for decreased organ and body weights in rats (USEPA 1995). Nickel is generally considered to be noncarcinogenic by the oral route of exposure. .
References:
ATSDR. 1991. Agency for Toxic Substances and Disease Registry. Toxicological profile for nickel (draft). Aflanta, GA: Agency for Toxic Substances and Disease Registry.
Clement Associates. 1985. Clement Associates, Inc. Chemical, physical, and biological properties of compounds present at hazardous waste sites. Final Report. Arlington, VA: Clement Associates, Inc.
Persaud D., Jaagumagi, R. and Hayton R. 1993. Guidelines for the Protection and Management of Aquatic Sediment (Quality in Ontario. Ontario Ministry of the Environment. ISBN 0-7729-9248-7.
USEPA. 1980. U.S. Environmental Protection Agency. Office of Water. Ambient water quality criteria for nickel. Washington, DC: U.S. Environmental Protection Agency.
I A3-26 . i^^mnZ
30195;
1
4
USEPA. 1995. U.S. Environmental Protection Agency. Integrated Risk Information System (IRIS).
23.0 PHENOL
Acute toxicity value of 5,CK)0 /tg/L and 5,020-67,500 /tg/L have been reported for Daphnia magna and fish, respectively (Clement Associates 1985). LCJQ values of 5,800 and 11,000 /xg/L were reported for grass shrimp and mountain bass, respectively (Clement Associates 1985). A chronic toxicity value of 2,560 /tg/L reported for the fathead minnow (Clement Associates 1985). Phenol is not expected to bioconcentrate in aquatic organisms. Bioconcentration factors of 1.2-2.3 were noted in goldfish (Clement Associate 1985).
Data concerning the toxicity of phenol in terrestrial wildlife were not located. Smdies in laboratory animals reported LDJQ values ranging from 300 to 420 mg/kg (ATSDR 1989). Decreased fetal body weight, increased fetal mortality and increased incidence of cleft palate were observed in rats acutely exposed to 280 mg/kg/day (ATSDR 1989). A NOAEL of 60 mg/kg/day and a LOAEL of 120 mg/kg/day were identified in rats for decreased fetal body weight (USEPA 1993).
References:
ATSDR. 1989. Agency for Toxic Substances and Disease Registry. Toxicological profile for phenol. Aflanta, GA: Agency for Toxic Substances and Disease Registry.
Clement Associates. 1985. Clement Associates, Inc. Chemical, physical, and biological properties of compounds found of hazardous waste sites. Final Report. Arlington, VA: Clement Associates, Inc.
USEPA. 1993. U.S. Environmental Protection Agency. Integrated Risk Information System aRIS).
24.0 POLYCYCLIC AROMATIC HYDROCARBONS (PAHS)
The term polycyclic aromatic hydrocarbons (PAHs) is used to refer to a group of chemicals that are formed during the incomplete combustion of organic substances. These chemicals include acenaphthene, anthracene, benzo(a)anthracene, benzo(a)pyrene, benzo(b)fluoranthene, benzo(g,h,i)perylene, benzo(k)fluoranfliene, chrysene, dibenz(a,h)anthracene, fluoranthene, fluorene, indeno(l,2,3-c,d)pyrene, 2-methylnaphthalene, naphthalene, phenanthrene, pyrene and other compounds.
A wide variety of PAH-caused biological effects have been observed in a wide range of species in varying laboratory conditions. These effects range from decreased survival and growth to effects on metabolism and carcinogenicity. It is known that plants can absorb PAHs from soils to their roots and that the chemicals are generally not phytotoxic. There is some evidence fliat plants can metabolize some PAHs (Eisler 1987).
I
In aquatic systems, toxicity generally increases as the molecular weight of each PAH increases. Because of their limited solubility in water, however, the very high molecular weight PAHs have low acute toxicity (Eisler 1987). Toxicity is most pronounced among crustaceans. The LCJQ for fluorene ranges from 320 /tg/L (96 hr) for grass shrimp to 1,000 /tg/L for flie sandworm. For phenanthrene LC50 values for the same two species are 370 and 600 fig/L, respectively (Eisler 1987). The reported LC50 values for some fish species are considerably higher: > 100,000 /xg/L for fluorene in fathead minnows and 150,0(X) /ig/L for liaphflialene in mosquitofish. BCFs for aquatic organisms are highly variable because of differences in the ability of species to metabolize the compounds and a variety of other environmental conditions. The highest BCF reported in Eisler (1987) is 134,248 for Daphnia pulex and benzo(a)pyrene; for naphthalene, the BCF for the same Cladoceran is 131. Since PAHs generally sequester in sediments, the contribution of PAHs to the body burden of benthos organisms and evenmally other organisms feeding on the benthos is important. In one smdy sediment-associated anthracene contributed approximately 77% of the steady state body burden in amphipods (Landrum and Scania 1983). In sediment lowest effect and severe effect levels have been estimated by Persaud et al. (1993) for selected PAHs. They are as follows:
The carcinogenic effects of PAHs generally are believed to be due to metabolic by-products, epoxides. There is a growing body of evidence linking liver tumors in fish populations to elevated levels of PAHs in sediments (Baumann et al. 1982, Varanasi et al. 1985).
r
Data regarding the toxicity of PAHs in wildlife were not located. A variety of noncarcinogenic effects have been observed in experimental animals exposed to carcinogenic PAHs at doses ranging from 40 to 350 mg/kg/day including destruction of sebaceous glands, hyperplasia, hyperkeratosis and ulceration of the skin; immunosuppressive effects; hemolymphatic changes in tiie lymph nodes; aplastic anemia; and fetal resorptions (ATSDR 1990, USEPA 1985, USEPA 1995).
A3-28
I
An LD50 of 700 mg/kg was reported for phenanthrene in mice (RTECS 1986). The only available information located regarding oral toxicity of benzo(b)fluoranthene and chrysene were smdies reported in RTECS (1993). At 5 mg/kg/day mice injected intraperitoneally wifli benzo(b)fluoranthene developed kidney, ureter and bladder tumors. Cytogenetic effects were observed in mice acutely dosed with 450 mg/kg chrysene.
^
In a series of subchronic (90-day) feeding smdies, the USEPA determined NOAEL and LOAEL values as follows:
The primary adverse effects of PAHs involve local and systemic carcinogenicity by various routes (USEPA 1985). Tumors are produced in the forestomach in mice exposed by the oral route. Skin carcinomas have been produced in mice m skin painting experiments. Lung tumors have been observed in hamsters and mice exposed to PAHs. Mice dosed with dibenz(a,h)anthracene (25 mg/kg/day) for a lifetime developed lung adenomas and papillomas and squamous cell carcinomas of the forestomach (ATSDR 1990). The incidence of forestomach mmors in mice has also been related to oral subchronic exposures to benzo(a)pyrene in food. A cancer effect level of 26 to 33 mg/kg/day was determined in this smdy (ATSDR 1990).
4
References:
ATSDR. 1990. Agency for Toxic Substances and Disease Registry. Toxicological profile for polycyclic aromatic hydrocarbons. Aflanta, GA: Agency for Toxic Substances and Disease Registry.
Baumann PC, Smith WD, Ribick M. 1982. Hepatic tumor rates and polynuclear aromatic hydrocarbon levels in two populations of brown bullhead (Ictalurus nebulosus). In: Cooke MW, Dennis AJ, Fisher GB (eds.). Polynuclear hydrocarbons: physical and biological chemistry. Columbus, OH: Battelle Press.
Eisler R. 1987. Polycyclic aromatic hydrocarbon hazards to fish, wildlife and invertebrates: synoptic review. Laurel, MD: U.S. Department of the Interior, Fish and Wildlife Service. Biological Report 85( 1.11).
^U )li 5 A3-29 ^
I
r
b
e
Landrum PF, Scania D. 1983. Influence of sediment on anfliracene uptake, depuration and biotransformation by the amphipod Hvalelle azteca. Canad. J. Fish Aquatic Sci. 40:298-305.
Long ER, Morgan LG. 1991. The potential for biological effects of sediment-sorbed contaminants tested in tiie national stams and trends program. Seatfle, WA: National Oceanic and Atmospheric Administration. NOAA Technical Memorandum NOS OMA 52.
NTP. 1980. National Toxicology Program. Unpublished subchronic toxicity smdy. Naphthalene (C52904), Fischer 344 rats. Prepared by Battelle's Columbus Laboratories under Subcontract No. 76-34-106002.
Persaud D., Jaagumagi, R. and Hayton R. 1993. Guidelines for the Protection and Management of Aquatic Sediment Quality in Ontario. Ontario Ministry of tiie Environment and Energy. ISBN 0-7729-9248-7.
RTECS. 1986. Registry of Toxic Effects of Chemical Substances. Cincinnati, OH: National Instimte for Occupational Safety and Health.
USEPA. 1995. U.S. Environmental Protection Agency. Integrated Risk Information System (IRIS). March 1995 retrievals for individual PAHs.
USEPA. 1985. U.S. Environmental Protection Agency. Chemical, physical and biological properties of compounds present at hazardous waste sites. Washington, DC: U.S. Environmental Protection Agency, Office of Waste Programs Enforcement. September 27, 1985.
Varanasi U, Reichert WL, Stein JE, Brown DW, Sanbom HR. 1985. Bioavailability and biotransformation of aromatic hydrocarbons in benthic organisms exposed to sediment from an urban esmary. Environ. Sci. Technol. 19:836-841.
25.0 POLYCHLOIUNATED BIPHENYLS (PCBS)
Because of their highly lipophilic namre, PCBs readily bioaccumulate within organisms and are biomagnified within food chains. A great deal of data regarding the tissue levels of PCBs in fish, mammals and birds exists. Bioconcentration factors for Aroclor 1254 range from 60 for the protozoan Tetrahvmena pvriformis to 47,000 for Daphnia (Eisler 1986). The bioconcentration factors for PCBs in fish, shrimp and oysters range from 26,000 to 43,000 (ATSDR 1993). The ER-L concentration in sediment for total PCBs is 50 /tg/kg; the ER-M is 400 mg/kg (Long & Morgan 1991). Persaud et al. (1993) reports a no-effect level of 0.01 mg/kg for total PCBs, and a lowest effect level of 0.07 mg/kg. A severe effect level for total PCBs was reported at 530 mg/kg (Persaud et al. 1993).
Aquatic invertebrates are an important factor in the cycling of PCBs through the ecosystem. Direct correlations between PCB sediment concentration and PCB tissue concentrations have been demonstrated in a number of invertebrate species (Eisler 1986). Larval forms can transfer PCBs upon metamorphosis from aquatic to terrestrial systems, thus exposing wildlife that feed on these insects.
-^po top A3-30 , rtk^i^- ^
CHP!I9:5B
I
Toxicity of aquatic organisms to Aroclor PCBs ranges from 0.1 to 10.0 /tg/L (7 to 38 days of exposure). Crustaceans and juvenile organisms are generally the most sensitive to the effects of PCBs (USEPA 1980).
The chronic toxicity of various PCBs to freshwater organisms has been smdied in numerous species. Daphnia. midge and Gammarus spp. are similar m their sensitivity to the PCBs. Chronic LCjoS for the Daphnids are 4.3 /ig/L (Aroclor 1248) and 2.1 /tg/L (Aroclor 1254), for midge 0.8 /tg/L (Aroclor 1254), and 4.9 /ig/L and 3.3 /tg/L for Gammarus (Aroclors 1242 and 1248, respectively). Aroclor 1248 was the PCB most toxic to fathead minnows with a chronic toxicity value of 0.2 /tg/L. Aroclors 1242, 1254 and 1260 had chronic values of 9.0, 2.9, 2.4 /tg/L respectively (Eisler 1986). A chronic toxicity value for Aroclor 1254 of 1.0 fig/L has been observed for brook trout.
Acute toxicity values for freshwater fish vary among species. Acute (96-hour) LQoS for Aroclor 1260 are 21 /tg/L for rainbow trout, 140 /xg/L for catfish, and 150 /xg/L for bluegill. Newly hatched fish are much more sensitive to the effects of PCBs tiian adult forms, witii acute LC50S for rainbow trout hatchlings at 2 /xg/L and for large-moutii bass hatchlings at 2.3 fig/L (both were exposed to Capacitor 21). Fathead minnow hatchlings exposed to Aroclor 1254 had a 96-hour LC50 of 7.7 /ig/L (Eisler 1986). Although aquatic species are markedly different in their sensitivity to PCBs, reduced growth and survival are frequenfly observed adverse effects following exposure to PCBs. Sublethal effects in fish from PCB exposure include reproductive effects, gastric ulcers, fatty liver, kidney degeneration, loss of appetite and skin lesions (Eisler 1986).
Plants also accumulate PCBs. In a smdy utilizing vegetables grown in soils amended with PCB-contaminated lake sediments, tiie lower chlorinated isomers (i.e., 1248) accumulated in plant tissue to a greater extent than the higher chlorinated 1260 isomer (Sawhney and Hankin 1984).
Food chain accumulation relative to diet was evident in data recording PCB concentrations in avian livers. Concentrations were highest in piscivorous species and lowest in herbivorous species (NAS 1979).
A wide variety of sublethal effects in birds and mammals have been attributed to PCB exposure including birth defects, reproductive disturbances, skin, liver and kidney abnormalities (Eisler 1986). Laboratory smdies in rats, mice and mink indicate that effects occur at oral doses greater tiian 0.1 mg/kg/day (ATSDR 1991). Birds tend to be more resistant to tiie effects of PCBs tiian mammals. LD50 values for birds vary depending upon the type of Aroclor in addition to the species. Acute toxicity values for Aroclor 1254 range from 604 mg Aroclor/kg-diet in the northern bobwhite to about 3,000 mg Aroclor/kg-diet in the Japanese quail. Acute toxicity values for Aroclor 1260 range from 747 mg Aroclor/kg-diet in the northern bobwhite to about 2,200 mg Aroclor/kg-diet in the Japanese quail. Acute toxicity values for Aroclors 1242 to 1262 are about 1,200 mg Aroclor/kg-diet (Eisler 1986). In sensitive avian species, PCBs affect growth, reproduction, metabolism and courtship behaviors (Eisler 1986). Delayed reproduction has been observed in mourning doves due possibly to reduced estrogen and androgen levels (Tori and Peter le 1983). American kestrels receiving a PCB dose of approximately 10 mg/kg/day
301957 ^ - ^
1
4
•I I
t
t I
evidenced declines in sperm concentration (Bird et al. 1983). Current evidence is inconclusive as to whether PCBs can be implicated in eggshell thinning (Eisler 1986).
Mink are the mammalian species most sensitive to flie toxic effects of PCBs, with acute LD50 values ranging from 750 to 4,000 mg/kg. A PCB concentration of approximately 0.64 ppm in the diet can result in reproductive failure (Eisler 1986). ;The acute LDJQ for the rat ranges from 1,000 to 4,250 mg/kg for a variety of Aroclors (ATSDR 1993). Chronic mammalian LD50 values for Aroclor 1254 include 6.7 mg/kg (dietary) for the mink, 10 mg/kg (dietary) for the cottontail rabbit, 100 mg/kg (dietary) for the white-footed mouse, 75 mg/kg (dietary) for the Norway rat and 50 mg/kg (dietary) for the raccoon (Eisler 1986).
Toxic signs include a "wasting syndrome" including anorexia and lethargy. The rhesus monkey is also sensitive to PCBs. Feed levels of approximately 5 ppm Aroclor 1248 resulted in a variety of reproductive effects including altered menstrual cycles and an increased frequency of stillbirths and abortions (Eisler 1986). Monkey smdies have identified LOAEL levels of 0.028 and 0.005 mg/kg/day for Aroclor 1016 and 1254, respectively (USEPA 1995). The critical effect for Aroclor 1016 was reduced birth weights and a NOAEL of 0.007 mg/kg/day was identified. In flie Aroclor 1254 smdy, critical effects included ocular exudate, inflamed Meibomian glands, distortions in nails and increased antibody responses. The laboratory rat is less sensitive. A NOAEL of 0.32 mg/kg/day and a LOAEL of 1.5 mg/kg/day were identified for Aroclor 1260 in rats for decreased litter sizes and histopathological changes in the liver (ATSDR 1993).
References:
ATSDR. 1993. Agency for Toxic Substances and Disease Registry. Toxicological profile for selected PCBs. Aflanta, GA: Agency for Toxic Substances and Disease Registry.
Bird DM, Tucker PH, Fox GA, Lague PC. 1983. Synergistic effects of Aroclor 1254 and mirex on the semen characteristics of American kestrels. Arch. Environ. Contam. Toxicol. 12:633-640.
Eisler R. 1986. Polychlorinated biphenyl hazards to fish, wildlife, and invertebrates: a synoptic review. U.S. Fish Wildl. Serv. Biol. Rep.
Long ER, Morgan LG. 1991. The potential for biological effects of sediment-sorbed contaminants tested in the national stams and trends program. Seatfle, WA: National Oceanic and Atmospheric Administration. NOAA Technical Memorandum NOS OMA 52.
NAS. 1979. National Academy of Sciences. Report of the commission on the assessment of PCBs in the environment. Washington, DC: National Research Council.
Persaud D., Jaagumagi, R. and Hayton R. 1993. Guidelines for the Protection and Management of Aquatic Sediment Quality in Ontario. Ontario Ministry of the Environment and Energy. ISBN 0-7729-9248-7.
A3-32 -Selgr 301958
'S^^'n}'^' ^ ^ ' ^
\
Sawhney BL, Hankin L. 1984. Plant contamination by PCBs from amended soil. J. Food Prot. 47:232-236.
USEPA. 1995. U.S. Environmental Protection Agency. Integrated risk information system. March 1995 retrieval.
USEPA. 1980. U.S. Environmental Protection Agency. Office of Water Regulations and Standards. Ambient water quality criteria for polychlorinated biphenyls (PCBs). Washington, DC: U.S. Environmental Protection Agency. NTIS Document No. PB81-117871.
26.0 SELENIUM
The toxicity of selenium in aquatic organisms is somewhat dependent on the form of selenium. In aquatic plants, selenium IV and selenium VI are equally toxic. The LC50 values for selenium in freshwater algae typically range from 522 to 30,000 /xg/L (USEPA 1987). In aquatic animals, selenium IV is generally more toxic than selenium VI. For selenium IV, acute EC50 values range from 340 /xg/L for the amphipod, Hvallela azteca to 203,000 /tg/L for the leech, nephelopsis obscura (USEPA 1987). Chronic values for invertebrates typically range from greater than 47 to 692 /xg/L. For selenium VI, acute ECjo values range from 75 /xg/L for the amphipod, Gamonarus pseudolimnaeus to 442,0{X) /xg/L for the leech, Nephelopsis obscura (USEPA 1987). Chronic values typically range from 565 to 2,000 /xg/L. Selenium is bioaccumulated in aquatic organisms and there is some evidence that it could biomagnify (ATSDR 1994). Bioconcentration ^ _ factors ranging from 1(X) (algae) to 200,000 (daphids) have been reported for freshwater ^ M organisms (ATSDR 1994). ^ *
Although selenium is an essential nutrient, toxic effects occur when required levels are exceeded. Plants accumulate selenium to high levels. Animals chronically exposed to 3 to 25 mg/kg selenium in the diet experience "alkali" disease, a condition recognized by lack of vitdity, loss of hair, sterility, hoof deformity, lameness, anemia and fatty necrosis of the liver (USEPA 1985). Livestock consuming 100 to 1,000 mg/kg selenium experience a variety of acute toxic effects, including vision impairment, weakness of limbs and respiratory failure. Consumption of plants containing 400 to 800 mg/kg selenium has resulted in death of hogs, sheep and calves (USEPA 1985).
Laboratory smdies have reported LD50 values for selenium ranging from 1 to 7 mg/kg for rats, mice, guinea pigs and rabbits (ATSDR 1994). Repeated oral exposure to 0.2 to 1 mg/kg/day resulted in increased mortality, liver cirrhosis, infertility and fetal toxicity (ATSDR 1994). Chronic oral exposure to 0.31 mg/kg/day resulted in amyloidosis in several organs of mice (ATSDR 1994). A NOAEL of 0.025 mg/kg/day and a LOAEL of 0.1 mg/kg/day were identified for hyperplastic liver lesions in rats (ATSDR 1994). Selenium sulfide exposure has produced liver mmors in rats and mice; however, fliis effect is generally not associated with otiier selenium compounds (ATSDR 1994).
n I
r References:
ATSDR. 1994. Agency for Toxic Substances and Disease Registry. Toxicological profile for selenium. Draft. Aflanta, GA: Agency for Toxic Substances and Disease Registry.
USEPA. 1987. U.S. Environmental Protection Agency. Office of Water. Ambient water quality criteria for selenium. Washington, DC: U.S. Environmental Protection Agency.
USEPA. 1985. U.S. Environmental Protection Agency. Chemical, physical and biological properties of compounds present at hazardous waste sites. Washington, DC: U.S. Environmental Protection Agency, Office of Waste Programs Enforcement. September 27, 1985.
27.0 SILVER
Silver is acutely toxic to aquatic life. Freshwater algae are more sensitive to silver than aquatic vascular plants. The 96-hr ECJQ for chlorophyll a production in the alga Selenastrum capricomumm exposed to silver was 2.6 /xg/L. Tests involving vascular plants indicated that the ECjo is in the range of 270 /xg/L (Lemna minor) to 7,500 /xg/L (Elodea canadensis) (USEPA 1987). Freshwater species mean acute values (SMAVs) range from 0.9 /tg/L for the waterflea Daphnia magna to 560 /xg/L for the crustacean Orconectes immunis (USEPA 1987). Acute toxicity among the most sensitive species occurred over a small range, with a genus mean acute value that ranged from 2.2 to 29 /tg/L. While arthropods were most sensitive, freshwater fish were almost as sensitive, with SMAVs fliat ranged from 8.2 /xg/L for Rhinichtfavs osculus to 13 /xg/L for Lepomis macrochims (USEPA 1987). Chronic toxicity occurred in cladocera at levels fliat ranged from less flian 0.56 /xg/L to 28.6 /xg/L (USEPA 1987). Chronic values for fish ranged from 0.12 /xg/L for rainbow trout (Salmo gairdneri) to 0.49 figlL for the fa;thead minnow (Pimephales promelas). In sediment an ER-L of 1 mg/kg was estimated by Long and Morgan (1991) for silver. The corresponding ER-M was 2.2 mg/kg. Bioconcentration factors for silver have been reported to range from 96 to 150 for algae, 12.2 to 26 for Daphnia magna. 5.9 to 8.5 for mussels, and 1.8 to 28 for fish (ATSDR 1990), suggesting that bioconcentration is not significant.
Excess silver in the diet of dogs, sheep, pigs, chicks, mrkey poults and ducklings induced selenium, vitamin E and copper deficiency symptoms. Even though these nutrients were adequate in the diet, silver aggravated symptoms when one or more of these nutrients were below required levels in the diet (USEPA 1985). Smdies in laboratory rats indicate that silver was lethal at acute oral doses ranging from 181.2 to 362.4 mg/kg/day (ATSDR 1990). Exposure to 18.1 mg/kg/day for 125 days resulted in decreased activity in mice (ATSDR 1990).
References:
ATSDR. 1990. Agency for Toxic Substances and Disease Registry. Toxicological profile for silver. Atianta, GA: Agency for Toxic Substances and Disease Registry!
A3-34 ^ ^' r8Mii:96o
Long ER, Morgan LG. 1991. The potential for biological effects of sediment-sorbed contaminants tested in the national stams and trends program. Seatfle, WA: National Oceanic and Atmospheric Administration. NOAA Technical Memorandum NOS OMA 52.
USEPA 1987. U.S. Environmental Protection Agency. Ambient aquatic life water quality criteria for silver. Draft. Narragansett, RI: U.S. Environmental Protection Agency. September 1987.
USEPA. 1985. U.S. Environmental Protection Agency. Chemical, physical and biological properties of compounds present at hazardous waste sites. Washington, DC: U.S. Environmental Protection Agency, Office of Waste Programs Enforcement. September 27, 1985.
28.0 2,3,7,8-TETRACHLORODIBENZO-P-DIOXIN (TCDD OR DIOXIN EQUIVALENT)
Polychlorinated dibenzo-p-dioxin (PCDDs) and dibenzofiirans (PCDFs) are two families of chemicals with related chemical stmcmres. Dibenzofiirans have a basic ring stmcmre of two benzene rings joined by two carbon-carbon bonds, while dibenzodioxins consist of two benzene rings joined by one carbon-carbon bond and one carbon-oxygen-carbon bond. Individual compounds within these families differ in the number of (congeners) and location (isomers) of chlorine atoms on the benzene rings. These various isomers and congeners produce the same sorts of biological effects, but differ substantially in their potency. It is generally believed that 2,3,7,8-tetrachlorodibenzodioxin (TCDD) is the most potent member of the group, and most smdies have been performed on this isomer.
A fairly extensive body of evidence on animal toxicity to dioxin has accumulated, which indicates a wide range of effects and a variety of species susceptibility to dioxin. This wide spectrum of responses lends credence to the hypothesis that dioxin produces its effects on a very fundamental level. The remarkable potency of TCDD in eliciting toxic effects in animals suggests that it functions via a receptor (intracellular protein) in parmership with a second protein that together reflect sustained alterations in gene expression (USEPA 1994). In addition to carcinogenicity, documented adverse effects due to dioxin exposures include chloracne, reproductive and developmental effects, immunological effects, changes in the level of circulating hormones, increased risk of diabetes and fasting semm glucose and increased enzyme induction (USEPA 1994, ATSDR 1989).
Evidence indicates that animal species with an Ah receptor are susceptible to dioxin. Thus, amphibians, invertebrates and plants are much less susceptible than fish and mammals.
Acute toxicity occurs in many aquatic species at 0.2 /xg/L, the level of TCDD water solubility (USEPA 1985). Exposure in the parts per trillion range for four days results in toxic symptoms and death in freshwater aquatic species 40 to 140 days later. The lowest reported chronic toxicity value for aquatic organisms is less than 0.001 /xg/L (USEPA 1985). Accumulation of TCDD occurs for most aquatic species. The BCF for fathead miimows was reported at 7,900 to 9,300; for rainbow ttout a BCF of 39,000 was estimated (ATSDR 1989). Invertebrates, plants and amphibians are comparatively resistant to TCDD. In one experiment with algae, daphnids
A3-35
\
n I
f
f I
and snails, a 32-day immersion in TCDD solutions up to 4.2 ppt produced no adverse effects via growth, reproduction or food consumption (Yockim et al. 1978).
Two species of earthworms were exposed to 5 and 10 ppm of dioxin-contaminated soils for 85 days (Eisler 1986). At 5 ppm no adverse effects were noted; at 10 ppm both species died. At lower concentrations (50 ppb), earthworms accumulated five times the soil dioxin levels in their bodies within seven days (Eisler 1986).
Sensitivity to dioxins in birds is also species-dependent. LD50 values have been reported as low as 15 /tg/kg (northem bobwhite) to as high as 810 /tg/kg (ringed mrfledove) (Eisler 1986). While biomagnification of TCDD has not been measured, it appears likely that piscivorous birds could have a greater potential to accumulate TCDD than the fish that they eat.
As with other animal groups, laboratory mammals show marked differences in their toxic responses to TCDD. The LD50 for the guinea pig is 0.6 /xg/kg while the LD50 for the hamster is 1,157. Toxic effects are similarly diverse. While effects typically include a "wasting" syndrome, monkeys develop chloracne-type skin lesions, birds exhibit edema and severe liver damage is apparent in rats, mice and rabbits. In chronic smdies in rats a LOAEL of lE-06 mg/kg was reported for toxic hepatic effects (ATSDR 1989).
Teratogenic and reproductive effects are well documented in several animal species (Eisler 1986). The most commonly observed developmental effects in mice smdies were hydronephrotic kidney and cleft palate (ATSDR 1989). These anomalies were observed at doses as low as 1 /xg/kg. In monkeys reproductive smdies reported increased abortions at total doses of 0.2 /xg/kg.
Several bioassays have demonstrated the carcinogenicity of TCDD in animals (rats and mice). Kociba et al. (1978) reported squamous cell carcinomas of the lung, tongue and hard palate and hepatocellular carcinomas at doses ranging from 0.001 to 0.1 /xg/kg/day.
References:
ATSDR. 1989. Agency for Toxic Substances and Disease Registry. Toxicological profile for 2,3,7,8-Tetrachlorodibenzo-p-dioxin. Aflanta, GA: Agency for Toxic Substances and Disease Registry.
Eisler R. 1986. Dioxin hazards to fish, wildlife and invertebrates: a synoptic review. Laurel MD: U.S. Fish and Wildlife Service.
Kociba RJ, Keyes DG, Beyer JE, et al. 1978. Results of a two-year chronic toxicity and oncogenicity smdy of 2,3,7,8-tetraclilorodibenzo-p-dioxin in rats. Toxicol. Appl. Pharmacol. 46:279-303.
USEPA. 1994. U.S. Environmental Protection Agency. Health assessment for 2,3,7,8-tetrachlorodibenzo-p-dioxin (TCDD) and related compounds. Washington, DC: U.S. Environmental Protection Agency. Office of Research and Development. EPA/600/BP-92/001.
1
USEPA. 1985. U.S. Environmental Protection Agency. Chemical, physical and biological properties of compounds present at hazardous waste sites. Washington, DC: U.S. Environmental Protection Agency, Office of Waste Programs Enforcement. September 27, 1985.
Yockim RS, Iscasee AR, Jones GE. 1978. Disfl-ibution and toxicity of TCDD and 2,4,5-T in an aquatic model ecosystem. Chemosphere 3:215-220.
29.0 1,1,2,2-TETRACHLOROETHANE
Data on toxic effects of 1,1,2,2-tetrachloroethane on aquatic or terrestrial wildlife were not located. In laboratory animals, a single dose of 22 mg/kg/day produced liver effects in rats (ATSDR 1989).
Reference:
ATSDR. 1989. Agency for Toxic Substances and Disease Registry. Toxicological profile for 1,1,2,2-Tetracliloroethane. Aflanta GA: Agency for Toxic Substances and Disease Registry.
30.0 THALLIUM
Thallium produced toxicity in freshwater aquatic organisms acutely exposed to concentrations as low as 1,400 /xg/L or chronically exposed to concentrations as low as 40 /tg/L (Clement Associates 1985). No information was located on toxicity in aquatic organisms exposed to thallium from sediments. Thallium bioconcentration factors vary substantially, ranging from 34 in bluegill to 150,000 in other freshwater aquatic organisms (Clement Associates 1985). Effect levels of thallium in sediments have not been developed.
Acute oral exposure to 24-28 mg Tl/kg was lethal to quail and other species of wild birds (RTECS 1993). Smdies in laboratory rats have reported LD50 values ranging from 32-39 mg Tl/kg (ATSDR 1991). Electrocardiogram alterations were observed in rabbits acutely exposed to 56 mg/kg/day (ATSDR 1991). Mice exhibited developmental effects following acute oral exposure to 0.08 mg/kg/day (ATSDR 1991). Repeated oral exposure to doses ranging from 0.7 to 4.5 mg Tl/kg/day for intermediate durations resulted in increased mortality, peripheral nerve damage and histopathological changes in the testes of rats (ATSDR 1991).
References:
ATSDR. 1991. Agency for Toxic Substances and Disease Registry. Toxicological profile for thallium (draft). Aflanta, GA: Agency for Toxic Substances and Disease Registry.
Clement Associates. 1985. Clement Associates, Inc. Chemical, physical, and biological properties of compounds present at hazardous waste sites. Final Report. Arlington, VA: Clement Associates, Inc.
30.1963
n
iftiift 1 I
r
31.0 TOXAPHENE
Toxaphene is toxic to aquatic wildlife. Concentrations ranging from 0.15 to 1,000 /xg/L produce adverse effects in aquatic plant species (Clement Associates 1985). Acute toxicity values typically range from 1.3-180 /xg/L for freshwater invertebrates, and 2-20 /xg/L for freshwater fish (Clement Associates 1985). Chronic toxicity values range from 0.037 /xg/L for the fathead minnow to 1.8 /ig/L for the midge (Clement Associates 1985). Toxaphene is bioconcentrated in aquatic organisms. Bioconcentration factors have been reported for algae (6,902), snails (9,600) and mamre fish (4,200-6,800) (ATSDR 1989). A sediment quality benchmark for toxaphene of 0.028 mg/kg has been calculated (USEPA 1996).
Toxaphene is relatively less toxic to terrestrial wildlife compared to aquatic wildlife, however, mortality in birds attributable to toxaphene has been reported (Clement Associates 1985). Oral LD50 values ranging from 80-200 mg/kg have been reported in laboratory rats and hamsters (ATSDR 1989). Long-term exposure to toxaphene is associated with hepatic effects. Histopathological and degenerative effects on the liver have been observed in rats, mice and dogs exposed to 1.5 to 63 mg/kg/day (ATSDR 1989). Chronic oral exposure to toxaphene has produced liver tumors in mice and thyroid tumors in rats (ATSDR 1989).
References:
ATSDR. 1989. Agency for Toxic Substances and Disease Registry. Toxicological profile for toxaphene (Draft). Aflanta, GA: Agency for Toxic Substances and Disease Registry.
Clement Associates. 1985. Clement Associates, Inc. Chemical, physical, and biological properties of compounds present at hazardous waste sites. Final Report. Arlington, VA: Clement Associates, Inc.
USEPA. 1996. U.S. Environmental Protection Agency. Ecotox Thresholds. ECO Update. January 1996. EPA 540/F-95/038.
32.0 VANADIUM
Data regarding the toxicity of vanadium in aquatic wildlife are limited. LC50 values of less than 0.16 figlL were reported for daphnids (Clement Associates 1985). In freshwater fish, LC50 values range from 5,000 to 100,000 /xg/L (typically around 10,000 /xg/L (Clement Associates 1985). Chronic toxicity values for aquatic species were generally reported around 2,000 fig/L (Clement Associates 1985). Some aquatic organism are capable of bioconcentrating vanadium up to 10,000 times greater flian levels present in water (ATSDR 1990).
Data regarding the toxicity of vanadium in terrestrial wildlife were not located. Smdies in laboratory animals indicate fliat oral exposure to vanadium can produce lethality, renal and developmental effects. LDJQ values of 31-41 mg/kg were reported for mice and rats (ATSDR 1990). Haemorrhagic changes and increased plasmal urea were noted in the kidneys of rats exposed to 0.57-2.87 mg/kg/day for subchronic durations. A NOAEL of 0.3 mg/kg/day was identified for this effect (ATSDR 1990)'. Developmental effects such as facial hemorrhaging,
A3-38 :•:'"i£3> iVi v ••"3(Jf§G4
I
decreased pup weight and altered lung collagen were noted in rats exposed to 2.1-8.4 mg/kg/day vanadium for acute, subchronic, and chronic durations, respectively (ATSDR 1990). Other smdies reported no adverse effects in rats or mice chronically exposed to 0.7-4.1 mg/kg/day (ATSDR 1991; USEPA 1995).
References:
ATSDR. 1990. Agency for Toxic Substances and Disease Registry. Toxicological profile for vanadium (Draft). Aflanta, GA: Agency for Toxic Substances and Disease Registry.
Clement Associates. 1985. Clement Associates, Inc. Chemical, physical, and biological properties of compounds present at hazardous waste sites. Final Report. Arlington, VA: Clement Associates, Inc.
USEPA. 1995. U.S. Environmental Protection Agency. Health effects assessment summary tables (HEAST).
33.0 XYLENES
Xylene refers to three isomers of dimethylbenzene (DMB), ortho- (1,2-DMB), meta- (1,3-DMB) and para-(l,4-DMB). Most smdies have investigated die toxicity of mixmres of all three isomers.
Acute toxicity values for xylenes to aquatic organisms range from 13,500 /ig/L for adult trout to about 30,000 /ig/L for other freshwater fish (USEPA 1985). No data were located regarding tiie chronic toxicity of xylenes to aquatic species. Bioconcentration factors for xylenes have been estimated to range from 45 to 105 (ATSDR 1990).
No data were located regarding the toxicity of xylenes to terrestrial wildlife. Acute oral doses of 4,000 to 6,000 mg/kg can cause deafli in rats and mice (NTP 1986). Rats given 200 mg xylene/kg in feed (approximately 10 mg/kg/day) for sk months had liver cell injury (hepatocyte vacuolization) (Bowers et al. 1982). Chronic exposure of rats to 500 or 1,000 mg xylene/kg/day resulted in decreased weight gain at the lower dose and hyperactivity (a sign of central nervous system toxicity) in mice (NTP 1986). No clinical signs of injury were reported in rats or mice at doses of 250 mg/kg/day. Smdies in rats suggest the liver is subject to mild injury following sue weeks of exposure to 3,500 ppm. A NOAEL of 250 mg/kg/day and a LOAEL of 500 mg/kg/day were identified in rats for hyperactivity and decreased body weight (USEPA 1995). The NTP (1986) detected no evidence of tumorigenicity in rats exposed to 500 mg/kg/day or in mice exposed to 1,000 mg/kg/day for two years.
References:
ATSDR. 1990. Agency for Toxic Substances and Disease Registry. Toxicological profile for total xylenes. Aflanta, GA: Agency for Toxic Substances and Disease Registry.
BflWf ^"'
4
\
I
f
Bowers DJ, Cannon MS, Jones DH. 1982. Ultrasttucmre changes in livers of young and agmg rats exposed to methylated benzenes. Am. J. Vet. Res. 43:679-683.
NTP. 1986. National Toxicology Program. Technical report on the toxicity and carcinogenesis smdies of xylenes (mixed) (60% m-xylene, 14% p-xylene, 9% o-xylene and 17% ethylbenzene) (CAS no. 1330-20-7) in F344/N rats and B6C3F1 mice (gavage smdies). Research Triangle Park, NC: National Toxicology Program. NTP-JR327, NIH Publication No. 87-2583.
USEPA. 1995. U.S. Environmental Protection Agency. Integrated Risk Information System. March 1995 retrieval.
USEPA. 1985. U.S. Environmental Protection Agency. Chemical, physical and biological properties of compounds present at hazardous waste sites. Washington, DC: U.S. Environmental Protection Agency, Office of Waste Programs Enforcement. September 27, 1985.
34.0 ZINC
Aquatic invertebrates are very resistant to toxic effects of zinc compared with of copper and cadmium. Zinc concentrations less than 100 /tg/L were toxic to some algal species (USEPA 1987). Acute toxicity in freshwater organisms occurred with concentrations that range from 90 to 58,100 /tg/L (USEPA 1985a). Chronic toxicity in freshwater organisms has been observed over the range 47 to 852 /tg/L. The alga Selanastmm capricomumm exhibited toxic effects at 30 /xg/L (USEPA 1985a). Acute toxicity values for the fathead minnow and bluegill were approximately 4,000 /xg/L and 6,000 /xg/L, respectively, at 50 mg/L water hardness (USEPA 1987). Malformations of frog embryos have been associated with zinc concentrations of 2,200 to 3,600 /xg/L (Dawson et al. 1988). Phvsa spp. (snails) exhibited acute toxicity at zinc concentrations greater tiian 1,000 /ig/L at 50 mg/L water hardness (USEPA 1987). Zinc toxicity to aquatic species is reduced by increased water hardness. Chronic zinc toxicity to fish and aquatic invertebrates has been demonstrated at concenti-ations of 36.4 /tg/L and 46.7 /xg/L, respectively. Comparable acute toxicity values of 66 /xg/L (fish) and 32 /xg/L (invertebrates) have been reported. The ER-L for zinc in sediment is 120 mg/kg; the ER-M is 270, with an overall apparent effects threshold of 260 mg/kg (Long and Morgan 1991). Persaud et al. (1993) reported a lowest effect level of 120 mg/kg and a severe effect level of 820 mg/kg. Bioconcentration factors for zinc in aquatic species are variable, ranging from 4 to 24,000 (ATSDR 1992).
Zinc is a necessary metal for plant growth, but plant species vary in their zinc requirements. Under zinc-enriched conditions, zinc is accumulated in roots. Zinc phytotoxicity is common, but highly variable depending on plant species (Kabata-Pendias and Pendias 1984). Various antagonistic and synergistic interactions have been reported between zinc and cadmium, copper and iron as well as other elements. Zinc solubility and availability were negatively correlated to soil pH and organic matter. Zinc phytotoxicity has been reported m acidic and sludged soils (Kabata-Pendias and Pendias 1984). Common symptoms of zinc phytotoxicity include chlorosis in new leaves and depressed growth rates (Beyer 1986). Zinc toxicity was, however, highly species- and growth stage-dependent (Kabata-Pendias and Pendias 1984). A bioconcentration factor of 0.4 was reported for zinc uptake from soil in terrestrial plants (ATSDR 1992).
A3-40
I
Zinc is an essential element required for protein synthesis, enzyme function and carbohydrate metabolism (USEPA 1985a). However, growth retardation, hypochromic anemia and defective mineralization of bone occurred in rats fed a diet containing 0.25% zinc (USEPA 1985a). Excessive intake of zinc can cause deficiency of copper and result in anemia, even though copper is adequate in the diet (USEPA 1985b). Severe anemia was noted in mice subchronically exposed to 68 mg/kg/day (ATSDR 1992). Rabbits exhibited a decrease in hemoglobin following exposure to 174 mg/kg/day (ATSDR 1992). Fetal resorptions, fetotoxicity and reproductive dysfunction were observed in rats orally exposed to high zinc doses ranging from 200 to 500 mg/kg/day for intermediate durations (ATSDR 1992). A LOAEL of 70 mg/kg/day was identified for zinc in mice for histopathological changes of tiie pancreas and kidney (ATSDR 1992). No effects were observed in dogs subchronically exposed to 76.5 mg/kg/day (ATSDR 1992). In ferrets exposed subchronically to zinc in their food, a NOAEL of 65 mg/kg/day was reported, witii a NOAEL of 195 mg/kg/day for anemia and kidney effects (ATSDR 1992).
Bioconcentration factors for zinc from soil were reported to be 8 and 0.6 for terrestrial mvertebrates and mammals, respectively (ATSDR 1992).
References:
ATSDR. 1992. Agency for Toxic Substances and Disease Registry. Toxicological profile for zinc. Draft. Aflanta, GA: Agency for Toxic Substances and Disease Registry.
Beyer WN. 1986. A reexamination of biomagnification of metals in terrestrial food chains. Environ. Toxicol. Chem. 5:863-864.
Dawson DA, Stebler EF, Burks SL, Banfle JA. 1988. Evaluation of the developmental toxicity of metal-contaminated sediments using short-term fathead minnow and frog embryo-larval assays. Environ. Toxicol. Chem. 7:27-34.
Kabata-Pendias A, Pendias H. 1984. Trace elements in soils and plants. Boca Raton, FL. CRC Press.
Long ER, Morgan LG. 1991. The potential for biological effects of sediment-sorbed contaminants tested in the national stams and trends program. Seatfle, WA: National Oceanic and Atmospheric Administration. NOAA Technical Memorandum NOS OMA 52.
Persaud D., Jaagumagi, R. and Hayton R. 1993. Guideliines for the Protection and Management of Aquatic Sediment Quality in Ontario. Ontario Ministry of flie Environment and Energy. ISBN 0-7729-9248-7.
USEPA. 1987. U.S. Environmental Protection Agency. Office of Water Regulations and Standards. Ambient water quality criteria for zinc - 1987. Washington, DC: U.S. Environmental Protection Agency. PB87-153581.
i i i^l^G' A3-41 * !
I
USEPA. 1985a. U.S. Environmental Protection Agency. Chemical, physical and biological properties of compounds present at hazardous waste sites. Washington, DC: U.S. Environmental Protection Agency, Office of Waste Programs Enforcement. September 27, 1985.
USEPA. 1985b. U.S. Environmental Protection Agency. Office of Water Regulations and Standards. Ambient water quality criteria for copper - 1984. Washington, DC: U.S. Environmental Protection Agency. PB85-227023.
USEPA. 1984. U.S. Environmental Protection Agency. Office of Research and Development. Health effects assessment for zinc (and compounds). Cincinnati, OH: U.S. Environmental Protection Agency. EPA 540/1-86-048.
f A3-42 r0?33fy>g968
I
APPENDIX 4
PRELIMINARY RISK CALCULATION WORK SHEETS
Part A - RBSC Comparison Food Chain Modeling for Ecological RBSC Values A4-2 Calculation of Soil RBSC Values . A4-3 Summary of RBSC Comparison A4-6
Part B - Sediment Toxicitv Calculation of Site-Specific Sediment (Quality Criteria A4-9 Comparison of Site-Specific Sediment Quality Criteria A4-13 Comparison to Lowest Effect Levels A4-18
Part C - Herbivore Food Chain Analvsis Toxicological Effects Levels for Rabbit A4-22 Comparison of Daily Intakes to Toxicity Reference Values A4-23
Part D - Omnivore Food Chain Analvsis Toxicological Effects Levels for Bird A4-24 Comparison of Daily Intakes to Toxicity Reference Values A4-25
r I
A4-1
30196S
f
b
f I
FOOD CHAIN MODELING FOR ECOLOGICAL RBSC VALUES
Soil RBSC values were developed using an exposure model utilizing the short-tailed shrew (Blarina brevicauda) as the target species. The basic equation is as follows:
The following describes input factors to this model.
1. Toxicity Reference Values
Toxicity reference values were derived from toxicological information collected during a comprehensive literamre and database search. The following data sources were used: Agency for Toxic Substances and Disease Registry Toxicological Profiles, USEPA's IRIS, Registry of Toxic Effects of Chemical Substances, Fish and Wildlife Contaminant Hazard Reviews, and other scientific publications.
Quantitative dose-response information representing either the highest NOAEL or the lowest LOEL were selected, with preference given to ecologically significant endpoints such as reproduction or development. Data for mice or rats were used rather than other test organisms. If NOAEL or LOEL values were not available, and only acute medial lethal doses were, the LDjg was multiplied by 4.7E-04, as suggested by Layton et al. (1987).
2. Exposure Factors
The following intake factors were obtained from the USEPA Wildlife Exposure Factors Handbook:
• The average body weight: 0.017 kg
• Food ingestion rate: 0.61 kg/kg/day
The following additional assumptions were made:
• The shrew's diet consists entirely of earthworms • The individual spends all of its time at the point of maximum chemical concentration • 5% of the diet is incidentally ingested soil
Bioconcentration factors (BCFs) to estimate chemical concentrations in invertebrates were based on literamre values, where avaUable. A default value of 1.51 was used if no BCF were available. For inorganics, soil to beef bioaccumulation factors from Baes et al. (1984) were used as defaults.
A4-2 301970
Calculation of Soil RBSC Values: Based on Shrew Food Chain
SUMMARY OF RBSC COMPARISONS-TRI-CITIES BARREL SITE
Potential Ctiemlcal o l Concem
Acenaphthene
Acenaphthylene
Acetone Aldrin
Alpha-Chlordane
Aluminum
Anthracene
Antimony
Aroclor-1248
Aroclcr-12S4
Aroclor-12eO
Arsenic
Barium
Benzene
Benzo(a)anlhracene
Benzo(a)pyrene
Benzo(b)tluoranthene
6enzo(g,h,l)perylene
Benzo(lc)fluoranthane
Berytlium
Beta-BHC Bis(2-ethylhexyl)phthalate
Butanone, 2-
Butylbenzylphthalate
Cadmlimi Calcium
Carbazole
Carbon disulfide
Cartion tetrachloride
Chlorobenzene
Chloroform
Chromium
Chrysene
Cobalt
Copper
DDO. 4,4'-
DDE, 4,4'-
DDT. 4,4'-
Delta-BHC
Di-n-bulvlphthalate
Di-n-octylphlhalate
Dtbenz(a,h)anthracene
DibenzoTuran
Dichloroethane, 1,1-
Dichlcroelhene, 1,1-
Dichloroethene, 1,2- (total)
Dieldrin
Diethylphthalate
Soil
Max.Concentration, mg/kg 13.45
8.7
0.18
0.57
300
18300
20.5
137
6.1
160
99
16.5
1210
0.003
37.5
40
19.85 37.3
10.4
55
0.033
13000
0.8
21.1 8.7
40800
14.55
NO
1.7
0.013
0.041
1610
41
37.2
477
7.65
0.15
4.3
0.35
5.75
21.7
12.2
23.9
0.99
0.009
0.22
54.5
80
Soil Benchmark, mg/kg
10.51
10.51
105
0.01
0.26
NC
126
11.25
0.23
0.23
0.23
19.4
122
1.05
91.07
126
126
149
149
30.5
NC
63
1861
1576
162
NC
151
-746
28.6
13.6
50.2
71.3
67.9
172
21
9.24
0.03
NC
04.6
315.3
10.5
NC
0.36
9.5
9.46 0.11
2102
Sediment
Max. Concentration, mg/kg
68
ND
ND
ND
4.6
23800
ND
6.8
4.3
33
0.055
13.6
134
ND
210
110
190
67
56
2
0.11
31
ND
ND
3.6 1860
35
ND
ND
ND
ND
35.7
190
17.4
24.2
0.58
0.89
0.11
ND
0.05
0.4
12
63
ND
ND
ND
0.24
ND
Sediment Benchmark, mg/kg
0.016
---
0.007
NC
-2
0.023
0.023
0.023
8.2
NC
-4
0.43
4
4
4
NC
NC
NC
_ -
1.2
NC
NC
_ --_
81
4
NC
34
NC
0.005
0.0016
-2.2
0.58
4
2
---
0.052
-
Surface Water
Max. Concentraticn, mg/L ND
ND
ND
ND
2.05E-05
NC
NO
ND
ND
NO
ND
ND
0.03
ND
NO
ND
ND
ND
ND
ND
ND
ND
ND
ND
ND
21.6
ND
0.013
ND
ND
ND
ND
NO
NO
ND
ND
ND
NO
ND
ND
ND
NO
ND
ND
ND
ND
ND
ND
Surface Water
Benchmark, mg/L
--_ _
2.40E-O3
0.087
-----
0.0039
--------_ -
NC
-NC
--. ------------------
COC7
Yes No
No
Yes
Yes
Yes
No
Yes
Yes
Yes
Yes
Yes (Sediment)
Yes
No
Yes
Yes
Yes
Yes
Yes
Yes
Yes
Yes
No
No
Yes
Yes
Yes (Sediment)
Yes (Surface Water)
No
No
No
Yes
Yes
Yes(Sediment)
Yes
Yes
Yes
Yes
Yes
No
No
Yes
Yes
Yes
No
No
Yes
No
SUMMARY OF RBSC COMPARISONS-TRI-CmES BARREL SITE
Potential Chemical of Concem
Dimethylphenol, 2,4-
DinitrtAoluene, 2,4-
Endosulfan sulfate
Endrin
Endrin aldehyde
Endrin ketone
Ethylbenzene
Ruoranthene
Ruorene
Gamma-Chlordane
Heptachlor
Heptachlor epoxide
Hexachlorobenzene Hexachlorocyclopentadiene
Hexanone, 2-
lndeno(1,2,3-cd)pyrene
Iron
Isophorone
Lead
Magnesium
Manganese Mercury
Methoxychlor
Methylene chlaride
Melhylnaphlhalene, 2-
Methylphenol, 2- (o-Cresd)
Methylphenol, 4,6-dinitro-^
Methylphenol, 4- (p-Cresd)
Methylphenol, 4-chloro.3-
Naphthalene
Nickel
Pentachlorophenol
Pentanone, 4-methyl-2- (MIBK)
Pheruuithrena Phenol
Potassium Pyrene
Selenium
Silver
Sodium
TCDD, 2,3,7,8-
Tetrachloroethane. 1.1,2,2-
Tetrachloroethene Thallium Toluene
Toxaphene
Trichloroethane, 1,1,1-
Trichloroelhane, 1,1,2-
SoM
Max.Cancentration, mg/kg
0.54
22.3
0.076
0.75
0.69
0.0098
13.85
73
44.5
400
36 0.1
0.078
0.14
1.1
16.4
76300
0.43
8510
4940
1690
7.1
8.4
0.005
23.85
10.2
1.8
23.9
0.074
29.1
70.7
0.068
0.92
113
76
1770
71.5
1.7
51.7
654
1.91E-04
0.42
0.78
4.3
17
ND
11
0.008
Soil
Benchnnark, mg/kg
0.63
0.63
NC
0.11
NC
NC
142.9
126.1
39
0.26
0.05 O.OS
1.68
7.4
NC
34.9
NC
157.6
88
NC
1265 2.7
26.3
194.4
10.5
52.5
NC
52.5
NC
10.51
146.4
0.53
52.5
96.4
63
NC
117.1
11.3
3093
NC
1E-06
0.12
21
2.5
620
_ 105
31.5
Sediment
Max. Concentration, mg/kg
ND
ND
NO
NO
0.006
ND
ND
540
95
6
0.1
0.003
ND
NO
ND
89
42500
NO
69.7 4280
2230
1.9
NO
NO
13
0.29
NO
0.48
NO
14
25
ND
ND
600
ND
1740
430
0.78
1.6
313
NO
ND
ND
0.84
ND
2.3
ND
ND
Sediment Benchmark, mg/kg
-_ _ -
0.02
_ -
0.6
0.54
0.007
NC
0.005
_ _ _ 4
NC
-47
NC
460
0.15
-_ 4
NC
-NC
-0.16
21
_ -
0.24
_ NC
0.66
NC
1 NC
_ _ _
NC
-0.028
_ -
Surface Water
Max. Concentration, mg/L
ND
ND
ND
NO
NO
ND
NO
ND
NO
3.75E-05
NO
NO
ND
ND
ND
ND
2.9 ND
3.20E-03
5.2
o.oe 3.10E-04
2.0
ND
ND
ND
NO
ND
ND
ND
ND
ND
NO
ND
ND
ND
ND
NO
ND
53.7
NO
ND
ND
ND
NO
NO
NO
ND
Surface Water
Benchmark, mg/L
---------
2.40E^)3
------1
-2.50E-03
NC
0.08
1.3E-06
NC
---
- --------_ ----
NC
--------
C O C ? No
Yes
Yes
Yes
Yes
Yes
No
Yes
Yes
Yes
Yes
Yea
No
No
Yes
Yes
Yes No
Yes
Yes
Yes
Yes Yes (Surface Water)
No
Yes
Yes
Yes
Yes (Sediment)
Yes
Yes
Yes
No
No
Yes
Yes
Yes
Yes
Yes
Yes
Yes
Yes
Yes
No
Yes
No
Yes
No
No
SUMMARY OF RBSC COMPARISONS-TRI-CITIES BARREL SITE
Potential Chemical of Concem
Tn ch 1 oroetn en e
Vanadium
Vinyl chloride
Xylenes (total)
Zinc
Soil
Max.Cancentration, mg/k f 1.4
274 0.008
72 6510
Soil
Beiichmaik, mg/kg
576.9
24 0.02
21.7 819.7
Sediment
Max. Concentration, mg/kg
ND 32.8
ND ND 188
Sediment Benchmark, mg/kg
-NC
_ -
150
Surface Water
Max. Concentration, mg/L
ND 3.80E-03
ND ND
0.06
Surface Water Benchmark, mg/L
-1.OOE-02
--1
COC 7
No Yes No Yes Yes
filename: n:\1316JA0\TC8\DATA\RBSC.WQ1
> I
00
• • • - - a f
ceo
(£0
.,(32) •
cucuiATicM or siTK-sPBCtric flniiHEn guALiTT CII:TSIIIA
f9QC (ng/kg) - BSgc * TOC • c r
> • a a p l « - ^ a a l £ l e wdiMent Qua l l t r C r i t e r i o n > • • • • ••4lM»nt g u a l l t r C r i t e r i o n , ag /g of organio eatben • Total Organlo carbon Cenoontrat lent Kg/kg o t a a i ^ l a > coRvarmlon f ac to r {• IX-OC)
Total organla cartoea
«a£2i
> f> 1
VD
Aeanaphtha iw Aoanaphthana
••nto< a)anthraoana Ban>o(a)pyraM >anio(b)fliioranthaM> Bante(k)fluoranthan» Banto{k)flw>ranth»na ••nto<ghljporylona » la(a-o thylhaKrl )phtha la to ChryMn*
riooranthaiM
riuoranthana r luorana Ind«no<l ,2 .9^>prE*na) Indano(l,},S-od)pyrafM) 01baRS(a,h)anthraeana Dlbansefuran
rhananthrana Phananthrana ryrana Mpha-Chlordana Mpha-ChlenJana Mlpha-Chlordana Mph-Chlerdana hTW>lor-lU» Kroelor-134a Aroolor- ia ie ARMler-13}« k roe l e r . l 3 )4 It toolor-ia54 K > t o t a l
rao. «.<•• DDO. « « < • -
DOS, « . * • -
DOS, « . < • -
DOT. 4 . 4 ' -
DOT. 4 , « ' -
m i T . * , * • •
Olaldr ln Dla ldr ln
• Dta ldr in Bndrln aldahyda Sndrln aldahydo Sndrln aldahyda
O iMi Chlortana
Tnaphana
Tosiphana
o . n 1 4 0
1 4 0
0.949 0.97
140
0.24 1 4 0
O.IT 1 » . 5
0.94 1 4 0
2 . 0
loae 0 . 1 3
0 . 1 0
0 . 2
1 4 0
0 . 0 <
a O.OS
1 2 0
O . M
0 . 4 t
1 .4
0 . 0 9
O.OOf
O.OOT
2 T 4 0 . 0
1 0 . 9
1 . 4
2 7 0 0 . 0
1 9 . 9
" 1 . 4
0 , 0 7
I . O
0 . 0 0 0
1 .0
0 . 0 0 9
1 . 0
1 1 0 0
O.OOT
0 . 0 5 2
t O.TT
0 . 0 0 9
4
0 . 0
1 . 4
0 . 0 9
0 . 0 0 0
O.OOT
0 . 0 2 0
9 . 2
0 . 0 1
USEPA l t * 9
ST - C h r e n l a
ST • C h r o n l o
P a r a a u d • LSL
P a r a a u d - b £ L
ST - C h r o n l e
P a r a a u d - L C L
ST - C h r o M e
P a r s a o d - U X
ST . C h r o n l e
P a r a a u d - U L
S T - C h r s n l o
USIPA 1 » * 9
ST - C h r o n l e
P a r a a u d - L E I .
P a r a a u d - L B L
P a r a a u d - L E I .
ST - C h r o n l e
P a r a a o d LXL
UflXPA l » t <
UaZPA 1 » » 9
ST - C h r o n l e
P a r a a u d - L X I .
P * r « * u d - L Z L
ST • A c u t a
ST • C h r o n l e
ST - B i o
P a r a a u d - Z « b
ST - AOTto
ST - C h r o n l e
ST - B l e
ST - A e u t *
ST - C h r o n l e
ST - S l o
P o r m a u d L i b
ST - S l o
P a r a a n d U L
ST * s l o
P o K s a u d LBL
ST - C h r o n i c , S l o
ST - A c u t a
P a r o a u d LXL
v n p A >«»9
ST • C h r o n l e
ST - B lO
p a r a a o d LEL
ST - C h r o n i c
ST - B i o
ST - ACUtO
ST . C h z o n l a
ST - B i o
USEPA I t O O
ST - A C U t *
ST - C h r o n i c
0 . 0 0 5
i.ao4 i.ao4 0.009 0.009 1.304 o.ooa 1.304 0.001 l . T U 0.009 1.204 0.025 o.Tn e.oos 0.002 0.002 1.204 0.001 e.oiT O.OOT
. . 0 .5T9 0.042 0.002 0.090 0,000 0.090 0,000 0,090 99.000 0.000 o.ooa 0 , 2 T O
0 . 0 3 9
0 . 0 0 0
0 . 1 3 0
0 . 0 3 4
0 . 0 4 2
0 , 0 0 1
0 , 0 0 0
0 . 0 0 0
0 . 0 0 1
0 . 0 9 0
0 . 0 0 0
0 . 0 9 9
T . 4 9 0
T , 4 9 0
0 . 0 1 0
0 . 0 3 0
T . 4 9 0
0 . 0 1 9
T . 4 9 0
0 . 0 0 9
1 0 . 0 T 9
0 . 0 1 0
T . 4 9 0
0 . 1 9 9
5 4 . 9 1 0
0 . 0 4 0
0 . 0 1 0
0 . 0 1 1
T . 4 9 0
0 . 0 0 9
0 . 1 0 7
0 . 0 4 9
4 , 4 3 0
0 . 0 3 0
0 . 0 3 4
0 .QT9
0 . 0 0 3
0 . 0 0 0
0 . 0 0 0
1 4 T . T 0 9
1 . 0 9 9
0 . 0 7 5
1 4 T . T 0 9
1 . 0 9 9
0 . O T 9
0 . 0 0 4
0 . 0 5 4
0 . 0 0 0
0 . 0 5 4
0 . 0 0 0
0 . 0 5 4
9 0 . 0 5 0
0 . 0 0 0
0 . 0 0 9
0 . 4 0 2
0 . 0 4 1
0 . 0 0 0
0 . 3 1 4
0 . 0 4 9
e . 0 T 5
0 . 0 0 2
0 . 0 0 0
0 . 0 0 0
0 . 0 0 1
O . l T l
0 . 0 0 1
LSM (USEPA 1 9 9 9 ]
0 . 0 0 9
1 . 9 4 0
1 . 9 4 0
0 . 0 0 5
0 . 0 0 5
1 . 9 4 0
0 . 0 0 9
1 . 9 4 0
0 . 0 0 3
2 . T 9 9
0 . 0 0 5
1 . 9 4 0
0 . 0 4 1
1 4 . 2 0 0
0 . 0 1 1
0 . 0 0 9
0 . 0 0 9
1 . 9 0 0
0 . 0 0 1
0 . 0 2 0
0 . 0 1 2
1 . 4 0 0
0 . 0 0 0
O.OOT
0 . 0 3 0
0 . 0 0 0
0 . 0 0 0
0 . 0 0 0
9 0 . 4 5 1
0 . 2 T O
0 . 0 3 0
9 0 . 4 5 1
O . 2 T 0
0 . 0 2 0
0 . 0 0 1
0 . 0 1 4
0 , 0 0 0
0 . 0 1 4
0 . 0 0 0
0 . 0 1 4
1 5 . 4 0 0
0 . 0 0 0
0 . 0 0 1
0 . 1 2 4
0 . 0 1 1
0 . 0 0 0
e . 0 5 <
0 . 0 1 1
0 . 0 3 0
0 . 0 0 0
0 . 0 0 0
0 . 0 0 0
0 . 0 0 0
0 . 0 4 9
0 . 0 0 0
1.
ST • t «chn lea l Ooldanoaa for Setoanlng Oontaalnatad SadlBMits (STOBEC 1994) | • a lna fo r a l t h a r acu ta o r ehronle t o s i c l t y fo r ban th le a q u a t i c U f a , o r Mi ld l l f* bioaeeuwolat ion (Blo) ,
Poroaud LEL - Loaat Offact lawal f ro* Paraaud a t a l , (1999) USBPA 1994. valua baaad on a q u i l l b r l u a p a r t i t i o n i n g »athod vaportad In USEPA (1990).
ni\l91«JAD\tCB\S0aMSK\0XDCaMP.«Ql
CALCULATIO* OT SXTE-fPECIPtC OEDIKEST gUALITT CRITESIA
Total Organic Carbon
seanaphthana Aoanaphthana •anao{•)anthraeana Sanae(a)anthraeana Same (a )pf rana Banao(b)Cluoranthana Manae (k) f luoranthana sanso(k)fInoranthana BaRto(ghi )parylana SlB<2-«thrlh»syl)phthalat Chryaana Chryaana r iuoranthana r iuoranthana r iuoranthana riuoK«na
Alpha-Chlordana Alpha-chlordana Alpha-Chlerdana Alpb^hlordaiw Aroeler-iaOO Aroelor-1240 Aroaler-1240 Aroclor-1354 Atoelor-12S4 Aroelor-1354 PCB t o t a l DDO, 4 , 4 ' -POO, 4 , 4 ' . DOS, 4.4*> DDE, 4 . 4 ' -DOT, 4 . 4 ' -DOT. 4 . 4 * . p o t . 4 ,4*-P i a l d r l n
. PJialdrln '^pi 'a ldrln
' • < « >
.*'<Mrln aldahyAa l ^ r l n aldat^da
»]|^rln
a ^ Teiiphana
\ J . J Tosaphana
Toxaphana
0.420 140.000 140.000
0.949
0.9TO
140.000 0.240
140.000 0.110
199.900
0.940
140.000 2.900
loao.eoo 0.T50 0.190 0.300
140.000 0.000 2.000 0.050
120.000 0.900
0.490
1.400
0.090 0.004 0.001
2140.000 19.900
1,400 3140.000
19.900
1.400 0.010 1.000 o.oeo
1.000 0.009
1.000 1100.000
0.001
0.093
9.000 O.T10
0.009 4.000
0.000 1.400 0.090
0.004 0.001 0.031
9.3 0.01
USEPA 1999
ST - Chronle ST - Chronic Paraaud - LEL
paraaud-LEL
ST • Chronic panaud^LXL
ST - Chronic par*aud.LXL ST - Chronle Pcraaud-LEL
ST-«hronic USBPA 1999 S« - Chronle
Pcraaud-LEL
Paraaud-LEL
ST • Chronic paraaud LEL USSPA 1990 USEPA 1999 ST - Chronle
PCraaud-LEL Paraaud-LXL
•T - Acute ST - Chronle ST - Bio
ST ' Aeuta
ST - Chronic
ST - Bio ST - Acuta ST - Chronic
ST - Bio POZMUd LSL ST - Bio
ST • Bio parsaud LXL
ST - Chronic, Bio ST • Acuta Paroaud LXL USEPA 1999
BT • Chronic ST - Bio Porsaod LSL
ST - Chronle ST - Bio
ST - Acuta ST - Chronic
ST - Bio par»aud-LBL USEPA 1990 ST • Acuta ST • Chronle
SXDT'l
0100.000
0.005 1.194 1.194 0.009
0.009
1,194
0.003 1.194 0.001 1.014
0.009
1.194 0.029
0.202 e.ooo
0.002 0.002
1.194 0.000 0,010
0,00T 0.913 0,009
0.004 0.011
0.000 0.000
0.000 22.942 0.194
0.011
22.942 0.194
0.011 0.001
0.000 0.000
0.000
0.000 0,000
0.910 0.000
0.000
0.0T9 0.000 0.000
0,093 0.000 0.011
0.000 o.oeo 0.00
0.00 0.09 0.00
OEOO-l
T300.000
0.004 1.000 t .ooo 0.002
0.009 1.000
0.002 1.000
0.001 1.494
0.003 1.000
0.031
T.944 0.009 0.001
0.001
1.000
0.000 0.014 0.000
0.SC4 0.004 0.004
0.010 0.000 0.000
0.000 19.0TS
0.199
0.010 19.070
0.199
0.010 0,001 0.001 0.000
O.OOT
o.oeo O.OOT T.oae
0.000 0,000
0.099 0.000 0.000 0.039 0.004
0.010 0.000
0.000 0.00 0.00 0.02 e.oo
SEDie-1
1500.000
0.009 1.090 1.090 0.009
0.009
1,090
0.002 1.050 0.001 1.494 0.009
1.050 0.022 1.490 0,004 0.001
0.003
1.090
0,000 0,015 0.004
0,900 0.004
0.004
0,011 0.000 0.000
e.ooo 20.100
0.145
e . o i i
30.TOO 0.145 0.011
0.001 o.eoo 0.000
e.ooo
e.ooo o.eoo
0.250 0.000 o.eoo
0.040 0.000 0.000 0.090 o.eoo
0,011 0.000
0.000 e.oo o.eo
0.02 0.00
0 0 1 9 . 2
0100.000
0.005 1.194 1.194 0.009
0.009
1.194
0.003 1,194 0.001 1.014
0.009
1,194 0.029
0.243 0.004
0.002 0.002
1.194 O.eoo 0.014 O.OOT
0 . 9 T 2
0.005 0.004
o . e i i 0.000 e.ooo
e.ooo 33.942
0.154
0.011 33.943
0.154
0.011 0.001 0.000 0.000
0.000
0.000 0.000
0.910 0.000 0,000
0.0T9 0.004 e.ooo
0.093 0.004
0,011 0.000
0.000 0.00 0.00 0.09 0.00
SI014-3
0100.000
0.005 1.194 1.194 0.009 0.009
1,194
0.002 1.194 0.001 1.014
0.009
1,194 0.029
0.242 0.004
0.003 0.003
1.194 O.eoo 0,014
0.001 0.913 0.009
0.004
0.011 0.000 O.eoo
o.eeo
32.943 0,154
0.011
32.903 0.194
0.011 0.001 0.000 0.000
0.000
e.ooo 0.000
0,910 0,000 0,000
0.0T9 0.004 o.eeo
0.093 0.004
0,011 0.000
0,000 o.oe 0.00 0.09 0.00
0XD19-3
0100.000
0.009 1.194 1.194 0.009
0.009
1.194
0.003 1.194
0.001 1.014
0.009
1.194 0.029
0.243 0.004
0.002 0.002
1.194 O.eoo
o .e io O.OOT
0 , 9 T 2
0.009 0.004
o . e i i 0.000 0.000
0.000
23.943 0.154
0.011 23.943 0.154
o . e i i 0.001 0.000
0.000
0.000 0.000 0.000
0.910 0.000
0.000
O.OTO 0.004
o.eeo 0.093 0,000
0.011 0.000
o.eeo 0.00 0.00 0.09 0.00
OED14-3
0100.000
0.009 1.194 1.194 0.009
0.009
1.194 0.003
1.194 0.001 1.414 0.009
1.194 0.039
0.343 0.004 0.002
0.003
1.1J4 0.000 0.014 O.OOT
0 . 9 T 3
0.005 0,004
0.011
e.ooo e.ooo
o.oeo 33.943 0,154
0.011
33,903 0.154
0.011 0.001 0.000 0.000
0,000
e.eoo o.eoo
0.910 e.ooo e.ooo
e.0T9 0.004
0.000 0.093 0.004 0.011 e.ooo
0.000 o.oe 0.00 0.09 o.oe
lOO
:; cp
CD
TABLE CALCULATIdS Of SITE-OPXCiriC OEDIKEST QUALITT CSltSAIA
T o t a l O r g a n l e cazbon
Aoanaph thana
Aeanaph thana B a n a e ( a ) a n t h r a e a n a B a n a e { • ) a n t h r a e a n a
BanBO{a)pyz«na S a n B o ( b ) f l u o r a n t h a n a B a n a e ( k ) f l u o r a n t h a n a B a n a o ( k } t 1 u e r a n t h a n a S a n s o ( g h l } p a r y l a n a
conrjuiuoa or ( i n - s n c i r i c UDmar oolAm m n a i A
> *> 1
M * >
C b M l o . l
T o t a l Or««nla C u b o o
AOMMphtKono
B«>la(a)pyra iM B « i i e ( b ) f l u o T u i t h « t o B«i ie (k ) f l t io ru>th« i io B. i i io(k) f l u o T u t h o n a B«n io («h l )po ry lono B i a ( 2 - * t h y U i a x y l ) p h t h a l « t » Chryaana Chvyaana r l o e r a n t h a a a r i u o r a n t h a n a r i u o r a n t h a n a r l u e r a n a Indane( 1 ,2 , l - e d ) n r r a a a ) Ind« io ( 1 ,2 , l - e d ) p T r a a a ) Dibant ( a , b) a n t h r a e a n a
r h a n a n t h r a n a r h a n a n t h r a n a r h a n a n t h r a n a r r r a n a Alpha-ChloTdana A l p h a - c h l o r d a n a A lpha -ch lo rdana Alph-Chlerdana Aroe le r -1240 Aroe l ez -124 ( Azoa le r -124( Arooloc-1294 Areo lor -1294 Aroolec-1294 rcB t o t a l ODD, 4 , 4 ' -DDO, 4 , 4 - -DOB, 4 , 4 - -DDB, 4 , 4 ' -DOT, 4 , 4 ' -DDT, 4 , 4 ' -ODI, 4 , 4 ' -D l a l d r l a O l a l d r l n D l a l d r l n Bndr ln a ldahyda Bndr ln a ldahyda
_ Bndrln a ldahyda
T l^ (« - /Oanna -Ch lo rdaaa C 3 ^ * 4 a a n n a - C h l o r d a a a faaA r '^ 'Vanna-Chlordana - ^ ; ^ > j o a , p h - » S M > v 9 « * p h a n a
Conpariaon of tBD9-2
Ceoo . ,
0 0
0.19 0.19 0.19 0.10
0 0 0
4 . ( O.K O .K 0.19 0.99 0.19
0 0 0 0 0
0.10 0.10 ( . 1 0 0.20 0.90 0.90 0.90 0.90
0 0 0 0 0 0 0
0.14 0.14 0.49 0.49
0 0 0 0 0 0 0 0 0
0 .97 ( . 9 7 0.97 0.97
2 . 1 1.1 2 . 1
•0-»QC
I.H+OO 7 . (B+( (
(.(I+OO
2.9(+00
9.71+00
4.0B+00
(.OB+00 l . lB+01 7.71+00 l . (B+«2 I . ( I + O l 1.9X+01
2.(B+00 1.11+01 0.4B+00 1.71+01
7.(B+00 I.(B+02 l.OB+01 1.9B+01 1.9B+01 l . lB+01 4.1B+01
( a n p l a C e n e a n t r a t l e n a SBD(-1
C o n e . ,
( ( 0 0 0 0 0 0 0
0 .11 0 0 0 0 0 0 0 0 0 0 0 0
( (
( . 0 0 9 1 ( . 0 0 9 1 ( .0031 ( .0091
0 . (09 ( . 0 0 9 0.009
0 0 0
0.009 0 0
( ( ( 0 0
( . 0 0 0 ( 0 0 .000(0 ( . 0 0 0 ( 0
0 0 0
0 .0091 0.0091 0 . ( 0 9 1 0.0091
0 0 0
•g-BQC
1
( 9
9
2 1 9
2B+01 lB+01 2X+01
2 t+0(
.2X+01
. lB+(2
.1B+(1
w i t h Bampla-apael f le •BD7.1
C o n e . ,
( 0 0 0 ( ( ( 0 0
11 0 0 0 0 0 0 0 0 0 0 0
( ( (
(.(92 0.(92 (.032 (.(32
4 . 1 4 . 1 4.1 1.9 1.9 1.9 ( . 2
( ( 0
( 0 0 0
0.12 0.12 0.12
0 0 0
0.010 0.(11 ( . (1 ( (.010
0 0 0
•Q-8QC
1.91+01
4.(B+0( 2.1B+02 l . lB+01 9.2B+02
2.(B+01 l.(B+02
1.2B+01 1.71+02 l . IB+(4
2.0B+O2 t . (B+«( 1.9B+(1
l . (B+00 7.4B+(1 1.71+02 1.2X+02
l a d l n a n t O n a l i t y C r i t e r i a , n9 /k« SBDO-1 HDlO-1
Cene . , Ceno . , n a / k « BQ-SOC mq/kg BO-BQC
0.042 0.041
> I
CO
o CP QHL
coHrAiiisoB or (iTB-trBCiric (BOHBIR ooALin CKITIIIIA
l e a l
CO Total Orfanie Carbon
Aeanaphthana
Aeanaphthana
Bonse C A) anthr aeana
Banso(a)anthraeann
Banso(a)pyrooa
Baaso|b)fluoranthana
Banso(k)fluoranthana
Banso<k)fluoranthana
Bans o(ghl)parylana
BiB(2-athylhaacyl)phthalata
Chryaana
Chryaana
rluoranthana
rluoranthana
riuoranthana
rluorana
Zndaoio( 1 ,2 ,3-od)py r a n a ) Znd«no( l , 2 ,3 -od )pyrana ) Dlbans (A, h) anthraeana
l .Ot+01 2..9B+02 9.(B+01 I.7B+00 2.1B+02 l . lB+00 2.7B+02
4.1B+01 2.1B+02 1.9B+(2
• a n p l a
Cene. ng /k ,
9 .1
C e n e a n t r a t l e n a
1X014-2
r "O-ooc
9 l . (X+00
>9 1.9B+01 9 2.(B+02 9 9.2B+01 1 1.4B+«0
>1 1.7B+02 )1 1.9B+00 )1 l.OB+02
w i t h San p l a - a p a e l f l o SX019-2
C e n e . ,
0
0 0
0 0 0 0
4.2
l . ( 1.0 1.0 1.0
0071 0071
.0099
.0099 0099 (099 0
( (
•o-sge
2.(B+eO
2.41+01 1.4X+02 ( .71+01
l . lB+02
2.1B+01 l . lX+02 (.7B+01
( a d l n a n t d u a l i t y C r i t e r i a , a « / k i SXOK-2 (XD17-2
Ceno . ,
0 0 0 0
( ( 0 0 0 1 0 0 0 0 0 0 0 0
( ( ( ( 0 0 0 0 0 0 0 0 0
0 . 9 ( 0 . 9 ( ( . 9 ( 0 . 9 (
0 0 0 0 0 0 0 0
( ( ( ( (
0.0019 0.0019 0.0019 0 . (019
( ( (
Cone . , M-agc n9/k« ag-soc
( . 1 1 1.7B+01
( . 1 1 9.4X+(1 1 1.9X+(0
19 l . (X+(0 19 9.(B+(1 4.9B+(1 19 l . l B + 0 1 9.9B+02 19 2 . (B+(4
. ( 7.(X+00 0 1.91+01 0 I.4X+01 0
coHTABisoa or BiTB-srxciric (xoimai ooALin CXITXXIA
> 4S
C3>
.CO
C h a a l e a l
T o t a l Orgu i i e Carbon
AoanaphthMia Aeanaphthana Banse (a )an th raeana feanso(a)anthraeana Ban«e(a)pyreaa Banse(b)Clueran tbana Ba^>o(k)f l uo ran thana Baase(k) f l u o r a n t h e n e Banae(9h l )pa ry lana B l a ( l - a t h y l h a x y l ) p h t h a l a t a Chryaeae Chryaana r i u o r a n t h a n a r i u o r a n t h a n a r i u o r a n t h a n a r l u o r a n a Indane( 1,2, l - e d ) p y r a a a ) I n d a n o ( l , 2 , ] - e d ) l T r e n a ) 0 1 b a n a ( a , h ) a a t h r a e e n a Dibanaefuran
rhanan thrana r y r a n a Alpha-ch lordana Alpha-ch lordana Alpha-ch lordana Alph-Chlerdana Aroelor-1241 Aroeler -1240 Aroole r -124( Areelor -1294 Aree le r -1294 Areelor -1294 rCB t e t a l DDD, 4 , 4 ' -000, 4 , 4 ' -DDX, 4 , 4 ' -DOB, 4 , 4 ' -DOT, 4 , 4 ' -DOT, 4 , 4 ' -DOT, 4 , 4 ' -O i a l d r l n D i e l d r i n D l a l d r l n Bndr ln a ldahyda Bndr ln a ldahyda Bndr ln a ldahyda
coNrABisoa or sztB-srBczrzc BBDZMBBT QUALzry CBITBBXA
Cenyar laon of Banpla C e n e a n t r a t i o n s w i t h B a n p l a - a p a e H i e Badinan t Q u a l i t y C r i t e r i a , ng /kg •BD23-2 8BD24-2 8ED29-2 8BD61-1 8BD9-3a
f ^ S ' * ' ''<>-<>l>»n*<'-*''*(^l*«^/n<>-<>l>o*rvad«lvara».aflact^«al (NOAEL); Lo«Mst«bsar«ad.adv«raa-eMecVlaval (LOAEL). ' % ^ ^ (b) UFl - uncertainty (actor aaaodatad wHh axtrapolatkin to NOAEU UF2 « uncertainty (actor aaaodatsd with sxtrspoiatton } y ^ (c) Full dtatkm in Appendix 3. f ^ (d) Baaed on eflecta and values (or acenaphthene. ^ * * ^ (a) Baasd on eflecta and values fc:rArDdor-1254. C j 3 (0 Bsaed on elfeets end values for pyrene.
( " ^ (g) Bsssd on effects and values for naphthalene.
to target spades.
CO m u i v o u rooD CBAia - coHPAitno or DAILY n T k n s ran RABBIT HITB n i i c i n nxniiBaci v u m t
CO
io
(QOATIOm I Dl(planta) • (Ca • Bcrte) • (ri/BH)(0.>4) or Cp/«.tS*ri/BH««.»4
Ol(aell) • Ca • ri/BW • S.Of
ri (g/day dxy setter) • S.977 • Bll'0.727 If BK - 1,0*0 «, TX •
then rl/BH • O.OIO
NJ
C h e e l e a l
A n t l s e e y
B a r l u a
B e r y l l i u m
Cadmium
Chromium ( V I )
Ceppar
L e a d
MangaBeee
H a r e o x y
• l e k e l
i e l a m l u m
i l l v e x
I h a l l l u m
l i a e
1 , 1 - D l e h l e r e a t l u m s
l y l e o e e
Aeeaaph thane
BeBao (a )amth raeeBa
B e B a e ( a ) p y r a B S
BaBae(b ) ( l u e r a a t b a a a
B e a s e ( « , h , D p e i y l e o a
B e B a e ( k ) f l a e r e > > t l i e a e
B l e ( ] - a t h y l h e x r l ) p h t h « l a t e
Chryeeme
Dlbems ( a , h ) a n t h r a e e o e
P l u e r a a t h e B a
P l t te reme
IadeBO( 1 , 2 , 9 - e , d ) p r r e B S
H e t h y l a a p h t h a l a a a , 2 -
• a p h t h a l e a a
t h e a a s t h r a a a
r y r e a e
A l d r i n
A l p h a - C h l e r d a n a
A r e e l e r - 1 2 4 1
A r e o l e r - 1 2 S 4
DOD
00<
DDT
D t e l d r i a
Oamma-Chlerdaae
• e p a e h l o r
B e p t a e h l e r e p e x t d e
H e t h e x y e l e r
R D D , 2 , 2 , 7 , 0 -
t « V
9 . 2 0 1 - 0 )
) . ] l l - 0 ]
1 . 2 I I - 0 2
6 . l » - 0 4
1 . 9 0 1 - 0 1
2 . 4 7 1 - 0 2
( . 2 9 1 - 0 4
> . 2 2 ( - 0 1
1 .441 -02
2 . 1 1 1 - 0 1
1 . 2 9 1 - 0 1
9 . 7 0 1 - 0 1
1 . 4 0 1 - 0 1
1 . 7 S t - 0 9
1.001+00
7 . 1 9 B - 0 1
0 . 0 0 1 - 0 9
1 . 9 4 I + 0 1
1.09B+00
I . I I B - O l
• . i n - 0 9
( . 9 1 1 - 0 2
4 . ( » - 0 1
4 . ( 9 1 - 0 1
a .90B+00
9 . ( 1 1 - 0 1
9 . 1 9 1 - 0 1 .
7 . 0 1 1 - 0 1
7 . 0 1 1 - 0 1
4 . ( 0 1 - 0 1
( .29B+O0
( . 2 9 1 + 0 0
4 . 1 1 1 - 0 1
4 . ( 9 1 - 0 1
9 . l n - 0 4
9 .44B-09
1 . 1 9 B - 0 )
l . l l B - O l
9 . 7 1 1 - 0 1
1 . 9 0 1 - 0 1 .
9 . 1 9 1 - 0 4
9 . 1 9 1 - 0 4
9 . 4 4 1 - 0 9
0 . 9 0 1 - 0 4
0 . 1 0 1 - 0 4
7 . 0 1 1 - 0 2
1 . 4 4 1 - 0 4
B C r l v ,
D r y » t .
2 . 0 0 1 - 0 1
1
9 0 1 - 0 1
.001 -02
. 9 0 1 - 0 1
. 9 0 1 - 0 1
. 0 0 1 - 0 1
. 9 0 1 - 0 2
, 9 0 1 - 0 1
. 0 0 1 - 0 1
. 0 0 1 - 0 2
. 9 0 1 - 0 2
, 0 0 1 - 0 1
. 9 0 1 - 0 2
. 9 0 1 - 0 9
.901+00
• A
m
WH
• A
• A
• A
• A
• A
«A
l U
• A
• A
• A
• A
• A
• A
n
•A •A «A
• A
• A
• A
• A
• A
• A
>A
• A
• A
• A
• A
. 0 0 1 - 0 2
r r o e e e e l a g
1 .971+02
1 .211+09
9 . 9 9 1 + 0 1
0 . 0 7 1 + 0 0
1 . ( 1 1 + 0 9
4 . 7 7 1 + 0 2
1 .091+09
1 .241+09
7 . 1 0 1 + 0 0
7 . 0 7 1 + 0 1
1 .701+00
9 . 1 7 1 + 0 1
4 . 9 0 1 + 0 0
1 . 7 4 1 + 0 1
( . 9 1 1 + 0 9
0 . 0 0 1 - 0 1
4 . 2 0 1 - 0 1
2 . 7 4 1 + 0 1
1 . 1 9 1 + 0 1
1 . 7 9 1 + 0 1
4 . 0 0 1 + 0 1
l . M I + 0 1
1 . 7 9 1 + 4 1
1 .041+01
1 .901+04
4 . 1 0 1 + 0 1
1 .211+01
7 . 1 0 1 + 0 1
4 . 4 9 1 + 0 1
1 . ( 4 1 + 0 1
2 . 1 9 1 + 0 1
2 . 0 2 1 + 0 1
1 .111+02
7 . 1 9 1 + 0 1
9 . 7 0 1 - 0 1
l . O O I + O ]
9 . 2 0 1 + 0 0
0 . 9 0 1 + 0 1
7 . ( 9 1 + 0 0
1 . 9 0 1 - 0 1
4 . 1 0 1 + 0 0
9 . 4 9 1 + 0 1
4 . 0 0 1 + 0 2
1 . ( 0 1 + 0 1
1 . 0 0 1 - 0 1
0 .401+00
1 . 0 1 1 - 0 4
B e r t h
0 . 0 0 1 + 0 0
1 . ( 4 1 + 0 2
2 .401+00
1 .901+00
1 .401+01
2 . 1 1 1 + 0 1
0 . 0 ( 1 + 0 1
1 . ( 0 1 + 0 1
2 . 1 0 1 + 0 0
2 . ( 1 1 + 0 1
2 . 9 0 1 - 0 1
I . 0 0 1 + 0 0
t . 4 0 1 + 0 0
2 . 2 0 1 + 0 1
1 . ( 7 1 + 0 2
0 . 0 0 1 + 0 0
1 . 0 0 1 - 0 1
1 . 2 9 1 + 0 1
0 . 0 0 1 + 0 0
0 . 0 0 1 + 0 0
0 . 0 0 1 + 0 0
0 . 0 0 1 + 0 0
0 . 0 0 1 + 0 0
0 . 0 0 1 + 0 0
( . 7 0 1 + 0 0
0 . 0 0 1 + 0 0
0 . 0 0 1 + 0 0
0 . 0 0 1 + 0 0
0 . 0 0 1 + 0 0
0 . 0 0 1 + 0 0
0 . 0 0 1 + 0 0
0 . 0 0 1 + 0 0
0 . 0 0 1 + 0 0
0 . 0 0 1 + 0 0
0 . 0 0 1 + 0 0
1 . 1 0 1 - 0 1
( . 1 0 1 + 0 0
1 .101+91
9 . 1 0 1 - 0 1
1 . 4 0 1 - 0 1
1 . 9 0 1 - 0 9
4 . 7 0 1 - 0 1
1 . 2 0 1 - 0 1
1 . 1 0 1 - 0 9
0 . 0 0 1 + 0 0
4 . 9 0 1 - 0 2
0 . 0 0 1 + 0 0
O e e t h
1 .101+01
1.001+02
0 . 1 9 1 - 0 1
1.401+00
2 .111+01
1 .401+01
1.411+02
1 . ( 4 1 + 0 1
1.401+00
2 . ( 9 1 + 0 1
1.201+00
1 .101+00
4 . 1 0 1 - 0 1
1 .101+01
4 . 0 7 1 + 0 1
0 .001+00
0 .001+00
1 .101+01
0 .001+00
2 . 9 0 1 - 0 1
1 . ( 0 1 - 0 1
1 . 4 0 1 - 0 1
1 . 1 0 1 - 0 1
7 . 9 0 1 - 0 1
7 .001+00
1 . 0 9 1 - 0 1
0 .001+00
9 . 4 0 1 - 0 1
0 .001+00
1 . 9 9 1 - 0 1
0 .001+00
0 .001+00
1 . 7 9 1 - 0 1
4 . 1 9 1 - 0 1
7 . 1 9 1 - 0 4
1 .401 -02
0 .001+00
4 . 1 4 1 - 0 1
I . 1 0 1 - 0 1
0 .001+00
0 .001+00
9 . ( 0 1 - 0 1
7 . 0 0 1 - 0 9
O.OOl+OO
O.OOl+OO
0 .001+00
0 .001+00
M a s t Ceneem
y r o e e a a l n g
1 .741+01
I . 0 2 1 + 0 2
9 . 9 1 1 - 0 1
4 .441+00
1 .211+01
1.011+42
1 .121+01
1 .101+02
( . 1 9 1 + 0 0
4 .241+00
4 . 2 9 1 - 0 2
1 .071+01
1 . 1 1 1 - 0 1
1 . 9 1 1 - 0 1
0 . 7 7 1 + 0 1
0 .001+00
0 .001+00
0 .001+00
S.OOl+00
0 .001+00
( . 0 0 1 + 0 0
0 .001+00
0 .001+00
0 .001+00
0 .001+00
( . 0 0 1 + 0 0
0 .001+00
0 .001+00
O.OOl+OO
0 .001+00
0 .001+00
0 .001+00
O.OOl+OO
0 .001+00
( . 0 0 1 + 0 0
0 .001+00
( . 0 0 1 - 0 1
4 .101+00
0 .001+00
0 . 0 0 1 + « (
4 . 0 0 1 - 0 1
0 .001+00
0 .001+40
0 .001+00
0 .001+00
( . 0 0 1 + 0 0
1 . 0 ( 1 - 0 (
t r a t l e o , m g / k g
B e r t h
0 . 0 0 1 + 0 0
1 . 4 ( 1 + 0 1
1 . 4 0 1 - 0 1
0 . 1 9 1 - 0 1
1 . ( 1 1 - 0 1
0 . 1 4 1 + 0 0
1 .901+00
4 . 1 1 1 + 0 1
1 .101+00
1 . ( 0 1 + 0 0
( . 1 9 1 - 0 1
7 . ( 0 1 - 0 1
1 . ( 9 1 - 0 1
1 . 2 ( 1 - 0 1
1 . 9 1 1 + 0 1
0 . 0 0 1 + 0 0
0 . 0 0 1 + 0 0
0 . 0 0 1 + 0 0
0 . 0 0 1 + 0 0
0 . 0 0 1 + 0 0
0 . 0 0 1 + 0 0
0 . 0 0 1 + 0 0
0 . 0 0 1 + 0 0
0 . 0 0 1 + 0 0
( . 0 0 1 + 0 0
0 . 0 0 1 + 0 0
0 . 0 0 1 + 0 0
0 . 0 0 1 + 0 0
0 . 0 0 1 + 0 0
0 . 0 0 1 + 0 0
0 . 0 0 1 + 0 0
0 . 0 0 1 + 0 0
0 . 0 0 1 + 0 0
0 . 0 0 1 + 0 0
0 . 0 0 1 + 0 0
0 . 0 0 1 + 0 0
S .001+00
9 . 1 0 1 + 0 0
0 . 0 0 1 + 4 0
0 . 0 0 1 + 0 0
( . 0 0 1 + 0 0
0 . 0 0 1 + 0 0
0 . 0 0 1 + 0 0
0 . 0 0 1 + 0 0
0 . 0 0 1 + 0 0
0 . 0 0 1 + 0 0
0 . 0 0 1 + 0 0
S e u t h
1 .21+00
l . O I + O l
0 . 4 1 - 0 9
1.01+00
1 . ( 1 - 0 1
1 .41+01
( . 9 1 + 0 0
4 . 1 1 + 0 1
1 .91+00
1 . ( 1 + 0 0
9 . 0 1 - 0 1
0 . 1 1 - 0 1
1 . 1 1 - 0 1
1 . 1 1 - 0 1
( . 1 1 + 0 1
0 .01+00
0 .01+00
0 .01+40
0 .01+00
0 .01+00
0 .01+00
0 . 0 1 + 0 0
0 .01+00
9 .01+00
0 .01+00
6 .01+00
0 .01+00
0 .01+00
( . 0 1 + 0 0
0 .01+00
0 .01+00
0 .01+00
( . 0 1 + 0 0
0 .01+40
0 .01+00
0 .01+00
0 .01+00
0 .01+00
0 .01+00
O.Ol+OO
0 .01+00
0 .01+00
0 .01+00
0 .01+00
0 .01+00
0 .01+40
0 .01+00
D a i l y I n t a k e , m g / k g / d a y
r r o e e e a i a g
1.091+00
1 .141+01
1 . 1 7 1 - 0 1
4 . 1 0 1 - 0 1
0 .901+00
1 .011+01
1 . ( 7 1 + 0 1
1 .221+01
9 . ( 4 1 - 0 1
7 . 2 4 1 - 0 1
1 .291 -02
1.001+00
4 . 0 4 1 - 0 2
1 .971 -01
( . 4 2 1 + 0 2
9 . 2 1 1 - 0 1
2 . 2 2 1 - 0 1
1 . 4 9 1 - 0 1
7 . 1 0 1 - 0 2
1 . 0 0 1 - 0 1
2 . 1 1 1 - 0 1
1 . 0 9 1 - 0 1
1 . 0 7 1 - 0 1
9 . 4 0 1 - 0 1
( . 1 ( 1 + 0 1
1 . 1 ( 1 - 0 1 .
( . 4 7 1 - 0 1
9 . 0 9 1 - 0 1
1 . 1 9 1 - 0 1
0 . ( ( I - 0 2
1 . 2 ( 1 - 0 1
1 . 9 4 1 - 0 1
9 . 0 7 1 - 0 1
9 . 7 0 1 - 0 1
1 . 0 1 1 - 0 1
1.901+40
7 . 7 1 1 - 0 2
( . 7 0 1 - 0 1
4 . 0 4 1 - 0 1
7 . 0 1 1 - 0 4
S . 9 0 1 - 0 1
1 . 0 0 1 - 0 1
1 .111+00
1 . 0 0 1 - 0 1
9 . 1 1 1 - 0 4
4 . 4 4 1 - 0 1
1 . 1 0 1 - 0 (
B e r t h
0 .001+00
1 .001+00
1 . 4 7 1 - 0 1
7 . ( 2 1 - 0 1
1 . 0 9 1 - 0 1
1 . 0 ( 1 - 0 1
7 . 0 0 1 - 0 1
4 . 9 9 1 + 0 1
1 . ( 7 1 - 0 1
1 . 7 1 1 - 0 1
1 . 0 4 1 - 0 9
7 . 1 0 1 - 0 1
1 . ( 1 1 - 0 1
1 . 9 1 1 - 0 1
1 . 1 ( 1 + 0 1
0 .001+00
1 . 9 0 1 - 0 9
1 . 1 1 1 - 0 1
0 .001+40
( . 0 0 1 + 0 0
0 .001+00
0 . 0 0 1 + 0 0
0 .001+40
O.OOl+OO
9 . 9 4 1 - 0 1
0 .001+00
0 . ( 0 1 + 0 0
0 .001+00
O.OOl+OO
0 .001+00
0 . 0 0 1 + 0 0
0 .001+00
0 . ( 0 1 + 0 0
0 .001+00
0 .001+00
1 . 1 1 1 - 0 1
4 . 4 ( 1 - 0 1
4 . 1 0 1 - 0 1
1 . ( 0 1 - 0 9
1 . 1 7 1 - 0 4
7 . 0 1 1 - 0 (
1 . 4 0 1 - 0 1
( . i a -04 9 ' . 0 1 l - 0 (
O.OOl+OO
1 . 1 7 1 - 0 4
0 .001+00
S o u t h
2 . 9 9 1 - 0 1
1.911+00
9 . 7 1 1 - 0 1
1 . 7 1 1 - 0 1
1 . 2 ( 1 - 0 1
1.101+00
1.271+00
4 . 2 ( 1 + 0 1
1 . 1 2 1 - 0 1
2 . 7 1 1 - 0 1
0 . 0 2 1 - 0 9
0 . 0 2 1 - 0 2
4 . 7 1 1 - 0 9
1 . 1 2 1 - 0 1
1 . 2 ( 1 + ( 1
( . 0 0 1 + 0 0
0 .001+00
1 . 2 1 1 - 0 1
0 .001+00
1 . 1 2 1 - 0 1
0 . 4 9 1 - 0 4
1 . 0 0 1 - 0 1
( . 0 ( 1 - 0 4
1 . 0 ( 1 - 0 4
1 .701 -02
1 . 0 0 1 - 0 1
O.OOl+OO
2 . 0 9 1 - 0 9
0 .001+00
1 . 1 0 1 - 0 4
0 .001+00
0 .001+00
1 . 4 9 1 - 0 1
2 . 2 4 1 - ( 1
1 . 0 1 1 - 0 (
1 . 2 7 1 - 0 4
0 .001+40
1 . 1 0 1 - 0 4
( . 1 1 1 - 0 0
0 .001+00
0 .001+00
1 . 0 ( 1 - 0 9
4 . 1 7 1 - 0 9
0 .001+00
0 .001+00
0 .001+00
0 .001+00
B a a a r d Q u e t l e n t
P r e e e e a i t i g
0 .11+02
( . 1 1 + 0 9
l . O I + O l
( . 0 1 + 0 2
( . 1 I + ( 1
7 .41+02
2 . 7 1 + 0 4
2 . ( 1 + 0 2
1.01+02
1 .11+00
1 .01+01
9 .11+00
0 .01+01
7 . 7 1 + 0 1
1 . ( 1 + 0 1
1 .71+00
1 .71+01
1.41+40
0 . ( 1 + 0 0
4.«+( l ( . 9 1 + 0 1
7 . 7 1 + 0 1
l . n + 0 2 0.21+02
( . 1 1 + 0 2
2 .01+02
B e r t h
S . ( l + ( 2
1.11+02
1.41+00
1 . ( 1 + 0 1
1.91+09
1 . (1+02
1.21+02
1.91+00
7 .41+01
2 .01+01
4 . (1+02
l . O I + O l
7 .01+00
S e u t h
7 .91+01
9 .01+01
2 .91+02
9 .91+01
2 . 0 1 + 0 )
9 .91+02
7 .01+01
7 .11+00
7 .41+01
4 .01+01
TOXICOLOGICAL EFFECTS LEVELS FOR BIRD -- TRI-CITIES BARREL
Chemical
Arochlor-1248 Arochlor-1254 Chlordane DDE
Dieldrin
Surrogate Species
Mallard Mallard Quail Quail
Critical Effect
Mortality Mortality Mortality Mortality
Partridge Mortality
Route
Oral Oral Oral Oral
Oral
Duration
Acute-l-DSO Acute-LDSO Acute-LDSO Acute-LDSO
Acute-LDSO
Experimental Dose (a) NOAEL LOAEL
(mg/kg/day) (mg/kg/day)
2000 2000 14.1 841
8.84
UFl
100 100 100 100
100
Uncertainty Factors (b) UF2
16 16 16 16
16
Combined
1600 1600 1600 1600
1600
Toxicity reference
value
1.25E+00 1.25E+00 8.81 E-03 S.26E-01
S.53E-03
Reference(c)
Eisler 1986 Eisler 1986 Eisler 1990 Hudson 1984
Hudson 1984
!> I
N>
(a) No-cbserved-flffect-level/no-observed-adverse-effect-level (NOAEL); Lowest-obseived-adverse-elfect-level (LOAEL). (b) UFl = uncertainty factor associated with extrapolation to NOAEL; UF2 » uncertainty factor associated with extrapolation
CO
(c) Full citation In Appendix 3.
SB o
CD
o CO o J — * CD CO a3
OMNIVORE FOOD CHAIN - COMPARISON OF DAILY INTAKES FOR ROBIN WITH TOXICITY REFERENCE VALUES
(a) For plants a default dry weight to wet weight conversion factor of 0.05 was assumed (Baes 1984). For earthworms a default dry weight to wet weight conversion factor of 0.05 was assumed (professional judgment).