56
Citibank European Credit Conference Citibank- European Credit Conference London November 30, 2011

Citibank European Credit ConferenceCitibank- European Credit Conference LondonNovember 30, 2011

Disclaimer
This presentation does not constitute or form part of, and should not be construed as, any offer or invitation to subscribe for, underwrite or otherwise acquire, any securities of the Company or any member of its group nor should it or any part of it form the basis of, or beCompany or any member of its group nor should it or any part of it form the basis of, or be relied on in connection with, any contract to purchase any securities of the Company or any member of its group or any commitment whatsoever.
THIS DOCUMENT MAY NOT BE DISTRIBUTED AND MAY NOT BE REPRODUCED IN ANYTHIS DOCUMENT MAY NOT BE DISTRIBUTED AND MAY NOT BE REPRODUCED IN ANY MANNER WHATSOEVER. ANY DISTRIBUTION OR REPRODUCTION OF THE ATTACHED DOCUMENT IN WHOLE OR IN PART IS UNAUTHORIZED.
This presentation comprises publicly available information and the Company undertakes noThis presentation comprises publicly available information and the Company undertakes no obligation to update this information after the date hereof. The information contained in this presentation is for background purposes only and is subject to amendment, revision and updating. No representation or warranty, express or implied, is made as to the fairness, accuracy or completeness of the information contained herein and no reliance should be
l d it N f th C th i d i th t li bilitplaced on it. None of the Company, their advisers or any other person accepts any liability for any loss howsoever arising, directly or indirectly, from the issue of this document or its contents.
Thi t ti i l d t i f d l ki t t t A t l lt ld diffThis presentation includes certain forward-looking statements. Actual results could differ materially from those included in the forward-looking statements due to various risks and uncertainties, including but not limited to changes in business, economic and competitive conditions, regulatory reforms, foreign exchange rate fluctuations, uncertainties in litigation or investigative proceedings and availability of financing.or investigative proceedings and availability of financing.
2

Agenda
● Executive Summary
St t d b i d l● Strategy and business model
● Financial overview and capitalization
● Growth and business plan
● Supplementary materials
3

Executive summary
Codere at a glance
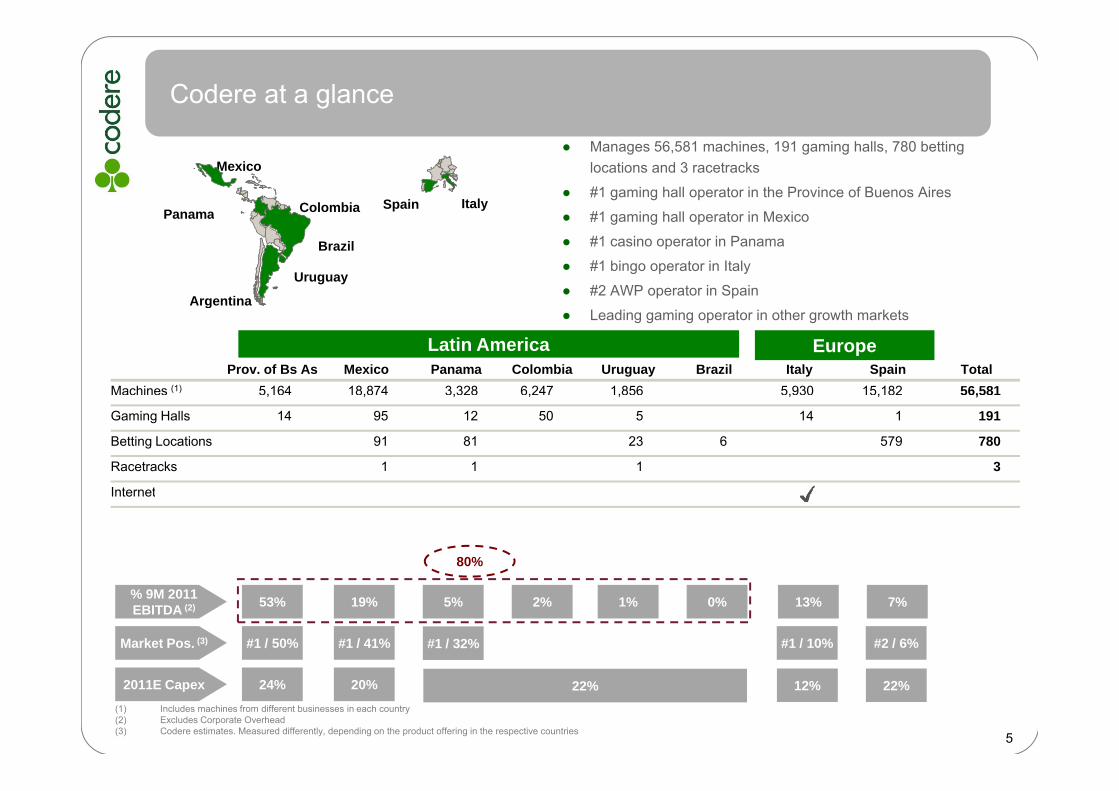
● Manages 56,581 machines, 191 gaming halls, 780 betting locations and 3 racetracks
● #1 gaming hall operator in the Province of Buenos Aires
● #1 gaming hall operator in MexicoColombiaPanama
Mexico
ItalySpain● #1 gaming hall operator in Mexico
● #1 casino operator in Panama
● #1 bingo operator in Italy
● #2 AWP operator in SpainUruguay
Brazil
Panama
Argentina● Leading gaming operator in other growth markets
Latin AmericaProv. of Bs As Mexico Panama Colombia Uruguay Brazil Italy Spain Total
Machines (1) 5,164 18,874 3,328 6,247 1,856 5,930 15,182 56,581
g
Europe
, , , , , , , ,
Gaming Halls 14 95 12 50 5 14 1 191
Betting Locations 91 81 23 6 579 780
Racetracks 1 1 1 3
Internet
80%
Market Pos. (3) #1 / 50% #1 / 41% #1 / 10% #2 / 6%
% 9M 2011 EBITDA (2) 53% 19% 5% 2% 1% 0% 13% 7%
#1 / 32%
(1) Includes machines from different businesses in each country(2) Excludes Corporate Overhead(3) Codere estimates. Measured differently, depending on the product offering in the respective countries
2011E Capex 24% 20% 12% 22%
5
22%

Key investment highlights
Compelling growth story in Latin America
• Strong track record of organic and non organic growth• Low gaming penetration in a context of high GDP growth rates in Latin America• Well positioned for legalization of gaming halls in Brazil and launch of on-line
• #1 gaming operator in the Province of Buenos Aires, in Mexico and casino operator in Panama
yand Italy activities in Latin America
• Competitive advantage in nascent VLT market in Italy
in Panama• Leading market position in Italy (#1 in bingo) and Spain (#2 in AWP machines)• Market share of c. 50% in Argentina and in c. 41% Mexico, the two largest markets• Entrenched operator with key local relationships and licenses in a highly regulated
market
Leading position in all markets
market• First mover advantage in most markets
Strong management• Experienced management team and Board with unique knowledge of the business• Proven track record navigating market cyclesStrong management
team and operations g g y
• Unrivaled local market expertise• Six years reporting as a public company
• Limited near-term maturitiesStrong balance sheet and cash flow profile
ed ea e a u es• Cash generative business• Low maintenance capex• Flexible investment program
Unique international gaming footprint with exceptional growth potential6

Strategy and business model

Growth drivers are not directly linked to economic cycles
Increasing gaming as % of GDP● Regulatory dialogue
○ Tax authorities outsourcing, large employer,
Increase market share● Strategic alliances
○ Attracting best partners successful partnershipg, g p y ,responsible gaming
● Technological & game innovation○ Video, server-based gaming, TITO, jackpots,
multigame● Market knowledge
○ Attracting best partners, successful partnership dialogue
● Driving consolidation○ Leadership in core markets, successful integration of
acquisitions, cross-fertilization of best practices● Market knowledge
○ Customer preferences, distribution footprint
GGY as % of GDP (1) Population per machine (2)
300,000
400,000
ines
It.60Mn
Sp 47Mn
2.71
1.37 1 11 0 99
0
100,000
200,000
Mac
hi
Prov. of Bs. As. 14 Mn
Sp.47Mn
Pan. 4Mn
Mex. 111Mn
Uru. 3Mn
1.11 0.99 0.93 0.71 0.67 0.670.25 0.17
00 500 1,000 1,500 2,000
Mac
hine
in
trod
uctio
n
1979 199619401936 na 200420041968
1- Gross Gaming Yield 2010 GBGC Report (data 2007)
na
Population/Machine2- Codere estimates
1979
8
Integrate market knowledge, regulatory expertise and technology, to develop successful, legal, gaming experiences

Codere’s business model
180
Characteristics Codere vs. Las Vegas revenues
100
120
140
160● Regional model of gaming
● Growth focused on profitability rather than scale
● Horizontal versus vertical integration
40
60
80
Q1 07
Q2 07
Q3 07
Q4 07
Q1 08
Q2 08
Q3 08
Q4 08
Q1 09
Q2 09
Q3 09
Q4 09
Q1 10
Q2 10
Q3 10
Q4 10
Q1 11
Q2 11
Q3 11
g
● Institutionalisation / professionalization
07 07 07 07 08 08 08 08 09 09 09 09 10 10 10 10 11 11 11
Las Vegas revenues Codere revenues
Regulation
Regional model Destination model
High Low
vs.
Target market
Stakes / prizes
Regulation
Local clientele
Low
High
Tourist
High
Low
Capital intensity
Marketing
Taxes
Low
High
High
Low
Restricted Permitted
9
Number of players / licensees Low High

Successful implementation of business model has resulted in a solid track record
3001.200
Revenues EBITDA(€ in millions) (€ in millions)
233 231 241 250
1.050
968
1.127
1.000
184 200
200
732
880
800
101
150
455
600
60 71 76
70 73
101
100
272
428
354 352 318 400
0
50
0
200
'00 '01 '02 '03 '04 '05 '06 '07 '08 '09 '100
'00 '01 '02 '03 '04 '05 '06 '07 '08 '09 '10
Notes: Discontinued operations are excluded between 2004 and 2008Gains or losses on asset disposals are excluded from EBITDA since 2008Figures for 2000-2004 are in Spanish GAAP, thereafter in IFRS 10

Argentina – Province of Buenos Aires53% ebitda
1.8006.000
Market Net win vs. machinesKey value drivers
53% ebitda
C G %
1.000
1.200
1.400
1.600
5.000
● Leadership position (c. 50% market share with 14 out of 46 halls) in fast growing market.
● Significant unmet demand resulting from limitation on number of licenses (regional monopolies)
achi
nes
CAGR 05-10 21.9%
Net w
inA
R
400
600
800
3.000
4.000
2005 2006 2007 2008 2009 2010 Q3 2011
Outlook
● Optimization of hall locations and capacity increase (7%-10% growth expected FY2011)
● Continued optimization of park via installation of coinless systems (i e TITO)
# of
m
R$/day
2011
# of machines net win in AR$
Evolution of machines per hall Net win CDR vs. competitors
systems (i.e. TITO)
● Economic growth (7% 2011E) and inflation (24% 2011E)
800
1.000
1.200
1.400
1.600Hall 2005 Q3 2011 Var.%SAN MARTIN 485 642 32%LOMAS DEL MIRADOR 115 656 470%LA PLATA 366 558 52%LANUS 388 512 32%SAN JUSTO 351 410 17%
348 471 35%111%
R$/
day
0
200
400
600
800MORON 348 471 35%SAN MIGUEL 312 388 24%LOMAS DE ZAMORA 256 323 26%MAR 224 204 (9%)SOL 179 310 73%TEMPERLEY 115 129 12%RAMOS MEJIA 186 322 73%
56%
79%H1N1 Flu
AR
Jan‐03 Jan‐04 Jan‐05 Jan‐06 Jan‐07 Jan‐08 Jan‐09 Jan‐10
Codere Rest of the market
11
PEATONAL 121 121 0%CENTRO 99 118 19%
TOTAL 3.545 5.164 46%
(1) Codere estimates
(1)
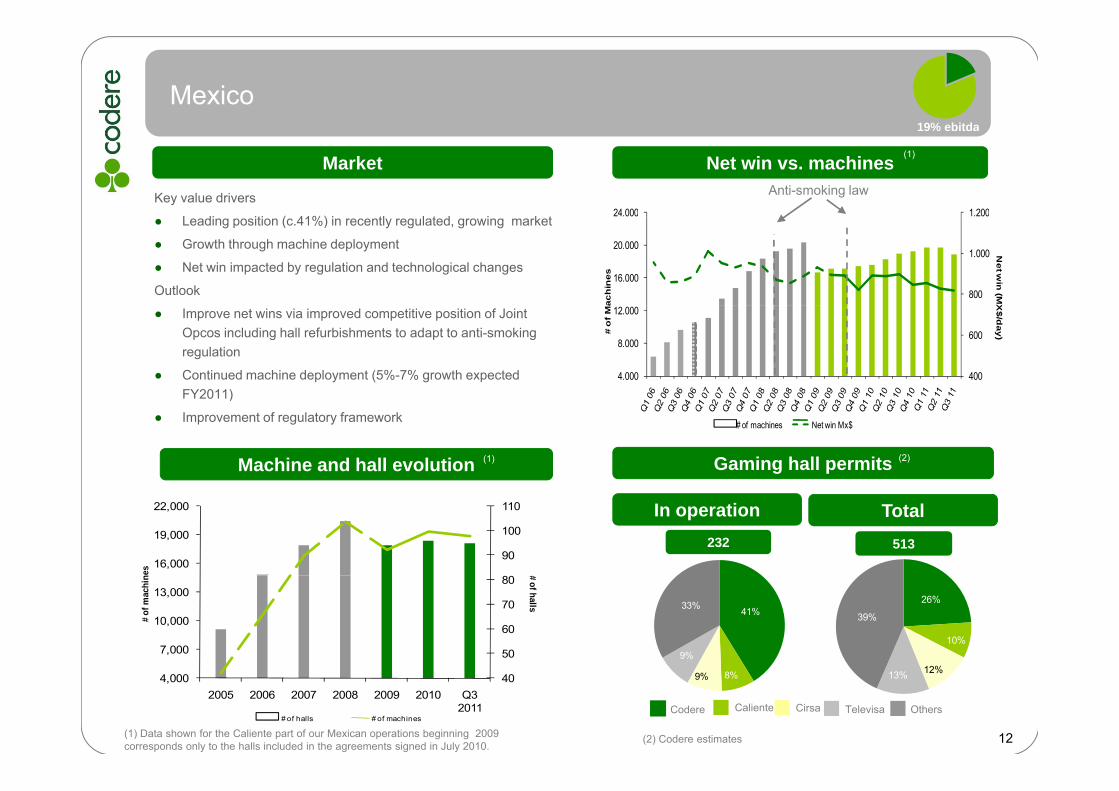
Mexico19% ebitda
24.000 1.200
Net win vs. machines Market
Key value drivers
L di i i ( 41%) i l l d i k
Anti-smoking law
19% ebitda
(1)
16.000
20.000
24.000
800
1.000
1.200
ac
hin
es
Ne
t win
(MX
● Leading position (c.41%) in recently regulated, growing market
● Growth through machine deployment
● Net win impacted by regulation and technological changes
Outlook
4.000
8.000
12.000
400
600# o
f M
X$
/da
y)
● Improve net wins via improved competitive position of Joint Opcos including hall refurbishments to adapt to anti-smoking regulation
● Continued machine deployment (5%-7% growth expected FY2011)
# of machines Net win Mx$
Gaming hall permitsMachine and hall evolution (2)
FY2011)
● Improvement of regulatory framework
(1)
90
100
110
16,000
19,000
22,000
es
In operation Total232 513
41%
9%
33% 26%
10%
39%
50
60
70
80
7,000
10,000
13,000# of halls
# of
mac
hin
8%9%12%13%
12
404,0002005 2006 2007 2008 2009 2010 Q3
2011# of halls # of machines
(2) Codere estimates
Codere Caliente Cirsa Televisa Others
(1) Data shown for the Caliente part of our Mexican operations beginning 2009 corresponds only to the halls included in the agreements signed in July 2010.

Italy13% ebitda
3005.600
Net win vs. machinesMarketKey value drivers
● Relevant presence in fast growing market via 3 businesses:
13% ebitda
140
180
220
260
2.100
2.800
3.500
4.200
4.900p g g
o 14 gaming halls with AWPs and VLTs and bingo (10% market share)
o 1 of 10 network concessionaires with 1,359 VLT rights and 9,000 interconnected AWPs
M hi ti ith 5 168 AWP
Net w
in€/dayof
mac
hine
s
60
100
140
0
700
1.400
Jan-10
Mar-10
May-10
Jul-10
Sept-10
Nov-10
Jan-11
Mar-11
May-11
Jul-11
Sept-11
o Machine operation with 5,168 AWPs
● Growth driven by machine deployment
Outlook
● Continued deployment of VLTs
● Selected acquisitions (AWP machine operators, halls and/or VLT
#
# of AWP machines # of VLT machines
AWP Net Win €/Day VLT Net Win €/Day
Machine ComparisonItalian gaming market
Selected acquisitions (AWP machine operators, halls and/or VLT rights)
(in € billions) CAGRVLT AWP
Minimum payout 85% 75%
Max. prize €5,000 - €500K €100
Taxes (amount 2.8%/18.6% 13.4%/53.6%
(in € billions) CAGR
10%
7%35
28
42
51%
4854
3%
61
51%50%
45%
3%51%wagered/net win)
Location Bingo hallsLBOs
Gaming halls
Bars, cafesBingo halls
89%
25
15
45%
4%52%
18%40% 44%
46% 47%
8%6%
5%5%
3%3%
90%
76%54%
51%
45%
52%4%
13
Net win Q3 2011 €243.4 €70.4
Source: AAMS
18%8%
2003 2004 2005 2006 2007 2008 2009 2010
BingoAWP

Spain7% ebitda
MarketKey value drivers
● Leading position in three businesses:
Net win (seasonally adjusted) vs. regulatory changes
7% ebitda
Castilla la Mancha
5355575961
Leading position in three businesses:
o 2nd largest operator of AWPs with 15,182 machines (6% market share)
o Canoe gaming hall (largest bingo in Spain)
o Sports betting (579 sports betting locations in Madrid, the Basque Region, Navarra and Aragon)
Cataluña (19%)
Valencia
(14%)
Castilla la Mancha (8%)
win
€/da
y
414345474951Outlook
● Decrease in AWP net win in 2011 (est. -12.2%) resulting from national anti-tobacco ban (since Jan. 2, 2011) and macroeconomic situation.
● Decrease in machine portfolio following rationalization
● Synergies from combination of businesses (AWP Sports Betting and Bingo)
Andalucia(12%)
(14%)
Madrid (22%)
Net
Smoking ban(national)
Q1 05 Q4 05 Q3 06 Q2 07 Q1 08 Q4 08 Q3 09 Q2 10 Q1 11● Synergies from combination of businesses (AWP, Sports Betting and Bingo)
● Growth of sports betting locations and increase in the types of machines allowed in gaming halls
Codere net win vs rest of market
(1)
Note: Figures in parenthesis represent percentage of Codere’sportfolio in that region when regulation was introduced.
# Sports betting locationsCodere net win vs. rest of market(in €/day)
# Sports betting locations
461
580 611 579
34 39 3649 50 49
59 56 49 49 44,5 41,6 40,2175 210 205
287
Q4 09 Q1 10 Q2 10 Q3 10 Q4 10 Q1 11 Q2 11 Q3 112007 2008 2009 2010 Q1 11 Q2 11 Q3 11
Market Cirsa Codere
14Source: Spanish National Gaming Commission and Cirsa annual Report
Q4 09 Q1 10 Q2 10 Q3 10 Q4 10 Q1 11 Q2 11 Q3 11

Financial overview and capitalization

Codere’s strong performance has been achieved through geographic and product diversification…
Revenue EBITDA(US$ in millions) (US$ in millions)
208182
18
19
CAGR CAGR
14% 30%
1,544
1,350
1,492343
322316
346
283
263148
182
98
90
5859
7
2119
0%
14%
(5%)
902
1,207
226
275
261
311107
226
287264 278
74
12%
902
530
747
988883
1.046 174
226
(15)
19%12%
2006 2007 2008 2009 2010
(15)(28)(34) (53)
(21) (40)
2006 2007 2008 2009 20102006 2007 2008 2009 2010
16
Latin America Spain Italy Headquarters

…driven by Argentina and Mexico…
Revenue in constant currency
CAGR
EBITDA in constant currency
CAGR(US$ in millions)(US$ in millions )
1 268
12
134 6%
CAGR CAGR
(4%)
9951,047
1,268
311
357
10523
25
331
347119
119
29% 18%
746
995
227
290
80
101
100
15
12
201
348
331
107
132
531172
135
166186
24054
414
529596
788125
107
28%
23%
103
135
2006 2007 2008 2009 2010
295
414
2006 2007 2008 2009 2010
Other Latin AmericaMexicoArgentina
17Excludes gains or losses on the foreign currency contracts

… reflecting sustantial investment in the business…
(4)Spain 87.3 67.3 50.4 21.2 24.2
2009 2010 (€ in million) 2006 2007 2008
19.0
9M 2011
(4)(5)
(6) (11)
(13)
Maintenance 45.5 45.9 38.5 19.0 19.5Growth 41.8 21.4 11.9 2.2 4.7
Argentina 57.1 21.3 51.7 25.1 29.4Maintenance 7.8 9.2 17.5 21.3 16.0
16.92.1
17.19.7
(1)
(6)
(7)(10)
(11)Growth 49.3 12.1 34.2 3.8 13.4
Mexico 60.5 203.1 12.6 12.3 13.8Maintenance 0.5 0.5 7.1 13.4 0.1Growth 60.0 202.6 5.5 (1.1) 13.7
7.4
15.19.45.7
(2)
( )
(8) (12) (14)
( )
Italy 22.5 26.6 5.2 19.0 29.8Maintenance 1.7 3.5 7.2 6.2 3.5Growth 20.8 23.1 (3.3) 12.8 26.3
9.54.25.3
(14)
(3)
(9)(15)
Other 53.0 27.4 22.7 8.5 44.1Maintenance 8.1 14.9 9.8 3.5 7.4Growth 44.9 12.5 12.9 5.3 36.7
Total 280.4 345.7 141.3 86.4 141.3
15.07.27.8
75.7
(8) Bingo Palace (€12m)(9) Codere Network (€6m)(10) Includes acquisition of 49% stake in ICELA and 10% of minorities
(1) Net of repayments from Caliente(2) Numbers for 2007 and 2008 exclude discontinued operations(3) Includes holding company, Panama, Brazil, Colombia and
Total 280.4 345.7 141.3 86.4 141.3Maintenance 63.6 23% 74.0 21% 80.1 57% 63.4 73% 46.5 33%Growth 216.8 77% 271.7 79% 61.2 43% 23.0 27% 94.8 67%
75.747.4 63%28.3 37%
18
( ) q(11) Includes €25.1 million related to the minority purchase(12) Includes €2.8 million in proceeds for the sale in WHCI(13) Includes €11.2 million related to licenses renewals(14) Includes €10 million related to the purchase of the VLT rights(15) Includes €30 million related to the purchase of 6 casinos in Panama
(3) Includes holding company, Panama, Brazil, Colombia and Uruguay.
(4) One-off RF portfolio purchase (5) Includes mainly MAE acquisition(6) Includes 6 license renewals (€30m)(7) Related to the opening of 42 bingo halls

… and driving robust growth in cash generation…
(€ in millions) 2006 2007 2008 2009 2010 CAGR06-10
EBITDA 176 200 233 231 241 8.2%
( ) N t i t t 55 56 66 69 69 5 8%(-) Net interest 55 56 66 69 69 5.8%
(-) Taxes 41 41 47 37 45 2.4%
Operating cash flow 80 104 120 126 126 12.0%
(-) Maintenance capex 64 74 80 63 46 (7.9%)
Discretionary cash flow 16 30 40 63 80 49.5%
( ) Growth capex 217 272 61 23 95 (18 7%)(-) Growth capex 217 272 61 23 95 (18.7%)
Free cash flow (201) (242) (22) 40 (15) n.a.
19

…maintaining prudent leverage ratios and long-dated debt.
€142 million
Prudent leverage Cash as of September 30, 2011
3.9x
3.1x 3.2x2.9x 2.9x
3.1x2.7x
3.2x3.7x 3.5x 3.4x 3.5x 3.6x Europe
41%
(1) (1)
1.0x
2005 2006 2007 2008 2009 2010 Q3 2011
Net debt /LTM EBITDA LTM EBITDA / LTM Net interest
(1) (1)
Others20%
Argentina 24%
Mexico15%
Maturity profile
17% of Argentinein € or US$(1) 2005-2006 EBITDA not adjusted for gains or losses on asset disposals
(€ in millions)
RCF781.2
20.3
2011 2012 2013 2014 2015+
37.7
20
18.311.4 10.0

Operating data (I)
# of machine seats and gaming halls
As of September 30, As of September 30,
2010 2011 % change 2010 2011 % change
Gaming machine seats Gaming halls
Argentina 5,042 5,164 2.4% 14 14 0.0%
Mexico 18,953 18,874 (0.4%) 94 95 0.0%
2 3 930 12 1 16 %(2)
(1)
Italy 2,355 5,930 n.a. 12 14 16.7%
Spain 15,340 15,182 (1.0%) 1 1 0.0%
Panama 3,389 3,382 (1.8%) 12 12 0.0%
C l bi 6 377 6 247 (2 0%) 49 50 2 0%
(2)
(3)
Colombia 6,377 6,247 (2.0%) 49 50 2.0%
Uruguay 1,604 1,856 15.7% 4 5 25.0%
Total 53,060 56,581 6.6% 187 191 2.1%
1- As a result of the Caliente transaction signed on July 16, 2010 data shown for the Caliente part of our Mexican operations corresponds only to the halls included in these new agreements. Data for 2010 has also been adjusted to reflect this change
21
2010 has also been adjusted to reflect this change. 2.- 2011 data includes 762 VLTs
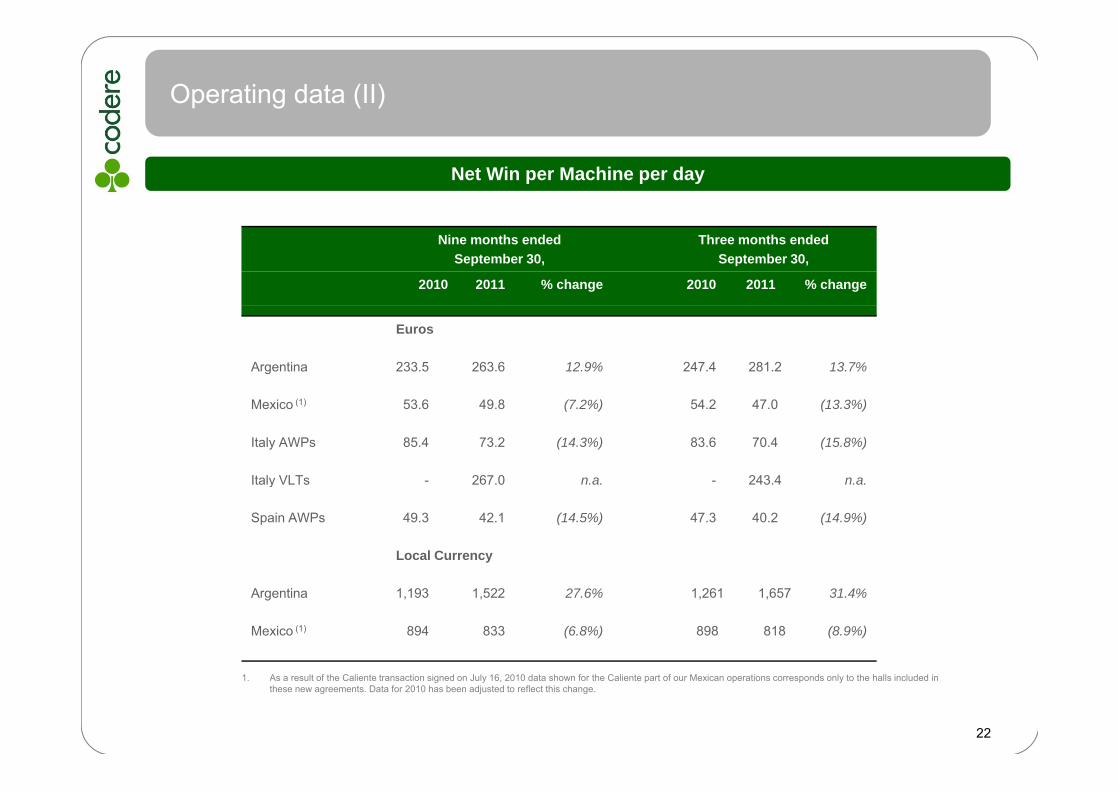
Operating data (II)
Net Win per Machine per day
Nine months endedSeptember 30,
Three months endedSeptember 30,
2010 2011 % change 2010 2011 % change
Euros
Argentina 233.5 263.6 12.9% 247.4 281.2 13.7%
Mexico (1) 53.6 49.8 (7.2%) 54.2 47.0 (13.3%)
Italy AWPs 85.4 73.2 (14.3%) 83.6 70.4 (15.8%)
Italy VLTs - 267.0 n.a. - 243.4 n.a.y
Spain AWPs 49.3 42.1 (14.5%) 47.3 40.2 (14.9%)
Local Currency
Argentina 1,193 1,522 27.6% 1,261 1,657 31.4%
Mexico (1) 894 833 (6.8%) 898 818 (8.9%)
22
1. As a result of the Caliente transaction signed on July 16, 2010 data shown for the Caliente part of our Mexican operations corresponds only to the halls included in these new agreements. Data for 2010 has been adjusted to reflect this change.

Growth and business plan

Business plan is a continuation of succesful growth strategy in ourprincipal markets
• Continue implementation of TITO and other coinless systems• Optimization of hall location and capacity increases
Argentina
Mexico
• Consolidate halls purchased pursuant to Caliente transaction• Improve competitive position of Joint Opcos halls • Continue build-out of permits and installation of machinesp• Continue adaptation of halls to anti-tobacco regulation
Other Latin American O ti
• Uruguay- Continue build-out of Carrasco• Panama- Consolidate synergies following casinos acquisition
Italy• Continue deployment of VLTs in Codere-managed and third party locations• Analyze growth opportunities
Operationsy g g q
• Analyze opportunities in existing or adjacent markets and products
Spain
• Manage effect of anti-tobacco regulation• Achieve synergies from combination of business (AWP, Sports Betting and Bingo)• Consolidate sports betting operations in existing regions and monitor regulatory p g p g g g y
developments in other regions.
Corporate• Continue optimization of intercompany charges• Maintain the effective tax rate• Analyze alternatives to match currency of debt to cash flowsAnalyze alternatives to match currency of debt to cash flows• Explore opportunities to crystallize the value of the business
24

2011 projected KPI growth is in line with track record…
Evolution in the machine portfolio Net wins
2009 2010 2011E2009 2010 2011E
(1) (1)
2009 2010 2011EArgentina
Euros 189.8 236.2% change 24.4%
local currency 989 1,223% h 23 7%
+
2009 2010 2011EArgentina 4,679 5,043 5,396 - 5,547
Absolute change 364 353 - 504% change 7.8% 7% -10%
M i 17 421 19 299 20 264 20 650 % change 23.7%
MexicoEuros 47.0 52.9
% change 12.6% -
Mexico 17,421 19,299 20,264 – 20,650Absolute change 1,878 965 – 1,350
% change 10.8% 5% - 7%
Italylocal currency 883 881
% change (0.2%)
ItalyAWPs
-AWPs 2,181 2,178 +Absolute change (3)
% change (0.1%)
VLTs NA 402 804 1 005Euros NA (1) 86 -
VLTsEuros NA 176.2 +
Spain AWPs 15 587 15 347 -
(1)
VLTs NA 402 804-1,005Absolute change 402 402-603
% change n.a. 100%-150%
Spain AWPs 15,587 15,347Absolute change (240)
% change (1.5%) Spain AWPsEuros 49.2 49.2
% change 0.0%43.2(12.2%)
25
(1) In 2009 the net win for machines placed in bingos was €123.5 and €75 in non-specialized locations

… and expected to generate strong EBITDA growth supported by investments in our key markets
EBITDA
28418%
Total Capex(€ in million) (€ in million)
241
284
28117%
141 141 140
2010 2011E
61
95
65
86(1)
( ) f
Capex
2010 2011E
23
(1) At November 2011 foreign exchange rates
Arg
Others31%
Spain17% Spain 20%
Others21%
Mex
80
63
46
75
Arg. 21%
Mex. 10% Italy
21%
Arg. 30%Italy
18%
Mex11%
6
2008 2009 2010 2011E
26
Maintenance Growth

Outlook 2011: Underlying assumptions and expectations
● Assumptions○ Foreign exchange rates based on forward rates on November 4, 2011
Avg. Averages based on FX forwards as of August 17, 2011 % change 10 vs. 11FY 10 1Q 11A 2Q 11A 3Q 11A 4Q 11F Avg. FY 11
€/AR$ 5.19 5.51 5.87 5.89 5.98 5.81 11.9%
€/MXP 16 74 16 59 16 91 17 41 18 50 17 35 3 6%
● Expectations○ Reported EBITDA expected in range of €281-€284 million
€/MXP 16.74 16.59 16.91 17.41 18.50 17.35 3.6%
€/US$ 1.32 1.37 1.44 1.41 1.39 1.40 6.1%
○ EBITDA projected to improve throughout the year as positive factors progressively outweigh negative factors impacting 2011.• Positive factors:
– Consolidation of Panama casinos– Increases in machine park in Argentina and Mexico– Increases in net win in Argentina– Gradual deployment of VLTs in Italy– Consolidation of Italian acquisitions
• Negative factors:– Implementation of anti-tobacco legislation at national level in Spain on January 2 2011Implementation of anti tobacco legislation at national level in Spain on January 2, 2011– Weak performance of Joint Opcos– Costs associated with new ventures (Carrasco in Uruguay, Internet, Sports Betting in new regions)
• Fourth quarter reported EBITDA expected in range of €72-75 million, compared to €68.9 million in Q4 2010 and €74 2 million in Q2 20112010 and €74.2 million in Q2 2011
27

Icela Option Agreement
Rationale● Achieves strategic objective of becoming majority
Agreement● Signed August 15 2011 ● Achieves strategic objective of becoming majority
owner of all licenses which the Company operates in Mexico
● Consolidates market leadership position in Mexico
● Signed August 15, 2011
● Non-binding option to purchase additional 36% stake in ICELA from CIE
● Gives Codere full control of the day-to-day operations of the business
● ICELA operates 53 halls, next largest players manage c 26 halls
● Purchase price MX$ 2,657 million (c. €144MM) 1
● Subject to certain conditions to closing manage c. 26 halls
● Increases weight of Mexican operations, with potential efficiencies for Codere, including possibility to transfer debt to subsidiaries
● Subject to certain conditions to closing
● COFECO approval October 31, 2011
● Expect to fund with debt financing
(€ in millions) Transaction Proforma
R t d Adj t t PFReported Adjustment PF Transaction
LTM EBITDA September 2011
278 40 318
28(1) At November 14, 2011 €/MX$ of 18.40 (2) Adjustment is equity value for 35.8% (€144MM) +51% of net debt assumed (€32MM)
Net Debt 2 737 176 1 913
EBITDA/Net Debt 2.7x 4.3x 2.9x

The Brazilian market presents a significant opportunity…
• Private gaming is illegal excluding betting on horse races
Private gaming in Brazil
• An estimated 1,100 bingo halls with machines operated as a “gray market” throughout the country prior to a government crack down in 2004
• Codere present in Brazil since 2004 is uniquely positioned for the
Brazil
• Codere, present in Brazil since 2004 is uniquely positioned for the regulation of the activity
•Codere has 10-year exclusivity agreements with major jockey clubs to offer betting services, including on international simulcast racing
Alternatives for Codere
BA
Operator of machines in the racetracks operated by the jockey clubs with
which Codere has
Operation of bingo halls with machines
throughout the country
Pote
ntia
l A
ctiv
ity
agreementsP Asa
ry
tion
29
Decree by Ministry of Agriculture
National law
Nec
ess
regu
lat

… and the company is developing know-how in on-line gaming in anticipation of regulation of the Latin American and Spanish marketsp g p
● Began on-line activities November 2010
○ Launched www.codere.it, an interconnected web of online bingo in Italy, with SISAL, among the leading gaming operators in that country
○ Announced agreement with Playtech to source software applications and technology○ Announced agreement with Playtech to source software, applications and technology
● Italy launch marks first of what are expected to be a number of online initiatives which we expect to develop in Latin America and Spain, upon regulation of the activity
● Currently, Italy is the only jurisdiction in which Codere operates which has regulated on-line gaming
30
● Expect on-line activities to reinforce our leadership position in the off-line market

Key investment highlights
Compelling growth story in Latin America
• Strong track record of organic and non organic growth• Low gaming penetration in a context of high GDP growth rates in Latin America• Well positioned for legalization of gaming halls in Brazil and launch of on-line
• #1 gaming operator in the Province of Buenos Aires, in Mexico and casino operator in Panama
yand Italy activities in Latin America
• Competitive advantage in nascent VLT market in Italy
in Panama• Leading market position in Italy (#1 in bingo) and Spain (#2 in AWP machines)• Market share of c. 50% in Argentina and in c. 41% Mexico, the two largest markets• Entrenched operator with key local relationships and licenses in a highly regulated
market
Leading position in all markets
market• First mover advantage in most markets
Strong management• Experienced management team and Board with unique knowledge of the business• Proven track record navigating market cyclesStrong management
team and operations g g y
• Unrivaled local market expertise• Six years reporting as a public company
• Limited near-term maturitiesStrong balance sheet and cash flow profile
ed ea e a u es• Cash generative business• Low maintenance capex• Flexible investment program
Unique international gaming footprint with exceptional growth potential31

Supplementary materials- FY 2010 and Q2 2011 results and updated guidance
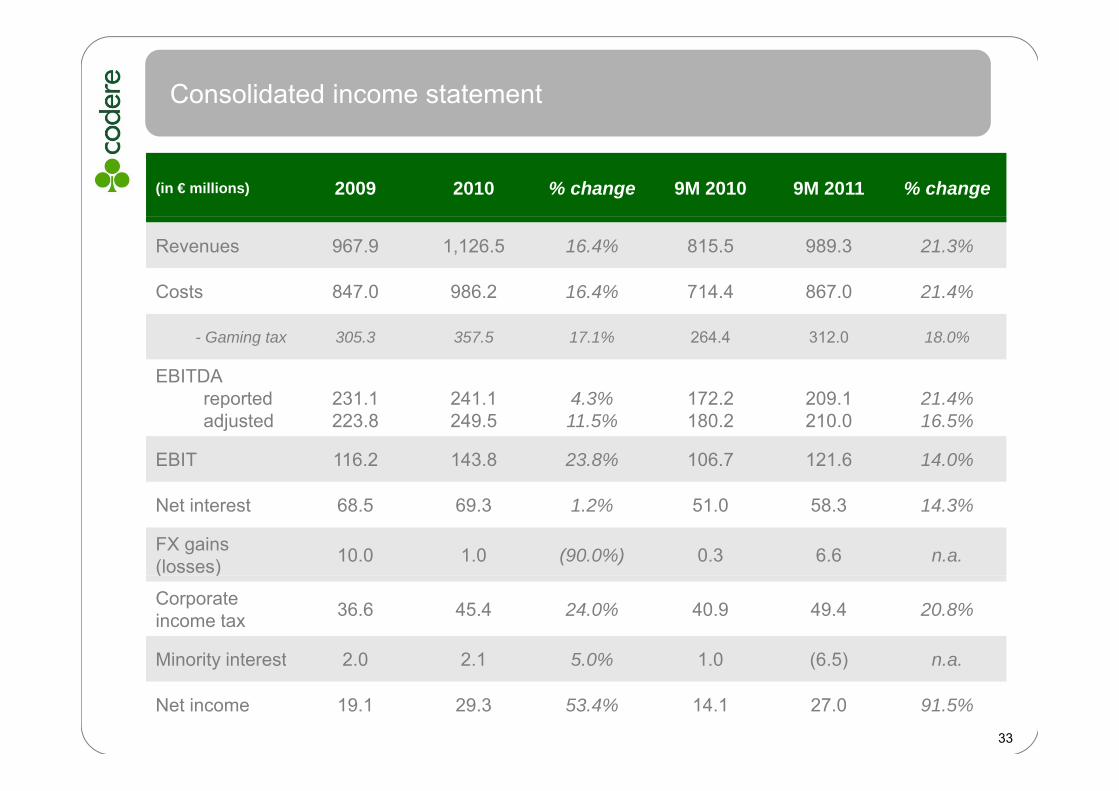
Consolidated income statement
(in € millions) 2009 2010 % change 9M 2010 9M 2011 % change
Revenues 967.9 1,126.5 16.4% 815.5 989.3 21.3%
Costs 847.0 986.2 16.4% 714.4 867.0 21.4%
- Gaming tax 305.3 357.5 17.1% 264.4 312.0 18.0%
EBITDA reported 231 1 241 1 4 3% 172 2 209 1 21 4%reportedadjusted
231.1223.8
241.1249.5
4.3%11.5%
172.2180.2
209.1210.0
21.4%16.5%
EBIT 116.2 143.8 23.8% 106.7 121.6 14.0%
Net interest 68.5 69.3 1.2% 51.0 58.3 14.3%
FX gains (losses) 10.0 1.0 (90.0%) 0.3 6.6 n.a.( )
Corporateincome tax 36.6 45.4 24.0% 40.9 49.4 20.8%
Minority interest 2.0 2.1 5.0% 1.0 (6.5) n.a.Minority interest 2.0 2.1 5.0% 1.0 (6.5) n.a.
Net income 19.1 29.3 53.4% 14.1 27.0 91.5%
33

Focus on cash flow generation
2009 Q3 20102010 Q3 2011
EBITDA
Net interest
231
68 69
241 62
18
74
19Net interest
Income tax
Operating CF
37
126 126
45
30
14
38
17
M capex
Discretionary CF
63
63 80
46
12
18
22
16
G capex
Free CF 39
23 95
(15)
42
(30)
11
12
Strong cash flow growth driven by tight discipline on capital expenditure
34
Strong cash flow growth driven by tight discipline on capital expenditure

Debt breakdown
Effective interest rate Final Maturity € million Currency
As of September 30, 2011
(1)HQ (Bond) 8,25% 2015 765,2 EURHQ (RCF) Euribor + 4,50% 2013 20,3 EURSpain 3,96% 2012 - 2025 2,3 EURMexico TIIE + 3,50% 2014 17,2 MXNMexico- Icela TIIE + 2,27% 2015 26,9 MXNMexico Icela TIIE + 5 00% 2011 5 4 MXN
(1)
Mexico- Icela TIIE + 5,00% 2011 5,4 MXNItaly 4,10% 2012 - 2014 15,5 EUR
PanamaLíbor 3M + 3,50%
(Floor 6,75%) 2016 15,9 USD
Sub - Total 868,6Sub Total 868,6
Uruguay (HRU) 4,79% 2011 10,3 UYU / UI
Total 878,9
Distribution of debt by currency3% Othercurrencies6% Mx$
(1) Includes €18.3 MM of interest
91% euros
currencies
Euros Mx$ Other currencies 35
9 % eu os

Debt structure and headroom
11.713.2 88.833.532.323.0
(141.3)
(€ in millions, at September 30, 2011)
878.9Senior Debt
(141.3)
737.3790.1765.2
Bonds (1) Pari Passu @ subs.
Unrestricted RCF (2) ICELA (49%)
Senior @ subs.
GrossDebt
Cash & equivalents
Net Debt( ) Debt
Headroom under senior● Maximum Senior under HY:€200MM● (-) Senior balance:
Debt TermsBank financing:● New Senior Facility Agreements renewed June 15, 2010
Key bond covenants● 3.0x FCCR incurrence test
○ RCF (2) (€23 MM)○ ICELA (100%) (€66MM)○ Senior @ subs (€33MM)○ Other debt (3) (€19 MM)
(€141MM)
○ €120MM multicurrency revolving credit facility • €60MM cash and LC at Euribor (or Libor) + 4.5%• €40MM LC at 4.5%• €40MM Surety bonds between 1.3% - 4%
○ Key covenants:
● €200m senior debt limit
Between both, not more than €60 millions
36
(€141MM)● Senior Headroom: €59MM(1) Includes €18.3MM of interest(2) Gross amount excludes €2.7 MM in expenses(3) Includes non-financial debt
y• Net financial debt / EBITDA <4.25x• Net senior debt / EBITDA <1.5x• EBITDA / Net interest >2.5x
○ Arranged by CS, Barclays, BBVA and HCC

Revenues and EBITDA evolution
(US$ in millions) 2006 2007 2008 2009 2010 2006 2007 2008 2009 2010Argentina 298 410 518 491 610 106 135 162 154 180
EBITDARevenues
Mexico 125 199 341 269 290 54 79 101 84 84Panama 43 60 67 67 82 9 16 14 14 5Colombia 39 47 39 32 36 7 (0) 9 7 7Uruguay 25 29 19 21 22 3 4 5 5 4Brazil 0 2 3 3 4 (5) (8) (3) (0) (3)( ) ( ) ( ) ( ) ( )HQ & Other 4 ‐ ‐ ‐ ‐ (20) (25) (38) (16) (26)Latam operating revenues 534 747 988 883 1,046 154 201 249 248 252Spain 261 311 346 283 263 74 98 90 58 59Italy 107 148 208 182 182 7 (15) 18 21 19HQ adjusted 1 1 3 2 0 (8) (9) (14) (5) (14)
(1)
(2)(1)
(€ in millions) 2006 2007 2008 2009 2010 2006 2007 2008 2009 2010Argentina 242 299 352 352 461 86 98 110 110 136
HQ adjusted 1 1 3 2 0 (8) (9) (14) (5) (14)Total Codere 902 1,207 1,544 1,350 1,492 226 275 343 322 316
Avg FX Rates 1.23 1.37 1.47 1.39 1.32 1.23 1.37 1.47 1.39 1.32
Argentina 242 299 352 352 461 86 98 110 110 136Mexico 101 145 232 193 219 43 58 69 60 64Panama 35 44 45 48 62 8 12 10 10 4Colombia 31 34 27 23 27 6 (0) 6 5 5Uruguay 20 21 13 15 17 3 3 3 4 3Brazil 0 2 2 2 3 (4) (6) (2) (0) (2)HQ & Other 3 ‐ ‐ ‐ ‐ (16) (18) (26) (12) (20)Latam operating revenues 433 545 672 633 790 125 146 169 178 190Spain 211 226 235 203 199 60 71 61 42 44Italy 87 108 141 131 137 5 (11) 12 15 14
(1)
y ( )HQ adjusted 1 1 2 1 0 (7) (7) (10) (3) (8)Total Codere 732 880 1,050 968 1,127 184 200 233 231 241
37(1) Split according to regional contrbution(2) Includes the internet business for 2009 and 2010
(2)(1)

Supplementary materialsSupplementary materials- Other

Shareholder structure
Masampe PIK loan
At September 30, 2011
OTHER BOARD Term Description
Issue amount €340.0 million
Issue date June 2007
Use of proceeds Purchase shares of Codere S.A.BOARD
OTHER BOARD MEMBERS 0.6% JAMS
12.4%
JMS 2 5%
17.1%
p
Amount held by MS 10% of the nominal (not cancelled)
Bloomberg code XS0305817842 Corp
Maturity 15 December 2015 (6 month outside existing HY)
FREE FLOAT30.2%
BOARD MEMBERS
17.8%
2.5%
EMS2.2%
EMS 2.2%
Maturity 15 December 2015 (6 month outside existing HY)
Interest 3 months EURIBOR + 750 bps.
Par call window From June 2008 to December 2009
Covenant Net debt to EBITDA < 6.5xMASAMPE HOLDING* MS FAMILY
MS FAMILY68 5% Mandatory
PrepaymentIf Masampe fails to own at least 50.1% of the issued and outstanding shares of Codere S.A.
Principal amount outstanding as
of September 30, €519.6 million
HOLDING*51.3%
MANAGEMENT
MS FAMILY68.5%
68.5%
20110.7%MANAGEMENT 0.7%
* Masampe Holding Partners: JAMS, LJMS y EMS
Total Shares Outstanding: 55,036,470
39

Argentine licenses
(1) (2)(2)(3)
(2) (2)(1)
% consol. Sales 10 % Argentine sales 10 % consol. EBITDA 10 % Argentine EBITDA 10Ar$ EURO AR$ EURO 1.136,9 467,4 251,5 142,1
1 Mar Sep-06 Mar-07 Jun-21 14,3 2,5 33,4 5,9 0,9% 2,3% 0,9% 1,6%2 Lomas de Zamora Jul-06 Jun-07 Jun-21 16,6 2,9 38,6 6,8 2,6% 6,3% 3,6% 6,3%3 Sol Jun-06 Mar-07 Jun-21 15,6 2,8 36,9 6,5 1,9% 4,7% 2,6% 4,7%
Original expiration
Renovation date
Renewal through
Hall Up-front fee (MM) Canon tax surcharge (MM)(1) (1) (2) (2) (2) (2)
3 Sol Jun 06 Mar 07 Jun 21 15,6 2,8 36,9 6,5 1,9% 4,7% 2,6% 4,7%4 Peatonal Jun-06 May-07 Jun-21 5,7 1,0 13,4 2,4 0,5% 1,3% 0,8% 1,4%5 Lanus Apr-07 Apr-07 Jun-21 38,2 6,8 89 15,7 4,9% 12,0% 7,3% 12,9%6 Platense Jun-07 Oct-09 Jun-21 28,4 5,0 137,7 24,3 4,9% 11,9% 6,8% 12,0%7 San Martín Oct-09 jun-10 jun-21 55,5 9,8 72,3 12,8 5,6% 13,7% 10,1% 17,9%8 Puerto Jan-09 jul-10 jun-21 5,5 1,0 7,2 1,3 0,4% 1,0% 0,8% 1,4%9 M ó J 13 4 2% 10 3% 7 7% 13 6%9 Morón Jun-13 4,2% 10,3% 7,7% 13,6%
10 Ramos Mejía Apr-14 2,1% 5,0% 3,2% 5,6%11 San Miguel May-14 3,5% 8,4% 6,2% 11,0%12 Lomas del Mirador Sep-14 5,1% 12,4% 9,9% 17,6%13 San Justo Oct-14 4,0% 9,7% 7,4% 13,2%14 Temperley Aug-16 0,4% 1,0% 0,6% 1,0%
Central -11,3% -20,1%
TOTAL 41,1% 100,0% 56,5% 100,0%
Renewal fee Canon Surcharge (3) EBITDA 10Ar$ Renewal fee Canon surcharge Total Surcharge canon % EBITDA 10Ar$
Total Charges / EBITDA Yearly
(1) Based on the Eur/Ar$ exchange at September 30 2011
Platense 28,4 137,7 166,1 87,9 0,3x 1,6x 1,9x 27,54 31,3%Puerto 5,5 7,2 12,7 10,0 0,6x 0,7x 1,3x 1,44 14,4%
San Martin 55,5 72,3 127,8 131,5 0,4x 0,5x 1,0x 14,46 11,0%
(2) Exclude the gains or losses on the foreign exchange contracts.
(1) Based on the Eur/Ar$ exchange at September 30, 2011
(3) Payable monthly over 5 years
40

Smoking bans overview
ScopeEffective
DateRegulation for gaming venues
General regulation
Italy National Jan 2005 50%* of total surface Total ban No clear effectsItaly National Jan. 2005 50% of total surface Total ban
Spain National Jan. 2011 Total ban (3) Same as gaming
No clear effects identified
Daily win reductionUruguay National March 2006 Total ban Same as gaming
MexicoD.F. April 3, 2008 Total ban
Same as gamingMaximum of 33%* of total
Daily win reduction of up to 15%.
Recovery in 9 to 12 months
Daily win reduction of up to 20% Recovery
National July 1, 2009 (1) Maximum of 33% of total surface (TBD by state)
Panama National April 25, 2008 Total ban Same as gaming
Distrito Mar Total ban (3)
Daily win reduction of up to 15%. Recovery
in 6 months
up to 20%. Recovery in 12 months
Argentina (Prov Bs.As.)
Distrito Mar del Plata April 25, 2011
Total ban (3)Same as gaming
National June 1, 2011 Pending regulation on Prov. Bs As (2) Total ban
Colombia National Dec. 4, 2008 Total ban Same as gaming
There is a world trend to regulate smoking in public places. Codere’s experience suggests a
Daily win reduction around 10%.
Recovery in 9 months
41
There is a world trend to regulate smoking in public places. Codere s experience suggests a moderate negative impact in revenues but with a recovery in the medium term
* Percentage of space allowed for smokers(1) Effective date of the Federal regulation that develops the Federal Act (2) Since April 2009 there is a total ban in the Prov. Bs As with exception of gaming halls(3) In 2006 and 2007 in Spain and Mar del Plata, respectively there was a partial ban implemented

Comparative gaming taxes
Machine Gaming Taxes(As percentage of Net Win)
Comments
24% 48%Spain
(As percentage of Net Win)●Fixed gaming tax per machine, “tasa”, that differs by
Comunidad Autónoma. In 2010, the average annual tax per machine was circa €3,600. The stated percentage was determined considering Codere’s actual average net win levels M f 12 6% + 0 8% (i l di PREU + C )
Over Codere’sshare of Net Box
54%
36%
Italy
Argentina
●Max. of 12.6% + 0.8% (including PREU + Canon) over amounts wagered (“coin-in”). The stated percentage was determined based on the current pay out ratio (75%)
● Includes payments to Non Profit Organizations (2% of net win, on average, in 2010). Canon tax surcharge of renewed halls %
30%
g
Mexico
g , ) gsuppose, on average, an extra 7% to 12% of total net win for these halls
●Federal tax of 30% over net win from January 2010. Reimbursement of SEGOB and state taxes at 100%.
12.5%Panama●Fixed percentage over slot machines net win. Increased
January 2010. Slots in racetrack remain 10% of net win.
●Depending on the installed portfolio. After the tax reform (Feb. 2010) gaming taxes are calculated as a % of the net win.
17%
60%
Colombia
Uruguay
2010) gaming taxes are calculated as a % of the net win.
●Percentage of net win that the “Dirección General de Casinos” (DGC) withholds to Codere for the operation of the halls. No further gaming taxes exist
42
g y
Simpleaverage 33%

Management of foreign exchange exposure
Risk SourceForeign Exchange Risk Coverage
Practice
● Foreign exchange risk is principally related to the potential negative impact in the consolidated financial statements (denominated in euros) of non euro currencies devaluations against the euro
● Contract foreign exchange forwards on a rolling forward four-quarter basis for approximately 50% of projected Argentina and Mexico EBITDA
● The Argentine Peso (Ar$) and the Mexican Peso (Mx$) are the most relevant sources of foreign exchange risk as operations in those countries generated the 53% and 19% of the EBITDA(1) for 9M
● Make financial projections based on forwards rates available on the market
Forwards contracted as of November 15, 20112011, respectively
Risk Mitigation By Natural Coverage
● In addition to forward contracts, natural coverage l l t l i f i h i k
(in millions)
€/Mx$ US$/Mx$ €/US$
- - 21.2
Quarter €/Ar$ US$/Ar$
4Q11 - 28.0
1Q12 28 0plays a relevant role in foreign exchange risk mitigation as most significant operating cost (typically gaming taxes and personnel expenses) are denominated in local currency
21.2--
---
- - -
- - -
116.0-Total
30.0-2Q12
3Q12 - 30.0
1Q12 - 28.0
43(1) EBITDA pre Headquarters' costs
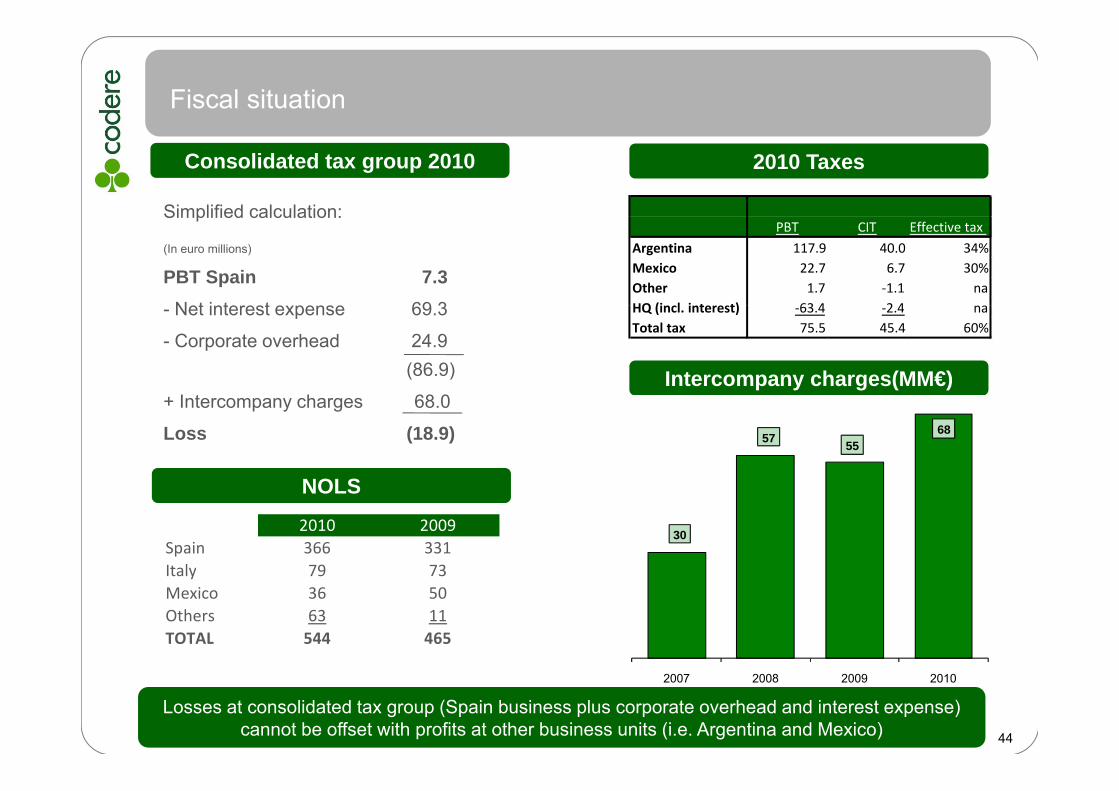
Fiscal situation
2010 TaxesConsolidated tax group 2010
Simplified calculation:PBT CIT Effective tax
Argentina 117.9 40.0 34%Mexico 22.7 6.7 30%Other 1.7 ‐1.1 naHQ (incl interest) 63 4 2 4 na
Simplified calculation:
(In euro millions)
PBT Spain 7.3Net interest expense 69 3
Intercompany charges(MM€)
HQ (incl. interest) ‐63.4 ‐2.4 naTotal tax 75.5 45.4 60%
- Net interest expense 69.3
- Corporate overhead 24.9(86.9)
I t h 68 0+ Intercompany charges 68.0
Loss (18.9)
NOLS
57 5568
NOLS
302010 2009
Spain 366 331Italy 79 73Italy 79 73Mexico 36 50Others 63 11TOTAL 544 465
44
Losses at consolidated tax group (Spain business plus corporate overhead and interest expense) cannot be offset with profits at other business units (i.e. Argentina and Mexico)
2007 2008 2009 2010

Strategic initiatives
#1 Match currency of debt to cash flows
- Refinance portion of euro bond with us dollar bond (portable to Latam)Refinance portion of euro bond with us dollar bond (portable to Latam)
- Finance acquisition of ICELA stake in US dollars or Mexican pesos
#2 Explore opportunities to crystallize value of the businessp pp y- IPO of minority stake in Latam business (listing in US markets)
• Position company relative to US gaming companies and Latin American comps trading at higher multiples than European gaming comps
• Use proceeds to repay remaining eurobond at HQ = reduction in effective tax rate
45

Selected economic indicators
Real GDP% CPI
2010 2011E 2012E 2010 2011E 2012E
Argentina 9.2 7.1 3.1 21.5 23.5 26.1
Mexico 5.4 3.7 3.2 4.4 3.3 3.6
Italy 1.2 0.6 (1.0) 1.5 2.8 2.1
Spain (0.1) 0.7 (1.0) 1.8 3.3 1.5
Latam 6.3 4.4 3.5 6.8 6.6 6.2
Source: Morgan Stanley, except Argentine CPI (Barclays)
Average exchange ratesAverage exchange rates
2007 2008 2009 2010 07/08 08/09 09/10
EUR/Ar$ 4.28 4.63 5.22 5.19 8.2% 12.8% (0.6%)
EUR/Mx$ 14.99 16.32 18.83 16.74 8.9% 15.3% (11.1%)
EUR/US$ 1 37 1 47 1 39 1 32 7 3% (5 2%) (5 0%)
46
EUR/US$ 1.37 1.47 1.39 1.32 7.3% (5.2%) (5.0%)
Source: Central Banks

Long term contracts
9
3
Italy VLTs & network
Italy AWP machines
12
10
10
Italy bingos
Spain AWP machines
Spain Sports betting
25
20
15
Mexican halls and racetrack
Panamá casinos & racetrack
Argentine halls
30
25
0 5 10 15 20 25 30 35
Uruguay racetrack and casino
Mexican halls and racetrack
Years (1)
1- Indicates number of years at inception and the maximum term of the contracts where they vary
Di ifi d tf li f l t t t
47
Diversified portfolio of long term contracts

Caliente Agreement
Rationale● Achieves strategic objective of owning all licenses
AgreementAcquisition by Codere of majority stake in three ● Achieves strategic objective of owning all licenses
which the Company operates in Mexico
● Consolidates market leadership position in Mexico
Acquisition by Codere of majority stake in three
Caliente licensees which hold an aggregate of 46
permits (32 halls in operation at July 2010) throughout
Mexico (‘Joint OpCos’)
● Gives Codere full control of the day-to-day operations of the business
( p )
Phase 1 –Effective July 2010
● Mgmt Services Agreement between Codere and
● Simplifies and streamlines relationship with Caliente
Joint OpCos: $36m annually through 2014, plus $1m monthly from July 1, 2010 through December 31st 2010 or Cofeco approval
● Management Services Agreement between
● Significantly reduces obligations from Caliente
● Increases weight of Mexican operations, with
g gCodere and Promojuegos and Mio: $8m annually through 2014
● Codere loan to Joint OpCos (“Caliente RCF”)
Ph 2 Eff i C f l potential efficiencies for Codere, including possibility to transfer debt to subsidiaries
● Adds €19 7m to pro forma 2009 EBITDA
Phase 2- Effective upon Cofeco approval
(approved in May 2011)
● Codere acquires 67.3% of Joint OpCos (Caliente will hold remaining 32.7%)
48
● Adds €19.7m to pro forma 2009 EBITDAwill hold remaining 32.7%)
● Caliente acquires 32.7% share in Promojuegosand Mio for $5.1m ( 32.7% of $15.5m)

Supplementary materialsSupplementary materials- Resistance of business
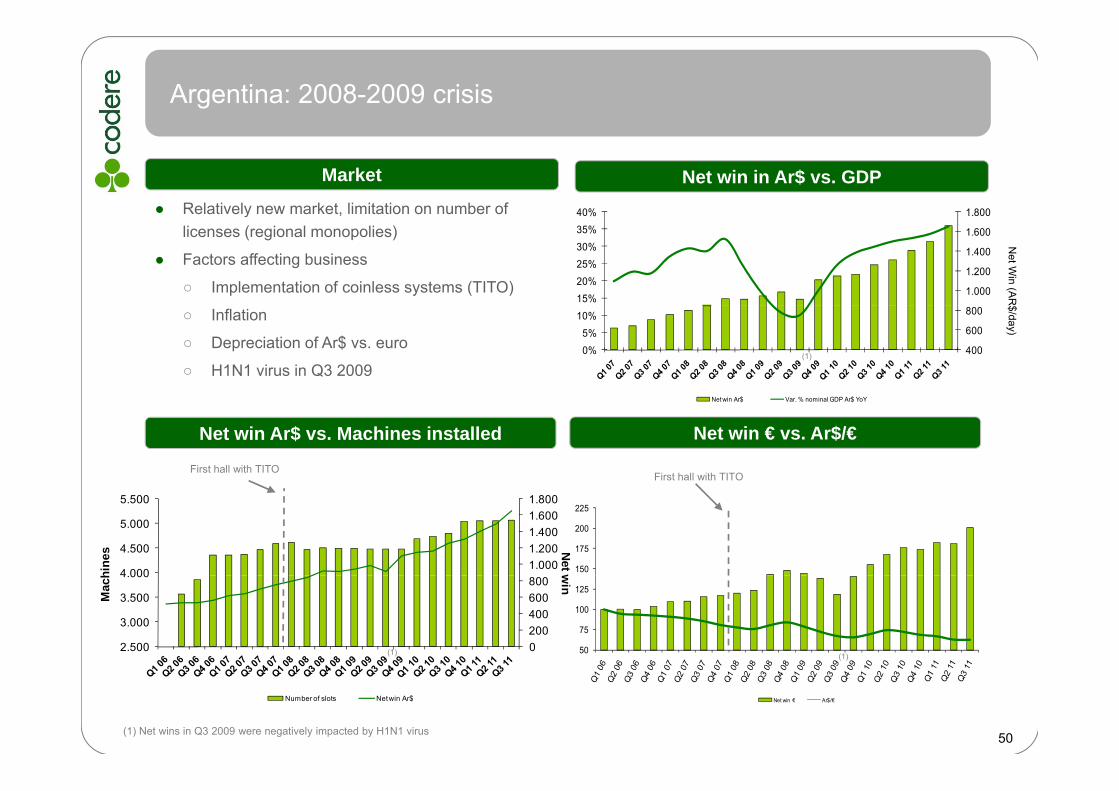
Argentina: 2008-2009 crisis
40% 1.800
Market
● Relatively new market, limitation on number of
Net win in Ar$ vs. GDP
15%20%25%30%35%
%
1.000
1.200
1.400
1.600
y ,licenses (regional monopolies)
● Factors affecting business
○ Implementation of coinless systems (TITO)
Net W
in(A
R
0%5%
10%
400
600
800○ Inflation
○ Depreciation of Ar$ vs. euro
○ H1N1 virus in Q3 2009(1)
$/day)
Net win Ar$ Var. % nominal GDP Ar$ YoY
Net win Ar$ vs. Machines installed Net win € vs. Ar$/€
First hall with TITOFirst hall with TITO
4 000
4.500
5.000
5.500
1.0001.2001.4001.6001.800
hine
s Net w 150
175
200
225
2.500
3.000
3.500
4.000
0200400600800
Mac
h win
50
75
100
125
(1) (1)
Number of slots Net win Ar$ Net win € Ar$/€
50(1) Net wins in Q3 2009 were negatively impacted by H1N1 virus

Argentina 2001-2002 Devaluation and “Corralito”
● December 31, 2001 Argentine government eliminated Peso peg to US$
Net Win per Day in US$
● Peso devalued 67% versus US$ in 2001-2002
● By August 2003 net win per machine was back to July 2001 levels in real terms
● 2002 EBITDA decreased 25% in euro terms following4 0
6 0
8 0
10 0
12 0
14 0
AR$
/ US$
de
valu
atio
n
2002 EBITDA decreased 25% in euro terms following the devaluation of the Peso
● Strong profitability maintained throughout economic crisis
0
2 0
4 0
Dec-
01
Jan-
02
Feb-
02
Mar
-02
Apr-
02
May
-02
Jun-
02
Jul-
02
Aug-
02
Sep-
02
Oct-
02
Nov-
02
Dec-
02
Jan-
03
Feb-
03
Mar
-03
Apr-
03
May
-03
Jun-
03
Jul-
03
Aug-
03
Net Win per Day (constant July 2001 pesos) EBITDA
220
6 6 222
228 54.0
(Ar$m / US$m / EURm)Devaluation
$2
$167
$150 $1
58
$161
$144
$178
$175
$200
$172
$172
$175 $181
$185
$154 $1
75
$180
$178 $1
97
$189 $2
06
$192 $2
06
$202 $2 $
32.032.0
18.115 7
Jul-0
1
ug-0
1
ep-0
1
Oct
-01
ov-0
1
ec-0
1
an-0
2
eb-0
2
Mar
-02
Apr-
02
ay-0
2
un-0
2
Jul-0
2
ug-0
2
ep-0
2
Oct
-02
ov-0
2
ec-0
2
an-0
3
eb-0
3
Mar
-03
Apr-
03
ay-0
3
un-0
3
Jul-0
3
ug-0
3
14.010.810.2
14.0 14.8
9.611.8
15.7
2001 2002 2003 2004
51
J A S O No
D J F M A M J J A S O No
D J F M A M J J A
-4.5% -10.9% +8.7%
GD
P
+9.0%

Net wins in US$ in Argentina have not been correlated withdevaluation of AR$
Codere net wins (US$) vs. AR$/US$ devaluation since 2006
200
250Var. % 06-11
+135.8%
100
150
50
100Var. % 06-11
(26.3%)
STRICTLY CONFIDENTIAL
0
Q1 06
Q2 06
Q3 06
Q4 06
Q1 07
Q2 07
Q3 07
Q4 07
Q1 08
Q2 08
Q3 08
Q4 08
Q1 09
Q2 09
Q3 09
Q4 09
Q1 10
Q2 10
Q3 10
Q4 10
Q1 11
Q2 11
Q3 11
Net win in Usd UsdArs FxNet win in Usd UsdArs Fx

Mexico: 2008-2009 crisis
16% 1.100
Market
● Newly regulated market (machines allowed 2005)
Net win in Mx$ vs. GDP
4%
8%
12%
800
900
1.000
y g ( )
● Factors affecting business
○ Aggressive machine deployment
○ Competition from illegal players
Net W
in(M
X
-8%
-4%
0%
500
600
700○ Smoking bans (D.F. 2008 and national 2009)
○ Depreciation of Mx$ vs. euro
○ H1N1 virus Q2 2009 (1)(2)
X$/day)
Net win MxP Var. % nominal GDP MxN YoY
Net win Mx$ vs. machines installed Net win € vs. Mx$/€Smoking bansSmoking bans
75
100
125
16.000
20.000
24.000
800
1.000
1.200
hine
s
Net w
in (
Smoking bansS o g ba s
0
25
50
4.000
8.000
12.000
400
600
800
# of
Mac
(MX
$/day)
(1)(1)
(2)(2)
53
Net win in € Mx$/€
# of machines Net win Mx$
(1) Net wins in Q2 2009 were negatively impacted by H1N1 virus
(2) As a result of the Caliente transaction signed on July 16, 2010 data shown for the Caliente part of our Mexican operations corresponds only to the halls included in these new agreements .
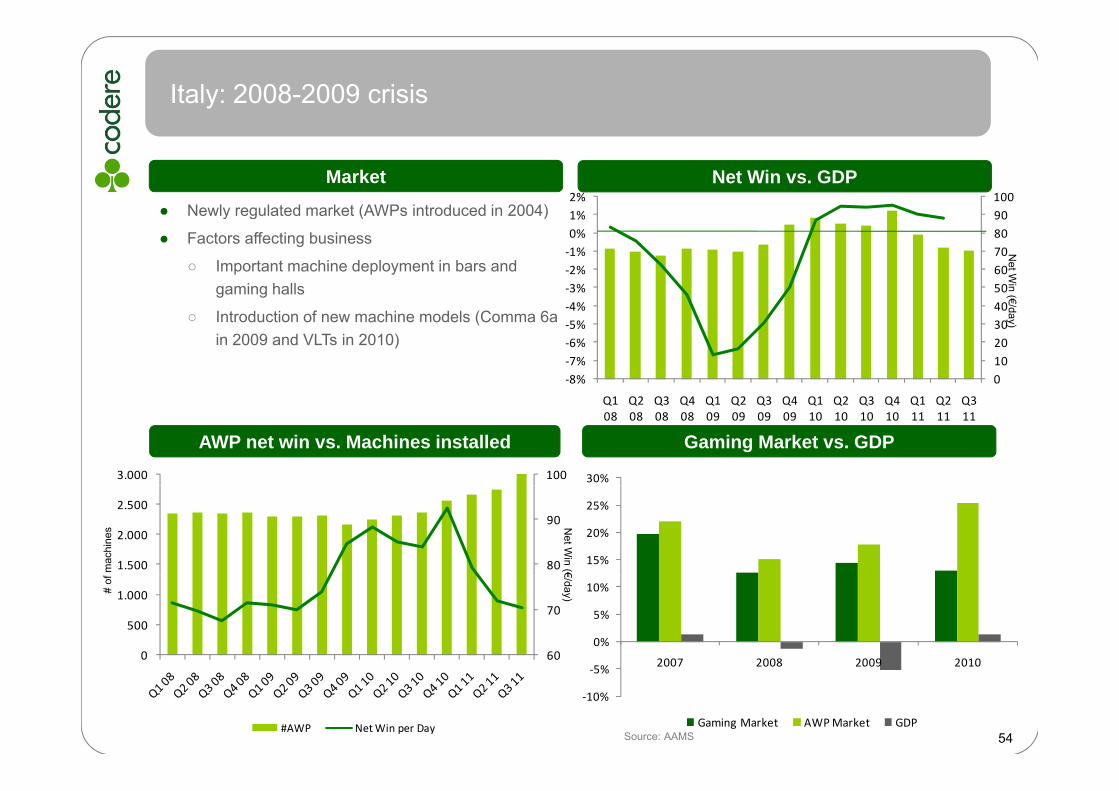
Italy: 2008-2009 crisis
1%2%
90100
Net Win vs. GDPMarket
● Newly regulated market (AWPs introduced in 2004)
4%‐3%‐2%‐1%0%1%
405060708090y g ( )
● Factors affecting business
○ Important machine deployment in bars and gaming halls
Net W
in(€/
‐8%‐7%‐6%‐5%‐4%
010203040
○ Introduction of new machine models (Comma 6a in 2009 and VLTs in 2010)
/day)
1003.000
Q1 08
Q2 08
Q3 08
Q4 08
Q1 09
Q2 09
Q3 09
Q4 09
Q1 10
Q2 10
Q3 10
Q4 10
Q1 11
Q2 11
Q3 11
Net Win Italy AWPs Var. % nominal GDP YoY
30%
AWP net win vs. Machines installed Gaming Market vs. GDP
80
90
1.500
2.000
2.500
15%
20%
25%
Net W
in(€m
achi
nes
60
70
0
500
1.000
0%
5%
10%
2007 2008 2009 2010
€/day)# of
#AWP Net Win per Day
‐10%
‐5% 2007 2008 2009 2010
Gaming Market AWP Market GDP54Source: AAMS

Spain: 2008-2011 crisis
6210%
Net win vs. GDPMarket
● Mature, highly fragmented AWP market Smoking ban
38
42
46
50
54
58
(4%)(2%)
-2%4%6%8%
(€/ day)
, g y g
● Factors affecting business
○ Significant macroeconomic downturn
○ Absence of regulatory changes
34
38
(6%)(4%)
Net win Spain AWP Var. % nominal GDP YoY
○ Lack of technological innovation
○ Smoking ban January 2, 2011
100130
Spain AWP vs Spanish Small - Mid Caps Spain AWP net win vs. Spanish indicators
Revenues in Spain
60
80
100
20
40
Q2 Q3 Q4 Q1 Q2 Q3 Q4 Q1 Q2 Q3 Q4 Q1 Q2 Q3 Q4 Q1 Q2 Q3 40
70
55
07 07 07 08 08 08 08 09 09 09 09 10 10 10 10 11 11 11Q1 07
Q2 07
Q3 07
Q4 07
Q1 08
Q2 08
Q3 08
Q4 08
Q1 09
Q2 09
Q3 09
Q4 09
Q1 10
Q2 10
Q3 10
Q4 10
Q1 11
Q2 11
Q3 11
CDR Spain AWP Media group Hotel sector
Beauty / Healthcare sector Media group
Spain AWP CDR Car registrations
Consumer confidence indexMortages Cement consumption

For further information, please contact:
Investor Relations Department
Tel. +34 91354 [email protected]


