24
PARKER CAREER MANAGEMENT CENTER CLASS OF 2016 FULL-TIME MBA EMPLOYMENT REPORT
PARK
ER CA
REER MA
NA
GEM
ENT C
ENTER
CLASS OF 2016 FULL-TIME MBA EMPLOYMENT REPORT

THE NEXT BUSINESS MODEL. THE NEXT WAVE OF TECHNOLOGY. HERE, WE ARE INTENTLY FOCUSED ON THE FUTURE OF BUSINESS.
CONTENTS
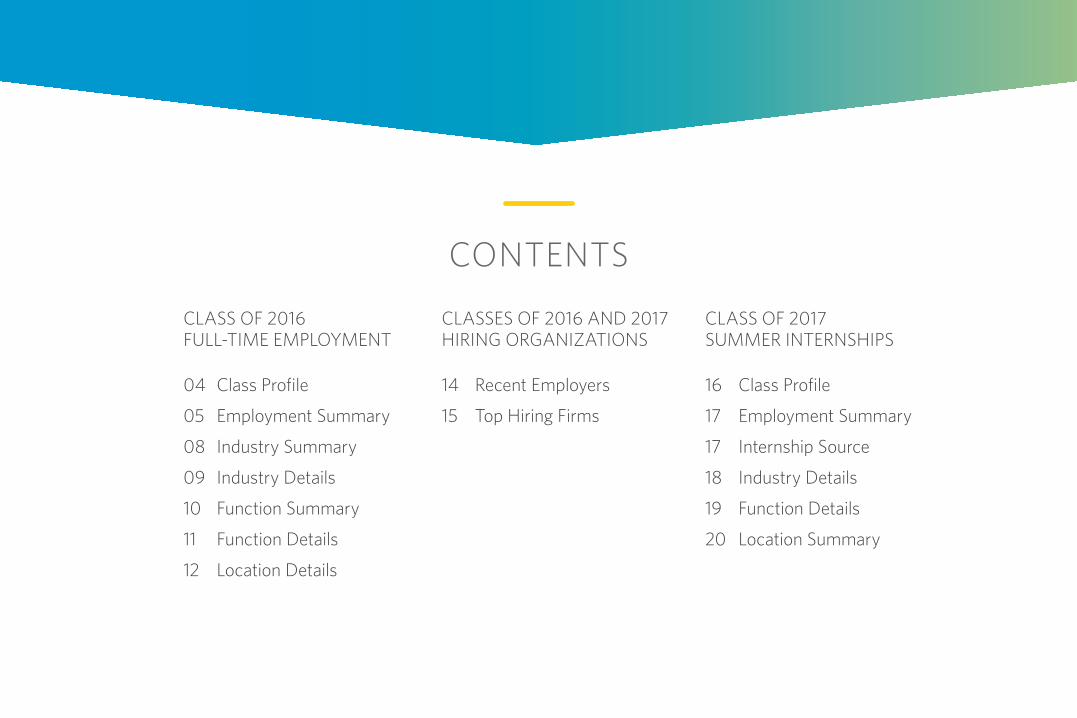
CLASS OF 2016 FULL-TIME EMPLOYMENT
04 Class Profile
05 Employment Summary
08 Industry Summary
09 Industry Details
10 Function Summary
11 Function Details
12 Location Details
CLASSES OF 2016 AND 2017 HIRING ORGANIZATIONS
14 Recent Employers
15 Top Hiring Firms
CLASS OF 2017 SUMMER INTERNSHIPS
16 Class Profile
17 Employment Summary
17 Internship Source
18 Industry Details
19 Function Details
20 Location Summary
CONTENTS
CLA
SS PRO
FILE
4
CLASS OF 2016 FULL-TIME EMPLOYMENT
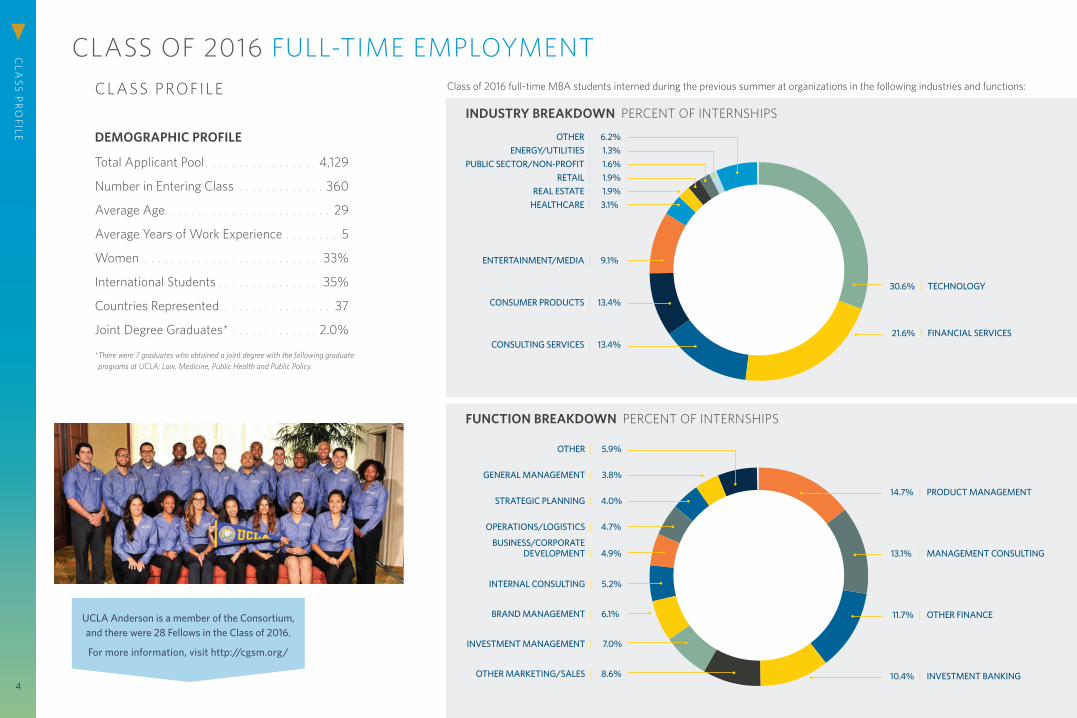
DEMOGRAPHIC PROFILE
Total Applicant Pool . . . . . . . . . . . . . . . . . 4,129
Number in Entering Class . . . . . . . . . . . . . 360
Average Age. . . . . . . . . . . . . . . . . . . . . . . . . 29
Average Years of Work Experience . . . . . . . . 5
Women . . . . . . . . . . . . . . . . . . . . . . . . . . . 33%
International Students . . . . . . . . . . . . . . . 35%
Countries Represented. . . . . . . . . . . . . . . . . 37
Joint Degree Graduates* . . . . . . . . . . . . . 2.0%
* There were 7 graduates who obtained a joint degree with the following graduate programs at UCLA: Law, Medicine, Public Health and Public Policy.
CLASS PROFILEINDUSTRY BREAKDOWN PERCENT OF INTERNSHIPS
30.6% | TECHNOLOGY
21.6% | FINANCIAL SERVICES
OTHER | 6.2% ENERGY/UTILITIES | 1.3% PUBLIC SECTOR/NON-PROFIT | 1.6% RETAIL | 1.9% REAL ESTATE | 1.9% HEALTHCARE | 3.1%
ENTERTAINMENT/MEDIA | 9.1%
CONSUMER PRODUCTS | 13.4%
CONSULTING SERVICES | 13.4%
14.7% | PRODUCT MANAGEMENT
13.1% | MANAGEMENT CONSULTING
11.7% | OTHER FINANCE
10.4% | INVESTMENT BANKING
OTHER | 5.9%
GENERAL MANAGEMENT | 3.8%
STRATEGIC PLANNING | 4.0%
OPERATIONS/LOGISTICS | 4.7%
BUSINESS/CORPORATE DEVELOPMENT | 4.9%
INTERNAL CONSULTING | 5.2%
BRAND MANAGEMENT | 6.1%
INVESTMENT MANAGEMENT | 7.0%
OTHER MARKETING/SALES | 8.6%
FUNCTION BREAKDOWN PERCENT OF INTERNSHIPS
UCLA Anderson is a member of the Consortium, and there were 28 Fellows in the Class of 2016.
For more information, visit http://cgsm.org/
Class of 2016 full-time MBA students interned during the previous summer at organizations in the following industries and functions:
5
EMPLO
YM
ENT
SUM
MA
RY
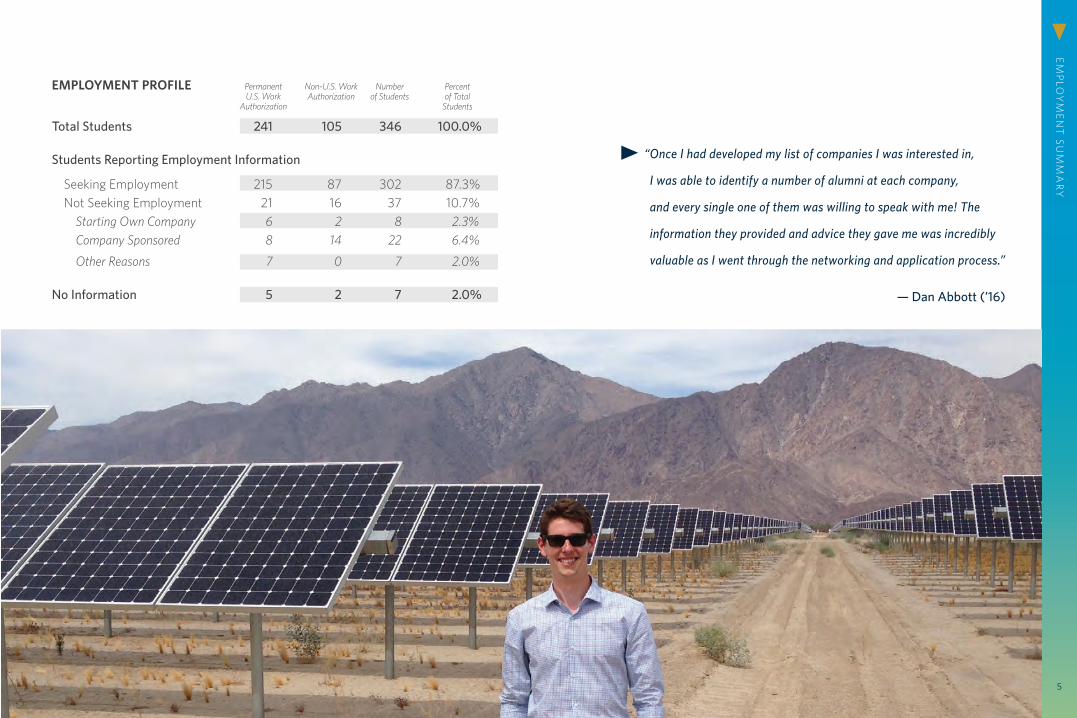
EMPLOYMENT PROFILE Permanent Non-U.S. Work Number Percent U.S. Work Authorization of Students of Total Authorization Students
Total Students 241 105 346 100.0%
Students Reporting Employment Information
Seeking Employment 215 87 302 87.3%Not Seeking Employment 21 16 37 10.7%
Starting Own Company 6 2 8 2.3%Company Sponsored 8 14 22 6.4%
Other Reasons 7 0 7 2.0%
No Information 5 2 7 2.0%
“ Once I had developed my list of companies I was interested in,
I was able to identify a number of alumni at each company,
and every single one of them was willing to speak with me! The
information they provided and advice they gave me was incredibly
valuable as I went through the networking and application process.”
— Dan Abbott (’16)
EMPLO
YM
ENT
SUM
MA
RY
6
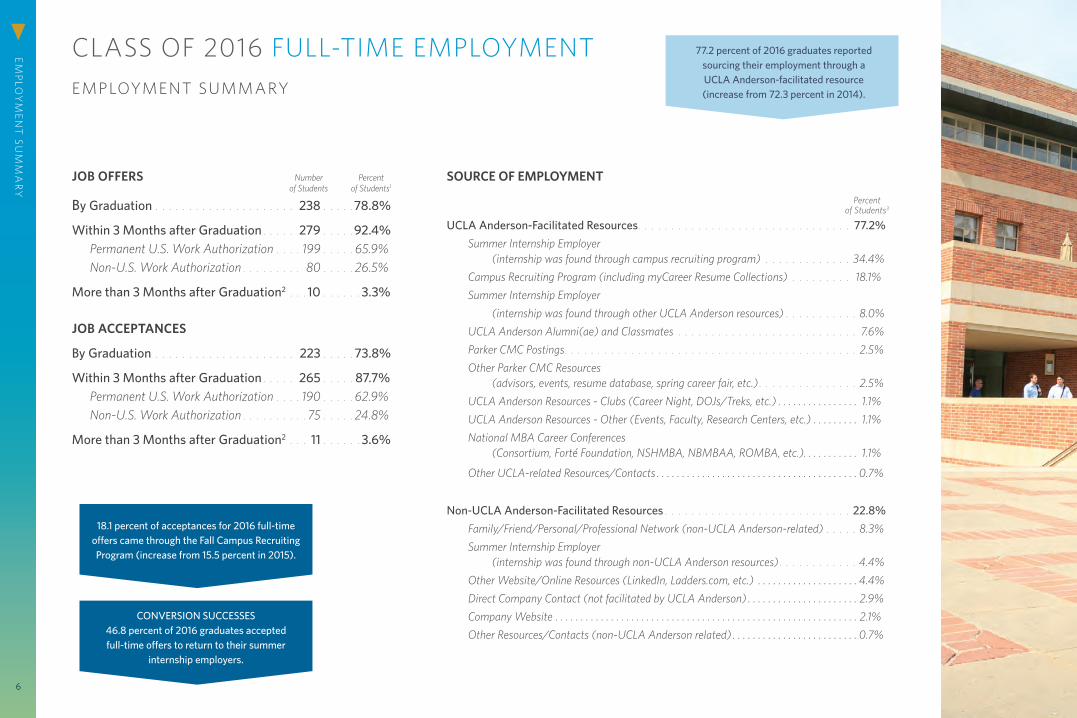
JOB OFFERS Number Percent of Students of Students1
By Graduation . . . . . . . . . . . . . . . . . . . . . 238 . . . . . 78.8%
Within 3 Months after Graduation . . . . . 279 . . . . . 92.4%Permanent U.S. Work Authorization . . . . 199 . . . . . 65.9%Non-U.S. Work Authorization . . . . . . . . . 80 . . . . . 26.5%
More than 3 Months after Graduation2 . . . 10 . . . . . . 3.3%
JOB ACCEPTANCES
By Graduation . . . . . . . . . . . . . . . . . . . . . 223 . . . . . 73.8%
Within 3 Months after Graduation . . . . . 265 . . . . . 87.7%Permanent U.S. Work Authorization . . . . 190 . . . . . 62.9%Non-U.S. Work Authorization . . . . . . . . . . 75 . . . . . 24.8%
More than 3 Months after Graduation2 . . . 11 . . . . . . 3.6%
EMPLOYMENT SUMMARY
SOURCE OF EMPLOYMENT Percent of Students3
UCLA Anderson-Facilitated Resources. . . . . . . . . . . . . . . . . . . . . . . . . . . . . . . . 77.2% Summer Internship Employer
(internship was found through campus recruiting program) . . . . . . . . . . . . . 34.4% Campus Recruiting Program (including myCareer Resume Collections) . . . . . . . . . 18.1% Summer Internship Employer (internship was found through other UCLA Anderson resources) . . . . . . . . . . . 8.0% UCLA Anderson Alumni(ae) and Classmates . . . . . . . . . . . . . . . . . . . . . . . . . . . 7.6% Parker CMC Postings. . . . . . . . . . . . . . . . . . . . . . . . . . . . . . . . . . . . . . . . . . . . 2.5% Other Parker CMC Resources
(advisors, events, resume database, spring career fair, etc.) . . . . . . . . . . . . . . . 2.5% UCLA Anderson Resources - Clubs (Career Night, DOJs/Treks, etc.) . . . . . . . . . . . . . . . . 1.1% UCLA Anderson Resources - Other (Events, Faculty, Research Centers, etc.) . . . . . . . . . 1.1% National MBA Career Conferences (Consortium, Forté Foundation, NSHMBA, NBMBAA, ROMBA, etc.). . . . . . . . . . . 1.1%
Other UCLA-related Resources/Contacts . . . . . . . . . . . . . . . . . . . . . . . . . . . . . . . . . . . . . . . . 0.7%
Non-UCLA Anderson-Facilitated Resources . . . . . . . . . . . . . . . . . . . . . . . . . . . . 22.8% Family/Friend/Personal/Professional Network (non-UCLA Anderson-related) . . . . . 8.3% Summer Internship Employer
(internship was found through non-UCLA Anderson resources) . . . . . . . . . . . . 4.4% Other Website/Online Resources (LinkedIn, Ladders.com, etc.) . . . . . . . . . . . . . . . . . . . . 4.4% Direct Company Contact (not facilitated by UCLA Anderson) . . . . . . . . . . . . . . . . . . . . . . 2.9% Company Website . . . . . . . . . . . . . . . . . . . . . . . . . . . . . . . . . . . . . . . . . . . . . . . . . . . . . . . . . . . . 2.1% Other Resources/Contacts (non-UCLA Anderson related) . . . . . . . . . . . . . . . . . . . . . . . . . 0.7%
18.1 percent of acceptances for 2016 full-time offers came through the Fall Campus Recruiting Program (increase from 15.5 percent in 2015).
CLASS OF 2016 FULL-TIME EMPLOYMENT 77.2 percent of 2016 graduates reported sourcing their employment through a UCLA Anderson-facilitated resource (increase from 72.3 percent in 2014).
CONVERSION SUCCESSES 46.8 percent of 2016 graduates accepted full-time offers to return to their summer
internship employers.
7
EMPLO
YM
ENT
SUM
MA
RY
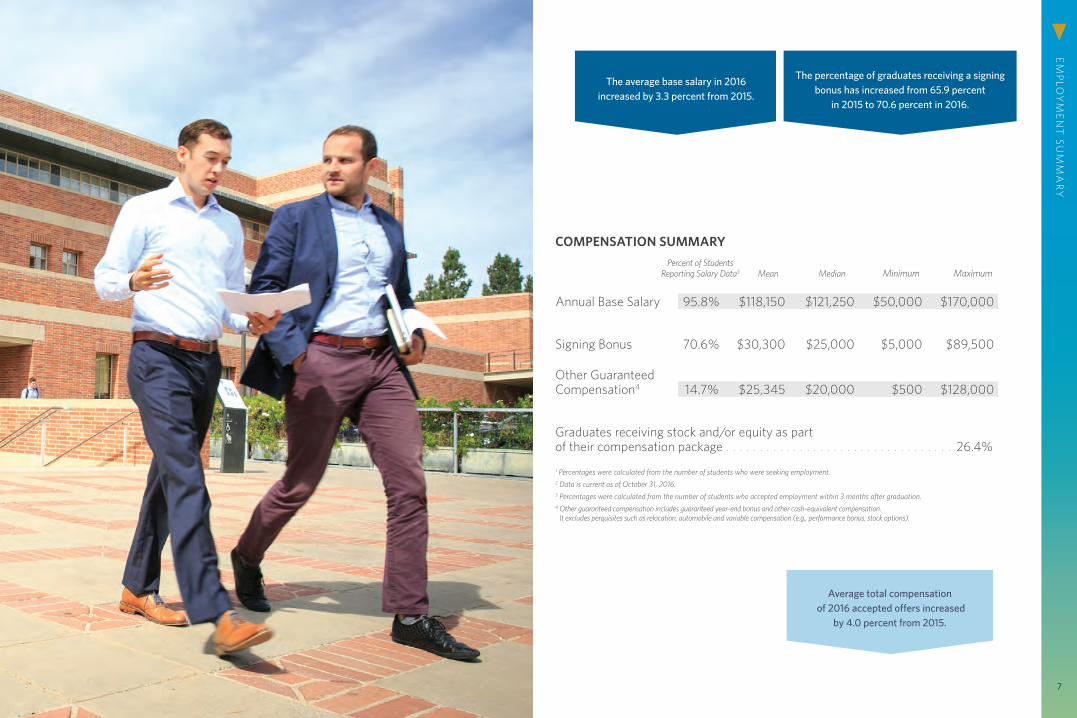
COMPENSATION SUMMARY Percent of Students Reporting Salary Data3 Mean Median Minimum Maximum
Annual Base Salary 95.8% $118,150 $121,250 $50,000 $170,000
Signing Bonus 70.6% $30,300 $25,000 $5,000 $89,500
Other Guaranteed Compensation4 14.7% $25,345 $20,000 $500 $128,000
Graduates receiving stock and/or equity as part of their compensation package . . . . . . . . . . . . . . . . . . . . . . . . . . . . . . . . . . 26.4%1 Percentages were calculated from the number of students who were seeking employment.2 Data is current as of October 31, 2016.3 Percentages were calculated from the number of students who accepted employment within 3 months after graduation.4 Other guaranteed compensation includes guaranteed year-end bonus and other cash-equivalent compensation.
It excludes perquisites such as relocation, automobile and variable compensation (e.g., performance bonus, stock options).
The percentage of graduates receiving a signing bonus has increased from 65.9 percent
in 2015 to 70.6 percent in 2016.
Average total compensation of 2016 accepted offers increased
by 4.0 percent from 2015.
The average base salary in 2016 increased by 3.3 percent from 2015.
CLASS OF 2016 FULL-TIME EMPLOYMENTINDUSTRY SUMMARY
IND
UST
RY
SUM
MA
RY
8
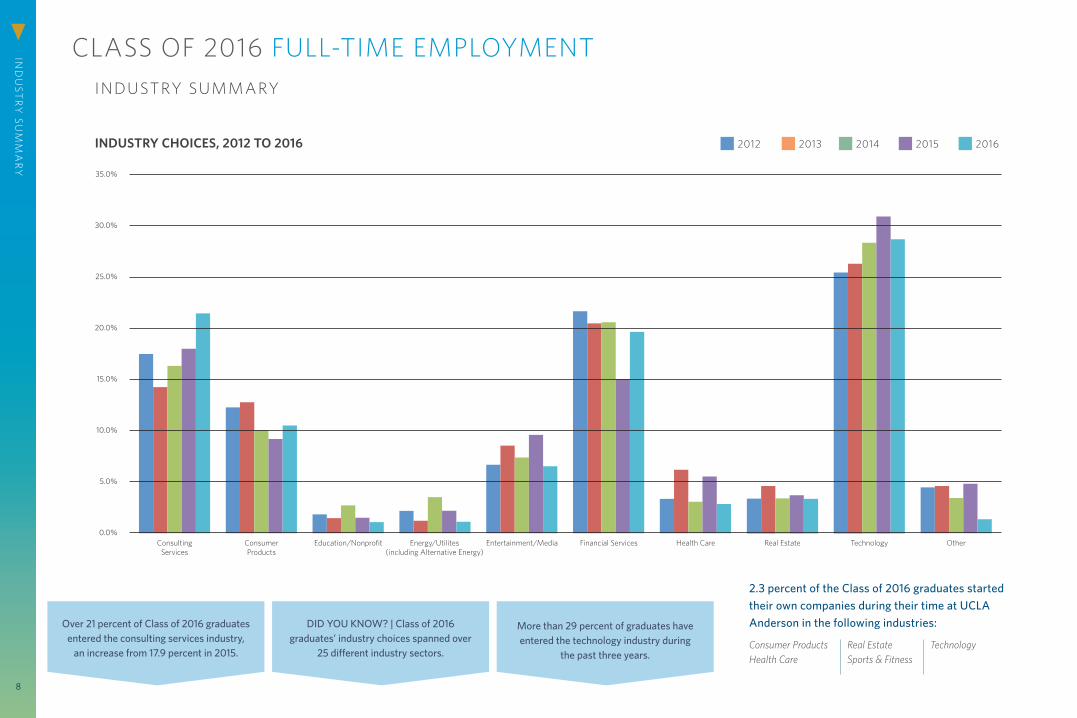
2.3 percent of the Class of 2016 graduates started their own companies during their time at UCLA Anderson in the following industries:
Consumer ProductsHealth Care
Real EstateSports & Fitness
Technology
35.0%
30.0%
25.0%
20.0%
15.0%
10.0%
5.0%
0.0%
INDUSTRY CHOICES, 2012 TO 2016
Consulting Services
Consumer Products
Education/Nonprofit Energy/Utilites (including Alternative Energy)
Entertainment/Media Financial Services Health Care OtherReal Estate Technology
2012 2011 2012 2013 2014 2015 2013 2011 2012 2013 2014 2015 2014 2011 2012 2013 2014 2015 2015 2011 2012 2013 2014 2015 2016
More than 29 percent of graduates have entered the technology industry during
the past three years.
DID YOU KNOW? | Class of 2016 graduates’ industry choices spanned over
25 different industry sectors.
Over 21 percent of Class of 2016 graduates entered the consulting services industry,
an increase from 17.9 percent in 2015.

9
IND
UST
RY
DETA
ILS
1 Percentages were calculated from the number of students who accepted employment within 4 months after graduation.2 Compensation data is self-reported. Salary data is not provided for industries with 4 or more data points available.
3 Other guaranteed compensation includes guaranteed year-end bonus and other cash-equivalent compensation. It excludes perquisites such as relocation, automobile and variable compensation (e.g., performance bonus, stock options).
4 Includes fitness, hospitatlity and other services.
ANNUAL BASE SALARY2 SIGNING BONUS2
BROKEN DOWN BY INDUSTRY
Percent of Hires1 Mean Median Range Mean Median Range
Consulting 21.4% $135,248 $140,000 $83,500 – $147,000 93.2% $29,085 $25,000 $10,000 – $50,000 13.6% 1.7%
Consumer Products 10.5% $105,293 $103,000 $90,000 – $150,000 58.6% $22,647 $20,000 $10,000 – $30,000 3.4% 17.3%
Apparel/Fashion 1.8% $105,000 $110,000 $90,000 – $110,000 80.0% $27,500 $30,000 $20,000 – $30,000 0.0% 0.0%
Beverages/Food 4.0% $105,045 $103,000 $90,000 – $150,000 45.5% $25,000 $25,000 $20,000 – $30,000 0.0% 27.3%
Toys 2.5% $102,143 $100,000 $95,000 – $115,000 85.7% $18,333 $20,000 $10,000 – $25,000 0.0% 0.0%
Other (Automotive, Electronics, Household Goods) 2.2% $109,667 $106,000 $103,000 – $120,000 33.3% N/A2 N/A2 N/A2 0.0% 28.6%
Energy (including Alternative Energy) 1.1% $116,667 $115,000 $115,000 – $120,000 100.0% $17,500 $17,500 $5,000 – $30,000 0.0% 0.0%
Entertainment/Media 6.5% $103,119 $105,000 $62,400 – $140,000 16.7% $43,167 $25,000 $15,000 – $89,500 11.1% 12.5%
Digital Media 1.4% $114,250 $117,500 $92,000 – $130,000 50.0% N/A2 N/A2 N/A2 0.0% 25.0%
Gaming 0.7% $91,500 $91,500 $88,000 – $95,000 0.0% N/A2 N/A2 N/A2 0.0% 0.0%
TV/Cable/Film 2.9% $92,486 $90,000 $62,400 – $125,000 0.0% N/A2 N/A2 N/A2 33.3% 12.5%
Other 1.4% $120,833 $122,500 $100,000 – $140,000 25.0% N/A2 N/A2 N/A2 0.0% 0.0%
Financial Services 19.6% $121,827 $125,000 $80,000 – $170,000 77.8% $44,845 $47,750 $5,000 – $70,000 5.6% 3.7%
Investment Banking/Brokerage 10.9% $129,333 $125,000 $100,000 – $170,000 96.7% $51,914 $50,000 $40,000 – $70,000 3.3% 0.0%
Investment Management 6.9% $111,667 $112,000 $90,000 – $130,000 52.6% $34,300 $40,000 $10,000 – $50,000 10.5% 5.3%
Other 1.8% $111,250 $117,500 $80,000 – $130,000 60.0% N/A2 N/A2 N/A2 0.0% 20.0%
Health Care 2.9% $110,643 $115,000 $80,000 – $145,000 75.0% $23,200 $27,500 $9,200 – $35,000 0.0% 37.5%
Biotechnology 1.4% $109,250 $115,000 $92,000 – $115,000 100.0% $23,550 $27,500 $9,200 – $30,000 0.0% 25.0%
Medical Devices 0.7% $80,000 $80,000 $80,000 – $80,000 0.0% N/A2 N/A2 N/A2 0.0% 50.0%
Other 0.7% $128,750 $128,750 $112,500 – $145,000 100.0% N/A2 N/A2 N/A2 0.0% 50.0%
Manufacturing 1.4% $123,947 $120,000 $111,840 – $140,000 75.0% N/A2 N/A2 N/A2 0.0% 25.0%
Nonprofits/Gov’t/Social Enterprises 1.1% $85,000 $90,000 $65,000 – $100,000 0.0% N/A2 N/A2 N/A2 0.0% 33.3%
Real Estate 3.3% $112,667 $105,000 $65,000 – $150,000 55.6% $10,500 $10,000 $5,000 – $17,500 22.2% 0.0%
Retail 1.8% $104,600 $110,000 $80,000 – $125,000 60.0% N/A2 N/A2 N/A2 0.0% 20.0%
Technology 28.6% $113,703 $115,000 $50,000 – $154,000 64.6% $24,899 $20,000 $5,000 – $88,000 6.3% 66.7%
Equipment/Hardware/Networking 4.3% $117,901 $124,000 $65,000 – $154,000 75.0% $19,995 $20,000 $10,000 – $30,000 16.7% 41.6%
General 5.4% $116,960 $115,000 $95,000 – $148,000 80.0% $33,333 $35,000 $5,000 – $60,000 0.0% 86.7%
Internet Services/E-Commerce 7.6% $103,782 $101,250 $75,000 – $135,000 52.4% $28,171 $25,000 $10,000 – $88,000 4.5% 76.2%
Software 8.3% $117,289 $120,000 $50,000 – $142,000 65.2% $21,000 $15,000 $10,000 – $50,000 8.7% 65.2%
Other 2.5% $122,143 $130,000 $100,000 – $140,000 57.1% $16,250 $17,500 $10,000 – $20,000 0.0% 42.8%
Other4 1.4% $112,500 $107,500 $85,000 – $150,000 50.0% N/A2 N/A2 N/A2 33.3% 40.0%
Percent Receiving Signing Bonus
Percent Receiving Other
Guaranteed Bonus3
Percent Receiving
Stock/Equity/Options

TOP FUNCTIONS . . . . . . . . . . . . . . . . . . . . . . 81.7%
Management Consulting . . . . . . . . . . . . . . . . . 20.7%Investment Banking . . . . . . . . . . . . . . . . . . . . . 10.5%Product Management . . . . . . . . . . . . . . . . . . . 10.5%Corporation Finance/FP&A/Treasury . . . . . . . . 9.0%Brand Management . . . . . . . . . . . . . . . . . . . . . . 6.8%Investment Management . . . . . . . . . . . . . . . . . 6.8%Rotational Programs. . . . . . . . . . . . . . . . . . . . . . 6.2%Business/Corporate Development . . . . . . . . . . 4.7%Internal Consulting. . . . . . . . . . . . . . . . . . . . . . . 4.0%Operations/Logistics/Supply Chain . . . . . . . . . 2.5%
All Others. . . . . . . . . . . . . . . . . . . . . . . . . . . . . 18.3%1 Percentages were calculated from the number of students who accepted employment within 4 months after graduation.
CLASS OF 2016 FULL-TIME EMPLOYMENTFUNCTION SUMMARY
FUN
CT
ION
SUM
MA
RY
10
6.4% of the Class of 2016 graduates were sponsored and returned to their pre-MBA employers in the following job functions:
Accounting/AuditingBusiness/Corporate DevelopmentBusiness AnalysisCorporation Finance/FP&A/TreasuryCorporate Strategy
Executive ManagementInvestment ManagementManagement ConsultingProject Management
Percent of Hires1
Top 10 Function choices of the Class of 2016 graduates made up
81.7 percent of the class, an increase from 72.8 percent.
SHELDON FIELDS (’16) Nike Inc.
Beaverton, OR
Top five functions of choice for Class of 2016 graduates remained consistent for two consecutive
years: brand management, corporate finance, investment banking, management consulting
and product management.

11
FUN
CT
ION
DETA
ILS
3 Other guaranteed compensation includes guaranteed year-end bonus and other cash-equivalent compensation. It excludes perquisites such as relocation, automobile and variable compensation (e.g., performance bonus, stock options).
4 Includes government affairs, law, real estate development.
1 Percentages were calculated from the number of students who accepted employment within 4 months after graduation.2 Compensation data is self-reported. Salary data is not provided for industries with fewer than 4 data points available.
BROKEN DOWN BY FUNCTION
Percent of Hires1 Mean Median Range Mean Median Range
Consulting 24.8% $131,325 $140,000 $83,500 – $147,000 92.6% $27,471 $25,000 $10,000 – $50,000 13.2% 4.4%
Internal 4.0% $112,727 $114,000 $95,000 – $140,000 81.8% $17,333 $20,000 $10,000 – $26,000 9.1% 18.2%
Management 20.7% $134,979 $140,000 $83,500 – $147,000 94.7% $29,161 $25,000 $10,000 – $50,000 14.0% 1.8%
Finance/Accounting 29.7% $118,193 $125,000 $65,000 – $170,000 75.6% $37,439 $40,000 $5,000 – $70,000 4.9% 12.2%
Commercial Banking/Lending 0.7% N/A2 N/A2 N/A2 50.0% N/A2 N/A2 N/A2 0.0% 0.0%
Corporation Finance/FP&A/Treasury 9.0% $110,447 $110,000 $80,000 – $150,000 76.0% $22,379 $20,000 $5,000 – $50,000 9.5% 36.0%
Investment Banking 10.5% $129,483 $125,000 $100,000 – $170,000 96.6% $51,982 $50,000 $40,000 – $70,000 3.4% 0.0%
Investment Management 6.8% $113,000 $110,000 $90,000 – $150,000 47.4% $39,778 $40,000 $10,000 – $55,000 9.1% 5.2%
Real Estate Finance 1.4% $101,250 $95,000 $65,000 – $150,000 100.0% $10,625 $10,000 $5,000 – $17,500 0.0% 0.0%
Venture Capital/Private Equity 1.1% $121,667 $125,000 $110,000 – $130,000 33.3% N/A2 N/A2 N/A2 0.0% 0.0%
General Management 7.6% $111,598 $115,000 $79,000 – $150,000 57.1% $22,496 $20,000 $10,000 – $40,000 23.8% 38.1%
Executive 1.4% $126,333 $150,000 $79,000 – $150,000 25.0% N/A2 N/A2 N/A2 50.0% 0.0%
Rotational Program 6.2% $108,651 $115,000 $80,000 – $143,208 64.7% $21,814 $20,000 $10,000 – $40,000 17.6% 47.1%
Human Resources 0.7% N/A2 N/A2 N/A2 0.0% N/A2 N/A2 N/A2 0.0% 50.0%
Marketing/Sales 24.4% $110,048 $110,400 $50,000 – $154,000 56.7% $25,395 $22,500 $5,000 – $88,000 2.9% 46.3%
Brand Management 6.8% $100,026 $100,000 $85,000 – $115,000 57.9% $24,091 $25,000 $20,000 – $35,000 0.0% 21.1%
Marketing Analytics 0.7% N/A2 N/A2 N/A2 50.0% N/A2 N/A2 N/A2 0.0% 0.0%
Marketing – Other Services 2.5% $108,833 $110,000 $88,000 – $130,000 42.9% $30,000 $25,000 $15,000 – $50,000 0.0% 33.3%
Merchandizing/Retail Marketing 1.4% $112,600 $110,200 $105,000 – $125,000 50.0% N/A2 N/A2 N/A2 0.0% 50.0%
Product Management 10.5% $123,927 $130,000 $65,000 – $154,000 65.5% $24,211 $20,000 $5,000 – $88,000 3.4% 62.1%
Sales/Account Management 2.5% $89,857 $90,000 $50,000 – $125,000 42.9% N/A2 N/A2 N/A2 14.3% 71.4%
Operations/Logistics/Supply Chain 2.5% $116,660 $120,000 $94,620 – $127,000 57.1% $31,095 $27,500 $19,380 – $50,000 0.0% 85.7%
Other Functions 10.1% $107,804 $112,500 $62,400 – $148,000 32.1% $27,056 $19,000 $10,000 – $89,500 3.6% 28.6%
Business/Corporate Development 4.7% $104,450 $105,000 $62,400 – $148,000 23.1% $26,667 $30,000 $10,000 – $40,000 0.0% 38.5%
Business Intelligence/Analytics 2.2% $125,400 $135,000 $97,000 – $140,000 50.0% $13,333 $10,000 $10,000 – $20,000 0.0% 33.3%
Strategic Planning 1.4% $110,625 $110,000 $82,500 – $140,000 50.0% N/A2 N/A2 N/A2 0.0% 25.0%
Other4 1.8% $96,000 $90,000 $65,000 – $140,000 20.0% N/A2 N/A2 N/A2 40.0% 40.0%
ANNUAL BASE SALARY2 SIGNING BONUS2
Percent Receiving Other
Guaranteed Compensation2,3
Percent Receiving
Stock/Equity/Options2
Percent Receiving Signing Bonus
DID YOU KNOW? | Class of 2016 graduates’ career choices spanned more
than 25 different functions.
The percentage of Class of 2016 graduates entering a consulting function increased from 20.9 percent in 2015
to 24.8 percent in 2016. Finance function also had an increase from 24.9 percent to almost 30 percent.

LOC
AT
ION
DETA
ILS
12
CLASS OF 2016 FULL-TIME EMPLOYMENTBROKEN DOWN BY LOCATION
CLASS OF 2016 GRADUATES CAME TO UCLA ANDERSON FROM THE FOLLOWING U.S. AND GLOBAL REGIONS
1.1% | MIDDLE EAST
2.2% | CANADA
2.5% | EUROPE
7.3% | CENTRAL & SOUTH AMERICA
20.1% | ASIA & OCEANIA
2.0% | U.S. – SOUTH
3.6% | U.S. – SOUTHWEST
4.7% | U.S. – MIDWEST
U.S. – WEST | 40.0%
U.S. – NORTHEAST | 11.2%
U.S. – MID-ATLANTIC | 5.3%
U.S. Regions
Global Regions
Companies who have hired for positions outside the U.S.:
Amazon Inc.AP TechnologiesAQR Capital Management LLCThe Boston Consulting Group (BCG)Capital Advisors Equity Investments SA
CemexCitigroup Inc.Google Inc.Integration ConsultingInvesco Ltd.
ItaúJD.comMcKinsey & CompanyMercado LibreMorgan Stanley
Sobey Digital Technology Co. Ltd.TencentTerrafondoVipshop
Number of companies outside of the U.S. that hired our graduates increased by 73 percent from 2015.

13
LOC
AT
ION
DETA
ILS
POST-MBA LOCATION DETAILS
Percent Receiving Signing Bonus
ANNUAL BASE SALARY2
UNITED STATES Percent of Hires1 Mean Median Range Mean Median Range
California 71.4% $120,611 $125,000 $62,400 - $154,000 67.0% $28,929 $25,000 $5,000 - $89,500 7.6% Southern 50.0% $117,989 $120,000 $62,400 - $150,000 61.6% $31,024 $25,000 $5,000 - $89,500 8.0% Northern 21.4% $126,951 $127,000 $90,000 - $154,000 79.7% $25,142 $25,000 $9,200 - $70,000 6.8%Northeast 7.2% $116,947 $125,000 $80,000 - $150,000 80.0% $33,938 $40,000 $10,000 - $60,000 0.0%West (excluding California) 6.2% $110,882 $115,000 $50,000 - $140,000 94.1% $39,375 $35,000 $10,000 - $88,000 11.8%Southwest 1.8% $124,400 $125,000 $100,000 - $147,000 100.0% $36,000 $35,000 $25,000 - $47,500 0.0%Midwest 1.8% $111,568 $110,000 $103,000 - $130,000 80.0% $22,500 $22,500 $20,000 - $25,000 0.0%Mid-Atlantic 1.2% N/A2 N/A2 N/A2 33.3% N/A2 N/A2 N/A2 33.3%South 0.8% N/A2 N/A2 N/A2 100.0% N/A2 N/A2 N/A2 0%
U.S. TOTAL 90.2% $119,120 $125,000 $50,000-$154,000 70.7% $30,356 $25,000 $5,000 - $89,500 13.7%
INTERNATIONAL Asia 5.1% $108,900 $102,500 $75,000 - $170,000 50.0% $18,527 $14,690 $10,000 - $40,000 35.7%Central & South America 2.1% $86,500 $82,500 $79,000 - $98,000 33.3% N/A2 N/A2 N/A2 33.3%Europe 1.8% $119,268 $94,620 $81,454 - $128,000 100% $30,776 $36,500 $10,000 - $50,000 20%Middle East 0.8% N/A2 N/A2 N/A2 100% N/A2 N/A2 N/A2 0% INTERNATIONAL TOTAL 9.8% $105,790 $99,000 $75,000 - $170,000 55.5% $24,171 $20,000 $10,000 - $50,000 25.9%
SIGNING BONUS2
Percent Receiving Other Guaranteed Compensation2, 3
1 Percentages were calculated from the number of students who accepted employment within 4 months after graduation.2 Compensation data is self-reported. Salary data is not provided for functions with fewer than 4 data points available.
3 Other guaranteed compensation includes guaranteed year-end bonus and other cash-equivalent compensation. It excludes perquisites such as relocation, automobile and variable compensation (e.g., performance bonus, stock options).
GLOBAL ANDERSON Average base salary of those
job acceptances outside of the U.S. increased by 11.3 percent.
GLOBAL ANDERSON Percent of graduates accepting jobs outside
of the U.S. more than doubled from 4.4 percent in 2015 to 9.8 percent in 2016.

A A.T. KearneyAccentureAceso GlobalAcore Capital LPActivision/Blizzard Inc.actv8.meADIDAS AGAdobe Systems Inc.AFP HabitatAlvarez & MarsalAmazon Inc.Amgen Inc.Analysis Group Inc.AP TechnolgiesApple Inc.AQR Capital Management LLCArup North America Ltd.AT&T Inc.Athenahealth Inc.Autodesk Inc.Avante Mezzanine PartnersAvivar CapitalB Bain & Company Inc.Bank of America Merrill LynchBank of the WestBarclaysBeachbody LLCBelcampo Meat Co.Benedict Canyon EquitiesBeyond YogaBeyondCurious Inc.Bill & Melinda Gates FoundationBitglass
Blizzard EntertainmentBonk BreakerThe Boston Consulting Group
(BCG)Boston Scientific CorporationThe Bouqs CompanyBrandStorm, IncC Campbell Soup CompanyThe Capital Group Companies Inc.CasaVisionCBS Interactive Inc.Chevron CorporationCicero GroupCisco Systems, IncCitigroup Inc.The Clorox CompanyCoach Inc.Combined Properties Inc.ComcastContrast SecurityCornerstone on DemandCOTA CapitalCove Street CapitalCredit SuisseCrescent Capital Group LPCross CampusCT3 via Education Pioneers
Summer Fellowship ProgamDDanaher CorporationDataScience Inc.David Geffen School of Medicine
UCLA AcceleratorDDD (3D Systems)DeloitteDelta Air LinesDerek LamDeutsche Bank AGDimensional Fund Advisors
DiNapoli Capital PartnersDivy Inc.DKSHdmg::informationDogVacayDoubleLine Capital LPDow Chemical CompanyDreamworks Animation LLCD-ToolsE E. & J. Gallo WineryEastdil SecuredEdison InternationalEnrouEpisource LLCEpson America Inc.ExperianEYFFacebook Inc.Factual Inc.FandangoFifth WallFirst Pacific AdvisorsFirst QuadrantFitness International LLCFlex Ltd.Frog DesignGGenentech Inc.General MillsGoldman Sachs & Co.Google Inc.GoPro Inc.Granite CapitalGreen Street AdvisorsGreenlightGSV AccelerationHH&M
Happiest Baby Inc.Hilton WorldwideHirschThe Honest CompanyHoulihan LokeyHP Inc.Human LongevityHunt Consolidated Inc.Hyperloop Transportation
Technologies Inc.IIBMIDEOIllumina Inc.InfineraInkflip.comIntel CorporationIntuit Inc.Intuitive Surgical Inc.Invesco Ltd.Invoice2goIrvine CompanyItaú JThe J.M. Smucker CompanyJD.comJeffries GroupJessie Lord BakeryJohnson & Johnson CompanyJPMorgan Chase & Co. KKarracanKayne CapitalKeller WilliamsKing’s Hawaiian Inc.KPMG LLPKrista Wegener ConsultingL L.E.K. Consulting LLCLA24
Landmark HealthLazard Frères & Co.Lincoln InternationalLionsgate Entertainment Inc.Lithium TechnologiesLocalConstructLong Wharf Real Estate PartnersLoot CrateLos Angeles County Employees
Retirement Association (LACERA)
Los Angeles LakersLT Global InvestmentMMacquarie GroupMarketShareMars Inc.MasterCard AdvisorsMattel Inc.McCarthy Cook & Co.McGraw Hill EducationMcKesson CorporationMcKinsey & CompanyMedallia IncMedia Rights CapitalMedtronic Inc.Mercado LibreMercer LLCMetLife Real Estate InvestmentsMicron TechnologyMicrosoft CorporationMoelis & CompanyMoody’s AnalyticsMorgan StanleyMorrison & Foerster LLPMUFG Union BankMunchkin Inc.musical.lyNNBCUniversal Media LLC
Nestlé USANewOakNiagara Bottling CompanyNike Inc.NISANordstromNRG GlobalOOaktree Capital Management LPOnPrem Solution Partners LLCOpenXOppenheimer FundsOrlando City SCOverton Moore PropertiesPPAAMCOPacific Gas & Electric CompanyPalm Tree AdvisorsPanda Restaurant Group Inc.Pandora RadioParamount PicturesPayoff.com Inc.PayPal Inc.PCCPPitchBook DataPivotal LabsPontifax Ag-TechProphetPulmonePwCQQualcomm RRakutenThe Ratkovich CompanyRBC Capital MarketsReebokRelativity SpaceRenovate AmericaRentSpree LLC
The following firms hired at least one UCLA Anderson student during the 2015 – 2016 school year (combining both full-time employment and summer internships):
CLASSES OF 2016 & 2017 HIRING ORGANIZATIONSRECENT EMPLOYERS
HIR
ING
OR
GA
NIZ
AT
ION
S
14

Rothschild Inc.SSaban Community Clinic Salesforce.comSamsung CorporationSanDisk CorporationSBA Complete, IncScratchpay.comShea PropertiesSkyview Capital LLCSoFiSONIFISony Pictures EntertainmentSony PlaystationSouthern California EdisonStout Risius Ross (SRR)Stratalux Inc.Strategy&STX EntertainmentSunEdison LLCSunPower CorporationSymantec Corp.TTala (formerly InVenture)Target Corp.TATA Consultancy ServicesTencentTerrafondoTesla MotorsThermo Fisher ScientificThornburg Investment
ManagementThrive MarketTicketFlyT-Mobile USA Inc.Top Tier ConsultingTotum WealthTranscendent Investment
ManagementTroika Design GroupTruAmerica Multifamily LLC
TrueCar Inc.Trust Company of the West
(TCW)Tyco ElectronicsUUCLA Anderson Harold and
Pauline Price Center for Entrepreneurship & Innovation
UCLA Office of Academic Planning & Budget
United Airlines Inc.United Health GroupUniversa Investments LPUniversal Music GroupUniversal PicturesVVance Street CapitalThe Veloz GroupVeritas Technologies LLCVerity Consulting Inc.Verizon Digital Media ServicesVestor.InVipshop.comVisa Inc.Visionary VCVMWare Inc.WThe Walt Disney CompanyWarner Bros.Watertower GroupWells Fargo SecuritiesWhiteWave FoodsXXPRIZE FoundationYYahoo! Inc.ZZestFinanceZS AssociatesZynga Inc.
The following organizations have hired five or more full-time MBA students during the 2015 – 2016 recruiting season (combining both full-time employment and summer internships):
20 OR MORE STUDENTS:Amazon Inc.Deloitte
16 – 20 STUDENTS:Bank of America Merrill Lynch
Google Inc.Microsoft Corporation
10 – 15 STUDENTS:Adobe Systems Inc.Amgen Inc.The Boston Consulting Group (BCG)EYMattel Inc.McKinsey & Company Inc.
Nike Inc.PwC
5 – 9 STUDENTS:Apple Inc.AT&T Inc.Autodesk Inc.Citigroup Inc.Credit SuisseDimensional Fund AdvisorsEpson America Inc.
Goldman Sachs & Co.Houlihan LokeyIntel CorporationJD.comMoelis & CompanySony Pictures EntertainmentSouthern California EdisonThe Walt Disney Company
Over 250 other organizations hired at least one MBA student/graduate for full-time employment or nternships in 2016.
TOP HIRING FIRMS
15
HIR
ING
OR
GA
NIZ
AT
ION
S
Among the offers accepted for full-time employment and summer internships, 43.6 percent came from companies in
our Top Hiring Firms list.
CLASS OF 2017 SUMMER INTERNSHIPSCLASS PROFILE
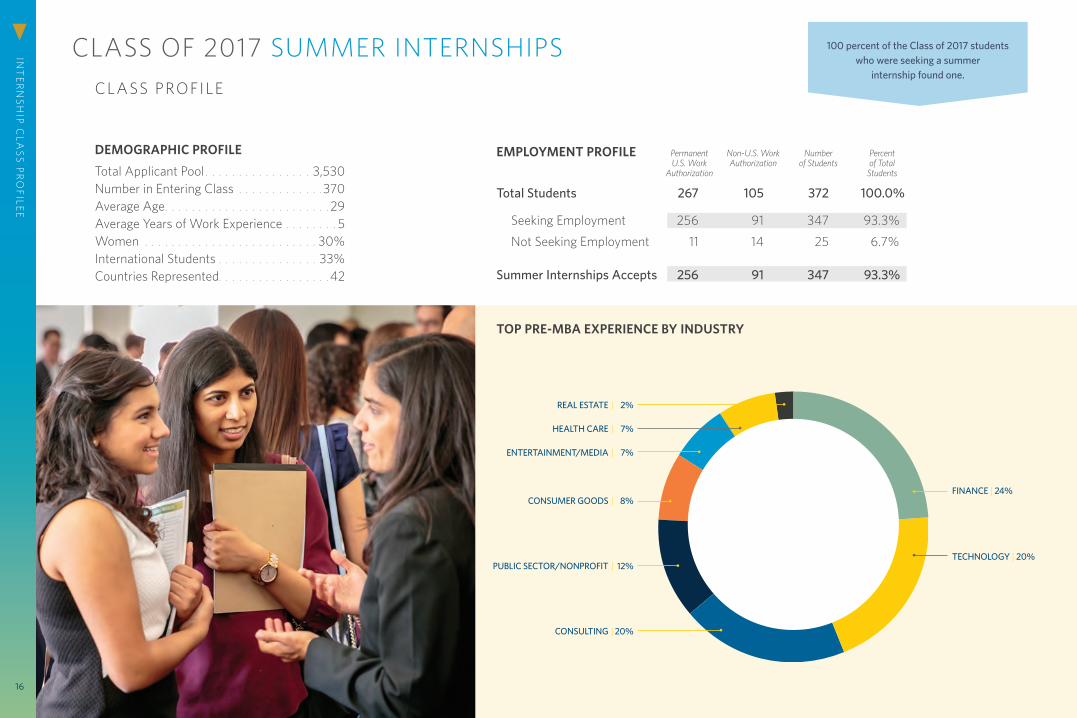
DEMOGRAPHIC PROFILE
Total Applicant Pool . . . . . . . . . . . . . . . . 3,530Number in Entering Class . . . . . . . . . . . . . 370Average Age. . . . . . . . . . . . . . . . . . . . . . . . . 29Average Years of Work Experience . . . . . . . . 5Women . . . . . . . . . . . . . . . . . . . . . . . . . . 30%International Students . . . . . . . . . . . . . . . 33%Countries Represented. . . . . . . . . . . . . . . . . 42
INT
ERN
SHIP C
LASS PR
OFILEE
16
CONSUMER GOODS | 8%
PUBLIC SECTOR/NONPROFIT | 12%
CONSULTING | 20%
FINANCE | 24%
TECHNOLOGY | 20%
TOP PRE-MBA EXPERIENCE BY INDUSTRY
EMPLOYMENT PROFILE Permanent Non-U.S. Work Number Percent U.S. Work Authorization of Students of Total Authorization Students
Total Students 267 105 372 100.0%
Seeking Employment 256 91 347 93.3%
Not Seeking Employment 11 14 25 6.7%
Summer Internships Accepts 256 91 347 93.3%
REAL ESTATE | 2%
HEALTH CARE | 7%
ENTERTAINMENT/MEDIA | 7%
100 percent of the Class of 2017 students who were seeking a summer
internship found one.

17
INT
ERN
SHIP EM
PLOY
MEN
T SU
MM
AR
Y
EMPLOYMENT SUMMARY
COMPENSATION SUMMARY Percent of Students Reporting Salary Data1 Mean Median Range
Monthly Base Salary 93.6% $7,224 $7,563 $933 – $13,000
1 Percentages were calculated from the number of students who accepted a summer internship.2 Compensation data is self-reported. Salary data is not provided for functions with fewer than 3 data points available.
Percent of Hires1
UCLA Anderson-Facilitated Resources . . . . . . . . . . . . . . . . . . . . . . . . . . . . . . . . . . . .83.8%
Campus Recruiting Program (including myCareer Resume Collections) . . . . . . . . . . . . . . . . . 51.2%
Parker CMC Postings . . . . . . . . . . . . . . . . . . . . . . . . . . . . . . . . . . . . . . . . . . . . . . . . . . . . . . . . . . . . . . 9.6%
UCLA Anderson Contacts (alumni, classmates, faculty, etc.) . . . . . . . . . . . . . . . . . . . . . . . . . . . 7.9%
Other Parker CMC Resources (advisors, resume database, spring career fair, etc.) . . . . . . . . . 5.5%
Student Club-Related Resources . . . . . . . . . . . . . . . . . . . . . . . . . . . . . . . . . . . . . . . . . . . . . . . . . . . . 3.2%
UCLA Anderson Contacts – Faculty and Research Centers (Price, Ziman, Fink, etc.) . . . . . . . 2.3%
National MBA Career Conferences (Consortium, Forté, NSHMBA, NBMBAA, ROMBA, etc.) . . . . . . 1.7%
Other UCLA Anderson Resources . . . . . . . . . . . . . . . . . . . . . . . . . . . . . . . . . . . . . . . . . . . . . . . . . . . 1.2%
Other UCLA-Related Resources . . . . . . . . . . . . . . . . . . . . . . . . . . . . . . . . . . . . . . . . . . . . . . . . . . . . . 1.2%
Non-UCLA Anderson-Facilitated Resources . . . . . . . . . . . . . . . . . . . . . . . . . . . . . . 16.2%
Other Website/Online Resources (LinkedIn, Indeed.com, etc.) . . . . . . . . . . . . . . . . . . . . . . . . . . 4.4%
Family/Friend/Personal Network (non-UCLA Anderson-related) . . . . . . . . . . . . . . . . . . . . . . . 2.9%
Other Resources/Contacts (non-UCLA Anderson-related) . . . . . . . . . . . . . . . . . . . . . . . . . . . . . 2.9%
Company Website. . . . . . . . . . . . . . . . . . . . . . . . . . . . . . . . . . . . . . . . . . . . . . . . . . . . . . . . . . . . . . . . . 2.6%
Pre-MBA Employer Network (non-sponsorship) . . . . . . . . . . . . . . . . . . . . . . . . . . . . . . . . . . . . . . 2.0%
Direct Company Contact (not facilitated by UCLA Anderson) . . . . . . . . . . . . . . . . . . . . . . . . . . .1.5%
INTERNSHIP SOURCE
Campus recruiting program and Parker Postings combined for more than 60 percent of the source
of summer internships for the Class of 2017.
NETWORK EFFECT Over 14 percent of summer internships were
sourced through personal networks, both within and outside of UCLA Anderson.
CLASS OF 2017 SUMMER INTERNSHIPS INT
ERN
SHIP IN
DU
STR
Y D
ETAILS
18
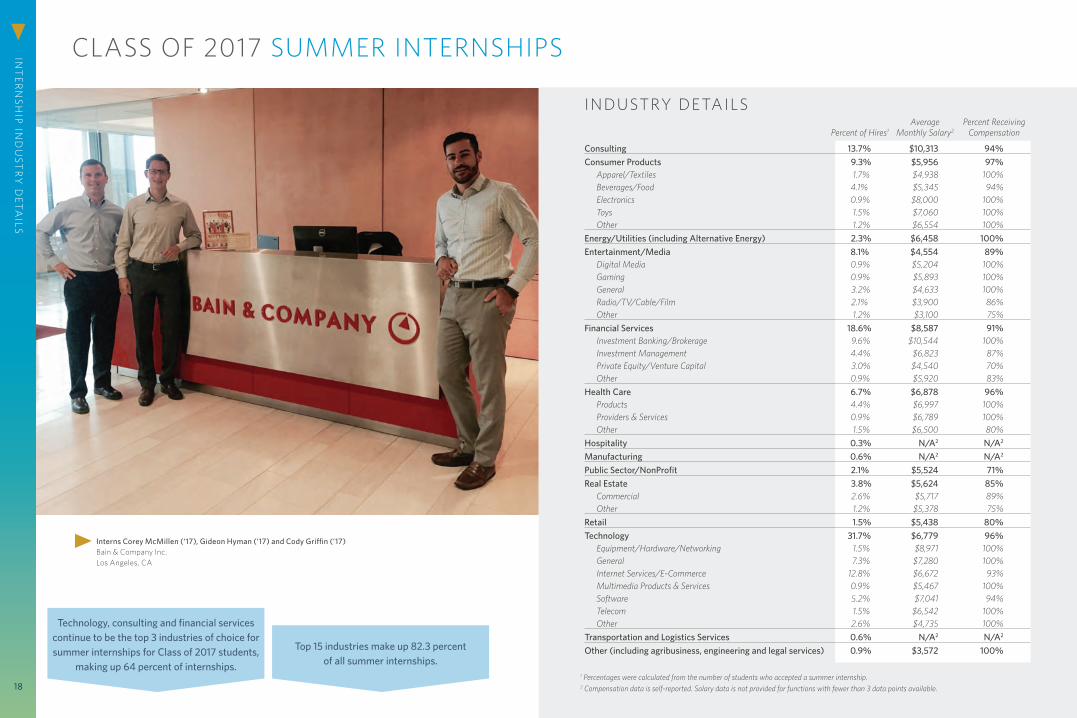
INDUSTRY DETAILS
1 Percentages were calculated from the number of students who accepted a summer internship.2 Compensation data is self-reported. Salary data is not provided for functions with fewer than 3 data points available.
Average Percent Receiving Percent of Hires1 Monthly Salary2 Compensation
Consulting 13.7% $10,313 94%Consumer Products 9.3% $5,956 97% Apparel/Textiles 1.7% $4,938 100% Beverages/Food 4.1% $5,345 94% Electronics 0.9% $8,000 100% Toys 1.5% $7,060 100% Other 1.2% $6,554 100%Energy/Utilities (including Alternative Energy) 2.3% $6,458 100%Entertainment/Media 8.1% $4,554 89% Digital Media 0.9% $5,204 100% Gaming 0.9% $5,893 100% General 3.2% $4,633 100% Radio/TV/Cable/Film 2.1% $3,900 86% Other 1.2% $3,100 75%Financial Services 18.6% $8,587 91% Investment Banking/Brokerage 9.6% $10,544 100% Investment Management 4.4% $6,823 87% Private Equity/Venture Capital 3.0% $4,540 70% Other 0.9% $5,920 83%Health Care 6.7% $6,878 96% Products 4.4% $6,997 100% Providers & Services 0.9% $6,789 100% Other 1.5% $6,500 80%Hospitality 0.3% N/A2 N/A2
Manufacturing 0.6% N/A2 N/A2
Public Sector/NonProfit 2.1% $5,524 71%Real Estate 3.8% $5,624 85% Commercial 2.6% $5,717 89% Other 1.2% $5,378 75%Retail 1.5% $5,438 80%Technology 31.7% $6,779 96% Equipment/Hardware/Networking 1.5% $8,971 100% General 7.3% $7,280 100% Internet Services/E-Commerce 12.8% $6,672 93% Multimedia Products & Services 0.9% $5,467 100% Software 5.2% $7,041 94% Telecom 1.5% $6,542 100% Other 2.6% $4,735 100%Transportation and Logistics Services 0.6% N/A2 N/A2
Other (including agribusiness, engineering and legal services) 0.9% $3,572 100%
Interns Corey McMillen (‘17), Gideon Hyman (‘17) and Cody Griffin (‘17) Bain & Company Inc.
Los Angeles, CA
Technology, consulting and financial services continue to be the top 3 industries of choice for summer internships for Class of 2017 students,
making up 64 percent of internships.
Top 15 industries make up 82.3 percent of all summer internships.

19
INT
ERN
SHIP FU
NC
TIO
N D
ETAILS
Interns Elizabeth Blakely (’17) and Suzie Lee (’17) The Honest Company
Los Angeles, CA
FUNCTION DETAILS
1 Percentages were calculated from the number of students who accepted a summer internship.2 Compensation data is self-reported. Salary data is not provided for functions with fewer than 3 data points available.
Average Percent Receiving Percent of Hires1 Monthly Salary2 Compensation
Consulting 15.4% $9,542 94% Consulting – Internal 2.0% $5,761 86% Consulting – Management 13.4% $10,058 96%
Finance/Accounting 26.7% $7,900 93% Accounting/Auditing 0.3% N/A2 N/A2
Corporation Finance/Financial Analysis/FP&A 6.1% $6,695 95% Corporation Finance/Treasury 1.2% $6,405 100% Investment Banking 9.0% $10,682 100% Investment Management 3.2% $7,092 82% Private Wealth Management 0.6% N/A2 N/A2
Real Estate Finance 2.9% $6,689 90% Venture Capital/Private Equity 3.5% $4,690 83%
General Management 4.7% $5,829 100% Executive 0.3% N/A2 N/A2
Project Management 1.7% $5,566 100% Rotational Program 2.6% $5,882 100%
Human Resources 1.7% $6,567 100%
Marketing/Sales 25.9% $6,904 96% Brand Management 4.4% $6,420 100% Market Research 0.3% N/A2 N/A2
Marketing Analytics 2.0% $5,667 100% Marketing Consulting 1.2% $8,208 100% Marketing – Other Services 2.3% $6,101 100% Merchandising/Retail Marketing 0.3% N/A2 N/A2
Product Management 14.2% $7,344 94% Sales 1.2% $5,895 100%
Operations/Logistics 6.7% $6,996 87%
Other 18.9% $5,228 88% Business/Corporate Development 8.4% $5,042 83% Business Intelligence/Analytics 2.9% $5,214 100% Real Estate Development 1.2% $3,800 100% Strategic Planning 3.5% $6,679 83%
Other (includes design strategy, law, sales operations, technical account management, etc.) 2.9% $4,761 90%
DID YOU KNOW? Class of 2017 students’ internship choices
spanned over 25 different functions.
Product management, management consulting and investment banking continue
to be the top 3 functions of choice for summer internships for Class of 2017
students. This year, business/corporate development and operations/logistics/
supply chain joined the top 5.

INT
ERN
SHIP FU
NC
TIO
N SU
MM
AR
Y
20
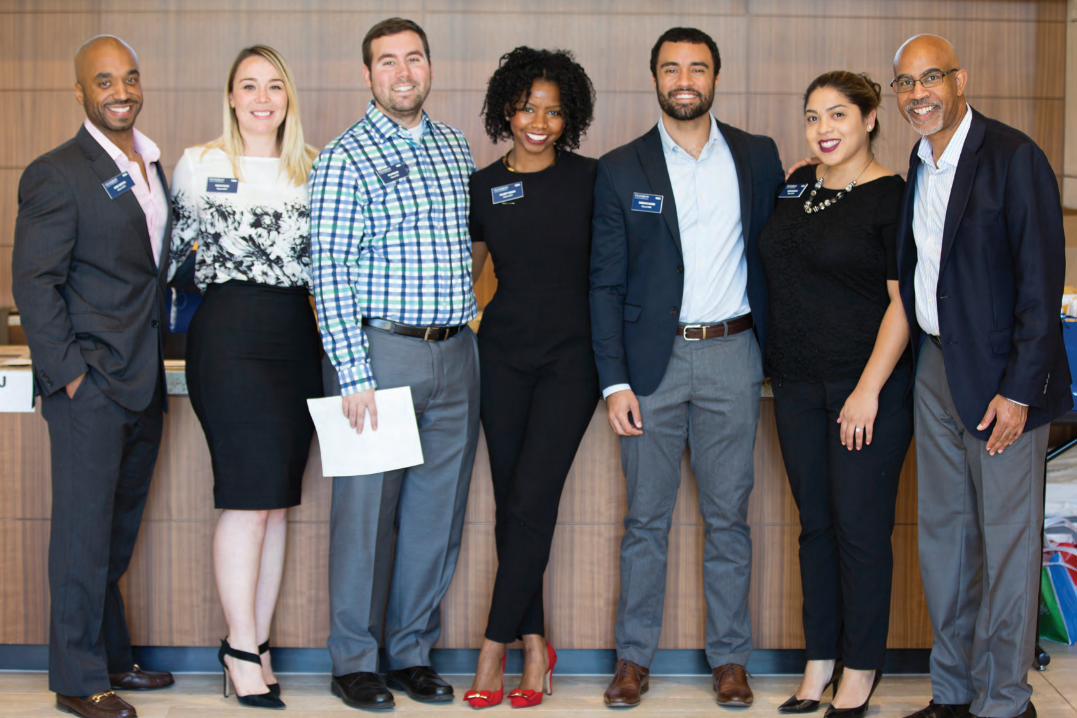
SUMMER INTERNS FROM CLASS OF 2017, left to right: Ariana Moseley, Josh Graham, Anita Raheja, Rebecca Hilton,
Alberto Martinez, Jessica Thompson, Jason Finkelstein Mattel
El Segundo, CA
CLASS OF 2017 SUMMER INTERNSHIPS
UNITED STATES Percent of Hires1 Average Monthly Salary2
California 76.3% $7,132
Southern 52.0% $6,689
Northern 24.3% $8,034
West (excluding California) 10.9% $7,354
Northeast 5.8% $9,210
Southwest 2.7% $7,889
Midwest 2.7% $7,236
Mid-Atlantic 0.9% $7,367
South 0.6% N/A2
U.S. TOTAL 95.6% $7,300
INTERNATIONAL
Asia 2.9% $5,298
Central & South America 0.9% $7,333
Europe 0.3% N/A2
Africa 0.3% N/A2
INTERNATIONAL TOTAL 4.4% $5,720
1 Percentages were calculated from the number of students who accepted a summer internship.2 Compensation data is self-reported. Salary data is not provided for functions with fewer than
3 data points available.
BROKEN DOWN BY LOCATION
21
INT
ERN
SHIP FU
NC
TIO
N SU
MM
AR
Y
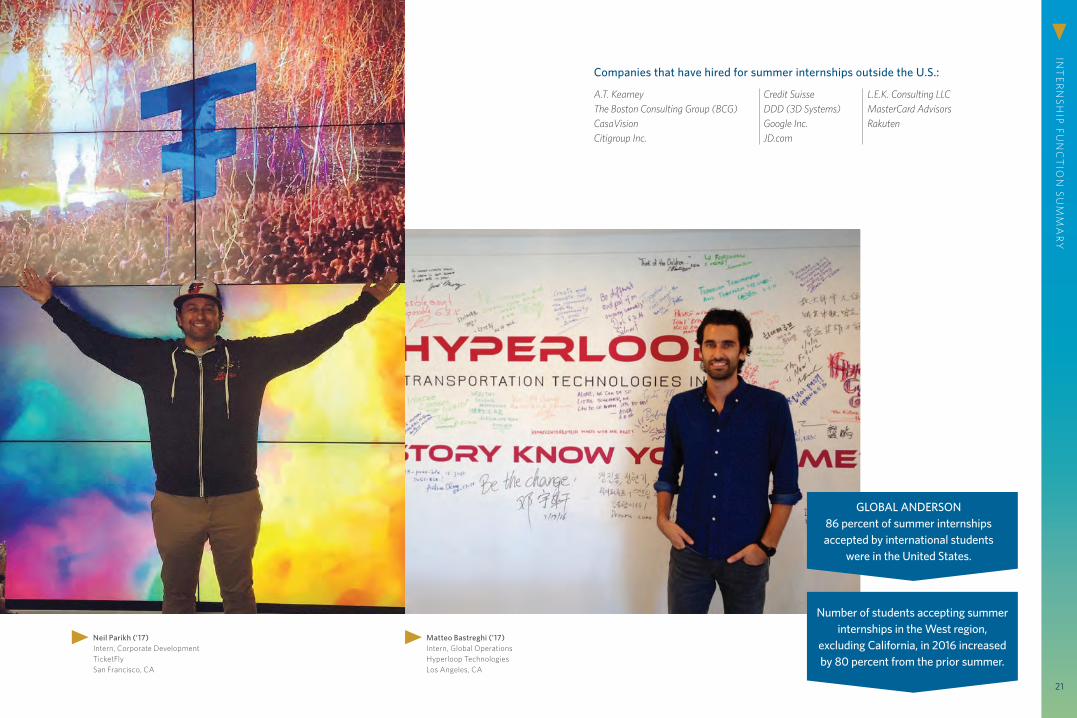
Neil Parikh (‘17) Intern, Corporate Development TicketFly
San Francisco, CA
Matteo Bastreghi (‘17) Intern, Global Operations Hyperloop Technologies
Los Angeles, CA
Companies that have hired for summer internships outside the U.S.:
A.T. KearneyThe Boston Consulting Group (BCG)CasaVisionCitigroup Inc.
Credit SuisseDDD (3D Systems)Google Inc.JD.com
L.E.K. Consulting LLCMasterCard AdvisorsRakuten
Number of students accepting summer internships in the West region,
excluding California, in 2016 increased by 80 percent from the prior summer.
GLOBAL ANDERSON 86 percent of summer internships accepted by international students
were in the United States.
CLASS OF 2017 SUMMER INTERNSHIPS INT
ERN
SHIP LO
CA
TIO
N SU
MM
AR
Y
22
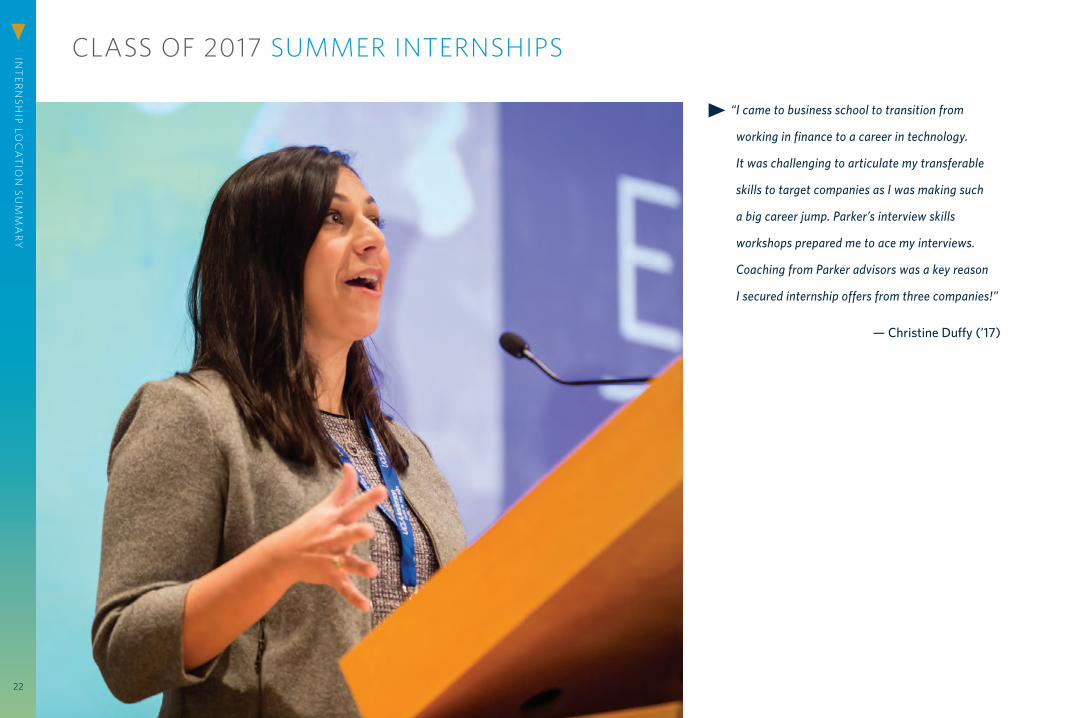
“ I came to business school to transition from
working in finance to a career in technology.
It was challenging to articulate my transferable
skills to target companies as I was making such
a big career jump. Parker’s interview skills
workshops prepared me to ace my interviews.
Coaching from Parker advisors was a key reason
I secured internship offers from three companies!”
— Christine Duffy (’17)
Regina Regazzi Assistant Dean, Parker Career Management Center
Phil Han Director, Recruiting Operations & Career Advisor
Emily Taylor Director, MBA Career Education & Communications
Chris Weber Director, MBA Career Advising & Education
Jessica Christopher Associate Director, Career Advisor
Hannah Cowherd Manager, Campus Recruiting & Business Services
Jessica Devereaux Communications Manager
Qilin He International Students Advisor
Wanda Hebert Logistics Manager, Campus Recruiting & Business Services
David Henry Associate Director, Career Advisor & Corporate Outreach
Elizabeth Litt Customer Relations Manager
Jessica McGruder Administrative Manager
Donna Robinson Associate Director, Employer Relations
Britta Schort Associate Director, Career Advisor & Corporate Outreach
Lin Young Associate Director, Career Advisor & Corporate Outreach
PARKER CAREER MANAGEMENT CENTER STAFF
UCLA Anderson School of ManagementParker Career Management Center110 Westwood PlazaEntrepreneurs Hall, Suite C.201Box 951481Los Angeles, CA 90095-1481
Phone: 310.825.3325Fax: 310.206.8087Email: [email protected]
UCLA Anderson Parker Career Management Center
@UCLAParkerCMC
Brochure: UCLA Anderson Marketing & Communications, paper contains 10% post-consumer fiber, printed with soy-based inks
anderson.ucla.edu/recruit/recruit-mbas


![LBS MBA Employment Report 2010[1]](https://static.documents.pub/doc/80x56/577d253c1a28ab4e1e9e560b/lbs-mba-employment-report-20101.jpg)


