Abstract This chapter addresses the societal and the environmental impacts of cli-mate change related to increasing surface temperatures on air quality and forest health. Increasing temperatures at and near the earth’s surface, due to both a warm-ing climate and urban heat island effects, have been shown to increase ground-level ozone concentrations in cities across the U.S. In terms of forest health, elevated surface air temperatures and increased water stress are raising the possibility that forests world-wide are increasingly responding to warming climate conditions, which may lead to widespread tree mortality. The importance of climate datasets is also addressed, specifi cally as it relates to understanding the observed and predicted changes in surface temperatures at the global, regional and local scale.
Keywords Anthropogenic-induced changes • Forest health • Change in surface temperature • Changing distribution of conifers • Phytophagous insects • Climate- induced forest mortality
Anthropogenic-induced changes to the earth’s climate are among the most complex and diffi cult issues to be addressed by modern science and the scientifi c commu-nity. Small changes in the concentrations of atmospheric gases, such as carbon dioxide (CO 2 ) and methane (CH 4 ), have large impacts on society, ecosystems, and the hydrologic cycle [ 1 ]. Given the magnitude of observed and potential impacts,
Chapter 3 Climate Change: Overview of Data Sources, Observed and Predicted Temperature Changes, and Impacts on Public and Environmental Health
David H. Levinson and Christopher J. Fettig
D. H. Levinson , M.S., Ph.D. (*) Watershed, Fish, Wildlife, Air and Rare Plants , USDA Forest Service, 2150A Centre Avenue , Fort Collins, CO 80526, USA e-mail: [email protected]
C. J. Fettig , M.S., Ph.D. Pacifi c Southwest Research Station , USDA Forest Service , 1731 Research Park Drive , Davis , CA 95618 , USA e-mail: [email protected]
32
numerous interagency and international efforts have been initiated over the past 3 decades to attempt to analyze every aspect of the earth’s climate and to address the adaptation and mitigation options that have the potential to aid in addressing this important challenge. The most well known of these efforts is the Intergovernmental Panel on Climate Change (IPCC), formed by the United Nations in 1988 to help address the scientifi c, economic, and policy aspects of global climate change.
In this chapter, several areas of research will be elucidated that address both the societal and the environmental impacts of climate change. Specifi cally, these are the impacts related to increasing surface temperatures on air quality and forest health. The importance of quality climate datasets is also addressed as it relates to under-standing the observed and predicted changes in surface temperatures at the global, regional, and local scale.
Observations of Changes in Surface Temperature
Previous studies, including both international assessments and independently pub-lished peer-reviewed articles, have demonstrated that surface temperatures have increased globally by approximately 0.7 °C per century since 1900 and 0.16 °C per decade since 1970 [ 2 , 3 ] (Fig. 3.1 ). The slight differences in the estimates of annual means, rankings, and trends in global surface temperatures are the result of differ-ences in the methods used to construct each of the three primary independent datasets that determine surface temperatures spatially across global ocean and land areas [ 4 ]. These three global datasets are those developed and maintained by NASA- GISS [ 5 ], HadCRUT3 [ 6 ], and NOAA-NCDC [ 7 ]. Despite the observed differences that result in variations in annual rankings of global surface temperature, each of these datasets is in close agreement, and all three have identifi ed 2010 as tied for the warmest year or ranked as second warmest in the historical record since 1880 (Table 3.1 ).
Increased occurrences of public health and environmental impacts due to changes in climate over the past several decades have been attributed to rising surface and lower tropospheric temperatures, and these impacts include heat stress and increased occurrence of heat waves, respiratory stress due to degraded air quality conditions, impacts on food safety and water quality, increasing aeroallergens and pollen sources, and the spread of vector-borne diseases [ 8 ]. However, in most cases the impacts are primarily related to increasing extreme temperatures, specifi cally increases in the daily maximum temperature, rising nocturnal temperature, or both [ 3 , 9 , 10 ]. Figure 3.2 shows the global trend in the maximum and minimum tem-perature, along with the diurnal temperature range (DTR) ( T max − T min ) over the period 1950–2004 [ 9 ]. The observed decrease in the DTR is primarily a result of larger increases in the minimum temperature at land-based observing sites. Since the heat-related mortality is correlated primarily by nocturnal temperatures, the increases in minimum temperatures are of widespread concern [ 11 – 13 ].
For most applications related to analyzing regional or local public health and the environmental impacts of climate change, it is important to use those data sources that provide the highest quality information and rigorous quality assurance and
D.H. Levinson and C.J. Fettig
33
Fig. 3.1 Observed trend in annual average surface air temperature (°C per century) over the period 1901–2005 using the NOAA-NCDC Global Blended Dataset [ 71 ] and adapted from Trenberth et al. [ 2 ] (Fig. 3.9 ). Trends signifi cant at the α = 5 % level are indicated by white “ plus ” signs, and grey areas have insuffi cient data to determine statistically reliable trends. Requirements for inclu-sion were a minimum of 66 years needed to calculate a trend value and 10 valid monthly tempera-ture anomaly values needed for inclusion of an individual year (adapted from Trenberth KE, Jones PD, Ambenje P, Bojariu R, Easterling D, Klein Tank A, Parker D, Rahimzadeh F, Renwick JA, Rusticucci M, Soden B, Zhai P (2007) Observations: Surface and Atmospheric Climate Change. In: Climate Change 2007 : The Physical Science Basis . Contribution of Working Group I to the Fourth Assessment Report of the Intergovernmental Panel on Climate Change [Solomon S, Qin D, Manning M, Chen Z, Marquis M, Averyt KB, Tignor M, Miller HL (eds.)]. Cambridge University Press, Cambridge, United Kingdom and New York, NY, USA, with permission)
Table 3.1 The observed differences in annual global temperature anomaly for 2010 and its rank relative to the entire historical record since 1880 for the three primary datasets used to determine global average temperatures
2010 Global anomaly relative to the 1961–1990 annual mean
Rank of 2010 to all years since 1880
HadCRUT3 0.50 °C Second warmest after 1998 NASA-GISS 0.56 °C Tied warmest with 2005 NOAA-NCDC 0.52 °C Tied warmest with 2005
From Sanchez-Lugo A, Kennedy JJ, Berrisford P (2011) Surface temperatures. In “State of the Climate 2010,” Bull Amer Meteor Soc 92:6:S36-S37, with permission
quality control (QA/QC) methods. For surface temperature, that is the NOAA Global Historical Climate Network (GHCN) dataset [ 14 ] and its subset the US Historical Climate Network (USHCN) dataset. NOAA’s GHCN Monthly data (ver-sions 2 and 3) can be accessed at http://www.ncdc.noaa.gov/ghcnm/ , the routinely
3 Climate Change: Overview of Data Sources, Observed and Predicted Temperature…
updated GHCN-Daily dataset can be found online at http://www.ncdc.noaa.gov/oa/climate/ghcn-daily/ , and the USHCN dataset is available at http://cdiac.ornl.gov/epubs/ndp/ushcn/ushcn.html . These high-quality, integrated climate datasets pro-vide the researcher the requisite information regarding the construction, mainte-nance, and historical provenance of data sources that are needed for reliable analysis of observed changes in temperatures at the global, regional, or local scale. To illus-trate the variability of climate changes related to surface temperature, Fig. 3.1 shows the spatial variation in surface temperature trends covering the period from 1901 to 2005; the vast majority of the earth’s surface has warmed since the start of the twen-tieth century, with the largest increases observed at continental mid- to high- latitudes in the Northern Hemisphere. Only a few areas have shown a decreasing trend in
Fig. 3.2 Global annual anomalies of surface maximum ( top ), minimum ( middle ), and diurnal temperature range (DTR, bottom ) in °C, over the period 1950–2004, with the thinner line the annual values and the thicker line showing the smoothed, decadal variations. Anomalies were determined relative to the 1961–1990 mean and averaged over the 71 % of land areas where data were available during the period of record (adapted from Vose RS, Easterling DR, Gleason B (2005) Maximum and minimum temperature trends for the globe: An update through 2004. Geophys Res Lett 32:L23822, with permission)
surface temperatures, and the vast majority of the surface temperature trends (both positive and negative) are statistically signifi cant at the 95 % confi dence level.
Predictions of Changes in Surface Temperature
Despite the well-documented uncertainty in the simulations of future climate condi-tions, associated with different emissions scenarios [ 15 ], it is clear that global tem-peratures will continue to rise due to the increasing radiative effects of greenhouse gases, primarily a result of increases in CO 2 but also increases in other greenhouse gases such as methane (CH 4 ), nitrous oxide (N 2 O), and halocarbons. Based on simu-lations realized from multiple ensembles of global circulation models (GCMs), surface temperatures are predicted to continue to rise over the remainder of the twenty-fi rst century. Predictions from the most recent IPCC report (AR4) include the following statement regarding the magnitude of the change expected: “Continued greenhouse gas emissions at or above current rates will cause further warming, and induce many changes in the global climate system during the twenty-fi rst century that would very likely be larger than those observed during the twentieth century” [ 15 ].
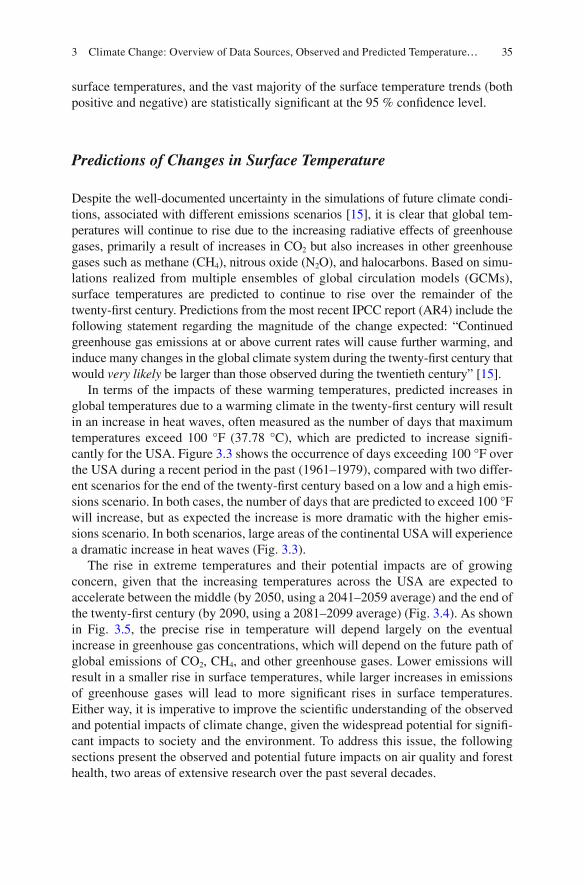
In terms of the impacts of these warming temperatures, predicted increases in global temperatures due to a warming climate in the twenty-fi rst century will result in an increase in heat waves, often measured as the number of days that maximum temperatures exceed 100 °F (37.78 °C), which are predicted to increase signifi -cantly for the USA. Figure 3.3 shows the occurrence of days exceeding 100 °F over the USA during a recent period in the past (1961–1979), compared with two differ-ent scenarios for the end of the twenty-fi rst century based on a low and a high emis-sions scenario. In both cases, the number of days that are predicted to exceed 100 °F will increase, but as expected the increase is more dramatic with the higher emis-sions scenario. In both scenarios, large areas of the continental USA will experience a dramatic increase in heat waves (Fig. 3.3 ).
The rise in extreme temperatures and their potential impacts are of growing concern, given that the increasing temperatures across the USA are expected to accelerate between the middle (by 2050, using a 2041–2059 average) and the end of the twenty-fi rst century (by 2090, using a 2081–2099 average) (Fig. 3.4 ). As shown in Fig. 3.5 , the precise rise in temperature will depend largely on the eventual increase in greenhouse gas concentrations, which will depend on the future path of global emissions of CO 2 , CH 4 , and other greenhouse gases. Lower emissions will result in a smaller rise in surface temperatures, while larger increases in emissions of greenhouse gases will lead to more signifi cant rises in surface temperatures. Either way, it is imperative to improve the scientifi c understanding of the observed and potential impacts of climate change, given the widespread potential for signifi -cant impacts to society and the environment. To address this issue, the following sections present the observed and potential future impacts on air quality and forest health, two areas of extensive research over the past several decades.
3 Climate Change: Overview of Data Sources, Observed and Predicted Temperature…
36
Climate Change and Air Quality
Climate and weather conditions directly impact air pollutants, specifi cally their formation, transport, dispersion, and deposition (both wet and dry). Stagnant weather patterns (i.e., light winds due to the infl uence of surface high-pressure systems and boundary layer inversions) are conducive to the trapping and produc-tion of certain atmospheric pollutants that may lead to elevated concentrations of some pollutants, especially ozone (O 3 ) and particulate matter (PM). Increasing tem-peratures, due to both a warming climate and urban heat island (UHI) effects, have
Fig. 3.3 Projected changes of the US (including Alaska and Hawaii, inset) surface air temperature (in °F) relative to the 1961–1979 base period for two different emissions scenarios: higher ( top ) and lower ( bottom ). Emissions scenarios are based on projections of future temperature by 16 of the Coupled Model Intercomparison Project Three (CMIP3) climate models using two emissions scenarios from the IPCC Special Report on Emissions Scenarios (Nakićenović N, Swart R (eds.) (2000) Special Report on Emissions Scenarios . A special report of Working Group III of the Intergovernmental Panel on Climate Change (IPCC), Cambridge University Press, Cambridge, UK, and New York, NY, USA ( http://www.grida.no/publications/other/ipcc_sr/?src=/climate/ipcc/emission/ )). The “lower” scenario is B1, while the “higher” is the A2 scenario. The brackets on the thermometers represent the likely range of model projections, though lower or higher outcomes are possible (adapted from Karl TR, Melillo JM, Peterson TC (2009) Global Climate Change Impacts in the United States , (eds.) Cambridge University Press, with permission)
Fig. 3.4 Observed and projected increase in the annual number of days with temperature over 100 °F. The recent past 1961–1979 ( top ) shows signifi cantly less days exceeding 100 °F when compared to the end-of- century (2080–2099) period under both the lower and the higher IPCC emissions scenarios (adapted from Karl TR, Melillo JM, Peterson TC (2009) Global Climate Change Impacts in the United States , (eds.) Cambridge University Press, with permission)
3 Climate Change: Overview of Data Sources, Observed and Predicted Temperature…
38
been shown to increase concentrations of ground-level ozone [ 16 ], since it is both naturally occurring and a secondary pollutant formed through photochemical reac-tions of sunlight (solar radiation) with nitrogen oxides (N 2 O) and volatile organic compounds (VOCs). Previous studies have clearly identifi ed that ozone formation is positively correlated with temperature, but formation is primarily related to incom-ing shortwave solar radiation, since concentrations are typically highest during the summer months. However, concentrations are not seasonally dependent in all cities with above normal concentrations of ozone, as exceptions have been noted [ 17 ].
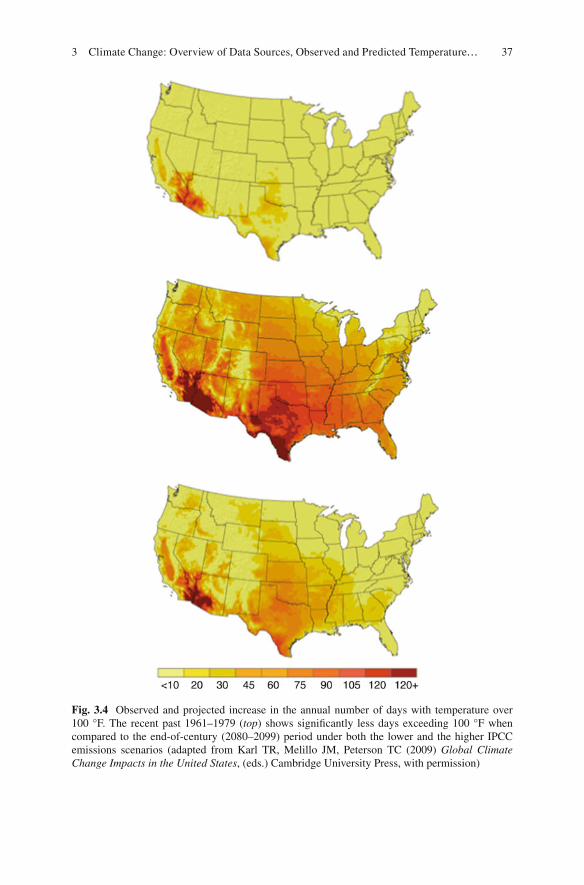
To illustrate the relationship between ground-level ozone concentrations and surface temperatures, Fig. 3.6 shows data from New York, New York, and Atlanta, Georgia. In terms of the overall relationship, measurements from both cities show that most high ozone level days occur when maximum daily temperatures ( T max ) are higher and concentrations systematically decrease with lower temperatures. Both cities have the potential for high concentrations, but the data show that the potential for extremely high ozone concentrations (above 200 ppb) is greater in New York, where ground-level concentrations reached 220 ppb when T max was only 85 °F (29.5 °C). Therefore, the variability of observed daily peak ground-level O 3 concentrations is higher in New York, but the potential for higher concentrations
Fig. 3.5 Observed relationship between daily maximum ground-level ozone concentration (in parts per billion, ppb) and maximum surface temperature (°F) based on measurements from ( top ) Atlanta, GA, and ( bottom ) New York, NY. Data are for the warm season (May to October) covering the period 1988–1990 at each location. The projected higher temperatures across the USA in the twenty-fi rst century are likely to increase the occurrence of high ozone concentrations, although this will also depend on emissions of ozone precursors and meteorological factors that can enhance or suppress ozone formation in the lower troposphere ( http://www.usgcrp.gov/usgcrp/Library/nationalassessment/ )
at lower temperatures is more likely in Atlanta. Similar relationships have been found for Los Angeles, California, Phoenix, Arizona, and other cities with well-documented ground-level ozone concentration issues.
The impact of climate change has also been observed on aeroallergens and their sources, as the observed warming has caused an earlier onset of pollens in the spring in the Northern Hemisphere [ 18 – 20 ]. This is due to both the earlier initiation of pollen production in spring and also the introduction and spread of invasive plant species with highly allergenic pollen, such as ragweed ( Ambrosia artemisiifolia ), which is spreading in several areas of the world [ 21 – 24 ]. Laboratory studies have confi rmed that increasing CO 2 concentrations and surface temperatures increase the production of ragweed pollen and lengthen the pollen season [ 25 – 29 ]. Therefore, the issue of increased length of the pollen season and the production of pollen from a variety of sources is expected to increase concentrations of aeroallergens in the twenty-fi rst century as the climate continues to warm [ 8 ].
Climate Change and Forest Health
Forests cover ~42 million km 2 (~30 %) of the earth’s surface and are found in all regions at elevations and latitudes capable of sustaining tree growth, except where disturbances, whether natural or human-induced, are too frequent and/or too severe
Fig. 3.6 Projected changes in ground-level ozone for the 2090s, averaged over the summer months (June–August) and relative to 1996–2000 under lower and higher emissions scenarios. The scenarios include both greenhouse gases and other emissions that lead to ozone formation, some of which decrease under the lower emissions scenario. By themselves, higher temperatures and other projected climate changes would increase ozone levels under both scenarios. However, future projections of ozone depend heavily on emissions, with the higher emissions scenario increasing ozone by large amounts, while the lower emissions scenario results in an overall decrease in ground-level ozone by the end of the century (adapted from Karl TR, Melillo JM, Peterson TC (2009) Global Climate Change Impacts in the United States , (eds.) Cambridge University Press, with permission)
3 Climate Change: Overview of Data Sources, Observed and Predicted Temperature…
40
to enable establishment. Forests provide immeasurable ecological, economic, and social goods and services to both natural systems and humankind. These include, among others, purifi cation of the air that we breathe; regulation of edaphic formation and control of runoff and soil erosion; provision of fi sh and wildlife habitat; provi-sion of food, medicine, shelter, and water; provision of wood and other forest products; provision of aesthetics, outdoor recreation, and spiritual renewal; and regulation of climate through carbon storage and complex physical, chemical, and biological processes that affect planetary energetics [ 30 ]. In short, forests represent one of the earth’s most important ecosystems and are critical to the health, welfare, and survival of human societies.
Large amounts of CO 2 are released when forests are burned, defoliated, or defor-ested and converted to structures that have relatively small carbon pools. In these cases, forests that were once carbon sinks may become carbon sources [ 31 – 33 ]. Alternatively, healthy forests have the potential to assimilate, accumulate, and sequester large amounts of carbon from the atmosphere, thus reducing one of the primary drivers of climate change. We use “forest health” in the context of ecosystems functioning within their natural range of historic variability. The effects of climate change on forest health include both positive (e.g., increased growth through elevated water use effi ciency and longer growing seasons) and negative impacts (e.g., increased frequency and severity of disturbances). Forest disturbances (storms, wildfi re, herbivory, etc.) are relatively discrete events that affect the structure, composition, and function of forest ecosystems through alterations of the physical environment [ 34 ]. They release growing space, alter nutrient cycling, and affect other key processes essential to the proper functioning of ecosystems [ 35 ].
Schelhass et al. [ 36 ] provided a quantitative overview of the role of natural disturbances in European forests, which they suggested was useful as a basis for modeling the future impacts of climate change by establishing a baseline. They reported storms were responsible for 53 % of the net volume affected over a 40-year period, while biotic factors (e.g., bark beetle outbreaks) contributed 16 %. In the intensively managed forests of Europe and elsewhere (e.g., portions of the USA), natural disturbance cycles have been altered by active management aimed at reduc-ing forest susceptibility to certain types of disturbances. In some cases, human interference in these natural disturbance cycles has later exacerbated their effects. For example, dry forests in portions of the western USA were once dominated by open and parklike stands of widely dispersed trees prior to Euro-American settlement. Frequent thinning of small-diameter and fi re-intolerant tree species by low-intensity surface fi res and competitive exclusion of tree seedlings by under-story grasses are believed to have maintained such conditions. Many of these forests are now denser, have more small trees and fewer large trees, and are dominated by more shade-tolerant and fi re-intolerant tree species, primarily as a result of fi re suppression activities and harvesting practices implemented in the twentieth century. These changes have led to heavy accumulations of forest fuels [ 37 ] that feed severe wildfi res when natural- or human-induced ignitions occur. Today, thinning and prescribed fi re are commonly used to increase the resiliency of forests to wild-fi res (Fig. 3.7 ), which is important given increased wildfi re activity is expected as a
D.H. Levinson and C.J. Fettig
41
consequence of climate change. In particular, a combination of thinning and prescribed fi re has been shown to be highly effective for reducing the severity of wildfi res [ 38 ] and will increase the resiliency of forests to other disturbances imposed on them by climate change [ 39 ].
Climate has always shaped the world’s forests [ 40 ] and minor climatic shifts may have signifi cant effects on community compositions [ 41 ]. Even under conservative scenarios, future climatic changes are likely to include further increases in tempera-ture with signifi cant drying in some regions and increases in the frequency and severity of extreme weather events [ 42 ]. These changes are predicted to further increase the frequency and severity of many other disturbances that shape forest ecosystems. A recent global assessment of forest health reported 88 unique epi-sodes of tree mortality over the last 30 years [ 43 ]. Since then, several additional episodes have been identifi ed [ 44 ]. The common implicated causal factor in these examples is elevated temperatures and/or water stress, raising the possibility that the world’s forests are increasingly responding to ongoing warming and drying attrib-uted to climate change [ 43 ]. While these episodes are well documented, the under-lying causes are complex and uncertain and likely involve numerous predisposing, inciting, and contributing factors [ 45 ]. Reports of climate-induced forest mortality
Fig. 3.7 Current conditions of many seasonally dry forests in the western USA, especially those that once experienced low-to-moderate intensity fi re regimes, leave them uncharacteristically sus-ceptible to high-severity wildfi re. Creating more fi re-resilient stands generally requires treatment of surface and ladder fuels, reductions in crown density, and maintenance of large-diameter trees. A combination of thinning and prescribed burning is commonly used and highly effective when applied within prescription. Most evidence suggests that these treatments are typically accom-plished with few unintended consequences as most ecosystem components (e.g., carbon seques-tration, soils, wildlife) exhibit very subtle impacts or no measurable impacts. Since increased wildfi re activity is expected as a result of climate change and desired treatment effects are tran-sient, forest managers need to be persistent and repeat the application of fuel reduction treatments over time (photo credits: left, C.J. Fettig, and right, S.R. McKelvey, USFS Pacifi c Southwest Research Station)
3 Climate Change: Overview of Data Sources, Observed and Predicted Temperature…
42
are now common in both the popular press and scientifi c journals but are by no means a new phenomenon [ 43 ].
Across North America, temperature increases are projected to exceed global mean increases and more frequent extreme weather events are expected [ 42 ]. Associated changes in precipitation patterns may result in earlier and longer dry seasons across the western USA, with a greater frequency and duration of drought [ 46 ]. It is thought that these changes will signifi cantly affect the condition, compo-sition, distribution, and productivity of multiple ecosystems [ 47 ]. Since tempera-ture increases are expected to be greatest at higher elevations and latitudes, conifers (the predominate vegetation of forests in these areas) are expected to be signifi -cantly affected.
The current distribution of coniferous vegetation across western North America resulted from climatic shifts dating back millions of years [ 48 ], in addition to more recent recolonization of deglaciated lands [ 49 ]. These historical patterns perhaps foreshadow changes to current coniferous vegetation as climate change accelerates. For example, based on the best existing data for 130 tree species in North America and associated climate information, McKenney et al. [ 50 ] predicted that on average the geographic range for a given tree species will decrease by 12 % and shift north-ward 700 km during the twenty-fi rst century. Under a scenario where survival only occurs in areas where anticipated climatic conditions overlap with current climatic conditions, niches for tree survival decrease by 58 % and shift northward 330 km. In terms of tree species, there will be winners (e.g., ponderosa pine) and losers (e.g., Engelmann spruce, Picea engelmannii ) [ 51 ]. By the end of the twenty-fi rst century, others predict that ~48 % of the western USA landscape will experience climate profi les with no contemporary analog for the current coniferous vegetation [ 51 ]. The fate of any tree species will depend on genetic variation, phenotypic variation, fecundity and dispersal mechanisms, and their resilience to a multitude of distur-bances. We consider three major disturbances (i.e., phytophagous insects, forest pathogens, and wildfi re) that will serve as catalysts for much of this change.
Phytophagous insects are major components of forest ecosystems, representing most of the biological diversity and affecting virtually all forest processes and uses. Insects infl uence forest ecosystem structure and function by regulating certain aspects of primary production, nutrient cycling, ecological succession, and the size, distribution, and abundance of forest trees [ 52 – 54 ]. Elevated insect activity reduces tree growth and hastens decline, mortality, and subsequent replacement by other tree species and plant associations. Such effects are often amplifi ed by other natural disturbances. The nature and extent of impacts are dependent upon the resource of concern, type of insect activity, size and distribution of the insect population, and metric used for evaluation [ 55 ]. Climate change is generally thought to increase levels of tree mortality attributed to insects, for example, bark beetles [ 56 ] and defo-liators [ 57 ], but there are exceptions to this trend, for example, larch budworm ( Zeiraphera diniana ) [ 58 ].
In specifi c, bark beetles are commonly recognized as a primary disturbance agent in coniferous forests. Of the hundreds of native species in western North America, few species (<1 %) attack and reproduce in live trees. Frequently referred
D.H. Levinson and C.J. Fettig
43
to as “aggressive” bark beetles, these species can kill healthy trees and have the capacity to cause landscape-scale tree mortality. The last decade has seen elevated levels of tree mortality attributed to bark beetle outbreaks in spruce forests of south- central Alaska and the Rocky Mountains, lodgepole pine ( P . contorta ) forests of western Canada and the Rocky Mountains, pinyon-juniper woodlands of the south-western USA, and ponderosa pine forests of Arizona, California, and South Dakota [ 59 ]. Because bark beetles, like many insects, are highly sensitive to thermal condi-tions conducive to population survival and growth, and water stress can infl uence host tree vigor, outbreaks have been correlated with shifts in temperature [ 60 ] and precipitation [ 61 ]. The life histories and ecological roles of the majority of bark beetle associates are not well understood, hampering full comprehension of the con-sequences of climate change on bark beetle population dynamics. However, Bentz et al. [ 56 ] predicted increases in thermal regimes conducive to population success for two economically important species, spruce beetle ( Dendroctonus rufi pennis ) and mountain pine beetle ( D . ponderosae ), although there was considerable spatial and temporal variability in their predictions. These suggested a northward and upward in elevation movement of temperature suitability and identifi cation of regions with a high potential for bark beetle outbreaks and associated levels of tree mortality in the twenty-fi rst century. Evangelista et al. [ 62 ] predicted that suitable habitats for the mountain pine beetle and pine engraver ( Ips pini ) will stabilize or decrease under future climate conditions, while habitats for the western pine beetle ( D . brevicomis ) will increase (Fig. 3.8 ). Their work represents an estimate of poten-tial distribution and not specifi c impacts to forest health.
As with phytophagous insects, outbreaks of forest diseases caused by native and introduced forest pathogens are generally predicted to become more frequent and severe as a result of climate change [ 63 ]. However, diseases caused by pathogens directly affected by climate (e.g., needle blights) are predicted to have a reduced impact under warmer and drier conditions. These groups of pathogens may cause disease in healthy hosts if the pathogen’s environmental requirements are met, many of which require moist conditions [ 64 ]. Forest diseases caused by pathogens indi-rectly affected by climate (e.g., root diseases) are generally predicted to have an increased impact [ 63 ]. While the ability of these pathogens to spread and infect new hosts is affected by moisture, factors associated with climate change that stress their hosts are generally considered to be more important to host invasion. Models fre-quently predict a reduction in the potential geographic distribution of forest diseases as a result of climate change [ 63 , 65 ].
Increased wildfi re activity is also expected as a result of climate change. In the western USA, increases in wildfi re frequency have been well documented since the mid-1980s and concentrated between 1680 and 2590 m in elevation [ 66 ]. Wildfi res at these elevations have been episodic, occurring during warm years and strongly associated with changes in spring snowmelt timing, which in turn is sensitive to changes in temperature [ 66 ] and precipitation. As a result, concerns regarding air quality (as discussed earlier), human safety, and protection of critical infrastructure are important, especially in the wild land urban interface where the presence of housing developments increases the cost and complexity of implementing fuel
3 Climate Change: Overview of Data Sources, Observed and Predicted Temperature…
44
reduction treatments to reduce fi re risk (Fig. 3.7 ). Increases in wildfi re activity are likely to magnify other threats to forest health. While in many cases it is recognized that bark beetle outbreaks and wildfi re will serve as the catalyst for much of the ecological change to be associated with climate change in coniferous forests, few studies have thoroughly examined the interactions between these disturbances until recently [ 67 ]. There is evidence that bark beetle outbreaks and associated levels of tree mortality affect subsequent fi re risk and severity in some forest types.
Rapid and broad-scale tree mortality events can have long-term impacts to both forest health [ 43 ] and human health [ 68 ] with feedbacks that further infl uence cli-mate and land use [ 33 , 69 ]. Complex interactions must be considered at numerous scales (e.g., from tree to forest to global scales) and on various aspects of the life histories of the numerous species that comprise these ecosystems. For example, the recent loss of whitebark pine ( P . albicaulis ) stands due to mountain pine beetle underscores the need for a greater understanding of climate change effects on com-plex interactions important to ecosystem resiliency and stability (Fig. 3.9 ). Characterizing thresholds for systems beyond which such changes are irreversible
Fig. 3.8 The western pine beetle ( Dendroctonus brevicomis ) is a primary disturbance agent in ponderosa pine ( Pinus ponderosa ) forests. Unlike many other bark beetles, western pine beetle is unique in that it has a very narrow host range. The only other common host is Coulter pine ( P . coulteri ), a species indigenous to the mountains of southern California, USA, and northern Baja California, Mexico. In the early 2000s, the mountain ranges of southern California started to experience elevated levels of tree mortality. Most experts attributed this mortality to drought (i.e., precipitation was the lowest in recorded history during 2001–2002) and elevated populations of bark beetles, specifi cally western pine beetle. Mortality was dispersed across >259,000 ha by 2004 and concentrated in several tree species, most notably ponderosa and Coulter pines. Signifi cant mortality occurred in other plant associations as well. The resultant western pine beetle outbreak that occurred during 2001–2004 is considered by many experts to be the largest in recorded history for this species of bark beetle. In some areas, tree mortality was >80 %. Climate change is gener-ally thought to increase levels of tree mortality attributed to insects. Western pine beetle is unique in that the range of its primary host is expected to increase as a result of climate change. The spe-cies is likely to become a more important disturbance agent in the future (photo credits: C.J. Fettig, USFS Pacifi c Southwest Research Station)
D.H. Levinson and C.J. Fettig
45
is important. There are tools available to restore forest health and to increase the resiliency of forests to disturbances [ 39 , 54 ]. Resource managers can intervene and mitigate some of the effects of climate change [ 70 ]. Uncertainty is inherent, but it is clear that healthy forests have a vital role to play in combating climate change.
References
1. Rosenzweig C, Casassa G, Imeson A, Karoly DJ, Liu C, Menzel A, Rawlins S, Root TL, Seguin B, Tryjanowski P. Assessment of observed changes and responses in natural and man-aged systems. In: Parry ML, Canziani OF, Palutikof JP, van der Linden PJ, Hanson CE, editors. Climate change 2007: impacts, adaptation and vulnerability contribution of Working Group II to the Fourth Assessment Report of the Intergovernmental Panel on Climate Change. Cambridge: Cambridge University Press; 2007. p. 79–131.
2. Trenberth KE, Jones PD, Ambenje P, Bojariu R, Easterling D, Klein Tank A, Parker D, Rahimzadeh F, Renwick JA, Rusticucci M, Soden B, Zhai P. Observations: surface and atmo-spheric climate change. In: Solomon S, Qin D, Manning M, Chen Z, Marquis M, Averyt KB, Tignor M, Miller HL, editors. Climate change 2007: the physical science basis. Contribution of Working Group I to the Fourth Assessment Report of the Intergovernmental Panel on Climate Change. Cambridge: Cambridge University Press; 2007.
Fig. 3.9 In western North America, recent outbreaks of mountain pine beetle ( Dendroctonus ponderosae ) have been severe, long lasting, and well documented. Since 2001, >25 million ha of lodgepole pine ( Pinus contorta ) forest have been impacted. The species ranges throughout British Columbia and Alberta, Canada, most of the western USA, into northern Mexico, and colonizes several pine species, most notably, lodgepole pine, ponderosa pine ( Pinus ponderosa ), sugar pine ( P . lambertiana ), limber pine ( P . fl exilis ), western white pine ( P . monticola ), and whitebark pine ( P . albicaulis ). Episodic outbreaks are a common occurrence, but the magnitude of recent outbreaks have exceeded the range of historic variability and have occurred in areas where moun-tain pine beetle outbreaks were once rare and of limited scale (e.g., whitebark pine forests) or previously unrecorded (e.g., jack pine forests ( P . banksiana ) in Canada). Several scientists specu-late that under continued warming the loss of whitebark pine, and the unique ecological services that this species provides, is imminent in many areas. The US Fish and Wildlife Service announced in 2011 that it determined whitebark pine warranted protection under the Endangered Species Act but that adding the species to the Federal List of Endangered and Threatened Wildlife and Plants was precluded by the need to address other listing actions of higher priority (photo credits: left, C.J. Fettig, and right, C.J. Hayes, USFS Pacifi c Southwest Research Station)
3 Climate Change: Overview of Data Sources, Observed and Predicted Temperature…
46
3. Karl TR, Melillo JM, Peterson TC, editors. Global climate change impacts in the United States. New York: Cambridge University Press; 2009. p. 188.
4. Sanchez-Lugo A, Kennedy JJ, Berrisford P. Surface temperatures. In: State of the climate 2010. Bull Amer Meteor Soc. 2011;92:6:S36–7.
5. Hansen J, Ruedy R, Sato M, Lo K. Global surface temperature change. Rev Geophys. 2010;48, RG4004.
6. Brohan P, Kennedy JJ, Harris I, Tett SFB, Jones PD. Uncertainty estimates in regional and global observed temperature changes: a new data set from 1850. J Geophys Res. 2006;111, D12106.
7. Smith TM, Peterson TC, Lawrimore J. Improvements to NOAA’s historical merged land-ocean surface temperature analyses (1880–2006). J Climate. 2008;21:2283–96.
8. Confalonieri U, Menne B, Akhtar R, Ebi KL, Hauengue M, Kovats RS, Revich B, Woodward A. Human health. In: Parry ML, Canziani OF, Palutikof JP, van der Linden PJ, Hanson CE, editors. Climate change 2007: impacts, adaptation and vulnerability. Contribution of Working Group II to the Fourth Assessment Report of the Intergovernmental Panel on Climate Change. Cambridge: Cambridge University Press; 2007. p. 391–431.
9. Vose RS, Easterling DR, Gleason B. Maximum and minimum temperature trends for the globe: an update through 2004. Geophys Res Lett. 2005;32, L23822.
10. Kunkel KE, Bromirski PD, Brooks HE, Cavazos T, Douglas AV, Easterling DR, Emanuel KA, Groisman PYa, Holland GJ, Knutson TR, Kossin JP, Komar PD, Levinson DH, Smith RL. Observed changes in weather and climate extremes. In: Karl TR, Meehl GA, Miller CD, Hassol SJ, Waple AM, Murray WL, editors. Weather and climate extremes in a changing cli-mate. Regions of focus: North America, Hawaii, Caribbean, and U.S. Pacifi c Islands. A report by the US Climate Change Science Program and the Subcommittee on Global Change Research, Washington, DC; 2008.
11. Davis R, Knappenberger P, Novicoff W, Michaels P. Decadal changes in heat related human mortality in the eastern United States. Climate Res. 2002;22:175–84.
12. Davis R, Knappenberger P, Michaels P, Novicoff W. Changing heat related mortality in the United States. Environ Health Perspect. 2003;111:1712–8.
13. Davis R, Knappenberger P, Michaels P, Novicoff W. Seasonality of climate-human mortality relationships in US cities and impacts of climate change. Climate Res. 2004;26:61–76.
14. Menne MJ, Williams CN, Vose RS. The U.S. Historical Climatology Network monthly tem-perature data, version 2. Bull Amer Meteor Soc. 2009;90:993–1007.
15. Meehl GA, Stocker TF, Collins WD, Friedlingstein P, Gaye AT, Gregory JM, Kitoh A, Knutti R, Murphy JM, Noda A, Raper SCB, Watterson IG, Weaver AJ, Zhao Z-C. Global climate projections. In: Solomon S, Qin D, Manning M, Chen Z, Marquis M, Averyt KB, Tignor M, Miller HL, editors. Climate change 2007: the physical science basis. Contribution of Working Group I to the Fourth Assessment Report of the Intergovernmental Panel on Climate Change. Cambridge: Cambridge University Press; 2007.
16. Morris CJG, Simmonds I. Associations between varying magnitudes of the urban heat island and the synoptic climatology in Melbourne, Australia. Int J Climatol. 2000;20:1931–54.
17. Bates DV. Ambient ozone and mortality. Epidemiology. 2005;16:427–9. 18. D’Amato G, Liccardi G, D’Amato M, Cazzola M. Outdoor air pollution, climatic changes and
allergic bronchial asthma. Eur Respir J. 2002;20:763–76. 19. Weber RW. Mother nature strikes back: global warming, homeostasis, and implications for
allergy. Ann Allergy Asthma Immunol. 2002;88:251–2. 20. Beggs PJ. Impacts of climate change on aeroallergens: past and future. Clin Exp Allergy.
2004;34:1507–13. 21. Rybnicek O, Jaeger S. Ambrosia (ragweed) in Europe. ACI International. 2001;13:60–6. 22. Huynen M, Menne B. Phenology and human health: allergic disorders. Report of a WHO
meeting in Rome, Italy, 16–17 Jan 2003. Health and Global Environmental Series EUR/03/5036791. Copenhagen: World Health Organization; 2003. p. 64.
23. Taramarcaz P, Lambelet B, Clot B, Keimer C, Hauser C. Ragweed (Ambrosia) progression and its health risks: will Switzerland resist this invasion? Swiss Med Wkly. 2005;135:538–48.
D.H. Levinson and C.J. Fettig
47
24. Cecchi L, Morabito M, Domeneghetti P, Crisci MA, Onorari M, Orlandini S. Long distance transport of ragweed pollen as a potential cause of allergy in central Italy. Ann Allergy Asthma Immunol. 2006;96:86–91.
25. Wan SQ, Yuan T, Bowdish S, Wallace L, Russell SD, Luo YQ. Response of an allergenic spe-cies Ambrosia psilostachya (Asteraceae), to experimental warming and clipping: implications for public health. Am J Bot. 2002;89:1843–6.
26. Wayne P, Foster S, Connolly J, Bazzaz F, Epstein P. Production of allergenic pollen by ragweed ( Ambrosia artemisiifolia L.) is increased in CO 2 -enriched atmospheres. Ann Allergy Asthma Immunol. 2002;88:279–82.
27. Singer BD, Ziska LH, Frenz DA, Gebhard DE, Straka JG. Increasing Amb a 1 content in com-mon ragweed (Ambrosia artemisiifolia) pollen as a function of rising atmospheric CO 2 con-centration. Funct Plant Biol. 2005;32:667–70.
28. Ziska LH, Emche SD, Johnson EL, George K, Reed DR, Sicher RC. Alterations in the produc-tion and concentration of selected alkaloids as a function of rising atmospheric carbon dioxide and air temperature: implications for ethno-pharmacology. Glob Chang Biol. 2005;11:1798–807.
29. Rogers C, Wayne P, Macklin E, Muilenberg M, Wagner C, Epstein P, Bazzaz F. Interaction of the onset of spring and elevated atmospheric CO2 on ragweed ( Ambrosia artemisiifolia L.) pollen production. Environ Health Perspect. 2006;114:865–9.
30. Bonan GD. Forests and climate change: forcings, feedbacks, and the climate benefi ts of for-ests. Science. 2009;320:1444–9.
31. Kurz WA, Apps MJ, Stocks BJ, Volney WJ. Global climate change: disturbance regimes and biospheric feedbacks of temperate and boreal forests. In: Woodwell GM, Mackenzie FT, edi-tors. Biotic feedbacks in the global climatic system: will the warming feed the warming? Oxford: Oxford University Press; 1995.
32. Stocks BJ, Lee BS, Martell DL. Some potential carbon budget implications of fi re manage-ment in the boreal forest. In: Apps MJ, Price DT, editors. Forest ecosystems, forest manage-ment and the global carbon cycle. Berlin: Springer; 1996.
33. Kurz WA, Dymond CC, Stinson G, Rampley GJ, Neilson ET, Carroll AL, Ebata T, Safranyik L. Mountain pine beetle and forest carbon feedback to climate change. Nature. 2008;452:987–90.
34. White PS, Pickett STA. The ecology of natural disturbance and patch dynamics. Orlando: Academic; 1985.
35. Folke C, Carpenter S, Walker B, Scheffer M, Elmqvist T, Gunderson L, Holling CS. Regime shifts, resilience, and biodiversity in ecosystem management. Ann Rev Ecol Evol Syst. 2004;35:557–81.
36. Schelhass MJ, Nabuurs GJ, Schuck A. Natural disturbances in the European forests in the 19th and 20th centuries. Glob Chang Biol. 2003;9:1620–33.
37. Youngblood A, Max T, Coe K. Stand structure in eastside old-growth ponderosa pine forests of Oregon and northern California. For Ecol Manage. 2004;199:191–217.
38. Ritchie MW, Skinner CN, Hamilton TA. Probability of tree survival after wildfi re in an interior pine forest of northern California: effects of thinning and prescribed fi re. For Ecol Manage. 2007;247:200–8.
39. Stephens SL, McIver JD, Boerner REJ, Fettig CJ, Fontaine JB, Hartsough BR, Kennedy P, Schwilk DW. Effects of forest fuel reduction treatments in the United States. Bioscience. 2012;62:549–60.
41. Shugart HH. A theory of forest dynamics: the ecological implications of forest succession models. New York, NY: Springer; 2003.
42. IPCC. Climate change 2007: the physical science basis. In: Solomon S, Qin D, Manning M, Chen Z, Marquis M, Averyt KB, Tignor M, Miller HL, editors. Contribution of Working Group I to the Fourth Assessment Report of the Intergovernmental Panel on Climate Change. Cambridge: Cambridge University Press; 2007.
3 Climate Change: Overview of Data Sources, Observed and Predicted Temperature…
48
43. Allen CD, Macalady AK, Chenchouni H, Bachelet D, McDowell N, Vennetier M, Kitzberger T, Rigling A, Breshears DD, Hogg EH, Gonzalez P, Fensham R, Zhangm Z, Castro J, Demidova N, Lim JH, Allard G, Running SW, Semerci A, Cobb N. A global overview of drought and heat-induced tree mortality reveals emerging climate change risks for forests. For Ecol Manage. 2010;259:660–84.
44. Martinez-Vilata J, Lloret F, Breshears DD. Drought-induced forest decline: causes, scope and implications. Biol Lett. 2012;8:689–91.
45. Manion PD. Tree disease concepts. Englewood Cliffs, NJ: Prentice-Hall; 1981. 46. Seager R, Ting M, Held I, Kushnir Y, Lu J, Vecchi G, Huang HP, Harnik N, Leetmaa A, Lau
NC, Li C, Velez J, Naik N. Model projections of an imminent transition to a more arid climate in southwestern North America. Science. 2007;316:1181–4.
47. Easterling DR, Meehl GA, Parmesan C, Changnon SA, Karl TR, Mearns LO. Climate extremes: observations, modeling, and impacts. Science. 2000;289:2068–74.
48. Brunsfeld SJ, Sullivan J, Soltis DE, Soltis PS. Comparative phylogeography of northwestern North America: a synthesis. In: Antonovics J, Silvertown J, editors. Integrating ecology and evolution in a spatial context. Wiliston, VT: Blackwell; 2001.
49. Godbout J, Fazekas A, Newton CH, Yeh FC. Glacial vicariance in the Pacifi c Northwest: evi-dence from a lodgepole pine mitochondrial DNA minisatellite for multiple genetically distinct and widely separated refugia. Mol Ecol. 2008;17:2463–75.
50. McKenney DW, Pedlar JH, Lawrence K, Campbell K, Hutchinson MF. Potential impacts of climate change on the distribution of North American trees. Bioscience. 2007;57:939–48.
51. Rehfeldt GE, Crookston NL, Warwell MV, Evans JS. Empirical analyses of plant-climate rela-tionships for the western United States. Int J Plant Sci. 2006;167:1123–50.
52. Mattson Jr WJ, Addy ND. Phytophagous insects as regulators of forest primary production. Science. 1975;90:515–22.
53. Schowalter TD. Insect herbivore relationship to the state of the host plant: biotic regulation of ecosystem nutrient cycling through ecological succession. Oikos. 1981;37:126–30.
54. Fettig CJ, Klepzig KD, Billings RF, Munson AS, Nebeker TE, Negrón JF, Nowak JT. The effectiveness of vegetation management practices for prevention and control of bark beetle infestations in coniferous forests of the western and southern United States. For Ecol Manage. 2007;238:24–53.
55. Coulson RN, Stephen FM. Impacts of insects in forest landscapes: implications for forest health management. In: Payne TD, editor. Invasive forest insects, introduced forest trees, and altered ecosystems: ecological pest management in global forests of a changing world. New York: Springer; 2006.
56. Bentz BJ, Régnière J, Fettig CJ, Hansen EM, Hayes JL, Hicke JA, Kelsey RG, Lundquist J, Negrón JF, Seybold SJ. Climate change and bark beetles of the western United States and Canada: direct and indirect effects. Bioscience. 2010;60:602–13.
57. Carnicera J, Colla M, Ninyerolac M, Pons X, Sánchez G, Peñuelasa J. Widespread crown condition decline, food web disruption, and amplifi ed tree mortality with increased climate change-type drought. Proc Natl Acad Sci USA. 2011;108:1474–8.
58. Büntgen U, Frank D, Liebhold A, Johnson D, Carrer M, Urbinati C, Grabner M, Nicolussi K, Levanic T, Esper J. Three centuries of insect outbreaks across the European Alps. New Phytol. 2009;182:929–41.
59. Bentz BJ, Allen CD, Ayres M, Berg E, Carroll A, Hansen M, Hicke J, Joyce L, Logan J, MacFarlane W, MacMahon J, Munson AS, Negrón JF, Paine TD, Powell J, Raffa KF, Régnière J, Reid M, Romme W, Seybold SJ, Six DL, Tomback D, Vandygriff J, Veblen T, White M, Witcosky J, Wood DL. Bark beetle outbreaks in western North America: causes and conse-quences. Salt Lake City: University of Utah Press; 2009.
60. Powell JA, Logan JA. Insect seasonality-circle map analysis of temperature-driven life cycles. Theor Popul Biol. 2005;67:161–79.
61. Berg EE, Henry JD, Fastie CL, De Volder AD, Matsuoka SM. Spruce beetle outbreaks on the Kenai Peninsula, Alaska, and Kluane National Park and Reserve, Yukon Territory: relationship
D.H. Levinson and C.J. Fettig
49
to summer temperatures and regional differences in disturbance regimes. For Ecol Manage. 2006;227:219–32.
62. Evangelista PH, Kumar S, Stohlgren TJ, Young NE. Assessing forest vulnerability and the potential distribution of pine beetles under current and future climate scenarios in the Interior West of the US. For Ecol Manage. 2011;262:307–16.
63. Sturrock RN, Frankel SJ, Brown AV, Hennon PE, Kliejunas JT, Lewis KJ, Worrall JJ, Woods AJ. Climate change and forest diseases. Plant Pathol. 2011;60:133–49.
64. Sinclair WA, Lyon HH, Johnson WT. Diseases of trees and shrubs. Ithaca: Cornell University Press; 1987.
65. Venette RC. Implication of global climate change on the distribution and activity of Phytophthora ramorum . In: McManus KA, Gottschalk KW, editors. Proceedings of the 20th U.S. Department of Agriculture Interagency Research Forum on Invasive Species 2009. NRS-P- 51, 58–9. Newtown Square, PA: U.S. Department of Agriculture, Forest Service, Northern Research Station; 2009.
66. Westerling AL, Hidalgo HG, Cayan DR, Swetnam TW. Warming and earlier spring increase western U.S. forest wildfi re activity. Science. 2006;313:940–3.
67. Jenkins MJ, Hebertson E, Page W, Jorgensen CA. Bark beetles, fuels, fi res and implications for forest management in the Intermountain West. For Ecol Manage. 2008;254:16–34.
68. Allan BF, Keesing F, Ostfeld R. Effect of forest fragmentation on Lyme disease risk. Conserv Biol. 2003;17:267–72.
69. McDowell NG, Pockman WT, Allen C, Breshears DD, Cobb N, Kolb T, Plaut J, Sperry J, West A, Williams D, Yepez EA. Mechanisms of plant survival and mortality during drought: why do some plants survive while others succumb to drought? New Phytol. 2008;178:719–39.
70. Peterson DL, Millar CI, Joyce LA, Furniss MJ, Haolosky JE, Neilson RP, Morelli TL. Responding to climate change on national forests: a guidebook for developing adaptation options. PNW-GTR-855. Portland, OR: US Department of Agriculture, Forest Service, Pacifi c Northwest Research Station; 2011.
71. Smith TM, Reynolds RW. A global merged land–air–sea surface temperature reconstruction based on historical observations (1880–1997). Journal of Climate, 2005; 18: 2021–36 (doi: http://dx.doi.org/10.1175/JCLI3362.1 ).
3 Climate Change: Overview of Data Sources, Observed and Predicted Temperature…