MISCELLANEOUS PAPER S-68-15 COMPACTION OF COHESIONLESS MATERIALS by 4 J. R. Compton W. E. Strohm, Jr. August 1968 Sponsored by Office, Chief of Engineers U. S. Army Conducted by U. S. Army Engineer Waterways Experiment Station CORPS OF: ENGINEERS Vicksburg, Mississippi ANMY.MRC VICKSBURG. MIS. nf wwagwoppma flae
Transcript
MISCELLANEOUS PAPER S-68-15
COMPACTION OF COHESIONLESSMATERIALS
by
4 J. R. ComptonW. E. Strohm, Jr.
August 1968
Sponsored by
Office, Chief of Engineers
U. S. Army
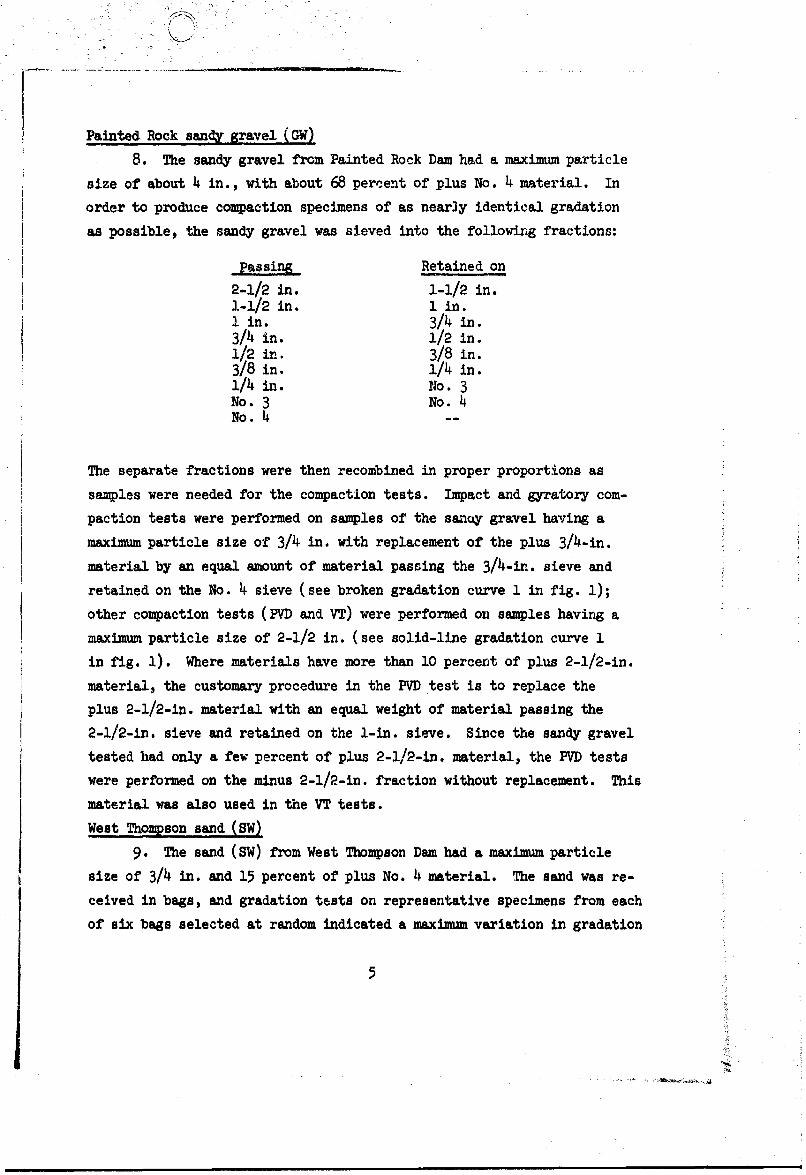
Conducted by
U. S. Army Engineer Waterways Experiment StationCORPS OF: ENGINEERS
Vicksburg, Mississippi
ANMY.MRC VICKSBURG. MIS.
nf wwagwoppma flae
Unclassified
DOCUMENT CONTROL DATA.- R &D
1. ORIGINIATtIw ACTIllY fOP~eft on") 'at. .. aw aacaImURI CLAmulCAlaON
U. S. Army Engineer Waterways Experiment Station 1 UnclassificdVicksburg, Mi-sissippi 1*06 sem-i
2. UP@UIT TSTLIL
COM.PACTION OF COHSIO1NLESS M4PTERIAIB
Final reprt kt~
Joseph R. ComptonWililim E. Strohm, Jr.
0. 049FUT DATE TA. TOTAL NO. OPPAt 11WI Or *a"UAugust 1968 592
COUTRACT OlRNaT NO. Sa ORIONATORI RUPORT NMM"MW
~. OJCT ~Miscellaneous Paper S-68-15
W0 OTN= RPORT now~ ie m ow to In m u
I O T TIOM STATtaEMT
E t mit 'adoc outside he es of '0
%I. suIp 7aEMYANT MOTtO1 12. &POMUORIMO MILITARY ACTIVITY
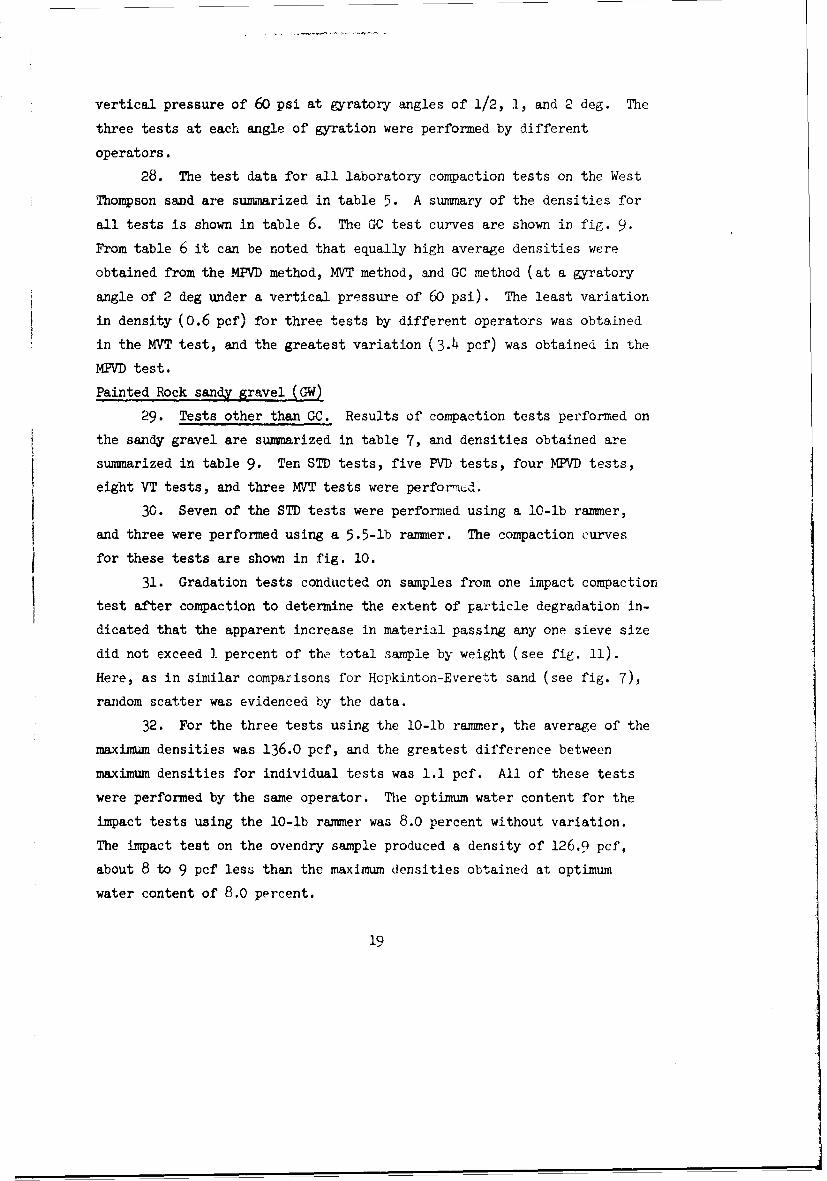
Office, Chief of Engineers, U. S. ArmyWashington, D. C.
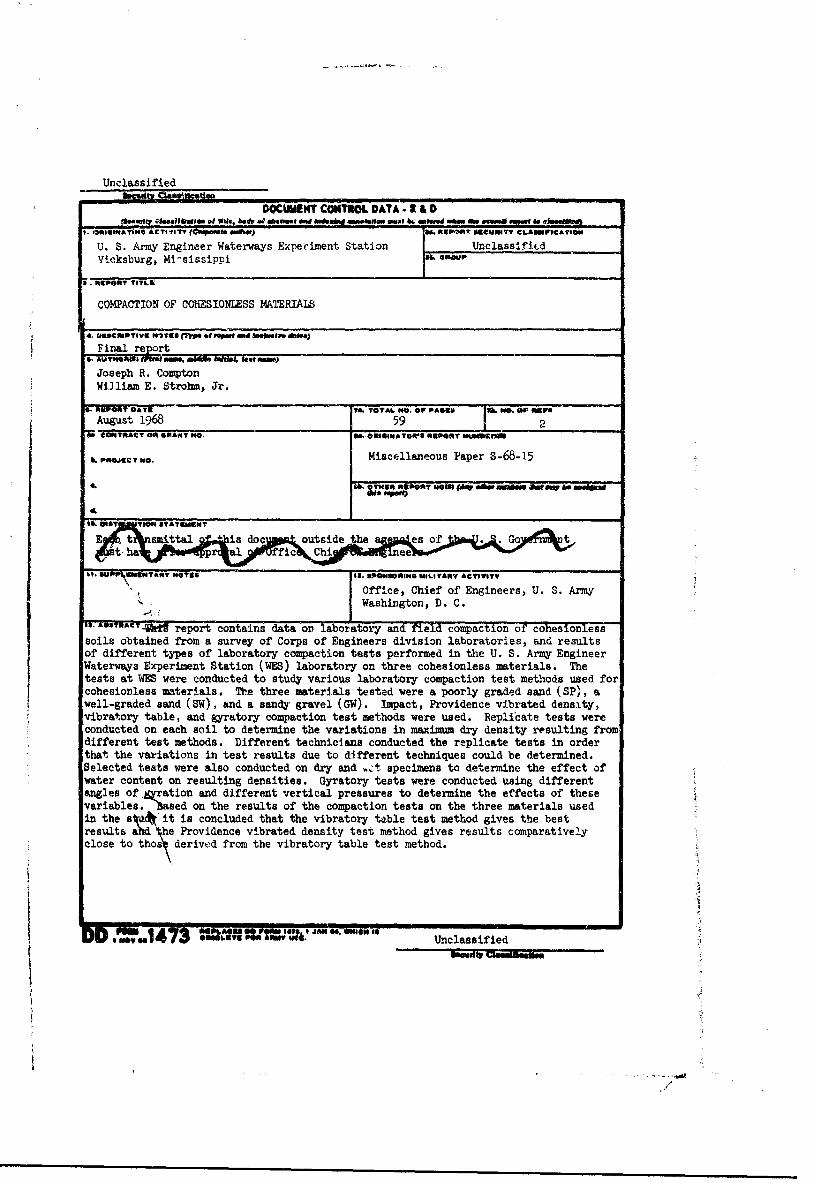
IS 1=9AC~~ report contains data or) laboratory and field compaction of cohesionlesssoils obtained from a survey of Corps of Engineers division laboratories, and resultsof different types of laboratory compaction tests performed in the U. S. Army EngineerWaterways Experiment Station (WES) laboratory on three cohesionless materials. Thetests at WES were conducted to study various laboratory compaction test methods used for
1cohesionless materials.* The three materials tested were a poorly graded sand (SP), awell-graded sand (SW), and a sandy gravel (GW). Impact, Providence vibrated density,vibratory table, and gyratory compaction test methods were used. Replicate tests wereconducted on each soil to determine the variations in maxiam dry density resulting fromdifferent test methods. Different technicians conducted the replicate tests in orderthat the variations in test results due to different techniques could be determined.Selected tests were also conducted on dry and z.t specimens to determine the effect ofwater content on resulting densities. Gyratory tests were conducted using differentangles of,~cvration and different vertical pressures to determine the effects of thesevariables. 'Based on the results of the compaction tests on the three materials usedin the s A'it is concluded that the vibratory table test method gives the bestresults &Wd he Providence vibrated density test method gives results comparativelyclose to thos derived from the vibratory table test method.
DO$ =V"4. 0*12llW0 1.0 Unclassified
Unclassified
Kii 4.M LINK a LINK * LINK C
MOE~. wy OLE OT POLI WT
Cohesionless soils
Soils.--compaction
Unclassified
. RE.WORD
The investigation reported herein was authorized by letter from the
Office, (hief of Engin,'ers (ENGWE), dated 2 March 1959, subject: Proposed
Civil Works Tnvestigation Program - FY 1960.
The investigation was initiated during FY 1960. During the period
FY 1959-FY 1961, a survey was wade of Corps division laboratories to obtain
information concerning current compaction procedures for cohesionless
soils. Laboratory compaction tests were performed in the U. S. Army Engi-
neer Waterways Experiment Station (WES) laboratory on two soils (a poorly
graded sand (SP), and a sandy gravel (GW)) during the period FY 1960-
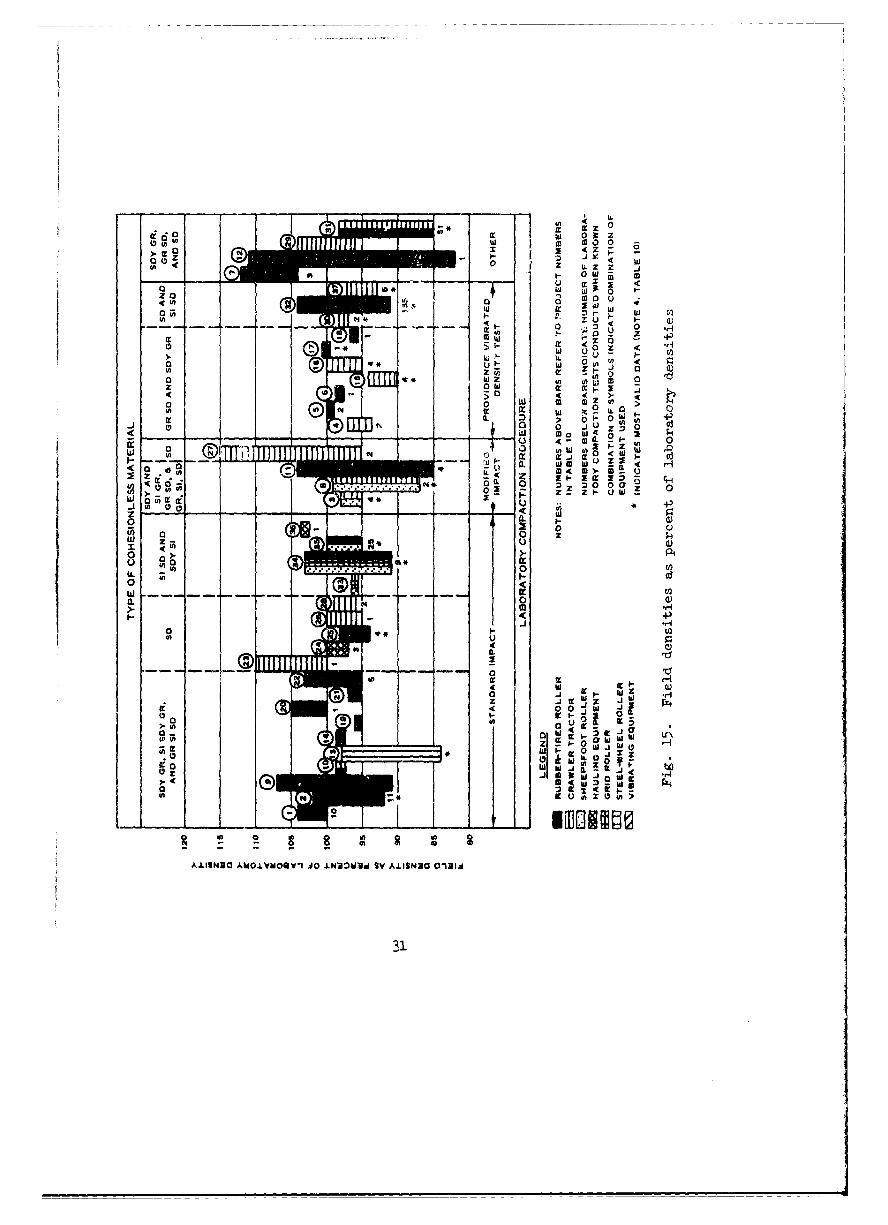
FY 1964. Interim reports of the test results were prepared in FY 1963
and FY 1964. Additional laboratory compaction tests were performed on
a third soil, a well-graded sand (SW), in FY 1965.
This investigation was conducted under the general direction of
Messrs. W. J. Turnbull, W. G. Shockley, A. A. Maxwell, J. R. Compton, and
R. W. Cunny.
Principal engineers conducting the investigation and analyzing
results were Messrs. R. C. Sloan and W. E. Strohm, Jr. This report was
prepared by Messrs. Compton and Strohm.
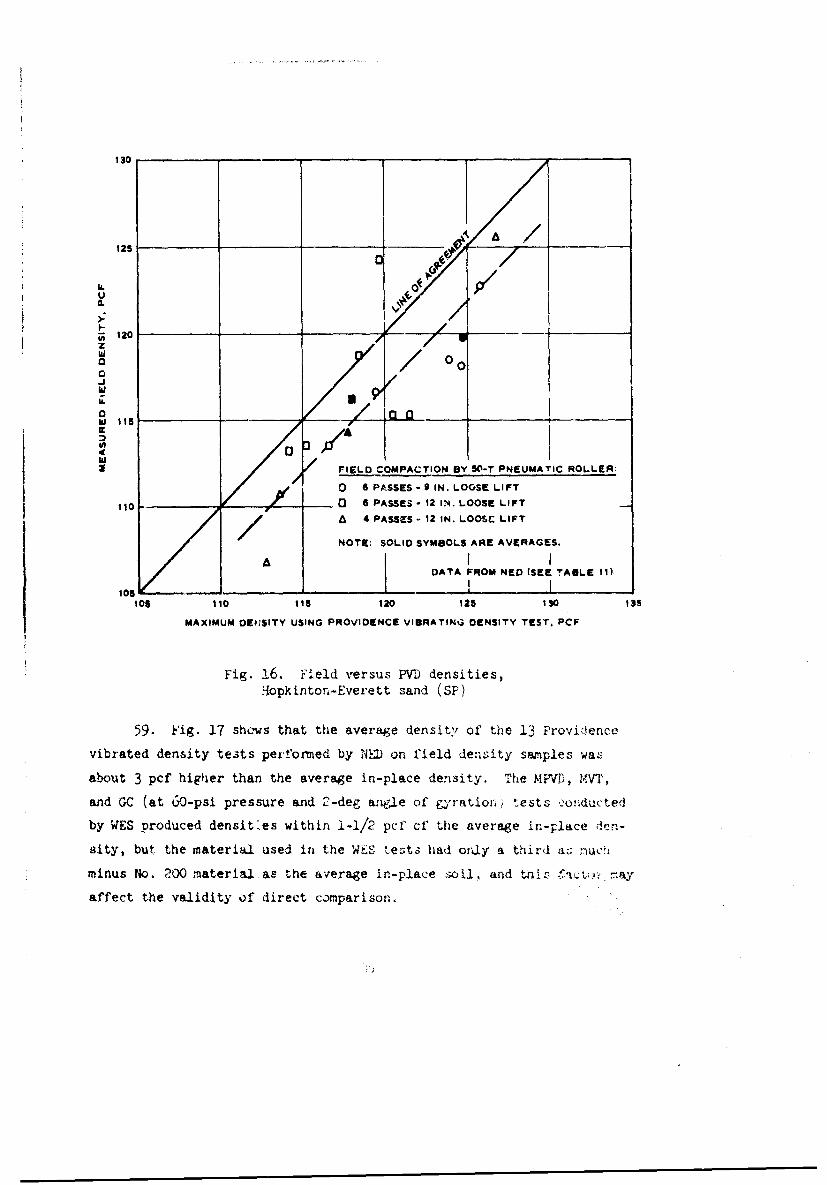
Directors of the WES during the preparation and publication of
this report were COL Edmund H. Lang, CE; COL Alex G. Sutton, Jr., CE;
COL John R. Oswalt, Jr., CE; and COL Levi A. Brown, CE. Technical
Director was Mr. J. B. Tiffany.
iii
CONTENTS
Page
FOPEWORD . . . . . . . . . . . . . . . . . . ii
CONVERSION FACTORS, BRITISH TO METRIC UNITS OF MEASUREMENT . . . . viiSUMMARY . .. .. .. .. .. .. .. .. .. .. .. .. .. . .. ix
PART IV: CONCLUSIONS AND RECOMMENDATIONS. . ............ .
TABLES 1-13
V
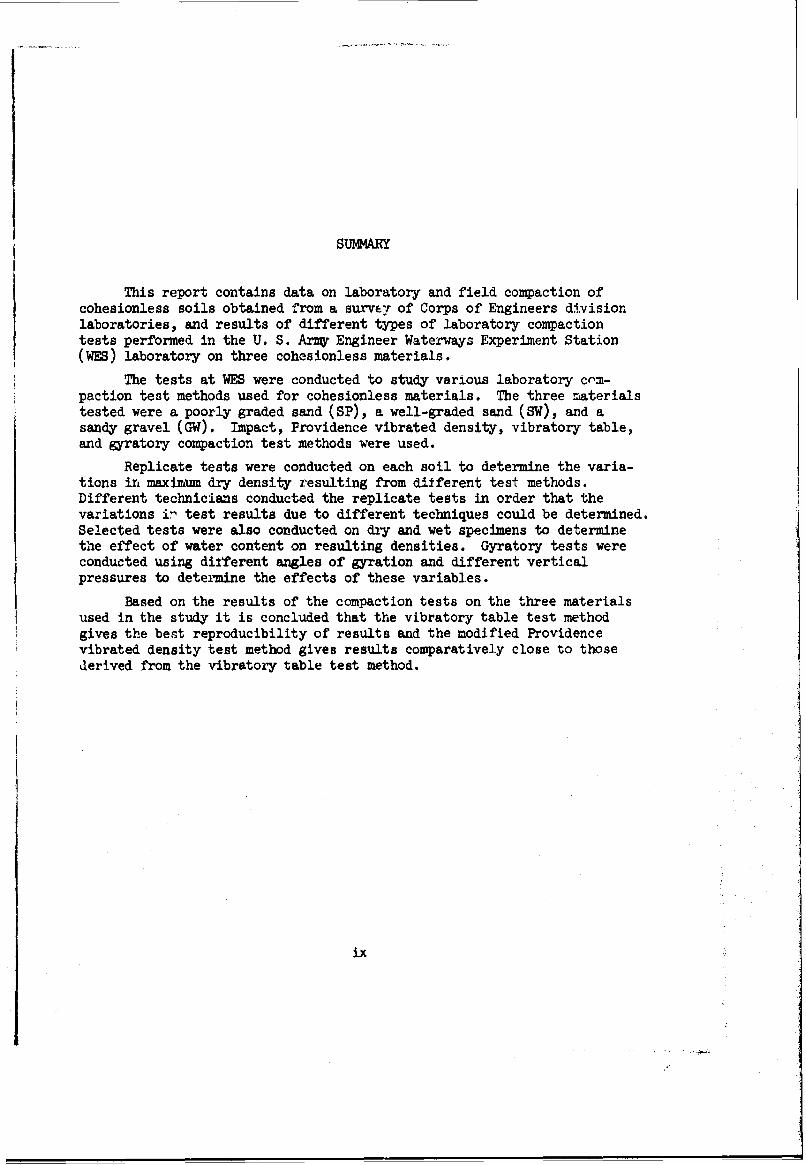
CONVERSION FACTORS, BRITISH TO METRIC UNITS OF MEASUREMENT
British units of measurement used in this report can be converted to
metric units as follows:
Multiply EX To Obtain
inches 2.54 centimeters
cubic feet 0.0283168 cubic meters
cubic yards 0.764555 cubic meters
pounds 0.45359237 kilograms
pounds per square inch 0.070307 kilograms per squarecentimeter
pounds per cubic foot 16.O185 kilograms per cubic meter
tons 907.185 kilograms
foot-pounds 0.138255 meter-kilograms
gallons 3.78533 liters
miles per hour 1.609344 kilometers per hour
vii
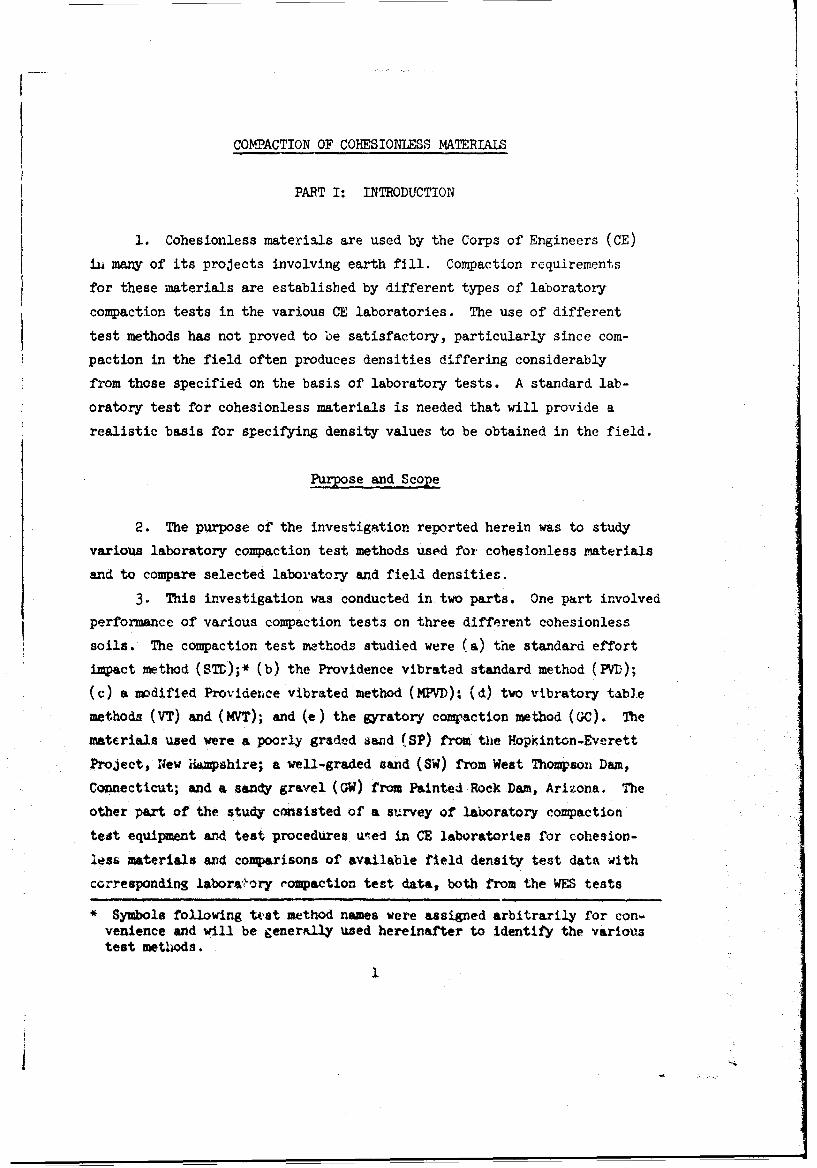
SUMMARY
This report contains data on laboratory and field compaction ofcohesionless soils obtained from a survey of Corps of Engineers divisionlaboratories, and results of different types of laboratory compactiontests performed in the U. S. Army Engineer Waterways Experiment Station(WES) laboratory on three cohesionless materials.
The tests at WES were conducted to study various laboratory com-paction test methods used for cohesionless materials. The three materialstested were a poorly graded sand (SP), a well-graded sand (SW), and asandy gravel (GW). Impact, Providence vibrated density, vibratory table,and gyratory compaction test methods were used.
Replicate tests were conducted on each soil to determine the varia-tions in maximum dry density resulting from different test methods.Different technicisns conducted the replicate tests in order that thevariations ir test results due to different techniques could be determined.Selected tests were also conducted on d2y and wet specimens to determinethe effect of water content on resulting densities. Gyratory tests wereconducted using different angles of gyration and different verticalpressures to determine the effects of these variables.
Based on the results of the compaction tests on the three materialsused in the study it is concluded that the vibratory table test methodgives the best reproducibility of results and the modified Providencevibrated density test method gives results comparatively close to thosederived from the vibratory table test method.
ix
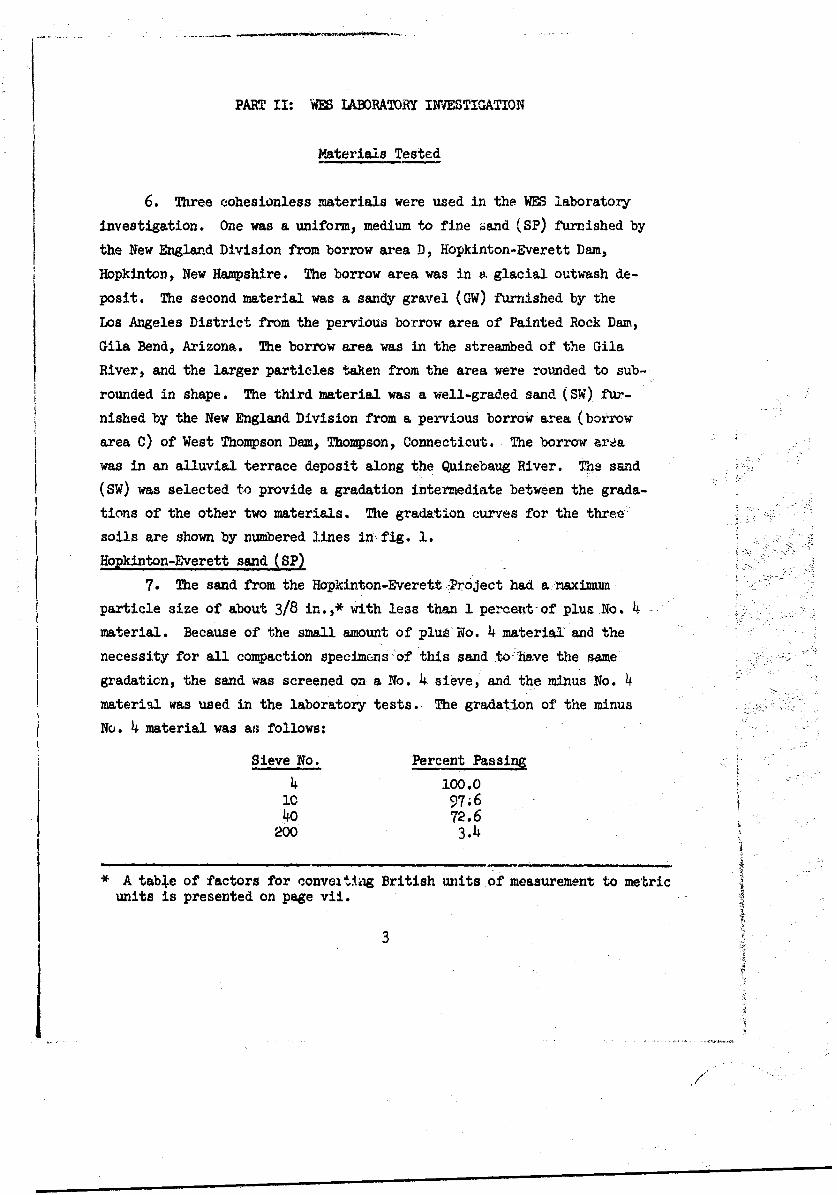
COMPACTION OF COHESIONLESS MATERIALS
PART I: INTRODUCTION
1. Cohesionless materials are used by the Corps of Engineers (CE)
in many of its projects involving earth fill. Compaction requirements
for these materials are established by different types of laboratory
compaction tests in the various CE laboratories. The use of different
test methods has not proved to be satisfactory, particularly since com-
paction in the field often produces densities differing considerably
from those specified on the basis of laboratory tests. A standard lab-
oratory test for cohesionless materials is needed that will provide a
realistic basis for specifying density values to be obtained in the field.
Purpose and Scope
2. The purpose of the investigation reported herein was to study
various laboratory compaction test methods used for cohesionless materials
and to compare selected laboratory and field densities.
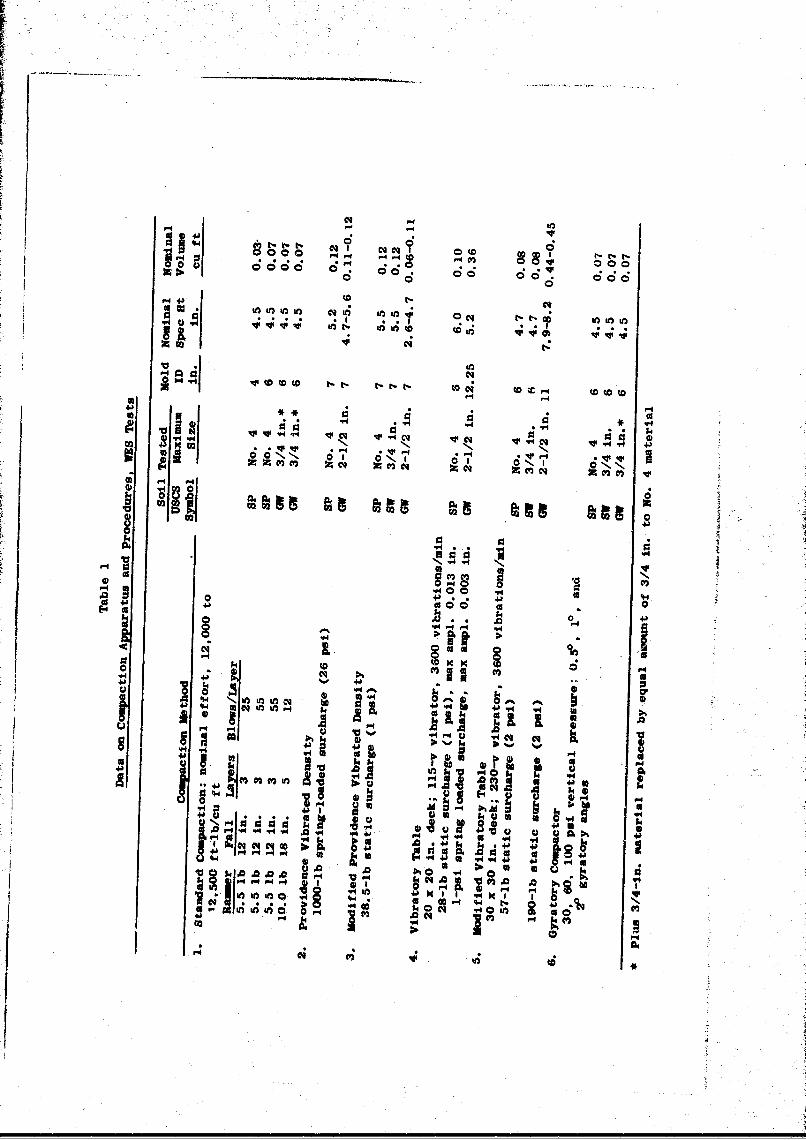
3. This investigation was conducted in two parts. One part involved
performance of various compaction tests on three different cohesionless
soils. The compaction test methods studied were (a) the standard effort
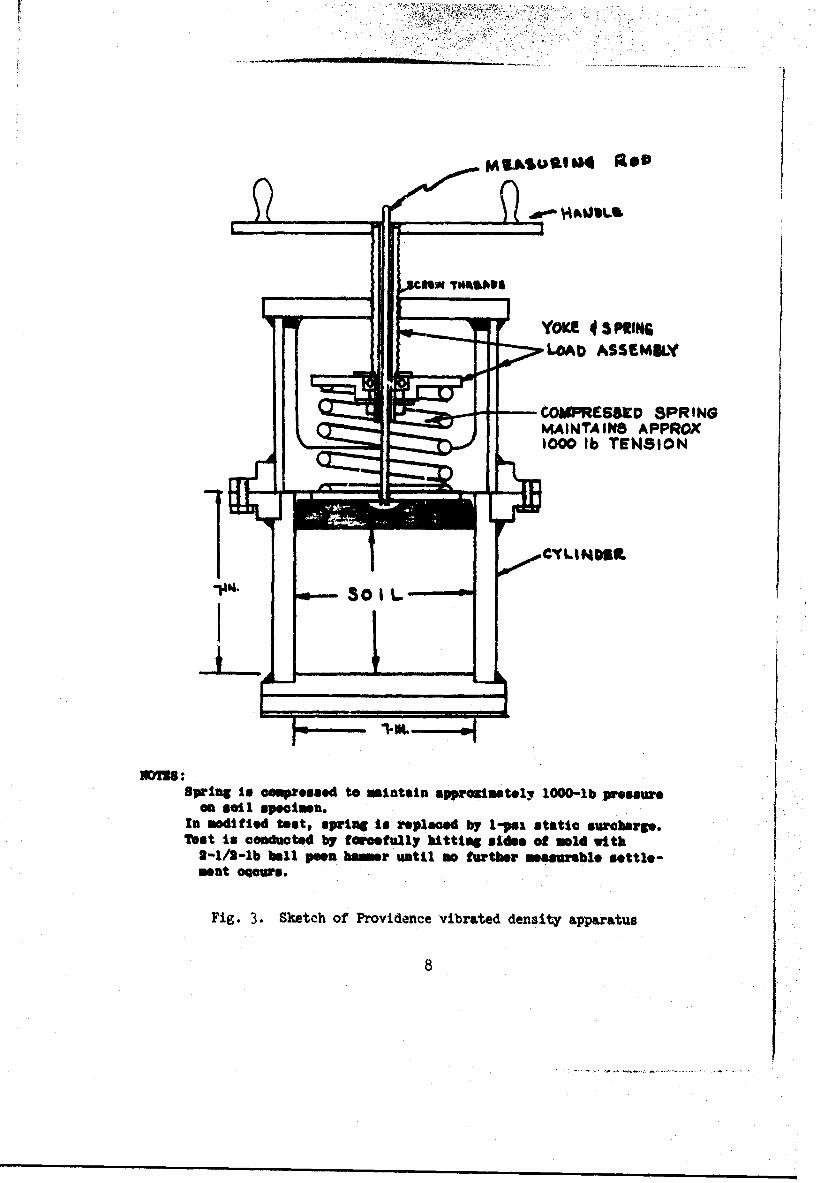
impact method (STD);* (b) the Providence vibrated standard method (PVD);
(c) a modified Providence vibrated method (MPVD): (d) two vibratory table
methods (VT) and (MVT); and (e) the gyratory compaction method (GC). The
materials used were a poorly graded iand (SP) from the Hopkinton-Everett
Project, New Hampshire; a well-graded sand (SW) from West Thompson Dam,
Connecticut; and a sandy gravel (GW) from Painted Rock Dam, Arizona. The
other part of the study consisted of a survey of laboratory compaction
teat equipment and test procedures ueed in CE laboratories for cohesion-
less materials and comparisons of available field density test data with
corresponding labora'ory compaction test data, both from the WFS tests
* Symbols following tAest method names were assigned arbitrarily for con-venience and will be generally used hereinafter to identify the varioustest methods.
1
and from test data supplied by the CE Districts.
4. In this report, the density results of the various laboratory
compaction tests are compared with one another and with results of field
density tests on similar materials compacted in the field.
Background
5. The investigation reported herein was initiated in FY 1960.
During FY 1960 and FY 1961, field and laboratory compaction data from
CE divisions were analyzed, and laboratory compaction tests were per-
formed at WES using the Hopkinton-Everett sand (SP) and Painted Rock
sandy gravel (GW). Laboratory compaction test methods used during these
periods were the STD, the PVD and a modification thereof, and the VT
method. An unpublished report of the results of the tests performed in
FY 1960 and FY 1961 was prepared in FY 1962. In FY 1963, GC tests were
performed on the sand (SP) and sandy gravel (GW), and an unpublished
report of the results of these tests was prepared in FY 1964. In FY 1965,
laboratory compaction tests were performed on a third material, a well-
graded sand (SW) from West Thompson Dam, having a gradation intermediate
between that of the sand (SP) and sandy gravel (GW). The compaction
test methods used on this material were the MPVD, the MVT, and the GC
methods.* MVT tests and additional GC tests were also performed on the
sand (SP) and the sand;- gravel (GW) to provide more complete data.
Procedures for the MPVD and MVT methods are now outlined in "AppendixXII: Relative Density" in "'Laboratory Soils Testing," EM 1110-2-1906,10 May 1965, Headquarters, Department of the Army, Washington, D. C.
2
PART II: WES LARATORY INVESTIGATION
Materials Tested
6. Three cohesionless materials were used in the WES laboratory
investigation. One was a uniform, medium to fine iand (SP) furnished by
the New England Division from borrow area D, Hopkinton-Everett Dam,
Hopkinton, New Hampshire. The borrow area was in s glacial outwash de-
posit. The second material was a sandy gravel (GW) furnished by the
Los Angeles District from the pervious borrow area of Painted Rock Dam,
Gila Bend, Arizona. The borrow area was in the streambed of the Gila
River, and the larger particles taken from the area were rounded to sub-
rounded in shape. The third material was a well-graded sand (SW) fur-
nished by the New England Division from a pervious borrow area (borrow
area C) of West Thompson Dam, Thompson, Connecticut. The borrow area
was in an alluvial terrace deposit along the Quinebaug River. The sand
(SW) was selected to provide a gradation intermediate between the grada-
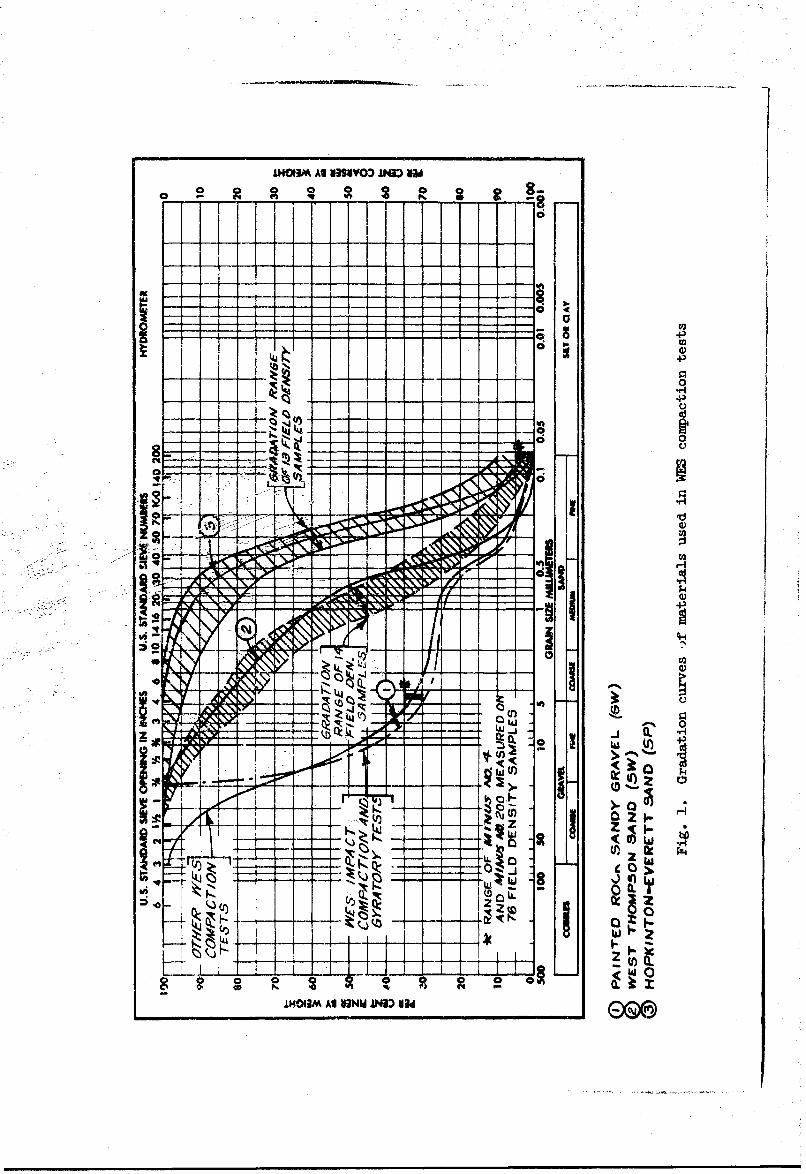
tions of the other two materials. The gradation curves for the three-
soils are shown by numbered lines in fig. 1.
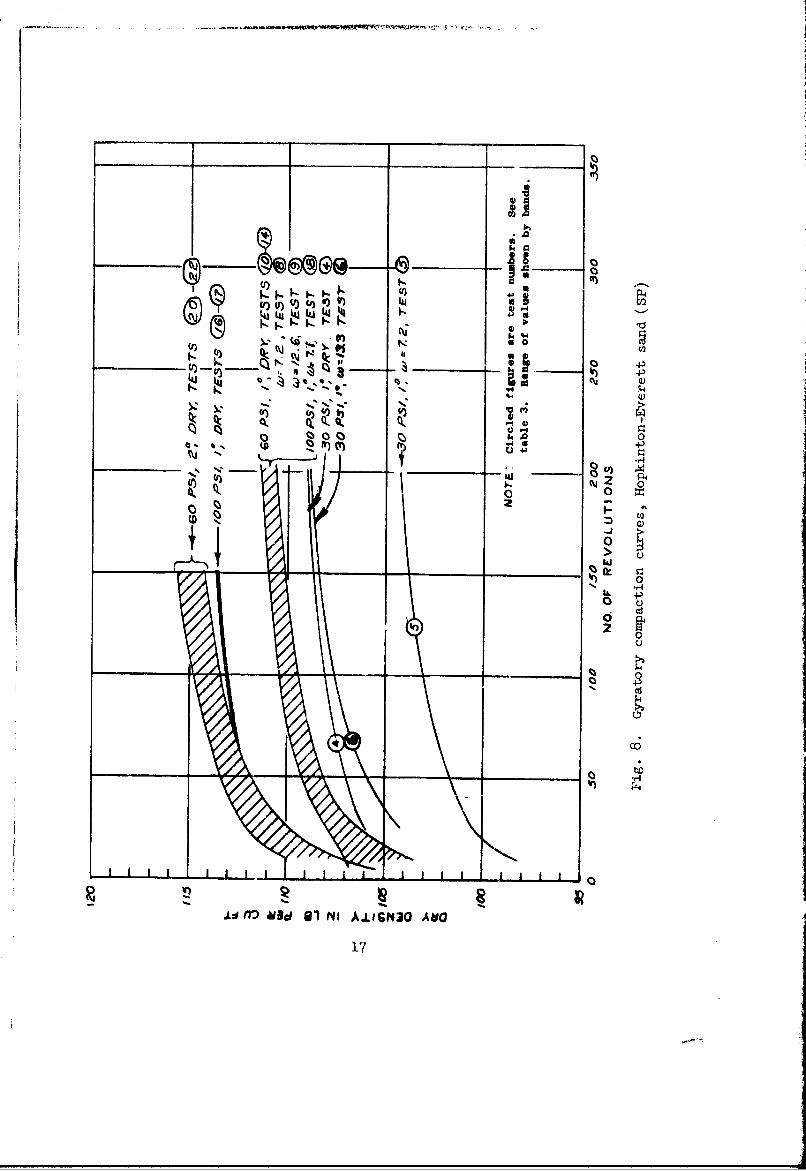
Hopkinton-Everett sand (SP)
7. The sand from the Hopkinton-EverettPr oject had a naximum
particle size of about 3/8 in.,* with less than 1 percent-of plus No. 4
material. Because of the small amount of plus No. 4 material and the
necessity for all compaction specimcns of this sand to have the same
gradaticn, the sand was screened on a No. 4 sieve, and the minus No. 4
material was used in the laboratory tests. The gradation of the minus
No. 4 material was ao follows:
Sieve No. Percent Pas-sing
4 100.010 97;640 72.6
200 3.4
* A table of factors for conveiting British units of measurement to metricunits is presented on page vii.
3
1HO3M At V3SVVO3 IND liU
C,.
- -4-------
C4 It
00
rkr
0)ImolamAs NNWIND V
Painted Rock sandy gravel (GW)
8. The sandy gravel from Painted Rock Dam had a maximum particle
size of about 4 in., with about 68 percent of plus No. 4 material. In
order to produce compaction specimens of as near3y identical gradation
as possible, the sandy gravel was sieved into the following fractions:
Passing Retained on
2-1/2 in. 1-1/2 in.1-1/2 in. 1 in.I in. 3/4 in.3/4 in. 1/2 in.1/2 in. 3/8 in.3/8 in. 1/4 in.1/4 in. No. 3No. 3 No. 4No.4 --
The separate fractions were then recombined in proper proportions as
samples were needed for the compaction tests. Impact and gyratory com-
paction tests were performed on samples of the sanay gravel having a
maximum particle size of 3/4 in. with replacement of the plus 3/4-in.
material by an equal amount of material passing the 3/4-in. sieve and
retained on the No. 4 sieve (see broken gradation curve 1 in fig. 1);
other compaction tests (PVD and VT) were performed on samples having a
maximum particle size of 2-1/2 in. (see solid-line gradation curve 1
in fig. 1). Where materials have more than 10 percent of plus 2-1/2-in.
material, the customary procedure in the PVD test is to replace the
plus 2-i/2-in. material with an equal weight of material passing the
2-1/2-in. sieve and retained on the 1-in. sieve. Since the sandy gravel
tested had only a few percent of plus 2-1/2-in. material, the PVD tests
were performed on the minus 2-1/2-in. fraction without replacement. This
material was also used in the VT tests.
West Thompson sand (SW)
9. The sand (SW) from West Thompson Dam had a maximum particle
size of 3/4 in. and 15 percent of plus No. 4 material. The sand was re-
ceived in bags, and gradation tests on representative specimens from each
of six bags selected at random indicated a maximum variation in gradation
5
- -
of only about 5 percent; it was therefore concluded that the sand in all
bags was essentially of the same gradation. To ensure that material for
each compaction specimen had as nearly identical gradation as possible,
the specimens were prepared by recombining the following fractions in the
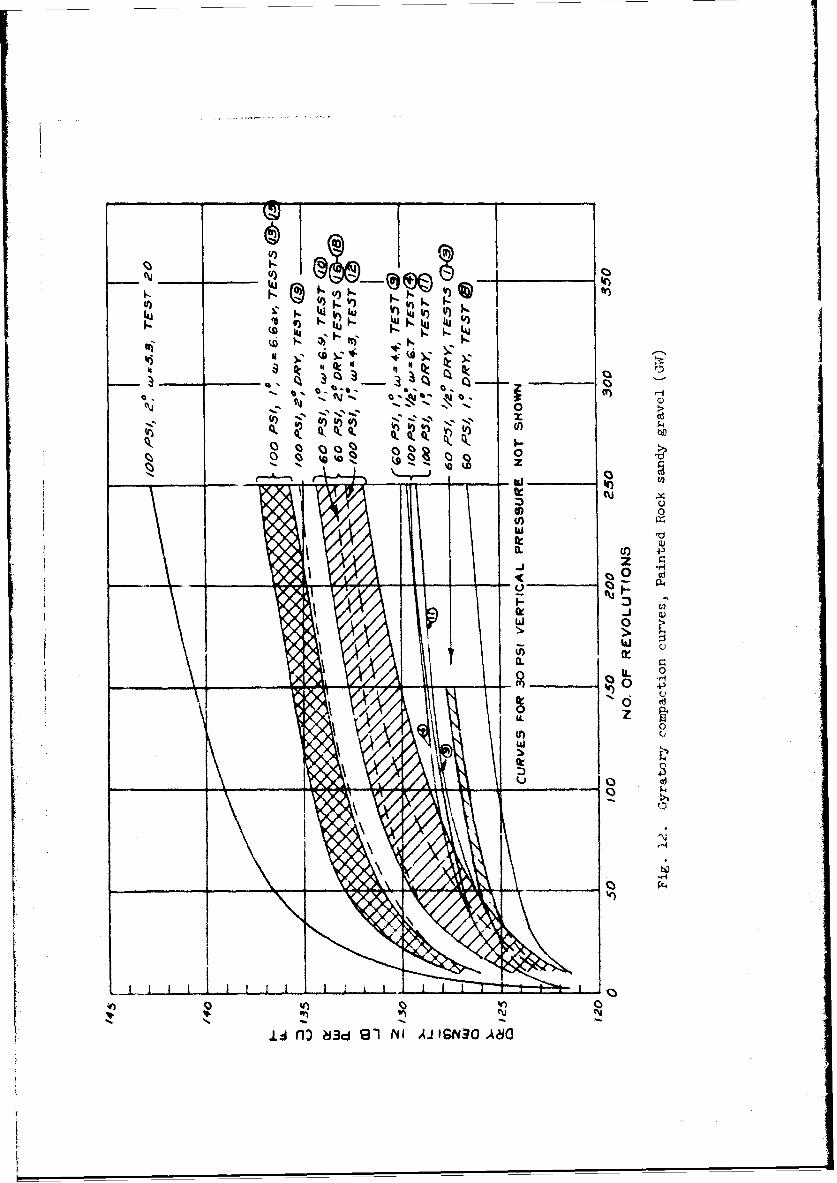
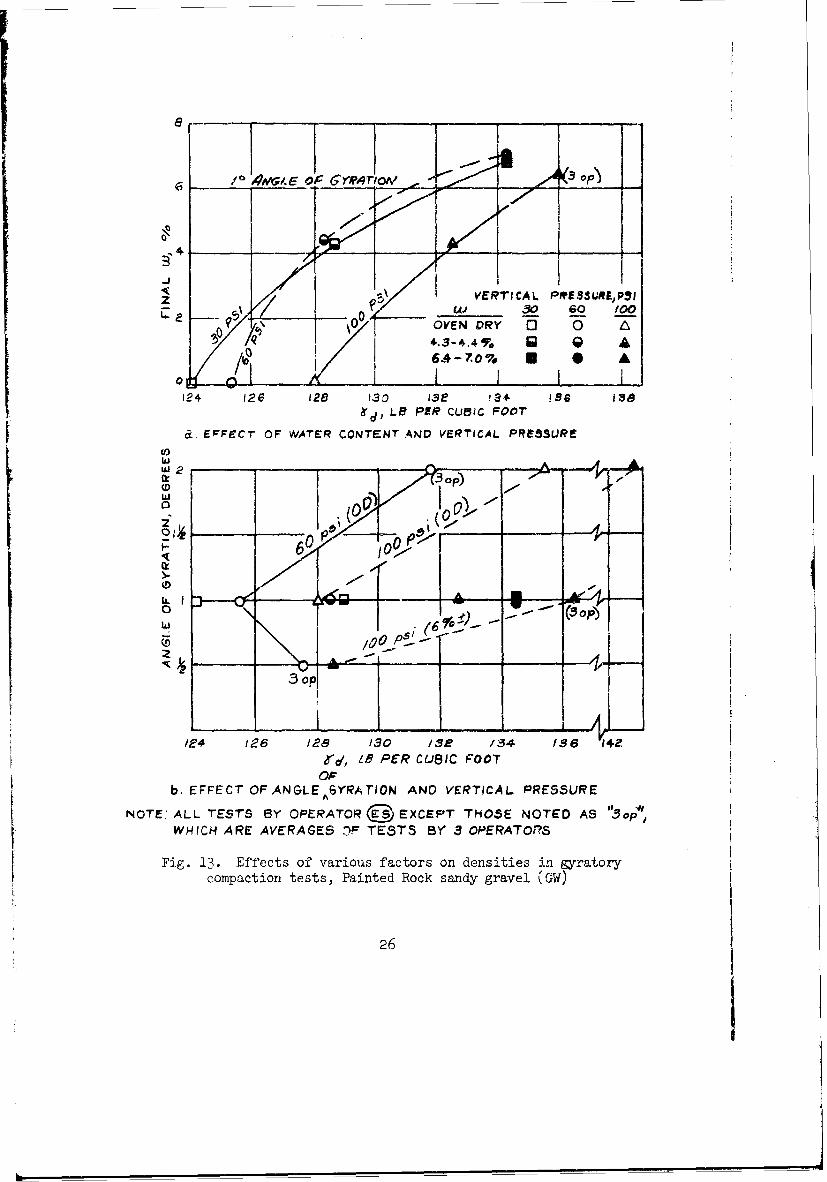
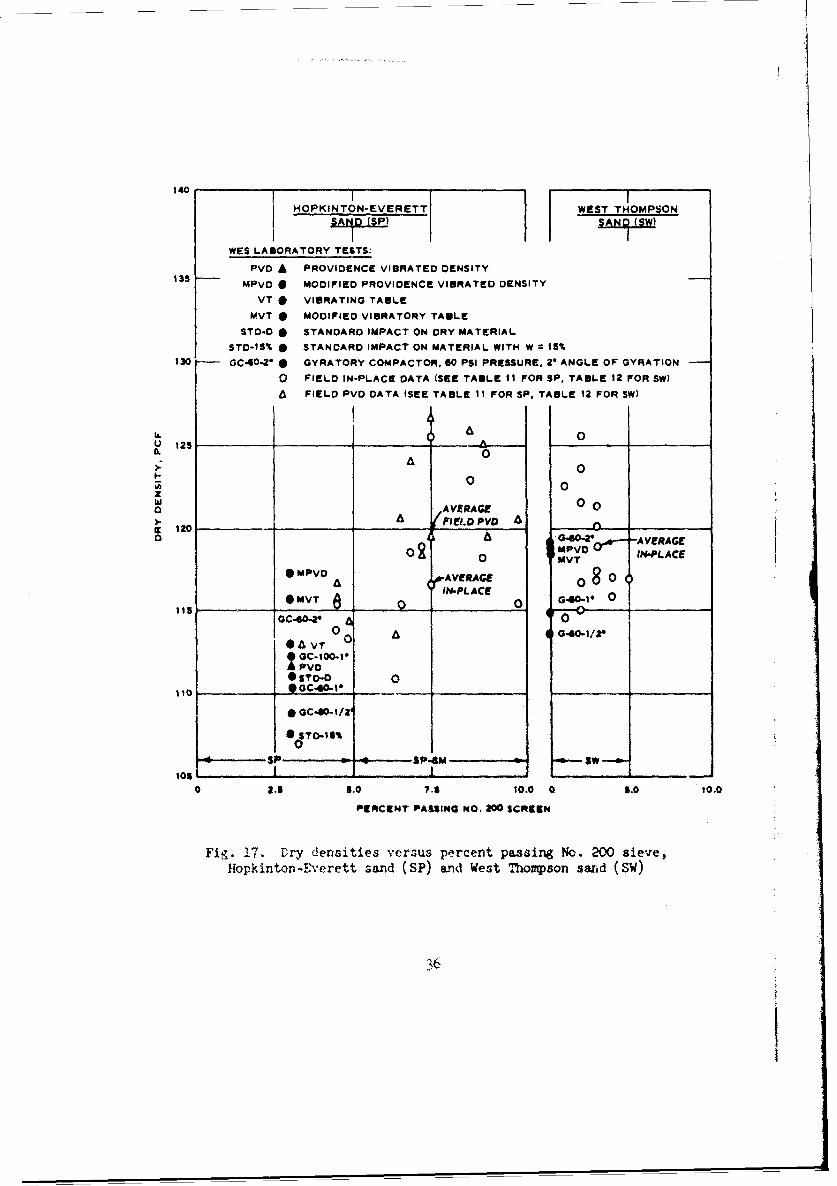
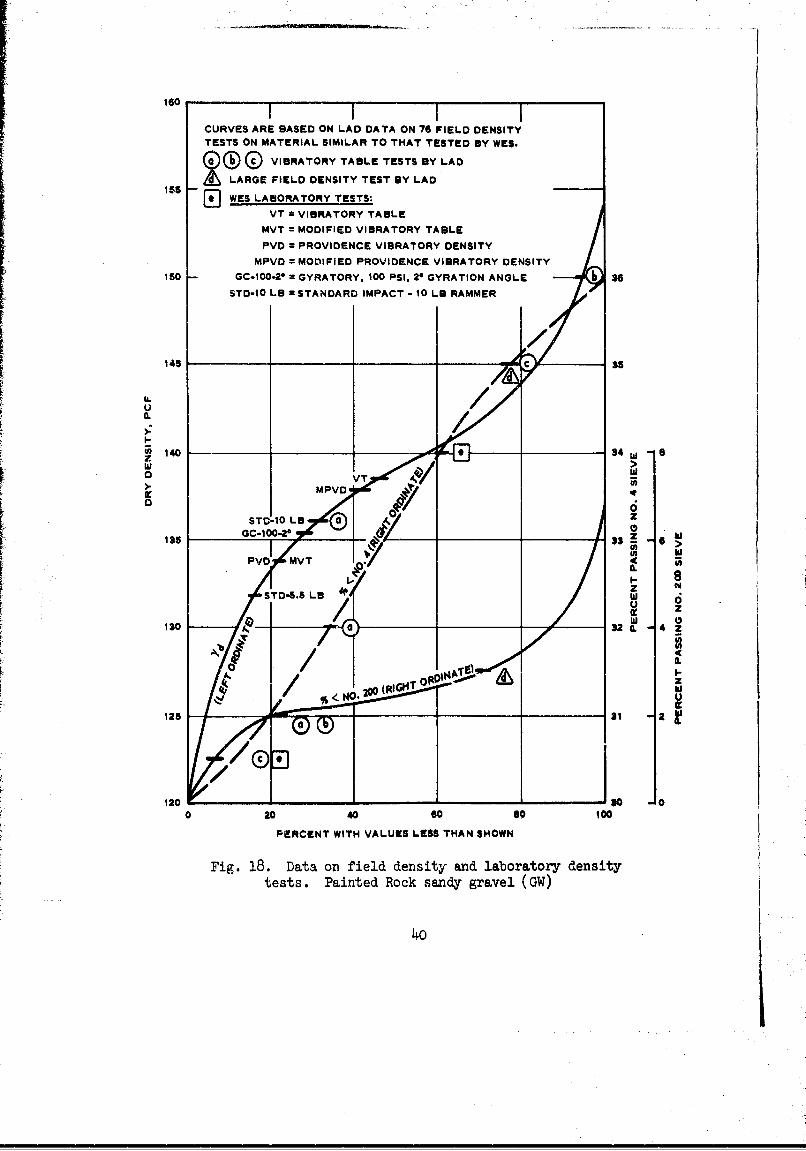
Fig. ~ ~ ~ ~ ~ ~ ~ ~ ~ ~ t >8 aao 'eddniyadlbrtr esttests Pane c anygavl(W
1~.8
PART IV: CONCLUSIONS AND RECOMENDATIONS
71. A valid comparison of laboratory versus field density data
could not be made because a statistically significant number of paired
observations was not available at the time this study was made. Much
field compaction data on pervious fills have been accumulated since that
time. The results of these field density tests should be compared sta-
tistically with the results of companion laboratory control density tests
for the pervious fills being placed in Corps of Engineers projects.
72. The wide range of density values in replicate tests on the
sandy gravel (GW) with 2-1/2-in. maximum size indicates the difficulty
of placing well-graded material with large particle sizes into test molds
in a consistent manner.
73. The flexibility of the gyratory compactor in reproducing desired
density values within close limits offers certain advantages. There is no
question but that the gyratory compactor can be made to produce any de-
sired density up to and above those attained by the other compaction
methods. A definite need exists for further study to develop an optimum
procedure for the gyratory compactor to produce densities matching desired
field densities for various granular materials. Emphasis should be placed
on a procedure utilizing a higher gyratory angle (say 2-1/2 deg), a realis-
tic pressure (say 100 psi), and a minimum number of revolutions, with
degradation effects no greater than those found in the field.
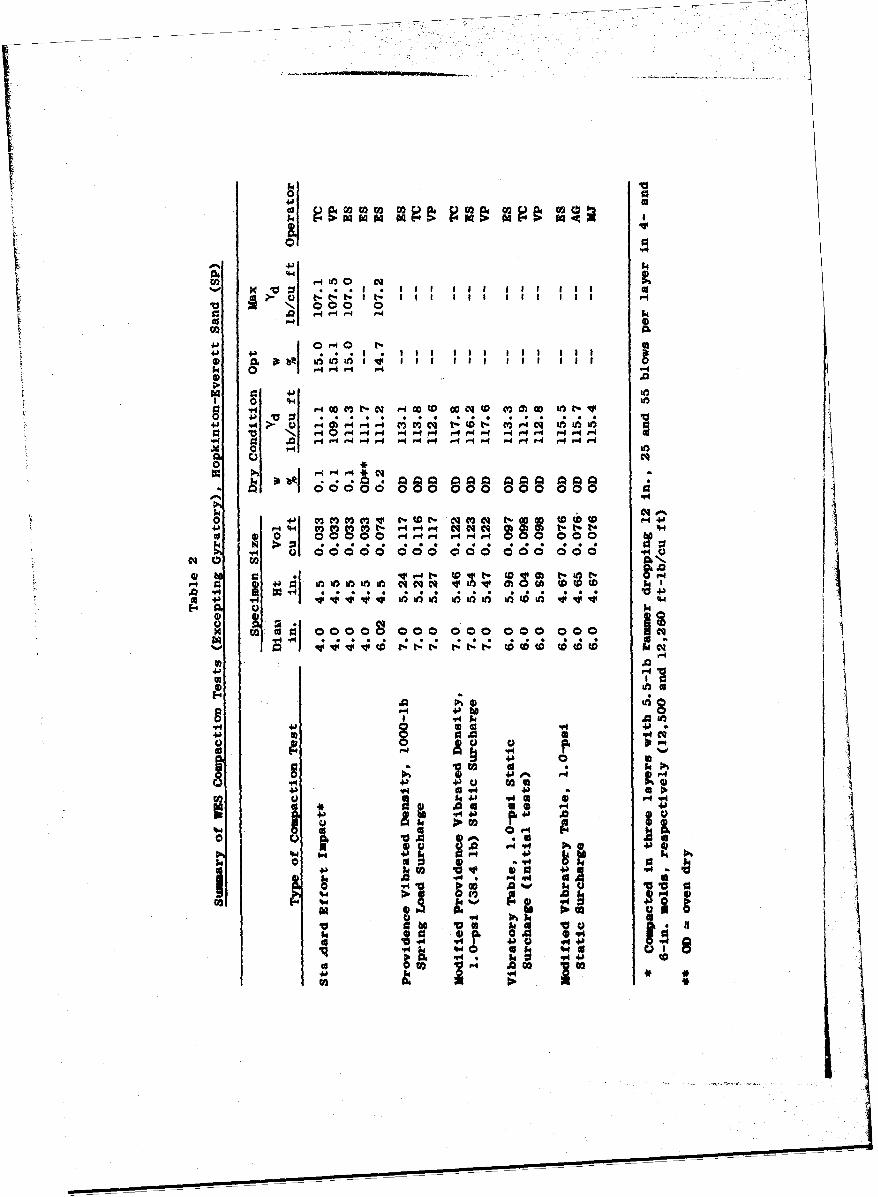
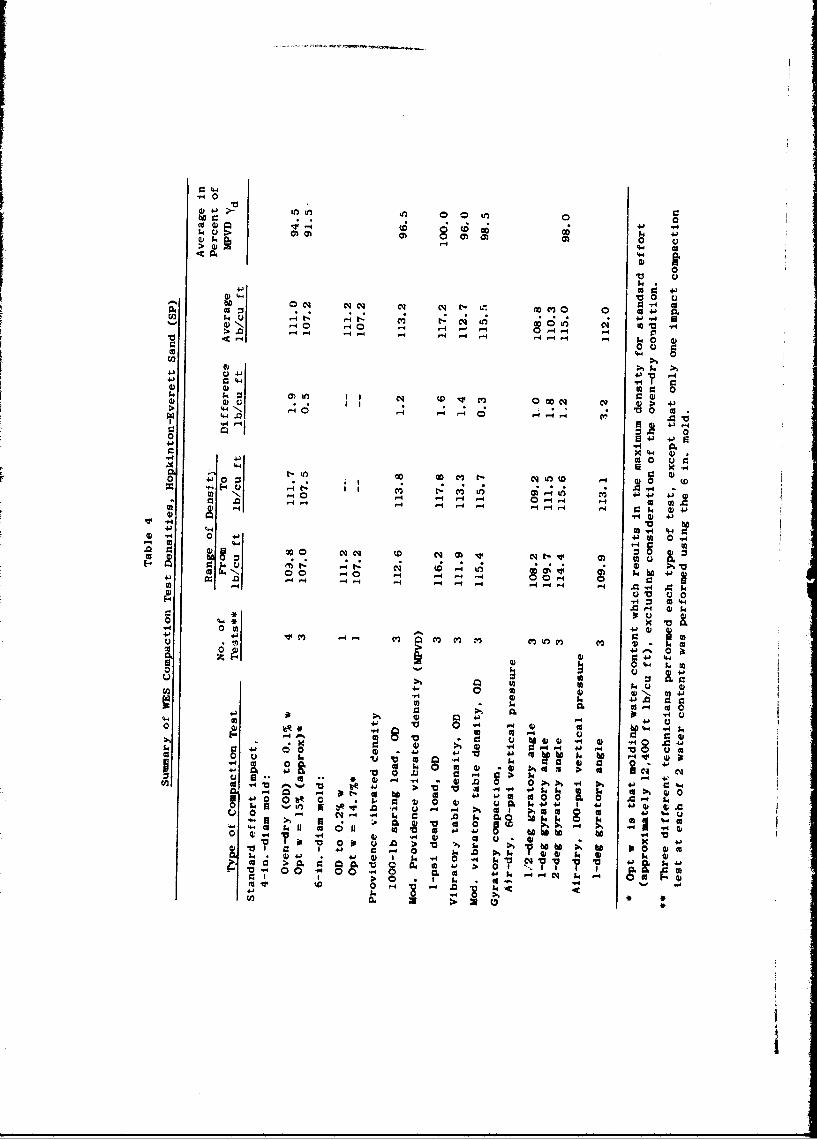
74. Of the test methods investigated in this study, the highest
densities were obtained with the MPVD method. The next highest den-
sities were obtained with the MVT method, which produced densities that
averaged 1 to 2 pcf less than those of the MPVD method. Since the re-
producibility of results using either method is. quite good, their use
for field control testing is justified.*
* Since this s'urvey, the vibratory table method (or when its use is notfeasible, the modified Providence vibrated density method) has been spe-cified for determining the maximm density of cohesiorless materials(see Headquarters, Department of the Army, op cit., p 6).
41
j - q
4-) j t': cqq, 0
'0 1 0
-~ ~ cq
'.4 wtr V4V v4q
-0
V44
0 0
0400 %0 4
43
CO4
4 0 3
S q.4
60) 4)
ri~ 14~ %4
Cq OD 41 0 0, . -4 -
(A .0.J3 13 1P4 .4 q 0 V4
4 P-4 Pto 1i0 ~ Qi~ 44 x ~ 1 m
i ~ ~~ 000cqCc; 0) ' 4
00
r4~
64 m 4 r
0CH-H u q go m :04c 9 mw t .
+1 v v; t4 i t4 P; c u; o"4
P-4 0 1 1 r 1 1 " a8 "
Be o14 4 0 0i It
v r- I-.4~" ccc to I t- to~-c m t- 46
4. %1 A4 --"" 444 a i.4 U;464 (4r 4 4-"44
m cc 00000o 0o 000 00
"4~~~~I. cc'cl~ cc
e* *4*
4
0-
U4.)
"w4
.54f w4 4.5--)
84 44 000 " ~ 4"4a
coo 0 0
P4 P4 r%% %4 P -I 4 P4 P4 P 4 M..g P4 P-1 m 4 .4 mr4-
4d m
) -- P4--
u4 .41N- 7 0 0
> (D 4.1:00 4)
V u41-4J4-4
0
M) 0- 0!0 t O 0m4II e t- 0cq Lm 4) 4> I- -4- 4 '-'- 4 -4, 0
M7ad4, -1. J2".. MD13In.8 - u C? a2 PA mo N..~l a 1W2 13 1p 2 107 10- 95 0511
M27 m f2.t. (p M. M 1813.8 -- k- C8 2a a" Dow 32.8 101 W2 12-13 2 97 131- 5M 99
,9 nI1 1/) In 14 W3) 06U3949,1
30 Mesa 41D In. 493-L D -S-67 P-5 C? 4 12 1" 11.. 1,7 117 120 - 2 11A8 1183.9 a 97w 91332att.1 40111 A) I 18.'1 sm. in /1. - - 8291 P29 (1000. i 3/8.1,9.3 US9 138A - 71 1218 -85 5 8
.%M9. by
.v bo i.(aowi14a. NO 11b.8 it 7h-10D 14-9k 2.04 ?8. "RP 8.6 9.19 WI 1-1/ 1-8.T ICU 139 . 135 10b 138 b-17 135 91. 10k.
33 11132 -34 (h..Iy Net AD. 4 ad-*2- 22-33 M1-318.09 2-6 6-16 3W iuhi 32. 8 MOW-e 112 17 *. too Is 196 9bat mU4 a may WD311190)0
3 1t1d.32 E . -18 38.33 ff141-0 94 6-16 ami Imp% at.8 19 115 us to 10 110 18 9 91 1031
3 1 . 134 AN .. 1 (DW MAW 2 W.-.. 13-97 20-87 M29& 30.T MI b id Doc 32. 8 121 &30 7-1 8 1312 . - 94IR38 Silly and 4 13.8 10838s 26 N..113 4 8 m IMPM. 1b.4 10 If 16 1 1 I4 q-. 103 -
1, Sit m A.W3 MR NO. 10 94-10 67-94 6-03 Of 8 9 NO 32.8 1 l 3t IV . 6 10)1 M* 5-19 6 93. 37170.1.. 811314. ma) t. 3b. h
12J-b. ~;pi3. 3. .14 dilwdin -i. W911. 994ft ftf b , I It.1 mi. vows. 8 18.1OM 193284.39. nlb83441.137 (Pre), r i.ftI t-1 LIN 31 nt itts 13 OF th1332314413 t W~l3i 832st ft. 13 o~r t. aer1 c.313 m13.