26
WP/05/141 Competition in Indian Banking A. Prasad and Saibal Ghosh
| Date post: | 07-May-2018 |
| Category: |
Documents |
| Upload: | duongkhuong |
| View: | 216 times |
| Download: | 1 times |
WP/05/141
Competition in Indian Banking
A. Prasad and Saibal Ghosh
© 2005 International Monetary Fund WP/05/141
IMF Working Paper
Office of the Executive Director for India
Competition in Indian Banking
Prepared by A. Prasad and Saibal Ghosh1
Authorized for distribution by B.P. Misra
July 2005
Abstract
This Working Paper should not be reported as representing the views of the IMF. The views expressed in this Working Paper are those of the author(s) and do not necessarily represent those of the IMF or IMF policy. Working Papers describe research in progress by the author(s) and are published to elicit comments and to further debate.
It is widely perceived that competition in the Indian banking sector has increased since the inception of the financial sector reforms in 1992. Using annual data on scheduled commercial banks for the period 1996–2004, the paper evaluates the validity of this claim in the Indian context. The empirical evidence reveals that the Indian banking system operates under competitive conditions and earns revenues as if under monopolistic competition. JEL Classification Numbers: G21 Keywords: Competition, India, banking, Panzar-Rosse statistics Author(s) E-Mail Address: [email protected]; [email protected]
1 A. Prasad is Advisor to Executive Director for India, and Saibal Ghosh is Assistant Adviser in the Department of Economic Analysis, Reserve Bank of India, Mumbai. We are thankful to Anges Belaisch, Kalpana Kochhar, Eswar Prasad, Gianni De Nicolo, Shawn Cole, and Sonali Jain-Chandra for their helpful comments.
Contents Page
I. Introduction.............................................................................................................. 3 II. Indian Banking Sector—An Overview.....................................................................4 III. The Panzar-Rosse Test for Assessing Competition in Banking................................6 IV. Empirical Specification............................................................................................10 V. The Database and Sample Selection.........................................................................12 VI. Empirical Results......................................................................................................14 VII. Conclusions and Policy Implications........................................................................22 References.............................................................................................................................23 Figures 1. Unit Cost of Funds (Ratio of Aggregate Interest Expenses to Total Deposits Plus Borrowings) by Type of Bank ................................................................... ......12 2. Unit Cost of Labor (Ratio of Personnel Expenses to Total Number of Employees)
by Type of Bank )………………………………………………............................ .13 3. Unit Cost of Capital (Ratio of Other Operating Costs to Fixed Assets)
by Type of Bank …………………………………………………...........................13 4. Interest Revenue to Total Assets by Type of Bank ……..........................................15 5. Total Revenue to Total Assets by Type of Bank ………………………................ .15 Tables 1. Summary of Banking Industry, 1990–91 to 2003–04.................................................6 2. Application of the Panzar-Rosse Methodology to Banking Studies……...................9 3. Interpretation of the Panzar-Rosse H statistic...........................................................10 4. Descriptive Summary of Variables, 1996–2004...................................................... .14 5. Estimation Results for the Indian Commercial Banks: Interest Revenue, 1996–2004.................................................................................................................17 6. Estimation Results for the Indian Commercial Banks: Total Revenue, 1996–2004.................................................................................................................18 7. Estimation Results for the Indian Commercial Banks: Interest Revenue by Type of Bank, 1996-2004………………………………………………….....…19 8. Estimation Results for the Indian Commercial Banks: Total Revenue
by Type of Bank, 1996-2004……………………………………….........................21 9. H Statistics: Cross-Country Estimates.................................................................... ..21
- 3 -
I. INTRODUCTION
The Indian banking system has undergone significant structural transformation since the 1990s. An administered regime under state ownership until the initiation of financial sector reforms in 1992, the sector was opened to greater competition by the entry of new private banks and more liberal entry of foreign banks in line with the recommendations of the Report of the Committee on the Financial System (chaired by Shri M. Narasimham):
…freedom of entry into the financial system should be liberalised and the Reserve Bank should now permit the establishment of new banks in the private sector, provided they conform to the minimum start up capital and other requirements and the set of prudential norms with regard to accounting, provisioning and other aspects of operations. (Government of India, 1991, p.72)
A second Committee on Banking Sector Reforms (also chaired by Shri M. Narasimham) was appointed in 1998 to review the record of implementation of financial system reforms and to look ahead and chart the reforms necessary in the years ahead. In its stocktaking of the recommendations of the first phase of reforms, the Committee observed that:
One of the more significant measures instituted since 1991 has been the permission for new private banks to be set up, and the more liberal approach towards foreign bank offices being opened in India. These steps have enhanced the competitive framework for banking — the more so as the new private and foreign banks have higher productivity levels based on newer technology and lower levels of manning. (Government of India, 1998, Para 1.21)
During this period, ownership in public sector banks was also diversified. Along with the flexible entry norms for private and foreign banks, this changed the competitive conditions in the banking industry. The importance of competition was also recognized by the Reserve Bank, when it observed that:
Competition is sought to be fostered by permitting new private sector banks, and more liberal entry of branches of foreign banks….Competition is sought to be fostered in rural and semi-urban areas also by encouraging Local Area Banks. Some diversification of ownership in select public sector banks has helped the process of autonomy and thus some response to competitive pressures. (Reddy, 2000)
and more recently:
the competition induced by the new private sector banks has clearly re-energized the Indian banking sector as a whole: new technology is now the norm, new products are being introduced continuously, and new business practices have become common place. (Mohan, 2004)
- 4 -
The present paper seeks to evaluate the degree of competition in the banking sector, which has not been done to date. This paper analyzes whether competition has yielded significant benefits in terms of greater product sophistication and cost reduction. The remainder of the discussion is structured as follows. An overview of the Indian banking sector is presented in Section II. Section III discusses the relevant literature and describes the methodology employed. The subsequent two sections explain the empirical strategy and the database. A discussion of the results comprises Section VI. The final section draws some conclusions and discusses a few policy implications.
II. INDIAN BANKING SECTOR — AN OVERVIEW
The Indian banking system is characterized by a large number of banks with mixed ownership.2 The commercial banking segment comprises 27 public sector banks in which the Government has majority ownership, 40 private sector banks, and 33 foreign banks. Total bank assets constituted a little over 70 percent of GDP in 2003-04. Public sector banks had 75 percent of the assets of the banking system in 2003-04, while private and foreign banks held 25 percent. In 1991, by comparison, public sector banks’ share of the total assets of the banking system was a little over 90 percent. Prior to the initiation of financial sector reforms in 1992, the Indian financial system essentially catered to the needs of planned development, and the government sector had a predominant role in every sphere of economic activity. The preemption of a large proportion of bank deposits in the form of reserves and an administered interest rate regime resulted in high-cost and low-quality financial intermediation. The existence of a complex structure of interest rates arising from economic and social concerns about providing concessional credit to certain sectors resulted in cross subsidization, which implied that higher rates were charged to non-concessional borrowers. The system of administered interest rates was characterized by detailed regulatory prescriptions on lending and deposits, leading to a multiplicity of interest rates. As a result, the spreads between deposit and lending rates of commercial banks increased, and the administered lending rates did not factor in credit risk. The lack of transparency, accountability, and prudential norms in the operations of the banking system led also to a rising burden of non-performing assets. On the expenditure front, inflexibility in licensing of branches and management structures constrained the operational independence and functional autonomy of banks and raised overhead costs. The financial environment during this period was characterized by segmented and underdeveloped financial markets. This resulted in a distortion of interest rates and the inefficient allocation of scarce resources. 2 The banking system in India consists of commercial and cooperative banks, with the former accounting for around 98 percent of banking system assets. The entire segment is referred to as Scheduled Commercial Banks, because they are included in the Second Schedule of the Reserve Bank of India Act, 1934.
- 5 -
The period 1992-97 laid the foundations for reform in the banking system (Rangarajan, 1998). It saw the implementation of prudential norms pertaining to capital adequacy, income recognition, asset classification, provisioning, and exposure norms. While these reforms were being implemented, the world economy also witnessed significant changes, “coinciding with the movement towards global integration of financial services” (Government of India, 1998). Against such a backdrop, a second government-appointed committee on banking sector reforms provided the blueprint for the current reform process (Government of India, 1998). Critical and noteworthy reforms in the financial system during the reform period included the following (Bhide, Prasad, and Ghosh, 2001):
• Lowering of statutory reserve requirements to the current levels of 5 percent for cash
reserves and 25 percent for statutory liquidity ratios. • Liberalizing the interest rate regime, allowing banks the freedom to choose their
deposit and lending rates. • Infusing competition by allowing more liberal entry of foreign banks and permitting
the establishment of new private banks. • Introducing micro-prudential measures such as capital adequacy requirements,
income recognition, asset classification and provisioning norms for loans, exposure norms, and accounting norms.
• Diversifying ownership of public sector banks by enabling the state-owned banks to raise up to 49 percent of their capital from the market. Seventeen state-owned banks accessed the capital market and raised around 82 billion rupees (Rs) as of end-March 2004.
• Mandating greater disclosure in the balance sheets to ensure greater transparency. • Adopting a consultative approach to policy formulation with measures being ushered
in after discussions with market participants to provide useful lead time to market players to make necessary adjustments.
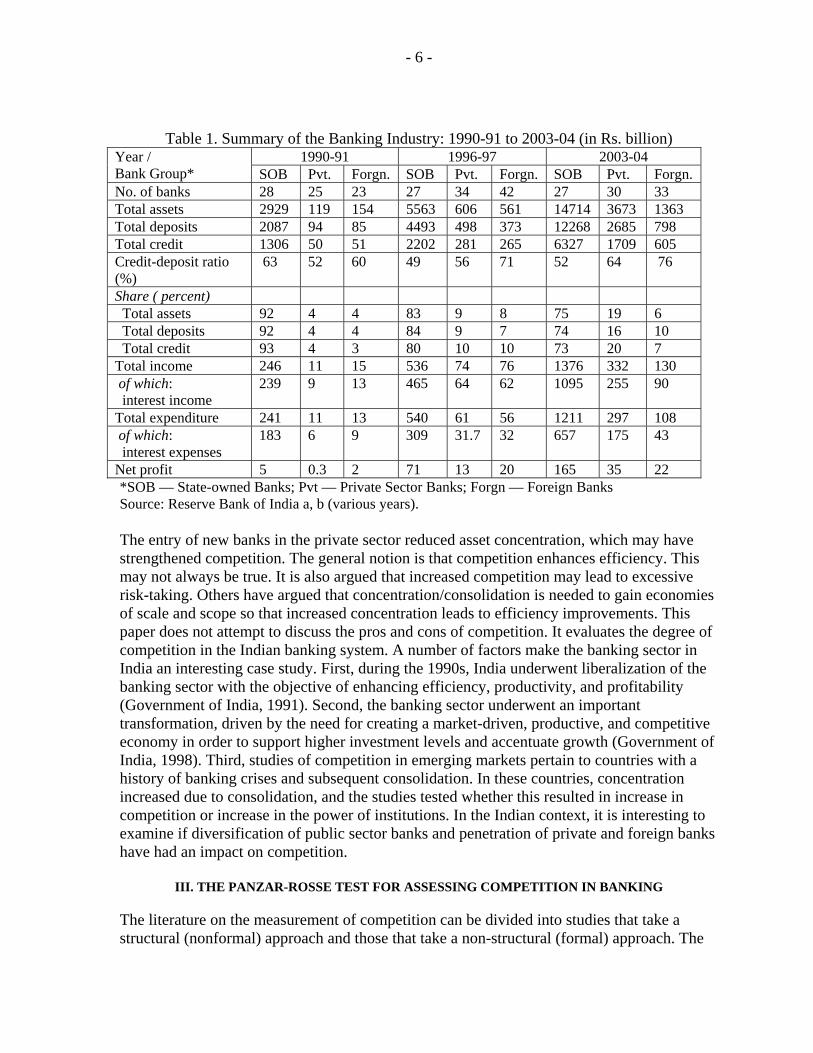
As a consequence of the reforms, public sector banks’ share of total assets in the banking system was reduced from 90 percent to 75 percent between 1991 and 2004. The five-bank asset concentration ratio declined from 0.51 in 1991-92, to 0.44 in 1995-96, and to 0.43 in 2003-04 (Table 1). Even the five-bank loan concentration ratio showed a decline from 0.68 in 1991-92, to 0.48 in 1995-96, and further to 0.41 percent in 2003-04.
- 6 -
Table 1. Summary of the Banking Industry: 1990-91 to 2003-04 (in Rs. billion) 1990-91 1996-97 2003-04 Year /
Bank Group* SOB Pvt. Forgn. SOB Pvt. Forgn. SOB Pvt. Forgn. No. of banks 28 25 23 27 34 42 27 30 33 Total assets 2929 119 154 5563 606 561 14714 3673 1363 Total deposits 2087 94 85 4493 498 373 12268 2685 798 Total credit 1306 50 51 2202 281 265 6327 1709 605 Credit-deposit ratio (%)
63 52 60 49 56 71 52 64 76
Share ( percent) Total assets 92 4 4 83 9 8 75 19 6 Total deposits 92 4 4 84 9 7 74 16 10 Total credit 93 4 3 80 10 10 73 20 7 Total income 246 11 15 536 74 76 1376 332 130 of which: interest income
239 9 13 465 64 62 1095 255 90
Total expenditure 241 11 13 540 61 56 1211 297 108 of which: interest expenses
183 6 9 309 31.7 32 657 175 43
Net profit 5 0.3 2 71 13 20 165 35 22 *SOB — State-owned Banks; Pvt — Private Sector Banks; Forgn — Foreign Banks Source: Reserve Bank of India a, b (various years). The entry of new banks in the private sector reduced asset concentration, which may have strengthened competition. The general notion is that competition enhances efficiency. This may not always be true. It is also argued that increased competition may lead to excessive risk-taking. Others have argued that concentration/consolidation is needed to gain economies of scale and scope so that increased concentration leads to efficiency improvements. This paper does not attempt to discuss the pros and cons of competition. It evaluates the degree of competition in the Indian banking system. A number of factors make the banking sector in India an interesting case study. First, during the 1990s, India underwent liberalization of the banking sector with the objective of enhancing efficiency, productivity, and profitability (Government of India, 1991). Second, the banking sector underwent an important transformation, driven by the need for creating a market-driven, productive, and competitive economy in order to support higher investment levels and accentuate growth (Government of India, 1998). Third, studies of competition in emerging markets pertain to countries with a history of banking crises and subsequent consolidation. In these countries, concentration increased due to consolidation, and the studies tested whether this resulted in increase in competition or increase in the power of institutions. In the Indian context, it is interesting to examine if diversification of public sector banks and penetration of private and foreign banks have had an impact on competition.
III. THE PANZAR-ROSSE TEST FOR ASSESSING COMPETITION IN BANKING
The literature on the measurement of competition can be divided into studies that take a structural (nonformal) approach and those that take a non-structural (formal) approach. The
- 7 -
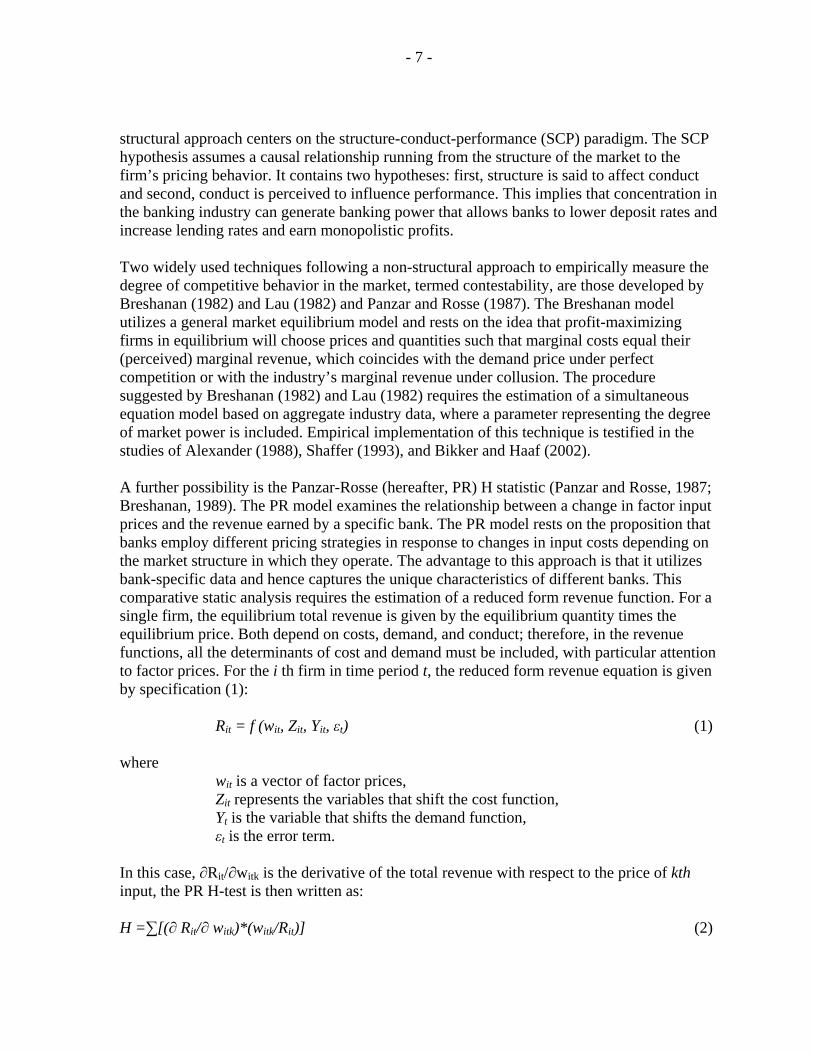
structural approach centers on the structure-conduct-performance (SCP) paradigm. The SCP hypothesis assumes a causal relationship running from the structure of the market to the firm’s pricing behavior. It contains two hypotheses: first, structure is said to affect conduct and second, conduct is perceived to influence performance. This implies that concentration in the banking industry can generate banking power that allows banks to lower deposit rates and increase lending rates and earn monopolistic profits.
Two widely used techniques following a non-structural approach to empirically measure the degree of competitive behavior in the market, termed contestability, are those developed by Breshanan (1982) and Lau (1982) and Panzar and Rosse (1987). The Breshanan model utilizes a general market equilibrium model and rests on the idea that profit-maximizing firms in equilibrium will choose prices and quantities such that marginal costs equal their (perceived) marginal revenue, which coincides with the demand price under perfect competition or with the industry’s marginal revenue under collusion. The procedure suggested by Breshanan (1982) and Lau (1982) requires the estimation of a simultaneous equation model based on aggregate industry data, where a parameter representing the degree of market power is included. Empirical implementation of this technique is testified in the studies of Alexander (1988), Shaffer (1993), and Bikker and Haaf (2002). A further possibility is the Panzar-Rosse (hereafter, PR) H statistic (Panzar and Rosse, 1987; Breshanan, 1989). The PR model examines the relationship between a change in factor input prices and the revenue earned by a specific bank. The PR model rests on the proposition that banks employ different pricing strategies in response to changes in input costs depending on the market structure in which they operate. The advantage to this approach is that it utilizes bank-specific data and hence captures the unique characteristics of different banks. This comparative static analysis requires the estimation of a reduced form revenue function. For a single firm, the equilibrium total revenue is given by the equilibrium quantity times the equilibrium price. Both depend on costs, demand, and conduct; therefore, in the revenue functions, all the determinants of cost and demand must be included, with particular attention to factor prices. For the i th firm in time period t, the reduced form revenue equation is given by specification (1):
Rit = f (wit, Zit, Yit, εt) (1)
where
wit is a vector of factor prices, Zit represents the variables that shift the cost function, Yt is the variable that shifts the demand function, εt is the error term.
In this case, ∂Rit/∂witk is the derivative of the total revenue with respect to the price of kth input, the PR H-test is then written as: H =∑[(∂ Rit/∂ witk)*(witk/Rit)] (2)
- 8 -
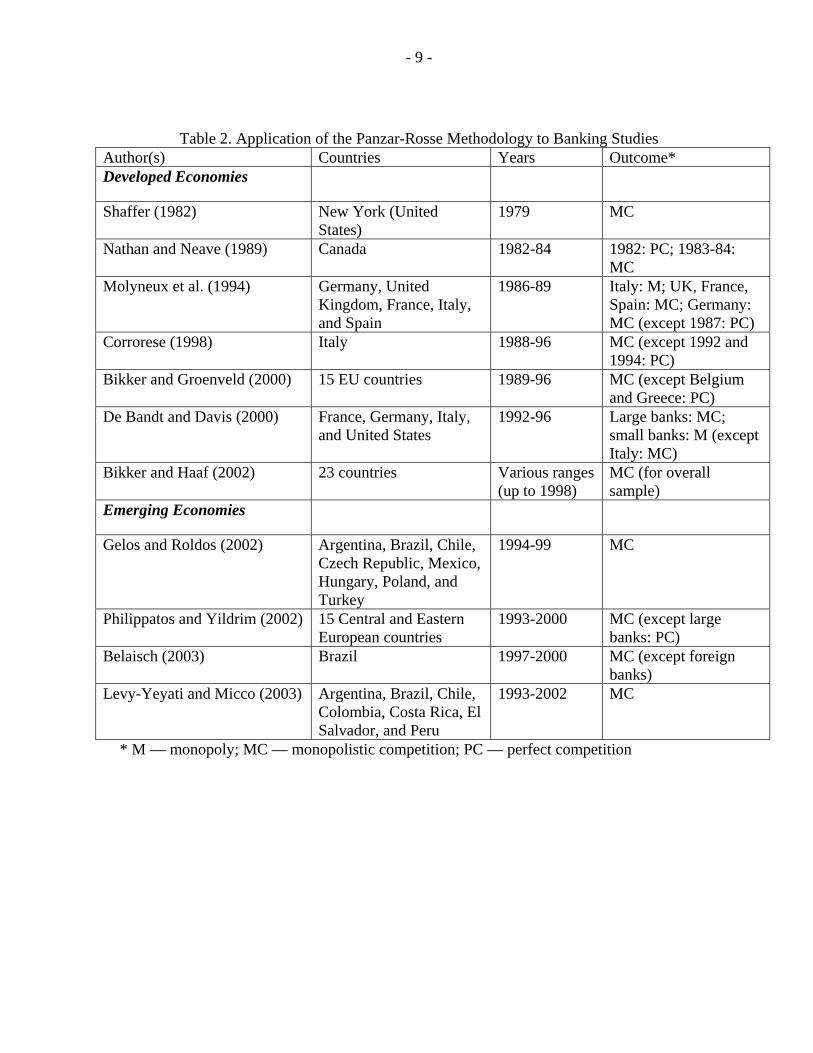
H is the sum of elasticities of the reduced form revenue with respect to all the factor prices. In other words, the statistic measures the percentage change in a bank’s equilibrium revenue caused by a 1 percent change in all of the bank’s input prices. As a result, the computation of the H statistic requires firm-specific data on revenues and factor prices. Further information on costs is not required, although the insertion of variables affecting demand or cost is needed. The PR test has a clear-cut interpretation when applied to the study of markets. H represents the percentage variation in the equilibrium revenue resulting from a unit percentage increase in the price of all factors used by the firm. PR depicts that in a collusive environment, assuming profit maximization, an increase in input prices will increase marginal cost and reduce equilibrium output and revenues. For a monopoly, a perfectly colluding oligopoly, or a homogeneous conjectural variations oligopoly, H<0. Shaffer (1982) has shown that the H = 1 for a natural monopolist operating in a perfectly contestable market, as well as for a sales-maximizing firm subject to break-even constraints. Under perfect competition, an increase in input prices will increase marginal cost and marginal revenue by same amount and hence H=1. A value of H between 0 and 1 indicates monopolistic competition where an increase in input prices will lead to a less than proportional increase in revenues, as the demand for banking facing individual banks is inelastic. In a symmetric monopolistic competitive market, 0<H<1. It is worth emphasizing that not only is the sign on H important, but its magnitude is equally important (Panzar and Rosse, 1987). As noted in Bikker and Haaf (2000), the approach subsumes four conditions: (1) banks are operating at their long-run equilibrium, (2) the performance of the banks is influenced by the actions of other market participants, (3) the cost structure is homogeneous and, finally, (4) the price elasticity of demand is greater than unity. By not requiring a locational market definition a priori, the PR framework avoids the potential bias caused by the misspecification of market boundaries; hence, the H statistic will reflect the average of a bank’s conduct in each market when that bank operates in more than one market. From an econometric standpoint, the rejection of H≤0 rules out the monopoly model; the rejection of H≤1 excludes all the three models; and the rejection of both H≤0 and the H=1 hypothesis (but not the H ≤ 1 hypothesis) implies that only monopolistic competition model is consistent with the data (Panzar and Rosse, 1987). A summary of the relevant cross-country and country-specific studies is presented in Table 2. In what follows, we evaluate the degree of competition in the Indian banking industry during 1996-2004 using data on scheduled commercial banks and employing the PR approach.
- 9 -
Table 2. Application of the Panzar-Rosse Methodology to Banking Studies Author(s) Countries Years Outcome* Developed Economies
Shaffer (1982) New York (United States)
1979 MC
Nathan and Neave (1989) Canada 1982-84 1982: PC; 1983-84: MC
Molyneux et al. (1994) Germany, United Kingdom, France, Italy, and Spain
1986-89 Italy: M; UK, France, Spain: MC; Germany: MC (except 1987: PC)
Corrorese (1998) Italy 1988-96 MC (except 1992 and 1994: PC)
Bikker and Groenveld (2000) 15 EU countries 1989-96 MC (except Belgium and Greece: PC)
De Bandt and Davis (2000) France, Germany, Italy, and United States
1992-96 Large banks: MC; small banks: M (except Italy: MC)
Bikker and Haaf (2002) 23 countries Various ranges (up to 1998)
MC (for overall sample)
Emerging Economies
Gelos and Roldos (2002) Argentina, Brazil, Chile, Czech Republic, Mexico, Hungary, Poland, and Turkey
1994-99 MC
Philippatos and Yildrim (2002) 15 Central and Eastern European countries
1993-2000 MC (except large banks: PC)
Belaisch (2003) Brazil 1997-2000 MC (except foreign banks)
Levy-Yeyati and Micco (2003) Argentina, Brazil, Chile, Colombia, Costa Rica, El Salvador, and Peru
1993-2002 MC
* M — monopoly; MC — monopolistic competition; PC — perfect competition
- 10 -
IV. EMPIRICAL SPECIFICATION
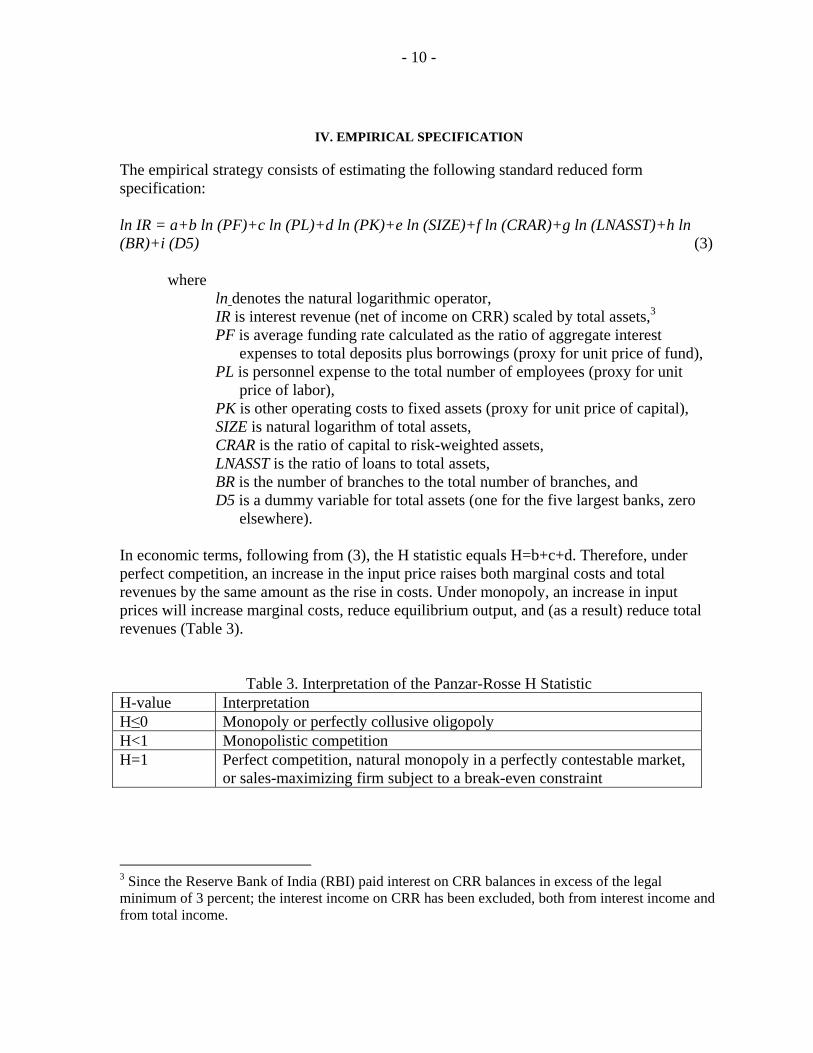
The empirical strategy consists of estimating the following standard reduced form specification: ln IR = a+b ln (PF)+c ln (PL)+d ln (PK)+e ln (SIZE)+f ln (CRAR)+g ln (LNASST)+h ln (BR)+i (D5) (3)
where ln denotes the natural logarithmic operator, IR is interest revenue (net of income on CRR) scaled by total assets,3 PF is average funding rate calculated as the ratio of aggregate interest
expenses to total deposits plus borrowings (proxy for unit price of fund), PL is personnel expense to the total number of employees (proxy for unit
price of labor), PK is other operating costs to fixed assets (proxy for unit price of capital), SIZE is natural logarithm of total assets, CRAR is the ratio of capital to risk-weighted assets, LNASST is the ratio of loans to total assets, BR is the number of branches to the total number of branches, and D5 is a dummy variable for total assets (one for the five largest banks, zero
elsewhere). In economic terms, following from (3), the H statistic equals H=b+c+d. Therefore, under perfect competition, an increase in the input price raises both marginal costs and total revenues by the same amount as the rise in costs. Under monopoly, an increase in input prices will increase marginal costs, reduce equilibrium output, and (as a result) reduce total revenues (Table 3).
Table 3. Interpretation of the Panzar-Rosse H Statistic
H-value Interpretation H≤0 Monopoly or perfectly collusive oligopoly H<1 Monopolistic competition H=1 Perfect competition, natural monopoly in a perfectly contestable market,
or sales-maximizing firm subject to a break-even constraint
3 Since the Reserve Bank of India (RBI) paid interest on CRR balances in excess of the legal minimum of 3 percent; the interest income on CRR has been excluded, both from interest income and from total income.
- 11 -
The nature of estimation of the H statistic means that we are especially interested in understanding how total revenues respond to variations in cost figures. Since financial intermediation is the central business of banks, we first consider the interest revenue as dependent variable. However, in order to take account of the increasing share of non-interest income in total income, we also estimate an alternative specification of the revenue function, where we replace the interest revenue (IR) with total revenue (TR), defined as the aggregate of interest revenues and non-interest revenues.
The control variables have been introduced to take into account bank-specific features. The natural logarithm of total asset (SIZE) can be considered a proxy for bank size and also for the aggregate demand. Apart from cost differences, size also controls for the risk-return profile and hence ex ante, the sign of this coefficient is not unambiguous.
The ratios of capital to risk-weighted assets (CRAR) and the loan-to-total-asset (LNASST) ratios are included to account for firm-level risk. The coefficient on the former will be negative or positive according to whether a higher level of risk capital leads to lower or higher bank revenues, whereas the coefficient on the latter is expected to be positive because a higher fraction of loans on the total assets implies greater revenues.4
The ratio of the number of branches of a bank to the total number of branches (BR) represents another useful proxy for evaluating the effect of bank size on revenues, thus identifying possible scale economies. Its sign will be positive or negative depending on whether differences between the banks, driven by their branch networks, lead to higher or lower revenues. This variable is particularly useful in the Indian context because banks, especially state-owned banks have large branch networks.
The dummy variable (D5) is added to distinguish the five largest banks from the others: if there exists oligopoly power associated with their large size, D5 should be significant.
4Note that Capital≡(Capital/RWA)×(RWA/TA)×TA, where RWA=risk-weighted assets and TA=total asset, which can be rewritten as: C=R × P × TA, where C=capital, R=risk-weighted capital ratio (=C/RWA), P=portfolio factor (=RWA/TA). The aforesaid relation can be rearranged as:
ATPCR ˆˆˆˆ −−= where Ĉ=∆C/C denotes proportionate changes
The expression suggests that to meet a targeted risk-adjusted capital requirement, a bank faces three possible options: (1) increase capital, (2) lower the portfolio factor, or (3) shrink total assets.
- 12 -
V. THE DATABASE AND SAMPLE SELECTION
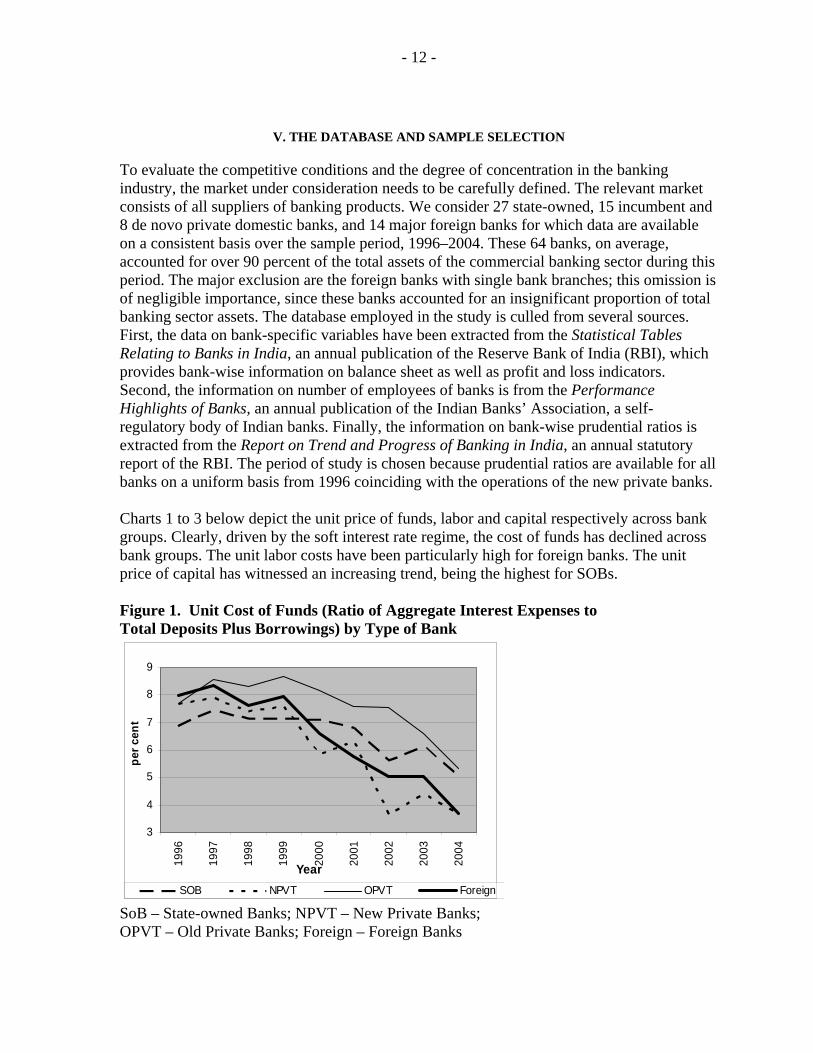
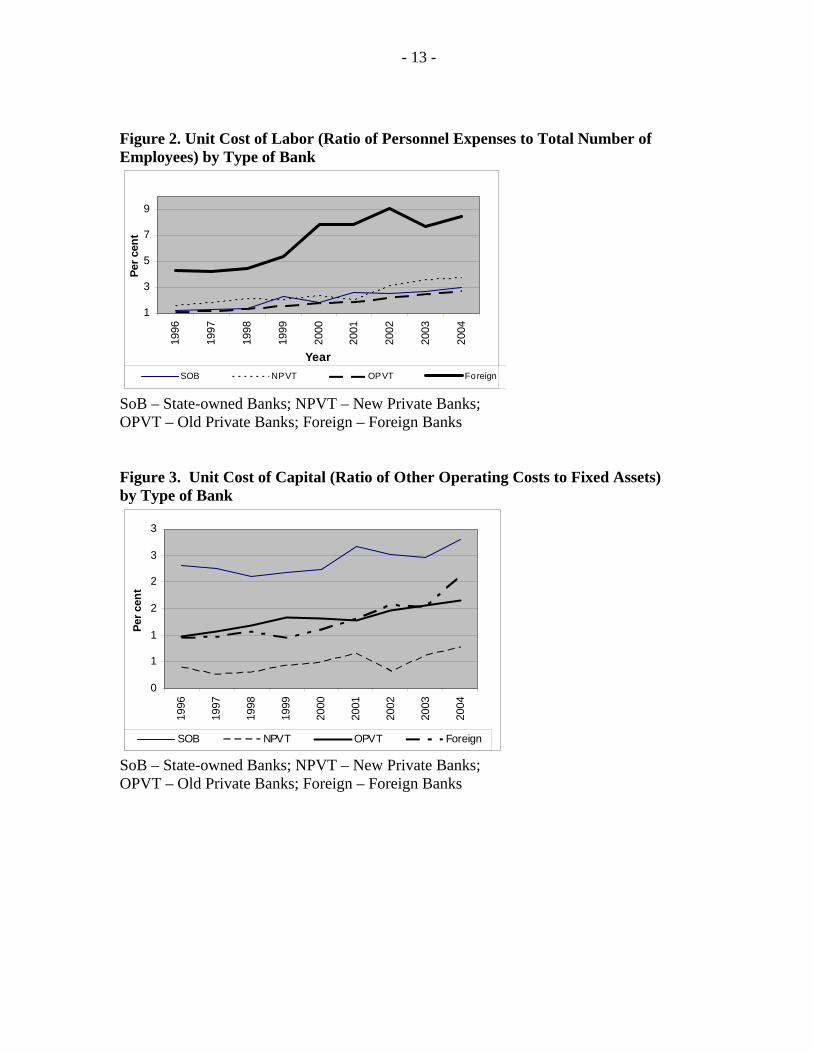
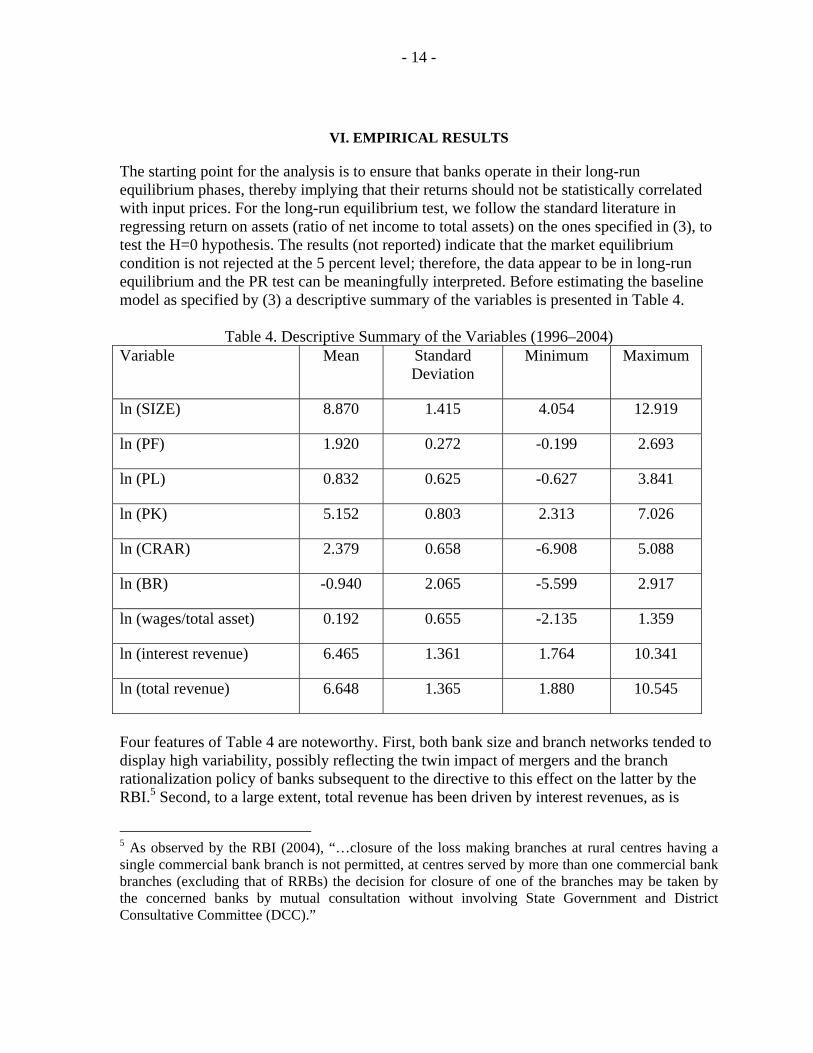
To evaluate the competitive conditions and the degree of concentration in the banking industry, the market under consideration needs to be carefully defined. The relevant market consists of all suppliers of banking products. We consider 27 state-owned, 15 incumbent and 8 de novo private domestic banks, and 14 major foreign banks for which data are available on a consistent basis over the sample period, 1996–2004. These 64 banks, on average, accounted for over 90 percent of the total assets of the commercial banking sector during this period. The major exclusion are the foreign banks with single bank branches; this omission is of negligible importance, since these banks accounted for an insignificant proportion of total banking sector assets. The database employed in the study is culled from several sources. First, the data on bank-specific variables have been extracted from the Statistical Tables Relating to Banks in India, an annual publication of the Reserve Bank of India (RBI), which provides bank-wise information on balance sheet as well as profit and loss indicators. Second, the information on number of employees of banks is from the Performance Highlights of Banks, an annual publication of the Indian Banks’ Association, a self-regulatory body of Indian banks. Finally, the information on bank-wise prudential ratios is extracted from the Report on Trend and Progress of Banking in India, an annual statutory report of the RBI. The period of study is chosen because prudential ratios are available for all banks on a uniform basis from 1996 coinciding with the operations of the new private banks. Charts 1 to 3 below depict the unit price of funds, labor and capital respectively across bank groups. Clearly, driven by the soft interest rate regime, the cost of funds has declined across bank groups. The unit labor costs have been particularly high for foreign banks. The unit price of capital has witnessed an increasing trend, being the highest for SOBs.
Figure 1. Unit Cost of Funds (Ratio of Aggregate Interest Expenses to Total Deposits Plus Borrowings) by Type of Bank
3
4
5
6
7
8
9
1996
1997
1998
1999
2000
2001
2002
2003
2004
Year
per c
ent
SOB NPVT OPVT Foreign SoB – State-owned Banks; NPVT – New Private Banks; OPVT – Old Private Banks; Foreign – Foreign Banks
- 13 -
Figure 2. Unit Cost of Labor (Ratio of Personnel Expenses to Total Number of Employees) by Type of Bank
1
3
5
7
9
1996
1997
1998
1999
2000
2001
2002
2003
2004
Year
Per c
ent
SOB NPVT OPVT Foreign
SoB – State-owned Banks; NPVT – New Private Banks; OPVT – Old Private Banks; Foreign – Foreign Banks Figure 3. Unit Cost of Capital (Ratio of Other Operating Costs to Fixed Assets) by Type of Bank
0
1
1
2
2
3
3
1996
1997
1998
1999
2000
2001
2002
2003
2004
Year
Per c
ent
SOB NPVT OPVT Foreign
SoB – State-owned Banks; NPVT – New Private Banks; OPVT – Old Private Banks; Foreign – Foreign Banks
- 14 -
VI. EMPIRICAL RESULTS
The starting point for the analysis is to ensure that banks operate in their long-run equilibrium phases, thereby implying that their returns should not be statistically correlated with input prices. For the long-run equilibrium test, we follow the standard literature in regressing return on assets (ratio of net income to total assets) on the ones specified in (3), to test the H=0 hypothesis. The results (not reported) indicate that the market equilibrium condition is not rejected at the 5 percent level; therefore, the data appear to be in long-run equilibrium and the PR test can be meaningfully interpreted. Before estimating the baseline model as specified by (3) a descriptive summary of the variables is presented in Table 4.
Table 4. Descriptive Summary of the Variables (1996–2004) Variable Mean Standard
Deviation Minimum Maximum
ln (SIZE) 8.870 1.415 4.054 12.919
ln (PF) 1.920 0.272 -0.199 2.693
ln (PL) 0.832 0.625 -0.627 3.841
ln (PK) 5.152 0.803 2.313 7.026
ln (CRAR) 2.379 0.658 -6.908 5.088
ln (BR) -0.940 2.065 -5.599 2.917
ln (wages/total asset) 0.192 0.655 -2.135 1.359
ln (interest revenue) 6.465 1.361 1.764 10.341
ln (total revenue) 6.648 1.365 1.880 10.545
Four features of Table 4 are noteworthy. First, both bank size and branch networks tended to display high variability, possibly reflecting the twin impact of mergers and the branch rationalization policy of banks subsequent to the directive to this effect on the latter by the RBI.5 Second, to a large extent, total revenue has been driven by interest revenues, as is
5 As observed by the RBI (2004), “…closure of the loss making branches at rural centres having a single commercial bank branch is not permitted, at centres served by more than one commercial bank branches (excluding that of RRBs) the decision for closure of one of the branches may be taken by the concerned banks by mutual consultation without involving State Government and District Consultative Committee (DCC).”
- 15 -
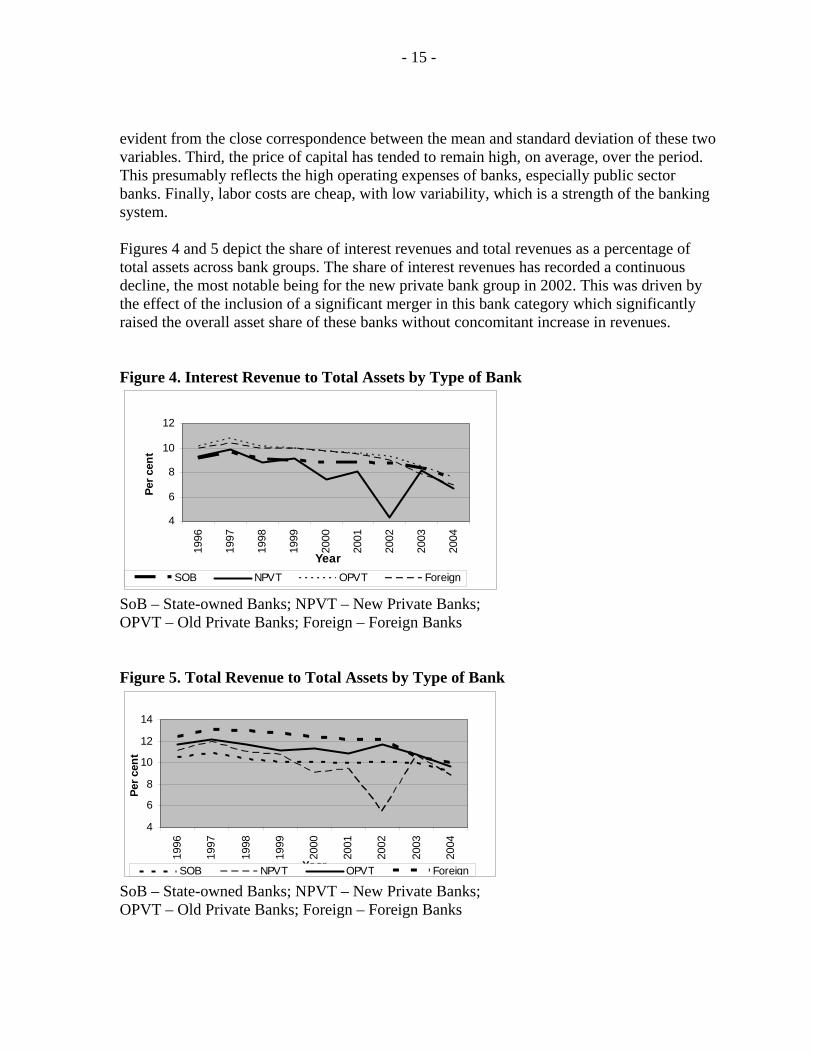
evident from the close correspondence between the mean and standard deviation of these two variables. Third, the price of capital has tended to remain high, on average, over the period. This presumably reflects the high operating expenses of banks, especially public sector banks. Finally, labor costs are cheap, with low variability, which is a strength of the banking system. Figures 4 and 5 depict the share of interest revenues and total revenues as a percentage of total assets across bank groups. The share of interest revenues has recorded a continuous decline, the most notable being for the new private bank group in 2002. This was driven by the effect of the inclusion of a significant merger in this bank category which significantly raised the overall asset share of these banks without concomitant increase in revenues. Figure 4. Interest Revenue to Total Assets by Type of Bank
4
6
8
10
12
1996
1997
1998
1999
2000
2001
2002
2003
2004
Year
Per c
ent
SOB NPVT OPVT Foreign
SoB – State-owned Banks; NPVT – New Private Banks; OPVT – Old Private Banks; Foreign – Foreign Banks Figure 5. Total Revenue to Total Assets by Type of Bank
4
6
8
10
12
14
1996
1997
1998
1999
2000
2001
2002
2003
2004
Year
Per c
ent
SOB NPVT OPVT Foreign SoB – State-owned Banks; NPVT – New Private Banks; OPVT – Old Private Banks; Foreign – Foreign Banks
- 16 -
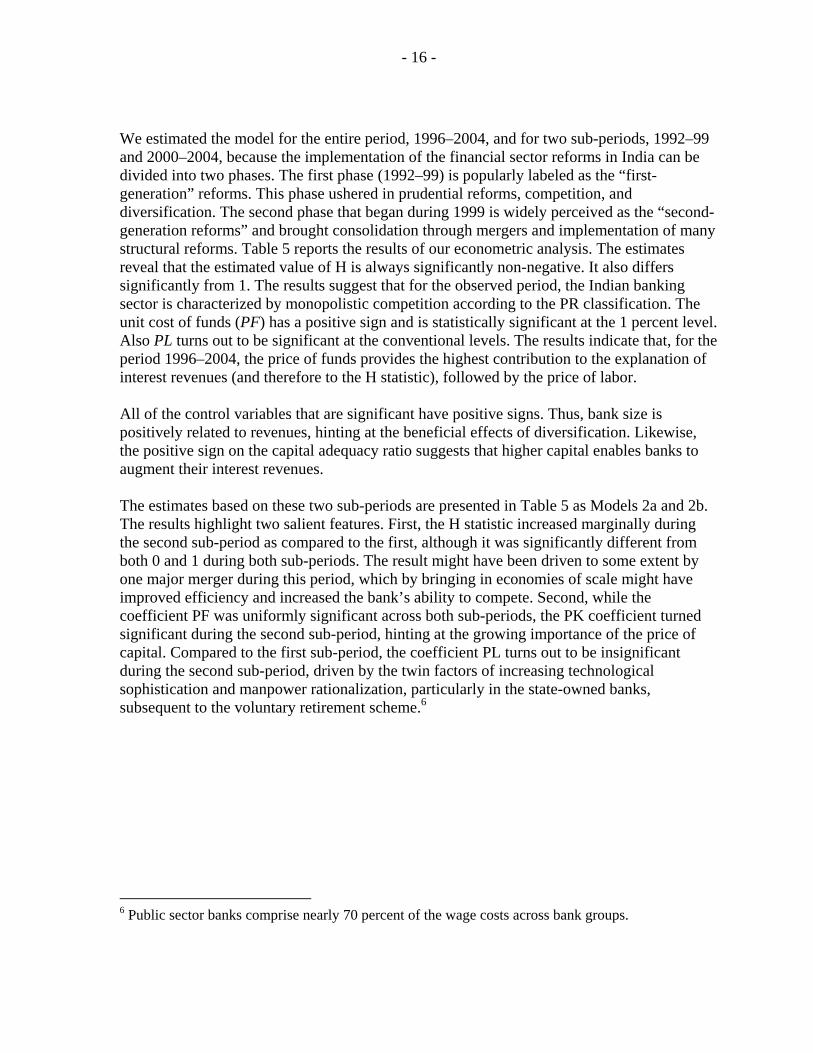
We estimated the model for the entire period, 1996–2004, and for two sub-periods, 1992–99 and 2000–2004, because the implementation of the financial sector reforms in India can be divided into two phases. The first phase (1992–99) is popularly labeled as the “first-generation” reforms. This phase ushered in prudential reforms, competition, and diversification. The second phase that began during 1999 is widely perceived as the “second-generation reforms” and brought consolidation through mergers and implementation of many structural reforms. Table 5 reports the results of our econometric analysis. The estimates reveal that the estimated value of H is always significantly non-negative. It also differs significantly from 1. The results suggest that for the observed period, the Indian banking sector is characterized by monopolistic competition according to the PR classification. The unit cost of funds (PF) has a positive sign and is statistically significant at the 1 percent level. Also PL turns out to be significant at the conventional levels. The results indicate that, for the period 1996–2004, the price of funds provides the highest contribution to the explanation of interest revenues (and therefore to the H statistic), followed by the price of labor.
All of the control variables that are significant have positive signs. Thus, bank size is positively related to revenues, hinting at the beneficial effects of diversification. Likewise, the positive sign on the capital adequacy ratio suggests that higher capital enables banks to augment their interest revenues.
The estimates based on these two sub-periods are presented in Table 5 as Models 2a and 2b. The results highlight two salient features. First, the H statistic increased marginally during the second sub-period as compared to the first, although it was significantly different from both 0 and 1 during both sub-periods. The result might have been driven to some extent by one major merger during this period, which by bringing in economies of scale might have improved efficiency and increased the bank’s ability to compete. Second, while the coefficient PF was uniformly significant across both sub-periods, the PK coefficient turned significant during the second sub-period, hinting at the growing importance of the price of capital. Compared to the first sub-period, the coefficient PL turns out to be insignificant during the second sub-period, driven by the twin factors of increasing technological sophistication and manpower rationalization, particularly in the state-owned banks, subsequent to the voluntary retirement scheme.6
6 Public sector banks comprise nearly 70 percent of the wage costs across bank groups.
- 17 -
Table 5. Estimation Results for the Indian Commercial Banks: Interest Revenue, 1996–2004
Dependent Variable = ln (Interest Revenue/Total Assets) 1996 – 2004 Sub-period 1,
1996 – 99 Sub-period 2, 2000 – 04
Model 1 Model 2a Model 2b Constant -3.181 (0.140)* -3.227 (0.173)* -3.424 (0.189)* ln PF 0.438 (0.024)* 0.382 (0.030)* 0.449 (0.029)* ln PL 0.052 (0.018)* 0.086 (0.029)* -0.004 (0.024) ln PK 0.021
(0.012)*** 0.0007 (0.013) 0.042 (0.016)*
ln (SIZE) 0.979 (0.012)* 0.959 (0.014)* 0.985 (0.016)* ln(LNASST) 0.007 (0.006) 0.872 (0.077)* 0.002 (0.005) ln (CRAR) 0.014
(0.008)*** 0.030 (0.014)** 0.021 (0.009)*
ln (BR) -0.015 (0.009) 0.026 (0.012)** 0.005 (0.012)* D5 0.059
(0.039)*** 0.032 (0.047) 0.018 (0.043)
H statistic 0.407 0.469 0.487 F-value on Wald test for H=0 149.32a 125.52a 147.96a
F-value on Wald test for H=1 316.11b 160.47b 163.09b
Diagnostics Adjusted R-square 0.989 0.994 0.989 Number of banks 64 64 64 Total panel observations 570 252 318 *, ** and *** indicate statistical significance at 1, 5, and 10 %, respectively
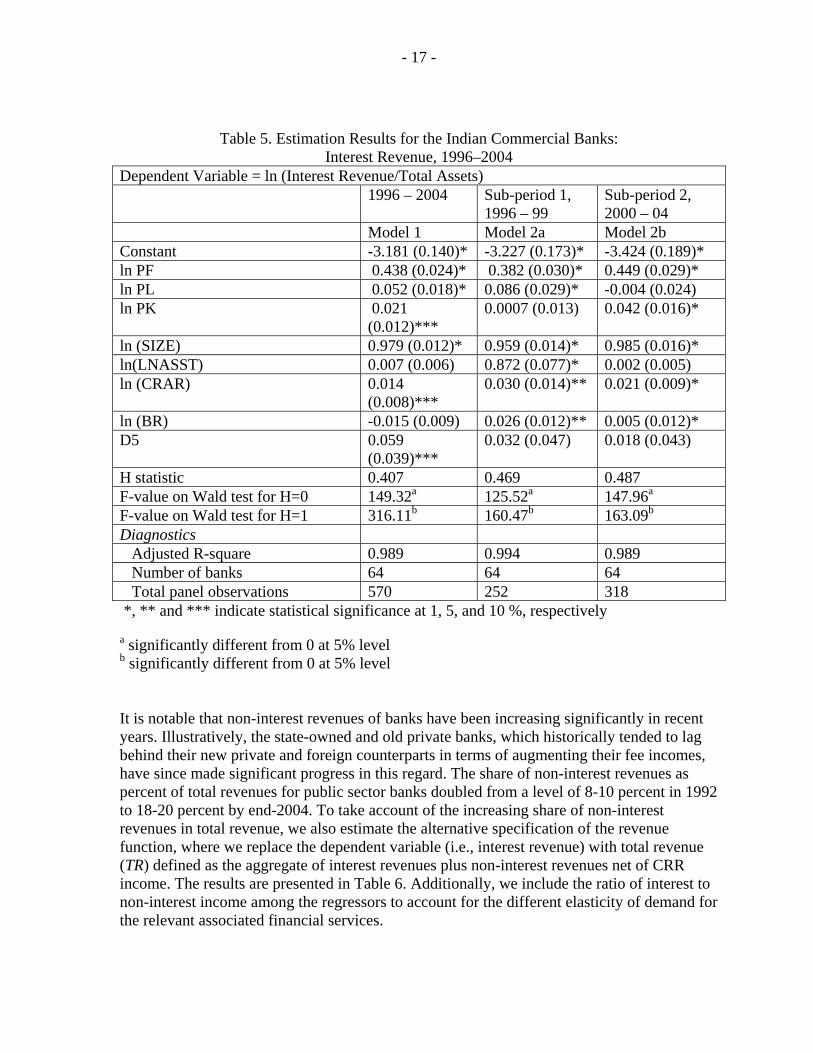
a significantly different from 0 at 5% level b significantly different from 0 at 5% level It is notable that non-interest revenues of banks have been increasing significantly in recent years. Illustratively, the state-owned and old private banks, which historically tended to lag behind their new private and foreign counterparts in terms of augmenting their fee incomes, have since made significant progress in this regard. The share of non-interest revenues as percent of total revenues for public sector banks doubled from a level of 8-10 percent in 1992 to 18-20 percent by end-2004. To take account of the increasing share of non-interest revenues in total revenue, we also estimate the alternative specification of the revenue function, where we replace the dependent variable (i.e., interest revenue) with total revenue (TR) defined as the aggregate of interest revenues plus non-interest revenues net of CRR income. The results are presented in Table 6. Additionally, we include the ratio of interest to non-interest income among the regressors to account for the different elasticity of demand for the relevant associated financial services.
- 18 -
Table 6. Estimation Results for the Indian Commercial Banks: Total Revenue, 1996–2004
Dependent Variable = ln (Total Revenue/Total Assets) 1996-2004 Sub-period 1,
1996 - 99 Sub-period 2, 2000 - 2004
Model 3 Model 4a Model 4b Constant -2.820 (0.143)* -2.896 (0.184)* -3.003 (0.189)* ln PF 0.367 (0.024)* 0.375 (0.031)* 0.367 (0.030)* ln PL -0.024 (0.019) 0.082 (0.029)* 0.024 (0.023) ln PK 0.025
(0.012)** -0.0009 (0.012) 0.053 (0.017)*
ln(SIZE) 0.982 (0.011)* 0.965 (0.015)* 0.981 (0.016)* ln(LNASST) 0.006 (0.005) 0.866 (0.079)* 0.0009 (0.005) ln (CRAR) 0.013
(0.007)*** 0.031 (0.015)** 0.018 (0.008)*
ln (BR) -0.023 (0.009)* 0.018 (0.012) -0.004 (0.012) ln (interest income/ non-interest income)
-0.065 (0.017)* -0.111 (0.022)* -0.075 (0.020)*
D 5 0.055 (0.036) 0.033 (0.049) 0.026 (0.042) H statistic 0.368 0.456 0.444 F-value on Wald test for H=0 128.04a 113.55a 132.91a
F-value on Wald test for H=1 377.16b 161.19b 207.93b
Diagnostics Adjusted R-square 0.990 0.994 0.989 Total Panel observations 570 252 318 Number of banks 64 64 64 *, ** and *** indicate statistical significance at 1, 5, and 10%, respectively
a significantly different from 0 at 5% level b significantly different from 0 at 5% level These results broadly mirror the earlier findings. Specifically, the value of the H statistic for the entire period is positive although much lower than earlier, confirming the existence of a monopolistic free-entry equilibrium. As in the earlier model, it is the price of capital that makes the second most important contribution to the H statistic, especially during the second sub-period. The contribution of the price of labor, which was significant during the first sub-period turns insignificant during the second. With regard to the control variables, bank size and capital adequacy once again turn out to be significant for the entire period; the magnitudes also are roughly of the same order as earlier. Of particular interest is the negative sign on the ratio of the interest to non-interest income. Economically, in an era of benign interest rates, the interest income of banks has been declining whereas their fee incomes have risen, driven by higher treasury incomes on government securities. Accordingly, this is likely to have lowered the ratio of interest to non-interest income. The lowering of this ratio has
- 19 -
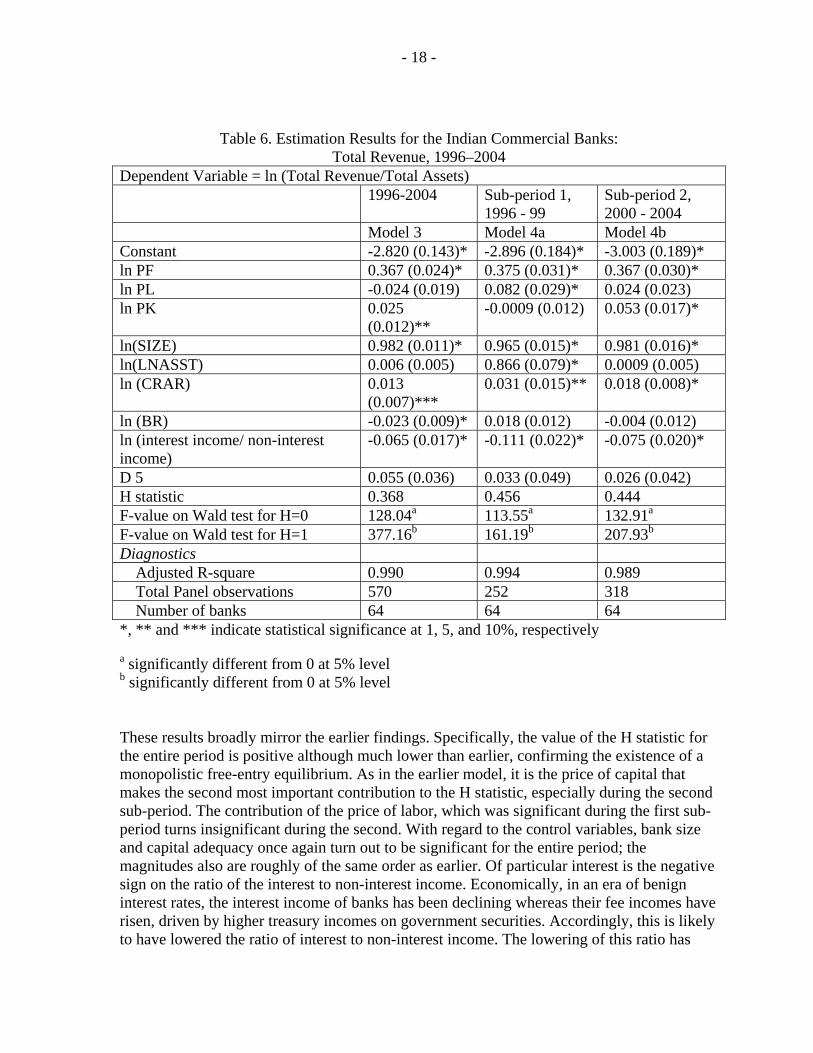
been associated with higher total revenues. The sub-period analysis indicates a marginal decrease in the H statistic during the second sub-period. Most control variables retain their sign and significance, as in the earlier specification. The analysis based on the sub-periods clearly reveals the increasing importance of capital cost in influencing the H statistic during the second sub-period.7
Table 7. Estimation Results for the Indian Commercial Banks: Interest Revenue by Type of Bank, 1996–2004
Public Sector Banks
New Private & Foreign Banks
Constant -1.298 (0.253)* -3.664 (0.325)* ln PF 0.161 (0.023)* 0.507 (0.042)* ln PL 0.059 (0.025)** -0.013 (0.039) ln PK 0.004 (0.015) -0.006 (0.029) ln (SIZE) 0.821 (0.023)* 0.981 (0.030)* ln(LNASST) 0.001 (0.003) 0.967 (0.124)* ln (CRAR) 0.062 (0.016)* 0.012 (0.014) ln (BR) 0.168 (0.026)* -0.010 (0.031) H statistic 0.224 0.488 F-value on Wald test for H=0 40.60a 61.54a
F-value on Wald test for H=1 487.25b 67.80b
Diagnostics Adjusted R-square 0.991 0.969 Number of banks 27 20 Total panel observations 243 174
*, ** and *** indicate statistical significance at 1, 5, and 10%, respectively
a significantly different from 0 at 5% level b significantly different from 0 at 5% level
7 We also re-estimate the baseline specification (3) using the weighted least squares (WLS) approach, where observations are weighted by the banks’ respective asset shares in a particular year. Intuitively, by providing higher weight to larger banks, the WLS procedure is better suited to capture the behavior of representative banks. The results (not reported) did not provide any significant additional insights and several of the variables had counterintuitive signs. More important, it seems that WLS methodology is more suited to a cross-country framework where the number of reporting banks differ across countries as reported by Levy Yeyati and Micco (2003) in their study of bank competition for several Latin American countries.
- 20 -
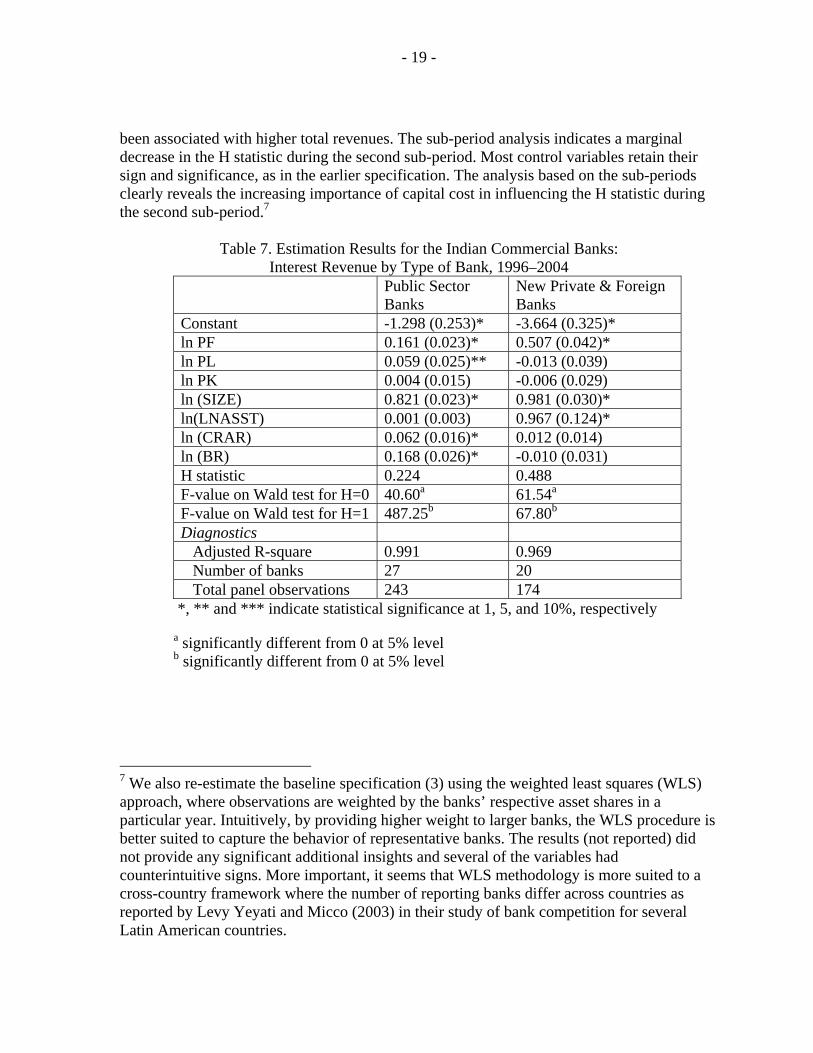
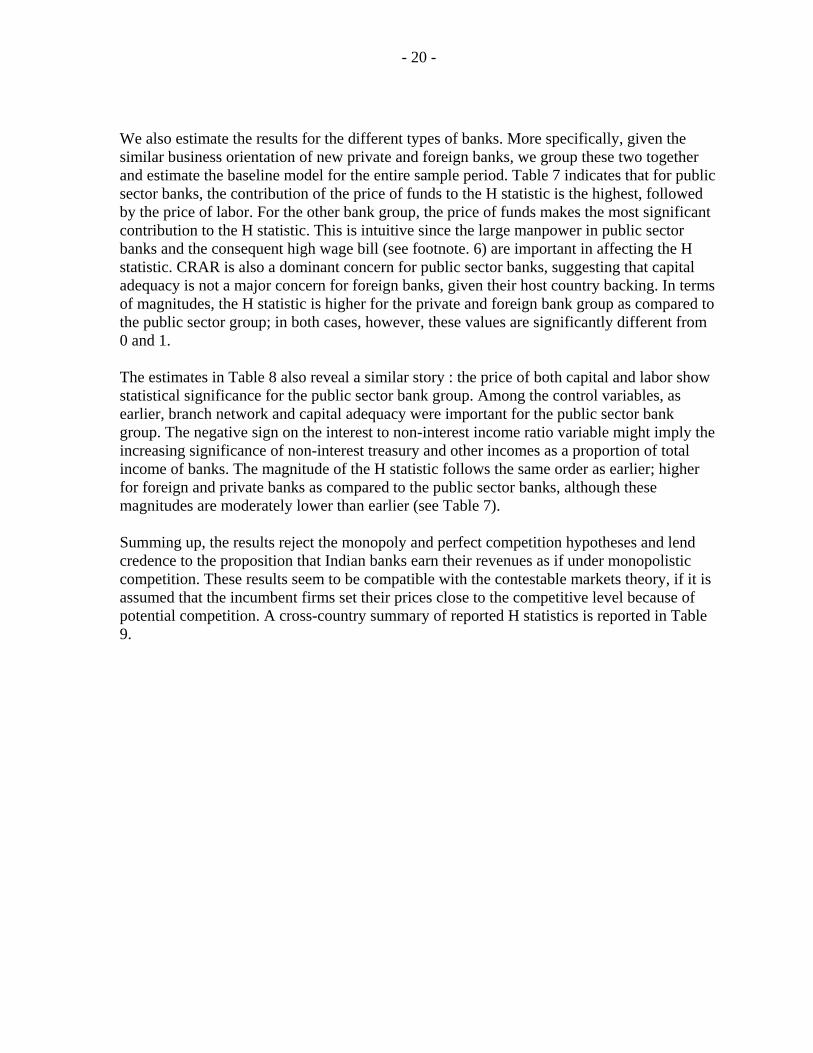
We also estimate the results for the different types of banks. More specifically, given the similar business orientation of new private and foreign banks, we group these two together and estimate the baseline model for the entire sample period. Table 7 indicates that for public sector banks, the contribution of the price of funds to the H statistic is the highest, followed by the price of labor. For the other bank group, the price of funds makes the most significant contribution to the H statistic. This is intuitive since the large manpower in public sector banks and the consequent high wage bill (see footnote. 6) are important in affecting the H statistic. CRAR is also a dominant concern for public sector banks, suggesting that capital adequacy is not a major concern for foreign banks, given their host country backing. In terms of magnitudes, the H statistic is higher for the private and foreign bank group as compared to the public sector group; in both cases, however, these values are significantly different from 0 and 1. The estimates in Table 8 also reveal a similar story : the price of both capital and labor show statistical significance for the public sector bank group. Among the control variables, as earlier, branch network and capital adequacy were important for the public sector bank group. The negative sign on the interest to non-interest income ratio variable might imply the increasing significance of non-interest treasury and other incomes as a proportion of total income of banks. The magnitude of the H statistic follows the same order as earlier; higher for foreign and private banks as compared to the public sector banks, although these magnitudes are moderately lower than earlier (see Table 7).
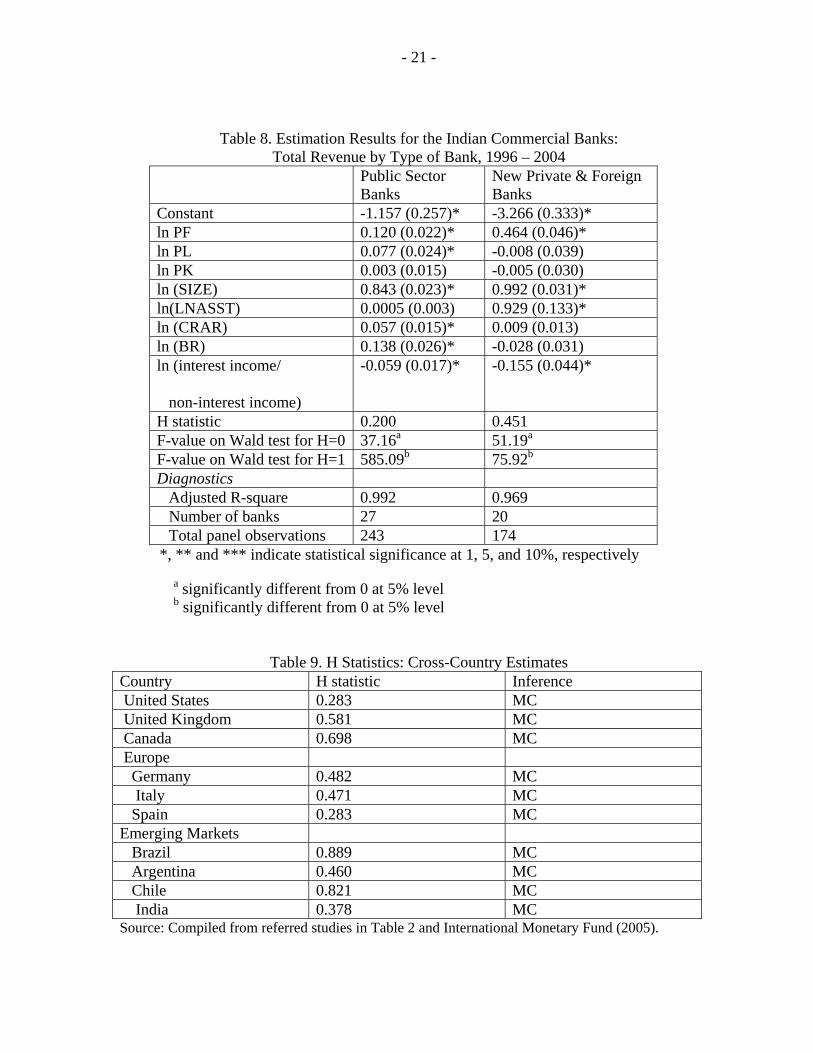
Summing up, the results reject the monopoly and perfect competition hypotheses and lend credence to the proposition that Indian banks earn their revenues as if under monopolistic competition. These results seem to be compatible with the contestable markets theory, if it is assumed that the incumbent firms set their prices close to the competitive level because of potential competition. A cross-country summary of reported H statistics is reported in Table 9.
- 21 -
Table 8. Estimation Results for the Indian Commercial Banks: Total Revenue by Type of Bank, 1996 – 2004
Public Sector Banks
New Private & Foreign Banks
Constant -1.157 (0.257)* -3.266 (0.333)* ln PF 0.120 (0.022)* 0.464 (0.046)* ln PL 0.077 (0.024)* -0.008 (0.039) ln PK 0.003 (0.015) -0.005 (0.030) ln (SIZE) 0.843 (0.023)* 0.992 (0.031)* ln(LNASST) 0.0005 (0.003) 0.929 (0.133)* ln (CRAR) 0.057 (0.015)* 0.009 (0.013) ln (BR) 0.138 (0.026)* -0.028 (0.031) ln (interest income/
non-interest income)
-0.059 (0.017)* -0.155 (0.044)*
H statistic 0.200 0.451 F-value on Wald test for H=0 37.16a 51.19a
F-value on Wald test for H=1 585.09b 75.92b
Diagnostics Adjusted R-square 0.992 0.969 Number of banks 27 20 Total panel observations 243 174 *, ** and *** indicate statistical significance at 1, 5, and 10%, respectively
a significantly different from 0 at 5% level b significantly different from 0 at 5% level
Table 9. H Statistics: Cross-Country Estimates Country H statistic Inference United States 0.283 MC United Kingdom 0.581 MC Canada 0.698 MC Europe Germany 0.482 MC Italy 0.471 MC Spain 0.283 MC Emerging Markets Brazil 0.889 MC Argentina 0.460 MC Chile 0.821 MC India 0.378 MC Source: Compiled from referred studies in Table 2 and International Monetary Fund (2005).
- 22 -
VII. CONCLUSIONS AND POLICY IMPLICATIONS
The study examined the degree of competition in the Indian banking system for the period 1996–2004 and the two-sub periods, 1996-99 and 2000-2004. The study tested the model using interest revenue and total revenue as dependent variables. Finally, the study estimated the model for two different bank groups — public sector and new private and foreign banks. The results point to monopolistic behavior of banks across time periods and across bank groups, with a more robust H statistic for the second sub-period and for private and foreign banks. The unit price of funds turned out to be significant in all specifications with positive coefficients. The unit price of labor turns out to be significant and positively related to interest and total revenue for the whole sample in the first sub-period and specifically for public sector banks. It was not statistically significant for the private and foreign bank group. The unit price of capital was significant for the second sub-period, with a positive coefficient.
The structure of the banking system is currently being shaped by the three Cs: competition, convergence, and consolidation. Of these, the increase in competition is widely acknowledged. A simple indicator, i.e., assets of public sector banks as a percent of total commercial banking sector assets, declined from over 90 percent in the beginning of the 1990s to around 75 percent at end-March 2004 — a decline of roughly 1 percent a year over a 15-year span. There is also an increasing convergence in activities as reflected in the overlapping of activities between banks and financial institutions. Consolidation activities have come into policy focus of late, with the delineation of a roadmap for the presence of foreign banks in India. The relevance of mergers has also been recognized in the Annual Policy for 2005–06:
…a Working Group was constituted by RBI to evolve guidelines for voluntary merger of banking companies. Based on the recommendations of the Group and in consultation with the Government, it is proposed to issue guidelines on merger and amalgamation between private sector banks and with NBFCs...The principles underlying these guidelines would also be applicable as appropriate to public sector banks, subject to relevant legislation. (Reserve Bank of India, 2005)
In this context, the present exercise provides empirical support for the assertion that the banking industry is more akin to a monopolistic competitive framework, a feature of banking structure in developed countries and other emerging markets. More important, this suggests that the competitive nature of the Indian banking system is not significantly different from the banking system in other countries, particularly in view of the fact that nearly 75 percent of banking system assets is with state-owned banks. The validation of monopolistic competition during the second sub-period suggests that the recent trends toward consolidation led to more rather than less competition in the banking sector. We also infer from the results that there is scope for further consolidation in the banking industry without compromising competition considerations.
- 23 -
REFERENCES
Alexander, D.L., 1988, “The Oligopoly Solution Tested,” Economics Letters, Vol. 28, pp.
361-64. Belaisch, A., 2003, “Do Brazilian Banks Compete?” IMF Working Paper 13 (Washington:
International Monetary Fund) Bhide, M.G., A. Prasad, and S. Ghosh, 2001, “Banking Sector Reforms: A Critical
Overview,” Economic and Political Weekly, Special Issue on Money, Banking, and Finance (February), pp. 399-408.
Bikker, J.A., and J.M. Gooenveld, 2000, “Competition and Concentration in the EU Banking
Industry,” Kredit und Kapital, Vol.33, pp.62-98. Bikker, J.A., and K. Haaf, 2002, “Competition, Concentration and their Relationship: An
Empirical Analysis of the Banking Industry,” Journal of Banking and Finance. Vol. 26(11), pp. 2191-214.
Breshanan, T.F., 1982, “The Oligopoly Solution Concept is Identified,” Economics Letters,
Vol.10, pp. 87-92. Breshanan, T.F., 1989, “Empirical Studies of Industries with Market Power,” In Handbook of
Industrial Organization, ed. by R. Schmalensee and R.D. Willig (Amsterdam: North-Holland), Vol. 2.
Buchs, Thierry, and Johan Mathisen, 2005, “Competition and Efficiency in Banking:
Behavioral Evidence from Ghana,” IMF Working Paper No.05/17 (Washington: International Monetary Fund).
De Bandt, O., and E.P. Davis, 2000, “Competition, Contestability and Market Structures in
European Banking Sector on the Eve of EMU,” Journal of Banking and Finance. Vol. 24, pp.1045-66.
Gelos, G.R., and J. Roldos, 2002, “Consolidation and Market Structure in Emerging Market
Banking Systems,” IMF Working Paper 186 (Washington: International Monetary Fund).
Government of India, 1991, Report of the Committee on the Financial System (Chairman:
Shri M. Narasimham) (New Delhi). Government of India, 1998, Report of the Committee on Banking Sector Reforms (Chairman:
Shri M. Narasimham) (New Delhi).
- 24 -
Indian Banks Association, Various Years, Performance Highlights of Banks (Mumbai). Levy Yeyati, E., and A.Micco, 2003, “Banking Competition in Latin America,” Working
Paper (Washington: Inter-American Development Bank). International Monetary Fund, 2005, “Competition in Canada’s Banking System,” in Canada:
Selected Issues (Washington). Lau, L., 1982, “On Identifying the Degree of Competitiveness from Industry Price and
Output Data,” Economic letters, Vol.10, pp. 93-99. Mohan. R., 2004, “Financial Sector Reforms in India: Policies and Performance Analysis,”
Lecture Delivered at the International Monetary Fund, Washington, DC. Molyneux, P., D.M. Lloyd-Williams, and J. Thornton., 1994, “Competitive Conditions in
European Banking,” Journal of Banking and Finance, Vol.18, pp. 445-59. Nathan, A., and E.A. Neave., 1989, “Competition and Contestability in Canada’s Financial
System: Empirical Results,” Canadian Journal of Economics, Vol. 22, pp.576-94. Panzar, J.C., and J.N. Rosse., 1987, “Testing for Monopoly Equilibrium,” Journal of
Industrial Economics, Vol. 25, pp. 443-56. Philippatos, G.C., and H. Yildrim., 2002, “Competition and Contestability in Central and
Eastern European Banking Markets.” (Cambridge, Massachusetts: Social Science Research Network), unpublished; available at: www.ssrn.com.
Rangarajan, C., 1998, Indian Economy: Essays in Money and Finance (New Delhi: UBSPD). Reddy, Y.V., 2000, “Financial Sector Reforms: Review and Prospects,” Monetary and
Financial Sector Reforms in India: A Central Banker’s Perspective (New Delhi: UBSPD).
Reserve Bank of India, 2004, Master Circular on Branch Licensing (Mumbai). Reserve Bank of India, 2005, “Annual Policy Statement for the year 2005-06” (Mumbai). Reserve Bank of India, 1954, Report of the All-India Rural Credit Survey Committee.
Mumbai. Reserve Bank of India (a), Various Years, Report on Trend and Progress of Banking in India
(Mumbai). Reserve Bank of India (b), Various Years, Statistical Tables Relating to Banks in India
(Mumbai).
- 25 -
Shaffer, S., 1982, “A Non-Structural Test for Competition in Financial Markets,” In Proceedings of a Conference in Bank Structure and Competition. (Chicago: Federal Reserve Bank of Chicago).
Shaffer, S., 1993, “A Test of Competition in Canadian Banking,” Journal of Money, Credit,
and Banking, Vol. 25, pp. 49-61.


