Consumer Price Inflation across the Income Distribution in South Africa Morné Oosthuizen Development Policy Research Unit University of Cape Town [email protected]Development Policy Research Unit DPRU Working Paper 07/129 November 2007 ISBN Number: 978-1-920055-56-1
3. Data and Methodology ..........................................................................10
3.1 Data .................................................................................................10 3.1.1 Expenditure Data ............................................................................... 10
3.1.2 Price Data ......................................................................................... 11
3.1.3 Matching Expenditure and Price Data ............................................... 12
3.2 Methodology ....................................................................................13 3.2.1 Weight Construction .......................................................................... 13 a. Plutocratic Weights .............................................................................. 14 b. Democratic Weights ............................................................................ 15
3.2.2 Calculation of Inflation Rates ............................................................. 16
3.3 Comparability with Official CPI Statistics ..........................................17
4.6.2 The Changing Drivers of Inflation Across the Distribution between
1997 and 2006................................................................................... 40
4.6.3 Identifying Key Products Responsible for the Difference in Inflation for Poor Households Compared to Other Groups .............................. 52
Alternatively, groups are defined according to some demographic or household characteristic,
such as age or family structure (see Amble & Stewart, 1994; Idson & Miller, 1999; McGranahan
& Paulson, 2006).
DPRU WP 07/129 Morné Oosthuizen
4
The second issue revolves around the bias inherent in the standard calculation of the weights
used by statistical agencies to calculate price indices. Standard practice sees expenditures
on a given item totalled across households and then divided by total household expenditure
across all items and households. These weights are termed plutocratic weights. However,
one of various alternative methods first calculates expenditure weights for all households
individually, with the overall weight calculated as the mean across all households. According to
Prais (1959: 126), the latter method, known as the democratic method, “attaches equal weight
to each household in calculating the Weight of the commodity in the index … [while] … the
conventional [or plutocratic] method gives a result equivalent to taking an unequally weighted
average of the proportions for each household, the weights being the total expenditure on
all commodities by that household”. Differences in calculation of the weights impact on the
representivity of the resulting price indices, with the plutocratic index biased towards the upper
end of the income/expenditure distribution.
2.1 International Studies
Much of the international (non-African) work investigating group-specific price indices has
established some consensus on a number of issues. The main conclusion is that there is
generally little difference in the rates of inflation between groups and, where differences are
found, no single group experiences consistently higher or lower rates of inflation relative to
other groups over the longer run. However, evidence does seem to show that there is a greater
dispersion in inflation rates during periods of above average inflation.
These findings are consistent across various methods of grouping households. For example,
Garner et al. (1996) investigate possible differences in experimental price indices of US poor
and non-poor households, covering the period between 1984 and 1994, and find that the price
indices of poor households do not differ much from those of the urban population as a whole
(Garner et al., 1996: 40). A Canadian study by Taktek (1998) analyses movements in price
indices for low-income households, senior citizen households and low-income senior citizen
households, over a relatively short period from 1993 (index equals 100) to 1996. The author
finds little dispersion between the three indices and the overall index, with the gap between
the highest and lowest indices never exceeding two percentage points. Other studies grouping
households by income with similar findings include Murphy and Garvey (2004) on Irish data
between 1989 and 2001 and Michael (1979) on US data for the period 1967 to mid-1974.
Idson and Miller (1999) investigate how their different expenditure patterns result in
differing inflation rates for US families with and without children, with a view to provide
improved estimates of child poverty trends. For the two decades between 1968 and
1987, the authors find that families with children experienced lower rates of inflation
than those without children. This they link to the fact that families with children tend to
be younger than those without and younger families tend to have lower rates of inflation.
Consumer Price Inflation across the Income Distribution in South Africa
5
The presence of children in a family does not shift family expenditure to low inflation
items as the authors find that, controlling for the family head’s age, children actually
result in greater consumption of higher inflation goods and services. However, these
findings did not materially affect the estimates of child poverty and the authors concluded
that a separate price index for families with children was, at the time, unnecessary.
Hobijn and Lagakos (2005), for the period 1987-2001, find that the elderly faced above
average rates of inflation in the US, while the converse was true for households with children
under the age of 18 years. The authors ascribe the considerable variation of household-
specific inflation rates to three expenditure categories in particular, namely education, health
care and gasoline, the former two exhibiting relatively rapid increases in prices over the period,
while the price of the latter was extremely volatile. As in other studies, rapid healthcare price
inflation was linked to the elderly population’s relatively high inflation rate. A further finding of
interest is that households that experienced above average rates of inflation in one year were
not very likely to experience above average rates of inflation in the following year.
McGranahan and Paulson (2006) analyse the inflation experiences of 31 demographic groups
and contrast them with each other and the experience of the urban population as a whole in
the US between 1983 and 2005. They find that, overall, the inflation experiences of vulnerable
groups have not been very different on average to that of the total urban population, although
vulnerable groups have been prone to greater variability in the rate of inflation experienced:
inflation was “3.0% more volatile for the bottom equivalent income quartile than for the
population generally” (McGranahan & Paulson, 2006: 34).
Only one study was found that contradicts the finding that different groups do not experience
long term differences in inflation rates. The study by Lieu et al. (2004), using data from Taiwan,
finds that there is “statistically significant evidence to support the claim that different household
groups face differential price changes, and that these variations are persistent” (Lieu et al.,
2004: 119). Specifically, households in the second quintile, those with heads younger than 20
years, those with children and those in urban areas were found to experience higher rates of
inflation between 1991 and 1996. However, this study covers a fairly short period of only five
years, which is arguably insufficient time to claim persistent variations between groups.
Several studies find that periods characterised by above average inflation rates are also
characterised by greater dispersion in inflation rates amongst groups. The 1961 study by
Snyder, one of the earliest investigations of group-specific price indices, on US data for the
period 1936 to 1955, calculates experimental price indices for low and high income groups
(as summarised by Garner et al., 1996: 33).1 During recessions, it was found that the prices
1 Unfortunately, due to the age of the study by Snyder, it has not been possible to locate a freely available electronic version or a locally available hard copy. This means that only second-hand information about this study is available for inclusion here.
DPRU WP 07/129 Morné Oosthuizen
6
of items consumed in relatively greater amounts by the poor declined more slowly than those
of items consumed more often by middle-income households. However, “[during] periods of
full employment and rising prices, the prices of ‘low-income’ items rose, but at a more rapid
rate than did the prices of commodities most likely purchased by higher income households”
(Garner et al., 1996: 33). However, this finding did not extend to indices calculated from food
expenditure data from 1955.
Crawford and Smith (2002) use data from the United Kingdom’s Family Expenditure Survey for
the quarter century between 1975 and 1999 to investigate the distribution of inflation rates and
the differences between various group price indices. They find substantial variation in inflation
rates across different households for a given period, with the dispersion being positively related
to the mean level of inflation. In terms of the group indices calculated in the study, households
with children experienced very similar rates of inflation to their childless counterparts, while
pensioners experienced relatively low rates of inflation.
Finally, Artsev et al. (2006) investigate the differences in the rates of inflation experienced
by different households and, specifically, the degree of dispersion in inflation rates across
households, in Israel between January 1999 and December 2005. They find that, although
there are relatively small differences across households in the rates of inflation experienced,
dispersion (as measured by the inter-quartile range) increases as the median inflation rate
increases (Artsev et al., 2006: 6). The authors conclude that the overall consumer price index
is generally good reflection of the inflation experiences of most households.
Studies that have investigated different ways of constructing the expenditure weights
underlying consumer price indices, calculating plutocratic and democratic inflation rates, have
generally found there to be little difference between the two types of indices. Crawford and
Smith (2002: 31) find that, although their calculated plutocratic and democratic indices are
often statistically different from each other, “[there] is no persistent ‘bias’ in either direction
in the plutocratic index compared to the democratic index over the period studied”. Similarly,
Artsev et al. (2006) find little difference in the plutocratic and democratic indices over the
period, indicating that neither upper- nor lower-income groups experienced consistently higher
rates of inflation.
Kokoski (2000) analyses the differences between plutocratic and democratic consumer price
index aggregations for the United States between 1987 and 1997. Using data at the most
disaggregated level possible, the author finds little difference between the two indices, with the
democratic index generally higher. The biggest difference between the two indices is just over
one index point, occurring in 1990/1 during a relatively high inflation episode. An examination
of the two index types across expenditure quintiles, however, reveals very little difference
between the two indices. In an attempt to glean better evidence of differences between
plutocratic and democratic indices, price changes of luxuries and necessities are simulated,
but “[only] in extreme scenarios, in which price changes were measured for expenditures on
Consumer Price Inflation across the Income Distribution in South Africa
7
inelastic goods, did the democratic and plutocratic index values show a difference … of about
1 index point for every 10-percent increase in the relative prices of these goods” (Kokoski,
2000: 38).
2.2 African Studies
Very little work on this topic has been undertaken in Africa generally, and South Africa in particular. McKay and Sowa (2004) investigate inflation rates across households in different locations and by income groups using the Ghana Living Standards Survey conducted in 1998-1999. The analysis is conducted at a very high level of aggregation – using only nine main commodity groups – and does not find significant differences in the rates of inflation faced by poor households compared to the population as a whole. This is due to the “remarkable consistency in patterns of purchases across household groups” at this level of aggregation (McKay & Sowa, 2004: 16). However, in further analysis of some of the major food categories, the authors do find important differences in the types of food purchased by households of different income levels.
The only published South African study that was located was that of Kahn (1985), which
calculates consumer price indices for various groups defined by location, income and race.
Over the seven year period between 1975 and 1982, Kahn calculated that the poorest three
groups in both Cape Town and Johannesburg experienced average inflation rates that were
above the national average (Table 1). From a base of 100 in 1975, the CPI for Blacks with
incomes of between R250 and R499 per annum in Cape Town rose to 246.0 by 1982, while
that of their Johannesburg counterparts increased to 242.7. In contrast, the overall CPI
increased to 233.7 over the same period, while that of the highest income Whites, those
earning in excess of R15 000 per annum, rose to only 229.4. However, Kahn’s figures also
reveal that for the first two years of the period, these same three poorest groups had lower
CPIs than high-income Whites in both cities. While Kahn (1985: 11) notes that the differing
expenditure patterns of the various groups gave rise to the differing CPIs, but concludes
that “in general the lower income groups are faced with a higher CPI than the higher income
groups”.
Table 1: Consumer Price Indices by Race, Income and Location, South Africa, 1982
Source: Own calculations, IES 2000 (Statistics South Africa 2002b)Note: The dataset used includes metropolitan and other urban areas only.
3.1.2 Price Data
Statistics South Africa collects extremely detailed price data on a monthly basis for the
calculation of the CPI in their monthly Survey of Retail Prices. Prices are collected for all
“consumer goods and services in the basket sold by … retail trade and service outlets to
consumers in the 14 metropolitan and 39 other urban areas” across the country (Statistics
2 It is important to note that descriptive statistics presented here and elsewhere are based on the cleaned, reconstructed dataset that does not include all expenditure categories, and not on the original version of the IES 2000.
DPRU WP 07/129 Morné Oosthuizen
12
South Africa, 2002a: 1). It is from this data that the official consumer price indices are
calculated. This means that the official inflation rate is an urban-based inflation rate, and can not
be assumed to accurately reflect the situation in rural areas with respect to price movements.3
There are two types of price data available from Statistics South Africa that would be of use in
this study, namely actual raw price data and calculated price indices, both at a very detailed
level. The detailed raw price data, however, is problematic in that there often exist multiple
series of price data for a single expenditure weight linked to a single expenditure category in
the IES, which necessitates the application of some type of weighting system within a single
expenditure category in order to combine prices. For example, there is a weight in the CPI for
‘white bread’, but in the raw price data there are separate mean prices for 700 gram loaves
and 800 gram loaves of white bread, with little public information available on the relative
importance of these types of loaves within total white bread consumption. Consequently, price
indices for each expenditure category were utilised. These indices already take into account
the extensive information that Statistics South Africa has on the various types, quantities and
qualities purchased by consumers for any given expenditure category.
The price data utilised in this study covers the period from January 1997, which is the start of
the majority of these price series, to December 2006, a total of ten years or 120 months. This
allows for the construction of a relatively long inflation series of 108 months, or nine years.
3.1.3 Matching Expenditure and Price Data
Expenditure categories as contained in the IES 2000 and the price data obtained from
Statistics South Africa do not correspond exactly. In fact, the price data does not correspond
directly with the expenditure categories as published in the CPI release by Statistics South
Africa (Statistics South Africa, 2002a). Consequently, the expenditure data and, in some cases,
the price data needed to be realigned to provide a proper match across datasets.
The most common adjustment required the consolidation of expenditure items in the IES
to match a given price item as contained in Statistics South Africa’s price data utilised in
this study. For example, within the Fruit and Nuts expenditure category of the IES 2000,
separate expenditure categories exist for Apples and Other deciduous fruit respectively. In the
price dataset, however, there exists only a single price for deciduous fruit and, consequently,
expenditures in the IES 2000 for these two items are combined to form a single item,
Deciduous fruit. This procedure is followed to construct many of the various ‘other’ expenditure
categories.
3 The rural consumer price index that Statistics South Africa began publishing in 2003 is also calculated on the basis of prices in urban areas, specifically on prices collected from outlets in the ‘smaller towns’ or ‘other urban areas’ (Statistics South Africa 2007: 7). Thus, it is also technically not necessarily an accurate reflection of rural inflation.
Consumer Price Inflation across the Income Distribution in South Africa
13
Statistics South Africa does not collect monthly data on all items included in the CPI calculation
and, where items lack price data, they assume that the price changes of the expenditure
category can proxy for the actual price changes of individual items for which no price data is
collected. In these instances, where expenditure items in the IES 2000 lack corresponding
price data, it is assumed in this study that the price changes for the relevant (sub-)category
proxy that of the specific expenditure item. For example, within the Transport expenditure
category, Statistics South Africa does not collect price data on taxi transport. To create a price
series for taxi transport, a price index is created using other items within the public transport
subcategory (bus, train and air transport) and this price series is then applied to the taxi
transport weight when calculating the overall price index. Obviously, there may be issues
as to the suitability of this calculation. In the case of taxi transport, it may be argued that the
cost of taxi transportation is more likely to vary in line with the petrol price than some index of
other modes of public transport. However, since this is the method followed by Statistics South
Africa, it is used in this study.
In some instances, price data is available for only part of the period under investigation. In
this instance, a similar method as described above is employed to complete the price series.
It is assumed that the price of the item with an incomplete price series moves in line with price
index for the relevant (sub-)category, with the calculated index being applied to the missing
section of the item’s price series, whether at the start or the end of the series.
Some expenditure categories are more aggregated than the corresponding price data,
meaning that two or more price series refer to a single expenditure weight. In such cases, the
price relatives are averaged across the price series and a new consolidated price series is
generated and applied to the expenditure weight in the price index calculation. For example,
there are separate price indices for brown bread and wholewheat bread, while in the IES 2000
there is a single expenditure category, brown and wholewheat bread. Each price series is
converted to a series of price relatives (the price in a given period being divided by the price in
the previous period) and the individual series are then averaged in each period. This averaged
series is then used to construct a price index for the single expenditure category.
3.2 Methodology
3.2.1 Weight Construction
Consumer price indices are calculated for various applications, such as the monitoring of the
general price level in the economy for monetary policy purposes, the indexation of wages and
social spending benefits, and for deflating incomes and prices for comparisons over time.
For national statistical agencies, perhaps the most important application is the consumer
price index as an input for the monetary policymaking process, the CPI reflecting general or
economy-wide inflation. This provides monetary authorities with both a target for monetary
policy and a measure of the success of anti-inflationary policy. However, consumer price
DPRU WP 07/129 Morné Oosthuizen
14
indices on their own do not necessarily accurately reflect an economy’s price inflation, since
they do not take into account the prices of “capital goods, such as houses, or the goods and
services consumed by enterprises or the government” (International Labour Organisation,
2004: 36).
Apart from this criticism, consumer price indices are unable to provide an indication
of average consumer inflation, where the term ‘average’ is applied across households or
consumers. Statistics South Africa defines the consumer price index as “a series of figures
(numbers) showing how the average price level of those goods and services (basket of goods
and services) bought by a typical consumer or household changes over time” (Statistics South
Africa, 2002a: 1). As a result, CPI inflation is interpreted by economic agents, from individuals
and households, to the media and government, as the inflation rate experienced by the
‘average’ household. This, however, is not true, the structure of the expenditure weights of
commonly calculated consumer price indices being biased towards those at the upper end
of the expenditure distribution. In South Africa, for example, the structure of the expenditure
weights for historical metropolitan and other urban areas most closely reflects the spending
patterns of the higher income groups. For the main expenditure categories (for example,
Food, Alcoholic Beverages and Transport), the official CPI weights consistently fall between
those of the upper two quintiles, referred to by Statistics South Africa as the High and Very
High income groups for both 1995 and 2000.
This bias is linked to the fact that the Very High income group (the top quintile) accounts
for more than two-thirds of the weight of the official CPI in both 1995 and 2000, with this
proportion actually having risen from 68.4 percent to 71.3 percent over the period (Statistics
South Africa, 2002a: 3). In contrast, the lowest three quintiles accounted for approximately
12 percent of the weight in 2000, despite accounting for 60 percent of households and, in all
likelihood, an even greater proportion of the population, given the greater average household
size amongst poorer households.
a. Plutocratic Weights
The conventional method of deriving expenditure weights for official consumer price indices
employed by Statistics South Africa and all other national statistical agencies internationally
entails the aggregation of expenditure on a specific item across all households and then
calculating the share of this aggregate within total consumer expenditure. For example, the
sum of all households’ expenditures on paraffin is calculated and the sum of all households’
expenditures on all goods and services is calculated, with the share of the former within the
latter being the weight of paraffin in the consumer price index. Mathematically, this is stated
as:
Consumer Price Inflation across the Income Distribution in South Africa
15
n
i
H
h
hi
H
h
hi
pi
e
ew
1 1
1
(1)
where wi is the weight of product i for i = 1,…,n items, e
i represents the expenditure on
product i, and the superscript h denotes the household for h = 1,…,H. This implies that the
CPI “can be interpreted as a weighted average of household price indexes … [the] weight of
each household [being] its total expenditure” (Ley, 2005: 635). This, then, is the mathematical
reason for the fact that the top quintile in South Africa accounts for more than 70 percent of the
weight of the CPI in the 2000 weights. Such weights are termed plutocratic weights and are
currently used by virtually all countries.
This bias towards the characteristics of the expenditure patterns of those at the upper end
of the expenditure distribution does not, however, invalidate the plutocratic method as used
by statistical agencies around the world. As the CPI is used as an indicator of economy-wide
inflation or as a deflator of national account and other such aggregates, it is preferable that the
index is weighted according to total consumer spending, as the plutocratic index is. It merely
points to the fact that where the analysis involves households in the middle of the distribution,
or even at the lower end of the distribution, plutocratic weights are no longer the most suitable
option.
b. Democratic Weights
An alternative method of calculating weights eliminates the bias that arises from the fact
that plutocratic weights are a weighted mean of individual household price indices, where
the weight is that household’s expenditure. Democratic weights entail a change in the unit of
analysis, from the product to the household. In order to arrive at an index that approximates
the inflation experience of households in the middle of the expenditure distribution, differential
weighting of households must be eliminated so that each household’s structure of expenditure
contributes equally to the overall weights. Essentially, the expenditure weights for each
individual household are derived and these are then averaged to obtain the democratic
weights. Mathematically, this is represented as:
H
h n
i
hi
hid
i
e
eH
w1
1
1
(2)
utilising the same notation as above. Thus, the democratic weight for white sugar, for example,
DPRU WP 07/129 Morné Oosthuizen
16
is the mean across all households of the share of white sugar within each household’s total
expenditure. The bias towards the upper end of the distribution is eliminated since the poorest
20 percent of households and the richest 20 percent of households each account for 20
percent of the democratic index’s weight.
A given product’s income elasticity will determine the difference between the plutocratic
and democratic estimates of its weight within a price index. Items with income elasticities in
excess of one (referred to as ‘luxuries’) will account for a greater proportion of expenditure
amongst higher income households, while those with elasticities of below one (referred to
as ‘necessities’ if the elasticity is positive, and ‘inferior goods’ if the elasticity is negative) will
account for a smaller proportion of expenditure as income rises. Thus, as Prais (1959: 127)
points out, plutocratic weighting structures attach greater importance to luxury items and less
importance to necessities than the democratic method.
3.2.2 Calculation of Inflation Rates
Official South African consumer price indices, as in most other countries, are fixed-weight
Laspeyres-type indices. Expenditure weights are calculated at a given point in time and are
used until such time as further use would compromise the weights’ ability to accurately reflect
expenditure patterns in reality, at which time new expenditure weights are calculated. This re-
estimation of expenditure weights typically occurs once every five years in South Africa on the
basis of data collected in the Income and Expenditure Surveys. The price indices are not true
Laspeyres indices due to the fact that updates to expenditure weights on the one hand, and
prices on the other are not synchronised, the weights being updated quinquennially and prices
monthly.
The Laspeyres price index is calculated as:
1001 0,
,0,0,
n
i i
tiit p
pwL (3)
where wi,0
is the average expenditure share for item i for the sample of households in period 0,
and pi,t and p
i,0 are the prices of good i in periods t and 0 respectively. The use of unchanging
weights is the target of one of the main critiques of Laspeyres(-type) price indices, since they
do not allow for substitution by consumers in response to price changes. Thus, although
rising relative prices may induce consumers to substitute away from a given product, the
Laspeyres index does not reflect this behavioural change. Consequently, this type of index
reflects an upper bound for the true change in the cost of living. This problem, though, will not
affect decile-specific price indices in the same way, since poorer households and consumers
have more limited scope to alter their spending patterns in the face of price increases. Thus,
amongst the poorest groups, the gap between the true value of the price index and the actual
measured value will be relatively narrower.
Consumer Price Inflation across the Income Distribution in South Africa
17
Once the price indices have been calculated, year-on-year inflation rates are calculated
according to the standard percentage change formula.
3.3 Comparability with Official CPI Statistics
Although one may wish to compare the CPI inflation figures presented below with official
inflation data as calculated and published by Statistics South Africa, the consumer price
indices that are calculated in this paper are not strictly comparable with official CPI figures.
This is due to a number of factors, which are discussed below.
Firstly, Statistics South Africa employed the 1996 Census to construct the sample frame and
to weight the data collected in the Income and Expenditure Survey of 2000, since that was
the most recent Census at that time. Subsequently, the 2001 Census has been conducted
and Statistics South Africa has gradually begun reweighting recent surveys, most notably
the Labour Force Surveys and very recently the 2000 IES, with 2001 Census weights. For
the purposes of this study, it was decided that the 2001 Census weights would be most
appropriate and consequently the indices presented below differ from official indices in terms
of survey weighting
Secondly, while all expenditure data used to construct the expenditure weights in this paper
have derived from the IES 2000, this is not true of official statistics. For numerous expenditure
categories, Statistics South Africa employs supplementary data that enable it to provide greater
detail and texture to the data. For example, data from the South African Meat Board is utilised
to establish precisely which cuts and of which types of meat are sold to consumers. These
types of breakdowns are then used to establish more precise weights to attach to the very
detailed price information, thereby constructing the price indices used in this study. Further,
use of the International Trade Classification results in a redistribution of expenditures as
measured in the IES to different CPI categories. For example, beef mince is moved from ‘Beef
and Veal’ to ‘Other Meat and Meat Products’, while baby foods containing meat or cereal
products, for example, are reclassified under meat and cereal products respectively (Bennett,
2006). In the process, there is some shifting of expenditure between categories and, therefore,
the official CPI weights do not always correspond exactly to the IES weights.
The CPI presented in the following section is essentially akin to the CPIX (CPI less interest on
mortgage bonds) published by Statistics South Africa on a monthly basis.
DPRU WP 07/129 Morné Oosthuizen
18
4. Results
4.1 Overall Expenditure Weights
For the purposes of this study, both plutocratic and democratic expenditure weights
were calculated for households located in the so-called historical metropolitan and other
urban areas of South Africa. Figure 1 presents the plutocratic weights for urban areas in
2000 for the 17 expenditure categories. From the figure, it is clear that three expenditure
categories account for the bulk of expenditure by urban households, namely Food, Housing
and Transport. Expenditure on food accounts for almost one-quarter (23.7 percent) of total
expenditure, followed by housing at 18.6 percent and transport at 15.0 percent. Thus, these
three expenditure categories account for 57.4 percent of total household expenditure.
Nine expenditure categories account individually for between three and six percent of total
household expenditure, with Clothing and Footwear (5.0 percent) being the most important
expenditure category. Reading Material, at 1.0 percent of expenditure, is the least important
group, apart from the Other Goods and Services group (0.9 percent).
Figure 1: Plutocratic Expenditure Weights for Urban Areas, 2000
0.94.3
3.71.0
3.73.3
15.04.64.2
3.24.4
18.65.0
1.41.71.2
23.7
0.0 5.0 10.0 15.0 20.0 25.0
Share of Expenditure (Percent)
Other Goods & ServicesPersonal Care
EducationReading Material
Recreation & EntertainmentCommunication
TransportMedical Care
Household OperationFurniture & Equipment
Fuel & PowerHousing
Clothing & FootwearTobacco Products
Alcoholic BeveragesNon-Alcoholic Beverages
Food
Historical Metropolitan and Other Urban Areas
Source: Own calculations, IES 2000 (Statistics South Africa)
Democratic expenditure weights for 2000 differ quite considerably from the plutocratic weights.
On average, expenditure on food accounts for the largest share of total expenditure, the weight
of 36.6 percent being more than 50 percent higher than the plutocratic weight. Other categories
that see increases in their weights when calculated democratically include Fuel and Power
(4.4 percent to 6.2 percent) and Personal Care (4.3 percent to 6.1 percent). Similarly, both
alcoholic and non-alcoholic beverages and tobacco products are more important within the
democratic weight structure compared to the plutocratic structure. The importance of housing
Consumer Price Inflation across the Income Distribution in South Africa
19
and transport is much reduced in the democratic bundle, falling from 18.6 percent and 15.0
percent to 10.9 percent and 9.5 percent respectively. Similarly, Medical Care, Communication,
Recreation and Entertainment and Education are less important within the democratic weight
structure.
Figure 2: Democratic Expenditure Weights for Urban Areas, 2000
0.76.1
2.80.82.32.5
9.52.83.73.0
6.210.9
6.52.02.01.7
36.6
0.0 5.0 10.0 15.0 20.0 25.0 30.0 35.0
Share of Expenditure (Percent)
Other Goods & ServicesPersonal Care
EducationReading Material
Recreation & EntertainmentCommunication
TransportMedical Care
Household OperationFurniture & Equipment
Fuel & PowerHousing
Clothing & FootwearTobacco Products
Alcoholic BeveragesNon-Alcoholic Beverages
Food
Historical Metropolitan and Other Urban Areas
Source: Own calculations, IES 2000 (Statistics South Africa)
While the ‘representative household’ of the conventional definition of consumer price indices
does not exist, it is worth investigating which households’ expenditure patterns most closely
resemble the plutocratic and democratic weight structures. This is done through the simple
calculation of correlation coefficients between a given pattern of expenditure and the plutocratic
or democratic weighting structures. Figure 3 presents the moving average of the correlation
coefficients calculated across 1 000 expenditure quantiles.
DPRU WP 07/129 Morné Oosthuizen
20
Figure 3: Correlation of Urban Household Expenditure Patterns with Mean Expenditure Pattern
Source: Own calculations, IES 2000 (Statistics South Africa)Note: Mean correlation coefficients are calculated as 21 observation moving averages of the correlation coefficients
of the 1000 expenditure quantiles.
The figure clearly demonstrates the varying ability of both the plutocratic and the democratic
weighting structures to reflect the patterns of expenditure at different points of the distribution.
Specifically, as one moves up the expenditure distribution, the plutocratic weighting structure
provides a continually improving match with the relevant households’ expenditure patterns. It is
only at the very top end of the distribution that the correlation weakens. The plutocratic weight
structure most closely resembles the expenditure patterns of households in the 95th percentile
of the expenditure distribution. This clearly confirms that the official inflation rate as calculated
by Statistics South Africa cannot reflect the experience of “a typical consumer or household”
(Statistics South Africa, 2002a: 1). In contrast, the composition of expenditure according to
the democratic weighting method is closest to the expenditure patterns observed at the 46th
percentile.
This problem is not unique to South Africa, although the extreme levels of inequality in South
African society do accentuate it. Muellbauer (1974) found that the plutocratic weighting
structure in the UK most closely resembled households in the 71st percentile, while in the
United States, using the 1990 Consumer Expenditure Survey, Deaton (1998: 43) finds that
households in the 75th percentile were best represented by the plutocratic weights. Izquierdo et
al. (2003: 149) find, during the 1990s in Spain, “the CPI-represented consumer in the sixty-first
percentile of the mean-adjusted household expenditure distribution”.
Consumer Price Inflation across the Income Distribution in South Africa
21
One important question, particularly given the extreme levels of inequality in South Africa, is
whether this problem of bias extends to indices for subpopulations. Of particular interest in the
context of this study is which of the plutocratic or democratic indices are superior in reflecting
the average expenditure patterns in the ten expenditure deciles. The correlation coefficients
between the expenditure patterns across the distribution and the relevant decile’s plutocratic
and democratic weight structures reveal very similar patterns of correlation for both weighting
structures. Specifically, it is only in deciles one and ten that there are noticeable differences
in correlations. This should not be totally unexpected, given the low levels of intra-decile
inequality highlighted in Table 2.
Figure 4: Correlation of Urban Household Expenditure Patterns with Mean Decile Expenditure
Source: Own calculations, IES 2000 (Statistics South Africa)Note: Mean correlation coefficients are calculated as 21 observation moving averages of the correlation coefficients
of the 1000 expenditure quantiles.
The figure does make it clear that no aggregated ‘average’ weight structure is able to
reflect the experience of each individual household equally well. For most of the deciles,
the correlations tend to peak somewhere towards the middle of the decile (for example in
deciles one, three, four, six, seven, nine and ten). Perhaps most interesting, is the fact that
for the middle eight deciles, the correlation patterns for plutocratic and democratic indices are
virtually identical. This is not unexpected given the very low Gini coefficients for the middle
eight deciles. Nevertheless, even in the two extreme deciles, the correlation coefficients are
rarely very different. Consequently, it would appear that constructing plutocratic price indices
by expenditure decile may be sufficient in most cases to accurately reflect their respective
inflation experiences, making disaggregated democratic indices superfluous.
DPRU WP 07/129 Morné Oosthuizen
22
Plutocratic weights and the inflation rates based on them do have their advantages though
relative to democratic weights. “[Expenditure] shares for each good by all households are
treated as if they were those of one aggregate ‘super-households’ [and thus] the index can be
constructed from information just on the prices and aggregated mean expenditure shares of all
households” (Artsev et al., 2006: 4). A true democratic price index requires the aggregation of
household level price indices, requiring household-specific data on expenditures and prices,
which is an extremely complex undertaking.
4.2 Decile-Specific Expenditure Weights
Given that this paper focuses on the differences in inflation experiences across the distribution,
it is important to assess how the structure of expenditure varies as income, proxied here by
expenditure, rises. Figure 5 presents the structure of expenditure for each expenditure decile,
including only the largest expenditure categories and revealing a number of distribution-
sensitive expenditure patterns. Details of all the main product categories can be found in the
Appendix.
First and foremost is the dominance of spending on food within total expenditure across
households in all deciles, but particularly in deciles one through eight. Half of all spending in
deciles one and two went to food, while this proportion was above two-fifths for deciles three
through five. This is compared to an average expenditure share for all households of 36.6
percent. Even in decile nine, food accounted for 21.8 percent of expenditure.
Secondly, a number of expenditure categories are revealed to decline in importance relative
to total expenditure as expenditure increases. These are food, fuel and power, personal care
and tobacco products. Personal care expenditures account for nearly ten percent of total
expenditure in decile one, falling to around six percent in deciles five through seven, and
to 3.1 percent in decile ten. Similarly, household fuel and power accounts for 8.7 percent
of expenditure in the poorest decile and only 3.1 percent in decile ten. The proportion of
expenditure on tobacco products, however, only really declines above decile seven, from over
two percent to 0.9 percent amongst the richest decile.
Thirdly, most other expenditure categories are increasingly important within total
expenditure as total expenditure increases. Chief amongst these is housing. Housing-
related expenditures increase from under six percent for deciles one and two (5.8 and 5.9
percent respectively), to 8.7 percent in decile six, and to 22.9 percent in decile ten. Relative
to total expenditure, decile ten households spend nearly four times more than decile
one households on housing. Similarly, spending on transport rises from 5.0 percent of
expenditure in decile one, to 7.9 percent in decile five, and to 20.7 percent in decile ten.
Consumer Price Inflation across the Income Distribution in South Africa
23
Other expenditure categories that exhibit this pattern include furniture and equipment,
medical care, communication, recreation and entertainment, reading material and education.
Figure 5: Democratic Structure of Household Expenditure by Expenditure Decile, 2000
0.0
20.0
40.0
60.0
80.0
100.0
Percent
Dec 1 Dec 2 Dec 3 Dec 4 Dec 5 Dec 6 Dec 7 Dec 8 Dec 9 Dec 10 All
Food Tobacco Products Clothing & Footwear
Housing Fuel & Power Furn & Equipment
HH Operation Transport Communication
Education Personal Care
Source: Own calculations, IES 2000 (Statistics South Africa).Note: Main expenditure category democratic weights can be found in the Appendix. This figure includes only those
expenditure categories that account for two percent or more of the total weight in the majority of deciles.
Lower income households also tend to have their expenditures concentrated in
relatively few categories. Thus, two-thirds (67.6 percent) of expenditure in decile one
households is located in just three categories, namely food, personal care and fuel
and power. In deciles seven through nine, this proportion falls to between 54 percent
and 55 percent, rising slightly to 58.8 percent in decile ten. The top five expenditure
categories account for nearly four-fifths (78.9 percent) of decile one expenditure.
Consequently, it can be expected that poorer households are more vulnerable to
inflation originating in their main expenditure categories than higher income households.
4.3 Official and Calculated CPIX Inflation Rates
Applying an identical set of price series to these varying expenditure weights, gives rise to
the pattern of inflation presented in Figure 6. The official CPIX inflation rate, as published by
DPRU WP 07/129 Morné Oosthuizen
24
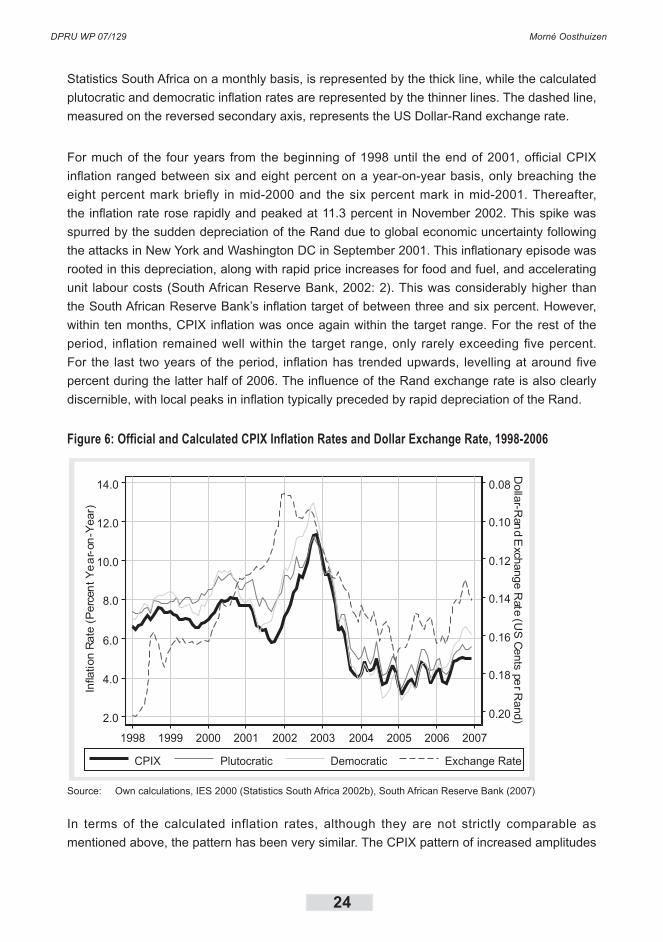
Statistics South Africa on a monthly basis, is represented by the thick line, while the calculated
plutocratic and democratic inflation rates are represented by the thinner lines. The dashed line,
measured on the reversed secondary axis, represents the US Dollar-Rand exchange rate.
For much of the four years from the beginning of 1998 until the end of 2001, official CPIX
inflation ranged between six and eight percent on a year-on-year basis, only breaching the
eight percent mark briefly in mid-2000 and the six percent mark in mid-2001. Thereafter,
the inflation rate rose rapidly and peaked at 11.3 percent in November 2002. This spike was
spurred by the sudden depreciation of the Rand due to global economic uncertainty following
the attacks in New York and Washington DC in September 2001. This inflationary episode was
rooted in this depreciation, along with rapid price increases for food and fuel, and accelerating
unit labour costs (South African Reserve Bank, 2002: 2). This was considerably higher than
the South African Reserve Bank’s inflation target of between three and six percent. However,
within ten months, CPIX inflation was once again within the target range. For the rest of the
period, inflation remained well within the target range, only rarely exceeding five percent.
For the last two years of the period, inflation has trended upwards, levelling at around five
percent during the latter half of 2006. The influence of the Rand exchange rate is also clearly
discernible, with local peaks in inflation typically preceded by rapid depreciation of the Rand.
Figure 6: Official and Calculated CPIX Inflation Rates and Dollar Exchange Rate, 1998-2006
0.08
0.10
0.12
0.14
0.16
0.18
0.20
Dollar-R
andE
xchangeR
ate(U
SCents
perRand)2.0
4.0
6.0
8.0
10.0
12.0
14.0
Infla
tion
Rate
(Per
cent
Year
-on-
Year
)
1998 1999 2000 2001 2002 2003 2004 2005 2006 2007
CPIX Plutocratic Democratic Exchange Rate
Source: Own calculations, IES 2000 (Statistics South Africa 2002b), South African Reserve Bank (2007)
In terms of the calculated inflation rates, although they are not strictly comparable as
mentioned above, the pattern has been very similar. The CPIX pattern of increased amplitudes
Consumer Price Inflation across the Income Distribution in South Africa
25
from 1998 to 2003, followed by relative stability thereafter is mimicked by both the calculated
inflation rates. For both the plutocratic and the democratic inflation rates, the correlation with
the official inflation rate is very high, with correlation coefficients of respectively 0.966 and
0.970. It is, however, important to remember that the weights for the published inflation rate
were based on the 1995 Income and Expenditure Survey prior to 2002. Hence, there is a
considerably weaker relationship in the first part of the period.4 Interestingly, the democratic
inflation rate is generally more volatile than either the official CPIX or the calculated plutocratic
inflation rates.
The fact that the three inflation rates move very similarly is encouraging as it indicates that,
even though the exact methodology of Statistics South Africa could not be followed, the
aggregated price indices do not follow significantly different trajectories. This is particularly true
for the period from 2002 onwards.
4.4 The Plutocratic Gap
The difference between the inflation rates calculated using plutocratic and democratic budget
shares defines the plutocratic gap. Mathematically, the gap is represented as:
∏ ∏−≡ P
t
D
ttG (4)
using the notation above, where Πt is the inflation rate for period t, and the superscripts P and
D refer to the plutocratic and democratic weights.
The plutocratic gap will be different from zero if three conditions are met (Ley, 2005: 638).
Firstly, there must exist inequality in the distribution of household expenditures. Secondly,
households with different expenditures must display different consumption patterns. Finally,
there must exist differences in the price movements of at least some of the goods consumed
in varying amounts across the distribution, according to the different consumption patterns
observed. Should any one of these conditions not hold, the plutocratic gap will not differ from
zero.
The evidence presented above, however, confirms that a non-zero plutocratic gap is expected
for South Africa. The country is characterised by exceptionally high levels of inequality. Recent
estimates of inequality are extremely high: 0.56 in 2000 (Hoogeveen & Ozler, 2006: 59), 0.577
4 Considering the period 1998 to 2001 only, the correlation coefficients for the plutocratic and democratic inflation rates were 0.720 and 0.778 respectively. In stark contrast, the coefficients for the period 2002 to 2006 were 0.982 and 0.977 respectively.
DPRU WP 07/129 Morné Oosthuizen
26
in 2000 (Ozler, 2006), and 0.635 in 2001 (United Nations Development Programme, 2003: 43).
Based on the cleaned IES 2000 used for this study, it is estimated that the Gini coefficient for
the country as a whole is 0.601, while that of metropolitan and other urban areas is 0.571. As
illustrated in Figure 5 expenditure patterns do vary quite substantially according to income or
expenditure level, while the analysis below confirms the varying patterns of price changes over
the period.
Figure 7 presents estimates of the plutocratic gap for South Africa for the period 1998 to
2006. It is immediately confirmed that the plutocratic gap fluctuates from positive to negative
and back again repeatedly over the period. From 1998 to September 2001, the trough of the
plutocratic inflation cycle, the gap fluctuated relatively quickly between positive and negative,
spending 27 out of 45 months, or more than one-half of the period, in positive territory. For
the last 13 months of that period, the gap turned quite strongly positive, peaking at a value of
+1.391 in March 2001 and averaging +0.812. Thereafter, there was a clear change in inflation
dynamics with the gap falling rapidly into negative territory and remaining there for 20 months.
By September 2002, the gap had fallen as far as -1.805 and averaged -0.920 for this period.
Another change in inflation dynamics occurred in mid-2003, when the gap once again turned
positive. While this positive plutocratic gap lasted somewhat longer than any of the preceding
cycles since 1998, it was not characterised by particularly high values, averaging +0.744.
Finally, in early 2006, the gap fell below zero and remained there until the end of that year,
where the data series ends. The changing value of the plutocratic gap from positive to negative
and vice versa coincides with the lines representing the plutocratic and democratic inflation
rates crossing each other.
Since the plutocratic gap is defined simply as the difference between the rates of inflation
using plutocratic and democratic weight structures respectively, the interpretation of the gap
is straightforward. A positive plutocratic gap signifies that the plutocratic inflation rate is higher
than the democratic inflation rate. Thus, the prices of items consumed disproportionately
more by wealthier households (and which are, therefore, more dominant in the plutocratic
weight structure) are rising more rapidly compared to prices of other goods. Conversely, a
negative plutocratic gap occurs when the democratic inflation rate exceeds the plutocratic
inflation rate. In this case, the prices of items consumed disproportionately more by poorer
households are rising more rapidly than the prices of other goods. This information allows one
to determine which income group experienced the higher rate of inflation in a given period.
In January through March 1998, households with higher expenditures generally experienced
higher rates of inflation relative to households with lower expenditures. This was also true
of the periods between April 1999 and February 2000, between October 2000 and October
2001 and between July 2003 and February 2006. In contrast, poorer households experienced
relatively higher inflation rates between April 1998 and March 1999, between March 2000 and
September 2000, between November 2001 and May 2003, and after February 2006 until the
end of the data series in December 2006.
Consumer Price Inflation across the Income Distribution in South Africa
27
Figure 7: The Plutocratic Gap, 1998-2006
2.0
4.0
6.0
8.0
10.0
12.0
14.0Inflation
Rate
(Percent)
-2.0-1.5-1.0-0.50.00.51.01.5
Gap
(Per
cent
Poin
ts)
1998 1999 2000 2001 2002 2003 2004 2005 2006 2007
Plutocratic Democratic Plutocratic Gap
Source: Own calculations, IES 2000 (Statistics South Africa)
Interestingly, negative plutocratic gaps appear to be related to higher levels of inflation. As
consumer price inflation rises, so it appears that the gap turns negative, while falls in the rate
of inflation are related to a positive plutocratic gap. In fact, the correlation coefficient between
the plutocratic inflation rate and the plutocratic gap is -0.510 while that between the democratic
inflation rate and the plutocratic gap is -0.724. This is a similar finding to that of Kokoski
(2000: 33), who finds what is a relatively large negative plutocratic gap for the period 1990-
1992, during which the “inflation rates for most commodities appear to be somewhat higher …
compared with other rates within the study period”. 5
4.5 Inflation Rates Across the Distribution5
While the plutocratic gap provides useful insight as to which segment of the income distribution
is relatively worse off due to inflation, the actual inflation rates provide a clearer indication of
the degree to which the inflation experiences of the deciles differ. Figure 8 presents the rates
of year-on-year inflation experienced by households in selected expenditure deciles between
1998 and 2006.
5 Unless otherwise stated, all price indices and inflation rates presented are calculated using democratic expenditure weights for households in urban and historical metropolitan areas.
DPRU WP 07/129 Morné Oosthuizen
28
The general pattern observed in Figure 6 and Figure 7 is again evident here. The 108 month
period can be divided into three sub-periods. The first period until mid-2001 includes close to
two full inflation cycles and saw inflation rates fluctuating in a relatively narrow band between
six and nine percent. Decile one experienced the highest rates of inflation at the peaks of both
cycles and relatively low, but not necessarily the lowest, rates of inflation at the troughs. The
experience of decile ten households was very different, with relatively low rates of inflation
during the peaks of the cycles and relatively higher rates during the troughs.
Figure 8: Democratic Inflation Rate by Decile, 1998-2006
0.0
2.0
4.0
6.0
8.0
10.0
12.0
14.0
16.0
Infla
tion
Rat
e(P
erce
nt)
Jan 98 Jan 99 Jan 00 Jan 01 Jan 02 Jan 03 Jan 04 Jan 05 Jan 06 Jan 07
Dec 1 Dec 4 Dec 7 Dec 10 All Urban
Source: Own calculations, IES 2000 (Statistics South Africa)
The second sub-period comprises the inflation cycle following the global economic turmoil
sparked by the attacks of September 11 in the United States. During the first part of this
period, the rate of inflation amongst all deciles increased to levels not seen since before
January 1998. However, the most marked increases in the rate of inflation were to be found
amongst the poorest deciles. Starting in May 2001, decile one saw its rate of inflation increase
from 4.7 percent to 5.9 percent in September 2001 and to a peak of 15.6 percent in September
and October 2002, an increase of almost 11 percentage points or over 230 percent within 17
months. Similarly, the inflation rate for decile four increased by nearly nine percentage points,
or over 170 percent, from 5.1 percent to 13.9 percent over the same period. In contrast, the
increase for decile ten households was from 8.2 percent to 10.2 percent, only 2.0 percentage
points or 24 percent. Fortunately, however, this inflation episode was short-lived, having been
caused by completely exogenous factors and, by June 2003, inflation had fallen to its earlier
levels of around six to seven percent.
Consumer Price Inflation across the Income Distribution in South Africa
29
The third period saw a further decline in the rates of inflation of all income groups, particularly
for poorer households, with the overall price level being driven downwards by food prices
generally and grain prices in particular. By August 2004, overall inflation had declined to under
three percent (and to under one percent for decile one), generally remaining in that range until
mid-2005. December 2005 saw the range in which decile inflation rates varied shrink to 0.8
percentage points, the narrowest for the period under review apart from the 0.6 percentage
points that occurred three months later. At this point, however, the inflation dynamic changed
again, with decile one inflation accelerating to over 8.5 percent and ending 2006 at 7.5 percent.
It appears that South Africa has since seen inflation follow a similar type of trajectory as it did
during the second period described above during early 2007, as the country faced rising
international oil prices and an expected poor maize harvest.
Figure 8, in combination with other analysis presented earlier, indicates the weak ability of the
official consumer price index to describe the inflation experiences of different income groups
at any given point in time. As Ley (2005: 644) notes, “the larger the income (expenditure)
inequality, the more different the consumption patterns by income group, and the larger the
variance in individual price behaviour, the less appealing is a single plutocratic CPI as the
only policy adjustor”. Thus, even the provision of plutocratic expenditure quintile consumer
price indices by Statistics South Africa allows for a superior understanding of the differing
experiences of inflation across various groups in society.
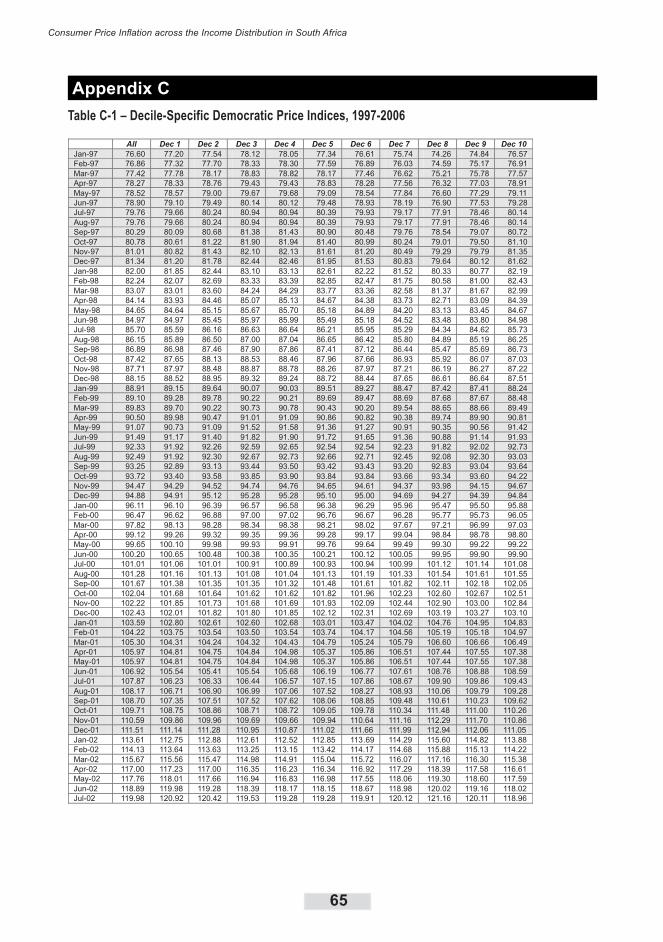
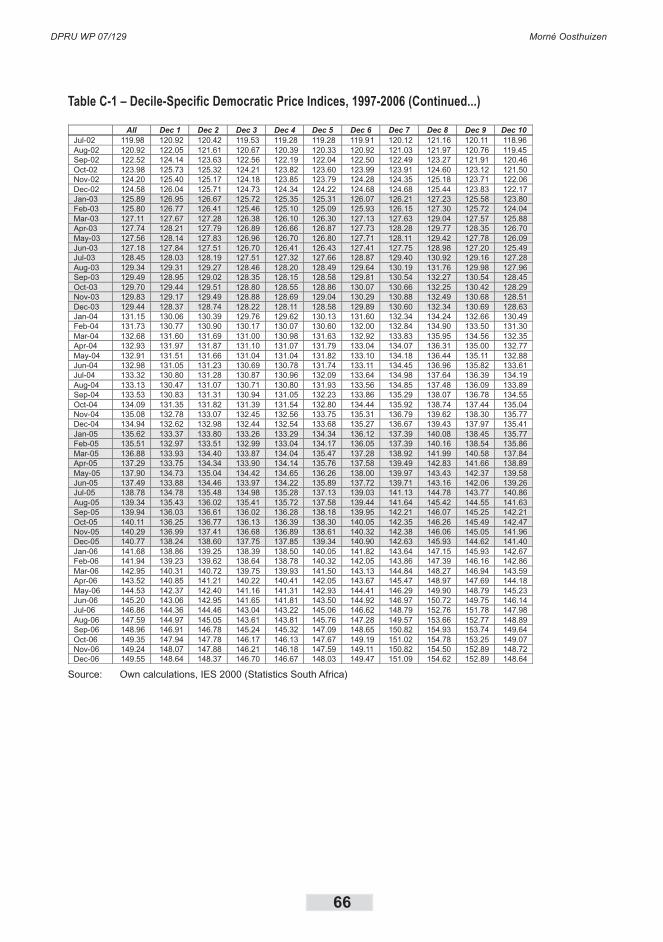
For the decade between January 1997 and December 2006, the aggregate democratic price
index increased from 76.6 to 149.6 with the average index for 2000 equalling 100 (Table
3). This equates to an increase of 95.2 percent over the period, or an average annual rate
of increase of 7.0 percent. The average annual inflation rates for the five two-year periods
conform with the trends presented above: relatively stable inflation around 7.8 percent per
annum for the first four years, followed by two years of inflation averaging 10.2 percent per
annum, followed by a four-year period characterised by low inflation, particularly in the first two
years when inflation fell to 3.8 percent per annum, but rising thereafter.
DPRU WP 07/129 Morné Oosthuizen
30
Table 3: Democratic Decile Price Indices and Inflation Rates, January 1997 - December 2006
Indices (2000 = 100), Average Annual Inflation Rate over Two Years in Italics PeriodChange(Percent)Jan 1997 Jan 1999 Jan 2001 Jan 2003 Jan 2005 Dec 2006
Source: Own calculations, IES 2000 (Statistics South Africa)Note: Only items contributing 2.0 percent or more to total inflation over the period are included.
For decile one households, the main driver of inflation is clear. Paraffin (PARAFF) stands
alone: a high inflation item at the upper end of the weight range. On its own, paraffin accounted
for 9.9 percent of decile one inflation over the decade, more than twice the contribution of the
second most important item, namely poultry (4.3 percent). Paraffin’s relatively high weight of
4.9 percent within total expenditure, and poor households’ reliance on paraffin for heating and
cooking, means that poor households are particularly vulnerable to paraffin price increases.
From its position on the upper right side of the figure, paraffin is clearly the single most
important driver of inflation amongst the poorest urban households. Decile one households
DPRU WP 07/129 Morné Oosthuizen
36
are potentially even more vulnerable to inflation deriving from mealie meal with its expenditure
weight of 6.1 percent. Although mealie meal is classified as a low inflation item, its price
having risen by 60.5 percent over the decade, it remains one of the top contributors to inflation
amongst the poorest of urban households.
Inflation drivers for decile one households are generally food items (brown and wholewheat
bread, mealie meal, beef and veal, and white sugar (WSUGAR)), household and other
necessities (paraffin, house rent, water, electricity, and taxi and hired transport), and addictive
substances (cigarettes, other tobacco products (OTHTOB), and alcoholic beverages
(ALCBEE)). Making the situation of the poorest households even more difficult is the fact
that sometimes substitutes for major inflation drivers are themselves inflation drivers. Thus,
both paraffin and electricity each contribute more than 2.0 percent of inflation for decile one
households, as do beef and veal and poultry.
Figure 10: Main Contributors to Decile One Inflation, 1997-2006
BBREAD
MLMEAL
BEEF
POULTR
ALCBEE
CIGS
OTHTOB
WATER
ELECTR
PARAFF
MATCH
TAXI
HOUSEDETERG
TUITN
TSOAP
WSUGAR
0.0
50.0
100.0
150.0
200.0
250.0
300.0
350.0
0.0 1.0 2.0 3.0 4.0 5.0 6.0 7.0
Expenditure Weight (Percent)
Inflation(Percent)
Source: Own calculations, IES 2000 (Statistics South Africa)Note: Only items contributing 2.0 percent or more to total inflation over the period are included.
Households in decile two are exposed to inflation from generally similar sources compared
to decile one households, although there are a greater number of strong inflation drivers
accounting for upwards of 3.5 percent of inflation for decile two. Paraffin again accounts for the
largest share of inflation, at 7.0 percent of the decile’s 91.3 percent inflation between 1997 and
2006 and, although paraffin’s dominance is evident in the figure, the difference between it and
other items is not as marked as it is for decile one. Three other items account for more than
4.0 percent of total inflation for this group, namely brown and wholewheat bread (4.6 percent),
Consumer Price Inflation across the Income Distribution in South Africa
37
water (4.6 percent) and poultry (4.3 percent). Decile two urban households are less exposed to
inflation in key products such as paraffin, mealie meal and taxi and hired transport compared
to decile one households, but more exposed to inflation in items such as water, cigarettes,
electricity and white bread. Eight of the 15 items in the figure are classified as low inflation
items and include two of the top five items, brown and wholewheat bread and poultry.
A broadly similar group of items is responsible for a large proportion of decile three inflation
(Figure 12), although there are some important differences. The dominance of paraffin within
overall inflation is declining due to the falling expenditure weight for this item as income
increases, contributing 5.0 percent of the decile’s inflation over the period. Cigarettes, brown
and wholewheat bread, and poultry, however, remain important contributors to overall inflation
for this decile, each item accounting for between 4.0 and 4.5 percent of inflation, while the
prices of taxis and other hired transport are relatively more important drivers of inflation for
this group. Decile three is also the lowest decile for which tuition and attendance fees account
for more than 3.0 percent of inflation. This high inflation item has a relatively low expenditure
weight, lower than any of the decile’s main inflation drivers, with the weight being even lower
amongst poorer households.
Figure 11: Main Contributors to Decile Two Inflation, 1997-2006
WBREADBBREAD
MLMEAL
BEEFALCBEE
CIGS
WATER PARAFF
TAXI
TUITN
POULTR
NALCAE
ELECTRDETERGWSUGAR
0.0
50.0
100.0
150.0
200.0
250.0
300.0
0.0 1.0 2.0 3.0 4.0 5.0
Expenditure Weight (Percent)
Inflation(Percent)
Source: Own calculations, IES 2000 (Statistics South Africa)Note: Only items contributing 2.0 percent or more to total inflation over the period are included.
DPRU WP 07/129 Morné Oosthuizen
38
Figure 12: Main Contributors to Decile Three Inflation, 1997-2006
WBREAD BBREAD
MLMEAL
BEEFNALCAE
CIGS
FLAT
PARAFF
TAXI
ALCBEE
ELECTR
TUITN
POULTR
WATER
0.0
50.0
100.0
150.0
200.0
250.0
300.0
350.0
400.0
0.0 1.0 2.0 3.0 4.0 5.0
Expenditure Weight (Percent)
Inflation(Percent)
Source: Own calculations, IES 2000 (Statistics South Africa)Note: Only items contributing 2.0 percent or more to total inflation over the period are included.
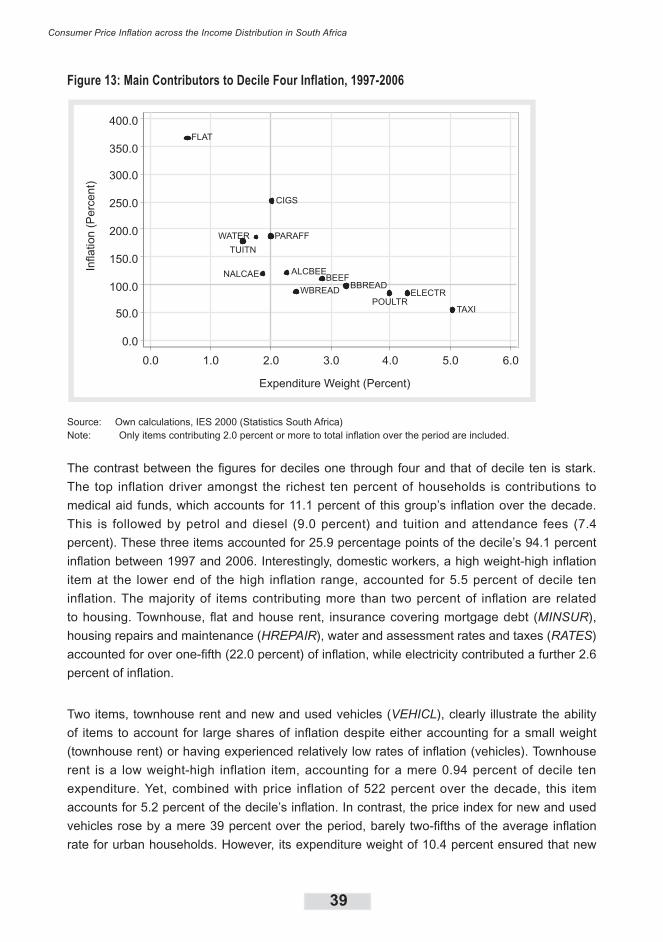
Decile four has a more even spread of importance across the top ten inflation drivers than is
the case in most other deciles (Figure 13). Cigarettes contribute 5.8 percent of inflation – a
contribution surpassed only in deciles five and six where cigarettes account for 6.2 percent
and 5.8 percent of those deciles’ inflation respectively. The two major household fuel sources,
paraffin and electricity, each account for more than four percent of inflation. The former’s large
contribution stemming from its rapid price increases over the period, and the latter’s from its
relatively large expenditure weight. The seven remaining items in the top ten inflation drivers,
namely poultry, water, brown and wholewheat bread, beef and veal, beer, taxi and hired
transport and tuition and attendance fees, all account for between three and four percent of
overall inflation. Apart from tuition and attendance fees and water, which are both low weight-
high inflation items, these items have relatively high weights and tend to range around and
below 100 percent inflation mark for the period.
Consumer Price Inflation across the Income Distribution in South Africa
3�
Figure 13: Main Contributors to Decile Four Inflation, 1997-2006
WBREAD BBREADBEEF
ALCBEE
CIGS
FLAT
ELECTR
PARAFF
TAXI
NALCAE
WATER
POULTR
TUITN
0.0
50.0
100.0
150.0
200.0
250.0
300.0
350.0
400.0
0.0 1.0 2.0 3.0 4.0 5.0 6.0
Expenditure Weight (Percent)
Inflation(Percent)
Source: Own calculations, IES 2000 (Statistics South Africa)Note: Only items contributing 2.0 percent or more to total inflation over the period are included.
The contrast between the figures for deciles one through four and that of decile ten is stark.
The top inflation driver amongst the richest ten percent of households is contributions to
medical aid funds, which accounts for 11.1 percent of this group’s inflation over the decade.
This is followed by petrol and diesel (9.0 percent) and tuition and attendance fees (7.4
percent). These three items accounted for 25.9 percentage points of the decile’s 94.1 percent
inflation between 1997 and 2006. Interestingly, domestic workers, a high weight-high inflation
item at the lower end of the high inflation range, accounted for 5.5 percent of decile ten
inflation. The majority of items contributing more than two percent of inflation are related
to housing. Townhouse, flat and house rent, insurance covering mortgage debt (MINSUR),
housing repairs and maintenance (HREPAIR), water and assessment rates and taxes (RATES)
accounted for over one-fifth (22.0 percent) of inflation, while electricity contributed a further 2.6
percent of inflation.
Two items, townhouse rent and new and used vehicles (VEHICL), clearly illustrate the ability
of items to account for large shares of inflation despite either accounting for a small weight
(townhouse rent) or having experienced relatively low rates of inflation (vehicles). Townhouse
rent is a low weight-high inflation item, accounting for a mere 0.94 percent of decile ten
expenditure. Yet, combined with price inflation of 522 percent over the decade, this item
accounts for 5.2 percent of the decile’s inflation. In contrast, the price index for new and used
vehicles rose by a mere 39 percent over the period, barely two-fifths of the average inflation
rate for urban households. However, its expenditure weight of 10.4 percent ensured that new
DPRU WP 07/129 Morné Oosthuizen
40
and used vehicles accounted for 4.3 percent of inflation. The key difference between these two
items, therefore, is that townhouse rent accounts for a far larger proportion of inflation than it
does of expenditure (5.2 percent vs. 0.94 percent respectively), while the converse is true for
new and used vehicles (4.3 percent vs. 10.4 percent respectively).
Figure 14: Main Contributors to Decile Ten Inflation, 1997-2006
Source: Own calculations, IES 2000 (Statistics South Africa)Note: Only items contributing 2.0 percent or more to total inflation over the period are included.
The differences in the inflation experiences of households clearly differ in terms
of source. Although many items are major contributors to inflation in all the four poorest
deciles and, as in the case of beef and veal, cigarettes, electricity, house rent, tuition
and attendance fees, and water, sometimes in all deciles, the decile-specific weights
determine the exact extent to which a change in price translates into an inflation share.
4.6.2 The Changing Drivers of Inflation Across the Distribution between
1997 and 2006
The overall picture presented in the previous section provides a sense of the items that were
most important in driving inflation over the decade as a whole. However, the contributions
of specific items vary over time, sometimes contributing substantially towards inflation for
a group, sometimes contributing little towards inflation, and sometimes even contributing
negatively to overall inflation. Thus, the analysis above is somewhat limited in its inability to
reflect items’ changing contributions to inflation at different points in time and in the fact that
Consumer Price Inflation across the Income Distribution in South Africa
41
certain important contributors to inflation in a given sub-period may not be captured due to
relative unimportance in other sub-periods.
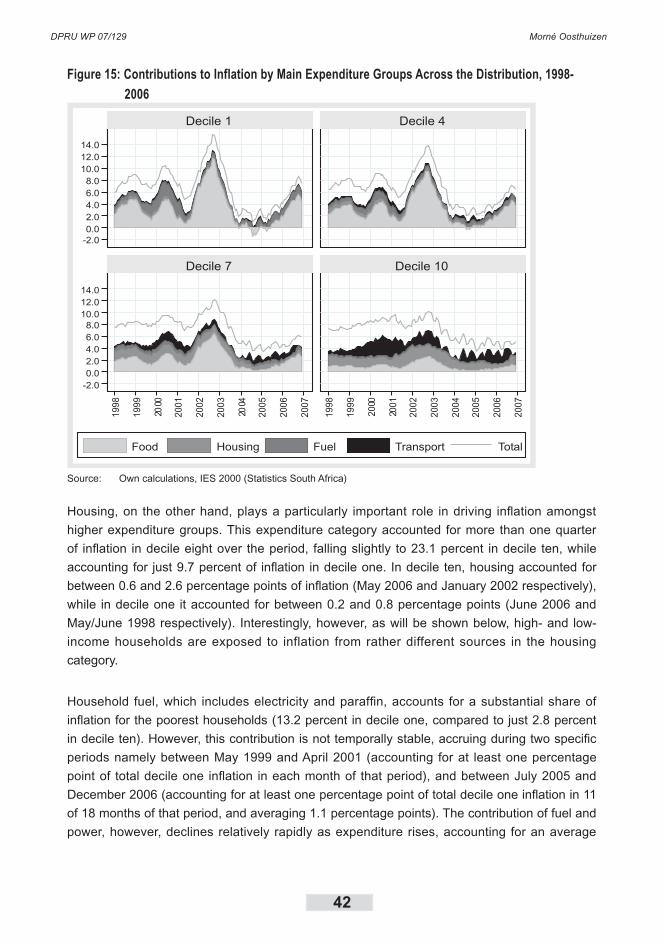
This section aims to address this issue by shedding more light on the development of inflation
over the decade, with particular emphasis on the poorest households. Figure 15 presents the
contributions to overall inflation for deciles one, four, seven and ten made by the expenditure
categories of food, housing, fuel and power and transport, represented by the stacked area
graphs. If all expenditure items were to be graphed in this way, the uppermost boundary of
the stacked area graphs would coincide with the path of overall inflation for the specific decile.
However, since most items contribute relatively little to overall inflation, the figures in this
section present only a selection of the most important. In Figure 15, the line graph represents
the path of overall inflation for the four selected deciles, while the gap between it and the
stacked area graphs represents the contribution to inflation made by those items that were not
specifically included in the figure.
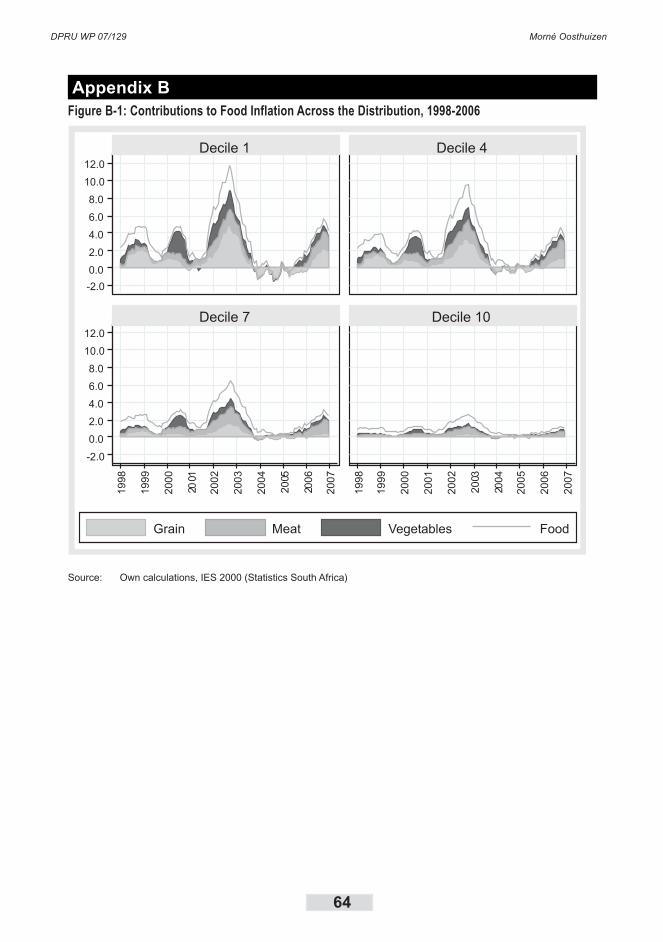
Food is clearly the dominant contributor to overall inflation in the lower expenditure groups,
accounting for 33.4 percent of inflation for the average urban household and as much as 47.3
percent in decile two, but generally falling as total expenditure rises. It is only in decile eight
that the contribution to overall inflation made by food is surpassed by any other expenditure
category, in this case, housing. Averaging 3.0 percentage points of decile one inflation from
January 1998 to June 2001, food inflation accounted for a rising proportion of inflation until
September 2002, whereafter it declined. At its peak, food inflation accounted for three-quarters
(11.7 percentage points) of the 15.6 percent inflation rate. Stated differently, had food prices
remained constant between September 2001 and September 2002, inflation for decile one
would have been just 3.9 percent instead of 15.6 percent. For the poorest deciles in particular,
and even as high as decile seven, the source of the peaks in inflation in 1998, 2000, 2002
and 2006 is clearly food, with food responsible, in no small measure, for the very low rates of
inflation towards the end of 2004.
DPRU WP 07/129 Morné Oosthuizen
42
Figure 15: Contributions to Inflation by Main Expenditure Groups Across the Distribution, 1998-
2006
-2.00.02.04.06.08.0
10.012.014.0
-2.00.02.04.06.08.0
10.012.014.0
1998
1999
2000
2001
2002
2003
2004
2005
2006
2007
1998
1999
2000
2001
2002
2003
2004
2005
2006
2007
Decile 1 Decile 4
Decile 7 Decile 10
Food Housing Fuel Transport Total
Source: Own calculations, IES 2000 (Statistics South Africa)
Housing, on the other hand, plays a particularly important role in driving inflation amongst
higher expenditure groups. This expenditure category accounted for more than one quarter
of inflation in decile eight over the period, falling slightly to 23.1 percent in decile ten, while
accounting for just 9.7 percent of inflation in decile one. In decile ten, housing accounted for
between 0.6 and 2.6 percentage points of inflation (May 2006 and January 2002 respectively),
while in decile one it accounted for between 0.2 and 0.8 percentage points (June 2006 and
May/June 1998 respectively). Interestingly, however, as will be shown below, high- and low-
income households are exposed to inflation from rather different sources in the housing
category.
Household fuel, which includes electricity and paraffin, accounts for a substantial share of
inflation for the poorest households (13.2 percent in decile one, compared to just 2.8 percent
in decile ten). However, this contribution is not temporally stable, accruing during two specific
periods namely between May 1999 and April 2001 (accounting for at least one percentage
point of total decile one inflation in each month of that period), and between July 2005 and
December 2006 (accounting for at least one percentage point of total decile one inflation in 11
of 18 months of that period, and averaging 1.1 percentage points). The contribution of fuel and
power, however, declines relatively rapidly as expenditure rises, accounting for an average
Consumer Price Inflation across the Income Distribution in South Africa
43
of just 0.2 percentage points, and never rising above 0.3 percentage points, of decile ten
inflation.
Finally, transport-related items account for a relatively large proportion of inflation amongst
better-off households, while also underlying to a large degree the volatility of inflation in the
upper deciles. The relative contribution of transport expenditures to overall inflation is almost
six times more in decile ten (at 17.8 percent of inflation) than it is in deciles one and two (at 3.0
percent of inflation). Transport inflation appears to have been most marked from 2000 to 2003
and again from mid-2004 onwards.
Thus, Figure 15 details four expenditure categories’ contributions to inflation in four selected
deciles. Two of these categories, namely food and household fuel and power, are particularly
important for poor households, while transport and housing are more important for better-off
households. Nevertheless, even within those expenditure categories that are relatively more
important for inflation amongst wealthier deciles, there are some items that make significant
contributions to inflation amongst the poor.
Within food, there are a number of expenditure categories, the most important of which in
terms of their contribution to inflation being grain products, meat products, and vegetable
products. These categories’ contributions to food inflation are presented in the Appendix. As
noted earlier, trends in food inflation underlie the movement of overall inflation amongst poorer
deciles. However, by decile ten, the influence of food inflation on overall inflation is muted,
only breaching the two percentage point level during the 2002/2003 inflation peak. For the
average urban household, the bulk of food inflation between 1998 and 2006 is attributable to
meat products, which account for 8.9 percent of overall inflation, followed by grain products at
7.4 percent. Relative to food inflation, meat and grain products account for 26.7 percent and
22.0 percent of inflation. However, from the perspective of poor households, grain products
contributed relatively more. Between 1998 and 2006, grain products contributed 12.4 percent
of total decile one inflation and 12.5 percent of decile two inflation, compared to 10.2 percent
and 11.3 percent respectively accounted for by meat products. Figures 16 and 17 present the
contributions of grain and meat products to food inflation in greater detail.
Grain products were the most important source of food inflation for poor households between
1998 and 2006, and changes in this category underlie some of the major trends in inflation for
poorer households. Rising inflation amongst grain products occurred during three of the four
spikes in the overall and food inflation rates. From June 1998 to March 1999, grain products
contributed between 1.5 and 2.1 percentage points to total inflation monthly in decile one,
while from March 2002 to March 2003 they contributed between 2.3 and 5.1 percentage points
of inflation. Finally, in each month from July 2006 to the end of the period, grain products
accounted for 1.6 to 2.3 percentage points of inflation. It is only during the inflation peak during
2000 that grain products did not experience particularly high rates of inflation. This pattern is
DPRU WP 07/129 Morné Oosthuizen
44
also observed in decile four and, to a lesser extent, in decile seven. In decile ten, though, grain
products contributed minimally to inflation and at no point over the period did it account for
more than 0.5 percentage points of inflation.
Figure 16: Contributions to Grain Product Inflation Across the Distribution, 1998-2006
-1.00.01.02.03.04.05.0
-1.00.01.02.03.04.05.0
1998
1999
2000
2001
2002
2003
2004
2005
2006
2007
1998
1999
2000
2001
2002
2003
2004
2005
2006
2007
Decile 1 Decile 4
Decile 7 Decile 10
Mealie Meal White Bread Brown BreadRice Grain Products
Source: Own calculations, IES 2000 (Statistics South Africa)
Within grain products, mealie meal is the dominant source of inflation for the poorest
households, being largely responsible for the three main inflation spikes in decile one in
1998/9, 2002/3 and 2006. In the earliest of the three inflation spikes, mealie meal contributed
up to one percentage point of the 2.0 percentage points of inflation contributed by all grain
products, or more than one-fifth (21.9 percent) and more than one-tenth (11.6 percent) of
decile one food and total inflation respectively. During the 2002/3 inflation episode, mealie meal
accounted for a peak of 2.6 percentage points of decile one inflation in September 2002, which
is equivalent to 22.7 percent of food inflation and 16.9 percent of total inflation in that decile.
Mealie meal’s relative contribution to decile one inflation was even more pronounced in 2006,
when in September it alone contributed 2.1 percentage points to inflation. This represents
40.5 percent of food inflation and 26.2 percent of total inflation in decile one. However, the
contribution of mealie meal to inflation in other deciles is significantly lower due to this item’s
smaller weight in these deciles. Even at its peak in September 2002, mealie meal contributed
Consumer Price Inflation across the Income Distribution in South Africa
45
only 1.1 percentage points to decile four inflation and just less than 0.4 percentage points in
decile seven.
Between these four items, mealie meal, white bread, brown and wholewheat bread and rice,
grain product inflation is almost fully accounted for. The inflation contributions from all four
expenditure items were relatively closely synchronised, all tending to rise at the same time.
This is unsurprising, particularly in the cases of white bread and brown and wholewheat bread,
given that flour prices, an important cost component in the production of bread, would move
closely with mealie meal prices. Rice inflation is likely to be linked to the Rand exchange rate
given imports of rice to South Africa.
Meat products accounted for an average of 8.9 percent of total inflation for all urban
households. Amongst poorer households, the share of inflation was highest at over 11.0
percentage points in deciles two through five, falling to just 4.1 percent in decile ten. The
prices of meat products have tended to accelerate in line with those of grain products. The
three main contributors to inflation within the meat products category are poultry, beef and
veal, and mutton, lamb and goat, which together account for 6.8 percentage points of the
category’s share of total inflation for all urban households. Poultry and beef and veal account
for very similar shares of average inflation (around 2.7 percent each), with poultry accounting
for a particularly large share of inflation amongst the poorest households.
As noted above, meat inflation has tended to echo grain product inflation over the decade. This
has been mainly due to surging beef and veal prices that coincided with rapid grain product
inflation, since beef producers would, in all likelihood, be faced with price trends in cattle feed
that mirror consumer prices of grain products. In instances where regional drought contributed
to grain product inflation, such as in 2001 and 2002, beef production in the region is likely to
have also been negatively impacted. Prior to December 2001, beef and veal accounted for
between -0.2 and 0.4 percentage points of decile one inflation in each month, but ranged
between 0.5 and 1.0 percentage points over the ensuing 15 month period. Following the
subsequent fall in prices and low contribution to inflation, beef and veal again accounted for
between 0.5 and 1.1 percentage points of inflation in decile one from March 2006 until the end
of the period. The contribution of beef and veal to decile four inflation is virtually identical (only
very marginally higher) due to the weights for this item in the two deciles being almost equal.
By decile seven, the contribution of this expenditure item is somewhat lower, but not by a
large margin, although in decile ten, beef and veal never contributed more than one-third of a
percentage point to total inflation.
DPRU WP 07/129 Morné Oosthuizen
46
Figure 17: Contributions to Meat Product Inflation across the Distribution, 1998-2006
Source: Own calculations, IES 2000 (Statistics South Africa)
Poultry contributed to inflation more consistently over the period. Apart from low or negative
contributions in 1999, late 2003 and 2005, poultry generally contributed between 0.3 and 0.7
percentage points to decile one inflation each month. Its contribution peaked at 0.9 percentage
points in October 2002, during a twelve month period from February 2002 onwards in which
poultry’s contribution ranged between 0.5 and 0.9 percentage points, apart from one month.
The lower expenditure weights for poultry in deciles four and seven resulted in slightly lower
contributions to inflation in those deciles. By decile seven, poultry never contributed more
than 0.5 percentage points of inflation and in the tenth decile, this statistic fell to less than 0.2
percentage points.
Finally, of the four deciles presented, mutton, lamb and goat made the largest contribution to
inflation in decile seven, where its contribution peaked at just under 0.4 percentage points.
Its contribution to inflation was relatively small during the first two years of the period, but
increased substantially from January 2000 to June 2003. Apart from eight months in that
period, during which it never fell below 0.1 percentage points, the contribution of mutton, lamb
and goat to decile seven inflation ranged between 0.1 and 0.4 percentage points. Relatively
speaking, however, this item accounted for 1.4 percent of average urban inflation, and more
Consumer Price Inflation across the Income Distribution in South Africa
47
than 1.6 percent in deciles five through seven. In decile one, it accounted for 0.8 percent of
inflation, compared to 1.0 percent in decile ten.
Housing accounts for a considerable proportion of inflation for households in the upper
expenditure deciles, contributing at its peak 2.6 percentage points of inflation in decile ten
in January 2002 (Figure 18). In contrast, housing contributed maxima of 1.8, 0.9 and 0.8
percentage points in deciles seven, four and one respectively. For poorer households, the
main contributors to housing inflation are water and house rent, with flat rent contributing
relatively more inflation in decile four than house rent.
Initially in decile one, water and house rent contributed relatively similarly to the decile’s
inflation, with house rent slightly more important. Water’s importance declined slightly in mid-
2000, followed by a decline in house rent’s importance to zero by the end of 2001. However,
by mid-2003, house rent had once again grown in importance, contributing more than 0.4
percentage points of inflation monthly between July and October 2003. A similar pattern is
observed for decile four, with water contributing slightly more to inflation (due to its larger
expenditure weight relative to decile one) and house rent slightly less to inflation (due to its
relatively smaller expenditure weight). At the same time, the contribution of flat rent to total
inflation is considerably larger in decile four than in decile one, although it tapers off particularly
after mid-2003.
DPRU WP 07/129 Morné Oosthuizen
48
Figure 18: Contributions to Housing Inflation across the Distribution, 1998-2006
0.0
0.5
1.0
1.5
2.0
2.5
0.0
0.5
1.0
1.5
2.0
2.5
1998
1999
2000
2001
2002
2003
2004
2005
2006
2007
1998
1999
2000
2001
2002
2003
2004
2005
2006
2007
Decile 1 Decile 4
Decile 7 Decile 10
Water House Rent Townh. Rent Rates
Ins. on Mortgage Flat Rent Maintenance Housing
Source: Own calculations, IES 2000 (Statistics South Africa)
In absolute terms, the inflation contribution of housing in decile seven is significantly different
from that of the poorer deciles and is driven largely by flat rent, with water making a slightly
larger absolute contribution. From January 1998 to January 2002, flat rent contributed between
0.6 and 0.8 percentage points of inflation each month, its contribution diminishing slightly
thereafter, but rising again to just under 0.5 percentage points in late 2003. From January
2004 until the end of 2006, flat rent’s contribution was somewhat smaller, averaging under 0.2
percentage points each month. In decile seven, assessment rates and taxes and townhouse
rent also contribute somewhat to overall inflation, whereas in the lower two deciles these items’
contributions were very small. This is also the first of the four deciles presented where the
contribution to inflation of the graphed items diverges considerably from the total contribution
from the housing expenditure category.
The composition of the overall contribution of housing to decile ten inflation is more diverse
than it is in the other deciles, with all seven items contributing significantly to inflation.
Townhouse rent, rates, insurance on mortgage debt and maintenance and repairs are
all considerably larger contributors to inflation than in other deciles. Townhouse rent was
particularly important in 2001 and the first half of 2002, contributing between 0.2 and 0.7
percentage points to decile ten inflation, but contributed little from 2004 onwards. Interestingly,
Consumer Price Inflation across the Income Distribution in South Africa
4�
its contribution to inflation is almost directly opposite to that of house rent, from the start of the
period to the end of 2002: both were relatively stable until early 2001, whereafter townhouse
rent’s contribution to inflation climbed to 0.7 percentage points, while that of house rent fell
to below zero in January 2002; the two items’ contributions then moved back towards each
other, townhouse rent falling to 0.1 percentage points and house rent moving back up to 0.3
percentage points. The two items then moved parallel to each other, falling from mid-2003 until
mid-2006. This latter movement may have been related to the prevailing economic conditions
at that time that were generally conducive to the purchase of homes, thereby resulting in a
softening of the rental market, and which occurred simultaneously with falling flat rent inflation.
Assessment rates and taxes contributed between 0.1 and 0.3 percentage points of inflation
each month in decile ten from 1998 to mid-2005, after which its contribution declined
somewhat to under 0.1 percentage points. The contribution of water, while rising and falling
cyclically, followed a downward trend, its contribution falling from a peak of 0.3 percentage
points in June 1998 to under 0.1 percentage points by the end of 2006. The contribution of
insurance on mortgage debt trends slowly downwards, apart from the period between March
2001 and October 2003, when it increased to between 0.2 and 0.4 percentage points in each
month. The inflation contribution of house repairs and maintenance was quite unstable over
the period, fluctuating quite widely. At its peak at the start of 2003, it contributed 0.5 percentage
points to inflation, but 13 months later contributed less than 0.1 percentage points. Overall,
the contribution of repairs and maintenance to decile ten inflation followed a pattern broadly
similar, although lagged by a couple of months, to the movements of average urban inflation.
Expenditures on household fuel and power, an expenditure category that includes paraffin and
electricity, represent an important necessity for South African households. However, given the
fact that they are necessities, their relative importance declines as expenditure levels rise and
this results in the major differences in the contributions to total inflation across the distribution
(Figure 19). Across all expenditure deciles, paraffin and electricity combined to account for
virtually all of the inflation originating within this expenditure category. Paraffin was identified
earlier as an important contributor to inflation for poorer deciles, accounting for 9.9 percent of
decile one inflation, and its exact contribution over time is vividly displayed. From a relatively
small contribution to the decile’s inflation during 1998, paraffin prices soared in 1999, 2000 and
early 2001. On its own, paraffin accounted for more than one percentage point of inflation in
each month between May 1999 and March 2001 in decile one, and more than 1.7 percentage
points between January and August 2000. Following a brief spell of declining paraffin prices in
late 2001, paraffin accounted for a relatively small proportion of decile one inflation until mid-
2005 when its contribution ranged around 0.9 percentage points each month.
The steep drop in the importance of inflation is evident in the difference in the contributions of
paraffin to inflation in deciles one and four. In the case of the latter, paraffin never accounted
for more than one percentage point of inflation in any given month and in only 20 months out
DPRU WP 07/129 Morné Oosthuizen
50
of 108 did it account for more than 0.5 percentage points. By decile seven, the contribution of
paraffin to total inflation is negligible.
Figure 19: Contributions to Fuel and Power Inflation across the Distribution, 1998-2006
-0.5
0.0
0.5
1.0
1.5
2.0
2.5
-0.5
0.0
0.5
1.0
1.5
2.0
2.5
1998
1999
2000
2001
2002
2003
2004
2005
2006
2007
1998
1999
2000
2001
2002
2003
2004
2005
2006
2007
Decile 1 Decile 4
Decile 7 Decile 10
Paraffin Electricity Fuel & Power
Source: Own calculations, IES 2000 (Statistics South Africa)
Poor households’ relatively poor access to electricity (possibly combined with the effect of the
free 50kWh allowance of electricity provided to households by Government) is illustrated in this
item’s relatively small contribution to inflation amongst the poorest households. By decile four,
however, electricity makes a relatively significant contribution to both fuel and power inflation
and overall inflation for the decile. However, even then, it does not account for more than 0.5
percentage points of inflation in any given month. In higher expenditure deciles household fuel
and power inflation originates almost exclusively from electricity. In decile ten, in particular,
electricity contributed 2.6 percentage points of the 2.8 percentage points (92 percent) of fuel
and power inflation over the period.
The contrast across the deciles in terms of transport inflation is as stark as it is for fuel and
power inflation, except that in this case, it is decile one households that are barely impacted
(Figure 20). In the upper deciles, petrol and diesel is the major driver of inflation, with new and
Consumer Price Inflation across the Income Distribution in South Africa
51
used vehicles also making a significant contribution to inflation. Petrol and diesel inflation is
relatively unstable, fuel prices being determined by international prices and the Rand-Dollar
exchange rate. The depreciation of the Rand in 2000 led to a spike in the inflation contribution
of petrol and diesel from late 1999 to early 2001, while rising international oil prices led to a
relatively large contribution from around mid-2004 onwards. This was experienced directly
in decile ten particularly, but also in decile seven. However, by decile four the impact was
minimal. Between October 1999 and March 2001, petrol and diesel accounted for between 1.0
and 2.0 percentage points of inflation for decile ten and between 0.6 and 1.1 percentage points
of inflation in decile seven. Similarly, between May 2004 and August 2006, petrol and diesel
contributed an average of 1.0 percentage points of inflation each month in decile ten and 0.6
percentage points in decile seven. In contrast, in decile four petrol and diesel never accounted
for more than 0.2 percentage points of inflation in any given month.
Figure 20: Contributions to Transport Inflation across the Distribution, 1998-2006
-0.50.00.51.01.52.02.53.0
-0.50.00.51.01.52.02.53.0
Decile 1 Decile 4
Decile 7 Decile 10
Petrol/Diesel Taxi Vehicles Transport
1998
1999
2000
2001
2002
2003
2004
2005
2006
2007
1998
1999
2000
2001
2002
2003
2004
2005
2006
2007
Source: Own calculations, IES 2000 (Statistics South Africa)
Particularly up to early 2003, expenditure on new and used vehicles was an important driver of
inflation for decile ten households. From January 1998 to June 2003, new and used vehicles
accounted for between 0.3 and 1.3 percentage points of inflation each month for decile
ten households, with inflation from this source being greatest in the second half of 2002.
Thereafter, however, this expenditure category contributed little to inflation, and actually turned
negative from December 2003 until the end of the period. This expenditure item is almost
DPRU WP 07/129 Morné Oosthuizen
52
uniquely important to decile ten, as it contributed no more than 0.4 percentage points of
inflation to decile nine households in any month.
The only transport item that contributed a relatively significant proportion of inflation amongst
the poorest deciles was taxi and hired transport. Amongst decile one households, taxi and
hired transport accounted for 2.3 percent of inflation over the entire period. The contribution
of this item rose to as much as 3.2 percent in decile four, but dropped to under one percent
from decile eight upwards. However, taxi and hired transport never accounted for more than
0.4 percentage points of inflation in decile one in any given month and even in decile four its
largest contribution to inflation was 0.4 percentage points.
Between food, housing, household fuel and power and transport, two-thirds (66.2 percent)
of average urban inflation is accounted for. The four inflation peaks, particularly visible for
lower expenditure deciles, are well explained by rapid increases in inflation of food products,
specifically grain and meat products, and household fuel and power, of which paraffin is the
most important for poorer households. Amongst the upper deciles, transport inflation was
relatively more important, with petrol and diesel and new and used vehicles largest amongst
these.
4.6.3 Identifying Key Products Responsible for the Difference in Inflation
For Poor Households Compared to Other Groups
While the preceding analysis demonstrates the sources of inflation for poor households, it does
not explain the differences between the inflation rates of poor households on the one hand
and non-poor or wealthy households on the other hand. In his study of the US between 1976
and 1982, Hagemann (1982: 502) employs a procedure, developed by Bohdan Szulc (1980),
that decomposes the difference between two price indices, obtained from different baskets of
goods and services, and isolates those items that contribute towards widening or narrowing
the gap between the two indices.
The total relative discrepancy (RD) between two price indices in period t, Itc and I
tr, the
comparison and reference indices respectively, using the same notation as above, equals
100
100
1,00
1,0
1,00
1,0
1,00
1,0
n
irjj
n
irjjt
n
irjj
n
irjjt
n
icjj
n
icjjt
trtrtc
qp
qp
qp
qp
qp
qp
IIIRD
(6)
Consumer Price Inflation across the Income Distribution in South Africa
53
Thus, the relative discrepancy is decomposable, per expenditure item, into two components:
“the relative differences between the rates of price change of each commodity and the average
rate of change, and … the relative differences in the weights of each commodity in the two
market baskets” (Hagemann 1982: 503). Assuming that prices are similar in both baskets, the
above can be shown to equal
n
iir
ir
ic
tr
ti www
IIRD
1
, 10011 (7)
where Ii,t is price index for expenditure item i in period t, and w
ic and w
ir are the expenditure
weights of item i in the comparison and reference group baskets respectively.
The relative discrepancy, or the gap between the price indices for two groups, can be widened
and narrowed in two ways respectively. The relative discrepancy can be widened if the weight
of a high inflation item in the comparison group basket is higher than the weight of that item
in the reference group basket. The relative discrepancy can also be widened if the weight of
a low inflation item in the comparison group basket is lower than the weight of that item in
the reference group basket. Simply stated, the gap between the price indices of one group
and another can be widened if the former group is over-exposed to high inflation items or
under-exposed to low inflation items compared to the latter. The relative discrepancy can be
narrowed if the weight of a high (low) inflation item in the comparison group basket is lower
(higher) than the weight of that item in the reference group basket. In other words, the gap
between the price indices of one group and another can be narrowed if the former group is
over-exposed to low inflation items or under-exposed to high inflation items compared to the
latter.
By the end of 2006, the price indices for decile one households and for all urban households
were 192.5 and 195.2 respectively. Thus, the relative discrepancy was -1.378 percent. Table
6 presents the items responsible for the largest shares of the relative discrepancy. The table
differentiates between those items that served to widen the gap in the inflation rates – the
upper left and lower right quadrants – and those that served to narrow the gap – the upper
right and lower left quadrants.
As noted earlier, paraffin is an important driver of inflation for poor households, and the relative
discrepancy decomposition reveals it as the expenditure item that contributes most to widening
the gap between the inflation rate of decile one households and that of the average urban
household. This is due to decile one households’ relative over-exposure to paraffin, which is a
high inflation product. Other tobacco products and matches and candles widen the gap in the
same way. In contrast, insurance of buildings, for example, serves to widen the gap between
decile one households and the average urban household due to the former’s relative under-
exposure to this low inflation item. Other items in this group tend to be luxuries – vehicles,
computers and telecommunications equipment, holiday accommodation – and furniture and
DPRU WP 07/129 Morné Oosthuizen
54
appliances – televisions, bedroom furniture, fridges. The 14 items listed here serve to increase
the relative discrepancy by 5.4 percentage points.
The size of the relative discrepancy between decile one households and the average urban
household is decreased by the relative under-exposure of the poorest households to a number
of high inflation items. Flat rent narrows the relative discrepancy by 1.5 percentage points,
while medical aid contributions narrow it by slightly less than 1.5 percentage points. Various
housing-related expenditures, such as townhouse rent, domestic workers, assessment rates
and taxes and water, all serve to narrow the gap between the inflation rates of decile one
households and the average urban household. Interestingly, despite the fact that cigarettes
are identified as an important inflation driver for decile one households, these households are
relatively under-exposed to this high inflation item and it therefore helps reduce the relative
discrepancy. Similarly, mealie meal helped reduce the relative discrepancy, but this was due
to decile one households being relatively over-exposed to what was shown above to be a
relatively low inflation item. The same is true of three other food items – rice, potatoes and
bread flour – as well as taxi and hired transport.
Table 6: Source of the Difference in Inflation between Decile One and All Urban HouseholdsPrice Increase of Item Relative to OverallInflation for All Urban Households
Higher Lower
ExpenditureWeight ofIteminDecile1Relativeto
OverallWeight
Higher(Over-
exposure)
Widening the Gap between Decile 1 & Overall
Paraffin (+1.594)Other tobacco products (+0.809)Matches and candles (+0.203)
Narrowing the Gap between Decile 1 & Overall
Mealie meal (-0.714)Rice (-0.199)Skin creams and preparations (-0.162)Taxi and hired transport (-0.155)Toothpaste and toothbrushes (-0.123)Potatoes (-0.103)Bread flour (-0.102)
Lower(Under-exposure)
Narrowing the Gap between Decile 1 & OverallFlat rent (-1.517)Contributions tomedical aid funds (-1.461)Petrol and diesel (-0.709)Tuition and attendance fees (-0.608)Townhouse rent (-0.520)Cigarettes (-0.329)Domestic workers (-0.239)Assessment rates and taxes (-0.230)Water (-0.191)Medical insurance (-0.161)
Widening the Gap between Decile 1 & OverallInsurance of buildings (+0.663)New and used vehicles (+0.489)Mens clothing (+0.382)Computers & telecomm. equipment (+0.269)Televisions (+0.187)Mens shoes (+0.181)Bedroom furniture (+0.180)Levy (sectional titles etc) (+0.125)Fridges (+0.109)Radios, tape recorders, CDs (+0.105)Boarding
Source: Own calculations, IES 2000 (Statistics South Africa)
Decile ten experienced 94.1 percent inflation between 1997 and 2006, compared to 92.5
percent for decile one. The relative discrepancy between the price indices of these two groups
was, therefore, 0.827 percent. Table 6 presents the main items responsible for this difference.
Paraffin is, interestingly, not the most important item contributing to a widening of the gap
between the indices of the two groups. At 2.3 percentage points, it is surpassed by building
insurance (3.5 percentage points) and new and used vehicles (3.0 percentage points). The
latter two items, however, widen the gap because decile one households are under-exposed
to their low price increases over the period. Decile one households are over-exposed to items
Consumer Price Inflation across the Income Distribution in South Africa
55
such as other tobacco products, cigarettes, beer and beef and veal, which are high inflation
items.
A number of items serve to narrow the gap between the inflation rates of deciles one and
ten. Decile one households’ low level of contributions to medical aid funds, a high inflation
item, reduces the relative discrepancy by 3.7 percentage points. Other high inflation items to
which poor households are underexposed and which reduce the relative discrepancy most are
townhouse rent (reducing the relative discrepancy by 1.8 percentage points), petrol and diesel
(1.7 percentage points) and tuition and attendance fees (1.2 percentage points). Other high
inflation items to which poor households are under-exposed are luxury items in that better-
off households spend relatively more on them, such as domestic workers, housing-related
expenditures, and vehicle maintenance expenditures.
Table 7: Source of the Difference in Inflation between Decile One and Decile Ten HouseholdsPrice Increase of Item Relative toDecile 10
Higher Lower
Expe
nditu
reW
eigh
tofI
tem
inDe
cile
1Re
lativ
eto
Deci
le10
Wei
ght
High
er
Widening the Gap between Decile 1 &Decile 10
Paraffin (+2.341)Other tobacco products (+1.064)Cigarettes (+0.335)Matches and candles (+0.293)Beer (+0.188)Beef and veal (+0.178)Toilet soap (+0.155)Salt (+0.128)
Narrowing the Gap between Decile 1 &Decile 10
Mealie meal (-1.039)Taxi and other hired transport (-0.742)Rice (-0.412)Womens clothing (-0.361)Womens shoes (-0.270)Skin creams and preparations (-0.245)Poultry (-0.191)Toothpaste and toothbrushes (-0.183)Bread flour (-0.179)Bus transport (-0.167)Potatoes (-0.166)Cake flour (-0.141)Wood and coal (-0.140)Tea (-0.135)Coffee (-0.124)Other personal care (-0.122)Mens shoes (-0.117)Mealie rice (-0.112)Deciduous fruit (-0.103)
Low
er
Narrowing the Gap between Decile 1 &Decile 10
Contributions to medical aid funds(-3.729)Townhouse rent (-1.779)Petrol and diesel (-1.725)Tutition and attendance fees (-1.222)Domestic workers (-0.825)Medical insurance (-0.402)Assessment rates and taxes (-0.397)Flat rent (-0.377)Other education expenditure(-0.134)Vehicle servicing etc (-0.128)
Widening the Gap between Decile 1 &Decile 10
Building insurance (+3.475)New and used vehicles (+2.972)Computers & telecomm. equipment (+0.837)BoardingCellular phonecalls (+0.219)Insurance of vehicles (+0.198)Televisions (+0.196)Levy (sectional titles etc) (+0.195)Other recreation and entertainment exp. (+0.134)Dining room furniture (+0.129)Membership fees (+0.120)Lounge furniture (+0.109)Telephone calls (+0.109)
Source: Own calculations, IES 2000 (Statistics South Africa)
In the instance of mealie meal, the relative discrepancy is reduced by the fact that decile
one households are relatively over-exposed to this relatively low inflation item. Thus, mealie
meal reduced the relative discrepancy by 1.0 percentage points. The majority of items in
this quadrant are necessities, such as food, clothing, and public transport. In terms of food
DPRU WP 07/129 Morné Oosthuizen
56
items, rice, poultry and bread flour make the largest contributions to reducing the relative
discrepancy between these two income groups, reducing it by 0.4, 0.2 and 0.2 percentage
points respectively. In terms of public transport expenditures, taxi and other hired transport
reduced the relative discrepancy by 0.7 percentage points over the period, while bus transport
contributed to narrowing the gap by 0.2 percentage points.
This type of analysis provides a clearer understanding of the plight of poor households in terms
of inflation that a pure inflation driver analysis can and does not. Paraffin emerged earlier as
a key driver of inflation for poor households and this analysis confirms that it widens the gap
between the aggregate price indices for decile one relative to the average urban household
and relative to decile ten households. However, the same is not true for mealie meal. Mealie
meal was identified as an important inflation driver, but actually contributes to a reduction in
the relative discrepancy because, over the period, prices increased by less than the overall
rate of inflation. Similarly, poultry is classified as an inflation driver for poor household, yet does
not contribute significantly to the relative discrepancy between decile one households and the
average urban household, and narrows the relative discrepancy between decile one and decile
ten households.
This analysis also points again to the potential threats to poor households based on their
relative over-exposure to certain items. Since inflation dynamics may change over time, low
inflation items may become high inflation items in the future. Thus, amongst the items to
which poor households are overexposed, may switch from the low inflation to the high inflation
quadrant. A key example of this, demonstrable for the 2001-2003 sub-period, is mealie meal.
For the overall period, mealie meal has contributed towards narrowing the gap between the
price indices of deciles one and ten respectively by 1.0 percentage points, between 2001 and
2003, it would have contributed substantially to a widening of the gap.
Consumer Price Inflation across the Income Distribution in South Africa
57
5. Conclusion
Poor households’ welfare levels depend crucially on two things: their incomes, be they
in the form of wages, remittances or social grants, and the prices they face. The fact that
households at different income or expenditure levels have different spending patterns leads
to two important conclusions. Firstly, different households may face different prices because
they purchase the various items in their baskets from different sources, such as supermarkets,
convenience stores, or informal (street) traders. Secondly, different households devote varying
proportions of their spending to given items, making them relatively more or less exposed to
price changes in specific expenditure categories. Even assuming away the difference in actual
prices, variation in spending patterns results in varying inflation rates across the expenditure
distribution.
This paper has investigated the differences in the inflation rates between households at varying
points of the expenditure distribution, and identified some of the important items responsible
for inflation amongst the poor between 1997 and 2006. Some important conclusions can be
drawn from the analysis.
The conventionally calculated, plutocratic weight structure does not reflect the ‘average’
household as is commonly believed. Being related to the level of inequality within a given
society, the plutocratic weights calculated above most closely reflect the spending patterns of
households in the 95th percentile of the expenditure distribution. As a result, price indices and
inflation rates calculated on the basis of these weights can not accurately reflect the rates of
inflation experienced by what would be viewed as the ‘average’ household.
This study concurs with the majority of the literature surveyed in that neither rich nor poor
households are found to have experienced rates of inflation consistently higher or lower than
average, with the plutocratic gap shifting from positive values to negative values (or vice
versa) seven times between January 1998 and December 2006. The preceding sections
have shown that the inflation rate calculated using conventional plutocratic weights does not
differ substantially over longer periods of time from the democratically weighted inflation rate.
However, over shorter time periods, the difference between the two inflation rates can be
significant, indicating a marked divergence in the rates of inflation experienced by households
at different points of the income distribution. Although the official CPI in South Africa is, like
those in other countries, unable to accurately reflect the rates of inflation experienced by
households of different income levels at all points in time, it is not suggested that the current
methodology be abandoned in favour of a democratically weighted consumer price index, for
example. Official price indices play an important role in macroeconomic policymaking, with
the official CPI providing an accurate reflection of economy-wide inflation. Plutocratic inflation
rates are biased towards the expenditures of wealthier households, but this bias is in line with
DPRU WP 07/129 Morné Oosthuizen
58
the overall structure of consumer spending. As such, it would be irresponsible to abandon
conventional CPIs in favour of democratic alternatives.
What is clear, however, is that the purpose for which a price index or inflation rate is used
should determine the type of weighting structure employed. In the case of monitoring economy-
wide consumer price inflation, the price index should reflect the structure of economy-wide
consumer spending. In contrast, where the price index is to be used for adjusting state welfare
benefits, or merely for the monitoring of the rate of inflation experienced by the poor, the price
index should reflect price changes that are relevant to poorer households. As Ley (2005: 644)
notes, there “is a crucial tradeoff between the simplicity of the current prevailing one-size-fits-all
approach and the conceptual superiority of a piecemeal-menu approach to index numbers …
[and the] best resolution may well vary in different places and at different times”. Further, it is
acknowledged that democratic weights are just one of numerous possible weighting structures
that would result in a price index that more accurately reflects the experience of poorer
households. “One way of overcoming [the bias of plutocratic weights] is to proceed according
to the democratic calculation … another would be to use the median method. Clearly, there
must be many other methods that may be suggested. Any choice among them will depend on
assessing the balance of political considerations (What sort of wage negotiations is the index
to be used for? Can more than one index numbers be tolerated without confusion?) and that
of numerical feasibility (Is a more complicated calculation worth the extra cost?)” (Prais, 1959:
131).
An item can make a significant contribution to a given group’s inflation via two routes: either
the item’s price must rise rapidly relative to average inflation, or the item must have a large
weight relative to other items in the expenditure basket. In instances where items both have a
large expenditure weight and experienced relatively high inflation, the contribution to inflation
will be even larger. Thus, although electricity was found to be an important driver of inflation
for the average urban household, this was more a result of a very large expenditure weight,
since the price of electricity rose less than the average rate of inflation. Over the period as
a whole, for poorer deciles, the same was true of mealie meal, poultry, and taxi and hired
transport. Cigarettes, tuition and attendance fees, water and beef and veal, in contrast,
tended to be inflation drivers because of their very high rates of price increase. This distinction
has an important implication for policymaking that attempts to mitigate the experience of
inflation amongst poor households. In the case of high-weight low-price increase drivers of
inflation, policy should perhaps be targeted at changing spending patterns in order to reduce
households’ vulnerability to inflation from this source, rather than focussing on reducing the
rate at which the price of the item increases. Conversely, for low-weight high-price increase
drivers of inflation, appropriate policy might focus on lowering the rate of price increases rather
than attempting to change spending patterns.
Inflation amongst poor households over the period was concentrated in three main expenditure
categories, namely food, housing and household fuel and power. Within these, the major
Consumer Price Inflation across the Income Distribution in South Africa
59
culprits are easily identifiable: mealie meal and brown and wholewheat bread, poultry and
beef and veal, water and house rent, and paraffin and electricity. These eight items accounted
for 34.5 percent of decile one inflation and 26.9 percent of decile four inflation and were
responsible in large part for the acceleration of inflation during the four inflation peaks over
the period. This demonstrates the vulnerability of poor households to inflation deriving from
necessities, but also highlights the fact that a targeted response to accelerating inflation may
have a significant impact. Thus, during the high inflation episode of 2002/3, Government’s
policy of subsidising mealie meal would have helped dampen the impact on poor households.
While unarguably monetary policy decisions should be based on the conventional consumer
price index or, in the case of South Africa, CPIX, monetary policy that aims to be sensitive
to the plight of the poor needs to be informed by alternative measures of inflation that more
accurately reflect the experiences of poor households. The publishing by Statistics South Africa
of expenditure quintile inflation rates is an important step in this regard and serves to create
greater awareness of the different experiences of inflation across the income distribution. It is
hoped that this paper will contribute to this better understanding of the varying experiences of
inflation.
DPRU WP 07/129 Morné Oosthuizen
60
6. REFERENCES
Amble, N. and Stewart, K. (1994), “Experimental Price Index for Elderly Consumers”, Monthly Labor Review 117(5): 11-16.
Artsev, Y., Roshal, V. and Finkel, Y. (2006), Consumer Price Indices - Measuring Across Households. Paper presented at Nineth Ottawa Group Meeting on Prices, 14-16 May 2006, London, United Kingdom, Available (online): http://www.statistics.gov.uk/events/ottawa_group/downloads/Session7.2.pdf. Accessed: 21 December 2006.
Bennett, M. (2006), Personal communications. Statistics South Africa, 23 August.
Bhorat, H. and Oosthuizen, M. (2003), The Differential Impact of Inflation on Poor South African Households. Unpublished research report for South African Reserve Bank. Development Policy Research Unit, Cape Town.
Crawford, I. and Smith, Z. (2002), “Distributional Aspects of Inflation”. The Institute for Fiscal Studies Commentary, No. 90. Available (online): http://www.ifs.org.uk/comms/comm90.pdf. Accessed: 15 January 2007.
Deaton, A. (1998), “Getting Prices Right: What Should Be Done?” Journal of Economic Perspectives 12(1): 37-46.
Garner, T. I., Johnson, D. S. and Kokoski, M. F. (1996), “An Experimental Consumer Price Index for the Poor”, Monthly Labor Review 119(9): 32-42.
Hagemann, R. P. (1982), “The Variability of Inflation Rates Across Household Types”, Journal of Money, Credit and Banking 14(4): 494-510.
Hobijn, B. and Lagakos, D. (2005), “Inflation Inequality in the United States”, Review of Income and Wealth 51(4): 581-606.
Hollister, R. G. and Palmer, J. L. (1972), “The Impact of Inflation on the Poor”, in Boulding, K. E. and Pfaff, M., eds. Redistribution to the Rich and the Poor. California: Wadsworth Publishing Company, pp. 240-270.
Hoogeveen, J. G. and Ozler, B. (2006), “Poverty and Inequality in Post-Apartheid South Africa: 1995-2000”, in Bhorat, H. and Kanbur, R., eds. Poverty and Policy in Post-Apartheid South Africa. Cape Town: HSRC Press, pp. 59-94.
Idson, T. and Miller, C. (1999), “Calculating a Price Index for Families with Children: Implications for Measuring Trends in Child Poverty”, Review of Income and Wealth 45(2): 217-234. Available (online): http://www.roiw.org/1999.asp. Accessed: 24 January 2007.
International Labour Organisation (2004), Consumer Price Index Manual: Theory and Practice. Available (online): http://www.ilo.org/public/english/bureau/stat/guides/cpi/index.htm. Accessed: 11 January 2007.
Izquierdo, M., Ley, E. and Ruiz-Castillo, J. (2003), “The Plutocratic Gap in the CPI: Evidence from Spain”. IMF Staff Papers Vol. 50, No. 1. Available (online): http://www.imf.org/external/pubs/ft/staffp/2003/01/PDF/Izqui.pdf. Accessed: 21 December 2006.
Consumer Price Inflation across the Income Distribution in South Africa
61
Kahn, B. (1985), “The Effects of Inflation on the Poor in South Africa”. Economic Learning Resources Series, No. 5. School of Economics, University of Cape Town.
Kokoski, M. (2000), “Alternative CPI Aggregations: Two Approaches”, Monthly Labor Review 123(11): 31-39.
Ley, E. (2005), “Whose Inflation? A Characterization of the CPI Plutocratic Gap”, Oxford Economic Papers 47(4): 634-646.
Lieu, P.-T., Chang, C. and Chang, J.-r. (2004), “Inflation Rate Variations Across Household: Empirical Evidence from Taiwan”, International Journal of Business 9(1): 103-124. Available (online): http://papers.ssrn.com/sol3/papers.cfm?abstract_id=490457. Accessed: 11 January 2007.
McGranahan, L. and Paulson, A. (2006), “Constructing the Chicago Fed Income Based Economic Index - Consumer Price Index: Inflation Experiences by Demographic Group: 1983-2005”. Federal Reserve Bank of Chicago Working Paper, No. 2005-20. Available (online): http://www.chicagofed.org/economic_research_and_data/publication_display.cfm?Publication=6&year=2000%20AND%202005. Accessed: 25 January 2007.
McKay, A. and Sowa, N. K. (2004), Does Inflation in Ghana Hit the Poor Harder? (preliminary draft). Available (online): http://www.isser.org/Inflation%20&%20Ghanaian%20Poor.pdf. Accessed: 21 December 2006.
Michael, R. T. (1979), “Variation Across Households in the Rate of Inflation”, Journal of Money, Credit and Banking 11(1): 32-46.
Moulton, B. R. and Stewart, K. J. (1999), “An Overview of Experimental US Consumer Price Indexes”, Journal of Business and Economic Statistics 17(2): 141-151. Available (online): http://links.jstor.org/sici?sici=0735-0015%28199904%2917%3A2%3C141%3AAOOEUC%3E2.0.CO%3B2-%23. Accessed: 25 January 2007.
Murphy, E. and Garvey, E. (2004), “A Consumer Price Index for Low-Income Households in Ireland (1989-2001)”. Combat Poverty Agency Working Paper, No. 04/03. Available (online): http://www.cpa.ie/publications/workingpapers.htm. Accessed: 11 January 2007.
Ozler, B. (2006), Not Separate, Not Equal: Poverty and Inequality in Post-Apartheid South Africa. The World Bank. Unpublished paper.
Prais, S. J. (1959), “Whose Cost of Living?” The Review of Economic Studies 26(2): 126-134.
Simkins, C. (2004), What Happened to the Distribution of Income in South Africa Between 1995 and 2001? University of the Witwatersrand. Unpublished paper. Available (online): http://www.sarpn.org.za/documents/d0001062/index.php. Accessed: 7 March 2007.
South African Reserve Bank, 2002. Quarterly Bulletin. No. 226, December. Available (online): http://www.reservebank.co.za/. Accessed: 5 March 2007.
South African Reserve Bank (2007), Quarterly Bulletin - Historic Macroeconomic Information.
DPRU WP 07/129 Morné Oosthuizen
62
Database available (online): http://www.reservebank.co.za. Accessed: 1 June 2007.Statistics South Africa (2002a), “Consumer Price Index (CPI): 2000 Weights (Historical
metropolitan and other urban areas).” Statistical Release P0141.5. Available (online): http://www.statssa.gov.za/publications/statsdownload.asp?ppn=P0141.5&SCH=1484. Accessed: 11 January 2007.
Statistics South Africa (2002b), Income and Expenditure Survey 2000. Dataset.
Statistics South Africa (2007), “Consumer Price Index (CPI) - Rural Areas and Total Country (December 2006)”. Statistical Release P0141.2. Available (online): http://www.statssa.gov.za. Accessed: 25 January 2007.
Taktek, N. (1998), “Comparative Study of Analytical Consumer Price Indexes (CPI) for Different Subgroups of the Reference Population”. Analytical Series, No. 13. Statistics Canada. Available (online): http://www.statcan.ca/cgi-bin/downpub/listpub.cgi?catno=62F0014MIB1998013. Accessed: 11 January 2007.
United Nations Development Programme (2003), South Africa Human Development Report. Cape Town: Oxford University Press.
Van der Berg, S., Burger, R., Burger, R., Louw, M. and Yu, D. (2006), “Trends in Poverty and Inequality since the Political Transition”. Development Policy Research Unit Working Paper, No. 06/104. Available (online): http://www.commerce.uct.ac.za/Research_Units/DPRU/WorkingPapers/wpapers.asp. Accessed: 5 March 2007.
Vermaak, C. (2005), Trends in Income Distribution, Inequality and Poverty in South Africa, 1995 to 2003. Paper presented at Economic Society of South Africa Conference, Durban, 7-9 September. Available (online): http://www.essa.org.za/download/papers2005.htm. Accessed: 5 March 2007.
Consumer Price Inflation across the Income Distribution in South Africa
63
Appendix A
Table A-1: Democratic Expenditure Weights Across Deciles, Metropolitan and Other Urban Areas,
2000
Dec
ile1
Dec
ile2
Dec
ile3
Dec
ile4
Dec
ile5
Dec
ile6
Dec
ile7
Dec
ile8
Dec
ile9
Dec
ile10
All
Food
49.2
50.3
46.2
44.5
40.5
38.1
32.9
27.2
21.8
15.3
36.6
Non-Alcoho
licBe
verage
s1.6
1.9
2.1
2.1
1.9
1.8
1.6
1.4
1.2
0.9
1.7
Alcoho
licBe
verage
s2.1
2.1
2.2
2.8
2.3
2.3
1.7
1.5
1.6
1.5
2.0
Toba
ccoProd
ucts
2.3
2.2
2.0
2.3
2.5
2.3
2.1
1.7
1.4
0.9
2.0
Clothing
&Fo
otwe
ar5.5
6.3
8.2
7.7
7.9
7.8
7.4
6.3
4.7
3.5
6.5
Housing
5.8
5.9
6.0
5.8
7.7
8.7
11.5
15.6
18.8
22.9
10.9
Fuel&Po
wer
8.7
8.4
7.0
7.1
6.4
6.4
5.8
5.2
4.3
3.1
6.2
Furniture
&Eq
uipm
ent
0.8
1.5
3.0
2.9
3.4
3.8
4.2
3.5
3.4
3.1
3.0
Househ
oldOpe
ration
4.6
3.8
3.2
3.2
3.0
2.8
3.1
3.7
4.8
4.8
3.7
Med
icalC
are
0.9
0.9
1.1
1.1
1.7
2.6
3.4
4.9
5.7
5.7
2.8
Tran
sport
5.0
4.9
6.3
7.1
7.9
7.7
10.0
11.5
14.0
20.7
9.5
Commun
ication
1.2
1.3
1.6
2.0
2.2
2.5
3.0
3.5
3.8
3.7
2.5
Recrea
tion&En
terta
inmen
t0.5
1.0
1.2
1.7
1.9
2.5
2.3
3.0
4.1
4.6
2.3
Read
ingMaterial
0.4
0.4
0.6
0.6
0.8
1.0
1.2
1.2
1.0
1.2
0.8
Education
1.2
1.4
1.9
1.8
2.9
2.7
3.5
4.1
4.3
4.3
2.8
Person
alCa
re9.7
7.1
6.9
6.5
6.3
6.2
5.7
5.1
4.5
3.1
6.1
Other
Goo
ds&Se
rvice
s0.5
0.6
0.7
0.8
0.8
0.7
0.8
0.7
0.7
0.8
0.7
Tota
l10
0.0
100.
010
0.0
100.
010
0.0
100.
010
0.0
100.
010
0.0
100.
010
0.0
Source: Own calculations, IES 2000 (Statistics South Africa)
DPRU WP 07/129 Morné Oosthuizen
64
Appendix BFigure B-1: Contributions to Food Inflation Across the Distribution, 1998-2006
-2.00.02.04.06.08.0
10.012.0
-2.00.02.04.06.08.0
10.012.0
1998
1999
2000
2001
2002
2003
2004
2005
2006
2007
1998
1999
2000
2001
2002
2003
2004
2005
2006
2007
Decile 1 Decile 4
Decile 7 Decile 10
Grain Meat Vegetables Food
Source: Own calculations, IES 2000 (Statistics South Africa)
Consumer Price Inflation across the Income Distribution in South Africa