+ All Categories
Home > Documents > Contrast-free T1 mapping at 3T can characterize chronic myocardial infarctions with high diagnostic...

Contrast-free T1 mapping at 3T can characterize chronic myocardial infarctions with high diagnostic...

Date post: 23-Dec-2016
Category:
Upload: rohan
View: 212 times
Download: 0 times
Share this document with a friend
3
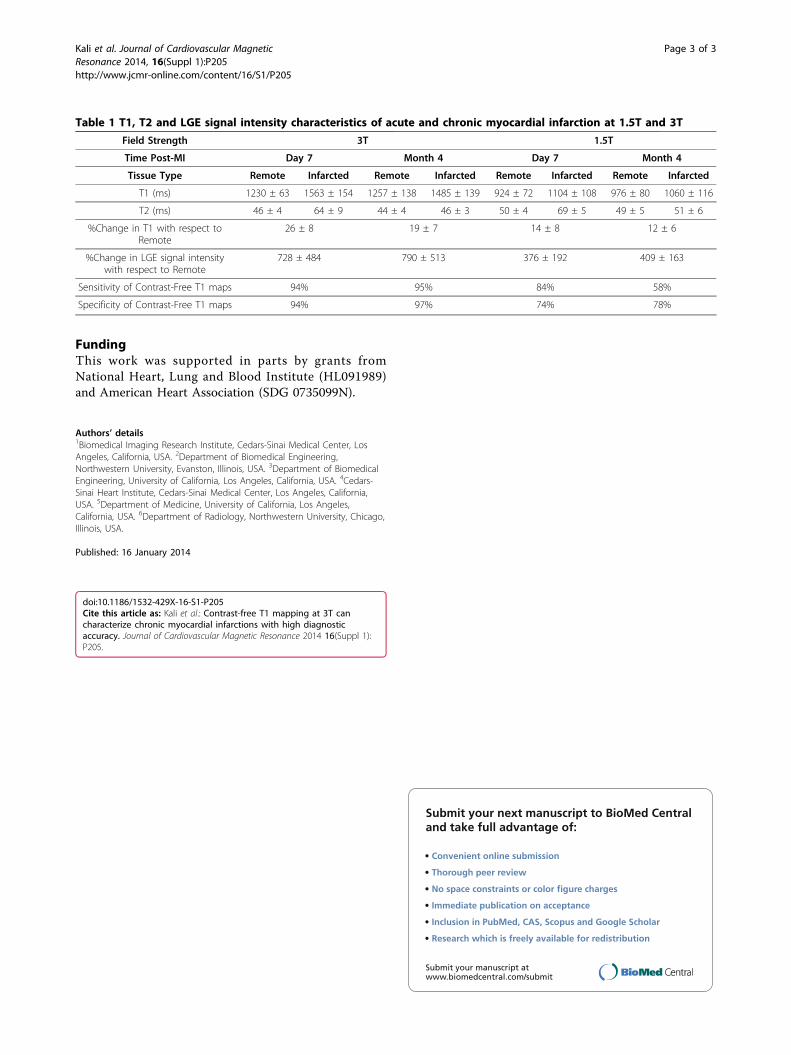
POSTER PRESENTATION Open Access Contrast-free T1 mapping at 3T can characterize chronic myocardial infarctions with high diagnostic accuracy Avinash Kali 1,2* , Ivan Cokic 1 , Richard Tang 1 , Hsin-Jung Yang 1,3 , Behzad Sharif 1 , Eduardo Marbán 4 , Debiao Li 1,6 , Daniel S Berman 4,5 , Rohan Dharmakumar 1,6 From 17th Annual SCMR Scientific Sessions New Orleans, LA, USA. 16-19 January 2014 Background Characterizing myocardial infarctions (MIs) on the basis of LGE CMR requires gadolinium infusion, which poses limitations in certain patient populations and imaging workflow. We hypothesized that T1 differences between MI and remote territories at 3T would enable reliable characterization of chronic MI. Methods Canines (n = 29) underwent CMR at 7 days (acute) and 4 months (chronic) following reperfused MIs at 3T (n = 19) and 1.5T (n = 10). Contrast-free T1 maps (MOLLI; 8 TIs with 2 inversion blocks of 3+5 images; minimum TI = 110 ms; ΔTI = 80 ms; TR/TE = 2.2/1.1 ms) and LGE images (IR-prepared FLASH; TI optimized to null remote myocardium; TR/TE = 3.5/1.75 ms) were acquired. MI location, size and transmurality were deter- mined using Mean+5SD criterion relative to remote myo- cardium. T2 maps (T2-prepared SSFP; T2 preparation times = 0, 24 and 55 ms; TR/TE = 2.8/1.4 ms) were acquired to compare acute and chronic MIs. Commonly used imaging parameters were slice thickness = 6 mm and spatial resolution = 1.3 × 1.3 mm 2. Histological vali- dation was sought to confirm the presence of replace- ment fibrosis within the chronic infarct zones. Results Contrast-free T1 maps and LGE images of a representa- tive mid-ventricular slice, along with AHA 17-segment bulls-eye plots depicting the MI size and transmurality acquired from a canine scanned imaged 4 months post-MI at 3T are shown in Figure 1. Bland-Altman plots, linear regression plots and receiver-operating characteristic curve comparing T1 maps and LGE images for measuring infarct volume (IV, %LV) and transmurality (IT) in the chronic phase at 3T are also shown. At 3T, T1 maps and LGE images were not dif- ferent for measuring IV (5.6 ± 3.7% vs. 5.5 ± 3.7%; p = 0.61) and IT (44 ± 15% vs. 46 ± 15%; p = 0.81) in the chronic phase, but were significantly different in the acute phase (IS: 13.3 ± 8.4% vs. 11.6 ± 6.8%, p = 0.007 and IT: 64 ± 19% vs. 56 ± 17%, p = 0.007). At 1.5T, IV and IT were significantly underestimated by T1 maps relative to LGE images during acute (IS: 9.4 ± 5.6% vs. 15.5 ± 9.4%, p < 0.001 and IT: 59 ± 5% vs. 76 ± 6%, p < 0.001) and chronic phases (IS: 2.1 ± 1.2% vs. 4.8 ± 1.8%, p < 0.001 and IT: 47 ± 7% vs. 66 ± 9%, p < 0.001). At 3T and 1.5T, T1 values of the MI remained elevated in both acute (3T: p < 0.001; 1.5T: p < 0.001) and chronic phases (3T: p < 0.001; 1.5T: p = 0.037) compared to remote myocardium (Table 1). At both 3T and 1.5T, relative to the remote myocardium, T2 values of the MI were elevated in the acute phase (p < 0.001 for both cases), but were not different in the chronic phase (3T: p = 0.19, 1.5T: p = 0.55). Ex-vivo TTC and Elastin- modified Massons Trichrome (EMT) stainings (Figure 1) confirmed extensive replacement fibrosis within the MI territories at 4 months post MI. Sensitivity and specificity of contrast-free T1 maps at 3T for detecting chronic MIs were 95% and 97%, respectively. Conclusions Contrast-free T1 maps at 3T can determine the location, size and transmurality of chronic MIs with high diag- nostic accuracy. 1 Biomedical Imaging Research Institute, Cedars-Sinai Medical Center, Los Angeles, California, USA Full list of author information is available at the end of the article Kali et al. Journal of Cardiovascular Magnetic Resonance 2014, 16(Suppl 1):P205 http://www.jcmr-online.com/content/16/S1/P205 © 2014 Kali et al.; licensee BioMed Central Ltd. This is an Open Access article distributed under the terms of the Creative Commons Attribution License (http://creativecommons.org/licenses/by/2.0), which permits unrestricted use, distribution, and reproduction in any medium, provided the original work is properly cited. The Creative Commons Public Domain Dedication waiver (http:// creativecommons.org/publicdomain/zero/1.0/) applies to the data made available in this article, unless otherwise stated.
Transcript

POSTER PRESENTATION Open Access

Contrast-free T1 mapping at 3T can characterizechronic myocardial infarctions with highdiagnostic accuracyAvinash Kali1,2*, Ivan Cokic1, Richard Tang1, Hsin-Jung Yang1,3, Behzad Sharif1, Eduardo Marbán4, Debiao Li1,6,Daniel S Berman4,5, Rohan Dharmakumar1,6

From 17th Annual SCMR Scientific SessionsNew Orleans, LA, USA. 16-19 January 2014

BackgroundCharacterizing myocardial infarctions (MIs) on the basisof LGE CMR requires gadolinium infusion, which poseslimitations in certain patient populations and imagingworkflow. We hypothesized that T1 differences betweenMI and remote territories at 3T would enable reliablecharacterization of chronic MI.

MethodsCanines (n = 29) underwent CMR at 7 days (acute) and4 months (chronic) following reperfused MIs at 3T (n =19) and 1.5T (n = 10). Contrast-free T1 maps (MOLLI;8 TIs with 2 inversion blocks of 3+5 images; minimumTI = 110 ms; ΔTI = 80 ms; TR/TE = 2.2/1.1 ms) andLGE images (IR-prepared FLASH; TI optimized to nullremote myocardium; TR/TE = 3.5/1.75 ms) wereacquired. MI location, size and transmurality were deter-mined using Mean+5SD criterion relative to remote myo-cardium. T2 maps (T2-prepared SSFP; T2 preparationtimes = 0, 24 and 55 ms; TR/TE = 2.8/1.4 ms) wereacquired to compare acute and chronic MIs. Commonlyused imaging parameters were slice thickness = 6 mmand spatial resolution = 1.3 × 1.3 mm 2. Histological vali-dation was sought to confirm the presence of replace-ment fibrosis within the chronic infarct zones.

ResultsContrast-free T1 maps and LGE images of a representa-tive mid-ventricular slice, along with AHA 17-segmentbulls-eye plots depicting the MI size and transmuralityacquired from a canine scanned imaged 4 months

post-MI at 3T are shown in Figure 1. Bland-Altmanplots, linear regression plots and receiver-operatingcharacteristic curve comparing T1 maps and LGEimages for measuring infarct volume (IV, %LV) andtransmurality (IT) in the chronic phase at 3T are alsoshown. At 3T, T1 maps and LGE images were not dif-ferent for measuring IV (5.6 ± 3.7% vs. 5.5 ± 3.7%; p =0.61) and IT (44 ± 15% vs. 46 ± 15%; p = 0.81) in thechronic phase, but were significantly different in theacute phase (IS: 13.3 ± 8.4% vs. 11.6 ± 6.8%, p = 0.007and IT: 64 ± 19% vs. 56 ± 17%, p = 0.007). At 1.5T, IVand IT were significantly underestimated by T1 mapsrelative to LGE images during acute (IS: 9.4 ± 5.6% vs.15.5 ± 9.4%, p < 0.001 and IT: 59 ± 5% vs. 76 ± 6%, p <0.001) and chronic phases (IS: 2.1 ± 1.2% vs. 4.8 ± 1.8%,p < 0.001 and IT: 47 ± 7% vs. 66 ± 9%, p < 0.001). At3T and 1.5T, T1 values of the MI remained elevated inboth acute (3T: p < 0.001; 1.5T: p < 0.001) and chronicphases (3T: p < 0.001; 1.5T: p = 0.037) compared toremote myocardium (Table 1). At both 3T and 1.5T,relative to the remote myocardium, T2 values of the MIwere elevated in the acute phase (p < 0.001 for bothcases), but were not different in the chronic phase (3T:p = 0.19, 1.5T: p = 0.55). Ex-vivo TTC and Elastin-modified Masson’s Trichrome (EMT) stainings (Figure 1)confirmed extensive replacement fibrosis within the MIterritories at 4 months post MI. Sensitivity and specificityof contrast-free T1 maps at 3T for detecting chronic MIswere 95% and 97%, respectively.

ConclusionsContrast-free T1 maps at 3T can determine the location,size and transmurality of chronic MIs with high diag-nostic accuracy.

1Biomedical Imaging Research Institute, Cedars-Sinai Medical Center, LosAngeles, California, USAFull list of author information is available at the end of the article

Kali et al. Journal of Cardiovascular MagneticResonance 2014, 16(Suppl 1):P205http://www.jcmr-online.com/content/16/S1/P205

© 2014 Kali et al.; licensee BioMed Central Ltd. This is an Open Access article distributed under the terms of the Creative CommonsAttribution License (http://creativecommons.org/licenses/by/2.0), which permits unrestricted use, distribution, and reproduction inany medium, provided the original work is properly cited. The Creative Commons Public Domain Dedication waiver (http://creativecommons.org/publicdomain/zero/1.0/) applies to the data made available in this article, unless otherwise stated.

Figure 1 Representative slice-matched LGE images and contrast-free T1 maps acquired from a canine imaged at 3T (4 months postMI) are shown. Post-processed images delineating the MI territories using Mean+5SD criterion relative to remote myocardium are also shown.Hypointense core of iron deposition within hyperintense MI zone on T1 maps was manually included in the analysis (highlighted light bluepixels on the processed images). AHA 17-segment bulls-eye plots showed excellent correlations between LGE images and T1 maps formeasuring infarct volume (IV) and transmurality (IT). Ex-vivo TTC and EMT staining showed extensive replacement fibrosis within MI (top panel),but not in remote myocardium (bottom panel). Strong agreement and correlation were observed between LGE images and T1 maps formeasuring chronic IV (Bias = -0.08 ± 0.68% (panel A) and R2 = 0.97 (panel B)) and IT (Bias = 0.45 ± 8.14% (panel C) and R2 = 0.75 (panel D)) at3T. Area under the curve for detecting chronic MI at 3T using T1 maps was 0.99 (panel E).

Kali et al. Journal of Cardiovascular MagneticResonance 2014, 16(Suppl 1):P205http://www.jcmr-online.com/content/16/S1/P205

Page 2 of 3

FundingThis work was supported in parts by grants fromNational Heart, Lung and Blood Institute (HL091989)and American Heart Association (SDG 0735099N).

Authors’ details1Biomedical Imaging Research Institute, Cedars-Sinai Medical Center, LosAngeles, California, USA. 2Department of Biomedical Engineering,Northwestern University, Evanston, Illinois, USA. 3Department of BiomedicalEngineering, University of California, Los Angeles, California, USA. 4Cedars-Sinai Heart Institute, Cedars-Sinai Medical Center, Los Angeles, California,USA. 5Department of Medicine, University of California, Los Angeles,California, USA. 6Department of Radiology, Northwestern University, Chicago,Illinois, USA.

Published: 16 January 2014

doi:10.1186/1532-429X-16-S1-P205Cite this article as: Kali et al.: Contrast-free T1 mapping at 3T cancharacterize chronic myocardial infarctions with high diagnosticaccuracy. Journal of Cardiovascular Magnetic Resonance 2014 16(Suppl 1):P205.

Submit your next manuscript to BioMed Centraland take full advantage of:

• Convenient online submission

• Thorough peer review

• No space constraints or color figure charges

• Immediate publication on acceptance

• Inclusion in PubMed, CAS, Scopus and Google Scholar

• Research which is freely available for redistribution

Submit your manuscript at www.biomedcentral.com/submit

Table 1 T1, T2 and LGE signal intensity characteristics of acute and chronic myocardial infarction at 1.5T and 3T

Field Strength 3T 1.5T

Time Post-MI Day 7 Month 4 Day 7 Month 4

Tissue Type Remote Infarcted Remote Infarcted Remote Infarcted Remote Infarcted

T1 (ms) 1230 ± 63 1563 ± 154 1257 ± 138 1485 ± 139 924 ± 72 1104 ± 108 976 ± 80 1060 ± 116

T2 (ms) 46 ± 4 64 ± 9 44 ± 4 46 ± 3 50 ± 4 69 ± 5 49 ± 5 51 ± 6

%Change in T1 with respect toRemote

26 ± 8 19 ± 7 14 ± 8 12 ± 6

%Change in LGE signal intensitywith respect to Remote

728 ± 484 790 ± 513 376 ± 192 409 ± 163

Sensitivity of Contrast-Free T1 maps 94% 95% 84% 58%

Specificity of Contrast-Free T1 maps 94% 97% 74% 78%

Kali et al. Journal of Cardiovascular MagneticResonance 2014, 16(Suppl 1):P205http://www.jcmr-online.com/content/16/S1/P205

Page 3 of 3


Recommended