Page 1
Computers and Chemical Engineering 28 (2004) 219�/234
www.elsevier.com/locate/compchemeng
Control structure design for complete chemical plants�
Sigurd Skogestad +
Department of Chemical Engineering, Norwegian University of Science and Technology (NTNU), 7491 Trondheim, Norway
Abstract
Control structure design deals with the structural decisions of the control system, including what to control and how to pair the
variables to form control loops. Although these are very important issues, these decisions are in most cases made in an ad hoc
fashion, based on experience and engineering insight, without considering the details of each problem. In the paper, a systematic
procedure for control structure design for complete chemical plants (plantwide control) is presented. It starts with carefully defining
the operational and economic objectives, and the degrees of freedom available to fulfill them. Other issues, discussed in the paper,
include inventory and production rate control, decentralized versus multivariable control, loss in performance by bottom-up design,
and a definition of a the ‘‘complexity number’’ for the control system.
# 2003 Elsevier Ltd. All rights reserved.
Keywords: Control structure design; Chemical plants; Plantwide control; Process control
1. Introduction
A chemical plant may have thousands of measure-
ments and control loops. In practice, the control system
is usually divided into several layers, separated by time
scale, including (see Fig. 1):
. scheduling (weeks),
. site-wide optimization (days),
. local optimization (hours),
. supervisory (predictive, advanced) control (minutes),
. regulatory control (seconds)
Here, we consider the lower three layers.
The local optimization layer typically recomputes new
setpoints only once an hour or so, whereas the feedback
layers operate continuously. The layers are linked by the
controlled variables , whereby the setpoints are computed
by the upper layer and implemented by the lower layer.
An important issue is the selection of these variables.
Control structure design deals with the structural
decisions that must be made before we start the
�Extended version of this paper ‘‘Plantwide control: towards a
systematic procedure’’ from ESCAPE 12 Symposium, Haag, May
2002.
* Tel.: �/47-7349-4154; fax: �/47-7349-4080.
E-mail address: [email protected] (S. Skogestad).
0098-1354/03/$ - see front matter # 2003 Elsevier Ltd. All rights reserved.
doi:10.1016/j.compchemeng.2003.08.002
controller design, and involves the following tasks
(Foss, 1973); (Skogestad & Postlethwaite, 1996):
1. selection of manipulated variables m (‘‘inputs’’);
2. selection of controlled variables (‘‘outputs’’; vari-
ables with setpoints);
3. selection of (extra) measurements (for control
purposes including stabilization);
4. selection of control configuration (the structure of
the overall controller that interconnects the con-
trolled, manipulated and measured variables);
5. selection of controller type (control law specifica-
tion, e.g. PID, decoupler, LQG, etc.).
Control structure design for complete chemical plants
is also known as plantwide control . In practice, the
problem is usually solved without the use of existing
theoretical tools. In fact, the industrial approach to
plantwide control is still very much along the lines
described by Buckley in 1964 in his chapter on Overall
process control . The realization that the field of control
structure design is underdeveloped is not new. Foss
(1973) made the observation that in many areas
application was ahead of theory, and stated that:
The central issue to be resolved by the new theories
is the determination of the control system struc-
ture. Which variables should be measured which
Page 2
Fig. 1. Typical control hierarchy in a chemical plant.
S. Skogestad / Computers and Chemical Engineering 28 (2004) 219�/234220
inputs should be manipulated and which links
should be made between the two sets? There is
more than a suspicion that the work of a genius is
needed here, for without it the control configura-
tion problem will likely remain in a primitive,
hazily stated and wholly unmanageable form. The
gap is present indeed, but contrary to the views of
many, it is the theoretician who must close it.
A recent review of the literature on plantwide control
can be found in Larsson and Skogestad (2000). In
addition to Page Buckley and Alan Foss, importantcontributors in this area include Morari, Stephanopou-
los, & Arkun (1980) (synthesis of control structures),
William ‘‘Bill’’ Luyben (1993,1994) (‘‘snowball effect’’),
Ruel Shinnar (‘‘dominant variables’’), Jim Douglas and
Alex Zheng (hierarchical approach) and Jim Downs
(Tennessee�/Eastman challenge process).
This paper is organized as follows. First, we present
an expanded version of the plantwide control designprocedure of Larsson and Skogestad (2000). A systema-
tic approach to plantwide control starts by formulating
the operational objectives. This is done by defining a
cost function J that should be minimized with respect to
the Nopt optimization degrees of freedom, subject to a
given set of constraints. In reminder of the paper, we go
through the procedure step by step with special empha-
sis on:
. degree of freedom analysis;
. selection of controlled variables;
. control system complexity;
. inventory control;
. loss in performance by bottom-up design.
2. Procedure for control structure design for chemical
plants
The proposed design procedure is summarized in
Table 1. In this table, we also give the purpose and
typical model requirements for each layer, along with ashort discussion on when to use decentralized (single
loop) control or multivariable control (e.g. MPC) in the
supervisory control layer. The procedure is divided in
two main parts:
I. Top-down analysis, including definition of opera-
tional objectives and consideration of degrees of
freedom available to meet these (tasks 1 and 2
above; steps 1�/4 in Table 1).
II. Bottom-up design of the control system, starting
with the stabilizing control layer (tasks 3, 4 and 5
above; steps 5�/8 in Table 1).
The procedure is generally iterative and may require
several loops through the steps, before converging at a
proposed control structure.
2.1. Model requirements
For the analysis of the control layers (steps 5 and 6),
we need a linear multivariable dynamic model. Since we
are controlling variables at setpoints using feedback, the
steady-state part of the model is not important (exceptfor controller design with pure feedforward control).
For the analysis of the optimization layer (steps 3 and 7),
a nonlinear steady-state model is required. Dynamics
are usually not needed, except for batch processes and
cases with frequent grade changes. For modeling, we
need to distinguish further between the cases of:
1. Control structure design (this paper): ‘‘generic’’
model sufficient.
2. Controller design (tuning of controllers): specific
model needed.
Since a good control structure is generally insensitiveto parameter changes, it follows that a ‘‘generic’’ model
is generally sufficient for our purpose. This is a model
where the structural part is correct, but where all the
parameters may not match the true plant in question. A
first-principle theoretical model, based on material and
energy balances, that covers the whole plant is usually
recommended for this. For the control system design in
case 2 (which is not the concern of this paper) we need a‘‘specific’’ model, for example, based on model identi-
fication. Here, it is usually sufficient with a local model
for the application in question with emphasis on the
Page 3
Table 1
A plantwide control structure design procedure
Step Comments, analysis tools and model requirements
/(I)Top�downanalysis
1. Definition of operational objectives
Identify operational constraints, and preferably identify a scalar cost
function J to be minimized.
2. Manipulated variables and degrees of freedom
Identify dynamic and steady-state degrees of freedom (DOF) May need extra equipment if analysis shows there are too few DOFs.
3. Primary controlled variables
Which (primary) variables c should we control? Steady-state economic analysis:
�/Control active constraints �/Define cost and constraints
�/Remaining DOFs: control variables for which constant setpoints
give small (economic) loss when disturbances occur.
�/Optimization w.r.t. steady-state DOFs for various disturbances
(gives active constraints)
�/Evaluation of loss with constant setpoints
4. Production rate
Where should the production rate be set? (Very important choice as it
determines the structure of remaining inventory control system)
Optimal location follows from steady-state optimization (step 3), but
may move depending on operating conditions
/(II)Bottom�updesign
(With given controlled and manipulated variables) Controllability analysis : compute zeros, poles, pole vectors, gains,
disturbance gains, relative gain array, minimum singular values, etc.
5. Regulatory control layer
5.1. Stabilization
5.2. Local disturbance rejection 5.1. Pole vector analysis (Havre & Skogestad, 1998) for selecting
measured variables and manipulated inputs for stabilizing control
Purpose : ‘‘Stabilize’’ the plant using low-complexity controllers
(single-loop PID controllers) such that 1) the plant does not drift too far
away from its nominal operating point and 2) the supervisor layer (or the
operators) can handle the effect of disturbances on the primary outputs (/
y1�c)
5.2. Partially controlled plant analysis . Control secondary measurements
(y2) so that the sensitivity of states (x ) to disturbances is small at
intermediate frequencies
Main structural issue : What more (y2) should we control? Model : Linear multivariable dynamic model. Steady-state usually not
important
�/Select secondary controlled variables (measurements) y2
�/Pair these with manipulated variables m, avoiding m’s that
saturate (reach constraints)
6. Supervisory control layer
Purpose : Keep (primary) controlled outputs y1�c at optimal
setpoints cs, using as degrees of freedom (inputs) the setpoints y2s for the
regulatory layer and any unused manipulated variables.
6a. Decentralized :
Main structural issue : Decentralized or multivariable control? Preferred for non-interacting process and cases where active constraints
remain constant.
Pairing analysis : Pair on RGA close to identity matrix at crossover
frequency, provided not negative at steady-state. Use CLDG for more
detailed analysis
6a. Decentralized (single-loop) control 6b. Multivariable :
Possibly with addition of feed-forward and ratio control. 1. Use for interacting processes and for easy handling of feedforward
control
�/May use simple PI or PID controllers. 2. Use MPC with constraints handling for moving smoothly between
changing active constraints (avoids logic needed in decentralized scheme
5a)
�/Structural issue: choose input-output pairing
6b. Multivariable control Model : See 5
Usually with explicit handling of constraints (MPC)
�/Structural issue : Size of each multivariable application
7. Optimization layer
Purpose : Identify active constraints and compute optimal setpoints cs
for controlled variables.
Model : Nonlinear steady-state model, plus costs and constraints.
Main structural issue : Do we need real-time optimization (RTO)?
8. Validation Nonlinear dynamic simulation of critical parts
S. Skogestad / Computers and Chemical Engineering 28 (2004) 219�/234 221
Page 4
S. Skogestad / Computers and Chemical Engineering 28 (2004) 219�/234222
time scale corresponding to the desired closed-loop
response time (of each loop), or, if on-line tuning is
used, we may not need any model at all.
2.2. Why not a single big multivariable controller?
Most of the steps in Table 1 could be avoided by
designing a single optimizing controller that stabilizes
the process and at the same time perfectly coordinates
all the manipulated variables based on dynamic on-lineoptimization. There are fundamental reasons why such a
solution is not the best, even with tomorrows computing
power. One fundamental reason is the cost of modeling
and tuning this controller, which must be balanced
against the fact that the hierarchical structuring pro-
posed in this paper, without much need for models, is
used effectively to control most chemical plants.
3. Definition of operational objectives and constraints
(step 1)
The operational objectives must be clearly defined
before attempting to design a control system. Althoughthis seems obvious, this step is frequently overlooked.
Preferably, the operational objectives should be com-
bined into a scalar cost function J to be minimized. In
many cases, J may be simply selected as the operational
cost, but there are many other possibilities. Other
objectives, including safety constraints, should normally
be formulated as constraints.
Fig. 2. Degrees of freedom for integrated distillation process (Example
1).
4. Selection of manipulated variables and degree of
freedom analysis (step 2)
4.1. Degree of freedom analysis
We start with the number of dynamic or control
degrees of freedom , Nm (m here denotes manipulated),
which is equal to the number of manipulated variables.
Nm is usually easily obtained by process insight as the
number of independent variables that can be manipu-
lated by external means from step 1 (typically, thenumber of adjustable valves plus other adjustable
electrical and mechanical variables). Note that the
original manipulated variables are always extensive
variables.
Next, we must identify the Nopt optimization degrees
of freedom , that is, the degrees of freedom that affect the
operational cost J . In most cases, the cost depends on
the steady-state only, and Nopt equals the number ofsteady-state degrees of freedom Nss. To obtain the
number of steady-state degrees of freedom we need to
subtract from Nm :
. N0m : the number of manipulated (input) variables
with no steady-state effect (or more generally, with
no effect on the cost). Typically, these are ‘‘extra’’
manipulated variables used to improve the dynamicresponse, e.g. an extra bypass on a heat exchanger.
. N0y : the number of (output) variables that need to be
controlled, but which have no steady-state effect (or
more generally, no effect on the cost). Typically, these
are liquid levels in holdup tanks.
and we have
Nss�Nm�(N0m�N0y)
Example 1 . The integrated distillation process in Fig.
2 has Nm�11 manipulated variables (including the
feedrate), and N0y�4 liquid levels with no steady-
state effect, so there are Nss�11�4�7 degrees of
freedom at steady-state.
Example 2 . Heat is transferred from the hot process
side to cooling water in a heat exchanger. The flow of
cooling water can be manipulated, and there arebypasses on both the cold and the hot side, so there
are three manipulated valves and thus Nm�3 dy-
namic (control) degrees of freedom (see Fig. 3).
However, at least when seen from the process (hot)
side, there is only 1 steady-state degree of freedom,
which is the amount of heat transferred from the hot
to the cold side, so Nss�1: Thus, there are N0m�2 of
the three manipulated variables have no steady-stateeffect (note that we cannot associate this with two
particular valves, as each valve individually has a
steady-state effect). However, dynamically there are
three degrees of freedom, and the bypass flows may
be used to improve the dynamic response.
The optimization is generally subject to constraints,
and at the optimum many of these are usually ‘‘active’’.
The number of ‘‘free’’ (unconstrained) degrees of free-
dom that are left to optimize the operation is then
Page 5
Fig. 3. Degrees of freedom for heat exchanger with bypasses (Example
2).
S. Skogestad / Computers and Chemical Engineering 28 (2004) 219�/234 223
Nopt�Nactive: This is an important number, since it is
generally for the unconstrained degrees of freedom that
the selection of controlled variables (task 1 and step 3) is
a critical issue.
4.2. Need for extra equipment (design change)
In most cases, the manipulated variables are given by
the design, and a degree of freedom analysis should be
used to check that there are enough DOFs to meet the
operational objectives, both at steady-state (step 2) and
dynamically (step 5). If the DOF analysis and/or the
subsequent design shows that there are not enough
degrees of freedom (either for the entire process orlocally for dynamic purposes), then degrees of freedom
may be added by adding equipment. This may, for
example, involve adding a bypass on a heat exchanger,
or adding an extra heat exchanger or a surge tank.
Note that it is not only the number of variables that is
important, but also their range. If a manipulated
variable saturates, then it is effectively lost as a degree
of freedom. For example, for the heat exchanger in Fig.3, one may need the bypasses on both sides because each
bypass by itself is too small to reduce the heat transfer
by the desired amount.
5. What should we control? (steps 3 and 5)
A question that puzzled me for many years was:
‘‘Why do we control all these variables in a chemicalplant, like internal temperatures, pressures or composi-
tions, when there are no a priori specifications on many
of them?’’. The answer to this question is that we first
need to control the variables directly related to ensuring
optimal economic operation (these are the primary
controlled variables y1�c in step 3):
. Control active constraints (Maarleveld & Rijnsdrop,
1970; Skogestad, 2000).
. Select unconstrained controlled variables so that withconstant setpoints the process is kept close to its
optimum in spite of disturbances and implementation
errors (Skogestad, 2000). These are the less intuitive
ones, for which the idea of self-optimizing control
(see below) is very useful.
In addition, we need to control variables in order to
achieve satisfactory regulatory control (these are the
secondary controlled variables y2 in step 5):
. With the regulatory control system in place, the plant
should not drift too much away from its desiredsteady-state operation point. This will reduce the
effect of nonlinearity, and enable the above super-
visory control layer (or the operators) to control the
plant at a slower time scale. Preferably, this ‘‘basic’’
control layer should be able to work for a wide range
of primary control objectives.
In particular, we should
. Control unstable/integrating liquid levels. This con-
sumes steady-state degrees of freedom since liquid
levels have no steady-state effect (but this has alreadybeen taken into account in the degree of freedom
analysis).
. Stabilize other unstable modes, for example, for an
exothermic reactor (these are also usually quite
obvious). This involves controlling extra local mea-
surements, but does not consume any degrees of
freedom, since the setpoints for the controlled vari-
ables replace the manipulated inputs (valve positions)as degrees of freedom.
. Control variables which would otherwise ‘‘drift
away’’ due to large disturbance sensitivity (these are
sometimes less obvious). This involves controlling
extra local measurements, e.g. a tray temperature in a
distillation column, and also does not consume any
degrees of freedom.
5.1. Self-optimizing control (step 3)
The basic idea of self-optimizing control was for-
mulated about 20 years ago by Morari et al. (1980) who
write that ‘‘we want to find a function c of the process
variables which when held constant, leads automatically
to the optimal adjustments of the manipulated vari-
ables.’’ To quantify this more precisely, we define the
(economic) loss L as the difference between the actualvalue of the cost function and the truly optimal value,
i.e. L�J(u; d)�Jopt(d) where u�f (c; d):/
Self-optimizing control (Skogestad, 2000) is
achieved if a constant setpoint policy results in
an acceptable loss L (without the need to reopti-
mize when disturbances occur).
The main issue here is not to find the optimal
setpoints, but rather to find the right variables to keep
constant. The idea of self-optimizing control is illu-
Page 6
Fig. 4. Loss L�J�Joptd imposed by constant setpoint policy. There is a loss if we keep a constant setpoint rather than reoptimizing when a
disturbance occurs. For the case in the figure it is better (with a smaller loss) to keep the setpoint c1s constant than to keep c2s constant.
S. Skogestad / Computers and Chemical Engineering 28 (2004) 219�/234224
strated in Fig. 4. We see that a loss results when we keep
a constant setpoint rather than reoptimizing when a
disturbance occurs.
An additional concern with the constant setpoint
strategy is that there is always a difference between the
setpoint cs and the actual value c due to implementation
errors caused by measurement errors and imperfect
control. To minimize the effect of the implementation
errors, the cost surface as a function of c should be as
flat as possible, see Fig. 5.
An example of a sharp optimum (Fig. 5c) is for high-
purity distillation where the controlled variable c is the
temperature in the end of the column. In this case, even
a small change in temperature at the end of the column
will imply a large relative change in composition, and
thus a large change in cost J for the process.
5.2. Procedure for selecting controlled variables (Step 3)
To select the controlled variables for self-optimizing
control, one may use the stepwise procedure of Skoges-
tad (2000):
Fig. 5. Implementing the controlled variable:
Step 3.1 . Definition of optimal operation (cost and
constraints).Step 3.2 . Determine degrees of freedom for optimiza-
tion.
Step 3.3 . Identification of important disturbances.
Step 3.4 . Optimization (nominally and with distur-
bances).Step 3.5 . Identification of candidate controlled vari-
ables.
Step 3.6 . Evaluation of loss for alternative combina-
tions of controlled variables (loss imposed by keeping
constant setpoints when there are disturbances or
implementation errors).
Step 3.7 . Evaluation and selection (including con-
trollability analysis).
Note that except for step 3.7, this procedure normally
requires steady-state information only. The procedure
has been applied to several applications, including
distillation column control (Skogestad, 2000), the
Tennessee�/Eastman process (Larsson, Hestetun, Hov-
land, & Skogestad, 2001) and the reactor-recycle process
(Larsson, Govatsmark, Skogestad, & Yu, 2003).
effect of implementation error on cost.
Page 7
S. Skogestad / Computers and Chemical Engineering 28 (2004) 219�/234 225
To identify good candidate controlled variables, c ,
one should look for variables that satisfy all of the
following requirements (Skogestad, 2000):
1. The optimal value of c should be insensitive to
disturbances
2. c should be easy to measure and control (so that the
implementation error is acceptable).
3. The value of c should be sensitive to changes in the
manipulated variables (the steady-state degrees of
freedom). Equivalently, the optimum (J as a func-
tion of c ) should be flat.
4. For cases with more than one unconstrained degrees
of freedom, the selected controlled variables should
be independent.
At least ‘‘locally’’ (for small disturbances), theserequirements may be combined into a single rule (which
generalizes requirement 3): Look for variables that
maximize the minimum singular value of the appropriately
scaled steady-state gain matrix G from u to c (Skogestad
& Postlethwaite, 1996) (Skogestad, 2000). Here, u
denotes the steady-state degrees of freedom.
If a linearized model is available, then the minimum
singular value rule may very useful for eliminating poorcandidate variables, but it is a local analysis, and for a
final selection one should use the above procedure with
evaluation of the loss for larger disturbances.
It is stressed that the issue of selecting appropriate
controlled variables c for the unconstrained degrees of
freedom is equally important when we use multivariable
constrained control in the supervisory control layer. The
setpoints for the selected controlled variables as well asthe active constraints, which may vary with time, are
then computed by the steady-state optimization layer
and supplied to MPC for implementation.
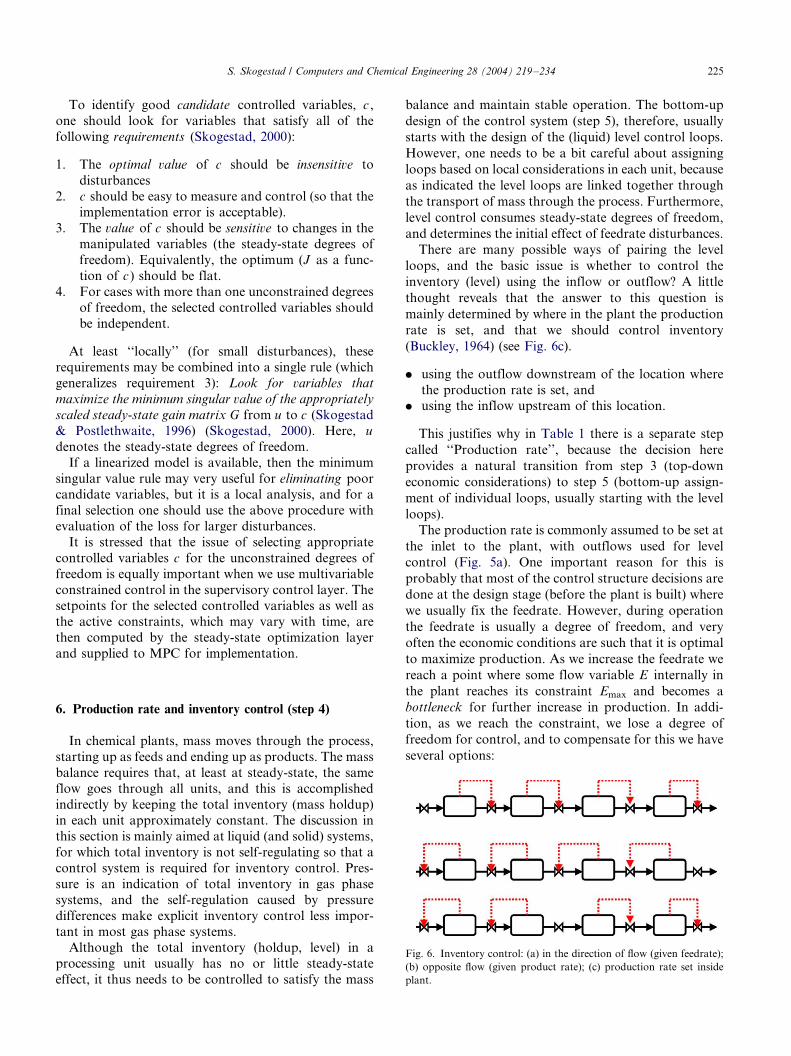
Fig. 6. Inventory control: (a) in the direction of flow (given feedrate);
(b) opposite flow (given product rate); (c) production rate set inside
plant.
6. Production rate and inventory control (step 4)
In chemical plants, mass moves through the process,
starting up as feeds and ending up as products. The mass
balance requires that, at least at steady-state, the same
flow goes through all units, and this is accomplished
indirectly by keeping the total inventory (mass holdup)in each unit approximately constant. The discussion in
this section is mainly aimed at liquid (and solid) systems,
for which total inventory is not self-regulating so that a
control system is required for inventory control. Pres-
sure is an indication of total inventory in gas phase
systems, and the self-regulation caused by pressure
differences make explicit inventory control less impor-
tant in most gas phase systems.Although the total inventory (holdup, level) in a
processing unit usually has no or little steady-state
effect, it thus needs to be controlled to satisfy the mass
balance and maintain stable operation. The bottom-up
design of the control system (step 5), therefore, usually
starts with the design of the (liquid) level control loops.
However, one needs to be a bit careful about assigning
loops based on local considerations in each unit, because
as indicated the level loops are linked together through
the transport of mass through the process. Furthermore,
level control consumes steady-state degrees of freedom,
and determines the initial effect of feedrate disturbances.
There are many possible ways of pairing the level
loops, and the basic issue is whether to control the
inventory (level) using the inflow or outflow? A little
thought reveals that the answer to this question is
mainly determined by where in the plant the production
rate is set, and that we should control inventory
(Buckley, 1964) (see Fig. 6c).
. using the outflow downstream of the location where
the production rate is set, and. using the inflow upstream of this location.
This justifies why in Table 1 there is a separate step
called ‘‘Production rate’’, because the decision here
provides a natural transition from step 3 (top-down
economic considerations) to step 5 (bottom-up assign-
ment of individual loops, usually starting with the level
loops).
The production rate is commonly assumed to be set at
the inlet to the plant, with outflows used for level
control (Fig. 5a). One important reason for this is
probably that most of the control structure decisions are
done at the design stage (before the plant is built) where
we usually fix the feedrate. However, during operation
the feedrate is usually a degree of freedom, and very
often the economic conditions are such that it is optimal
to maximize production. As we increase the feedrate we
reach a point where some flow variable E internally in
the plant reaches its constraint Emax and becomes a
bottleneck for further increase in production. In addi-
tion, as we reach the constraint, we lose a degree of
freedom for control, and to compensate for this we have
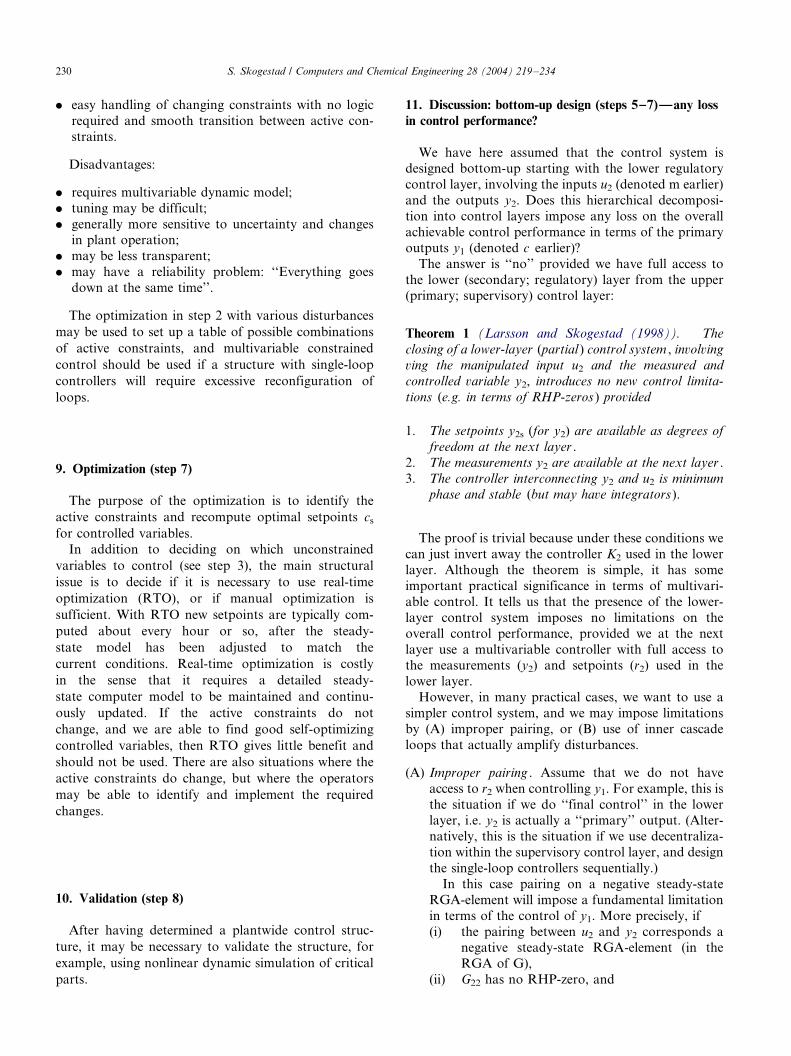
several options:
Page 8
S. Skogestad / Computers and Chemical Engineering 28 (2004) 219�/234226
(1) Reduce the feedrate and ‘‘back off’’ from the
constraint on E (gives economic loss).
(2) Use the feedrate as a manipulated variable to take
over the lost control task (but this usually gives a
very ‘‘slow’’ loop dynamically because of longphysical distance).
To avoid this slow loop one may either:
(3) Install a surge tank upstream of the bottleneck, and
reassign its outflow to take over the lost control
task, and use the feedrate to reset the level of the
surge tank, or
(4) Reassign all level control loops upstream of the
bottleneck from outflow to inflow (which may
involve many loops).
All of these options are undesirable. A better solution
is probably to permanently reassign the level loops (as
indicated in option 4). We then have the following rule:
Identify the main bottleneck in the plant by
optimizing the operation with the feedrate as a
degree of freedom (steady-state, see step 3). Set the
production rate at this location.
The justification for this rule is that the economic
benefits of increasing the production are usually very
large (when the market conditions are such), so that it is
important to maximize flow at the bottleneck. On the
other hand, if market conditions are such that we are
operating with a given feedrate or given product rate,
then the economic loss imposed by using a outer cascade
loop to adjust the production rate at the bottleneck
(somewhere inside the plant, see Fig. 11 for an example)
is usually zero, as deviations from the desired feed or
production rate can be averaged out over time, provided
we have storage tanks for feeds or products. However,
one should be careful when applying this rule, as also
other considerations may be important, such as the
control of the individual units (e.g. distillation column)
which may be affected by whether inflow or outflow is
used for level control.
We have here assumed that the bottleneck is always in
the same unit. If it moves to another unit, then
reassignment of level loops is probably unavoidable if
we want to maintain optimal operation.
Note that here we have only considered changes in
operating conditions that may lead to bottlenecks and
thus to the need to reassign inventory (level) loops. Of
course, other active constraints may move and the best
unconstrained controlled variable (with the best self-
optimizing properties) may change, but the reconfigura-
tion of these loops is usually easier to handle locally.
6.1. MPC in regulatory control layer
The above discussion assumes that we use single-loop
controllers in the regulatory control layer (whichincludes level control), and that we want to minimize
the logic needed for reassigning loops. An alternative
approach, which overcomes most of the above pro-
blems, is to use a multivariable model-based controller
with constraints handling (MPC), which automatically
tracks the moving constraints and reassigns control
tasks in an optimal manner. This is many ways a more
straightforward approach, but such controllers are morecomplex, and their sensitivity to errors and failures is
quite unpredictable, so such controllers are usually
avoided at the bottom of the control hierarchy.
Another alternative, which is more failure tolerant, is
to implement a MPC system on top of a fixed single-
loop regulatory control layer (which includes level
control). As shown in Theorem 1, this gives no
performance loss provided we let the multivariablecontroller have access also to the setpoints of the
lower-layer regulatory controllers (including the ability
to dynamically manipulate the level setpoints). The
regulatory layer then provides a back-up if the MPC
controller fails, but under normal conditions does not
affect control performance.
6.2. Several external feeds
If the process has more than one external feed, then
the largest feedstream or the sum of the feedstrams is
normally used for total inventory control, whereas the
other feedstreams are used for inventory control of
individual components.
6.3. Purge streams
Purge streams may be required to avoid accumulation
of intermediate trace components that have no ‘‘nat-
ural’’ way out of the process and are not removed by
reactions.
7. Regulatory layer (step 5)
In this paper, we use the terms ‘‘lower layer’’, ‘‘inner
loops’’ and ‘‘secondary loops’’ as synonyms for the
regulatory control layer. The ‘‘primary’’ control system
is the same as the supervisory control system.
The regulatory control layer should usually be of ‘‘low
complexity ’’. Usually, it consists of single-input�/single-
output (SISO) PI control loops. The main objective is to
‘‘stabilize ’’ the plant. We have here put stabilize inquotes because we use the word in an extended meaning,
and include both modes which are mathematically
unstable as well as slow modes (‘‘drift’’) that need to
Page 9
S. Skogestad / Computers and Chemical Engineering 28 (2004) 219�/234 227
be ‘‘stabilized’’ from an operator point of view. The
controlled variables for stabilization are measured out-
put variables y2, and their setpoints y2s may be used as
degrees of freedom by the layers above.
More generally, the objective of the regulatory control
layer is to locally control secondary measurements (y2),
so that the effect of disturbances on the primary outputs
(/y1�c) can be handled by the layer above (or the
operators). In the regulatory control layer, we generally
avoid using manipulated variables that may saturate,
because otherwise control is lost and reconfiguration of
loops is required.
The main structural issue in the regulatory layer is to
determine which extra (secondary) variables y2 to control
in order to stabilize the process and achieve local
disturbance rejection (see Fig. 7). A good secondary
controlled variable (measurement) usually has the
following properties:
. The variable is easy to measure.
. The variable is easy to control using one of the
available manipulated variables (the manipulated
variable should have a ‘‘direct’’, fast and strong effecton it).
. For stabilization: the unstable mode should be
detected ‘‘quickly’’ by the measurement (compute,
for example, the pole vectors for a more detailed
analysis).
. For local disturbance rejection: the variable is located
‘‘close’’ downstream of an important disturbance
(use, for example, a partial control analysis for amore detailed analysis).
We have here distinguished between stabilization and
local disturbance rejection, but in practice the may be
combined into the requirement of avoiding that the
states x (or more generally, the weighted states Wx) drift
too far away from their desired (nominal) value. The
advantages of considering a measure of all the states in
the system is that the regulatory control system is then
not tied to closely to a particular primary control
Fig. 7. Selection of secondary controlled variables y2.
objective which may change with time. Also, keeping
all the states bounded is important to avoid that
nonlinear effects give a problem. The sensitivity of the
system state to disturbances with the regulatory controlloops closed may be analyzed using partial control, as
discussed later.
The ‘‘unstable’’ modes are very often related to
inventory in each unit. This includes both the overall
inventory (total mass) as well as the inventory of
individual components.
. For liquid phase systems, overall inventory in each
unit is stabilized by controlling liquid level.
. For gas phase systems, overall inventory (pressure) is
controlled in selected units, but in many units it is leftuncontrolled (floating), for example, to minimize
pressure drop.
. For both gas and liquid phase systems, the inventory
of individual components may need to be stabilized.
Usually, this involves controlling a composition, or a
derived property such as temperature. For example,
in a distillation column, a temperature controller is
often used to stabilize its otherwise drifting composi-tion profile. Note that we do not need to control the
inventory of all components, as there may be only
one unstable mode associated with the ‘‘drift’’ of
many components. Also, control of a single measure-
ment may stabilize several unstable modes.
As already discussed, the design of the regulatory
layer (or more precisely, the assignment of control loops
in the regulatory control layer) usually starts by
determining where to set the production rate (step 4),and then assigning the stabilizing liquid level loops. For
the other unstable modes, a pole vector analysis (Havre
& Skogestad, 1998) may be useful. It requires a
linearized model, and to minimize the required input
usage, the rule is to select for stabilizing control
measured variables and manipulated inputs correspond-
ing to large elements in the pole vectors.
Except for cases where we do final control in theregulatory control layer, no degrees of freedom are lost
as the setpoints y2s for the locally controlled variables
remain degrees of freedom for the layer above. This
assumes that also the setpoints for the liquid levels
remain as degrees of freedom.
7.1. Partial control and selection of secondary controlled
variables
To analyze the selection of secondary controlled
variables y2 in more detail, the concept of partial control
is very useful (Fig. 8). The objective is to minimize themagnitude of the partial control gain, Pd1 (see below),
which gives the effect of the disturbances on the
weighted states y1�Wx with the secondary (regulatory)
Page 10
Fig. 8. Partial control of the secondary variables y2.
S. Skogestad / Computers and Chemical Engineering 28 (2004) 219�/234228
loops closed. The results in this section are based on
Skogestad and Postlethwaite (1996), and Havre and
Skogestad (1996), but they considered the effect on the
primary outputs (/y1�c); whereas we here have a more
general view, where y1�Wx denotes the weightedstates. In the case where we are concerned with keeping
the plant close to its steady-state, the weight matrix W is
a diagonal matrix consisting of the inverse of the
allowed variation in its state along the diagonal.
However, in general, W can be a full non-square matrix.
Let the overall process model be y�Gu�Gdd: We
partition the manipulated inputs u and the measured
outputs y into two sets,
y� [y1 y2]; u� [u1 u2]
where y1�Wx denotes the weighted states, y2 the
(secondary) measurements, u the inputs (m), u2 the
inputs used in the secondary layer, and u1 denotes the
unused inputs (this is not very important). The plant
model G is partitioned correspondingly,
y1�G11u1�G12u2�Gd1d
y2�G21u1�G22u2�Gd2d
By closing the lower-layer (inner) loops involving u2
and y2,
u2�K2(y2s�y2�n2)
we obtain, as seen from the (supervisory) layer above, a
partially controlled system with y2s (the setpoints for the
locally controlled variables y2) and u1 (the unused input)as degrees of freedom. The transfer function for the
partially controlled system is
y1�P1u1�Pr1(y2s�n2)�Pd1d
where
P1�G11�G12K2(I�G22K2)�1G21
Pd1�Gd1�G12K2(I�G22K2)�1Gd2
Pr1�G12K2(I�G22K2)�1
The lower layer is assumed to be much faster than the
upper layer, so for a preliminary analysis when selecting
secondary controlled variables y2 we may assume that y2
is perfectly controlled (let K2 0 �; or equivalently set
y2�y2s�n2) and we get
P1�G11�G12G�122 G21
Pd1�Gd1�G12G�122 Gd2
Pr1�G12G�122
We should then (note that y1�Wx here denotes the
weighted states):
. Select to control secondary variables y2 such that the
norm of Pd1�Gd1�G12G�122 Gd2 is sufficiently small
(especially at intermediate and high frequencies
beyond the bandwidth of the primary control system,
but also the steady-state should be considered). If this
is satisfied then we say that the plant is ‘‘stabilized’’
(in the extended sense defined earlier).
It is recommended to plot the magnitude of theelements in Pd1 as a function of frequency, and if the
variables y1 (�/Wx) and d are appropriately scaled then
‘‘small’’ means less than 1 (Skogestad & Postlethwaite,
1996).
If we have found a lower-layer control structures
which ‘‘stabilizes’’ the plant, then we should as the next
step check that it is consistent with the selected set of
controlled variables. This may be done by recalculatingthe partial gains, but now with y1�c: We then have:
. If we want to use the reference r2 as a degree offreedom to control the primary outputs y1�c; then
Pr1�G12G�122 should be (sufficiently) large (also at
steady-state).
. If r2 is not a degree of freedom in the primary control
layer, then it may be viewed as a disturbance and
Pr1�G12G�122 should be small so that it can be
handled by the supervisory control system.
. If we want to use the unused inputs u1 as a degree offreedom to control the primary outputs y1, then P1�G11�G12G�1
22 G21 should be (sufficiently) large (also
at steady-state).
The use of partial gains with K2 0 � is useful for
finding which variables to control in regulatory control
layer. However, for a more detailed analysis it may be
useful to design a controller K2. In the simplest case, K2
may be assumed static. Also, it is often desirable to find
a simple (low complexity) way of implementing thecontroller K2. For this it is useful to define some
measure of complexity as discussed next.
7.2. System control complexity
It is generally desirable that the complexity of the
control system, and in particular of the regulatory
control layer should be as small as possible (e.g. Nett,1989). To quantify this it may be useful to introduce a
structural complexity number Ps. This may be defined in
many ways, and one possibility is the following:
Page 11
S. Skogestad / Computers and Chemical Engineering 28 (2004) 219�/234 229
Ps�#measurements�#manipulators�#blocks
�#control-elements
Here, the number of measurements and manipulators
refer to the ones used by the controller. The number of
blocks is the number of blocks in a block diagram
representation plus the number of numerical parameters
required to define the interconnections of the block
diagram (these are sometimes represented as separate
blocks and should then not be counted twice). For
example, for a full multivariable controller #blocks�1;
whereas for single-loop decertralized control with n
manipulators (inputs) and n outputs (measurements)
#blocks�n: A block that computes a ratio, e.g. u�L=D; has #blocks�1 (one division block). The compu-
tation u�c1L�c2D has #blocks�3 (one summation
block and two parameters). The number of controller
elements is the number of tunable controller
elements. For example, with n manipulators
(inputs) and n outputs (measurements), a full
multivariable controller has #control-elements�n2;
whereas a we with n single-loop controllers (decentra-
lized control) have #control-elements�n: The contr
ol-elements factor is partly related to the
required complexity of the model and sensitivity to
uncertainty.
This gives the complexity of the structure itself. To
get the overall complexity P of the control system,
we may add the complexity Pc of the controller, and
we have P�Pc�Ps: Here, Pc may be defined
as the number of tuning parameters for the
controller (which may not be too many if a
systematic procedure is used) or as the number of
parameters in the controller (which is generally a larger
number).
Having defined the complexity P of the control
system, we can then proceed to find the ‘‘optimal’’
controller (a simple realization of K2) for a given
complexity. Unfortunately, the required calculations to
find the optimal controller with a given complexity are
non-convex and very difficult numerically. To simplify
the calculations and reduce the complexity of the
controller itself, it is therefore reasonable to use a static
controller (constant gains) when considering the reg-
ulator control layer. We may start with a low complexity
number P and increase it until we get acceptable
‘‘stabilization’’ (which is the objective of the regulatory
control layer). Obviously, if the complexity number is
sufficiently large, we may eventually get a full multi-
variable controller, which includes both the regulatory
and supervisory control layers. A complexity
number may also be defined for the supervisory control
layer.
8. Supervisory control (step 6)
The purpose of the supervisor control layer is to keep
the (primary) controlled outputs c at their optimal
setpoints cs, using as degrees of freedom the setpoints
y2s in the regulatory layer and any unused manipulated
inputs. Which variables to control and their setpoints
are determined by the optimization layer above. Note
that the variables to control may change if the active
constraints change.
For the supervisory control layer, the first structural
issue is deciding on whether to use decentralized or
multivariable control. Note that there is usually some
decentralization, that is, there is often a combination of
several multivariable and single-loop controllers.
Decentralized single-loop control is the simplest. It is
preferred for non-interacting process and cases where
active constraints remain constant. Advantages with
decentralized control:
. tuning may be done on-line;
. no or minimal model requirements;
. easy to fix and change.
Disadvantages:
. need to determine pairing;
. performance loss compared to multivariable control;
. complicated logic required for reconfiguration when
active constraints move.
The decision on how to pair inputs (y2s, u1) and
outputs (c ), and this is often done based on process
insight. In more difficult cases a RGA-analysis may be
useful, and the rule is pair such that the resulting
transfer matrix is close to identity matrix at the cross-
over expected frequency, provided the element is not
negative at steady-state. For a more detailed analysis
one should also consider disturbances, and compute the
closed-loop disturbance gain (CLDG) (Skogestad &
Postlethwaite, 1996). One disadvantage with decentra-
lized control is that it may require reconfiguration of
loops (with complicated logic) if the active constraints
change.
Multivariable control is preferred for
interacting processes and for processes with changes
in active constraint. For the cases where the
constraints may change, one needs a multivariable
controller with explicit constraint handling
(e.g. MPC). This avoids the need for logic, and
gives a smooth transition between active
constraints. Advantages with multivariable constrained
control:
. coordinated control for interactive processes;
. easy handling of feedforward control;
Page 12
S. Skogestad / Computers and Chemical Engineering 28 (2004) 219�/234230
. easy handling of changing constraints with no logic
required and smooth transition between active con-
straints.
Disadvantages:
. requires multivariable dynamic model;
. tuning may be difficult;
. generally more sensitive to uncertainty and changesin plant operation;
. may be less transparent;
. may have a reliability problem: ‘‘Everything goes
down at the same time’’.
The optimization in step 2 with various disturbances
may be used to set up a table of possible combinations
of active constraints, and multivariable constrained
control should be used if a structure with single-loop
controllers will require excessive reconfiguration of
loops.
9. Optimization (step 7)
The purpose of the optimization is to identify the
active constraints and recompute optimal setpoints cs
for controlled variables.
In addition to deciding on which unconstrained
variables to control (see step 3), the main structural
issue is to decide if it is necessary to use real-time
optimization (RTO), or if manual optimization is
sufficient. With RTO new setpoints are typically com-
puted about every hour or so, after the steady-
state model has been adjusted to match the
current conditions. Real-time optimization is costly
in the sense that it requires a detailed steady-
state computer model to be maintained and continu-
ously updated. If the active constraints do not
change, and we are able to find good self-optimizing
controlled variables, then RTO gives little benefit and
should not be used. There are also situations where the
active constraints do change, but where the operators
may be able to identify and implement the required
changes.
10. Validation (step 8)
After having determined a plantwide control struc-
ture, it may be necessary to validate the structure, for
example, using nonlinear dynamic simulation of critical
parts.
11. Discussion: bottom-up design (steps 5�/7)*/any loss
in control performance?
We have here assumed that the control system isdesigned bottom-up starting with the lower regulatory
control layer, involving the inputs u2 (denoted m earlier)
and the outputs y2. Does this hierarchical decomposi-
tion into control layers impose any loss on the overall
achievable control performance in terms of the primary
outputs y1 (denoted c earlier)?
The answer is ‘‘no’’ provided we have full access to
the lower (secondary; regulatory) layer from the upper(primary; supervisory) control layer:
Theorem 1 (Larsson and Skogestad (1998)). The
closing of a lower-layer (partial ) control system , involving
ving the manipulated input u2 and the measured and
controlled variable y2, introduces no new control limita-
tions (e.g. in terms of RHP-zeros ) provided
1. The setpoints y2s (for y2) are available as degrees of
freedom at the next layer .
2. The measurements y2 are available at the next layer .
3. The controller interconnecting y2 and u2 is minimum
phase and stable (but may have integrators ).
The proof is trivial because under these conditions we
can just invert away the controller K2 used in the lower
layer. Although the theorem is simple, it has some
important practical significance in terms of multivari-
able control. It tells us that the presence of the lower-
layer control system imposes no limitations on the
overall control performance, provided we at the next
layer use a multivariable controller with full access tothe measurements (y2) and setpoints (r2) used in the
lower layer.
However, in many practical cases, we want to use a
simpler control system, and we may impose limitations
by (A) improper pairing, or (B) use of inner cascade
loops that actually amplify disturbances.
(A) Improper pairing . Assume that we do not have
access to r2 when controlling y1. For example, this is
the situation if we do ‘‘final control’’ in the lowerlayer, i.e. y2 is actually a ‘‘primary’’ output. (Alter-
natively, this is the situation if we use decentraliza-
tion within the supervisory control layer, and design
the single-loop controllers sequentially.)
In this case pairing on a negative steady-state
RGA-element will impose a fundamental limitation
in terms of the control of y1. More precisely, if
(i) the pairing between u2 and y2 corresponds a
negative steady-state RGA-element (in the
RGA of G),
(ii) G22 has no RHP-zero, and
Page 13
S. Skogestad / Computers and Chemical Engineering 28 (2004) 219�/234 231
(iii) we use integral control in K2,
then closing the inner loop involving u2 and y2 will
introduce a RHP-zero in the resulting transfer function
P11 from u1 to y1 (Shinskey, 1979; Bristol, 1966;
Grosdidier and Morari, 1985; Jacobsen, 1999). The
effect of the RHP-zero is less severe (moved to higherfrequencies) as we tighten the control in the inner loop
(Jacobsen, 1999; Larsson, 2000 (thesis).
Note : There are also other reasons for avoiding
pairing on negative steady-state RGA-elements, includ-
ing ensuring failure tolerance and allowing for indepen-
dent tuning (DIC).
(B) Improper cascade control . Assume that the outputs
y2 are ‘‘secondary’’ outputs (extra measurements)which we choose to control in order to stabilize the
plant or improve local disturbance rejection. This is
a standard cascade control system. In this case, the
set u1 is empty, and the layer above uses the
setpoints r2 in order to control the ‘‘primary’’
outputs y1.
In this case, the main purpose of the lower-layer
control system is to improve the control of y1, but if
improperly designed, it may make the situation worse.For example, if we had a case where originally the
disturbance had no effect on the output (/Gd1�0); then
the closing of a lower-layer loop may introduce sensi-
tivity to the disturbance (with Pd1�Gd1�G12K2(I�G22K2)�1Gd2 non-zero).
12. Discussion: life cycle approach
As noted above, the process and control system
design is usually based on considering a few base case
designs with given feedrates, whereas in practice the
plant is often operated with feedrate as a degree of
freedom. Thus, one fails to consider the entire plant life
cycle when designing the plant. Also, during design with
a given feedrate F , optimizing the profit P is equivalent
to maximizing P /F (since F is given). On the other hand,during operation with the feedrate as a free variable, we
will increase the feedrate until dP=dF �0; so we get
(P=F )operationB(P=F )design: Thus, unless we take a life
cycle approach, we will use the raw materials and energy
less effectively than we designed for.
13. Application: reactor-recycle process
Here we will apply the above procedure, withemphasis on the selection of controlled variables, to
the reactor-recycle process in Fig. 9. For more details
about this process, including a discussion of the so-
called snowballed effect, the reader is referred to
Larsson et al. (2003).
13.1. Control structure design with given feedrate
The degrees of freedom analysis (step 2) was per-
formed earlier (Example 4).
Step 3.1 . The operational cost function J to be
minimized, or equivalently the profit function P to be
maximized, is
P��J�pBB�pF0F0�pV V�pDD
where pB (US$/kg) is the product price, pF0(US$/kg) the
feedstock price, pV (US$/kg) is the energy cost (sum of
price for reboiling and condensing) and pD is the recycle
cost (sum of cost for pumping and preprocessing the
recycle stream). With a given feedrate and negligible
recycling costs, the economic objective is then to
minimize energy usage (i.e. minimize boilup V ).
Step 3.2 . From Example 4 there are, with fixed
pressure, four degrees of freedom at steady-state,including the external feedrate F0. With a fixed feedrate
F0, there are three steady-state degrees of freedom.
Step 3.3 The most important disturbance is the
feedrate FO .
Step 3.4 (active constraints). Optimization with
respect to the three degrees of freedom, give that Mr
should be kept at its maximum (to maximize conver-
sion), and that the product composition xB be kept at itsspecification (overpurifying costs energy). These two
variables should then be controlled (active constraint
control). This makes the Luyben structure and the two
balanced structures of Wu and Yu (1996) economically
unattractive, at least from a steady-state point of view.
Step 3.5 (unconstrained DOFs). There is one uncon-
strained degree of freedom left, and the issue is to decide
which variable we should select to keep constant.Alternatives are, for example, the amount of recycle D
or F (‘‘Luyben rule’’), composition xD (conventional
structure), reflux L , reflux ratios L /D or L /F , etc.
Step 3.6 (evaluation of loss). Larsson et al. (2003)
evaluated the energy loss imposed by keeping these
constant when there are disturbances in F0 and found
that xD and L /F were good choices for the uncon-
strained controlled variable, whereas F , D or L werepoor choices. This is illustrated in Fig. 10 for L /F and F .
In fact. keeping D or F constant (Luyben rule) yields
infeasible operation for relatively small feedrate distur-
bances and confirms the results of Wu and Yu (1996).
This is easily explained: as the feedrate F0 is increased,
we must with constant F �F0�D reduce the recycle D
to the reactor. Therefore, light component A will
accumulate in the distillation column and operationbecomes infeasible. In terms of the loss, control of top
composition xD is slightly better than control of the
reflux ratio L /F . However, the ‘‘two-point’’ distillation
Page 14
Fig. 9. Reactor with recycle process with control of recycle ratio (L /F ), Mr (maximum reactor holdup), and xB (given product composition).
Fig. 10. Selection of controlled variable for the reactor-recycle
process. The loss imposed by controlling c1�L=F is much smaller
than when controlling c2�F :/
S. Skogestad / Computers and Chemical Engineering 28 (2004) 219�/234232
column control problem, involving control of both of
bottom (xB , active constraint) and top (xD) composi-
tions, is known to be difficult due to strong two-way
interactions. In conclusion, it is therefore recommended
to control L /F .
Step 4 . The feedrate is here assumed to be set at the
inlet (see more about this below).
Step 5 (regulatory loops). One possible choice for the
regulatory control loops are shown in Fig. 9. Note that
with a given feedrate, the outflows are used to control
level in the reactor and in the distillation column.
Step 6 (supervisory control layer). The proposed
decentralized structure of the supervisory control layer
is also shown in Fig. 9.
13.2. Variable feedrate and bottleneck
In practice, the feedrate may be a degree of freedom,
and the production rate should be set at the bottleneck.
Step 4 (where to set production rate). For this plantthe reactor holdup is a steady-state (design) bottleneck,
whereas the column capacity (Vmax) is the dynamic
(control) bottleneck. Thus, if it is likely that the plant
will be operated under conditions where we want to
maximize production, then we should probably use a
control structure where the production rate is set at the
column bottleneck (V ), and inventory control should
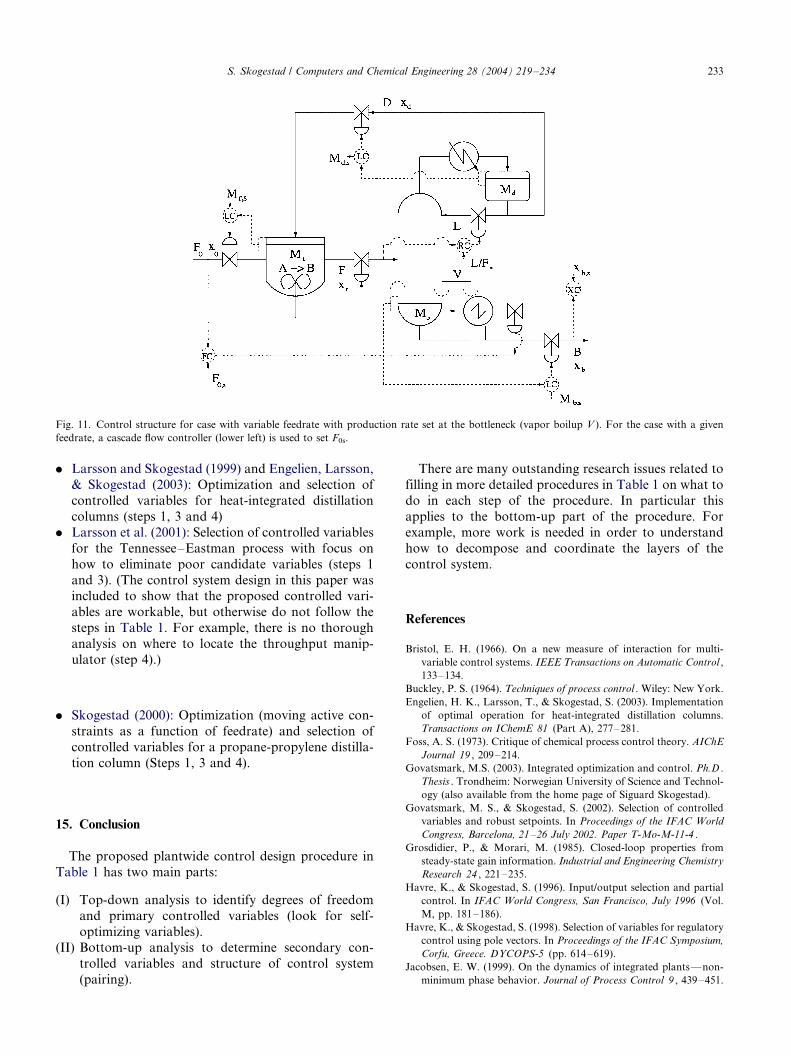
use inflow upstream of this location.Step 5 (regulatory loops). A possible control structure
is to use the feedrate F0 to control the reactor level, the
column feed F to control bottom composition, and the
boilup V to set the production rate. For the case with a
given feedrate F0 one could adjust F0 to its given value
with a cascade flow controller with V as the degree of
freedom, see Fig. 11.
14. Additional case studies
The design procedure described in this paper has been
applied to numerous case studies, several of which are
found in the thesis by Larsson (2000) and Govatsmark
(2003).
. Larsson et al. (2003) and Govatsmark and Skogestad(2002): Selection of controlled variables for reactor,
separator and recycle process (steps 1, 2 and 4 plus
some on steps 5 and 6)
Page 15
Fig. 11. Control structure for case with variable feedrate with production rate set at the bottleneck (vapor boilup V ). For the case with a given
feedrate, a cascade flow controller (lower left) is used to set F0s.
S. Skogestad / Computers and Chemical Engineering 28 (2004) 219�/234 233
. Larsson and Skogestad (1999) and Engelien, Larsson,
& Skogestad (2003): Optimization and selection of
controlled variables for heat-integrated distillation
columns (steps 1, 3 and 4)
. Larsson et al. (2001): Selection of controlled variables
for the Tennessee�/Eastman process with focus on
how to eliminate poor candidate variables (steps 1
and 3). (The control system design in this paper wasincluded to show that the proposed controlled vari-
ables are workable, but otherwise do not follow the
steps in Table 1. For example, there is no thorough
analysis on where to locate the throughput manip-
ulator (step 4).)
. Skogestad (2000): Optimization (moving active con-
straints as a function of feedrate) and selection of
controlled variables for a propane-propylene distilla-
tion column (Steps 1, 3 and 4).
15. Conclusion
The proposed plantwide control design procedure in
Table 1 has two main parts:
(I) Top-down analysis to identify degrees of freedom
and primary controlled variables (look for self-
optimizing variables).(II) Bottom-up analysis to determine secondary con-
trolled variables and structure of control system
(pairing).
There are many outstanding research issues related to
filling in more detailed procedures in Table 1 on what to
do in each step of the procedure. In particular this
applies to the bottom-up part of the procedure. For
example, more work is needed in order to understand
how to decompose and coordinate the layers of the
control system.
References
Bristol, E. H. (1966). On a new measure of interaction for multi-
variable control systems. IEEE Transactions on Automatic Control ,
133�/134.
Buckley, P. S. (1964). Techniques of process control . Wiley: New York.
Engelien, H. K., Larsson, T., & Skogestad, S. (2003). Implementation
of optimal operation for heat-integrated distillation columns.
Transactions on IChemE 81 (Part A), 277�/281.
Foss, A. S. (1973). Critique of chemical process control theory. AIChE
Journal 19 , 209�/214.
Govatsmark, M.S. (2003). Integrated optimization and control. Ph.D .
Thesis . Trondheim: Norwegian University of Science and Technol-
ogy (also available from the home page of Siguard Skogestad).
Govatsmark, M. S., & Skogestad, S. (2002). Selection of controlled
variables and robust setpoints. In Proceedings of the IFAC World
Congress, Barcelona, 21�/26 July 2002. Paper T-Mo-M-11-4 .
Grosdidier, P., & Morari, M. (1985). Closed-loop properties from
steady-state gain information. Industrial and Engineering Chemistry
Research 24 , 221�/235.
Havre, K., & Skogestad, S. (1996). Input/output selection and partial
control. In IFAC World Congress, San Francisco, July 1996 (Vol.
M, pp. 181�/186).
Havre, K., & Skogestad, S. (1998). Selection of variables for regulatory
control using pole vectors. In Proceedings of the IFAC Symposium,
Corfu, Greece. DYCOPS-5 (pp. 614�/619).
Jacobsen, E. W. (1999). On the dynamics of integrated plants*/non-
minimum phase behavior. Journal of Process Control 9 , 439�/451.
Page 16
S. Skogestad / Computers and Chemical Engineering 28 (2004) 219�/234234
Larsson, T., & Skogestad, S. (1998). Limitations imposed
by lower layer control configurations. In Proceedings of the
AIChE Annual Meeting, Miami Beach, 16�/20 November
1998 .
Larsson, T., & Skogestad S. (1999). Control of industrial heat
integrated distillation columns. In AIChE Annual Meeting, Dallas,
1�/5 November 1999 .
Larsson, T. (2000). Studies on plantwide control. Ph.D. Thesis .
Trondheim: Norwegian University of Science and Technology.
Larsson, T., & Skogestad, S. (2000). Plantwide control: A review and a
new design procedure. Modeling, Identification and Control 21 ,
209�/240 (also available from the home page of Sigurd
Skogestad).
Larsson, T., Hestetun, K., Hovland, E., & Skogestad, S. (2001). Self-
optimizing control of a large-scale plant: The Tennessee Eastman
process. Industrial and Engineering Chemistry Research 40 , 4889�/
4901.
Larsson, T., Govatsmark, M. S., Skogestad, S., & Yu, C. C. (2003).
Control structure selection for reactor, separator and recycle
processes. Industrial and Engineering Chemistry Research 42 ,
1225�/1234.
Luyben, W. L. (1993). Dynamics and control of recycle systems. 2.
Comparison of alternative process designs. Industrial and Engineer-
ing Chemistry Research 32 , 476�/486.
Luyben, W. L. (1994). Snowball effect in reactor/separator processes
with recycle. Industrial and Engineering Chemistry Research 33 ,
299�/305.
Maarleveld, A., & Rijnsdrop, J. E. (1970). Constraint control of
distillation columns. Automatica 6 , 51�/58.
Morari, M., Stephanopoulos, G., & Arkun, Y. (1980). Studies in the
synthesis of control structures for chemical processes. Part I.
Formulation of the problem. Process decomposition and the
classification of the control task. Analysis of the optimizing control
structures. AIChE Journal 26 , 220�/232.
Nett, C. N. (1989). A quantitative approach to the selection and
partitioning of measurements and manipulations for the control of
complex systems. In Paper Presented at the Caltech Control
Workshop, Pasadena, USA, January 1989 .
Shinskey, F. G. (1979). Process control systems . New York: Mc-Graw
Hill.
Skogestad, S., & Postlethwaite, I. (1996). Multivariable feedback
control . New York: Wiley.
Skogestad, S. (2000). Plantwide control: The search for the self-
optimizing control structure. Journal of Process Control 10 , 487�/
507.
Wu, K. L., & Yu, C.-C. (1996). Reactor/separator process with recycle.
1. Candidate control structure for operability. Computers and
Chemical Engineering 20 , 1291�/1316.