56
Copyright © 2010 Pearson Education, Inc. Publishing as Prentice Hall. 1
| Date post: | 14-Dec-2015 |
| Category: |
Documents |
| Upload: | emmeline-snow |
| View: | 222 times |
| Download: | 4 times |

Copyright © 2010 Pearson Education, Inc. Publishing as Prentice Hall. 1

Copyright © 2010 Pearson Education, Inc. Publishing as Prentice Hall.
Cost-Volume-Profit Analysis
Chapter 7
2

Copyright © 2010 Pearson Education, Inc. Publishing as Prentice Hall.
Learning Objective 1
Calculate the unit contribution margin and the contribution margin
ratio
3

Copyright © 2010 Pearson Education, Inc. Publishing as Prentice Hall.
Cost-Volume-Profit (CVP) Analysis
• Is a powerful tool that helps managers make important business decisions
• Is a relationship among costs, volume, and profit or loss
• Determines how much the company must sell each month just to cover costs or to break even
• Helps managers decide how sales volume would need to change to achieve the same profit level
4

Copyright © 2010 Pearson Education, Inc. Publishing as Prentice Hall.
Components of CVP Analysis• CVP analysis relies on the interdependency of
five components or pieces of information– Sales price per unit– Volume sold– Variable costs per unit– Fixed costs– Operating income
• If you know or can estimate four of these five components, you can compute the remaining unknown amount
5

Copyright © 2010 Pearson Education, Inc. Publishing as Prentice Hall.
CVP Assumptions
1. Change in volume is only factor that affects costs
2. Managers can classify each cost as either variable or fixed
• These costs are linear throughout relevant range
3. Revenues are linear throughout relevant range
4. Inventory levels will not change5. The sales mix of products will not change
6

Copyright © 2010 Pearson Education, Inc. Publishing as Prentice Hall.
CVP Example Facts: Kay’s PostersKay has an e-tail poster business. She currently sells each poster for $35, while each poster has a variable cost of $21. Kay has fixed costs of $7,000. Kay is currently selling 550 posters.
7

Copyright © 2010 Pearson Education, Inc. Publishing as Prentice Hall.
Contribution Margin Income Statement
Kay’s e-tail poster example from prior slide
Sales revenue (550 posters)..................................... $ 19,250Less: Variable expenses ............................................ (11,550)Contribution margin ................................................. 7,700Less: Fixed expenses.................................................. (7,000)Operating income...................................................... $ 700
8

Copyright © 2010 Pearson Education, Inc. Publishing as Prentice Hall.
Unit Contribution MarginKay’s e-tail poster example from previous slides Sales price per unit $ 35- Variable costs per unit (21)
Contribution margin per unit $ 14
Now assume sales are 650 units:
Contribution margin ( 650 sales X $14) $ 9,100- Fixed cost (7,000) Operating Income $ 2,100
9

Copyright © 2010 Pearson Education, Inc. Publishing as Prentice Hall.
Contribution Margin Ratio
Contribution margin ratio
Unit contribution margin = $14 Sales price per unit $35
= 40%
Contribution margin ratio
Contribution margin = $ 7,700 Sales revenue $19,250
= 40%
Contribution margin ratio = percentage of each sales dollar that is available for covering fixed expenses and generating a profit.
Numbers above are from the Kay’s e-tail poster example on previous slides.
10

Copyright © 2010 Pearson Education, Inc. Publishing as Prentice Hall.
S7-1 Bay Cruiseline offers nightly dinner cruises off the coast of Miami, San Francisco, and Seattle. Dinner cruise tickets sell for $50 per passenger. Bay Cruiseline’s variable cost of providing the dinner is $20 per passenger, and the fixed cost of operating the vessels (depreciation, salaries, docking fees, and other expenses) is $210,000 per month. The company’s relevant range extends to 15,000 monthly passengers.
a. What is the contribution margin per passenger? Sales revenue (1 passenger)..................................... Less: Variable expenses ............................................ Contribution margin .................................................
11

Copyright © 2010 Pearson Education, Inc. Publishing as Prentice Hall.
S7-1 (continued)b. What is the contribution margin ratio?
c. Use the unit contribution margin to project operating income if monthly sales total 10,000 passengers.
d. Use the contribution margin ratio to project operating income if monthly sales revenue totals $400,000.Contribution margin ( $400,000 sales X 60%)Fixed costOperating Income
Contribution margin ratio =
Unit contribution margin = $ 30 Sales price per unit = $ 50
= ?
?
12

Copyright © 2010 Pearson Education, Inc. Publishing as Prentice Hall.
S7-2 Bay Cruiseline offers nightly dinner cruises off the coast of Miami, San Francisco, and Seattle. Dinner cruise tickets sell for $50 per passenger. Bay Cruiseline’s variable cost of providing the dinner is $20 per passenger, and the fixed cost of operating the vessels (depreciation, salaries, docking fees, and other expenses) is $210,000 per month. The company’s relevant range extends to 15,000 monthly passengers. •If Bay Cruiseline sells an additional 500 tickets, by what amount will its operating income increase (or operating loss decrease)?
Contribution Margin per unit x additional tickets
13

Copyright © 2010 Pearson Education, Inc. Publishing as Prentice Hall.
Learning Objective 2
Use CVP analysis to find breakeven points and target profit volumes
14

Copyright © 2010 Pearson Education, Inc. Publishing as Prentice Hall.
Breakeven PointBreakeven point:
• Sales level at which operating income is zero
• Fixed expenses = total contribution margin
• Total sales = total expenses
15
Copyright © 2010 Pearson Education, Inc. Publishing as Prentice Hall.
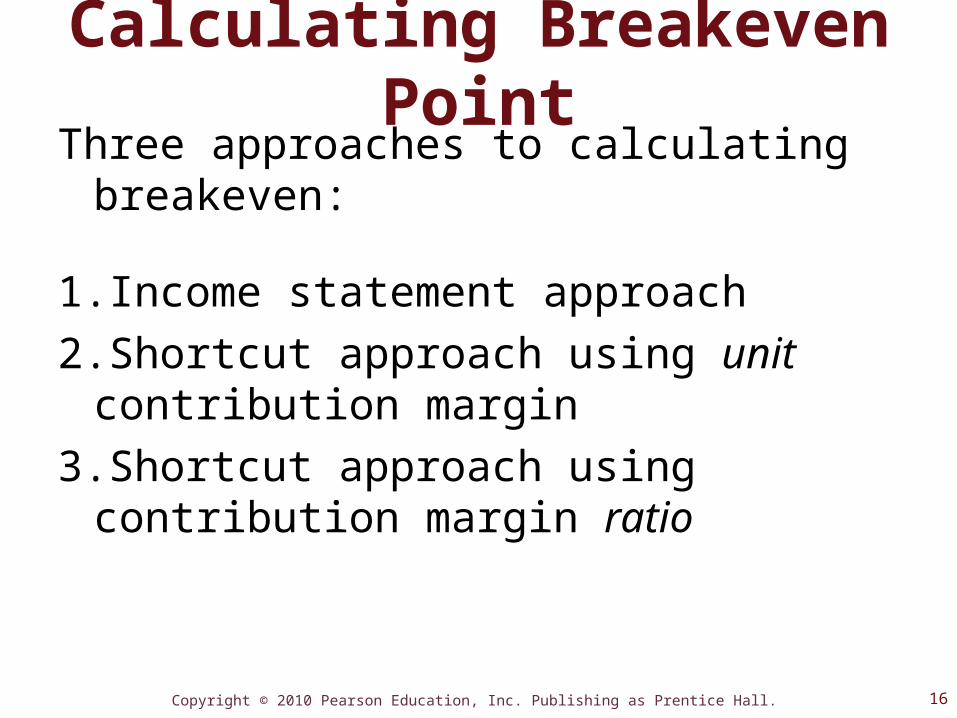
Calculating Breakeven PointThree approaches to calculating breakeven:
1.Income statement approach2.Shortcut approach using unit contribution
margin3.Shortcut approach using contribution margin
ratio
16

Copyright © 2010 Pearson Education, Inc. Publishing as Prentice Hall.
Income Statement ApproachContribution Margin Income Statement
Sales- Variable Expenses Contribution Margin- Fixed Expenses Operating Income
17

Copyright © 2010 Pearson Education, Inc. Publishing as Prentice Hall.
Short-Cut Approach to Calculating Breakeven Using the Unit Contribution Margin
Fixed expenses + Operating income Contribution margin per unit
Units sold =
$7,000 + $0 $14
Units sold =
= 500 posters
18

Copyright © 2010 Pearson Education, Inc. Publishing as Prentice Hall.
Short-Cut Using the Unit Contribution Margin Ratio
Fixed expenses + Operating income Contribution margin ratio
Sales in $ =
$7,000 + $0 0.40
Sales in $ =
= $17,500
19

Copyright © 2010 Pearson Education, Inc. Publishing as Prentice Hall.
Finding the Volume Needed for a Target Profit Using Unit CM
CVP analysis helps managers determine what theyneed to sell to earn a target amount of profit.
Fixed expenses + Operating income Contribution margin per unit
Units sold =
$7,000 + $4,900 $14
Units sold = =
= 850 posters
$11,900 $14
= 850 posters x $35 = $29,750
20

Copyright © 2010 Pearson Education, Inc. Publishing as Prentice Hall.
Finding the Volume Needed for a Target Profit Using Ratio
CVP analysis helps managers determine what theyneed to sell to earn a target amount of profit.
Fixed exp + Target operating income Contribution margin ratio
Units sold =
$7,000 + $4,900 0.40
Units sold = =
= 29,750 posters
$11,900 0.40
21

Copyright © 2010 Pearson Education, Inc. Publishing as Prentice Hall.
S7-3 Use the information from the Bay Cruiseline Data Set to compute the number of dinner cruise tickets it must sell to break even.a. Use the income statement equation approach.
($50 x units) – ($20 x units) - $210,000 = $0 ($50 – $20 ) x units - $210,000 = $0
22

Copyright © 2010 Pearson Education, Inc. Publishing as Prentice Hall.
S7-3 (continued) Use the information from the Bay Cruiseline Data Set to compute the number of dinner cruise tickets it must sell to break even.b. Using the shortcut unit contribution margin approach, perform a numerical proof to ensure that your answer is correct.
Fixed expenses + Operating income Contribution margin per unit
Units sold =
?Units sold =
= ?
?Units sold =
23

Copyright © 2010 Pearson Education, Inc. Publishing as Prentice Hall.
S7-3 (continued)
Use the information from the Bay Cruiseline Data Set to compute the number of dinner cruise tickets it must sell to break even.c. Use your answers from a and b to determine the sales revenue needed to break even.
7,000 units to break even X $50 sales price = ?
24

Copyright © 2010 Pearson Education, Inc. Publishing as Prentice Hall.
S7-3 (continued) Use the information from the Bay Cruiseline Data Set to compute the number of dinner cruise tickets it must sell to break even.d. Use the shortcut contribution margin ratio approach to verify the sales revenue needed to break even.
Fixed expenses + Operating income Contribution margin ratio
Sales in $ =
?Sales in $ =
= ?
?Sales in $ =
25

Copyright © 2010 Pearson Education, Inc. Publishing as Prentice Hall.
Graphing the CVP Relationships
Step 1: – Choose a sales volume (Units x $Price)– Plot point for total sales revenue – Draw sales revenue line from origin through
the plotted point
26

Copyright © 2010 Pearson Education, Inc. Publishing as Prentice Hall.
Preparing a CVP Chart
$0
$5,000
$10,000
$15,000
$20,000
0 500 1,000 1,500
Volume of Units
Do
llars
Revenues
27

Copyright © 2010 Pearson Education, Inc. Publishing as Prentice Hall.
Preparing a CVP ChartStep 2: Draw the fixed cost line
$4,000
28

Copyright © 2010 Pearson Education, Inc. Publishing as Prentice Hall.
Preparing a CVP Chart
$0
$5,000
$10,000
$15,000
$20,000
0 500 1,000 1,500
Volume of Units
Do
llars Revenues
Fixed costs
Total cost
Step 3: Draw the total cost line (fixed plus variable)
29

Copyright © 2010 Pearson Education, Inc. Publishing as Prentice Hall.
Step 4: Identify the breakeven point and the areas of operating income and loss
Preparing a CVP Chart
$0
$5,000
$10,000
$15,000
$20,000
0 500 1,000 1,500
Volume of Units
Do
llar
s
Breakeven point
30

Copyright © 2010 Pearson Education, Inc. Publishing as Prentice Hall.
Step 5: Mark operating income and operating loss areason graph
Preparing a CVP Chart
$0
$5,000
$10,000
$15,000
$20,000
0 500 1,000 1,500
Volume of Units
Do
llar
s
Operating Loss
Operating Income
Breakeven point
31

Copyright © 2010 Pearson Education, Inc. Publishing as Prentice Hall.
S7-5
$-
$100,000
$200,000
$300,000
$400,000
$500,000
$600,000
$700,000
0 2,500 5,000 7,500 10000
Tickets
Do
llars
(in
th
ou
san
ds)
Revenues
32

Copyright © 2010 Pearson Education, Inc. Publishing as Prentice Hall.
S7-5 (continued)
$-
$100,000
$200,000
$300,000
$400,000
$500,000
$600,000
$700,000
2,500 5,000 7,500 10000
Tickets
Do
llars
(in
th
ou
san
ds)
Fixed Cost
33

Copyright © 2010 Pearson Education, Inc. Publishing as Prentice Hall.
S7-5 (continued)
$-
$100,000
$200,000
$300,000
$400,000
$500,000
$600,000
$700,000
2,500 5,000 7,500 10000
Tickets
Do
llars
(in
th
ou
san
ds)
Total Cost
Breakeven Point
Income Area
Loss Area
34

Copyright © 2010 Pearson Education, Inc. Publishing as Prentice Hall.
Learning Objective 3
Perform sensitivity analysis in response to changing business conditions
35

Copyright © 2010 Pearson Education, Inc. Publishing as Prentice Hall.
Sensitivity AnalysisManagers need to be prepared for increasing costs, pricing pressure from competitors, and other changing business conditions.
Sensitivity Analysis: •Conducts “What if” analysis
36

Copyright © 2010 Pearson Education, Inc. Publishing as Prentice Hall.
What if the Sales Price Changes?• Calculate a new unit contribution margin using
the new sales price• Use the new unit contribution margin to
compute breakeven sales in units• Use the new unit contribution margin to
compute breakeven sales to maintain target profit
• Using the new breakeven numbers, decide if a change should be made
37

Copyright © 2010 Pearson Education, Inc. Publishing as Prentice Hall.
What if Costs Change?• Calculate a new unit contribution margin using
the new cost• Use the new unit contribution margin to
compute breakeven sales in units• Use the new unit contribution margin to
compute breakeven sales to maintain target profit
• Using the new breakeven numbers, decide if a change should be made
38

Copyright © 2010 Pearson Education, Inc. Publishing as Prentice Hall.
What if Fixed Costs Change?
• Changes in fixed costs do not affect the contribution margin
• Breakeven point changes because fixed costs change
• Use the unit contribution margin to compute the new breakeven sales in units
• Use the unit contribution margin to compute breakeven sales to maintain target profit
• Using the new breakeven numbers, decide if a change should be made
39

Copyright © 2010 Pearson Education, Inc. Publishing as Prentice Hall.
Learning Objective 4
Find breakeven and target profit volumes for multiproduct companies
40
Copyright © 2010 Pearson Education, Inc. Publishing as Prentice Hall.
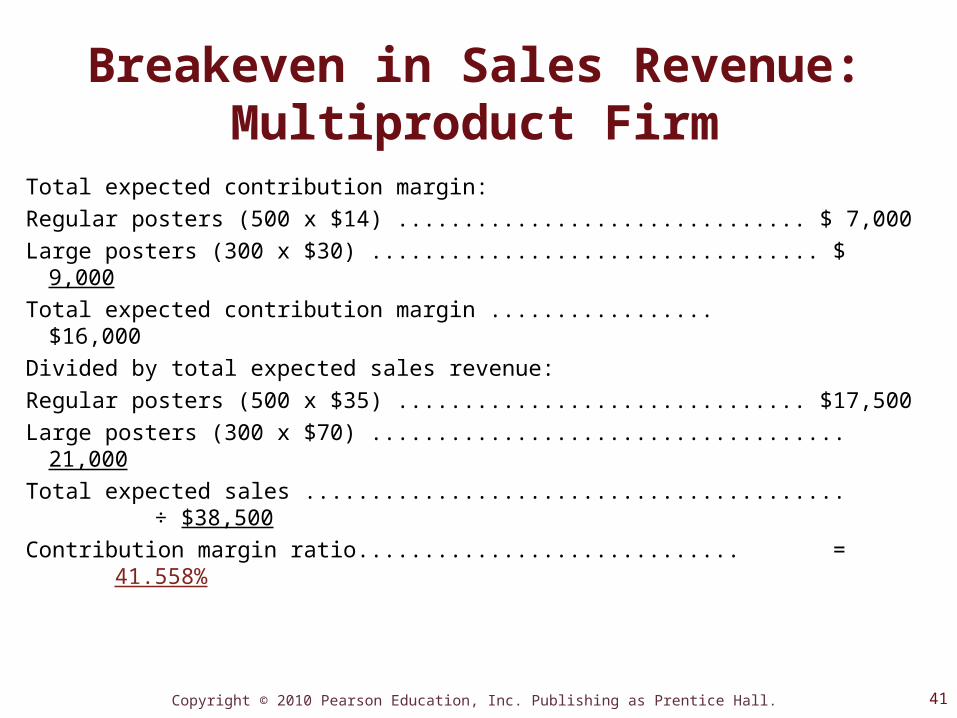
Breakeven in Sales Revenue: Multiproduct Firm
Total expected contribution margin:Regular posters (500 x $14) ............................... $ 7,000Large posters (300 x $30) .................................. $ 9,000Total expected contribution margin ................. $16,000Divided by total expected sales revenue:Regular posters (500 x $35) ............................... $17,500Large posters (300 x $70) .................................... 21,000Total expected sales ......................................... ÷ $38,500Contribution margin ratio............................. = 41.558%
41

Copyright © 2010 Pearson Education, Inc. Publishing as Prentice Hall.
Breakeven in Sales Revenue: Multiproduct Firm (continued)
Fixed expenses + Operating income Contribution margin ratio
Units sold =
Units sold = =
= $16,844 (rounded)
$7,000 0.41558
$7,000 + 0 0.41558
42

Copyright © 2010 Pearson Education, Inc. Publishing as Prentice Hall.
Information Technology and Sensitivity Analysis
• Allows managers to perform a wide array of sensitivity analyses before committing to decisions.
• Uses Excel spreadsheets to perform sensitivity analyses
• Allows managers to estimate how one change (or several simultaneous changes) affects business operations
• Uses spreadsheet software to create CVP graphs 43

Copyright © 2010 Pearson Education, Inc. Publishing as Prentice Hall.
S7-9Regular Cruise Executive Cruise
Sales price per ticket $50 $130
Variable expense per passenger $20 $40
Assuming that Bay Cruiseline expects to sell four regular cruises for every executive cruise, compute the weighted-average contribution margin per unit.
Sales Mix Calculation Regular Executive TotalSales price per unit ........................ $ 50 $130Less: Variable cost per unit ........... (20) (40)Contribution margin per unit ........ Sales mix ....................................... Contribution margin ..................... Weighted-average contributionmargin per unit ($210/5) ...........
44

Copyright © 2010 Pearson Education, Inc. Publishing as Prentice Hall.
S7-9 (continued)
Is it higher or lower than a simple average contribution margin?
Why?
Sales Mix Calculation Regular Executive TotalSales price per unit ........................ $ 50 $130Less: Variable cost per unit ........... (20) (40)Contribution margin per unit ........ Sales mix ....................................... Contribution margin ..................... Weighted-average contributionmargin per unit ($210/5) ...........
45

Copyright © 2010 Pearson Education, Inc. Publishing as Prentice Hall.
S7-9 (continued)
Will this new sales mix cause Bay Cruiseline’s breakeven point to increase or decrease from what it was when it sold only regular cruises?
Sales Mix Calculation Regular Executive TotalSales price per unit ........................ $ 50 $130Less: Variable cost per unit ........... (20) (40)Contribution margin per unit ........ Sales mix ....................................... Contribution margin ..................... Weighted-average contributionmargin per unit ($210/5) ...........
Fixed expenses + Operating income Weighted Average Contribution margin per unit
Sales in $ =
?Sales in $ =
=
46

Copyright © 2010 Pearson Education, Inc. Publishing as Prentice Hall.
What if the Sales Mix Changes?• Use the same CVP formula for multiple products.• Use the weighted-average contribution margin per unit
of all products.• Can find the breakeven or the target profit volume in
terms of units, or in terms of sales revenue.
47

Copyright © 2010 Pearson Education, Inc. Publishing as Prentice Hall.
Learning Objective 5
Determine a firm’s margin of safety and operating leverage
48

Copyright © 2010 Pearson Education, Inc. Publishing as Prentice Hall.
Common Indicators of Risk
• Margin of Safety– The excess of expected sales over breakeven sales
• Operating Leverage• The relative amount of fixed and variable costs that make
up a company’s total costs
49

Copyright © 2010 Pearson Education, Inc. Publishing as Prentice Hall.
Margin of Safety
• Excess of expected sales over breakeven sales• Drop in sales that the company can absorb
before incurring a loss• Used to evaluate the risk of current operations
as well as the risk of new plans
50

Copyright © 2010 Pearson Education, Inc. Publishing as Prentice Hall.
Margin of Safety
Breakeven sales in units
Margin of safetyin units
Expected sales in units
= −
Breakeven sales
Margin of safetyin dollars
Expected sales= −
= 950 units − 500 units 450 units
= $33,250 – $17,500
= $15,750
51

Copyright © 2010 Pearson Education, Inc. Publishing as Prentice Hall.
Margin of Safety as a PercentageMargin of safety as a percentage
Margin of safety in unitsExpected sales in units
=
450 Units950 Units
=
47.4% (rounded)=
Margin of safety as a percentage
Margin of safety in dollarsExpected sales in dollars
=
= $15,750$33,25047.4% (rounded)=
52

Copyright © 2010 Pearson Education, Inc. Publishing as Prentice Hall.
Operating Leverage Factor• How responsive a company’s operating income is
to changes in volume– Lowest possible value for this factor is 1, if the
company has no fixed costs
Operating leverage factor =Contribution marginOperating income
Operating leverage factor =$13,300 $6,300
= 2.11 (rounded)
53

Copyright © 2010 Pearson Education, Inc. Publishing as Prentice Hall.
High Operating Leverage• High operating leverage companies have:
– Higher levels of fixed costs and lower levels of variable costs– Higher contribution margin ratios
• For high operating leverage companies, changes in volume significantly affect operating income, so they face:– Higher risk– Higher potential for reward
• Examples include golf courses, hotels, rental car agencies, theme parks, airlines, cruise lines
54

Copyright © 2010 Pearson Education, Inc. Publishing as Prentice Hall.
Low Operating Leverage
• Low operating leverage companies have:– Higher levels of variable costs and lower levels of fixed
costs– Lower contribution margin ratios
• For low operating leverage companies, changes in volume do NOT have as significant an effect on operating income, so they face:– Lower risk– Lower potential for reward
• Examples include merchandising companies.
55

Copyright © 2010 Pearson Education, Inc. Publishing as Prentice Hall.
End of Chapter 7
56


