International Journal of Environmental Research and Public Health Article Cost and Affordability of Diets Modelled on Current Eating Patterns and on Dietary Guidelines, for New Zealand Total Population, M¯ aori and Pacific Households Sally Mackay 1, * ID , Tina Buch 2 , Stefanie Vandevijvere 1 , Rawinia Goodwin 1 , Erina Korohina 3 , Mafi Funaki-Tahifote 2 , Amanda Lee 4 and Boyd Swinburn 1 1 School of Population Health, University of Auckland, Auckland 1142, New Zealand; [email protected] (S.V.); [email protected] (R.G.); [email protected] (B.S.) 2 The Heart Foundation of New Zealand, Auckland 1051, New Zealand; [email protected] (T.B.); mafi[email protected] (M.F.-T.) 3 Toi Tangata, Auckland 1010, New Zealand; [email protected]4 The Australian Prevention Partnership Centre, The Sax Institute, Sydney 1240, Australia; [email protected]* Correspondence: [email protected]; Tel.: +64-9-923-8733 Received: 11 April 2018; Accepted: 12 June 2018; Published: 13 June 2018 Abstract: The affordability of diets modelled on the current (less healthy) diet compared to a healthy diet based on Dietary Guidelines was calculated for population groups in New Zealand. Diets using common foods were developed for a household of four for the total population, M¯ aori and Pacific groups. M¯ aori and Pacific nutrition expert panels ensured the diets were appropriate. Each current (less healthy) diet was based on eating patterns identified from national nutrition surveys. Food prices were collected from retail outlets. Only the current diets contained alcohol, takeaways and discretionary foods. The modelled healthy diet was cheaper than the current diet for the total population (3.5% difference) and Pacific households (4.5% difference) and similar in cost for M¯ aori households (0.57% difference). When the diets were equivalent in energy, the healthy diet was more expensive than the current diet for all population groups (by 8.5% to 15.6%). For households on the minimum wage, the diets required 27% to 34% of household income, and if receiving income support, required 41–52% of household income. Expert panels were invaluable in guiding the process for specific populations. Both the modelled healthy and current diets are unaffordable for some households as a considerable portion of income was required to purchase either diet. Policies are required to improve food security by lowering the cost of healthy food or improving household income. Keywords: INFORMAS; diet prices; food affordability; Pacific diets; M¯ aori diets; food security 1. Introduction Dietary risks and a high body mass index are major risk factors contributing to health loss globally and in New Zealand (NZ) with dietary risk factors contributing to the highest proportion of total disability-adjusted life years in 2015 compared to other risk factors [1]. New Zealanders consume too much saturated fat, sodium and sugar and not enough dietary fibre, fruit and vegetables [2]. NZ has high rates of obesity with 32.2% of all adults, 50.2% of M¯ aori adults and 68.7% of Pacific adults, obese [3]. For children (aged 2 to 14), 11% of the total population, 18.1% of M¯ aori and 29.1% of Pacific Int. J. Environ. Res. Public Health 2018, 15, 1255; doi:10.3390/ijerph15061255 www.mdpi.com/journal/ijerph
Transcript
International Journal of
Environmental Research
and Public Health
Article
Cost and Affordability of Diets Modelled on CurrentEating Patterns and on Dietary Guidelines,for New Zealand Total Population, Maori andPacific Households
Sally Mackay 1,* ID , Tina Buch 2, Stefanie Vandevijvere 1, Rawinia Goodwin 1, Erina Korohina 3,Mafi Funaki-Tahifote 2, Amanda Lee 4 and Boyd Swinburn 1
Received: 11 April 2018; Accepted: 12 June 2018; Published: 13 June 2018�����������������
Abstract: The affordability of diets modelled on the current (less healthy) diet compared to a healthydiet based on Dietary Guidelines was calculated for population groups in New Zealand. Dietsusing common foods were developed for a household of four for the total population, Maori andPacific groups. Maori and Pacific nutrition expert panels ensured the diets were appropriate. Eachcurrent (less healthy) diet was based on eating patterns identified from national nutrition surveys.Food prices were collected from retail outlets. Only the current diets contained alcohol, takeawaysand discretionary foods. The modelled healthy diet was cheaper than the current diet for the totalpopulation (3.5% difference) and Pacific households (4.5% difference) and similar in cost for Maorihouseholds (0.57% difference). When the diets were equivalent in energy, the healthy diet was moreexpensive than the current diet for all population groups (by 8.5% to 15.6%). For households onthe minimum wage, the diets required 27% to 34% of household income, and if receiving incomesupport, required 41–52% of household income. Expert panels were invaluable in guiding theprocess for specific populations. Both the modelled healthy and current diets are unaffordablefor some households as a considerable portion of income was required to purchase either diet.Policies are required to improve food security by lowering the cost of healthy food or improvinghousehold income.
Dietary risks and a high body mass index are major risk factors contributing to health loss globallyand in New Zealand (NZ) with dietary risk factors contributing to the highest proportion of totaldisability-adjusted life years in 2015 compared to other risk factors [1]. New Zealanders consumetoo much saturated fat, sodium and sugar and not enough dietary fibre, fruit and vegetables [2].NZ has high rates of obesity with 32.2% of all adults, 50.2% of Maori adults and 68.7% of Pacific adults,obese [3]. For children (aged 2 to 14), 11% of the total population, 18.1% of Maori and 29.1% of Pacific
Int. J. Environ. Res. Public Health 2018, 15, 1255; doi:10.3390/ijerph15061255 www.mdpi.com/journal/ijerph
Int. J. Environ. Res. Public Health 2018, 15, 1255 2 of 12
children are obese [3]. Maori and Pacific people are more likely than non-Maori and non-Pacific toexperience food insecurity [2].
An ‘obesogenic’ environment is ‘the sum of influences that the surroundings, opportunities, orconditions of life have on promoting obesity in individuals or populations’ [4]. A focus on creatinghealthy food environments is required to move populations towards diets that meet food-based dietaryguidelines [5]. It is fundamental to consider cultural factors when discussing environmental influenceson obesity [6].
Non-Maori are more advantaged than Maori across socioeconomic indictors related to education,employment, income and household crowding [7]. Inequities in health outcomes for Maori areinfluenced by the negative experiences of colonisation, institutional racism, alienation of land andthus identity and historical trauma [8]. In NZ, the Pacific Island community is a large and diverseethnic group. Pacific communities, while being an integral part of New Zealand’s society, continueto face challenges with lower levels of education and qualifications, lower incomes and a higherunemployment rate than the total population [9].
The International Network for Food and Obesity/NCDs Research, Monitoring and ActionSupport (INFORMAS) aims to monitor key aspects of food environments related to obesity andnon-communicable diseases (NCDs) [10]. The INFORMAS food price module provides a frameworkto examine the price differential of healthy and unhealthy foods, meals and diets with this researchfocusing on the diet component.
Food prices are a major influence on household food purchases [11]. When the household budgetis limited, fixed costs are prioritized so the money allocated for food reduces, which often results infood insecurity with potential health consequences [12].
Researchers have successfully used expert or focus panels to develop diets and select pricingoutlets to ensure the costing of diets reflects intakes [13,14]. This is important in this research as eatingpatterns of Maori and Pacific households in NZ are influenced by traditional foods and eating patterns.
The relative difference in the affordability of a diet modelled to meet dietary guidelines comparedwith a modelled current (less healthy) diet has not been measured before in NZ, and there are fewinternational studies. A systematic review by Rao et. al. (2013) concluded that healthier diets costmore than less healthy diets, though this depended on whether the cost of the total diet or cost per2000 kcal was compared [15].
The affordability of a healthy diet compared to the current diet can be used to estimate theaffordability component of food security for households on different income levels, for social planningand to advocate for fiscal policies and examine the influence on diet cost of taxes and subsidies onfoods [16,17].
This study aims to assess the affordability of diets modelled on current eating patterns(current diet) and on dietary guidelines (healthy diet), for the total population, Maori and Pacifichouseholds, and to explore the feasibility of using expert panels to guide the process.
2. Materials and Methods
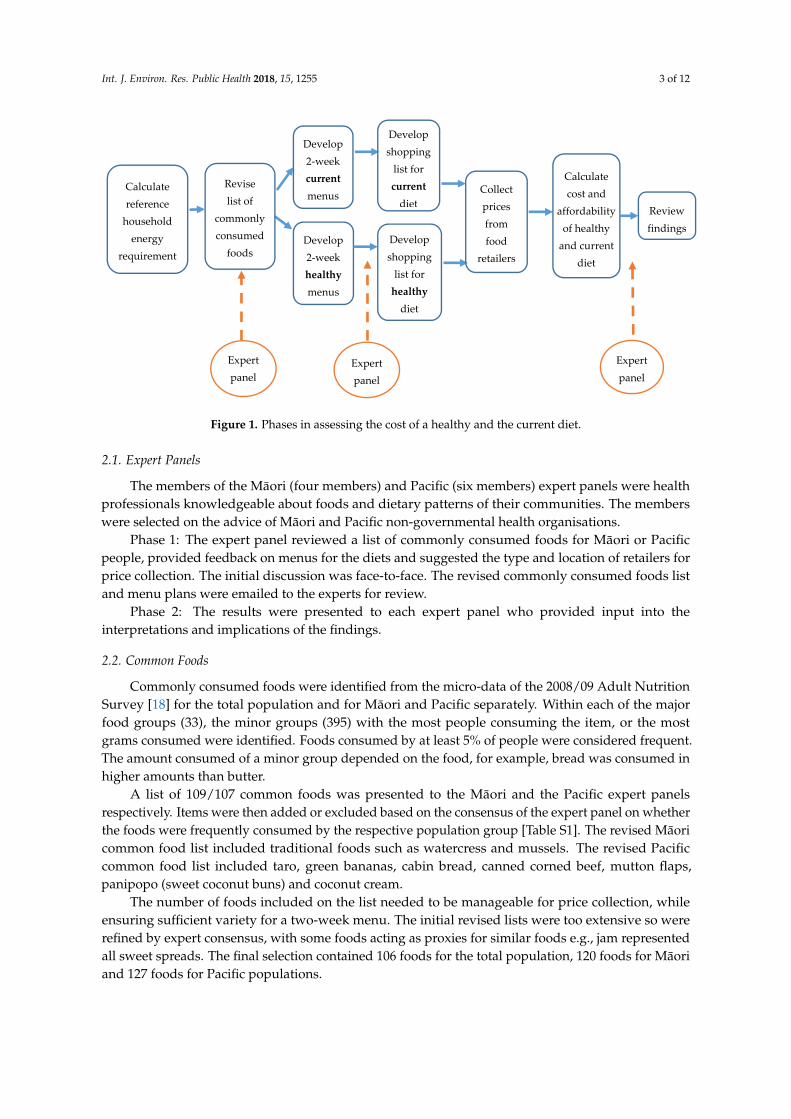
The methodology follows the guidelines set out in the INFORMAS food prices foundationpaper [10] and the INFORMAS food prices module (www.INFORMAS.org). Maori and Pacific expertpanels provided guidance for the selection of common foods, menus and price collection methodsappropriate to the population group. Figure 1 illustrates the phases in assessing the cost of a modelledhealthy versus the current diet. The diets for the total population were developed by a RegisteredNutritionist (SM) rather than an expert panel.
The research was approved by the University of Auckland Human Participant Ethics Committeeon 22 June 2016 for the Pacific diets (reference 017579) and on 26 September 2016 for the Maoridiets (reference 018028). All expert panel participants provided written informed consent priorto participation.
Int. J. Environ. Res. Public Health 2018, 15, 1255 3 of 12Int. J. Environ. Res. Public Health 2018, 15, x 3 of 12
Figure 1. Phases in assessing the cost of a healthy and the current diet.
2.1. Expert Panels
The members of the Māori (four members) and Pacific (six members) expert panels were health professionals knowledgeable about foods and dietary patterns of their communities. The members were selected on the advice of Māori and Pacific non-governmental health organisations.
Phase 1: The expert panel reviewed a list of commonly consumed foods for Māori or Pacific people, provided feedback on menus for the diets and suggested the type and location of retailers for price collection. The initial discussion was face-to-face. The revised commonly consumed foods list and menu plans were emailed to the experts for review.
Phase 2: The results were presented to each expert panel who provided input into the interpretations and implications of the findings.
2.2. Common Foods
Commonly consumed foods were identified from the micro-data of the 2008/09 Adult Nutrition Survey [18] for the total population and for Māori and Pacific separately. Within each of the major food groups (33), the minor groups (395) with the most people consuming the item, or the most grams consumed were identified. Foods consumed by at least 5% of people were considered frequent. The amount consumed of a minor group depended on the food, for example, bread was consumed in higher amounts than butter.
A list of 109/107 common foods was presented to the Māori and the Pacific expert panels respectively. Items were then added or excluded based on the consensus of the expert panel on whether the foods were frequently consumed by the respective population group [Table S1]. The revised Māori common food list included traditional foods such as watercress and mussels. The revised Pacific common food list included taro, green bananas, cabin bread, canned corned beef, mutton flaps, panipopo (sweet coconut buns) and coconut cream.
The number of foods included on the list needed to be manageable for price collection, while ensuring sufficient variety for a two-week menu. The initial revised lists were too extensive so were refined by expert consensus, with some foods acting as proxies for similar foods e.g., jam represented all sweet spreads. The final selection contained 106 foods for the total population, 120 foods for Māori and 127 foods for Pacific populations.
Calculate reference
household energy
requirement
Develop 2-week current menus
Develop 2-week healthy menus
Develop shopping
list for current
diet
Develop shopping
list for healthy
diet
Collect prices from food
retailers
Calculate cost and
affordability of healthy
and current diet
Expert panel
Revise list of
commonly consumed
foods
Expert panel
Expert panel
Review findings
Figure 1. Phases in assessing the cost of a healthy and the current diet.
2.1. Expert Panels
The members of the Maori (four members) and Pacific (six members) expert panels were healthprofessionals knowledgeable about foods and dietary patterns of their communities. The memberswere selected on the advice of Maori and Pacific non-governmental health organisations.
Phase 1: The expert panel reviewed a list of commonly consumed foods for Maori or Pacificpeople, provided feedback on menus for the diets and suggested the type and location of retailers forprice collection. The initial discussion was face-to-face. The revised commonly consumed foods listand menu plans were emailed to the experts for review.
Phase 2: The results were presented to each expert panel who provided input into theinterpretations and implications of the findings.
2.2. Common Foods
Commonly consumed foods were identified from the micro-data of the 2008/09 Adult NutritionSurvey [18] for the total population and for Maori and Pacific separately. Within each of the majorfood groups (33), the minor groups (395) with the most people consuming the item, or the mostgrams consumed were identified. Foods consumed by at least 5% of people were considered frequent.The amount consumed of a minor group depended on the food, for example, bread was consumed inhigher amounts than butter.
A list of 109/107 common foods was presented to the Maori and the Pacific expert panelsrespectively. Items were then added or excluded based on the consensus of the expert panel on whetherthe foods were frequently consumed by the respective population group [Table S1]. The revised Maoricommon food list included traditional foods such as watercress and mussels. The revised Pacificcommon food list included taro, green bananas, cabin bread, canned corned beef, mutton flaps,panipopo (sweet coconut buns) and coconut cream.
The number of foods included on the list needed to be manageable for price collection, whileensuring sufficient variety for a two-week menu. The initial revised lists were too extensive so wererefined by expert consensus, with some foods acting as proxies for similar foods e.g., jam representedall sweet spreads. The final selection contained 106 foods for the total population, 120 foods for Maoriand 127 foods for Pacific populations.
Int. J. Environ. Res. Public Health 2018, 15, 1255 4 of 12
2.3. Household Energy Requirements
The reference household used was that recommended in the INFORMAS food prices module:45-year old man, 45-year old woman, 14-year old boy, 7-year old girl. The energy requirement forthe adults for the healthy diet was calculated using the Body Weight Planner [19] based on a weightderived from a Body Mass Index (BMI) of 23 kg/m2 calculated from mean population height [20] formoderate physical activity [Table S2]. The energy requirement for children for the healthy diet wasbased on the recommended energy requirements per KJ/kg per day by FAO/WHO/UNU [21] formoderate physical activity. The target weight was calculated from the 50th percentile BMI from theCentres for Disease Control and Prevention growth charts [22] using mean height [20].
The energy requirement for the current diet for adults was based on the current BMI [Table S2].The average physical activity level (PAL) was unknown for the population, but approximately half ofNZ adults met the physical activity guidelines [20] so a moderate physical activity level was selected.The energy requirement for the current diet for children was based on actual weight [20] and moderatephysical activity as most children met the NZ physical activity guidelines [23]. The additional energyrequired for the actual weight was calculated using a validated equation for the excess energy intakeper unit excess weight in childhood [24].
2.4. Diet Constraints
The current diets were modelled to reflect the median intake of the macronutrients (percentageof energy), fibre and total sugar, serves of fruits, vegetables, grains, meat and alternatives and dairyproducts reported in the 2008/09 Adult Nutrition Survey [2] and the Children’s Nutrition Survey2002 [25] [Tables S3 and S4]. The estimated intakes of sodium were from a later survey using a 24-hurine collection [26]. The current diets met Recommended Dietary Intakes (RDIs) and AdequateIntakes (AIs) for micronutrients except for iodine for all household members, and calcium, iron orVitamin A for some household members.
The healthy diets were modelled to meet the NZ Eating and Activity Guidelines food grouprecommendations for number of servings [27] [Table S3] and the acceptable macronutrient distributionrange, adequate intake for fibre and the upper limit for sodium (2.3 g per day) from the NutrientReference Values and the RDIs and AIs for micronutrients [28] [Table S4]. The intake of iodine couldnot be assessed due to incomplete food composition data on this micronutrient. The RDI for ironwas not met by the adult female of each population group. Foods recommended by the Eating andActivity Guidelines (for example, whole-grain bread, lean meat, reduced-fat milk) were selected.There were no discretionary foods (high in added salt, sugar, saturated fat) in the standard healthydiets. An additional scenario was modelled which replaced 6% of energy from a wide range of foodswith discretionary foods and alcohol (adult’s diets) to compare a realistic healthy diet rather than anaspirational diet with the current diet.
Additional healthy foods were added to the list of common foods to enable the NZ Eatingand Activity Guidelines recommendations for whole-grains, low-fat dairy and legumes to be met;for example, unsalted peanuts, reduced fat corned beef, brown rice, hummus, canned beans. Theadditional foods were selected based on frequency of consumption in the nutrition surveys and advicefrom the expert panels.
2.5. Gifting and Gathering of Food
The Maori expert panel identified the gifting and gathering of kai (food) as an important partof accessing food. Foods commonly gifted and/or gathered were seasonal fruit and vegetables andseafood. An additional scenario was analysed where the foods commonly gifted or gathered werepriced in the original diet at $0 (mandarins, fresh fish, mussels, puha and watercress).
Int. J. Environ. Res. Public Health 2018, 15, 1255 5 of 12
2.6. Menu Development
A fortnightly menu was developed for the current and healthy diets for each household memberseparately using the commonly consumed foods for breakfast, lunch, dinner, snacks and beverages.The expert panels advised on the menu structure. For example, the Pacific expert panel highlightedthat on Sunday there is a large shared church feast so people only have a cup of tea and cabin breadfor breakfast. The Maori expert panel considered it important to include sauces and spreads in thehealthy diet to ensure the diet was realistic. The nutrient content of the menus was analysed usingFoodWorks [29] with the NZ Food Composition Database. The nutrient composition of some Pacificfoods were entered as additional foods, sourced from the Pacific Island Food Composition Tables [30].Modifications were made to ensure diets met the constraints.
2.7. Price Collection
The amount to purchase for the household, allowing for inedible portion, yield and retentionfactors, [31] was calculated [Tables S5 and S6]. The expert groups advised that households wouldselect the cheapest brand. Therefore, the brand with the cheapest price was collected from each store,including discount prices and generic brands. For items sold per unit, for example head of broccoli ora donut, three units were weighed and averaged to calculate the price per 100 g.
For the total population, prices were collected from a convenience sample of twelve supermarketsrepresenting the three major supermarket chains and twelve neighbouring fresh produce stores ingreater Auckland in November 2016 over two weeks. The prices for takeaway items were sourcedfrom the INFORMAS meals cost study [32]. All items were available.
The Maori expert panel advised to collect prices from urban and rural grocery stores because priceand access may be a barrier in rural areas. Prices were collected from three supermarkets (two large,one small) in an urban area and from three supermarkets (one large, two small) in rural areas andtakeaway outlets in the Waikato region. Price collection was for one week in July 2017. Six items werenot available in some of the smaller grocery stores, mainly fresh fish and meat.
The Pacific expert panel advised that prices should be collected in South Auckland to ensurespecific Pacific foods were available. Prices were collected from three supermarkets (each major chain),three neighbouring fruit and vegetable shops, three bakeries and takeaway outlets. Price collectionwas for two weeks in September 2016. Not all items were available in stores such as mutton flaps,wholemeal pasta, light coconut cream and taro leaves.
2.8. Analysis
The cost of the household diet was calculated for the healthy and current diet (Table 1) for thethree populations. A scenario was calculated with the 15% Goods and Services Tax (GST) removedfrom core foods (fruits, vegetables, less processed meat, seafood, poultry, legumes, nuts, dairy, healthyoils, grains).
To assess affordability of the diets, the percentage of household income required to purchase eachdiet was calculated for three scenarios:
Scenario 1: Median disposable income [33]Scenario 2: Household receiving income support
• Jobseeker Support [34]• Accommodation Supplement (area 2) [34]• Family tax credit [35]
Scenario 3: Minimum wage [36]
• 60 h per week = one adult 40 h + one adult 20 h Jobseeker Support [34]• Family tax credit calculated online using gross wages [35]
Int. J. Environ. Res. Public Health 2018, 15, 1255 6 of 12
3. Results
3.1. Energy Requirements
The household energy requirement for the modelled healthy diet is 39.9 MJ and for the currentdiet is 43.6 MJ for the total population, 46 MJ for Maori and 47.3 MJ for Pacific. The current diet has8.5% more energy than the healthy diet for the total population household, 13.3% for Maori and 15.6%for Pacific households.
3.2. Cost of Diets
The cost of the diets, and composite food groups, for each population group is outlined in Table 1.For the total population and Pacific Island households, the cost of a modelled healthy diet per fortnightis slightly less than the current diet by 3.5% and 4.5%, with a cost differential over one year of $588and $575 respectively. For the Maori household, the cost of a healthy and current diet is similar (0.57%difference). When the diets are equivalent in energy, the healthy diet is more expensive than the currentdiet for all population groups (by 8.5% for the total population, 13.3% for Maori, and 15.6% for Pacific).When 6% of energy in the healthy diet is replaced by discretionary foods and alcohol, the healthy dietreduces in cost by 0.5% ($3.23 per fortnight).
Discretionary foods, beverages and takeaways comprise 36%, 46% and 41% respectively of thecurrent diet costs for the total population, Maori and Pacific Islander populations. The healthy dietshave more protein foods, vegetables, grains, fruit and dairy foods than the current diets, and notakeaways, discretionary foods, alcohol, or sugary beverages.
Table 1. Percentage of diet cost of each food group.
The percentage of income required to purchase either diet is outlined in Table 2. When the 15%Goods and Services Tax (GST) is removed from core foods, affordability for a household improvesmore for the healthy diet than the current diet.
Int. J. Environ. Res. Public Health 2018, 15, 1255 7 of 12
Table 2. Percentage of household income required to purchase diets.
Standard Diet GST off Core Foods
Healthy Diet %Income
Current Diet %Income
Healthy Diet %Income
Current Diet %Income
Median Household income ($1733 per week)Total population 18.7% 19.4% 16.3% 17.7%Maori 16.1% 16.2% 14.0% 15.1%Pacific 15.2% 15.9% 13.2% 15.2%
Minimum Wage ($1115 per week)Total population 32.8% 33.9% 28.5% 31.0%Maori 28.2% 28.3% 24.5% 26.3%Pacific 26.6% 27.8% 23.1% 26.6%
Income support ($636 per week)Total population 51.0% 52.8% 44.4% 48.2%Maori 43.9% 44.2% 38.2% 41.0%Pacific 41.4% 43.3% 36.0% 41.4%
3.4. Cost Scenarios
For Maori, six items were identified as foods typically gathered or gifted rather than purchased.The modelled healthy diet reduces in cost more than the current diet when these foods are gifted,as all these foods were healthy. In rural areas, the healthy diet cost reduces by $28.34 per week andthe current diet cost reduces by $15.00 while in urban areas these figures were $27.23 and $14.20respectively. Both the healthy and current diets are cheaper in the urban area compared to the ruralarea, with the healthy diet costing 9.4% more and the current diet 7.6% more in rural areas.
4. Discussion
This study showed that in NZ, a diet modelled on dietary guidelines is not more expensive thanthe current, less healthy diet, however when the diets are equivalent in energy the healthy diet is moreexpensive than the current diet for all population groups. For the total population and Pacific, the costof a healthy diet is slightly cheaper than the current, less healthy diet. The current diets are higher inenergy than the healthy diets because household energy requirement is determined by the averagecurrent BMI for the current diet, which is higher than the BMI used for the healthy diet to maintainweight at a healthy BMI.
The input from the Maori and Pacific expert panels was invaluable to identify some popular foodsand practices, the type of food to price, meal patterns, common type of retailers and the importance ofgathered and gifted food.
An Australian pilot study using similar methodology found the modelled healthy diet costapproximately 12% less than the modelled current diet for a household of four [37]. The healthydiet had 9.6% less energy than the current diet. The energy requirement of the healthy diet was thatrequired to maintain the current BMI and physical activity level of the population. In the New Zealandstudy, the energy requirement of the healthy diet was determined by a healthy BMI. In Australia,there is no GST on basic, healthy foods but 10% GST on discretionary foods, which contributed to thehealthy diet being cheaper than the current diet.
The Otago Food Cost Survey [38] collects the price of a diet that meets the NZ Eating and ActivityGuidelines and contains some less healthy snack foods but no alcohol or takeaways. The cost of threediets is calculated: basic (cheapest), moderate and liberal (most expensive, most variety). For a similarhousehold of four, the costs of the healthy diets for Maori ($559) and Pacific ($527) in this study werebetween the cost of the basic ($482) and moderate ($628) diets in the Otago study, while the cost for thetotal population ($649) was slightly higher than the moderate diet.
Int. J. Environ. Res. Public Health 2018, 15, 1255 8 of 12
There is no accepted benchmark for affordability of a healthy diet internationally, though otherresearchers consider a household is suffering from food stress if more than 25% of disposable income isspent on food [39]. Therefore, NZ households receiving the minimum wage or income support wouldbe suffering from food stress with some households requiring half of their income to purchase a healthydiet. The percentage of household income required for other major costs such as housing and utilitiesalso determines the income available for food. Affordability was similar for the healthy and currentdiets for Maori. The healthy diet was slightly more affordable for Pacific and the total population.However, for a household of four receiving income support or minimum wage, a considerable portionof household income is required to purchase either diet. Food insecurity is a concern with 7.3% of NZhouseholds classified as having low food security in the 2008/09 national nutrition survey [2]. In NZ,all foods have 15% GST added [40]. If GST was removed from basic healthy foods, this would improveaffordability more for the healthy diet than the current diet.
4.1. Strengths
Few reported studies have compared the cost of a hypothetical healthy diet and a current diet,particularly for different population groups. The current diet is based on the common foods reportedby the population in a national nutrition survey. The healthy diet is developed to meet food-baseddietary guidelines and Nutrient Reference Values. The energy requirement for the current diet reflectedthe actual BMI of the population rather than using the mean reported energy intake in the survey,which is always under-reported [41]. Takeaway foods and alcohol were included in the current diet asthese are common. Overall, the healthy diet met more of the micronutrient recommendations than thecurrent diet though the diet for the adult female (total population only) met the RDI for iron on thecurrent diet but not the healthy diet. This study demonstrated that an expert panel is a useful methodfor gaining cultural input into the commonly consumed foods, dietary patterns and selection of retailoutlets used by Maori and Pacific households. As the national nutrition surveys were not recent, theexpert panels offered an up-to-date view on commonly consumed foods.
4.2. Limitations
Arbitrary decision points occur at all stages of the process from selecting common foods, selectingitems to represent other foods, the amount of each food in the diets, the energy requirement, thedefinition of a healthy diet, sampling retail outlets and the price selected. The nutrient intake of thecurrent diet was based on older nutrition surveys (2008/09, 2002/03) so may not reflect the nutrientintake of the current diet, however no other data were available.
There is a range of healthy menus that could fit the food-based dietary guidelines andrecommended dietary intakes. Only one healthy and one current diet was developed for eachpopulation group, so this may not be representative of the average cost if a range of diets werepriced. The healthy diet was modelled to be aspirational but when limited discretionary foods wereadded the cost was similar.
There are other inputs to the cost of producing a household meal, aside from food prices, whichcould underestimate diet cost, particularly for healthy diets, which may require more preparation.Inputs include time, cooking fuel, transport for groceries, storage, preparation, cooking utensils,cooking space and skills [10].
The cost of the diets was calculated using food prices collected at supermarkets, rather than actualhousehold expenditure that may take into account brand loyalty or purchases from multiple stores.The prices for the different population groups were collected at different times and seasons: Pacificin September 2016, total population in November 2016, Maori in July 2017. The Food Price Indexindicated that the price of foods increased by 3.0% from July 2016 to July 2017, particularly fruit andvegetables (8.2%) [42]. Therefore, the relative difference between the healthy and current diets of thedifferent population groups was compared, not the absolute amount. The higher price of fruit andvegetables could be a factor in explaining why the Maori healthy and current diets were a similar
Int. J. Environ. Res. Public Health 2018, 15, 1255 9 of 12
price, rather than the healthy diet being slightly cheaper for the Pacific and total population diets.Seasons affect fruit and vegetable prices with fresh fruit and vegetables more expensive in July andSeptember, and close to the average monthly price in November [42], therefore it is expected that thecost differences between the healthy and current diets would persist in seasons where prices are lower.
4.3. Implications
A diet modelled on dietary guidelines is not more expensive than the current diet when thereference household also shifts from the estimated current energy intake to the recommended energyintake. This is particularly important for those on low incomes because food costs are typically betweena quarter and a half of household budgets indicating they are suffering from food stress. There is aperception that healthy diets are more expensive than those currently consumed [43,44]. However,this research and similar research in Australia [37] indicates it is possible to shift to a healthy diet (thatdoes not exceed energy requirements) from the current, healthy diet without additional cost. Price isonly one barrier to healthy eating. Other key influences are taste, traditions, convenience, knowledgeand cooking skills [43]. Gathering and gifting food is important in reducing diet costs.
This paper describes the collection of the baseline data. After further price collections, it can beseen whether the healthy diet is increasing in cost at a different rate than the current diet. An analysisof foods in the NZ Food Price Index [45] over ten years indicates the price of healthy foods rose at asimilar rate compared to unhealthy foods.
It is recommended that work be conducted with the expert panels on how to translate thesefindings into a practical health promotion tool for Pacific, Maori and low-income households.Monitoring the price and affordability of diets provides robust data and benchmarks to informeconomic and fiscal policies [10]. As demonstrated in this study, having information on the prices ofthe current and healthy diets is invaluable to demonstrating the impact taxes and subsidies will haveon diets.
5. Conclusions
Expert panels were invaluable in guiding development of the diets to be costed for specificpopulation groups. In NZ, a lower-energy healthy diet is not necessarily more expensive than thecurrent diet, but discretionary foods make up 36–41% of food costs in the current diet. Strategies toswitch current spending on discretionary food and takeaways to healthy food need not cost more.However, overall food security is of concern as a considerable portion of income is required to purchaseeither a healthy or the current diet in NZ, especially for households receiving minimum wage or incomesupport. In order to consume a healthy diet, policies are required to lower the cost of healthy food orensure that households have sufficient income after fixed expenses to purchase nutritious, acceptableand safe food.
Supplementary Materials: The following are available online at http://www.mdpi.com/1660-4601/15/6/1255/s1. Table S1: Common foods added and removed from diets by Maori and Pacific expert panels, Table S2:Individual and household energy requirements for each population group, Table S3: Number of serves of eachfood group per week for each household member for healthy and current diets, Table S4: Nutrient intake ofhousehold members for healthy and current diets for each population group, Table S5: Edible amount of eachcommon food in the current diet per fortnight for each population group, Table S6: Edible amount of each commonfood in the healthy diet per fortnight for each population group.
Author Contributions: S.M., A.L., S.V. and B.S. conceived and designed the study; S.M., T.B. and R.G. performedthe study and analyzed the data; S.M. wrote the paper. E.K. and M.F.-T. provided expert advice and contributedto performing the study; All authors critically revised the manuscript.
Acknowledgments: This research was funded by a grant from the Health Research Council (3704724).
Conflicts of Interest: The authors declare no conflict of interest. The founding sponsors had no role in the designof the study; in the collection, analyses, or interpretation of data; in the writing of the manuscript, and in thedecision to publish the results.
Int. J. Environ. Res. Public Health 2018, 15, 1255 10 of 12
References
1. GBD 2016 Risk Factor Collaborators. Global, regional, and national comparative risk assessment of79 behavioural, environmental and occupational, and metabolic risks or clusters or risks, 1990–2015:A systematic analysis for the Global Burden of Diseases Study 2015. Lancet 2016, 388, 1659–1724.
2. University of Otago and Ministry of Health. A Focus on Nutrition: Key Findings of the 2008/09 New ZealandAdult Nutrition Survey; Ministry of Health: Wellington, New Zealand, 2011.
3. Ministry of Health. New Zealand Health Survey 2016/17. Available online: https://www.health.govt.nz/nz-health-statistics/national-collections-and-surveys/surveys/current-recent-surveys/new-zealand-health-survey#published (accessed on 20 November 2017).
4. Swinburn, B.; Egger, G.; Raza, F. Dissecting obesogenic environments: The development and application ofa framework for identifying and prioritizing environmental interventions for obesity. Prev. Med. 1999, 29,563–570. [CrossRef] [PubMed]
5. Swinburn, B.; Sacks, G.; Vandevijvere, S.; Kumanyika, S.; Lobstein, T.; Neal, B.; Barquera, S.; Friel, S.;Hawkes, C.; Kelly, B.; et al. INFORMAS (International Network for Food and Obesity/non-communicablediseases Research, Monitoring and Action Support): Overview and key principles. Obes. Rev. 2013, 14(Suppl. 1), 1–12. [CrossRef] [PubMed]
6. Kumanyika, S.K. Environmental influences on childhood obesity: Ethnic and cultural influences in context.Physiol. Behav. 2008, 94, 61–70. [CrossRef] [PubMed]
7. Ministry of Health; Kahukura, T. Maori Health Chart Book 2015, 3rd ed.; Ministry of Health: Wellington,New Zealand, 2015.
8. Berghan, G.; Came, H.; Coupe, N.; Doole, C.; Fay, J.; McCreanor, T.; Simpson, T. Tiriti-Based Health PromotionPractice. STIR: Stop Institutional Racism. 2017. Available online: https://trc.org.nz/treaty-waitangi-based-practice-health-promotion (accessed on 7 February 2018).
9. Sorensen, D.; Jensen, S.; Rigamoto, M.; Pritchard, M. Pacific People in New Zealand: How Are We doing? PasifikaFutures Ltd.: Auckland, New Zealand, 2015.
10. Lee, A.; Ni Mhurchu, C.; Sacks, G.; Swinburn, B.; Snowdon, W.; Vandevijvere, S.; Hawkes, C.; L’Abbé, M.;Rayner, M.; Sanders, D.; et al. Monitoring the price and affordability of foods and diets globally. Obes. Rev.2013, 14 (Suppl. 1), 82–95. [CrossRef] [PubMed]
11. Ni Mhurchu, C.; Eyles, H.; Dixon, R.; Matoe, L.; Teevale, T.; Meagher-Lundberg, P. Economic incentives topromote healthier food purchases: Exploring acceptability and key factors for success. Health Promot. Int.2012, 27, 331–341. [CrossRef] [PubMed]
12. Lloyd, S.; Lawton, J.; Caraher, M.; Singh, G.; Horsley, K.; Mussa, F. A tale of two localities: Healthy eating ona restricted income. Health Educ. J. 2011, 70, 48–56. [CrossRef]
13. Bowyer, S.; Caraher, M.; Eilbert, K.; Carr-Hill, R. Shopping for food: Lessons from a London borough.Br. Food J. 2009, 111, 452–474. [CrossRef]
14. Goedemé, T.; Storms, B.; Van den Bosch, K. Pilot Project: Developing a Common Methodology on ReferenceBudgets in Europe; European Commission: Brussels, Belgium, 2015.
15. Rao, M.; Afshin, A.; Singh, G.; Mozaffarian, D. Do healthier foods and diet patterns cost more than lesshealthy options? A systematic review and meta-analysis. BMJ Open 2013, 3, e004277. [CrossRef] [PubMed]
16. Kettings, C.; Sinclair, A.; Voevodin, M. A healthy diet consistent with Australian health recommendationsis too expensive for welfare-dependent families. Aust. N. Z. J. Public Health 2009, 33, 566–572. [CrossRef][PubMed]
17. Nathoo, T.; Shoveller, J. Do healthy food baskets assess food security? Chronic Dis. Can. 2003, 24, 65–69.[PubMed]
18. Statistics New Zealand. Adult National Nutrition Survey 2008/09 Confidentialised unit Record Files; StatisticsNew Zealand: Wellington, New Zealand, 2011.
19. National Institute of Diabetes and Digestive and Kidney Diseases. Body Weight Planner. Available online:https://www.niddk.nih.gov/health-information/weight-management/body-weight-planner (accessed on6 April 2017).
20. Ministry of Health. Annual Update of Key Results 2013/14: New Zealand Health Survey.Available online: https://www.health.govt.nz/publication/annual-update-key-results-2013-14-new-zealand-health-survey (accessed on 20 November 2017).
Int. J. Environ. Res. Public Health 2018, 15, 1255 11 of 12
21. FAO; WHO; UNU. Report on Human Energy Requirements; Food and Agricultural Organization; World HealthOrganization; United Nations University Expert Consultation: Rome, Italy, 2004.
22. CDC Growth Charts 2010. Available online: http://www.cdc.gov/growthcharts/index.htm (accessed on 11January 2016).
23. Clinical Trials Research Unit and Synovate. A National Survey of Children and Young People’s PhysicalActivity and Dietary Behaviours in New Zealand: 2008/09: Key Findings; Ministry of Health: Wellington,New Zealand, 2010.
24. Hall, K.; Butte, N.; Swinburn, B.; Chow, C. Dynamics of childhood growth and obesity: Development andvalidation of a quantitative mathematical model. Lancet Diabetes Endocrinol. 2013, 10, 97–105. [CrossRef]
25. Ministry of Health. NZ Food NZ Children: Key Results of the 2002 National Children’s Nutrition Survey; Ministryof Health: Wellington, New Zealand, 2003.
26. Skeaff, S.; McLean, R.; Mann, J.; Williams, S. The Impact of Mandatory Fortification of Bread with Iodine; MPITechnical Paper No: 2013/025; Ministry of Primary Industries: Wellington, New Zealand, 2013.
27. Ministry of Health. Eating and Activity Guidelines for New Zealand Adults. 2015. Available online:https://www.health.govt.nz/publication/eating-and-activity-guidelines-new-zealand-adults (accessed on20 November 2017).
28. NHMRC. Nutrient Reference Values for Australia and New Zealand; National Health and Medical ResearchCouncil: Canberra, Australia, 2006.
30. Dignan, C.; Burlingame, B.; Kumar, S.; Aalbersberg, W. The Pacific Island Food Composition Tables; Food andAgriculture Organization of the United Nations: Rome, Italy, 2004.
31. New Zealand Institute of Plant and Food Research. FOODfiles 2013; The New Zealand Institute of Plant andFood Research and the New Zealand Ministry of Health: Palmerston North, New Zealand, 2013.
32. Mackay, S.; Vandevijvere, S.; Xie, P.; Lee, A.; Swinburn, B. Paying for convenience: Comparing the cost oftakeaway meals with their healthier home-cooked counterparts in New Zealand. Public Health Nutr. 2017,20, 2269–2276. [CrossRef] [PubMed]
33. OECD Income Distribution and Poverty. 2016. Available online: http://stats.oecd.org/Index.aspx?DataSetCode=IDD (accessed on 30 May 2016).
34. Ministry of Social Development. Benefit Rates at 1 April 2016. Available online: http://www.workandincome.govt.nz/products/benefit-rates/benefit-rates-april-2016.html#null (accessed on 4May 2016).
35. Inland Revenue. Estimate Your Working for Families Tax Credits 2016. Available online: http://www.ird.govt.nz/calculators/keyword/wff-tax-credits/calculator-wfftc-estimate-2016.html (accessed on30 May 2016).
36. Employment New Zealand. The Minimum Wage. 1 April 2016. Available online: https://www.employment.govt.nz/hours-and-wages/pay/minimum-wage/ (accessed on 30 May 2016).
37. Lee, A.J.; Kane, S.; Ramsey, R.; Good, E.; Dick, M. Testing the price and affordability of healthy and current(unhealthy) diets and the potential impacts of policy change in Australia. BMC Public Health 2016, 16, 315.[CrossRef] [PubMed]
38. Department of Human Nutrition. Information Package for Users of the New Zealand Estimated Food Costs 2016;University of Otago: Dunedin, New Zealand, 2016.
39. Landrigan, T.; Kerr, D.; Dhaliwal, S.; Savage, V.; Pollard, C. Removing the Australian tax exemption onhealthy food adds food stress to families vulnerable to poor nutrition. Aust NZ J Public Health 2017. [CrossRef][PubMed]
40. New Zealand Legislation. Goods and Services Tax Act 1985. Available online: http://www.legislation.govt.nz/act/public/1985/0141/latest/DLM81035.html (accessed on 30 August 2016).
41. Poslusna, K.; Ruprich, J.; de Vries, J.; Jakubikova, M.; van’t Veer, P. Misreporting of energy and micronutrientintake estimated by food records and 24 h recalls, control and adjustment methods in practice. Br. Nutr.2009, 101 (Suppl. 2), S73–S85. [CrossRef] [PubMed]
42. Statistics New Zealand. Food Price Index: July 2017. Available online: http://www.stats.govt.nz/browse_for_stats/economic_indicators/prices_indexes/FoodPriceIndex_HOTPJul17.aspx (accessed on 10October 2017).
Int. J. Environ. Res. Public Health 2018, 15, 1255 12 of 12
43. Andajani-Sutjahjo, S.; Ball, K.; Warren, N.; Inglis, V.; Crawford, D. Perceived personal, social andenvironmental barriers to weight maintenance among young women: A community survey. Int. J. Behav.Nutr. Phys. Act. 2004, 1, 15. [CrossRef] [PubMed]
44. Funaki-Tahifote, M.; Fung, M.; Timaloa, Y.; Langi, T.; Lafuloa, S.; Manuopangai, V.; Johnston, O. BetterQuality and Reduced Quantity in Food/Drinks in Pacific Settings; Health Promotion Agency: Wellington,New Zealand, 2016.
45. Statistics New Zealand. Food Price Index Selected Monthly Weighted Average Prices for New Zealand.2017. Available online: http://www.stats.govt.nz/infoshare/SelectVariables.aspx?pxID=e3632d54-64c5-45c0-80f5-721bc77c2bca (accessed on 30 May 2017).