39
COVID-19 SMALL AND MEDIUM ENTERPRISE SENTIMENT TRACKER – WAVE 17 – 24 th September 2020

COVID -19 SMALL AND MEDIUM ENTERPRISE
SENTIMENT TRACK ER
– W A V E 1 7 –
2 4 t h S e p t e m b e r 2 0 2 0

ABOUT US
ACA Research & Fifth Quadrant have worked closely with TEG Insights on
business and consumer research projects for over a decade. Our strong partnership allowed us to collaborate
on this new tracker aiming at understanding the impact of COVID-19 on SMEs during these unprecedented
times.
Please do not hesitate to contact us should you have any questions!
T W O B R A N D S O P E R A T I N G U N D E R A S I N G L E M A N A G E M E N T
ACA Research is a full-service market research consultancy, with a strong focus
on B2B projects.
Our consultants provide strategic qualitative and quantitative research
solutions to support business decision making.
Fifth Quadrant is our specialist customer experience brand providing industry analysis, benchmarking, research and
consulting services.
Our consultants work on strategic and operational projects to help clients
optimise CX delivery and reduce cost to serve.
TEG Insights is committed to delivering quality data, analytics and online
research services with access to one of Australia’s largest and most responsive online research panels. Our wide reach
includes professionals, from small business owners to executives, across a
variety of industries.
Our continued success is based on integrity and passion to ensure the best
outcomes for both our Clients and Members alike.
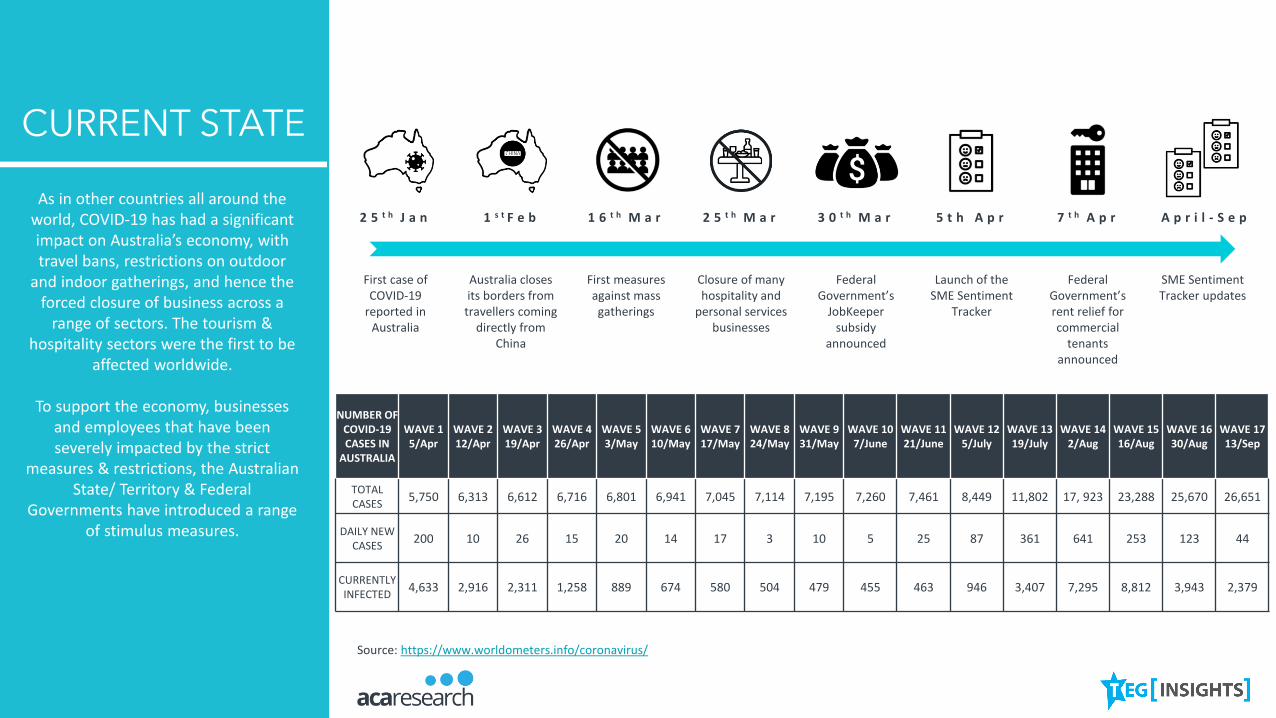
CURRENT STATE
As in other countries all around the world, COVID-19 has had a significant impact on Australia’s economy, with travel bans, restrictions on outdoor
and indoor gatherings, and hence the forced closure of business across a
range of sectors. The tourism & hospitality sectors were the first to be
affected worldwide.
To support the economy, businesses and employees that have been severely impacted by the strict
measures & restrictions, the Australian State/ Territory & Federal
Governments have introduced a range of stimulus measures.
First case of COVID-19
reported in Australia
2 5 t h J a n
Australia closes its borders from
travellers coming directly from
China
1 s t F e b
First measures against mass gatherings
1 6 t h M a r
Closure of many hospitality and
personal services businesses
2 5 t h M a r
Federal Government’s
JobKeeper subsidy
announced
3 0 t h M a r
Launch of the SME Sentiment
Tracker
5 t h A p r
Federal Government’s rent relief for commercial
tenants announced
7 t h A p r
SME Sentiment Tracker updates
A p r i l - S e p
Source: https://www.worldometers.info/coronavirus/
NUMBER OF COVID-19 CASES IN
AUSTRALIA
WAVE 1 5/Apr
WAVE 2 12/Apr
WAVE 3 19/Apr
WAVE 4 26/Apr
WAVE 5 3/May
WAVE 610/May
WAVE 717/May
WAVE 8 24/May
WAVE 9 31/May
WAVE 10 7/June
WAVE 11 21/June
WAVE 12 5/July
WAVE 13 19/July
WAVE 14 2/Aug
WAVE 15 16/Aug
WAVE 16 30/Aug
WAVE 17 13/Sep
TOTAL CASES
5,750 6,313 6,612 6,716 6,801 6,941 7,045 7,114 7,195 7,260 7,461 8,449 11,802 17, 923 23,288 25,670 26,651
DAILY NEW CASES
200 10 26 15 20 14 17 3 10 5 25 87 361 641 253 123 44
CURRENTLY INFECTED
4,633 2,916 2,311 1,258 889 674 580 504 479 455 463 946 3,407 7,295 8,812 3,943 2,379

METHODOLOGY
The COVID-19 Tracker was first launched w/e 5th April 2020.
In each wave we get minimum n=300 completed surveys.
TEG Insights ensures a consistent sample of financial decision makers and
influencers at Small and Medium Size Businesses each wave.
5-minute questionnaire All surveys completed online(TEG Insights Business Panel)
All respondents are financial decision makers/influencers in Small and Medium Businesses
with up to 500 employees
Respondents are from across Australia, including metro and
regional areas
A wide selection of industry sectors are represented, allowing
for deep dive analysis on a regular basis
Data is weighted by state and number of employees to reflect
the national distribution of businesses across the country
In summary, optimism is growing with SME decision makers feeling slightly more confident. Seemingly the second wave is under control and therefore SMEs are expecting economic activity and revenues to increase as restrictions ease and borders reopen.
However, the lack of collaboration between State and Federal Governments is not well received and hence support is dwindling. As cashflow stimulus, rental relief and JobKeeper support are all reduced or withdrawn over the short-medium term it is critical that Government leaders reunite to provide a clear pathway forward for SMEs concerned about their future.
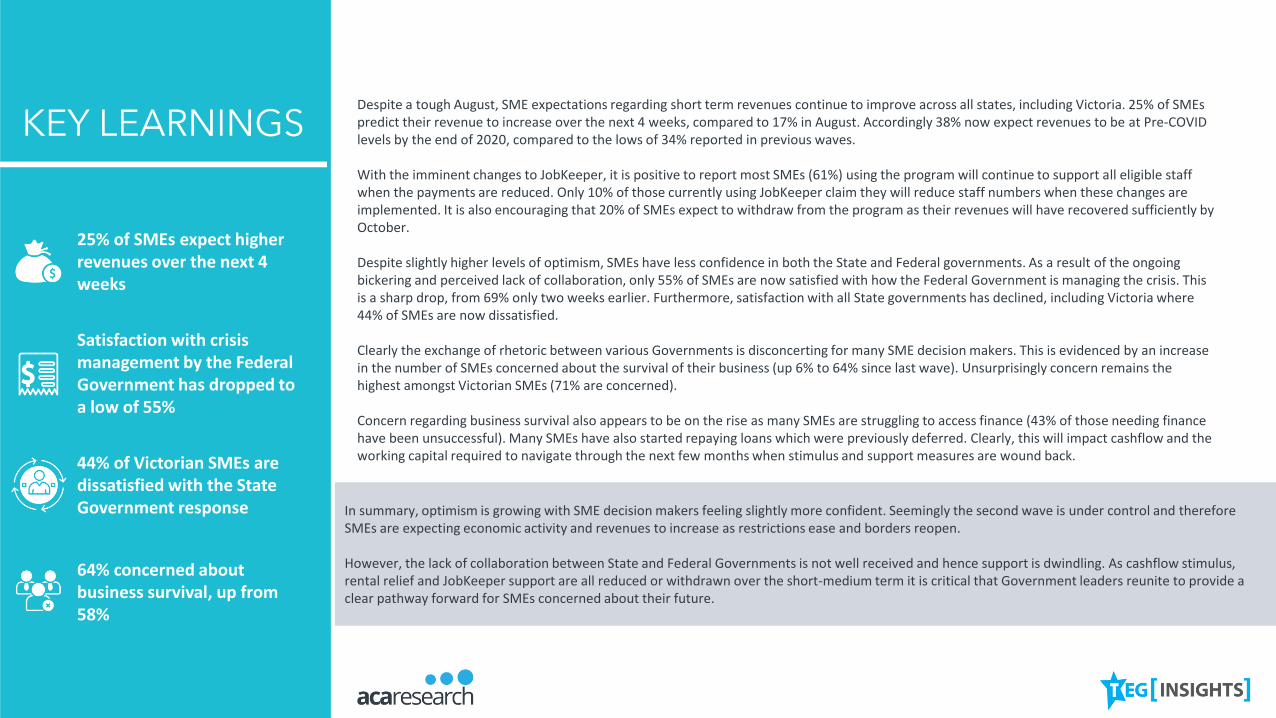
KEY LEARNINGSDespite a tough August, SME expectations regarding short term revenues continue to improve across all states, including Victoria. 25% of SMEs predict their revenue to increase over the next 4 weeks, compared to 17% in August. Accordingly 38% now expect revenues to be at Pre-COVID levels by the end of 2020, compared to the lows of 34% reported in previous waves.
With the imminent changes to JobKeeper, it is positive to report most SMEs (61%) using the program will continue to support all eligible staff when the payments are reduced. Only 10% of those currently using JobKeeper claim they will reduce staff numbers when these changes are implemented. It is also encouraging that 20% of SMEs expect to withdraw from the program as their revenues will have recovered sufficiently by October.
Despite slightly higher levels of optimism, SMEs have less confidence in both the State and Federal governments. As a result of the ongoing bickering and perceived lack of collaboration, only 55% of SMEs are now satisfied with how the Federal Government is managing the crisis. This is a sharp drop, from 69% only two weeks earlier. Furthermore, satisfaction with all State governments has declined, including Victoria where 44% of SMEs are now dissatisfied.
Clearly the exchange of rhetoric between various Governments is disconcerting for many SME decision makers. This is evidenced by an increase in the number of SMEs concerned about the survival of their business (up 6% to 64% since last wave). Unsurprisingly concern remains the highest amongst Victorian SMEs (71% are concerned).
Concern regarding business survival also appears to be on the rise as many SMEs are struggling to access finance (43% of those needing finance have been unsuccessful). Many SMEs have also started repaying loans which were previously deferred. Clearly, this will impact cashflow and the working capital required to navigate through the next few months when stimulus and support measures are wound back.
25% of SMEs expect higher revenues over the next 4 weeks
Satisfaction with crisis management by the Federal Government has dropped to a low of 55%
44% of Victorian SMEs are dissatisfied with the State Government response
64% concerned about business survival, up from 58%

C O N T E N T
H O W I S T H E C O V I D - 1 9 PA N D E M I C
I M PA C T I N G S M E s A C R O S S T H E
F O L L O W I N G A R E A S :
I M PA C T O F C O V I D - 1 9 O N R E V E N U E S1
S AT I S FA C T I O N W I T H S T I M U L U S & S U P P O R T M E A S U R E S2
T H E R E C O V E R Y3
7
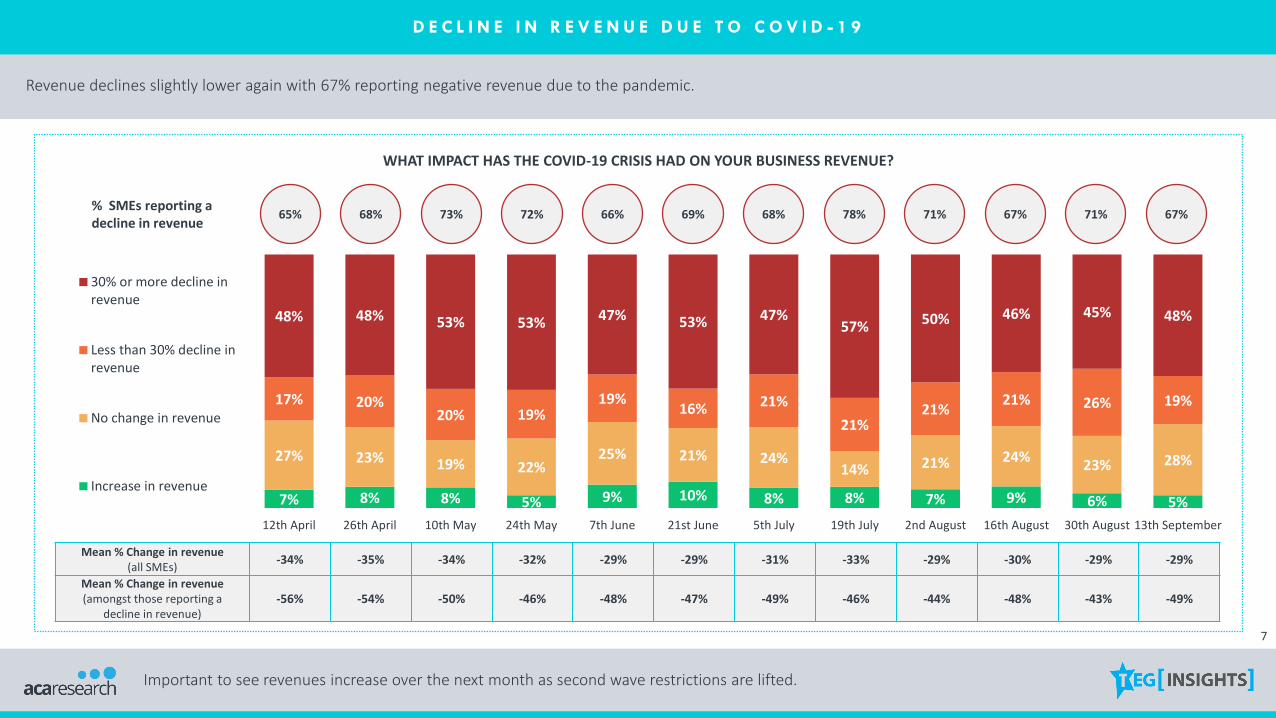
D E C L I N E I N R E V E N U E D U E T O C O V I D - 1 9
Revenue declines slightly lower again with 67% reporting negative revenue due to the pandemic.
WHAT IMPACT HAS THE COVID-19 CRISIS HAD ON YOUR BUSINESS REVENUE?
7% 8% 8% 5% 9% 10% 8% 8% 7% 9% 6% 5%
27% 23% 19% 22%25% 21% 24%
14% 21% 24%23% 28%
17% 20%20% 19%
19%16% 21%
21%21%
21% 26% 19%
48% 48% 53% 53% 47% 53% 47%57% 50% 46% 45% 48%
12th April 26th April 10th May 24th May 7th June 21st June 5th July 19th July 2nd August 16th August 30th August 13th September
30% or more decline inrevenue
Less than 30% decline inrevenue
No change in revenue
Increase in revenue
% SMEs reporting a decline in revenue
65% 68% 73% 72% 66% 69% 68% 78%
Mean % Change in revenue (all SMEs)
-34% -35% -34% -32% -29% -29% -31% -33% -29% -30% -29% -29%
Mean % Change in revenue (amongst those reporting a
decline in revenue)-56% -54% -50% -46% -48% -47% -49% -46% -44% -48% -43% -49%
71% 67% 71% 67%
Important to see revenues increase over the next month as second wave restrictions are lifted.

8
D E C L I N E I N R E V E N U E D U E T O C O V I D - 1 9 B Y S T A T E
Downward trend in VIC continues, but stronger data for WA with those reporting higher revenues continuing to climb.
WHAT IMPACT HAS THE COVID-19 CRISIS HAD ON YOUR BUSINESS REVENUE?
NSW VIC
QLD WA SA
5% 5% 5% 5% 2%15% 17% 25% 22% 25%
21% 16%18% 28% 26%
59% 62% 52% 45% 48%
19thJuly
2ndAugust
16th August
30thAugust
13thSeptember
12% 9% 10% 6% 5%
22% 17% 18% 20% 18%
23% 28% 24% 23% 25%
43% 45% 47% 50% 52%
19thJuly
2ndAugust
16th August
30thAugust
13thSeptember
9% 13% 12% 11% 7%
20% 18% 20% 16% 31%10% 11%
22% 22%17%
61% 58%47% 50% 45%
19thJuly
2ndAugust
16th August
30thAugust
13thSeptember
7% 4% 9% 11% 14%20% 17%
20% 22% 22%
41%42% 24% 17% 20%
32% 38% 48% 50% 43%
19thJuly
2ndAugust
16th August
30thAugust
13thSeptember
7% 7% 4% 5% 7%
30% 32% 30%40% 34%
16% 19% 23%27% 28%
47% 42% 43%28% 31%
19thJuly
2ndAugust
16th August
30thAugust
13thSeptember
Stronger data for WA with those reporting higher revenues climbing to 14%.

9
32%42% 45%
35%22%
35%
31%47%
27%
35% 36%
13%33%
19%
43%
27%
34%19%
31%
35%45%
35%
34%
24%
34% 27% 33%
17%31%
18%
38%
19%
22% 15% 15% 8%
12%12% 18% 30%
49%42%
50% 43%
11%23%
13% 15%6% 8% 5% 4%
Maycompared to April
Junecompared
to May
Julycompared
to June
Augustcompared
to July
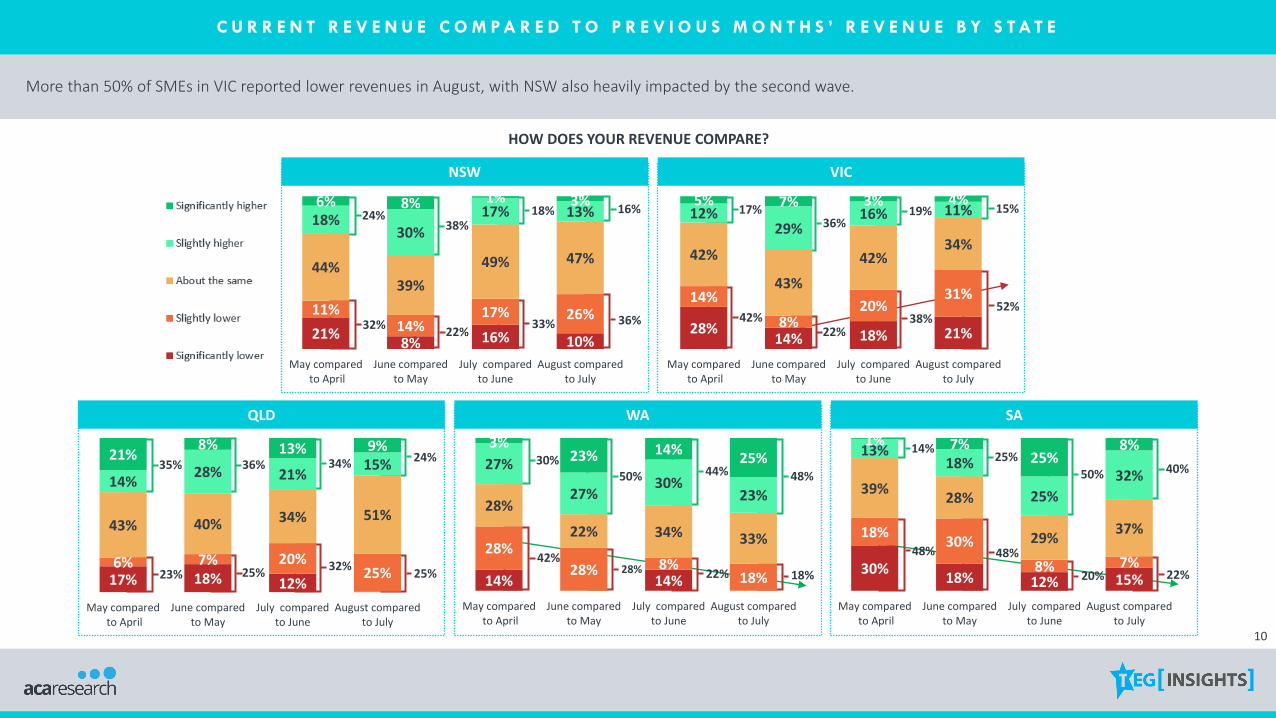
C U R R E N T R E V E N U E C O M P A R E D T O P R E V I O U S M O N T H S ’ R E V E N U E
Not surprisingly, month on month revenues declined again in August as the lockdown measures took their toll. Hopefully, this is the peak of the trend and we start to see a turnaround as restrictions are eased.
HOW DOES YOUR REVENUE COMPARE?
Businesses with 20-99 employees have been hit hard with 1 in 5 reporting significantly lower revenue in August compared to July.
< 5 EMPLOYEES
20 TO 99 EMPLOYEES
5 TO 19 EMPLOYEES
100 TO 500 EMPLOYEES
18% 14% 7% 2%
17% 22%
6% 25%
33% 22%
41%30%
25%26% 28%
37%
7% 16% 17%6%
Maycompared to April
Junecompared
to May
Julycompared
to June
Augustcompared
to July
22%6% 15% 12%
12%
13%16% 22%
31%36%
35%42%
25% 36%26% 13%
10% 9% 9% 11%
Maycompared to April
Junecompared
to May
Julycompared
to June
Augustcompared
to July
12% 5%18% 20%
23%17%
17% 13%
33%
31%
39% 47%
20%37%
23% 17%11% 10% 4% 2%
Maycompared to April
Junecompared
to May
Julycompared
to June
Augustcompared
to July
34%25%
32%
25%
37%
25%
36%
22%
21%12% 15%
10%
13%
13%17% 26%
41%
39%
43%42%
17%
28%
19% 15%
8% 9% 6% 7%
May compared to April
June comparedto May
July comparedto June
August compared to July
Significantlyhigher
Slightly higher
About the same
Slightly lower
Significantlylower
10
42%22%
38%
17%36%
19%
52%
15%24%
38%18%
32%22%
33%
16%
36%21%
8% 16% 10%
11%14%
17% 26%
44%39%
49% 47%
18%30%
17% 13%6% 8% 1% 3%
May compared to April
June comparedto May
July comparedto June
August comparedto July
C U R R E N T R E V E N U E C O M P A R E D T O P R E V I O U S M O N T H S ’ R E V E N U E B Y S T A T E
More than 50% of SMEs in VIC reported lower revenues in August, with NSW also heavily impacted by the second wave.
HOW DOES YOUR REVENUE COMPARE?
28%14% 18% 21%
14%
8%20%
31%
42%
43%
42%34%
12%29%
16% 11%5% 7% 3% 4%
May compared to April
June comparedto May
July comparedto June
August comparedto July
NSW VIC
QLD WA SA
48% 48%
20%
14%25%
50%
42%22%
30%50% 44%
28%23% 25%32%
35% 36% 34%
22%
40%
18%
48%
25%
24%
17% 18% 12%
6% 7% 20%25%
43% 40% 34% 51%
14%28% 21%
15%21%
8% 13% 9%
May compared to April
June comparedto May
July comparedto June
August comparedto July
14% 14%
28%
28% 8%18%
28%
22% 34% 33%
27%
27%30%
23%
3%23% 14%
25%
May compared to April
June comparedto May
July comparedto June
August comparedto July
30%18% 12% 15%
18%30%
8% 7%
39%28%
29%37%
13%18%
25%
32%
1% 7%25%
8%
May compared to April
June comparedto May
July comparedto June
August comparedto July

11
F U T U R E R E V E N U E E X P E C T A T I O N S
Despite a tough August, expectations regarding short term revenues continue to improve as lockdown and border restrictions are lifting.
WHERE DO YOU EXPECT YOUR REVENUE TO BE IN 4 WEEKS’ TIME, COMPARED TO TODAY?
8% 7% 5% 9% 4% 10% 9% 14% 8% 7%
21%
8% 11%9%
9%
19% 15%14%
13% 12%
48%
56%45% 46% 56%
51% 59% 55%56% 55%
20%23%
35% 33% 26%18%
16% 14% 22% 24%
3% 5% 4% 4% 5% 3% 1% 3% 1% 1%
10th May 24th May 7th June 21st June 5th July 19th July 2nd August 16th August 30th August 13th September
Significantly better
Slightly better
About the same
Slightly worse
Significantly worse
% Better 28%23% 39% 37% 31% 21% 17%
% Net score(Better - Worse)
-6% 13% 23% 19% 18% -8% -7% -11% 2% 6%
17% 23% 25%

12
25% 8% 2% 9% 22%11% 21% 28% 27% 35%11% 18% 7% 1% 1%
F U T U R E R E V E N U E E X P E C T A T I O N S B Y S T A T E
There are positive signs of stronger revenues across most states, including a significant jump in VIC.
WHERE DO YOU EXPECT YOUR REVENUE TO BE IN 4 WEEKS’ TIME, COMPARED TO TODAY?
9% -12% -11% 2% 4%% Net score -13% -35% -33% -35% -15%
3% 3% 1% 4%4% 12% 16% 15% 7%
61%62% 64% 61%
56%
28% 15% 12% 20% 33%4% 8% 7% 4%
19thJuly
2ndAugust
16thAugust
30thAugust
13thSeptember
3% 4% 9% 8% 4%9% 10% 12% 10% 15%
65% 53% 52% 63% 62%
21% 30% 26% 17% 20%2% 2% 2% 2%
19thJuly
2ndAugust
16thAugust
30thAugust
13thSeptember
4% 5% 6% 5% 5%14% 8% 4% 8% 4%
53% 54% 53% 46% 46%
27% 34% 38% 40% 44%
2%
19thJuly
2ndAugust
16thAugust
30thAugust
13thSeptember
10% 16% 22% 24% 15%22%
26% 19% 20%17%
50%50% 50% 47%
52%
16%7% 5% 6% 15%
3% 3% 3% 2%
19thJuly
2ndAugust
16thAugust
30thAugust
13thSeptember
9% 11% 9% 7% 8%13% 17% 15% 14% 13%
48%56% 64%
56% 55%
25%14% 12% 21% 24%
6% 2% 1% 2% 1%
19thJuly
2ndAugust
16thAugust
30thAugust
13thSeptember
NSW VIC
QLD WA SA

13
P E R C E N T A G E C H A N G E I N T H E N U M B E R O F S T A F F B E F O R E T H E C R I S I S V S N O W
Employee data has remained steady with one third of SMEs reporting overall declines in their staff numbers due to the pandemic.
CHANGE IN NUMBER OF EMPLOYEES SINCE THE PANDEMIC
% of SMEs reporting a decrease in the number of staff
35% 40% 33% 33% 32% 39% 34% 41%
Mean % Change in staff (all SMEs)
-18% -21% -17% -17% -14% -14% -12% -18% -13% -14% -14% -14%
Mean % Change in staff (amongst those reporting a decline
in staff)-51% -54% -54% -53% -48% -43% -40% -46% -39% -46% -46% -46%
40% 31% 34%
1% 1% 2% 2% 2% 4% 2% 2% 4% 4% 3% 2%
64% 60%65% 65% 66% 58% 64%
57% 56%65% 62% 66%
14%15%
14% 11%16%
20%20%
20% 24%18% 19% 15%
21% 25% 19% 22% 16% 19% 14%21% 16% 13% 15% 17%
12th April 26th April 10th May 24th May 7th June 21st June 5th July 19th July 2nd August 16th August 30th August 13th September
50% or more decrease inthe number of staff
Less than 50% decrease inthe number of staff
No change in the numberof staff
Increase in the number ofstaff
32%

14
P E R C E N T A G E C H A N G E I N T H E N U M B E R O F S T A F F B E F O R E T H E C R I S I S V S N O W
Despite a slight decline in employment numbers in VIC, the majority of SMEs across all states continue to keep their teams in place.
CHANGE IN NUMBER OF EMPLOYEES SINCE THE PANDEMIC
2% 2% 3% 3%
56% 49% 55% 60% 62%
24% 28%25% 22% 18%
18% 21% 16% 15% 19%
19thJuly
2ndAugust
16th August
30thAugust
13thSeptember
3% 4% 5% 4% 5%
61% 54% 57% 61% 57%
21% 23% 21% 15% 18%
16% 19% 18% 20% 21%
19thJuly
2ndAugust
16th August
30thAugust
13thSeptember
4% 4% 2% 2%
64% 65% 70% 67% 71%
15% 14% 14% 19%23%21% 17% 12% 12% 4%
19thJuly
2ndAugust
16th August
30thAugust
13thSeptember
5% 4% 6% 12% 8%
63% 67% 59% 48% 63%
21% 19% 28%29% 12%
10% 9% 6% 12% 17%
19thJuly
2ndAugust
16th August
30thAugust
13thSeptember
1% 5% 4% 1%
74% 66% 74%92% 83%
14% 15%13%
5%7%
11% 14% 8% 2% 9%
19thJuly
2ndAugust
16th August
30thAugust
13thSeptember
NSW VIC
QLD WA SA
15
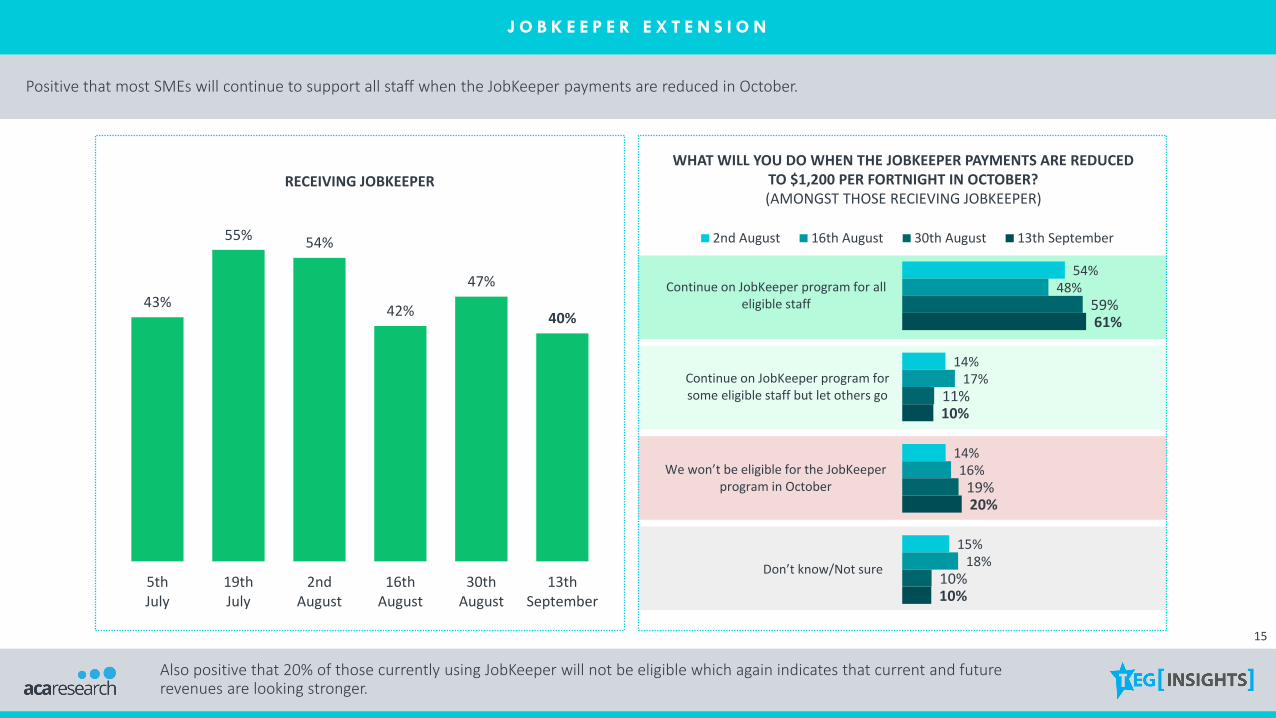
J O B K E E P E R E X T E N S I O N
Positive that most SMEs will continue to support all staff when the JobKeeper payments are reduced in October.
RECEIVING JOBKEEPER
43%
55% 54%
42%
47%
40%
5thJuly
19thJuly
2ndAugust
16thAugust
30thAugust
13thSeptember
WHAT WILL YOU DO WHEN THE JOBKEEPER PAYMENTS ARE REDUCED TO $1,200 PER FORTNIGHT IN OCTOBER? (AMONGST THOSE RECIEVING JOBKEEPER)
54%
14%
14%
15%
48%
17%
16%
18%
59%
11%
19%
10%
61%
10%
20%
10%
Continue on JobKeeper program for alleligible staff
Continue on JobKeeper program forsome eligible staff but let others go
We won’t be eligible for the JobKeeper program in October
Don’t know/Not sure
2nd August 16th August 30th August 13th September
Also positive that 20% of those currently using JobKeeper will not be eligible which again indicates that current and future revenues are looking stronger.

16
N E G A T I V E I M P A C T O F C O V I D - 1 9
In line with short term revenue expectations, we can also report more optimism regarding the longer term impact on the Australian economy and the number of staff employed by SMEs.
WHAT NEGATIVE IMPACT DO YOU THINK THE COVID-19 SITUATION WILL HAVE ON THE FOLLOWING?(W/E 13th SEPTEMBER)
3%
3%
13%
14%
30%
4%
6%
10%
16%
20%
13%
17%
19%
27%
26%
80%
74%
58%
42%
24%
Global economy
Australian economy
Salary increases
Your business spending/capitalinvestment
The number of staff you employ
No negative impact Short term impact (up to 6 months) Medium term impact (6-12 months) Long term impact (more than 12 months)
% Long term impact % Change
from last wave
W/E 21st
JuneW/E 5th
JulyW/E 19th
JulyW/E 2nd
AugustW/E 16th
AugustW/E 30th
August
77% 76% 77% 88% 73% 80% 0%
66% 69% 73% 82% 77% 82% -8%
- - - - 47% 54% +4%
29% 32% 33% 37% 43% 39% +3%
18% 16% 25% 32% 29% 27% -3%
However, the long term negative impact (more than 12 months) on wage growth continues to trend upwards.
17
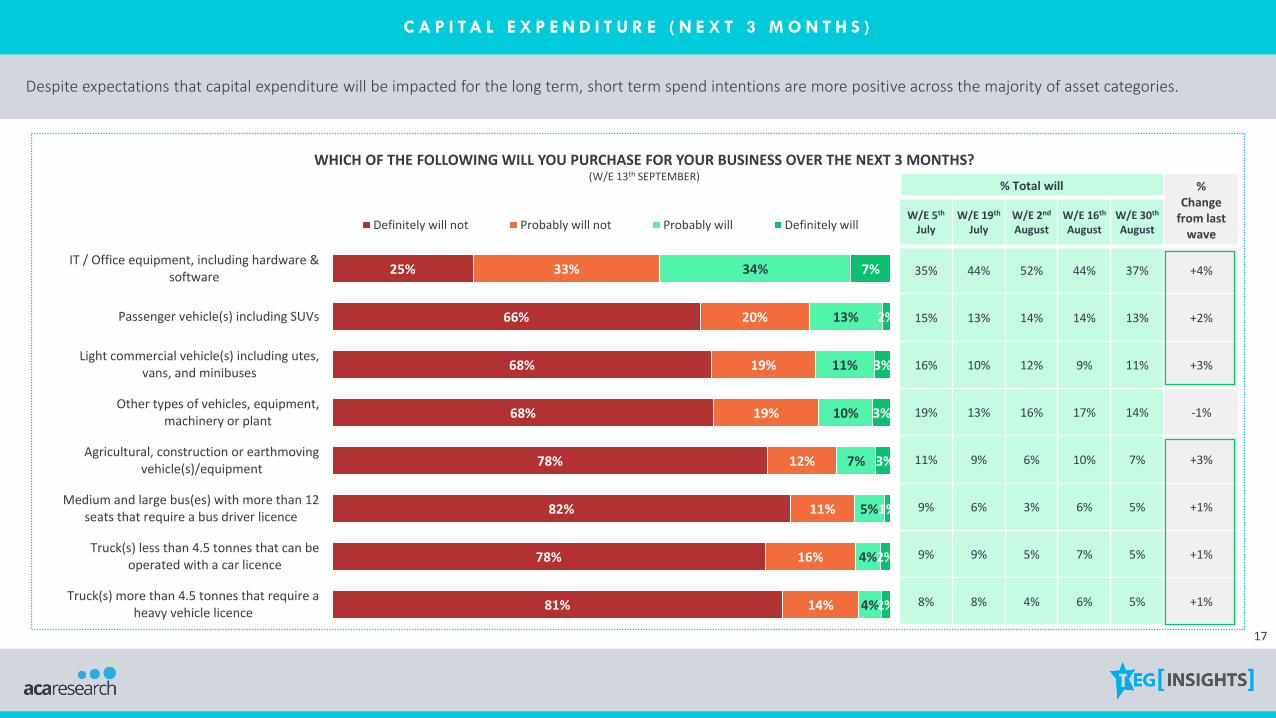
C A P I T A L E X P E N D I T U R E ( N E X T 3 M O N T H S )
Despite expectations that capital expenditure will be impacted for the long term, short term spend intentions are more positive across the majority of asset categories.
WHICH OF THE FOLLOWING WILL YOU PURCHASE FOR YOUR BUSINESS OVER THE NEXT 3 MONTHS? (W/E 13th SEPTEMBER)
25%
66%
68%
68%
78%
82%
78%
81%
33%
20%
19%
19%
12%
11%
16%
14%
34%
13%
11%
10%
7%
5%
4%
4%
7%
2%
3%
3%
3%
1%
2%
2%
IT / Office equipment, including hardware &software
Passenger vehicle(s) including SUVs
Light commercial vehicle(s) including utes,vans, and minibuses
Other types of vehicles, equipment,machinery or plant
Agricultural, construction or earthmovingvehicle(s)/equipment
Medium and large bus(es) with more than 12seats that require a bus driver licence
Truck(s) less than 4.5 tonnes that can beoperated with a car licence
Truck(s) more than 4.5 tonnes that require aheavy vehicle licence
Definitely will not Probably will not Probably will Definitely will
% Total will % Change
from last wave
W/E 5th
JulyW/E 19th
JulyW/E 2nd
AugustW/E 16th
AugustW/E 30th
August
35% 44% 52% 44% 37% +4%
15% 13% 14% 14% 13% +2%
16% 10% 12% 9% 11% +3%
19% 13% 16% 17% 14% -1%
11% 9% 6% 10% 7% +3%
9% 6% 3% 6% 5% +1%
9% 9% 5% 7% 5% +1%
8% 8% 4% 6% 5% +1%

C O N T E N T
H O W I S T H E C O V I D - 1 9 PA N D E M I C
I M PA C T I N G S M E s A C R O S S T H E
F O L L O W I N G A R E A S :
I M PA C T O F C O V I D - 1 9 O N R E V E N U E S1
S AT I S FA C T I O N W I T H S T I M U L U S & S U P P O R T M E A S U R E S2
T H E R E C O V E R Y3

19
S A T I S F A C T I O N W I T H T H E F E D E R A L G O V E R N M E N T ’ S R E S P O N S E
Support for the Federal Government has been negatively impacted by the ongoing bickering with various State Governments. Satisfaction with the overall management of the crisis has dropped to a low of 55%.
HOW SATISFIED ARE YOU WITH THE WAY THE AUSTRALIAN FEDERAL GOVERNMENT HAS MANAGED THE COVID-19 CRISIS OVERALL SO FAR?
8% 4% 5% 5% 5% 4% 4% 4% 2%8% 4%
10%
13%11% 8% 9% 9% 13%
6%11% 13%
9%6%
9%
16%
15%14%
22% 17%18%
23%22% 24% 19%
21%
26%
42% 53%
43%
41%40%
39% 46%47% 39%
39% 45%
38%
21% 17%
31%24%
29% 25% 22%16%
22% 26% 24%17%
12thApril
26thApril
10thMay
24thMay
7thJune
21stJune
5thJuly
19thJuly
2ndAugust
16thAugust
30thAugust
13thSeptember
Extremely satisfied
Somewhat satisfied
Neutral
Somewhat dissatisfied
Extremely dissatisfied
% Total satisfied 63% 70% 74% 65% 69% 64% 68% 63% 61% 65% 69% 55%

20
S A T I S F A C T I O N W I T H T H E S T A T E G O V E R N M E N T ’ S R E S P O N S E
Satisfaction with most State Governments is declining, with pressure on the VIC Government continuing to mount, with 44% of SMEs now dissatisfied.
HOW SATISFIED ARE YOU WITH THE WAY YOUR STATE GOVERNMENT HAS MANAGED THE COVID-19 CRISIS SO FAR?
3% 3% 5%3% 2%5% 9% 7%10% 5%
10%18% 18%
27% 30%36%
43%29%
56% 61%46%
28%41%
19thJuly
2ndAugust
16thAugust
30thAugust
13thSeptember
8% 4% 4% 5% 5%10% 13% 12% 7% 13%
21% 24% 25% 27%30%
46% 40% 35% 38%36%
16% 19% 24% 23% 17%
19thJuly
2ndAugust
16thAugust
30thAugust
13thSeptember
Extremely satisfied
Somewhat satisfied
Neutral
Somewhat dissatisfied
Extremely dissatisfied
3% 3% 2% 2%4% 2% 5% 8%17% 14% 16% 17% 20%23% 24% 35%
43% 38%
56% 58% 46%33% 32%
19thJuly
2ndAugust
16thAugust
30thAugust
13thSeptember
3% 9% 11%2% 8% 7% 7% 13%16% 14% 10%
15%19%
58% 54% 52%45%
39%
24% 24% 28% 24% 18%
19thJuly
2ndAugust
16thAugust
30thAugust
13thSeptember
13% 19% 23% 25% 27%13%
19% 20% 16% 17%21%19% 16% 17% 20%
33%30% 31% 31% 27%
20% 14% 10% 11% 9%
19thJuly
2ndAugust
16thAugust
30thAugust
13thSeptember
77% 87% 74% 59% 58%80% 70% 70% 53% 33%
44% 42% 43% 49% 35%% Net score 27% 6% -2% 1% -8%
75% 77% 78% 69% 60%
NSW VIC
QLD WA SA
% Net score
The ongoing negative trend in QLD will be concerning for the State Government as the election draws closer.

21
S A T I S F A C T I O N W I T H T H E C O L L A B O R A T I O N O F G O V E R N M E N T S
The lack of collaboration between State & Federal Governments is undermining the goodwill developed with SMEs throughout the pandemic. Only 36% of SMEs are now satisfied with the ongoing collaboration.
HOW SATISFIED ARE YOU WITH THE COLLABORATION BETWEEN THE AUSTRALIAN FEDERAL GOVERNMENT AND YOUR STATE GOVERNMENT WHEN IT COMES TO MANAGING THE COVID-19 CRISIS?
6% 5% 4% 7% 8% 6% 4% 5% 7% 6% 9% 11%10% 11% 14% 12% 13% 14% 13% 17% 15% 12%
20%23%
18% 19% 17%26% 21% 28%
28% 23% 25%25%
25%
31%
44% 44% 44%
39% 40% 35% 39% 40% 34% 41%
35%
29%
22% 21% 21%16% 17% 17% 16% 16% 20% 15% 11% 7%
12thApril
26thApril
10thMay
24thMay
7thJune
21stJune
5thJuly
19thJuly
2ndAugust
16thAugust
30thAugust
13thSeptember
Extremely satisfied
Somewhat satisfied
Neutral
Somewhat dissatisfied
Extremely dissatisfied
% Total satisfied 66% 65% 65% 55% 57% 52% 55% 56% 54% 56% 46% 36%

22
S U P P O R T F R O M T H E B A N K S
The level of positive sentiment towards the Banks has also continued the downward trend, with 17% now negative about the support banks are providing.
65%69%
65%62%
66%62%
68% 67% 66% 65%
10thMay
24thMay
7thJune
21stJune
5thJuly
19thJuly
2ndAugust
16thAugust
30thAugust
13thSeptember
% AWARE OF THE SUPPORT THAT BANKS ARE PROVIDING BUSINESS CUSTOMERS AFFECTED BY THE COVID-19 CRISIS
PERCEPTIONS OF SUPPORT PROVIDED BY THE BANKS TO BUSINESS CUSTOMERS (AMONGST THOSE AWARE OF BANK SUPPORT)
3% 2% 5% 2% 5% 4% 5% 3% 1% 4%10% 7%
11% 14% 6% 9% 4% 9%7%
13%
41% 41% 32% 29% 33% 36%28%
31% 34%
33%
42% 43% 45%45% 49% 44%
46%46% 50%
44%
6% 6% 7% 10% 6% 8%17%
11% 8% 6%
10thMay
24thMay
7thJune
21stJune
5thJuly
19thJuly
2ndAugust
16thAugust
30thAugust
13thSeptember
Very positive
Somewhatpositive
Neutral
Somewhatnegative
Very negative
48% 49%% Positive 52% 55% 55% 52% 63% 57% 58% 50%

23
Decreasing positive sentiment towards the Banks is probably linked to the increasing number of SMEs unable to access finance.
HAVE YOU REQUIRED ANY ADDITIONAL FINANCE SINCE THE ONSET OF THE COVID-19 CRISIS? AND WHAT IS THE PURPOSE OF THIS FINANCE?
72%
26%
13%
16%
5%
6%
74%
12%
5%
13%
10%
4%
67%
11%
13%
16%
5%
9%
62%
19%
11%
9%
6%
4%
Cashflow/ working capital
Purchase plant, machinery orequipment
Fund growth into new markets
Fund growth in Australia
Fund export growth
Fund merger/ acquisition
2nd August 16th August 30th August 13th September
23%
23%
55%
19%
23%
58%
18%
20%
62%
18%
24%
58%
Yes
No, but we mayneed in the next
6 months
No
2nd August 16th August 30th August 13th September
A D D I T I O N A L F I N A N C E
15%
17%
29%
39%
29%
26%
22%
24%
11%
21%
40%
28%
7%
5%
45%
43%
We obtained sufficientfinance
We obtained sufficientfinance for now, but will
probably need more
We obtained finance, butgot less than requested
We sought finance, butwere unsuccessful

24
L O A N D E F E R R A L
Likely that positivity towards the Banks is also impacted by SMEs having to restart payments on deferred loans.
GOVERNMENT STIMULUS AND SUPPORT MEASURES CURRENTLY USED BY THE BUSINESS:
LOAN DEFERRAL
WHAT WILL YOU DO AT THE END OF YOUR LOAN DEFERRAL PERIOD? (AMONGST THOSE UTILISING LOAN DEFERRAL)
25%
36%
23%
16%
43%
19%
12%
27%
Restart repayments in full
Ask for an extension (up to 4 months foreligible customers)
Restructure loans to reduce repayments
Don’t know/ Not sure
August September
22%
16%
August September
C O N T E N T
H O W I S T H E C O V I D - 1 9 PA N D E M I C
I M PA C T I N G S M E s A C R O S S T H E
F O L L O W I N G A R E A S :
I M PA C T O F C O V I D - 1 9 O N R E V E N U E S1
S AT I S FA C T I O N W I T H S T I M U L U S & S U P P O R T M E A S U R E S2
T H E R E C O V E R Y3

26
62%
54%
46%
37%34%
39%
34%
38%
7th June 21st June 5th July 19th July 2nd August 16th August 30th August 13th September
R E V E N U E R E T U R N I N G T O P R E - C O V I D L E V E L S B E F O R E E N D O F 2 0 2 0
Although expectations of returning to Pre-COVID revenues remain low compared to June, we would expect an upward trend moving forward if cases continue to drop and restrictions are lifted.
BUSINESS REVENUE EXPECTED TO RETURN TO PRE-COVID-19 LEVELS BY END OF 2020

27
L E V E L O F C O N C E R N A B O U T B U S I N E S S S U R V I VA L
Despite signs of positivity in this wave, 2/3s of SME decision makers remain concerned about the survival of their business.
7% 9% 10% 8% 11% 9% 14%7% 5% 7% 12% 10%
23% 22%28%
22%
32%
22%24%
20% 22%28%
30%27%
29%38%
36%42%
30%
39% 27%36% 38%
36%32%
32%
41%32%
26% 28% 27% 30% 35% 36% 35%28% 26%
32%
12thApril
26thApril
10thMay
24thMay
7thJune
21stJune
5thJuly
19thJuly
2ndAugust
16thAugust
30thAugust
13thSeptember
Very concerned
Quite concerned
Not that concerned
Not at all concerned
% Total concerned 70% 70% 62% 70% 57% 69% 62% 72% 73% 64% 58% 64%
HOW CONCERNED ARE YOU ABOUT THE SURVIVAL OF YOUR BUSINESS DUE TO THE COVID-19 CRISIS?

28
L E V E L O F C O N C E R N A B O U T B U S I N E S S S U R V I VA L
Unsurprisingly concern remains the highest for Victorian SMEs.
HOW CONCERNED ARE YOU ABOUT THE SURVIVAL OF YOUR BUSINESS DUE TO THE COVID-19 CRISIS?
8% 8% 11% 10%22% 22% 17% 19%
33% 32% 33% 31%
38% 38% 39% 40%
2nd August 16th August 30th August 13th September
6% 2% 8% 10%
26% 36%43% 42%
35%34%
32% 32%
33% 27% 17% 16%
2nd August 16th August 30th August 13th September
9% 3% 11% 14%
39%35%
34% 24%
29%36%
35%35%
23% 26% 20% 27%
2nd August 16th August 30th August 13th September
7% 8% 8% 11%15% 23% 31% 28%34%
32%32% 29%
45% 38% 29% 32%
2nd August 16th August 30th August 13th September
NSW VIC
QLD WA SA
5% 5%26% 21%
27% 31%
54% 62% 48% 41%
20% 17% 20% 23%
2nd August 16th August 30th August 13th September
% Total concerned 79% 70% 61% 61% 71% 70% 72% 71%
68% 61% 49% 48% 74% 79% 68% 64% 52% 62% 55% 62%% Total concerned
Despite ongoing contradictory commentary it is interesting to note that QLD SMEs again report the lowest levels of concern.

29
L E V E L O F C O N C E R N A B O U T P E R S O N A L W E L L B E I N G
Positive to see the ongoing downward trend in concern for personal health and wellbeing.
64% 65% 45%
HOW CONCERNED ARE YOU FOR YOUR OWN HEALTH & WELLBEING DURING THIS CRISIS?
56% 60% 56% 50% 69% 67% 69% 58%
3% 7%15% 11% 7% 7% 10%
4% 5% 9% 8% 9%
32% 27%
40%
33%34% 36%
40%
26% 28% 22%34% 36%
38%47%
35%
38% 44% 41%36%
49% 46% 48%
42% 39%
26%18%
10%18% 16% 15% 14%
20% 21% 21% 16% 15%
12thApril
26thApril
10thMay
24thMay
7thJune
21stJune
5thJuly
19thJuly
2ndAugust
16thAugust
30thAugust
13thSeptember
Very concerned
Quite concerned
Not that concerned
Not at all concerned
% Total concerned 54%

30
21%
25%
52%
57%
76%
78%
79%
75%
48%
43%
24%
22%
Join a meeting with your colleagues inperson
Join a meeting with your clients and/ orsuppliers in person
Allow your employees to travel interstatefor business if there were no travel
restrictions
Fly interstate for business if there were notravel restrictions
Allow your employees to travel overseasfor business if there were no travel
restrictions
Fly overseas for business if there were notravel restrictions
No Yes
M E E T I N G S A N D M O B I L I T Y
With the number of COVID cases dropping it is not surprising that the willingness to meet in person and travel interstate is again increasing.
WOULD YOU BE COMFORTABLE DOING THE FOLLOWING ACTIVITIES IN THE CURRENT ENVIRONMENT?(W/E 13th SEPTEMBER)
% Yes % Change
from last wave
W/E 7TH
JuneW/E 21st
JuneW/E 5th
JulyW/E 19th
JulyW/E 2nd
AugustW/E 16th
AugustW/E 30TH
August
74% 80% 80% 75% 64% 67% 75% +4%
72% 78% 73% 72% 55% 68% 67% +8%
54% 54% 54% 40% 27% 31% 34% +14%
53% 59% 57% 38% 26% 38% 35% +8%
18% 23% 34% 21% 16% 25% 21% +3%
22% 25% 33% 21% 16% 25% 21% +1%

31
P R O D U C T I V I T Y O F T E A M M E M B E R S W O R K I N G F R O M H O M E
Overall less negativity regarding WFH productivity, but smaller businesses (5-19 employees) are struggling with 44% reporting productivity is down.
HOW WOULD YOU RATE THE PRODUCTIVITY OF YOUR TEAM MEMBERS WHEN WORKING FROM HOME COMPARED TO AT THE
OFFICE/WORKPLACE?(AMONGST THOSE WHO EMPLOY STAFF)
< 5 EMPLOYEES 5 TO 19 EMPLOYEES
20 TO 99 EMPLOYEES 100 TO 500 EMPLOYEES
6% 6% 5%11%
5%
23% 24% 21%
24%
20%
46% 48%50%
49%
55%
13% 11% 14%7% 14%
12% 11% 10% 10% 7%
19thJuly
2ndAugust
16thAugust
30thAugust
13thSeptember
Much better
Slightly better
About the same
Slightly worse
Much worse
4% 5% 5% 6% 4%14% 15% 18% 19% 15%
53% 56% 54% 53% 64%
8% 10% 12% 8% 6%20% 14% 11% 13% 11%
19thJuly
2ndAugust
16thAugust
30thAugust
13thSeptember
7% 7% 5% 13% 15%
29% 31% 26%27% 29%
44% 41% 44%45% 40%
14% 12% 11%10% 13%
6% 10% 9% 5% 3%
19thJuly
2ndAugust
16thAugust
30thAugust
13thSeptember
5% 6% 11% 10% 4%
31% 30% 25% 25% 27%
32% 33% 34% 33% 41%
21% 20% 19% 19% 16%
11% 11% 11% 12% 10%
19thJuly
2ndAugust
16thAugust
30thAugust
13thSeptember
4% 4% 2%
31% 27%18% 20% 26%
26% 34%43% 42%
43%
27% 19% 16% 20%21%
11% 16% 19% 17% 10%
19thJuly
2ndAugust
16thAugust
30thAugust
13thSeptember

C O N T E N T
A P P E N D I X :
M E T H O D O L O G Y & S A M P L E
A B O U T A C A R E S E A R C H & F I F T H Q U A D R A N T
1
2

METHODOLOGY
The COVID-19 Tracker was first launched w/e 5th April 2020.
In each wave we get minimum n=300 completed surveys.
TEG Insights ensures a consistent sample of financial decision makers and
influencers at Small and Medium Size Businesses each wave.
5-minute questionnaire All surveys completed online(TEG Insights Business Panel)
All respondents are financial decision makers/influencers in Small and Medium Businesses
with up to 500 employees
Respondents are from across Australia, including metro and
regional areas
A wide selection of industry sectors are represented, allowing
for deep dive analysis on a regular basis
Data is weighted by state and number of employees to reflect
the national distribution of businesses across the country
34
9%
5%
5%
5%
2%
2%
12%
4%
8%
7%
8%
3%
1%
5%
4%
2%
11%
8%
Professional, Scientific & Technical Services
Administrative & Support Services
Information, Media & Telecommunications
Financial & Insurance Services
Rental, Hiring & Real Estate
Other services
Retail Trade
Arts & Recreation Services
Healthcare & Social Assistance
Education & Training
Manufacturing
Agriculture, Forestry & Fishing
Mining
Transport, Postal & Warehousing
Wholesale Trade
Electricity, Gas, Water & Waste Services
Construction
Accommodation & Food
O U R S A M P L E
We targeted SMEs across all sizes and industry sectors.
Data was weighted by size to reflect the distribution by the number of employees.
SIZE OF BUSINESS: EMPLOYEES INDUSTRY SECTOR
36%
22%
15%
9%
18%
Less than 5 employees
5-19 employees
20-49 employees
50-99 employees
100- 500 employees
22%
22%
24%
24%
9%
Less than $100k
$100k to $500k
$500k to $2M
$2M to $20M
$20M or more
SIZE OF BUSINESS: TURNOVER
16% RETAIL TRADE
28% SERVICES
8% HOSPITALITY
15% HEALTH & EDUCATION
12% PRODUCTION
10% DISTRIBUTION
NOTE: CHARTS SHOW UNWEIGHTED DATA
11% CONSTRUCTION

35
O U R S A M P L E
Key decision makers and influencers at SMEs across all states and territories responded to the survey, including metro and regional areas.
Data was also weighted by state to reflect the distribution of SMEs across the country.
HEAD OFFICE LOCATION POSITION IN BUSINESS
50%
17%
16%
12%
6%
Business Owner/ Partner
CFO/ Financial Controller
CEO/ Managing Director
Other Manager/ Executive
Other (e.g. admin)
QLD15%
WA10%
SA/NT9%
NSW/ACT36%
VIC/TAS31%
19%
81%
METRO
REGIONAL
NOTE: CHARTS SHOW UNWEIGHTED DATA
C O N T E N T
A P P E N D I X :
M E T H O D O L O G Y & S A M P L E
A B O U T A C A R E S E A R C H & F I F T H Q U A D R A N T
1
2

O U R P R O M I S E T O C L I E N T S
Providing meaningful insight to allow you to make informed business decisions that drive
growth, competitive advantage and productivity
W E H E L P O U R C L I E N T S M A K E I N F O R M E D
B U S I N E S S D E C I S I O N S
T O E X E C U T E C U S T O M I S E D R E S E A R C H
A N D C O N S U L T I N G P R O G R A M S
B Y L E V E R A G I N G O U R S P E C I A L I S T
C A P A B I L I T I E S
T O D E L I V E R A C T I O N A B L E
R E C O M M E N D A T I O N S A N D A D V I C E
Leveraging our deep industry expertise and customer
experience specialisation to drive better outcomes for your business,
customers, employees, business partners, shareholders and the
community
Working in partnership with you to design and deliver research & consulting programs aligned to
your individual needs
Helping you achieve your goals by delivering pragmatic, actionable recommendations and strategic
advice

O U R R E S E A R C H F R A M E W O R K
W e d e l i v e r i n s i g h t s t h r o u g h o u t t h e c u s t o m e r j o u r n e y e n a b l i n g y o u t o …

T H A N K Y O U !
F O R F U R T H E R I N F O R M A T I O N , P L E A S E C O N T A C T :
J A M E S O R G A N , M A N A G I N G D I R E C T O RA C A R E S E A R C H & F I F T H Q U A D R A N T
E : j o r g a n @ a c a r e s e a r c h . c o m . a u
L I S A S A L A S , H E A D O F C O M M E R C I A LT E G I N S I G H T S
E : l i s a . s a l a s @ t e g i n s i g h t s . c o m


