THIS PRESENTATION IS NOT AND DOES NOT FORM PART OF ANY OFFER, INVITATION OR RECOMMENDATION IN RESPECT OF SECURITIES. ANY DECISION TO BUY OR SELL BLUESCOPE STEEL LIMITED SECURITIES OR OTHER PRODUCTS SHOULD BE MADE ONLY AFTER SEEKING APPROPRIATE FINANCIAL ADVICE. RELIANCE SHOULD NOT BE PLACED ON INFORMATION OR OPINIONS CONTAINED IN THIS PRESENTATION AND, SUBJECT ONLY TO ANY LEGAL OBLIGATION TO DO SO, BLUESCOPE STEEL DOES NOT ACCEPT ANY OBLIGATION TO CORRECT OR UPDATE THEM. THIS PRESENTATION DOES NOT TAKE INTO CONSIDERATION THE INVESTMENT OBJECTIVES, FINANCIAL SITUATION OR PARTICULAR NEEDS OF ANY PARTICULAR INVESTOR.
THIS PRESENTATION CONTAINS CERTAIN FORWARD-LOOKING STATEMENTS, WHICH CAN BE IDENTIFIED BY THE USE OF FORWARD-LOOKING TERMINOLOGY SUCH AS “MAY”, “WILL”, “SHOULD”, “EXPECT”, “INTEND”, “ANTICIPATE”, “ESTIMATE”, “CONTINUE”, “ASSUME” OR “FORECAST” OR THE NEGATIVE THEREOF OR COMPARABLE TERMINOLOGY. THESE FORWARD-LOOKING STATEMENTS INVOLVE KNOWN AND UNKNOWN RISKS, UNCERTAINTIES AND OTHER FACTORS WHICH MAY CAUSE OUR ACTUAL RESULTS, PERFORMANCE AND ACHIEVEMENTS, OR INDUSTRY RESULTS, TO BE MATERIALLY DIFFERENT FROM ANY FUTURE RESULTS, PERFORMANCES OR ACHIEVEMENTS, OR INDUSTRY RESULTS, EXPRESSED OR IMPLIED BY SUCH FORWARD-LOOKING STATEMENTS.
TO THE FULLEST EXTENT PERMITTED BY LAW, BLUESCOPE STEEL AND ITS AFFILIATES AND THEIR RESPECTIVE OFFICERS, DIRECTORS, EMPLOYEES AND AGENTS, ACCEPT NO RESPONSIBILITY FOR ANY INFORMATION PROVIDED IN THIS PRESENTATION, INCLUDING ANY FORWARD LOOKING INFORMATION, AND DISCLAIM ANY LIABILITY WHATSOEVER (INCLUDING FOR NEGLIGENCE) FOR ANY LOSS HOWSOEVER ARISING FROM ANY USE OF THIS PRESENTATION OR RELIANCE ON ANYTHING CONTAINED IN OR OMITTED FROM IT OR OTHERWISE ARISING IN CONNECTION WITH THIS.
AUTHORISED FOR RELEASE BY MARK VASSELLA, MANAGING DIRECTOR & CHIEF EXECUTIVE OFFICER OF BLUESCOPE STEEL LIMITED
BlueScope Contact: Don Watters, Treasurer & Head of Investor RelationsP +61 3 9666 4206 E [email protected]
IMPORTANT NOTICE
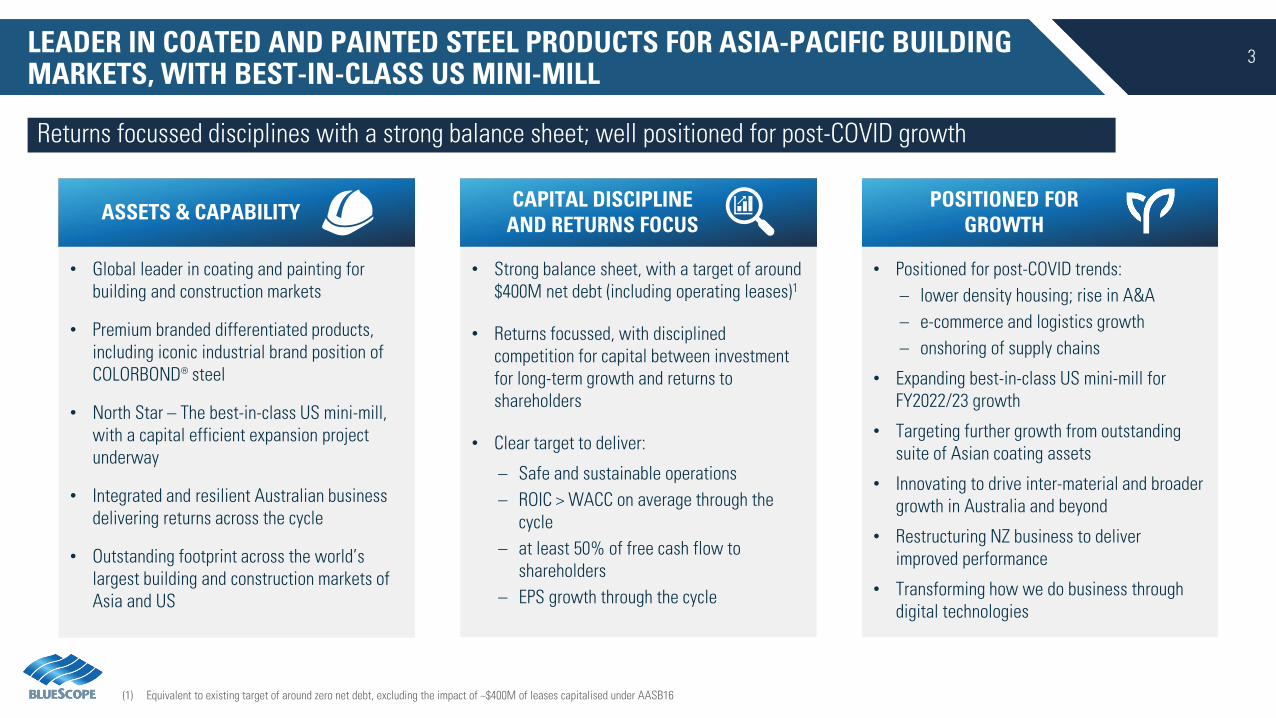
3LEADER IN COATED AND PAINTED STEEL PRODUCTS FOR ASIA-PACIFIC BUILDING MARKETS, WITH BEST-IN-CLASS US MINI-MILL
Returns focussed disciplines with a strong balance sheet; well positioned for post-COVID growth
(1) Equivalent to existing target of around zero net debt, excluding the impact of ~$400M of leases capitalised under AASB16
CAPITAL DISCIPLINE AND RETURNS FOCUS
• Strong balance sheet, with a target of around $400M net debt (including operating leases)1
• Returns focussed, with disciplined competition for capital between investment for long-term growth and returns to shareholders
• Clear target to deliver:
– Safe and sustainable operations– ROIC > WACC on average through the
cycle– at least 50% of free cash flow to
shareholders– EPS growth through the cycle
ASSETS & CAPABILITY
• Global leader in coating and painting for building and construction markets
• Premium branded differentiated products, including iconic industrial brand position of COLORBOND® steel
• North Star – The best-in-class US mini-mill, with a capital efficient expansion project underway
• Integrated and resilient Australian business delivering returns across the cycle
• Outstanding footprint across the world’s largest building and construction markets of Asia and US
POSITIONED FOR GROWTH
• Positioned for post-COVID trends:– lower density housing; rise in A&A– e-commerce and logistics growth – onshoring of supply chains
• Expanding best-in-class US mini-mill for FY2022/23 growth
• Targeting further growth from outstanding suite of Asian coating assets
• Innovating to drive inter-material and broader growth in Australia and beyond
• Restructuring NZ business to deliver improved performance
• Transforming how we do business through digital technologies
4
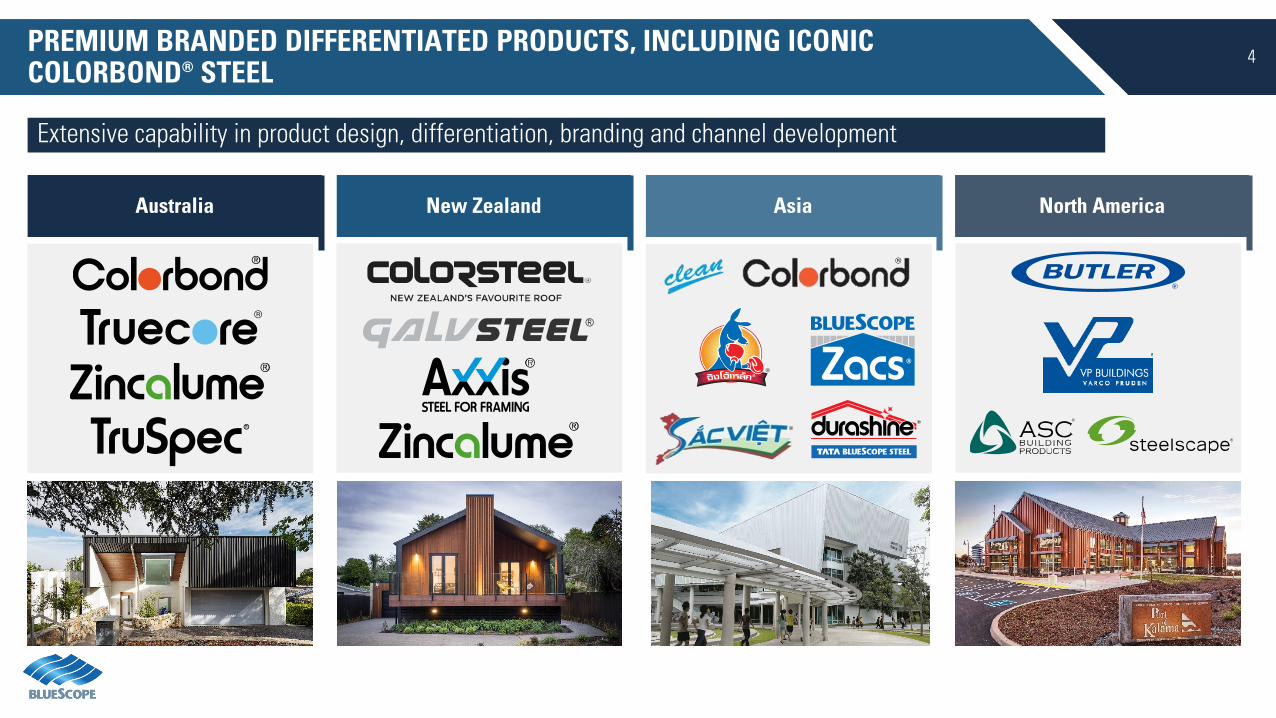
Australia
PREMIUM BRANDED DIFFERENTIATED PRODUCTS, INCLUDING ICONIC COLORBOND® STEEL
Extensive capability in product design, differentiation, branding and channel development
New Zealand Asia North America
®
®
®
®
®
®
®
5
Aesthetically appealing products, providing extreme durability whilst also offering superior design flexibility
A WIDE RANGE OF WORLD CLASS METALLIC COATED AND PAINTED PRODUCTS
6
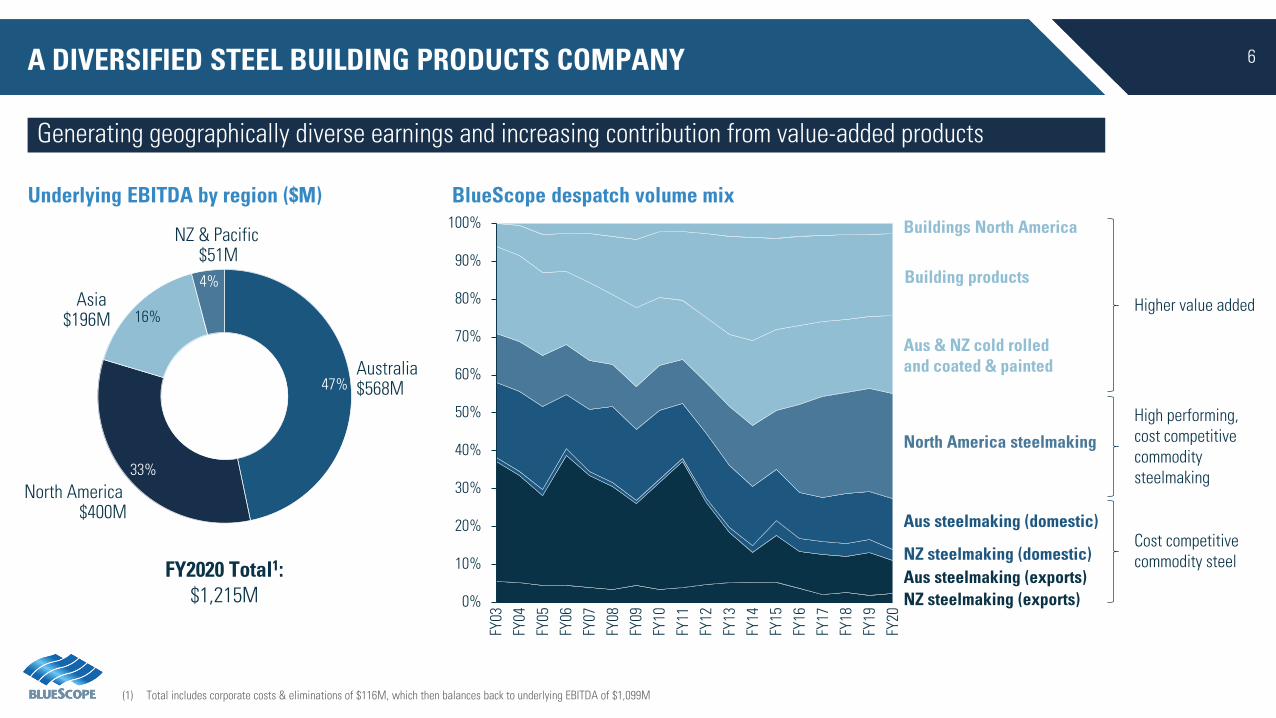
47%
33%
16%
4%Asia
$196M
Australia $568M
North America $400M
NZ & Pacific $51M
A DIVERSIFIED STEEL BUILDING PRODUCTS COMPANY
Generating geographically diverse earnings and increasing contribution from value-added products
(1) Total includes corporate costs & eliminations of $116M, which then balances back to underlying EBITDA of $1,099M
Underlying EBITDA by region ($M) BlueScope despatch volume mix
High performing,cost competitivecommoditysteelmaking
Cost competitivecommodity steel
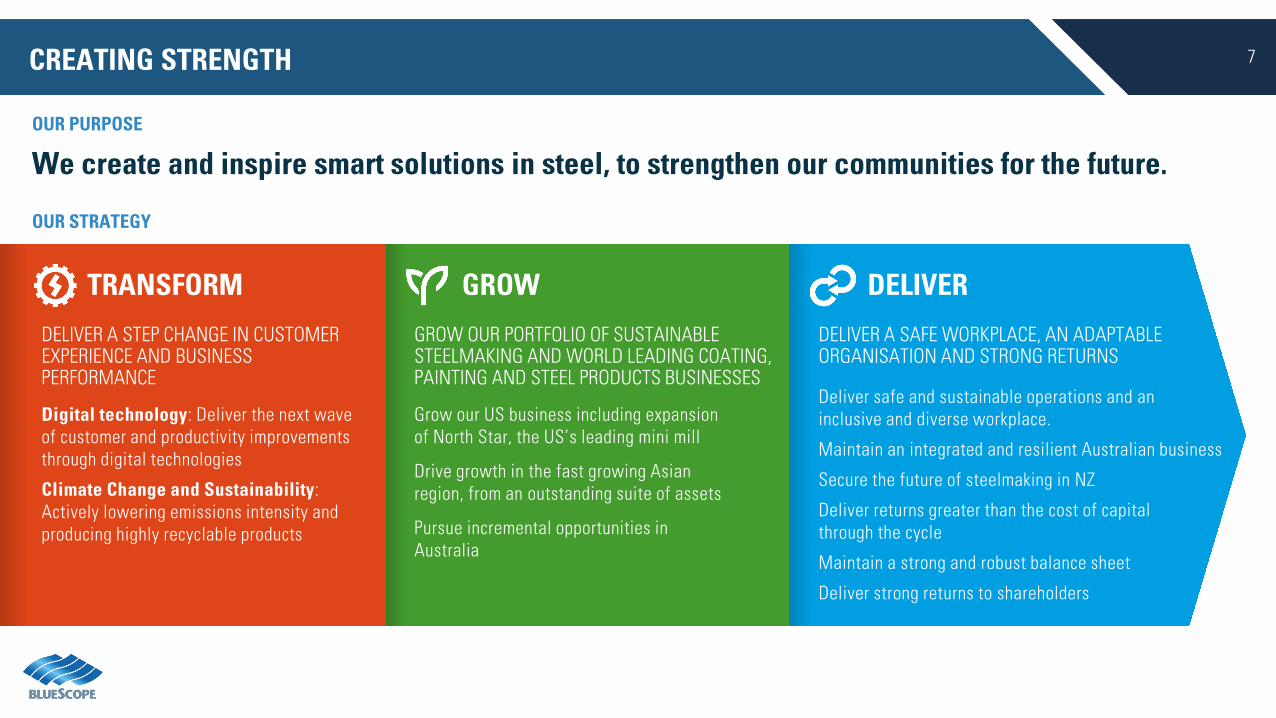
7CREATING STRENGTH
We create and inspire smart solutions in steel, to strengthen our communities for the future.OUR PURPOSE
OUR STRATEGY
TRANSFORM
DELIVER A STEP CHANGE IN CUSTOMER EXPERIENCE AND BUSINESS PERFORMANCE
Digital technology: Deliver the next wave of customer and productivity improvements through digital technologies
Climate Change and Sustainability: Actively lowering emissions intensity and producing highly recyclable products
GROW
GROW OUR PORTFOLIO OF SUSTAINABLE STEELMAKING AND WORLD LEADING COATING, PAINTING AND STEEL PRODUCTS BUSINESSES
Grow our US business including expansion of North Star, the US’s leading mini mill
Drive growth in the fast growing Asian region, from an outstanding suite of assets
Pursue incremental opportunities in Australia
DELIVER
DELIVER A SAFE WORKPLACE, AN ADAPTABLE ORGANISATION AND STRONG RETURNS
Deliver safe and sustainable operations and an inclusive and diverse workplace.
Maintain an integrated and resilient Australian business
Secure the future of steelmaking in NZ
Deliver returns greater than the cost of capital through the cycle
Maintain a strong and robust balance sheet
Deliver strong returns to shareholders
8FINANCIAL FRAMEWORK UNDERPINNING RESILIENCE
Maintaining commitment to a strong balance sheet and disciplined capital allocation
(1) Equivalent to existing target of around zero net debt, excluding the impact of ~$400M of leases capitalised under AASB16(2) On-market buy-backs are an effective method of returning capital to shareholders after considering various alternatives and given BlueScope’s lack of franking capacity. Given large capex program in FY2021 for North Star expansion and uncertain market
conditions, there is currently no active buy-back program.
RETURNS FOCUS
ROIC > WACC on average through the cycle
ROIC incentives for management and employees
Maximise free cash flow generation
OPTIMAL CAPITAL STRUCTURE
Strong balance sheet, with a target of around $400M net debt (including operating leases)1
Retain strong credit metrics
Intent to have financial capacity through the cycle to make opportunistic investments or to fund reinvestment in or a shutdown of steelmaking if not cash positive
Leverage for M&A if accompanied by active debt reduction program
DISCIPLINEDCAPITAL ALLOCATION
Invest to maintain safe and reliable operations, and in foundation and new technologies
Returns-focussed process with disciplined competition for capital between:
Growth capital• Investments• M&A (avoid top of the cycle)
Shareholder returns• Distribute at least 50% of free cash flow to
shareholders in the form of consistent dividends and on-market buy-backs2
1 2 3
9
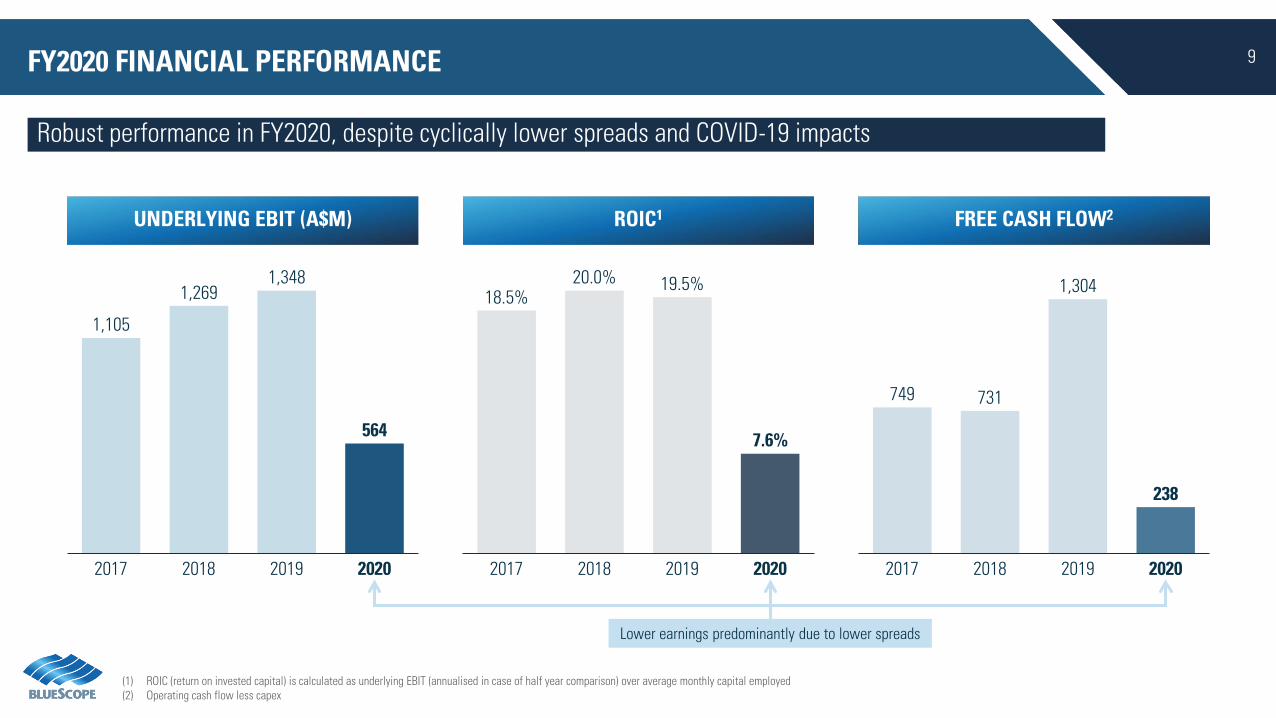
UNDERLYING EBIT (A$M) FREE CASH FLOW2ROIC1
(1) ROIC (return on invested capital) is calculated as underlying EBIT (annualised in case of half year comparison) over average monthly capital employed(2) Operating cash flow less capex
Robust performance in FY2020, despite cyclically lower spreads and COVID-19 impacts
FY2020 FINANCIAL PERFORMANCE
1,105
1,2691,348
564
20202017 2018 2019
18.5%20.0% 19.5%
7.6%
2017 2018 2019 2020
749 731
1,304
238
2017 20192018 2020
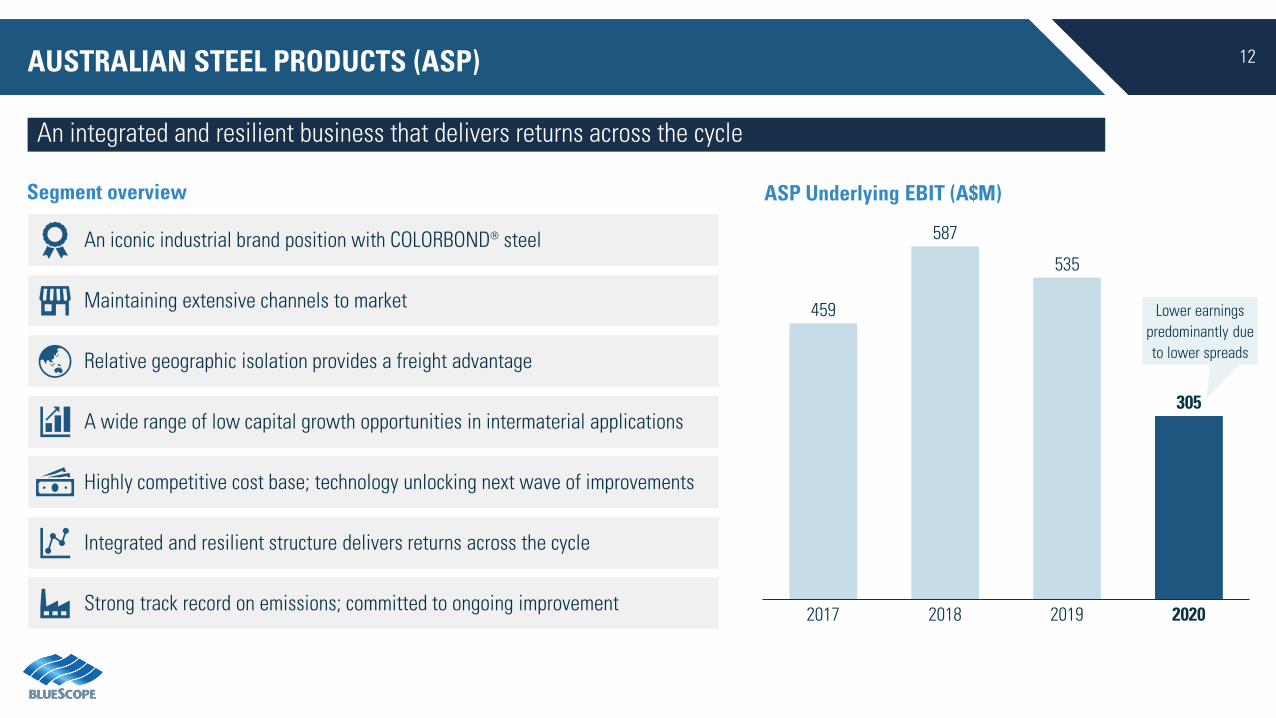
Lower earnings predominantly due to lower spreads
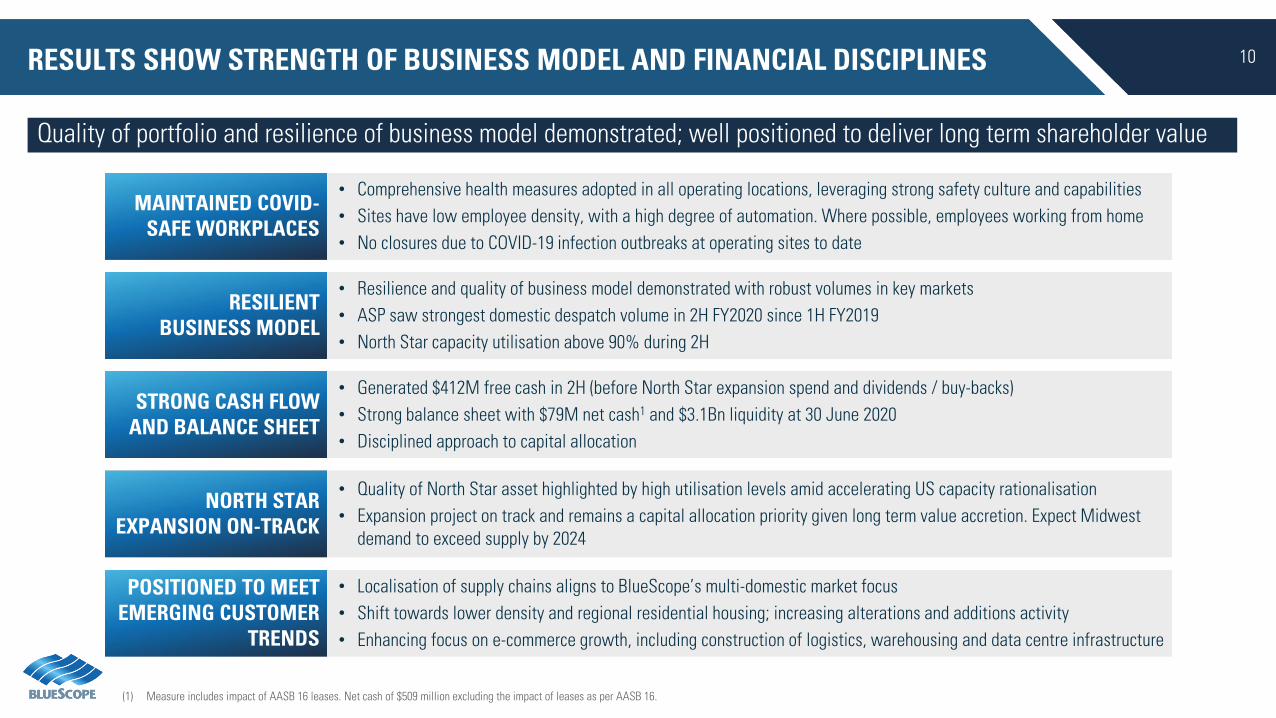
10RESULTS SHOW STRENGTH OF BUSINESS MODEL AND FINANCIAL DISCIPLINES
Quality of portfolio and resilience of business model demonstrated; well positioned to deliver long term shareholder value
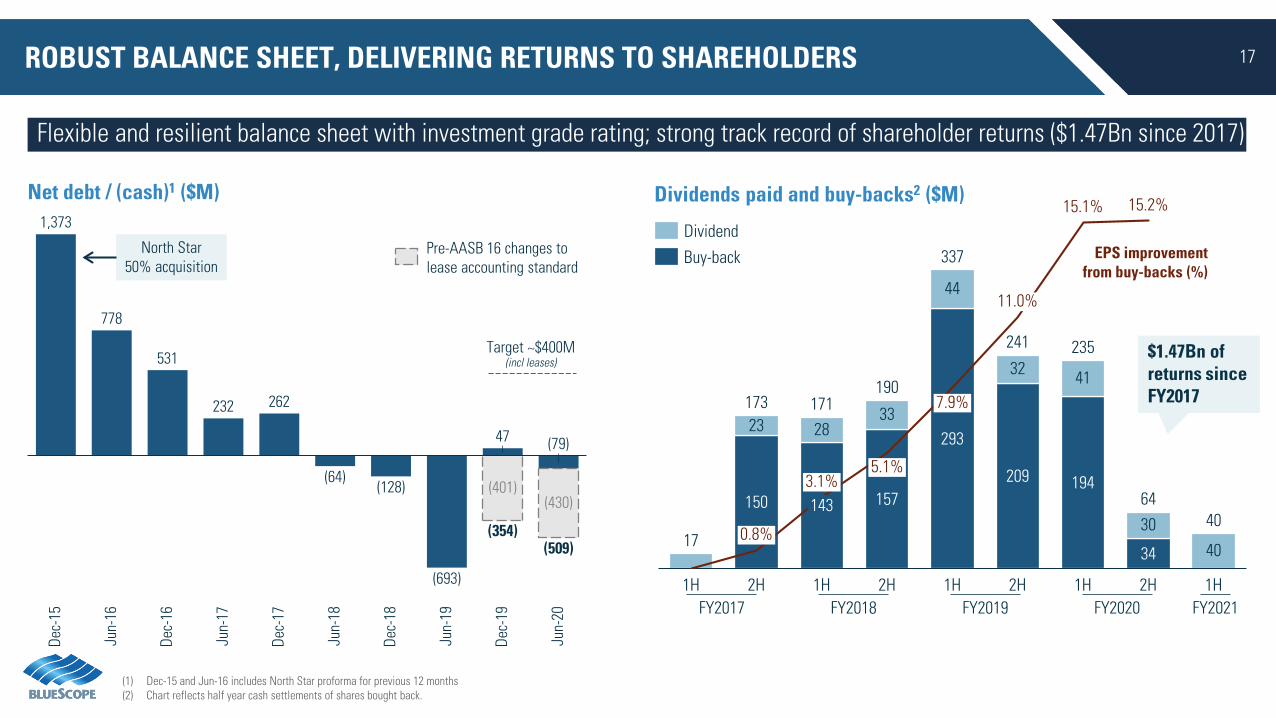
(1) Measure includes impact of AASB 16 leases. Net cash of $509 million excluding the impact of leases as per AASB 16.
• Comprehensive health measures adopted in all operating locations, leveraging strong safety culture and capabilities• Sites have low employee density, with a high degree of automation. Where possible, employees working from home• No closures due to COVID-19 infection outbreaks at operating sites to date
• Resilience and quality of business model demonstrated with robust volumes in key markets• ASP saw strongest domestic despatch volume in 2H FY2020 since 1H FY2019• North Star capacity utilisation above 90% during 2H
• Generated $412M free cash in 2H (before North Star expansion spend and dividends / buy-backs)• Strong balance sheet with $79M net cash1 and $3.1Bn liquidity at 30 June 2020 • Disciplined approach to capital allocation
• Quality of North Star asset highlighted by high utilisation levels amid accelerating US capacity rationalisation• Expansion project on track and remains a capital allocation priority given long term value accretion. Expect Midwest
demand to exceed supply by 2024
• Localisation of supply chains aligns to BlueScope’s multi-domestic market focus• Shift towards lower density and regional residential housing; increasing alterations and additions activity• Enhancing focus on e-commerce growth, including construction of logistics, warehousing and data centre infrastructure
MAINTAINED COVID-SAFE WORKPLACES
RESILIENTBUSINESS MODEL
STRONG CASH FLOW AND BALANCE SHEET
NORTH STAR EXPANSION ON-TRACK
POSITIONED TO MEET EMERGING CUSTOMER
TRENDS
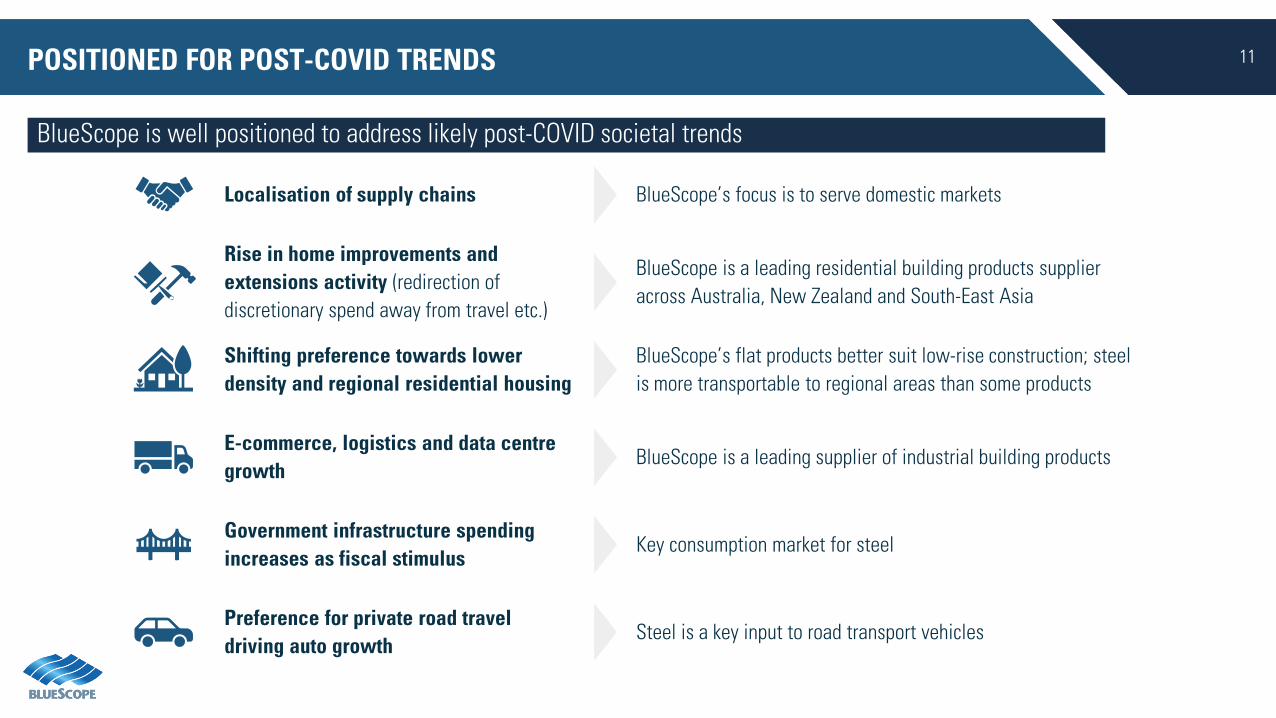
11POSITIONED FOR POST-COVID TRENDS
BlueScope is well positioned to address likely post-COVID societal trends
BlueScope’s focus is to serve domestic marketsLocalisation of supply chains
Key consumption market for steelGovernment infrastructure spending increases as fiscal stimulus
BlueScope’s flat products better suit low-rise construction; steel is more transportable to regional areas than some products
Shifting preference towards lower density and regional residential housing
Steel is a key input to road transport vehiclesPreference for private road travel driving auto growth
BlueScope is a leading supplier of industrial building productsE-commerce, logistics and data centre growth
BlueScope is a leading residential building products supplier across Australia, New Zealand and South-East Asia
Rise in home improvements and extensions activity (redirection of discretionary spend away from travel etc.)
12
Segment overview
An integrated and resilient business that delivers returns across the cycle
AUSTRALIAN STEEL PRODUCTS (ASP)
ASP Underlying EBIT (A$M)
An iconic industrial brand position with COLORBOND® steel
Maintaining extensive channels to market
Relative geographic isolation provides a freight advantage
A wide range of low capital growth opportunities in intermaterial applications
Highly competitive cost base; technology unlocking next wave of improvements
Integrated and resilient structure delivers returns across the cycle
Strong track record on emissions; committed to ongoing improvement
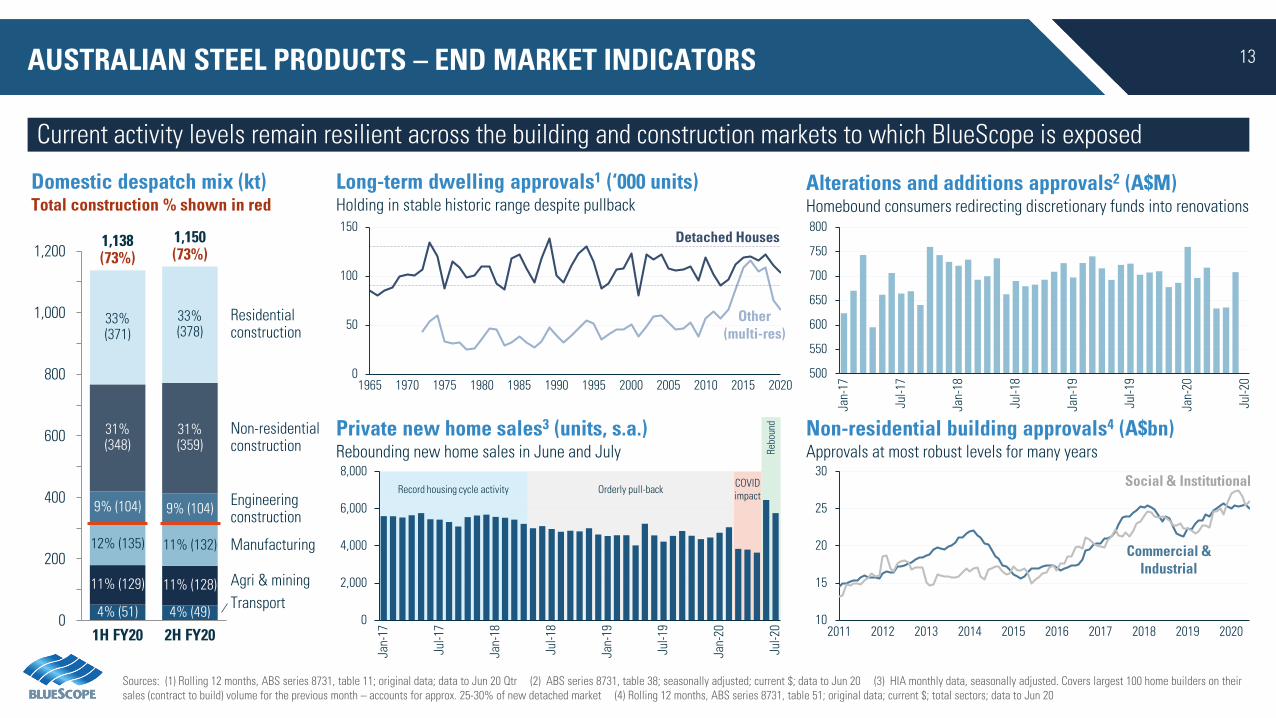
Sources: (1) Rolling 12 months, ABS series 8731, table 11; original data; data to Jun 20 Qtr (2) ABS series 8731, table 38; seasonally adjusted; current $; data to Jun 20 (3) HIA monthly data, seasonally adjusted. Covers largest 100 home builders on their sales (contract to build) volume for the previous month – accounts for approx. 25-30% of new detached market (4) Rolling 12 months, ABS series 8731, table 51; original data; current $; total sectors; data to Jun 20
Current activity levels remain resilient across the building and construction markets to which BlueScope is exposed
AUSTRALIAN STEEL PRODUCTS – END MARKET INDICATORS
Alterations and additions approvals2 (A$M)Homebound consumers redirecting discretionary funds into renovations
Private new home sales3 (units, s.a.)Rebounding new home sales in June and July
Long-term dwelling approvals1 (‘000 units)Holding in stable historic range despite pullback
Non-residential building approvals4 (A$bn)Approvals at most robust levels for many years
Detached Houses
Other (multi-res)
Social & Institutional
Commercial & Industrial
Domestic despatch mix (kt)Total construction % shown in red
200
0
1,000
400
1,200
600
800
9% (104)
1,138(73%)
11% (128)
33%(371)
31%(348)
9% (104)
33%(378)
12% (135)
11% (129)
4% (51)
1H FY20
31%(359)
Non-residentialconstruction
11% (132)
4% (49)
Manufacturing
Residentialconstruction
2H FY20
Engineeringconstruction
Agri & miningTransport
1,150(73%)
14
GFC COVID-19
NORTH STAR – AN ADVANTAGED ‘BEST-IN-CLASS’ ASSET
Strong EBITDA and cash generation through the cycle; industry leading margins and utilisation
(1) US Midwest mini-mill HRC spread (metric) – based on CRU Midwest HRC price (assuming illustrative one month lag), SBB #1 busheling scrap price (assuming one month lag) and Fastmarkets NOLA pig iron price (assuming two month lag); assumes raw material indicative usage of 1.1t per output tonne. Note, North Star sales mix has longer lags.
(2) Capex is presented on an accrual basis, and as such excludes movements in capital creditors.(3) Reflects CY2019 North Star underlying EBIT margin. Peer margin data sourced from company information, simple average of three BOF and three EAF North American peers using relevant segment information(4) Source: CRU, AISI, company data
Moved to 100% ownership of
North Star during
1H FY16
Impact of GFC on volume, and NRV impact on pig iron holdings (US$56M)
U.S. mini-mill spread
EBITDA (100% basis)
Cash flow (EBITDA less capex)2
EBIT margins3 (%)11.1%
9.8%
-1.2%EAF PeersNorth Star BF Peers
US$M EBITDA and spread (100% basis)1
20%
40%
60%
80%
100%
2006
North Star
20122008 2010 2014
Total US
2016 2018
US steel mill capacity utilisation4 (%)
Jan-20 Apr-20
Excludes North Star expansion CAPEX
71
12 4
9915
1
138
92
157
154
87
6312
7
23
(104
)25
83
16
132
66
100
7881 10
2 114 13
1
74 6599
180
168
135
240
320
194
102
737112 4
97
150
137
91
156
153
87
6112
7
21
(105
)24
83
14
130
61
94
66 71
92 108 117
63 54
89
164
156
122
232
310
175
90
58
244
309 325 332296
313343
249218
364
263
219171
326
195247 257
233 248278
295
221
253
340 324
434
524
374
276300
0
600
500
-100
100
200
400
1H06
1H20
2H19
2H15
1H14
2H06
1H17
1H09
2H05
1H03
138
1H07
2H03
133
1H10
1H04
2H04
1H05
2H07
1H08
304
2H08
2H09
288
1H13
2H10
215
1H11
2H11
1H12
2H12
2H13
2H14
1H15
250
1H19
285
1H16
2H16
2H17
1H18
2H18
2H20
15
• With a strong balance sheet, executing this highly value-accretive project remains a priority
• Development was rescheduled in April to minimise near term cash spend whilst maintaining core program activities
– No impact to overall project budget – Now targeting commissioning during the June 2022 half year; full ramp-up approximately 18
months later
• Over the last six months: – Maintained a strong safety performance with no lost time injuries– Design engineering has progressed significantly– Civil and buildings works have progressed on schedule, including the melt shop building
extension and new equipment foundations– Expect to begin receiving key plant and equipment including melt shop in 1H FY2021
• Total of US$133M spent to 30 June 2020; approximately US$570M remaining to be spent
NORTH STAR EXPANSION PROGRESSING WELL – INVESTING IN QUALITY GROWTH
Significant project for BlueScope; remains on-budget and set for commissioning during the June 2022 half year
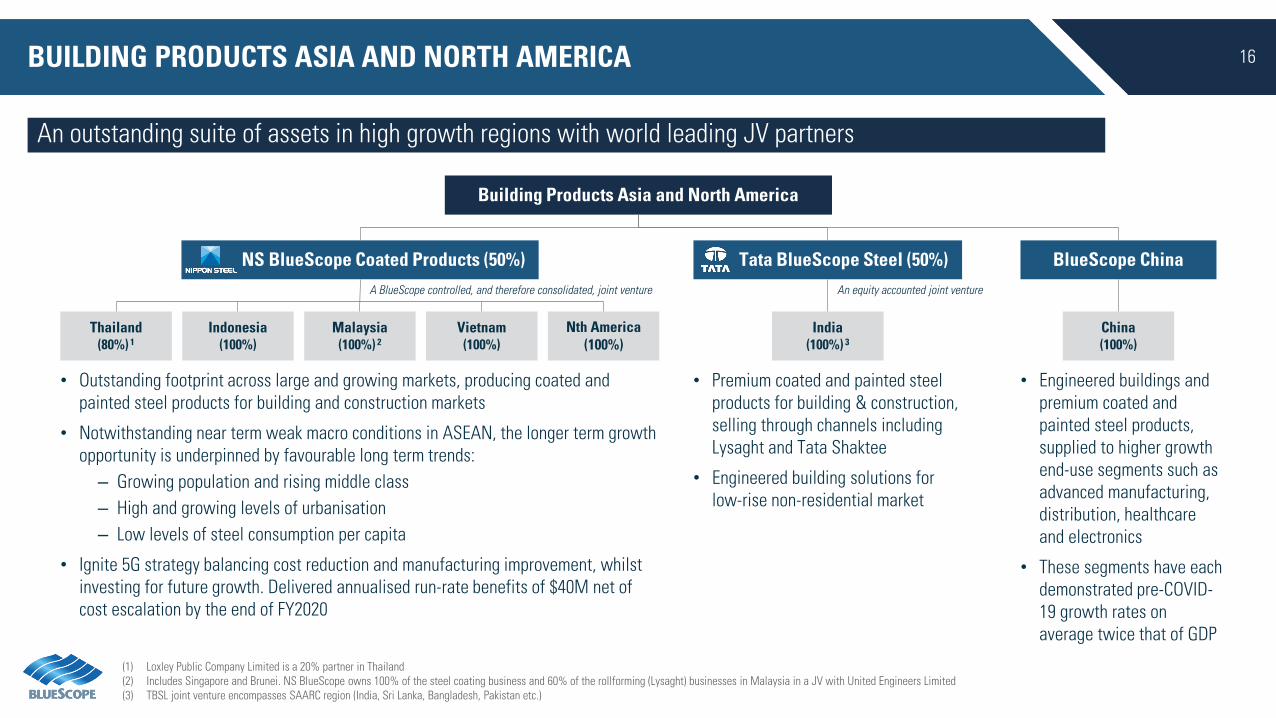
16BUILDING PRODUCTS ASIA AND NORTH AMERICA
An outstanding suite of assets in high growth regions with world leading JV partners
(1) Loxley Public Company Limited is a 20% partner in Thailand(2) Includes Singapore and Brunei. NS BlueScope owns 100% of the steel coating business and 60% of the rollforming (Lysaght) businesses in Malaysia in a JV with United Engineers Limited(3) TBSL joint venture encompasses SAARC region (India, Sri Lanka, Bangladesh, Pakistan etc.)
Building Products Asia and North America
Tata BlueScope Steel (50%)
India(100%) 3
An equity accounted joint venture
BlueScope China
China(100%)
NS BlueScope Coated Products (50%)
Thailand(80%) 1
Indonesia(100%)
Malaysia(100%) 2
Vietnam(100%)
Nth America (100%)
A BlueScope controlled, and therefore consolidated, joint venture
• Outstanding footprint across large and growing markets, producing coated and painted steel products for building and construction markets
• Notwithstanding near term weak macro conditions in ASEAN, the longer term growth opportunity is underpinned by favourable long term trends:
– Growing population and rising middle class– High and growing levels of urbanisation– Low levels of steel consumption per capita
• Ignite 5G strategy balancing cost reduction and manufacturing improvement, whilst investing for future growth. Delivered annualised run-rate benefits of $40M net of cost escalation by the end of FY2020
• Engineered buildings and premium coated and painted steel products, supplied to higher growth end-use segments such as advanced manufacturing, distribution, healthcare and electronics
• These segments have each demonstrated pre-COVID-19 growth rates on average twice that of GDP
• Premium coated and painted steel products for building & construction, selling through channels including Lysaght and Tata Shaktee
• Engineered building solutions for low-rise non-residential market
17
1,373
778
531
232 262
(64)(128)
(693)
47 (79)
(401)(430)
Jun-
19
Jun-
18
(354)
Jun-
16
Dec-
15
Dec-
18
Dec-
16
Jun-
17
Dec-
17
Dec-
19
Jun-
20(509)
Net debt / (cash)1 ($M)
(1) Dec-15 and Jun-16 includes North Star proforma for previous 12 months(2) Chart reflects half year cash settlements of shares bought back.
Flexible and resilient balance sheet with investment grade rating; strong track record of shareholder returns ($1.47Bn since 2017)
ROBUST BALANCE SHEET, DELIVERING RETURNS TO SHAREHOLDERS
North Star50% acquisition
Target ~$400M(incl leases)
Dividends paid and buy-backs2 ($M)
17
150 157
293
209 194
34 40
23 2833
44
32 41
30
15.1% 15.2%
1H
3.1%
190
0.8%
1H 2H
143
5.1%
2H2H
7.9%
1H
11.0%
1H 2H
235
1H
173 171
337
241
6440
DividendBuy-back EPS improvement
from buy-backs (%)
FY2017 FY2018 FY2019 FY2020 FY2021
$1.47Bn of returns since FY2017
Pre-AASB 16 changes to lease accounting standard
18
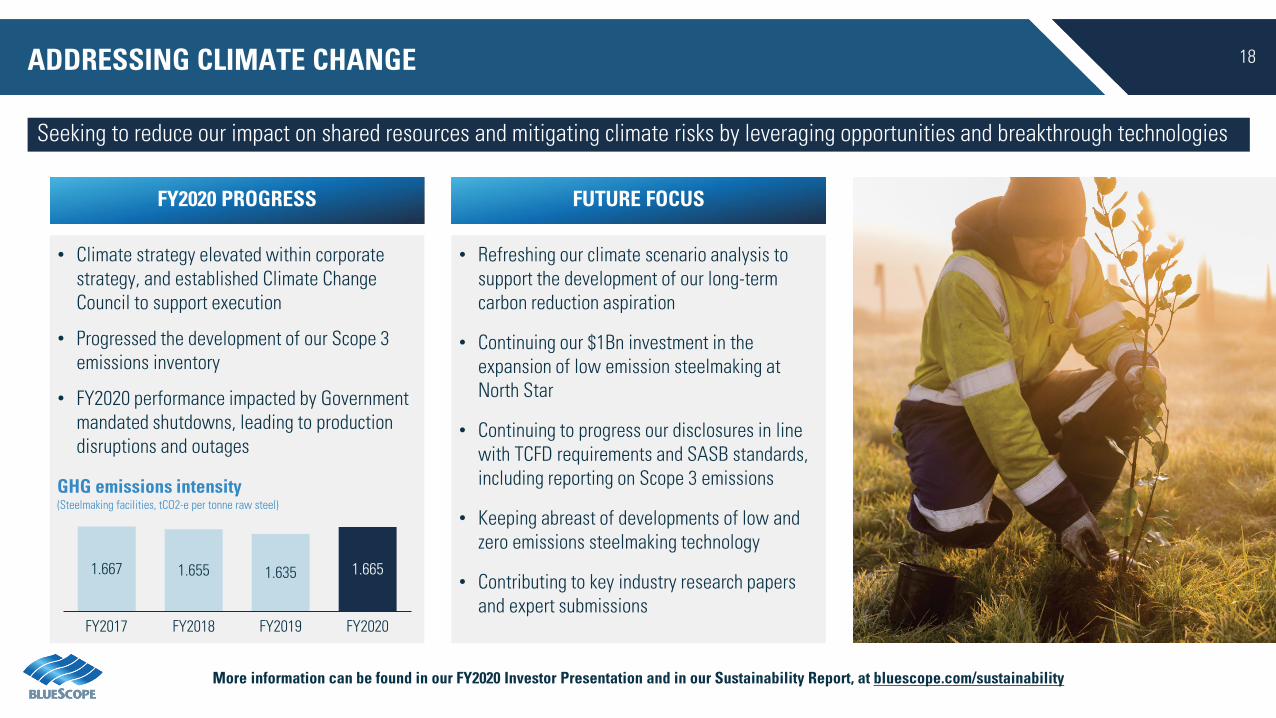
Seeking to reduce our impact on shared resources and mitigating climate risks by leveraging opportunities and breakthrough technologies
ADDRESSING CLIMATE CHANGE
• Climate strategy elevated within corporate strategy, and established Climate Change Council to support execution
• Progressed the development of our Scope 3 emissions inventory
• FY2020 performance impacted by Government mandated shutdowns, leading to production disruptions and outages
FY2020 PROGRESS
• Refreshing our climate scenario analysis to support the development of our long-term carbon reduction aspiration
• Continuing our $1Bn investment in the expansion of low emission steelmaking at North Star
• Continuing to progress our disclosures in line with TCFD requirements and SASB standards, including reporting on Scope 3 emissions
• Keeping abreast of developments of low and zero emissions steelmaking technology
• Contributing to key industry research papers and expert submissions
FUTURE FOCUS
1.667 1.655 1.635 1.665
FY2020FY2017 FY2018 FY2019
GHG emissions intensity(Steelmaking facilities, tCO2-e per tonne raw steel)
More information can be found in our FY2020 Investor Presentation and in our Sustainability Report, at bluescope.com/sustainability
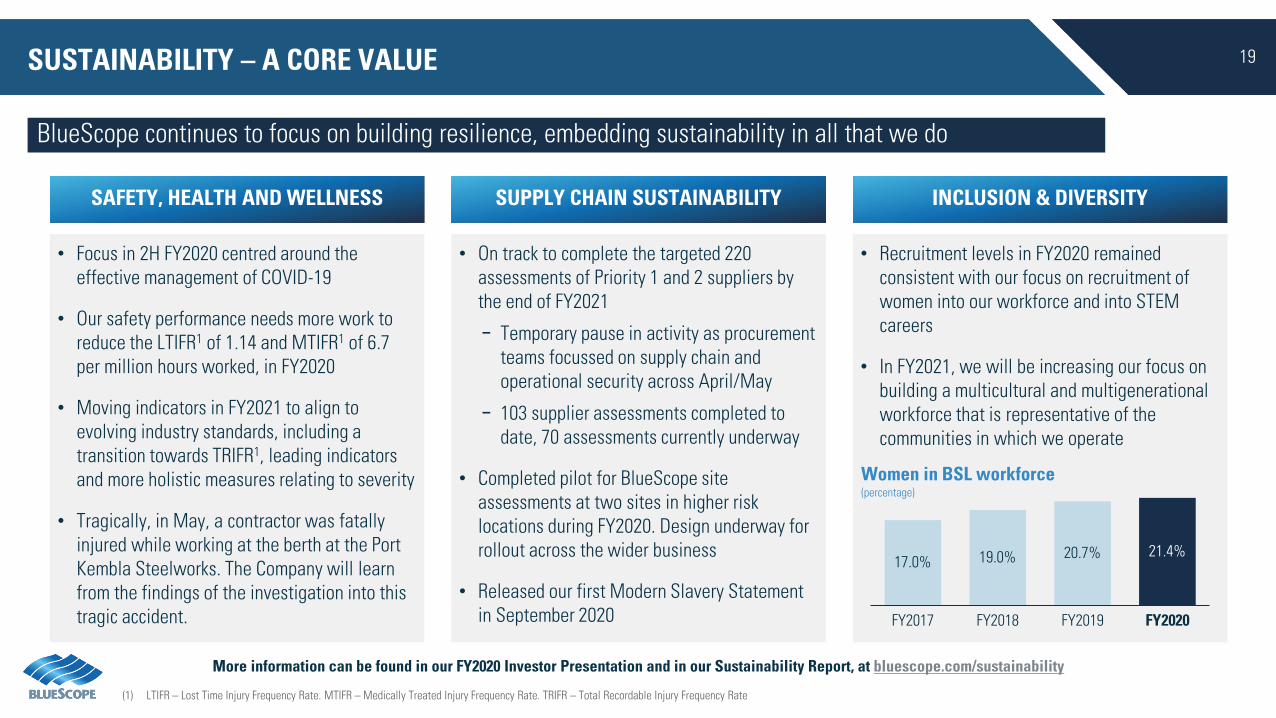
BlueScope continues to focus on building resilience, embedding sustainability in all that we do
(1) LTIFR – Lost Time Injury Frequency Rate. MTIFR – Medically Treated Injury Frequency Rate. TRIFR – Total Recordable Injury Frequency Rate
• Recruitment levels in FY2020 remained consistent with our focus on recruitment of women into our workforce and into STEM careers
• In FY2021, we will be increasing our focus on building a multicultural and multigenerational workforce that is representative of the communities in which we operate
INCLUSION & DIVERSITY
17.0% 19.0% 20.7% 21.4%
FY2019FY2018FY2017 FY2020
Women in BSL workforce(percentage)
• Focus in 2H FY2020 centred around the effective management of COVID-19
• Our safety performance needs more work to reduce the LTIFR1 of 1.14 and MTIFR1 of 6.7 per million hours worked, in FY2020
• Moving indicators in FY2021 to align to evolving industry standards, including a transition towards TRIFR1, leading indicators and more holistic measures relating to severity
• Tragically, in May, a contractor was fatally injured while working at the berth at the Port Kembla Steelworks. The Company will learn from the findings of the investigation into this tragic accident.
SAFETY, HEALTH AND WELLNESS
• On track to complete the targeted 220 assessments of Priority 1 and 2 suppliers by the end of FY2021
− Temporary pause in activity as procurement teams focussed on supply chain and operational security across April/May
− 103 supplier assessments completed to date, 70 assessments currently underway
• Completed pilot for BlueScope site assessments at two sites in higher risk locations during FY2020. Design underway for rollout across the wider business
• Released our first Modern Slavery Statement in September 2020
SUPPLY CHAIN SUSTAINABILITY
More information can be found in our FY2020 Investor Presentation and in our Sustainability Report, at bluescope.com/sustainability