OUR APPROACH CRS applies information and communication technology for monitoring and evaluation (M&E) in projects across Africa, Asia, Latin America and the Middle East. The use of technology for M&E makes us more accountable to our donors and program participants, and improves the way we share learning within our agency and with other relief and development organizations. With many organizations collecting data on mobile devices and GIS tools becoming easier to use, mapping and spatial analysis can improve program delivery. GIS software allows us to layer sets of diverse information from a targeted geographic area and analyze it from different perspectives using six key steps: 1. Understanding where and when things change using comparative maps 2. Measuring size, shape and distribution of geographic features 3. Determining how places are related by location and visibility 4. Finding the best locations and paths to satisfy known needs 5. Detecting and quantifying patterns, trends, and how they change over time 6. Making predictions for how phenomena will spread and what effect it will have By merging cartography, spatial analysis and database technology, geographic information systems (GIS) technology allows us to share lessons learned while shaping the future of our programming for maximum impact. 12 VOLUNTEER GIS PROFESSIONALS AND INTERNS SUPPORTED CRS IN FY 2014-2015 CRS volunteers help Leofoldo Cadion register to receive farming support using GPS- enabled data collection during CRS’ emergency response to Typhoon Haiyan. Jennifer Hardy/CRS MONITORING & EVALUATION Surveys of project performance are converted into a comprehensive map where each indicator is rated for quality across locations PROJECT PARTICIPANT SELECTION Existing data on the location of vulnerable populations can be combined with historical country program data to target the areas in most need PROGRAM SITE SELECTION Using tools such as hydrological or erosion analysis prior to selection ensures that communities at the most risk for environmental impacts are being chosen correctly TECHNICAL SUPPORT Save cost and time by focusing technical support based on analyzing program strengths and weaknesses THE BASICS 50 UNIQUE MAPS PRODUCED BY CRS EACH MONTH ON AVERGAGE CRS AND geographic information systems
Transcript
OUR APPROACHCRS applies information and communication technology for monitoring and evaluation (M&E) in projects across Africa, Asia, Latin America and the Middle East. The use of technology for M&E makes us more accountable to our donors and program participants, and improves the way we share learning within our agency and with other relief and development organizations.
With many organizations collecting data on mobile devices and GIS tools becoming easier to use, mapping and spatial analysis can improve program delivery. GIS software allows us to layer sets of diverse information from a targeted geographic area and analyze it from different perspectives using six key steps:
1. Understanding where and when things change using comparative maps
2. Measuring size, shape and distribution of geographic features
3. Determining how places are related by location and visibility
4. Finding the best locations and paths to satisfy known needs
5. Detecting and quantifying patterns, trends, and how they change over time
6. Making predictions for how phenomena will spread and what effect it will have
By merging cartography, spatial analysis and database technology, geographic information systems (GIS) technology allows us to share lessons learned while shaping the future of our programming for maximum impact.
12VOLUNTEER GIS PROFESSIONALS AND
INTERNS SUPPORTED CRS IN FY 2014-2015
CRS volunteers help Leofoldo Cadion register to receive farming support using GPS-enabled data collection during CRS’ emergency response to Typhoon Haiyan. Jennifer Hardy/CRS
MONITORING & EVALUATION Surveys of project performance are converted into a comprehensive map where each indicator is rated for quality across locations
PROJECT PARTICIPANT SELECTION Existing data on the location of vulnerable populations can be combined with historical country program data to target the areas in most need
PROGRAM SITE SELECTION Using tools such as hydrological or erosion analysis prior to selection ensures that communities at the most risk for environmental impacts are being chosen correctly
TECHNICAL SUPPORT Save cost and time by focusing technical support based on analyzing program strengths and weaknesses
THE BASICS
50UNIQUE MAPS PRODUCED BY CRS EACH
MONTH ON AVERGAGE
CRS AND
geographic information systems
SHARING KNOWLEDGEIn order to produce high-impact interventions, we must use powerful and analytic communication tools. Maps bring layers of data to life by not only allowing CRS’ staff to see where needs are located, but by also enabling collaboration on a larger scale. International partners and local beneficiaries can visualize where materials have been distributed, give insight on a proposed shelter site, and quickly grasp the multiple considerations in project planning by simply pointing to a map. CRS also uses unmanned aerial vehicles (UAVs) to gather high quality aerial images where land surveys are otherwise too expensive or impossible in disaster settings.
CRS currently utilizes a team of professional volunteers, interns, university partners, and professional service firms who support our goals with technical expertise. GIS offers the opportunity for fellow agencies, governments, and local communities who are invested in a common location to share unique perspectives and advancements, which promotes data openness and accountability between stakeholders on every level.
EXAMPLES OF SUCCESS• In The Gambia, CRS used GIS to spatially analyze the
relationship between the national population and distribution of long lasting insecticidal nets (LLINs) for prevention of malaria. By layering data on district population, distribution sites, and district heat maps, project teams found areas that were either over- or under-distributed, as well as people not included in the national census. This information allowed field teams to adjust their action plans for future distributions to ensure equitable access to bed nets among target communities.
• In Lesotho, the Geospatial Innovations for Transforming Strategies (GIFTS) program used GIS that incorporated satellite imagery and LIDAR (a remote sensing technology that can use lasers to assess vegetation) to help farmers incorporate drought tolerant crops. By looking at imagery taken from early planting to post-harvest, staff detected patterns in crop growth by type of vegetation and monitored where their efforts were having an effect. Further evaluations were conducted in areas where diversification was ineffective, and staff assessed whether it was caused by a lack of community practice or indicated the need to expand the program.
• In the Philippines, CRS used UAVs in the Typhoon Haiyan Recovery Program to view damage and plan our emergency response. Previous images were compared with the new aerial imagery to show levels of damage, the location of existing settlements, and the least vulnerable locations for new settlements. CRS also employed participatory mapping to gather information by encouraging local residents to help add context to preliminary maps.
GOING FORWARDWhile we rely on maps as an outreach and communication tool, we are exploring ways to more routinely apply spatial analysis to improve the efficacy of our programs. As local stakeholders continue to engage in the mapping process and see the results, we hope to expand the scope of community led mapping and increase their contributions to improving the aid they receive. CRS also seeks to strengthen our relationships with partner universities, agencies, and private actors to share technical resources and insights in the field of GIS.
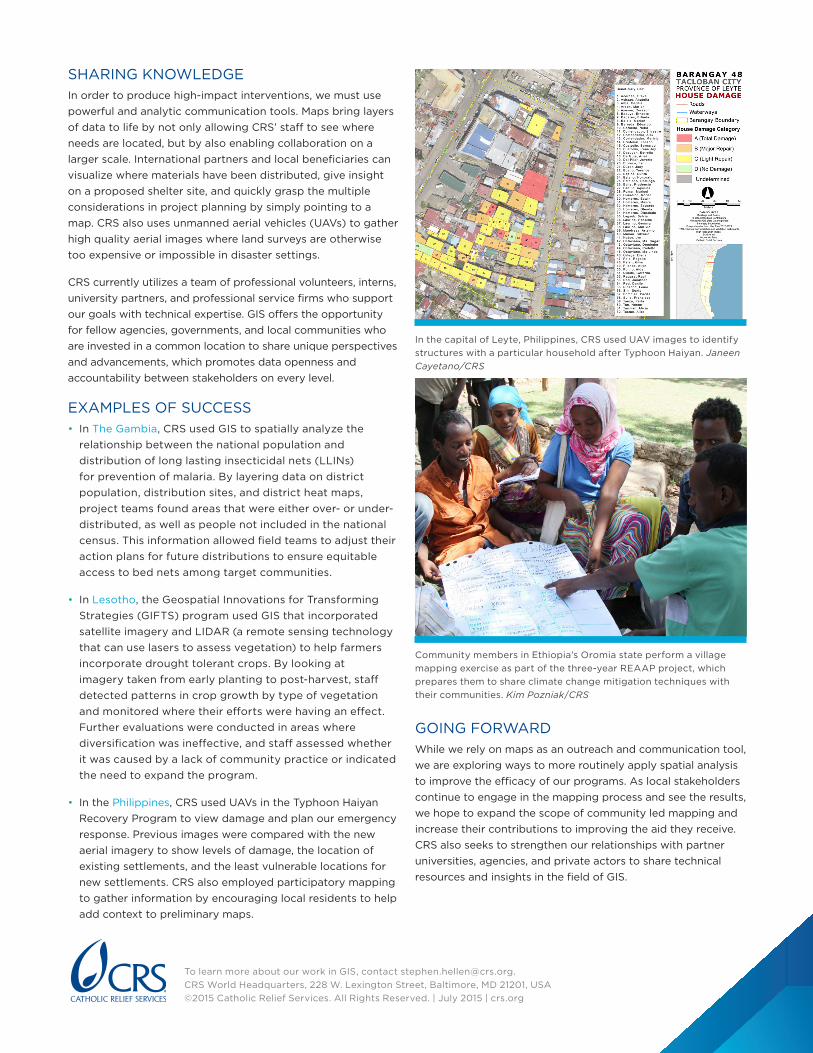
In the capital of Leyte, Philippines, CRS used UAV images to identify structures with a particular household after Typhoon Haiyan. Janeen Cayetano/CRS
Community members in Ethiopia’s Oromia state perform a village mapping exercise as part of the three-year REAAP project, which prepares them to share climate change mitigation techniques with their communities. Kim Pozniak/CRS