Repsol Economic Research Department. Antonio Merino Chief Economist “Crude Oil Outlook” Seventh IEA_IEF_OPEC Symposium on Energy Outlooks IEF Headquarters Riyadh, Saudi Arabia, February 2017
Transcript
Repsol Economic Research Department. Antonio Merino Chief Economist
“Crude Oil Outlook”
Seventh IEA_IEF_OPEC Symposium on Energy OutlooksIEF Headquarters
Riyadh, Saudi Arabia, February 2017
2
Discussion Points
Price Forecast
Demand Dynamics: Long term forecast and facts
Supply Dynamics: Integrated, Unconventional and OPEC
3
Discussion Points
Price Forecast
Demand Dynamics: Long term forecast and facts
Supply Dynamics: Integrated, Unconventional and OPEC
4
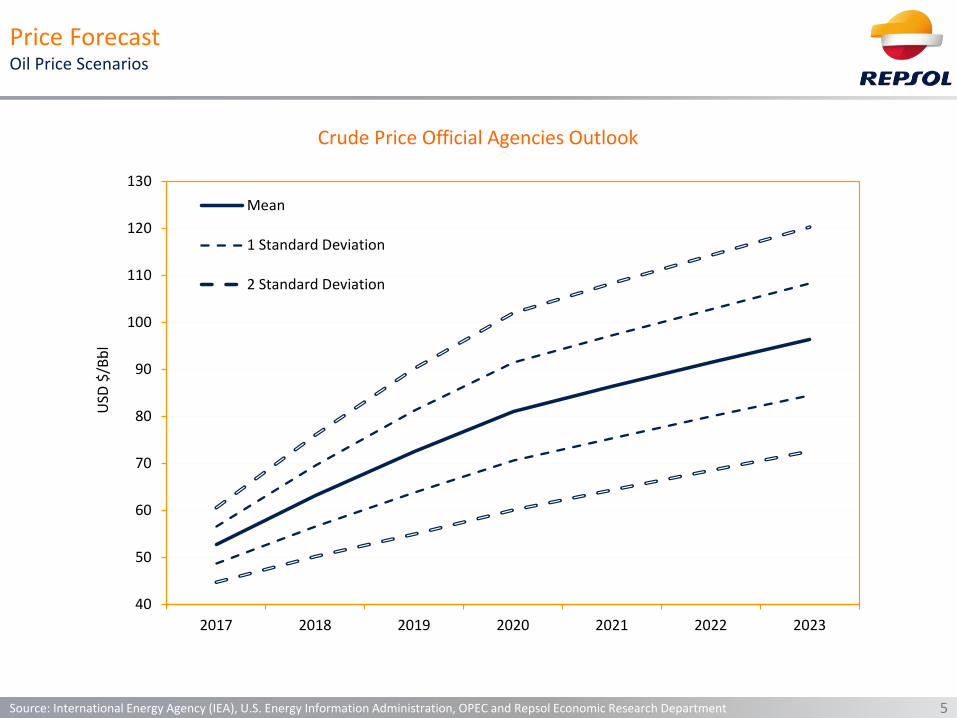
Crude Price Official Agencies Outlook
Price ForecastOil Price Scenarios
Source: International Energy Agency (IEA), U.S. Energy Information Administration, OPEC and Repsol Economic Research Department
40
50
60
70
80
90
100
110
120
130
2017 2018 2019 2020 2021 2022 2023
USD
$/B
bl
EIA Ref. (AEO 2017)*
EIA High R&T (AEO 2017)
EIA Low R&T (AEO 2017)
IEA (WEO 2016, NP Sc.)**
IEA (WEO 2016, CP Sc.)**
IEA (WEO 2016, 450 Sc.)**
OPEC (WOO 2016, RC)***
*** OPEC Reference Basket price
** Prices are calculated through lineal interpolation from IEA perspectives in the WEO2016. Nominal prices assume inflation of 2% per year from 2015. IEA forecasts OECD Crude oil import costs, which was 2.1 US$/Bbl below Brent in average in the 2006-2015 period. In this regard, 2.1 US$/Bbl is added to IEA estimation in nominal terms to obtain Brent perspectives.
* Short term prices from the EIA's Short Term Energy Outlook
5
Crude Price Official Agencies Outlook
Source: International Energy Agency (IEA), U.S. Energy Information Administration, OPEC and Repsol Economic Research Department
40
50
60
70
80
90
100
110
120
130
2017 2018 2019 2020 2021 2022 2023
USD
$/B
bl
Mean
1 Standard Deviation
2 Standard Deviation
Price ForecastOil Price Scenarios
6
Crude Price Official Agencies Outlook
Source: International Energy Agency (IEA), U.S. Energy Information Administration, OPEC and Repsol Economic Research Department
0
50
100
150
200
250
30020
17
2018
2019
2020
2021
2022
2023
2024
2025
2026
2027
2028
2029
2030
2031
2032
2033
2034
2035
2036
2037
2038
2039
2040
USD
$/B
bl
Mean
1 Standard Deviation
2 Standard Deviation
Price ForecastOil Price Scenarios
7
Discussion Points
Price Forecast
Demand Dynamics: Long term forecast and facts
Supply Dynamics: Integrated, Unconventional and OPEC
8Source: UN and Repsol Research Department
Annual Growth of Working Age Population (%)
-1
0
1
2
3
World Africa Mid. East India Em.Asia*
Latin Am. China Em.Europe
DM
2000-15 2015-30
Demand Dynamics long-term population growth projection:
9
Oil Demand Growth forecast in the long term
Demand Dynamics In the long term, oil demand growth forecasts hoover around 0,7% -1%
Source: Different sources and Repsol Economic Research Department
-0,8%
-0,6%
-0,4%
-0,2%
0,0%
0,2%
0,4%
0,6%
0,8%
1,0%
1,2%
1,4%
Ener
data
(201
6)
Woo
dMac
kenz
ie (2
016)
OPE
P (W
orld
Oil
Out
look
201
6)
STAT
OIL
(201
6)
EXXO
N (2
016)
BP (2
016)
EIA
(Int
erna
tiona
l Ene
rgy
Out
look
201
6)
PIRA
(201
6)
IEA
(Wor
ld E
nerg
yO
utlo
ok 2
016)
- BU
IEA
(Wor
ld E
nerg
yO
utlo
ok 2
016)
- N
PS
IEA
(Wor
ld E
nerg
yO
utlo
ok 2
016)
- 45
0 Sc
en
2015
-203
0 CA
GR
Crude demand growth (2015-2030 CAGR)
10Source: International Energy Agency (IEA), IMF and Repsol Economic Research Department
Global Demand and Economic Growth → Recent Development & Perspectives
2.2%
1.7%
1.5%
1.9%
1%
5,4%
4,2%
3,5%
3,3%
3,4%3,2%
3,1%
3,4%
-2%
-1%
0%
1%
2%
3%
4%
5%
6%
1986
1987
1988
1989
1990
1991
1992
1993
1994
1995
1996
1997
1998
1999
2000
2001
2002
2003
2004
2005
2006
2007
2008
2009
2010
2011
2012
2013
2014
2015
2016
2017
Demand Growth
Avg. growth 1986-2004
Avg. growth 2005-2014
Economic Growth
Demand Dynamics Demand growth is outstripping last years behavior at rates comparable to the 1986-2004 avg. growth. Lower prices → higher demand, moreover part of the increase in disposable income was used to reduce debt
11
Global Demand Growth → Recent Development & Perspectives
Source: International Energy Agency (IEA) and Repsol Economic Research Department
Semielasticity World Demand
∆ Oil prices
∆ GDP
OEF/Repsol -0,17 0,44
2.2%
1.7%
1.5%
1.9%
1%
-2%
-1%
0%
1%
2%
3%
4%
5%
6%
1986
1987
1988
1989
1990
1991
1992
1993
1994
1995
1996
1997
1998
1999
2000
2001
2002
2003
2004
2005
2006
2007
2008
2009
2010
2011
2012
2013
2014
2015
2016
2017
Demand Growth
Avg. growth 1986-2004
Avg. growth 2005-2014
Demand Dynamics Demand growth is outstripping last years behavior at rates comparable to the 1986-2004 avg. growth. Lower prices → higher demand, moreover part of the increase in disposable income was used to reduce debt
12
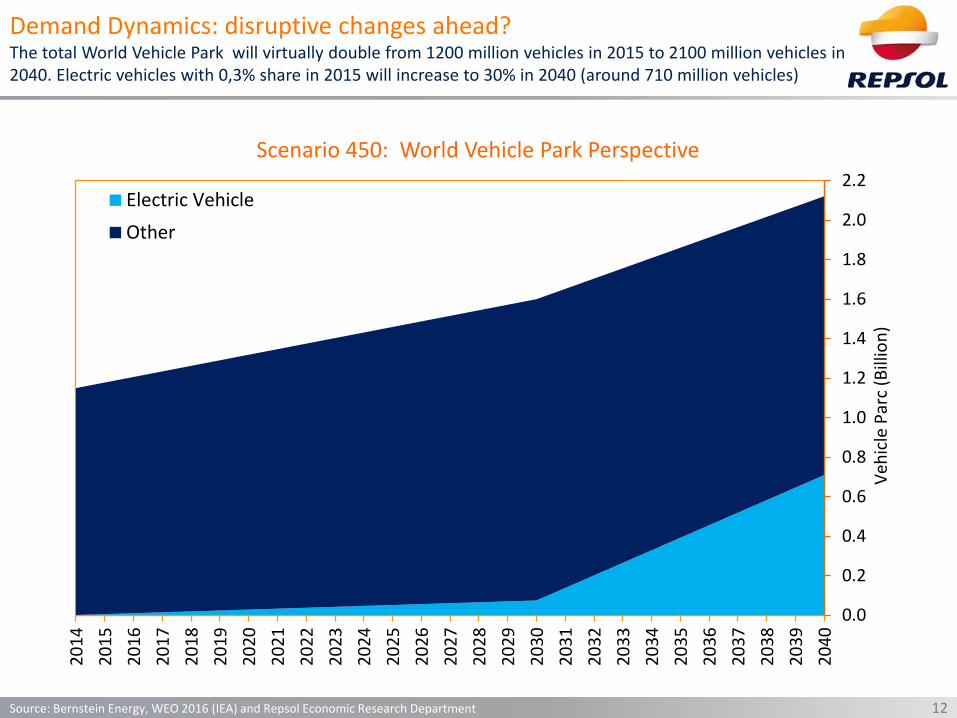
Scenario 450: World Vehicle Park Perspective
Demand Dynamics: disruptive changes ahead? The total World Vehicle Park will virtually double from 1200 million vehicles in 2015 to 2100 million vehicles in 2040. Electric vehicles with 0,3% share in 2015 will increase to 30% in 2040 (around 710 million vehicles)
Source: Bernstein Energy, WEO 2016 (IEA) and Repsol Economic Research Department
24Source: Bloomberg and Repsol Economic Research Department
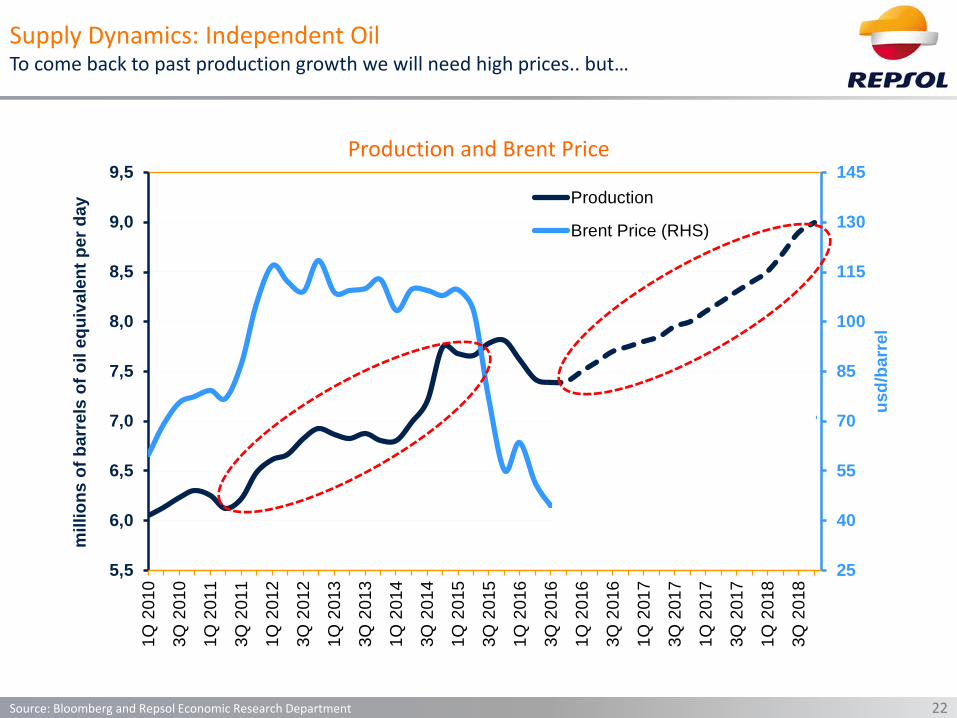
Production and Brent Price
25
40
55
70
85
100
115
130
145
5,5
6,0
6,5
7,0
7,5
8,0
8,5
9,0
9,51Q
201
0
3Q 2
010
1Q 2
011
3Q 2
011
1Q 2
012
3Q 2
012
1Q 2
013
3Q 2
013
1Q 2
014
3Q 2
014
1Q 2
015
3Q 2
015
1Q 2
016
3Q 2
016
1Q 2
016
3Q 2
016
1Q 2
017
3Q 2
017
1Q 2
017
3Q 2
017
1Q 2
018
3Q 2
018
usd/
barr
el
mill
ions
of b
arre
ls o
f oil
equi
vale
nt p
er d
ay
Production
Brent Price (RHS)
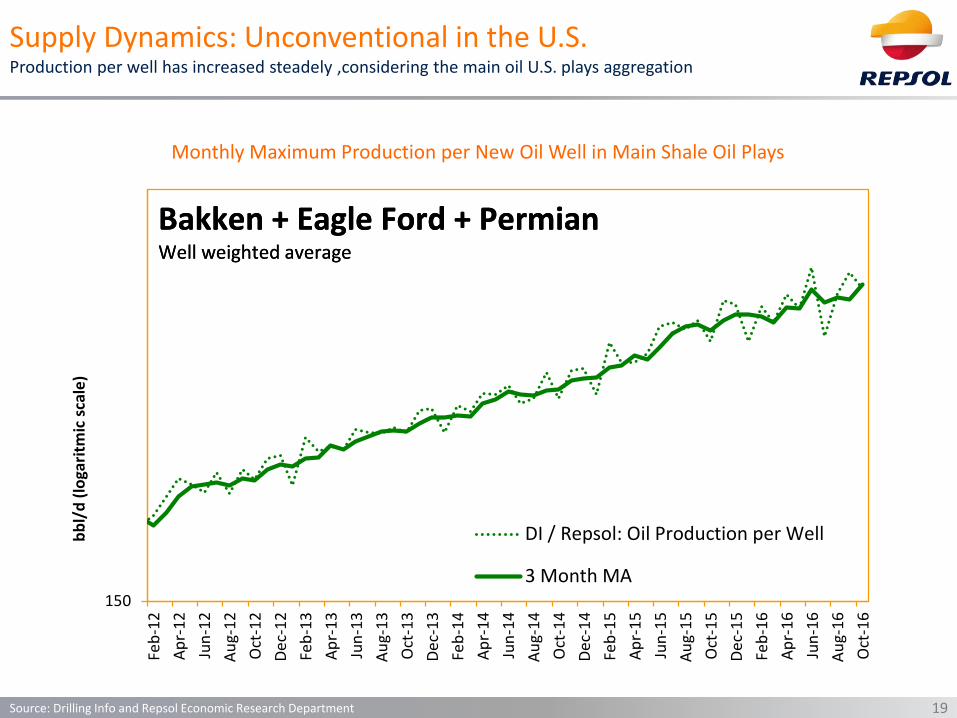
Supply Dynamics: Independent OilTo come back to past production growth, due to cost reduction we will need other prices. The rate of growth in productivity per well remains stable….
Monthly Crude Oil Price and PPI Drilling Oil and Gas Wells
Supply Dynamics: Independent OilHowever, E&P costs and oil prices co-move. And some of the reduction in costs should be considered cyclical no STRUCTURAL
25Source: Thomson Reuters and Repsol Economic Research Department
Price Cost96 → 98 -56% -19%00 → 01 -47% -17%06 → 07 -22% -14%08 → 09 -70% -20%14 → 16 -70% -34%* From máx 2014 to min 2016
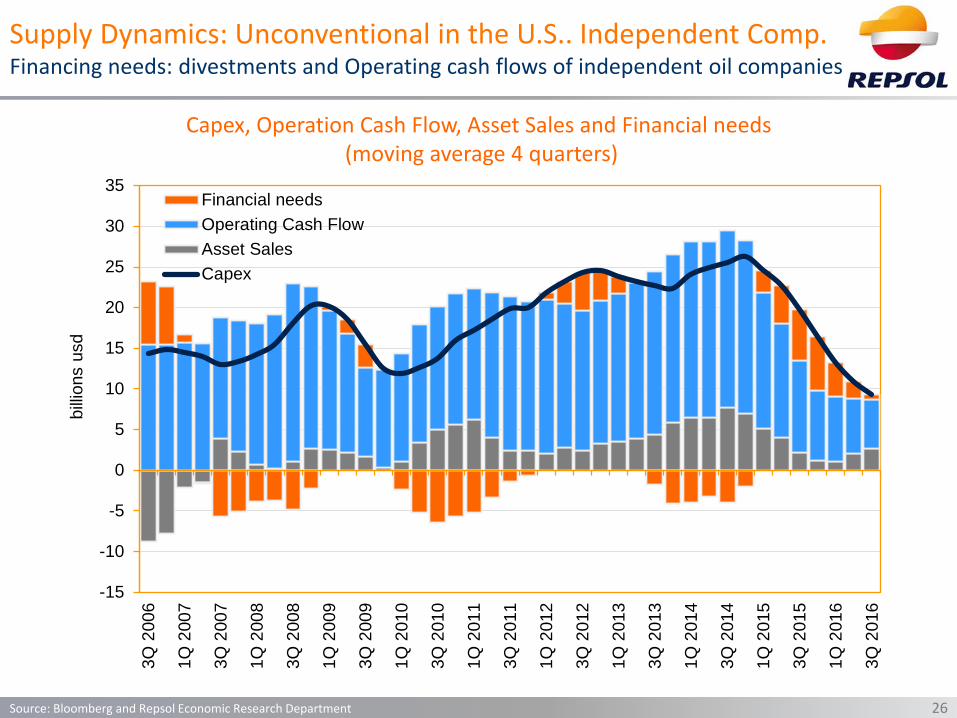
26Source: Bloomberg and Repsol Economic Research Department
Capex, Operation Cash Flow, Asset Sales and Financial needs(moving average 4 quarters)
Supply Dynamics: Unconventional in the U.S.. Independent Comp.Financing needs: divestments and Operating cash flows of independent oil companies