24
CS654: Digital Image Analysis Lecture 17: Image Enhancement
| Date post: | 12-Jan-2016 |
| Category: |
Documents |
| Upload: | griffin-fowler |
| View: | 230 times |
| Download: | 3 times |

CS654: Digital Image Analysis
Lecture 17: Image Enhancement

Recap of Lecture 16
• Mask processing
• Spatial filtering
• Averaging
• Differentiation
• Correlation
• Convolution

Outline of Lecture 17
• Image enhancement
• Dynamic range
• Point processing
• Contrast stretching
• Intensity level slicing

Introduction
• Improve the quality of an image as perceived by human being
• Can be performed at both spatial and frequency domain
• Different types of enhancement
• Noise suppression
• Increase contrast
• Sharpen or smoothen image feature
• Emphasise
• Display and analysis

Common techniques
Image enhancement
Point processing Spatial operation Transform operation
Pseudocoloring
• Contrast stretching• Noise clipping• Window slicing• Histogram modeling
• Noise smoothing• Median filtering• Unsharp masking• Filtering
• Linear filter• Root filter• Homomorphic filter
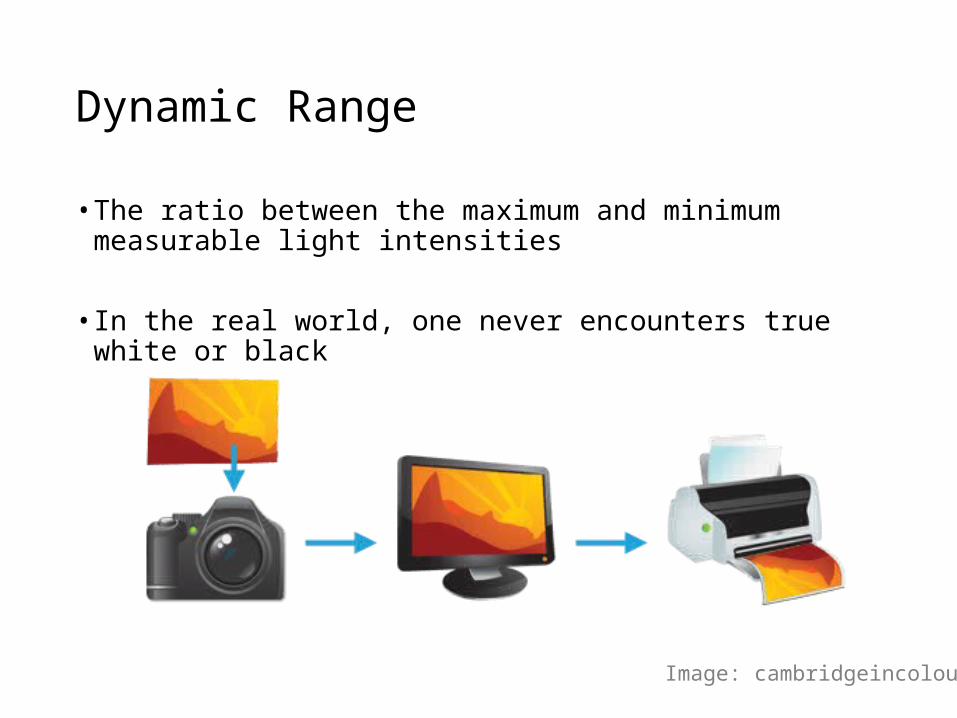
Dynamic Range
• The ratio between the maximum and minimum measurable light intensities
• In the real world, one never encounters true white or black
Image: cambridgeincolour

ILLUMINANCE & REFLECTIVITY
• Both contribute to the dynamic range of a scene
• Illuminance to specify only incident light
• Vast variation possible for incident light
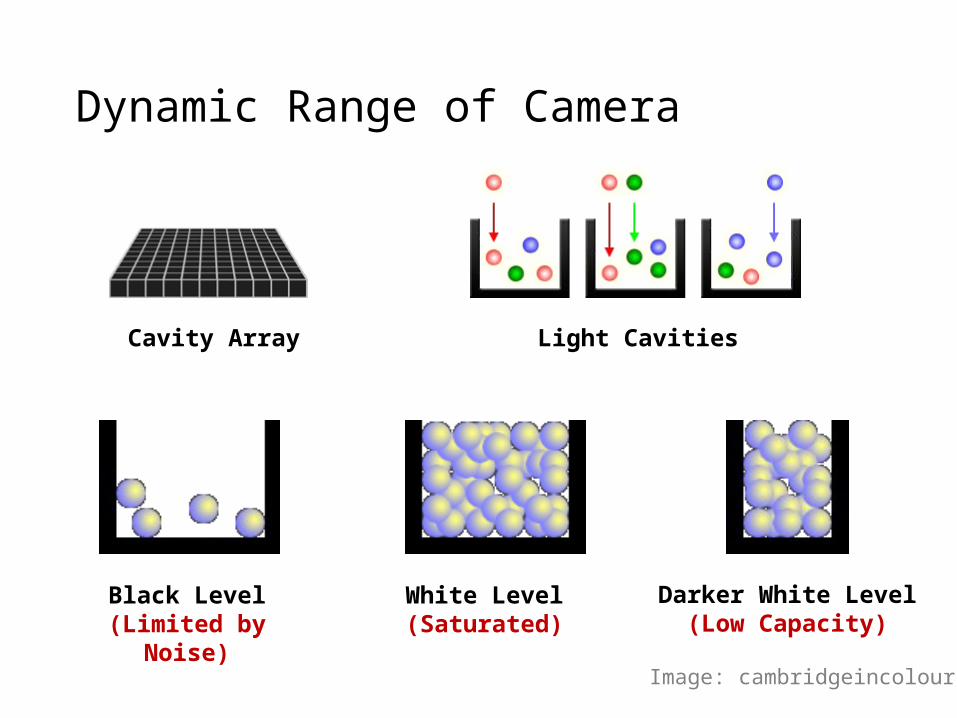
Dynamic Range of Camera
Black Level(Limited by Noise)
White Level(Saturated)
Darker White Level(Low Capacity)
Cavity Array Light Cavities
Image: cambridgeincolour
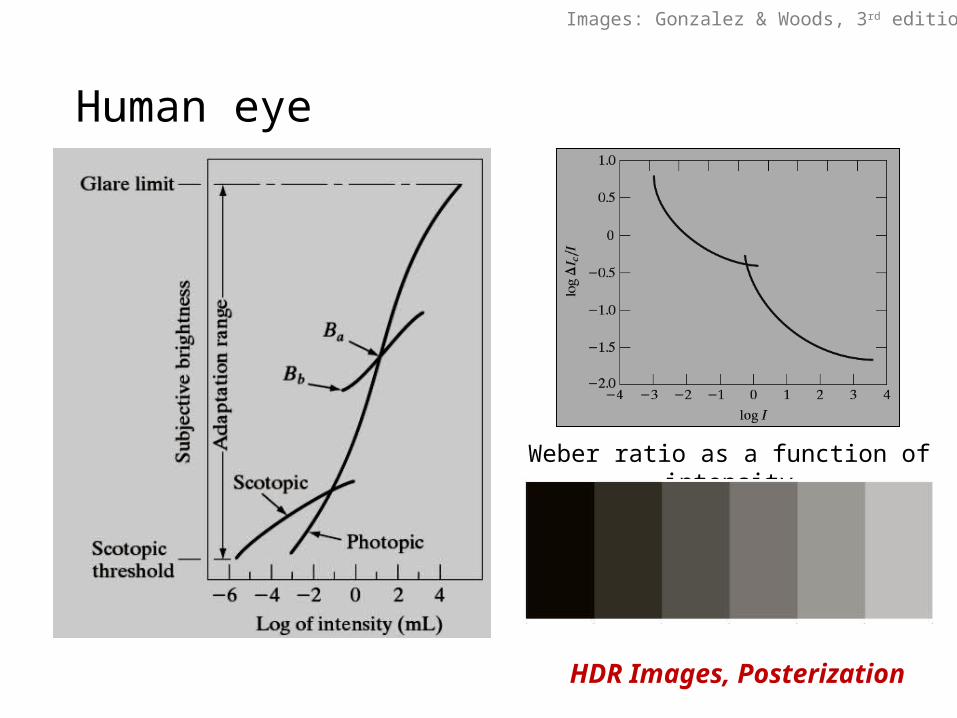
Human eye
Weber ratio as a function of intensity
HDR Images, Posterization
Images: Gonzalez & Woods, 3rd edition

Intensity transformation
𝑔 (𝑥 , 𝑦 )=𝑇 ( 𝑓 (𝑥 , 𝑦 ))
: Transformed image
: Input image
: Transformation function
Images: Gonzalez & Woods, 3rd edition
𝑠=𝑇 (𝑟 )neighbourhood
Point processing

Point processing
Images: Gonzalez & Woods, 3rd edition
Contrast stretching function
0 255
255
Thresholding function
0 255
255
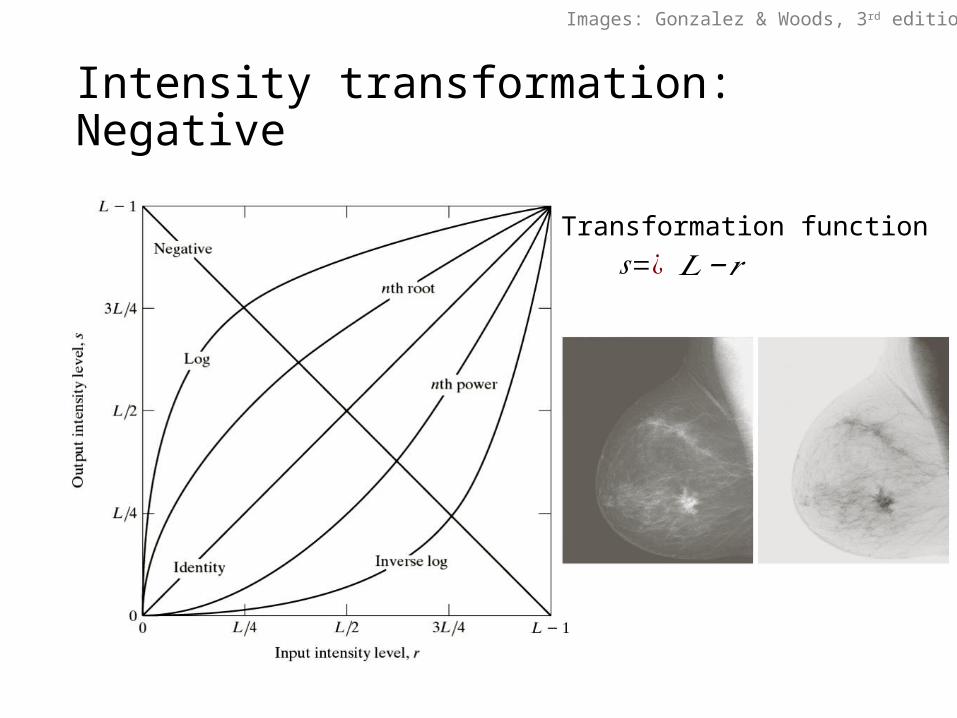
Intensity transformation: Negative
𝐿−𝑟𝑠=¿Transformation function
Images: Gonzalez & Woods, 3rd edition

Intensity transformation: Log-transform
𝑠=𝑐𝑙𝑜𝑔 (1+𝑟 ) ;𝑟 ≥0Transformation function
• Maps narrow low intensity to wider range of intensity
• Compresses the dynamic range of images
Images: Gonzalez & Woods, 3rd edition

Intensity transformation: Gamma
𝑠=𝑐𝑟𝛾Transformation function
• Fractional value maps narrow low intensity to wider range of intensity
• Higher value maps narrow low intensity to wider range of intensity
Images: Gonzalez & Woods, 3rd edition

Gamma correction: Display
Images: Gonzalez & Woods, 3rd edition
Gamma corrected image as viewed in monitor
Gamma correction
Gamma corrected image
Original image Input image as viewed in monitor
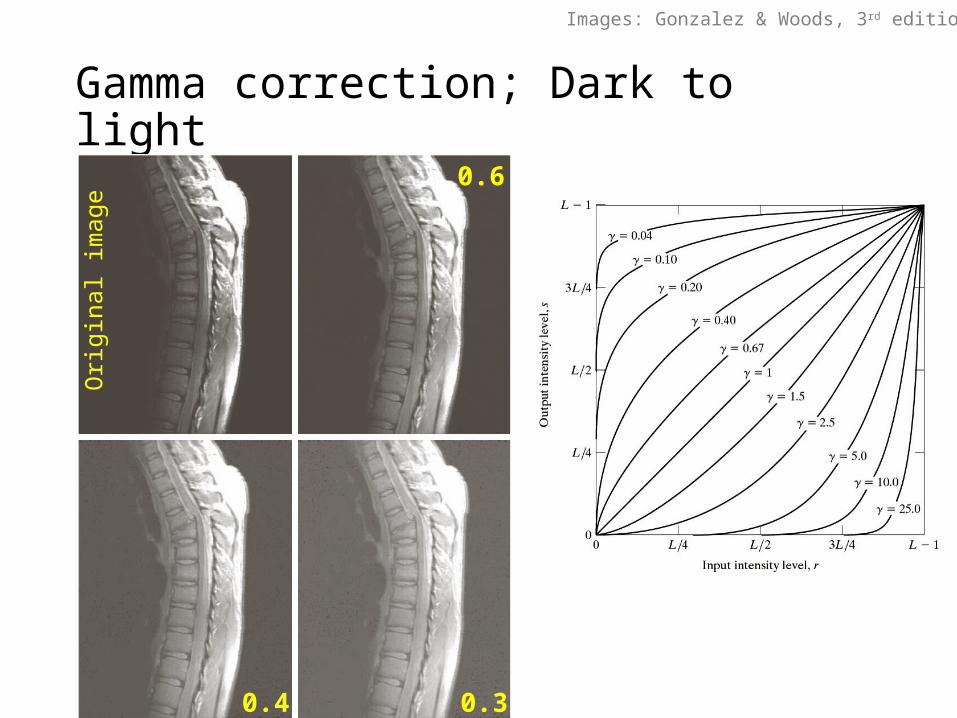
Gamma correction; Dark to light
Images: Gonzalez & Woods, 3rd edition
Orig
inal
imag
e
0.6
0.4 0.3

Gamma correction: light to dark
Images: Gonzalez & Woods, 3rd edition
3.0
4.0 5.0

Contrast stretching
Images: Gonzalez & Woods, 3rd edition
𝛼 𝛽 𝛾
𝑠={ 𝛼𝑟 ;0≤𝑟 ≤𝑟 1𝛽 (𝑟 −𝑎)+𝑠1 ;𝑟1≤𝑟 ≤𝑟 2𝛾 (𝑟−𝑏)+𝑠2;𝑏≤𝑟 ≤ 𝐿
𝒓𝟏 𝒓𝟐
Spans the full range of intensity level
𝑟1=𝑠1 ,𝑟 2=𝑠2 Linear
𝑟1=𝑟2 ,𝑠1=0 , 𝑠2=𝐿−1Thresholding
𝒔𝟏
𝒔𝟐

Contrast stretching
Input image Contrast stretched image
Thresholded image
Images: Gonzalez & Woods, 3rd edition
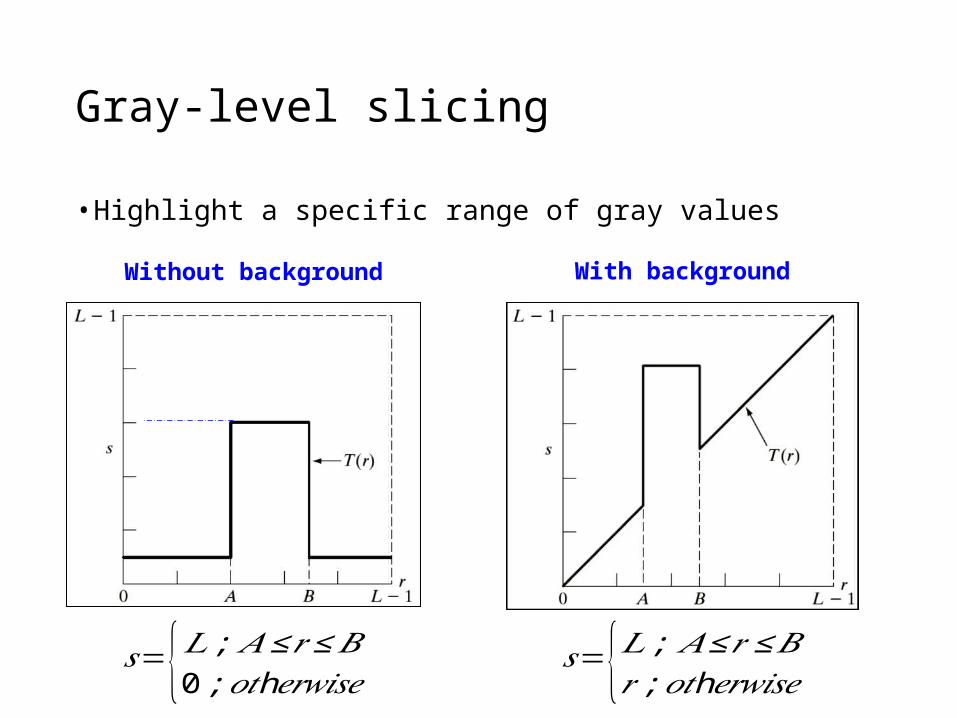
Gray-level slicing
• Highlight a specific range of gray values
Without background
𝑠={ 𝐿 ; 𝐴≤𝑟 ≤𝐵0 ; h𝑜𝑡 𝑒𝑟𝑤𝑖𝑠𝑒
With background
𝑠={ 𝐿; 𝐴≤𝑟 ≤𝐵𝑟 ; h𝑜𝑡 𝑒𝑟𝑤𝑖𝑠𝑒

Example
Input image Without background With background

Bit plane slicing
Bit plane representation of 8 bit images
1 2
4 5
7 8
3
6

Reconstruction of images
8+7
8+7+6
8+7+6+5
Thank youNext lecture: Histogram Processing


