49
Contents I. AAPI Fact Sheets Cultural Competency and Asian American and Pacific Islanders
| Date post: | 24-Jun-2018 |
| Category: |
Documents |
| Upload: | truongphuc |
| View: | 214 times |
| Download: | 0 times |
34
Contents
I. AAPI Fact Sheets
Cultural Competency and Asian American and Pacific Islanders
BA
NG
LAD
ES
HI &
P
AK
ISTA
NI

36
Early Entrance With Recent Growth
The first measurable numbers of South Asians (including Indians, Bangladeshis, and Pakistanis) began arriving on the West Coast of the United States at the beginning of the 20th century. They worked in the developing West, building railroads, clearing and cultivating the rich agricultural lands of California, reclaiming the desert in the Southwest, and working in the lumber industry in Oregon and Washington.
During this period, the first individuals from present-day Sri Lanka and Bangladesh arrived in very small numbers. Yamau Kira, a native of Ceylon, came to the United States in 1913. He opened one of first South Asian restaurants in New York City, the Ceylon-India Inn. By the 1940s, merchant seamen from what is now Bangladesh began settling in the states of New York and New Jersey. They established the first Pakistani American Association in New York in 1947.
Immigration records show 11,884 South Asians entered the U.S. in 1970 and by 1980 they reached 27,912. The South Asian population in the United States has grown substantially during the last three decades. When counted "alone or in combination with other races," Pakistani Americans numbers grew by 151.1 percent, Sri Lankans by 124.1 percent, and Bangladeshis by 385 percent. By comparison, the overall "alone or in combination" APA population increased 72.2 percent.
Bangladeshi Americans
Prior to 1971 when Bangladesh became an independent nation, Bangladeshis had been counted as Pakistanis. Of the 7,215 Bangladeshis who were admitted in 2000, 65 percent came as relatives of existing U.S. residents, 9.4 percent were allowed in for job reasons, and 23.8 percent came in the diversity program. The diversity category is the result of the 1990 Immigration Act's lottery program, instituted to enable and encourage immigration from countries that were not already sending large numbers.
In New York, where there is the highest concentration of Bangladeshi Americans, a majority work in the restaurant and transport industries. A 1991 survey showed that Bangladeshi Americans applied for over ten percent of the driving permits for taxis, just ahead of Asian Indians who made up 9.9 percent of the applicants. Nearly fifty two percent of Bangladeshi Americans reside in New York.
Other concentrations are in California, Texas, New Jersey, Michigan, and Virginia. Growth and dispersion of the community is occurring--in Georgia, the Bangladeshi population grew from 135 in 1990 to 1,283 in 2000. In another possible population shift, Bangladeshi Americans have been moving from New York to Michigan in large numbers to take jobs in small factories in the Detroit area that produce automobile parts.

37
Pakistani Americans
People from present-day Pakistan were among the first South Asians to immigrate to the United States. Many of these early arrivals married and settled on the West Coast, particularly in California, where there are families who trace their roots back to the early. 1900s. After Pakistan became an independent nation in 1947, there were a handful of individuals who came under the family reunification provisions of United States immigration law More Pakistanis came as students from the 1950s to the early 1960s.
After 1965, Pakistanis entered as professional and skilled workers, although many continue to come on temporary student visas as well. Many student visa holders eventually apply to stay permanently in the U.S. due to the dim economic prospects back in their home country. In 2000, 73 percent of new Pakistani immigrants entered the United States through family preference categories, 13.6 percent through employment-related preferences, and 12.1 percent under the diversity program.
As the tenth-largest APA community, Pakistani Americans are widely distributed across the country Over 48 percent of Pakistani Americans live in New York (with 22.3% of the total Pakistani American population), California (13.6%), and Texas. The 1990 Census recorded that 25.3 percent of Pakistani Americans had four years of college and 25.4 percent had post-graduate degrees. By comparison, the overall APA numbers with the same degrees were 22.7 percent and 13.9 percent, respectively.
Pakistani Americans also have varied occupations. According to the 1990 Census, 33.5 percent held managerial and professional positions, 35.2 percent worked in technical, sales, or administrative positions, 10.2 percent had service jobs, and 20.5 percent worked in areas such as production, fabrication and as laborers. Self-employment accounted for 7.9 percent.
Building Communities and Coalitions For The Future
While each will have its own distinctive trajectory, there are many ways that South Asians (including Indian, Bangladeshi, Pakistani, and others) could come together to address common concerns. The post-Sept. 11th backlash is an unfortunate example of why concerned citizens are increasingly joining forces. Responding to hundreds of attacks on South Asian Americans, and, in some cases, people who look South Asian, Muslim, or Arab, several new organizations, such as South Asian American Leaders of Tomorrow, have been established to take action against these dangerous and sometime deadly incidents of hate violence.
Additionally, Asian American advocacy groups have provided legal services and resource information to those facing job and housing discrimination, racial profiling, and INS searches and detentions because of their South Asian or Middle Eastern ethnicity. On another front, South Asian American women have founded numerous organizations in the last decade and a half to address women's issues, from domestic abuse to the adverse impact of immigration policies. As emerging populations, South Asian Americans are attentive to current and future immigration policy trends that may impact their communities.
38
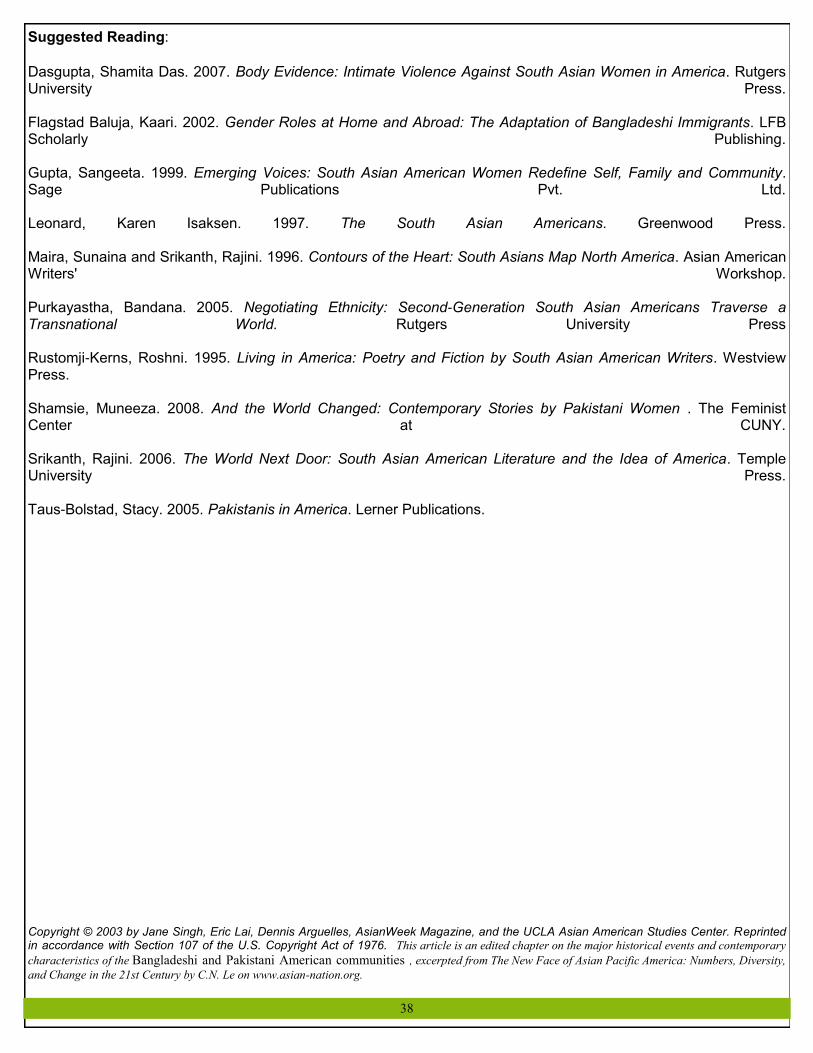
Suggested Reading:
Dasgupta, Shamita Das. 2007. Body Evidence: Intimate Violence Against South Asian Women in America. Rutgers University Press. Flagstad Baluja, Kaari. 2002. Gender Roles at Home and Abroad: The Adaptation of Bangladeshi Immigrants. LFB Scholarly Publishing. Gupta, Sangeeta. 1999. Emerging Voices: South Asian American Women Redefine Self, Family and Community. Sage Publications Pvt. Ltd. Leonard, Karen Isaksen. 1997. The South Asian Americans. Greenwood Press. Maira, Sunaina and Srikanth, Rajini. 1996. Contours of the Heart: South Asians Map North America. Asian American Writers' Workshop. Purkayastha, Bandana. 2005. Negotiating Ethnicity: Second-Generation South Asian Americans Traverse a Transnational World. Rutgers University Press Rustomji-Kerns, Roshni. 1995. Living in America: Poetry and Fiction by South Asian American Writers. Westview Press. Shamsie, Muneeza. 2008. And the World Changed: Contemporary Stories by Pakistani Women . The Feminist Center at CUNY. Srikanth, Rajini. 2006. The World Next Door: South Asian American Literature and the Idea of America. Temple University Press. Taus-Bolstad, Stacy. 2005. Pakistanis in America. Lerner Publications.
Copyright © 2003 by Jane Singh, Eric Lai, Dennis Arguelles, AsianWeek Magazine, and the UCLA Asian American Studies Center. Reprinted in accordance with Section 107 of the U.S. Copyright Act of 1976. This article is an edited chapter on the major historical events and contemporary
characteristics of the Bangladeshi and Pakistani American communities , excerpted from The New Face of Asian Pacific America: Numbers, Diversity,
and Change in the 21st Century by C.N. Le on www.asian-nation.org.

CA
MB
OD
IAN

40
Overcoming Unimaginable Atrocities
Located in the heart of Southeast Asia, Cambodia is a small country about the physical size of the state of Oklahoma, bordered by Laos, Vietnam, and Thailand. The country, despite being officially neutral, inevitably found itself embroiled in the Vietnam War and its own Communist uprising in the form of the Khmer Rouge, led by Pol Pot.
From 1969 to 1973, the U.S. secretly conducted air-bombing raids on North Vietnamese troops over the Cambodian border, despite Cambodia's neutrality. The bombings caused numerous Cambodian civilian casualties and damage to land and property that increased anti-American sentiment and a rise in the support for the communist Khmer Rouge. When U.S. forces withdrew from the region in 1975, the Khmer Rouge soon defeated the U.S.-dependent Cambodian government.
After taking power in April 1975, the Khmer Rouge began to implement a wholesale restructuring of Cambodian society with the intent of creating an agrarian socialist state. The mechanism for this change was forced labor camps and the systematic murder of all political opposition, ethnic minority groups, individuals from religious, professional and educated segments of society, and all others who questioned the new order. The Khmer Rouge dissolved institutions such as banks, hospitals, schools, stores, religion, and attempted to unravel the fabric of the family. Children were separated from their parents to work in mobile groups or as soldiers.
In proportion, the genocide in Cambodia rivals that of the Jewish holocaust. During the Khmer Rouge's reign from 1975 to 1979, about one-third of the Cambodian population died by starvation, torture or execution -- 2 million in total. In 1979, the Vietnamese government wrested control of the country, putting an end to Khmer Rouge rule.
With the fall of the Khmer Rouge and Vietnamese occupation, 600,000 refugees fled to refugee camps along the Thai border. Although refugees began arriving in the United States after the fall of Cambodia in 1975, the overthrow of the Khmer Rouge in 1979 marked the true beginning of the Cambodian mass exodus and arrival in America.
Demographic and Community Challenges
The 1980 Census was the first to count Cambodians in the United States. It found 16,044, of which nearly half that number (7,739) had been admitted as refugees. During the 1980s, liberal refugee admission policies helped the Cambodian American population increase nine times to 149,047 in the 1990 Census. According to Immigration and Naturalization Service (now reorganized as the U.S. Citizenship and Immigration Services) statistics, 114,064 Cambodians were admitted as refugees during the 1980s.
Refugee admissions tapered off sharply in the 1990s -- from 1991 to 1998, only 6,150 Cambodians were admitted as refugees. The Cambodian community continued to grow, however. As of 2000, there were 171,937 Cambodians of single descent, a 13 percent increase over 1990, and 206,052 Cambodians, including those of mixed-race and mixed-ethnicity.
It should be noted that measuring the demographics of the Cambodian American community has historically been challenging; it is widely suspected that the community is repeatedly undercounted by the Census Bureau. A 1992 report sponsored by the Center of Survey Methods Research of the Census Bureau identified language barriers, mistrust of strangers and the government, and unusual residence and household composition as significantly affecting Census counts.
Since the implementation of 1996 immigration and welfare reform laws, Cambodians have been caught up in a dragnet of immigration policies and social service policies that limit benefits to non-citizens and require the mandatory detention and deportation of those convicted of crimes. Although a number of Cambodians have

41
managed to find success in the United States, many continue to face challenges related to their refugee resettlement experience.
Applying the Lessons of Survival
The community as a whole, according to 1990 Census data available at the time of this writing, still deals with a high poverty rate (47 percent), poor English fluency (56 percent are rated as "linguistically isolated"), and low levels of educational achievement (only 6 percent of Cambodians over the age of 25 have a bachelor's degree from a university).
Learning English is a challenge for many Cambodians, who by and large arrived with a lack of formal education. The Khmer Rouge genocide decimated the educated and professional classes. As a result, Southeast Asian refugees (not including the Vietnamese), of whom Cambodians are a prominent percentage, have the lowest educational level, averaging just 3.1 years of schooling before arriving in the United States.
This language barrier has made it difficult for many first-generation Southeast Asian Americans to become full-fledged citizens because they are unable to pass the English- language portion of the citizenship test. Due to the fact their parents have not become citizens, the 1.5 generation of Cambodian Americans (young people who arrived as infants or small children but have largely grown up in America) remain non- citizens. This has made them particularly vulnerable to changes in U.S. policies directed broadly at "aliens" or non-citizens.
Having survived near-starvation, violence, and torture, many Cambodians in this country still continue to struggle with day-to-day survival and consequently lack interest in civic participation. Because of their histories of being oppressed by the government, some Cambodians continue to harbor fear and distrust of the government and remain largely ignorant of their civic responsibilities.
In looking at the past twenty years of Cambodian American history, it is clear that the community has come along way in a short period, but there is still much work to be done. Through greater civic and political participation, Cambodian Americans can guide their own course, empower themselves, and foster positive community development.

42
Suggested Reading:
Canniff, Julie G. 2001. Cambodian Refugees' Pathways to Success: Developing a Bi-Cultural Identity . LFB Scholarly Publishing. Chan, Sucheng . 2004. Survivors: Cambodian Refugees in the United States. University of Illinois Press. Chandler, David. 2007. A History of Cambodia. Westview Press. Coates, Karen J. 2006. Cambodia Now: Life In the Wake of War. McFarland and Company. Das, Mitra. 2006. Between Two Cultures: The Case of Cambodian Women in America. Peter Lang Publishing. Hein, Jeremy Hein. 2006. Ethnic Origins: The Adaptation of Cambodian and Hmong Refugees in Four American Cities. Russell Sage Foundation Publications. Pran, Dith and Kim DePaul. 1999. Children of Cambodia's Killing Fields: Memoirs by Survivors. Yale University Press. Smith-Hefner, Nancy J. 1999. Khmer American: Identity and Moral Education in a Diasporic Community. University of California Press. Streed, Sarah. 2002. Leaving the House of Ghosts: Cambodian Refugees in the American Midwest. McFarland and Company. Cambodian Rocks Volume 1 (Audio CD), Various Artists. Label: Khmer Rocks.
Copyright © 2003 by Porthira Chhim, Eric Lai, Dennis Arguelles, AsianWeek Magazine, and the UCLA Asian American Studies Center. Reprinted in accordance with Section 107 of the U.S. Copyright Act of 1976. This article is an edited chapter on the major historical events and contemporary characteristics of the Cambodian community , excerpted from The New Face of Asian Pacific America: Numbers, Diversity, and Change in the 21st Century by C.N. Le on www.asian-nation.org.

CH
INE
SE

44
Dreams And Reality Diverge Chinese Americans are the oldest and largest ethnic group of Asian ancestry in the United States. They have endured a long history of migration and settlement that dates back to the late 1840s, including some 60 years of legal exclusion. In the mid-l9th century, most Chinese immigrants arrived in Hawaii and the U.S. mainland as contract labor, working at first in the plantation economy in Hawaii and in the mining industry on the West Coast and later on the transcontinental railroads west of the Rocky Mountains.
But few realized their gold dreams; many found themselves instead easy targets of discrimination and exclusion. In the 1870s, white workers' frustration with economic distress, labor market uncertainty, and capitalist exploitation turned into anti-Chinese sentiment and racist attacks against the Chinese called them the "yellow peril." In 1882, the U.S. Congress passed the Chinese Exclusion Act, and later extended to exclude all Asian immigrants until World War II. The number of new immigrants arriving in the United States from China dwindled from 123,000 in the 1870s to 14,800 in the 1890s, and then to a historically low number of 5,000 in the 1930s.
Legal exclusion, augmented by extralegal persecution and anti-Chinese violence, effectively drove the Chinese out of the mines, farms, woolen mills, and factories on the West Coast. As a result, many Chinese laborers already in the United States lost hope of ever fulfilling their dreams and returned permanently to China. Others, who could not afford or were too ashamed to return home, gravitated toward San Francisco's Chinatown for self-protection.
Still others traveled eastward to look for alternative means of livelihood. Chinatowns in the Northeast, particularly New York, and the mid-West grew to absorb those fleeing the extreme persecution in California. The gender imbalance for Chinese was nearly 27 males per single female in 1890. That dropped steadily over time, but males still outnumbered females by more than 2:1 by the 1940s.
Building A Community In much of the pre-World War II era, the Chinese American community was essentially an isolated bachelors' society consisting of a small merchant class and a vast working class of sojourners (temporary immigrants who intended to return home after making money working in the U.S.). After the 1950s, when hundreds of refugees and their families fled Communist China and arrived in the U.S. and particularly since the enactment of the 1965 Hart-Cellar Act, the ethnic community has experienced unprecedented demographic and social transformation from a bachelors' society to a family community.
Contemporary Chinese immigrants have arrived not only from mainland China, but also from the greater Chinese Diaspora- Hong Kong, Taiwan, Vietnam, Cambodia, Malaysia, and the Americas. They have also come from diverse socioeconomic backgrounds. Some arrived in the United States with little money, minimum education, and few job skills, which forced them to take low-wage jobs and settle in deteriorating urban neighborhoods. Others came with family savings, education and skills far above the levels of average Americans.
Nationwide, levels of educational attainment among Chinese Americans were significantly higher than those of the general U.S. population in both 1980 and 1990, and skill level increased over time. The 1990 Census showed that 41 percent of Chinese Americans (aged 25 to 64) have attained four or more years of college education, compared to 21 percent of non-Hispanic whites.
Immigrants from Taiwan displayed the highest levels of educational attainment with 62 percent having completed at least four years of college, followed by those from Hong Kong (46 percent) and from the mainland (31 percent). Professional occupations were also more common among Chinese Americans than among non- Hispanic whites (36 percent vs. 27 percent). The annual median family income for Chinese Americans was $34,000 in 1989, compared to $30,000 for the national median family.
45
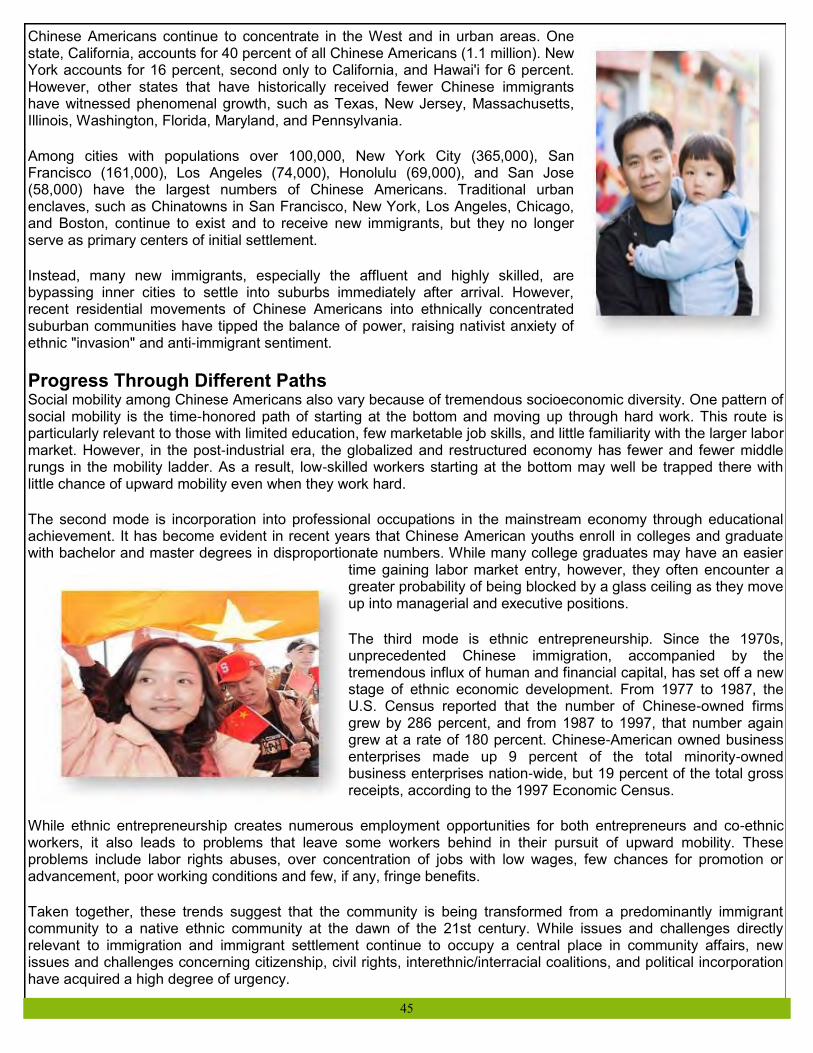
Chinese Americans continue to concentrate in the West and in urban areas. One state, California, accounts for 40 percent of all Chinese Americans (1.1 million). New York accounts for 16 percent, second only to California, and Hawai'i for 6 percent. However, other states that have historically received fewer Chinese immigrants have witnessed phenomenal growth, such as Texas, New Jersey, Massachusetts, Illinois, Washington, Florida, Maryland, and Pennsylvania.
Among cities with populations over 100,000, New York City (365,000), San Francisco (161,000), Los Angeles (74,000), Honolulu (69,000), and San Jose (58,000) have the largest numbers of Chinese Americans. Traditional urban enclaves, such as Chinatowns in San Francisco, New York, Los Angeles, Chicago, and Boston, continue to exist and to receive new immigrants, but they no longer serve as primary centers of initial settlement.
Instead, many new immigrants, especially the affluent and highly skilled, are bypassing inner cities to settle into suburbs immediately after arrival. However, recent residential movements of Chinese Americans into ethnically concentrated suburban communities have tipped the balance of power, raising nativist anxiety of ethnic "invasion" and anti-immigrant sentiment.
Progress Through Different Paths
Social mobility among Chinese Americans also vary because of tremendous socioeconomic diversity. One pattern of social mobility is the time-honored path of starting at the bottom and moving up through hard work. This route is particularly relevant to those with limited education, few marketable job skills, and little familiarity with the larger labor market. However, in the post-industrial era, the globalized and restructured economy has fewer and fewer middle rungs in the mobility ladder. As a result, low-skilled workers starting at the bottom may well be trapped there with little chance of upward mobility even when they work hard.
The second mode is incorporation into professional occupations in the mainstream economy through educational achievement. It has become evident in recent years that Chinese American youths enroll in colleges and graduate with bachelor and master degrees in disproportionate numbers. While many college graduates may have an easier
time gaining labor market entry, however, they often encounter a greater probability of being blocked by a glass ceiling as they move up into managerial and executive positions.
The third mode is ethnic entrepreneurship. Since the 1970s, unprecedented Chinese immigration, accompanied by the tremendous influx of human and financial capital, has set off a new stage of ethnic economic development. From 1977 to 1987, the U.S. Census reported that the number of Chinese-owned firms grew by 286 percent, and from 1987 to 1997, that number again grew at a rate of 180 percent. Chinese-American owned business enterprises made up 9 percent of the total minority-owned business enterprises nation-wide, but 19 percent of the total gross receipts, according to the 1997 Economic Census.
While ethnic entrepreneurship creates numerous employment opportunities for both entrepreneurs and co-ethnic workers, it also leads to problems that leave some workers behind in their pursuit of upward mobility. These problems include labor rights abuses, over concentration of jobs with low wages, few chances for promotion or advancement, poor working conditions and few, if any, fringe benefits.
Taken together, these trends suggest that the community is being transformed from a predominantly immigrant community to a native ethnic community at the dawn of the 21st century. While issues and challenges directly relevant to immigration and immigrant settlement continue to occupy a central place in community affairs, new issues and challenges concerning citizenship, civil rights, interethnic/interracial coalitions, and political incorporation have acquired a high degree of urgency.

46
Suggested Reading:
Chan, Sucheng and Madeline Hsu (Eds.). 2008. Chinese Americans and the Politics of Race and Culture. Temple University Press.
Chang, Iris. 2003. The Chinese in America: A Narrative History. Amazon Remainders Account.
Chen, Shehong. 2006. Being Chinese, Becoming Chinese American. University of Illinois Press.
Kwong, Peter and Dusanka Miscevic. 2007. Chinese America: The Untold Story of America's Oldest New Community. New Press.
Lau, Estelle and Estelle Lau. 2006. Paper Families: Identity, Immigration Administration, and Chinese Exclusion. Duke University Press.
Pfaelzer, Jean. 2008. Driven Out: The Forgotten War Against Chinese Americans. University of California Press.
Toyota, Tricia. 2009. Envisioning America: New Chinese Americans and the Politics of Belonging. Stanford University Press.
Yung, Judy, Gordon Chang, and Him Mark Lai (Eds.). 2006. Chinese American Voices: From the Gold Rush to the Present. University of
California Press.
Zhou, Min. 2009. Contemporary Chinese America: Immigration, Ethnicity, and Community Transformation. Temple University Press.
Zinzius, Birgit. 2005. Chinese America: Stereotype and Reality: History, Present, and Future of the Chinese Americans. Peter Lang
Publishing.
Copyright © 2003 by Min Zhou, Eric Lai, Dennis Arguelles, AsianWeek Magazine, and the UCLA Asian American Studies Center. Reprinted in accordance with Section 107 of the U.S. Copyright Act of 1976. This article is an edited chapter on the major historical events and contemporary characteristics of the Chinese community , excerpted from The New Face of Asian Pacific America: Numbers, Diversity, and Change in the 21st Century by C.N. Le on www.asian-nation.org.

47
FIL
IPIN
O
48
The Philippines and the U.S.: An Enduring Connection
The Filipino American population first started booming after the Philippines became a territory of the United States in 1898. They arrived as laborers, mostly in agriculture and domestic service, and as students. By 1930, the Filipino American population numbered 45,026. Since 1970, the Filipino population has grown nearly seven times, from 336,731 to 2,364,815, making up almost one percent of the national population. This includes hapas of part-Filipino ancestry, who make up 22 percent of the Filipino American population the third-highest rate among major APA groups (behind Native Hawaiians and Japanese).
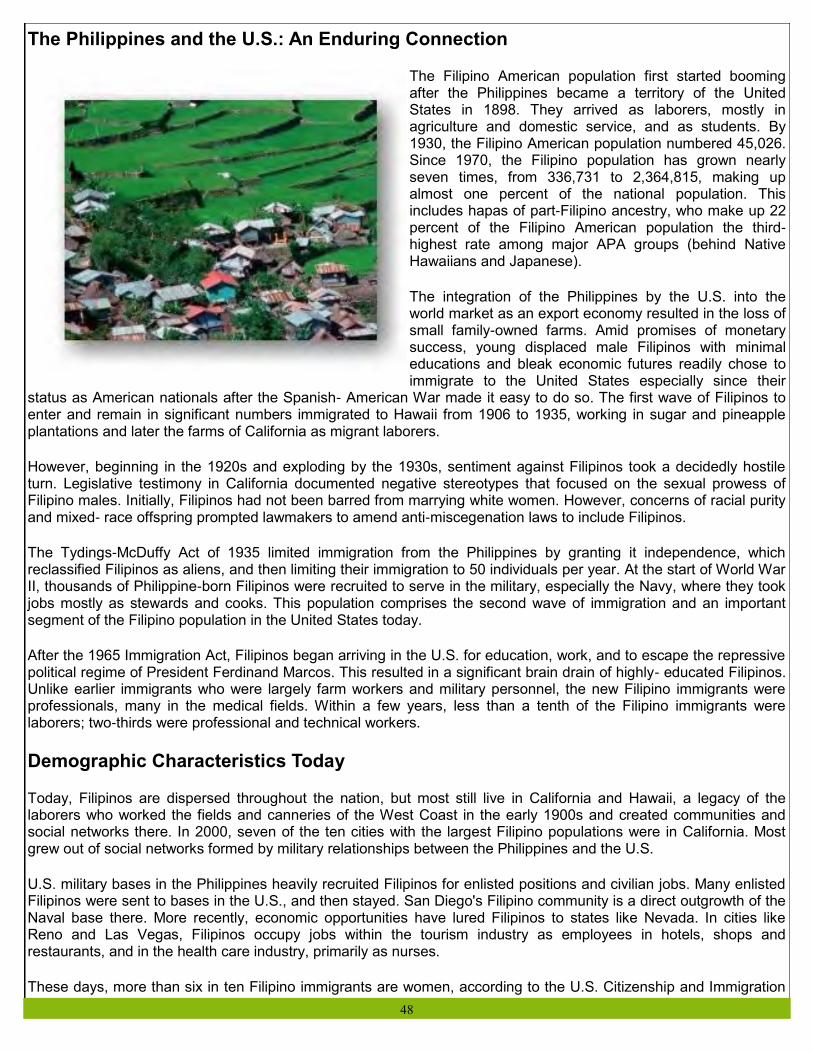
The integration of the Philippines by the U.S. into the world market as an export economy resulted in the loss of small family-owned farms. Amid promises of monetary success, young displaced male Filipinos with minimal educations and bleak economic futures readily chose to immigrate to the United States especially since their
status as American nationals after the Spanish- American War made it easy to do so. The first wave of Filipinos to enter and remain in significant numbers immigrated to Hawaii from 1906 to 1935, working in sugar and pineapple plantations and later the farms of California as migrant laborers.
However, beginning in the 1920s and exploding by the 1930s, sentiment against Filipinos took a decidedly hostile turn. Legislative testimony in California documented negative stereotypes that focused on the sexual prowess of Filipino males. Initially, Filipinos had not been barred from marrying white women. However, concerns of racial purity and mixed- race offspring prompted lawmakers to amend anti-miscegenation laws to include Filipinos.
The Tydings-McDuffy Act of 1935 limited immigration from the Philippines by granting it independence, which reclassified Filipinos as aliens, and then limiting their immigration to 50 individuals per year. At the start of World War II, thousands of Philippine-born Filipinos were recruited to serve in the military, especially the Navy, where they took jobs mostly as stewards and cooks. This population comprises the second wave of immigration and an important segment of the Filipino population in the United States today.
After the 1965 Immigration Act, Filipinos began arriving in the U.S. for education, work, and to escape the repressive political regime of President Ferdinand Marcos. This resulted in a significant brain drain of highly- educated Filipinos. Unlike earlier immigrants who were largely farm workers and military personnel, the new Filipino immigrants were professionals, many in the medical fields. Within a few years, less than a tenth of the Filipino immigrants were laborers; two-thirds were professional and technical workers.
Demographic Characteristics Today
Today, Filipinos are dispersed throughout the nation, but most still live in California and Hawaii, a legacy of the laborers who worked the fields and canneries of the West Coast in the early 1900s and created communities and social networks there. In 2000, seven of the ten cities with the largest Filipino populations were in California. Most grew out of social networks formed by military relationships between the Philippines and the U.S.
U.S. military bases in the Philippines heavily recruited Filipinos for enlisted positions and civilian jobs. Many enlisted Filipinos were sent to bases in the U.S., and then stayed. San Diego's Filipino community is a direct outgrowth of the Naval base there. More recently, economic opportunities have lured Filipinos to states like Nevada. In cities like Reno and Las Vegas, Filipinos occupy jobs within the tourism industry as employees in hotels, shops and restaurants, and in the health care industry, primarily as nurses.
These days, more than six in ten Filipino immigrants are women, according to the U.S. Citizenship and Immigration

49
Services. Three major factors explain why female immigration is on the rise: preference and non-preference quotas; globalization of the economy has created a feminization of labor; and export-led growth strategy has weakened the Philippine's domestic market economy.
In 1980, the Philippines replaced China and Japan as the Asian country sending the largest number of immigrants to the United States. By the 1990s, the Philippines sent more immigrants than any country except Mexico. Among illegal immigrants in the U.S., those from the Philippines rank sixth. The portion of the Filipino American population that is foreign-born is declining: from 69 percent in 1990 to 50 percent between 1998 and 2000 (29 percent were second generation and 21 percent were third generation or later).
In 1986, the passage of the Immigration Marriage Fraud Amendments enacted stiff penalties for marriage fraud. The 1990 Immigration Act limited the number of family-sponsored preference visas, which continue to decline each year. Instead, employment-based preferences mostly temporary are on the rise and have become the foremost means of entry for Filipinos to the United States.
More recently, the Absconder Apprehension Initiative was developed as part of the U.S. Department of Justice's anti-terrorist campaign. As a result, record high numbers of Filipinos are being deported. The Philippines were among those singled out as "al Qaeda active nations" because of Abu Sayyaf terrorists in Basilan Island, despite the fact that it is only one of 7,100 islands in the Philippines.
Although Philippine President Arroyo was among the very first heads of state to declare support for the anti-terrorist war declared by the Bush administration, no protections have been offered to prevent innocent Filipinos from being victims of racial profiling, interrogation, and selective deportation. The upsurge in deportations may partly explain the decrease in foreign-born Filipinos from 1998 to the present. Together, these immigration policies have reversed the tides of opportunity and have made it more difficult for illegal and legal immigrants to move up the ladder of social mobility.
Facing External Challenges and Internal Diversity
For Filipino Americans already in the U.S., their economic mobility continues to be hampered by the global restructuring of the economy. In the last thirty years, many American cities have recruited Filipino nurses to meet shortages in their hospitals. Recently, Filipino school teachers are also in demand, although in most cases, they must pay their own way to America and fork over application and processing fees; teacher-strapped school districts are enjoying a free lunch in this regard. As a result, many Filipinos occupy low- wage and middle-wage sector jobs that offer very little opportunity to advance up a higher-paying career ladder.
As another example of continuing inequality toward Filipino Americans, only recently have Filipino veterans have been able to secure full veterans benefits for their service during World War II. Also, in the wake of 9/11, hundreds of Filipino airport screeners have been laid off and not rehired for better paid federal screener jobs, despite decades of experience, because they were not U.S. citizens.
Filipinos continue to be one of the largest APA groups due to immigration and increased childbearing. Filipino immigration has decreased during the past decade, and there is no telling whether it will once again be on the rise. But the continuing
nurse and teacher shortage will mean significant streams of low-/semi-skilled and skilled workers from the Philippines will continue to emigrate.
Segments of the Filipino American population are succeeding. An increasing majority of Filipinos is moving to the suburbs, which is one marker of economic success. The relatively young and middle-aged population and increasing educational attainment levels also indicates that second and third generation Filipino Americans will possess greater

50
employment and earnings opportunities than their parents. Filipino Americans remain a population that is diverse on many levels that must be seen in relation to, not in isolation of, each other.
Suggested Reading
Bonus, Rick. 2000. Locating Filipino Americans . Temple University Press.
Choy, Catherine Ceniza. 2003. Empire of Care: Nursing and Migration in Filipino American History. Duke University Press.
Espana-Maram, Linda. 2006. Creating Masculinity in Los Angeles's Little Manila: Working-Class Filipinos and Popular Culture in the
United States. Columbia University Press.
Espiritu, Yen Le. 2003. Home Bound: Filipino American Lives across Cultures, Communities, and Countries. University of California Press.
Gutierrez, Tiongson (Ed.). 2006. Positively No Filipinos Allowed: Building Communities and Discourse. Temple University Press.
Jamero, Peter M. 2006. Growing Up Brown: Memoirs of a Filipino American . University of Washington Press.
Lott, Juanita Tamayo. 2006. Common Destiny: Filipino American Generations. Rowman & Littlefield Publishers
Mendoza, Susanah. 2001. Between the Homeland and the Diaspora: The Politics of Theorizing Filipino and Filipino American Identities.
Routledge.
Nadal, Kevin L. 2009. Filipino American Psychology: A Handbook of Theory, Research, and Clinical Practice. AuthorHouse Publishers.
Rafael, Vincente L. 2000. White Love and Other Events in Filipino History. Duke University Press.
Copyright © 2003 by Melany Dela Cruz, Pauline Agbayani-Siewart, Eric Lai, Dennis Arguelles, AsianWeek Magazine, and the UCLA Asian American Studies Center. Reprinted in accordance with Section 107 of the U.S. Copyright Act of 1976. This article is an edited chapter on the major historical events and contemporary characteristics of the Filipino community , excerpted from The New Face of Asian Pacific America: Numbers, Diversity, and Change in the 21st Century by C.N. Le on www.asian-nation.org.
51
HM
ON
G

52
A Population Without a Nation
The Hmong people are an ethnic group whose origins go back about 3,000 years in China. Most Hmong about eight million still live in southwestern China. Another four million live in the Southeast Asian countries of Thailand, Burma, Laos and Vietnam, where they immigrated during the 19th century following centuries of persecution in China. There, they existed mostly as farmers living in rural areas.
The first Hmong migration of notable size to the United States began with the fall of Saigon and Laos to Communist forces in 1975. Many Hmong had worked with pro-American anti-Communist forces during the conflicts in Vietnam and Laos. As a result, they were subject to violence and retribution in Laos. Many Hmong escaped Laos to Thailand where they were incarcerated in refugee camps.
From 1981 to 1986, the number of Hmong refugees slowed to a few thousand each year, but admissions picked up again between 1987 and 1994, when about 56,000 Hmong refugees were accepted. After 1994, Hmong refugee admissions slowed to a trickle as most of the Thai camps were by now empty, with the remaining Hmong repatriated to Laos. Also, Hmong immigration based on family reunification remains low, especially compared to other Southeast Asian ethnic groups.
With the first wave that arrived in the late 1970s and early 1980s, voluntary resettlement agencies purposely tried to disperse the Hmong around the country, such as Providence (RI), Philadelphia, Chicago, Des Moines, Iowa, Kansas City (KS), Denver, Missoula (MT), Tulsa, and Salt Lake City. This strategy, however, proved unsuccessful as many Hmong were settled in a poor, predominantly African American neighborhoods where they encountered much hostility and violence.
Also, many Hmong wished to be reunited with family and clan members. These reasons led to a massive shift of the Hmong population in the mid-to- late 1980s to central California cities like Fresno, Stockton, and Merced, and to a lesser extent, to Minnesota and Wisconsin. The 2000 Census counted 186,310 Hmong Americans across the U.S. (single race or part-Hmong), representing a nearly 90 percent increase in the population from 1990. Many agree, however, that the figure is probably a significant undercount.
Building a New Home
During the 1990s, the Hmong moved again: away from the West and towards the Midwest and the South. This shift was epitomized by the emergence of Minneapolis and St. Paul as the unofficial capitals of Hmong America, taking over from Fresno. About half of Hmong today live in the Midwest, mostly in Minnesota, Wisconsin and Michigan, compared to 41 percent in 1990. Meanwhile, the proportion of Hmong in the Western states fell to 42 percent in 2000 from 55 percent in 1990. Around 6 percent of the Hmong now live in the South (with most in North and South Carolina), an impressive increase from just 1.3 percent in 1990. In 2000, the Hmong population numbered in the Northeastern states remained very small, at just 2 percent.
Why did Minneapolis-St. Paul emerge as the new Hmong American capital? The opportunity to make a better life seems to be at the heart of things. "The cost of living is cheaper here than in California," Lee Pao Xiong, president of the Urban Coalition in St. Paul, told the Associated Press. "The quality of education is better here, and jobs are available here." Xiong said he's recruited 10 families from his own extended family to come here from California in recent years. "They came here and they found jobs within a month or two and are making ten, eleven, twelve dollars an hour," he said.
A 2002 community directory provides listings of 13 Hmong community organizations and 39 Hmong religious congregations in the Minneapolis-St. Paul area. Whereas many Hmong in California's Central Valley have taken up their old occupations of farming, those in Minneapolis have found jobs working in factories. But there is a substantial emerging class of Hmong small business owners -- many of them congregated near St. Paul's University Avenue --
53
and college-educated Hmong professionals going into fields like law, medicine, and non-profit management. And the United States' first Hmong politician, a 32-year-old female lawyer named Mee Moua, was elected to the Minnesota State Senate in 2002.
The Hmong came to America less-prepared for the modern capitalistic society of their new home than most other immigrant groups. Most had been farmers in their native country, and did not graduate from high school or the equivalent. As a result, many Hmong families when they first arrived were forced to go on public assistance. Data from the 2000 Census shows considerable upward socioeconomic movement, as many Hmong settled into stable or more lucrative jobs.
Looking to the Future
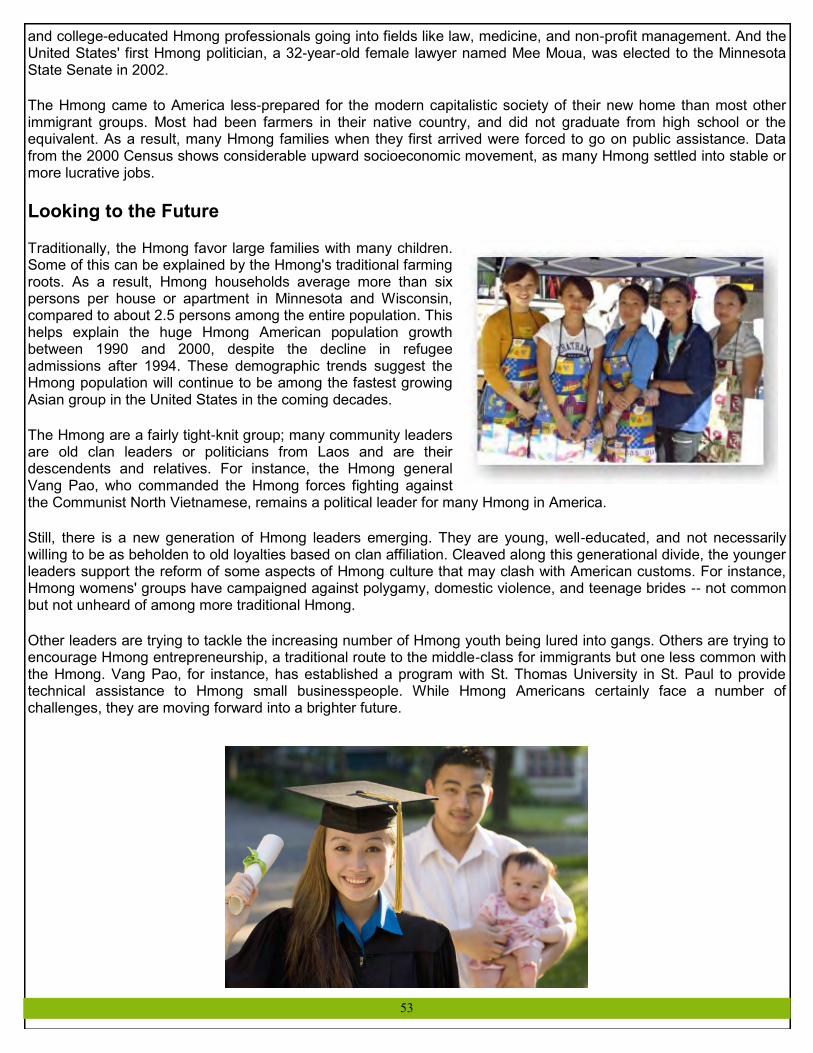
Traditionally, the Hmong favor large families with many children. Some of this can be explained by the Hmong's traditional farming roots. As a result, Hmong households average more than six persons per house or apartment in Minnesota and Wisconsin, compared to about 2.5 persons among the entire population. This helps explain the huge Hmong American population growth between 1990 and 2000, despite the decline in refugee admissions after 1994. These demographic trends suggest the Hmong population will continue to be among the fastest growing Asian group in the United States in the coming decades.
The Hmong are a fairly tight-knit group; many community leaders are old clan leaders or politicians from Laos and are their descendents and relatives. For instance, the Hmong general Vang Pao, who commanded the Hmong forces fighting against the Communist North Vietnamese, remains a political leader for many Hmong in America.
Still, there is a new generation of Hmong leaders emerging. They are young, well-educated, and not necessarily willing to be as beholden to old loyalties based on clan affiliation. Cleaved along this generational divide, the younger leaders support the reform of some aspects of Hmong culture that may clash with American customs. For instance, Hmong womens' groups have campaigned against polygamy, domestic violence, and teenage brides -- not common but not unheard of among more traditional Hmong.
Other leaders are trying to tackle the increasing number of Hmong youth being lured into gangs. Others are trying to encourage Hmong entrepreneurship, a traditional route to the middle-class for immigrants but one less common with the Hmong. Vang Pao, for instance, has established a program with St. Thomas University in St. Paul to provide technical assistance to Hmong small businesspeople. While Hmong Americans certainly face a number of challenges, they are moving forward into a brighter future.

54
Suggested Readings
Cha, Dia. 2003. Hmong American Concepts of Health, Healing and Conventional Medicine. Routledge. Chan, Suchen (Ed.). 1994. Hmong Means Free: Life in Laos and America. Temple University Press. Faderman, Lillian. 1999. I Begin My Life All Over: The Hmong and the American Immigrant Experience. Beacon Press. Fadiman, Anne. 1998. The Spirit Catches You and You Fall Down. Farrar, Strauss, and Giroux. Hein, Jeremy Hein. 2006. Ethnic Origins: The Adaptation of Cambodian and Hmong Refugees in Four American Cities. Russell Sage Foundation Publications. Miyarees, Ines M. 1998. The Hmong Refugees Experience in the United States: Crossing the River. Routledge. Moua, Mai Neng. 2002. Bamboo Among the Oaks: Contemporary Writing by Hmong Americans. Minnesota Historical Society Press. Symonds, Patricia V. 2005. Calling In The Soul: Gender and the Cycle of Life in a Hmong Village. University of Washington Press. Vang, Chia. 2008. Hmong in Minnesota. Minnesota Historical Society Press. Yang, Kao Kalia. 2008. The Latehomecomer: A Hmong Family Memoir. Coffee House Press.
Copyright © 2003 by Mark E. Pfeifer, Eric Lai, Dennis Arguelles, AsianWeek Magazine, and the UCLA Asian American Studies Center. Reprinted in accordance with Section 107 of the U.S. Copyright Act of 1976.This article is an edited chapter on the major historical events and contemporary characteristics of the Hmong community , excerpted from The New Face of Asian Pacific America: Numbers, Diversity, and Change in the 21st Century by C.N. Le on www.asian-nation.org.

IND
IAN

56
Diverse Origins and Destinations
Indians had come to the United States as early as 1820. But the distance and restrictive immigration quotas meant that by the end of the 19th century, less than 800 Indians are recorded to have emigrated here. No wonder that when four Sikhs were allowed to land in San Francisco on April 6, 1899, it was a newsworthy event. It was unclear what happened to those Sikhs, but soon many other Sikhs followed, also seeking their fortunes.
Small Sikh male worker communities soon sprang up all along the West Coast. From the early 1900s until 1922, there were up to 100 Hindus working at a timber mill near Portland, Oregon, with their neighborhood nicknamed "Hindu Alley." In San Francisco, a Hindu temple was dedicated in 1908. In the Central Valley city of Stockton, California, the first organized society of Sikhs was formed in 1911, with a temple built the following year. And in 1912, six Indians enrolled as students at UC Berkeley.
Relations were not always so harmonious, as Indians were seen as a threat for jobs by local workers. In 1907, in the city of Bellingham, Washington, a mob of about 500 men attacked boarding houses and mills, forcing about 300 Indians to flee. And restrictive laws, such as the 1913 Alien Land Law in California aimed at preventing Chinese and Japanese from owning and farming land, also affected Indian immigrants.
No significant immigration took place until the 1965 Immigration Act. Only 7,629 immigrants from South Asia are said to have arrived in the United States by 1965. The 2000 Census counted nearly 1.7 million non-mixed Asian Indians, a 100 percent increase over 1990, and an increase of almost five times over the 1980 population.
A significant proportion of the Indian American population are ethnic Indo-Caribbeans. Indians were brought by the British to the Caribbean beginning in the early 1800s as indentured workers. The majority went to three countries -- Guyana, Trinidad and Tobago, and Suriname -- but others went to Jamaica, St. Lucia, and other countries up until the early 20th century. Even today, Indians comprise about half of the population of Guyana, while in Trinidad and Tobago, Indians comprise about forty percent of the population. The Census does not track lndo-Caribbeans separately; they may identify themselves as Asian Indian or Pakistani, or choose the Caribbean country of origin.
Demographic Characteristics
An East-West Center study of Asian Indians in the United States based on 1980 Census data concluded that Asian Indians are extremely well-assimilated economically, but very diversified in other areas such as cultural, religious, and other dimensions. According to the recent Census data, Indians had the highest median household income, family income, per capita income, and annual median income of any foreign-born group.
The Asian Indian American population is dominated by young working-age people. Nearly four in ten are between the ages of 20 and 40. The true figure may have been even higher; some temporary immigrant workers (such as H1-B visa holders) and their families might not have completed the 2000 Census forms due to confusion over whether they should complete the Census forms (they were supposed to). The Asian Indian community is not only very young compared to the white population, it is aging slowly. The median age changed from 28.9 years in 1990 to 30 years old in 2000.
Slightly more than one-quarter of the Asian Indians in the United States were born in the United States. 51.3 percent
57
were born in India; another ten-plus percent were born in other countries such as Pakistan, Bangladesh, and Guyana, where a sizable Indian population lives. That leaves about 15 percent born in other parts of the world, such as the Caribbean, evidence of the wide scope of the Indian diaspora.
Asian Indians are highly concentrated in the Northeastern part of the United States. About 35 percent live there, with more than 400,000 Asian Indians calling the New York City metropolitan area home. Southern and Western regions of the United States serve as homes to more than half of Asian Indians. The San Francisco Bay Area has the highest percentage of Asian Indians.
Success and Mobility, But With Some Exceptions
The educational attainment of Asian Indians far exceeds those of local populations for any given marital status or age group. It is important to note that most Asian Indians allowed to emigrate to the United States have completed their bachelor's or master's degree. This selectivity is an important factor that contributes to higher levels of education among Asian Indian Americans. The 2000 Census data shows that about 54 percent of Asian Indians held a professional or college education. Among Asian Indians 20 years or older, only 25 percent have high school diplomas or lower, with the remaining 75 percent population having some college or professional degree.
The average salary earned by an individual Asian Indian worker in 2000 was $29,745. The difference is wide between the sexes: males' average annual salary was $40,551, compared to $16,078 for females. These gender differences closely follow the educational differences noted earlier and the type of employment sought by Asian Indian males and females.
There are ongoing debates on whether Asian Indians should be included in affirmative action policies, and whether businesses owned by Asian Indians should qualify for minority status. For instance, some Chinese Americans in San Francisco protested against including Asian Indians among beneficiaries of a citywide affirmative action program aimed at under-represented Asian Pacific Americans.
The demographics of Asian Indians in 2000 were very favorable for them to advance socioeconomically as a group. The percentage of young, working people is very high relative to the number of elderly and children. Provided with equal opportunity, this youthful community looks set to achieve high levels of education, climb the occupational ranks, and increase their incomes and wealth. While Asian Indians do boast the highest median household
income for any ethnic group in the country, the mainstream media often ignores the possibility that their incomes may lower than whites with similar educations and degrees.
Furthermore, the 2000 Census showed that many Asian Indian households had relatives living with them meaning that the larger average household size is a big reason for the larger household incomes. Finally, the concentration of Asian Indians predominantly in East and West Coast cities, means that the higher cost of living there also offsets any gains in household incomes. The bottom line is that it is very likely that when one controls for educational achievement and experience, Asian Indians may still be earning significantly lower wages than majority population with similar characteristics.
58
Suggested Reading
Alexander, George P. 2006. New Americans: The Progress of Asian Indians in America . Stonewood Publishing Company. Bacon, Jean. 1997. Life Lines: Community, Family, and Assimilation among Asian Indian Immigrants. Oxford University Press. Bhatia, Sunil. 2007. American Karma: Race, Culture, and Identity in the Indian Diaspora. NYU Press. Dhingra, Pawan. 2007. Managing Multicultural Lives: Asian American Professionals and the Challenge of Multiple Identities . Stanford University Press. Gupta, Monisha Das . 2006. Unruly Immigrants: Rights, Activism, and Transnational South Asian Politics in the United States. Duke University Press. Gupta, Sangeeta R. (Ed.). 1999. Emerging Voices: South Asian American Women Redefine Self, Family and Community. Sage Publications Pvt. Ltd.
Joshi, Khyati Y. 2006. New Roots in America's Sacred Ground: Religion, Race, and Ethnicity in Indian America. Rutgers University Press. Khandelwal, Madhulika S. 2002. Becoming American, Being Indian: An Immigrant Community in New York City. Cornell University Press. Maira, Sunaina Marr. 20002. Desis In The House: Indian American Youth Culture In NYC. Temple University Press. Sircar, Arpana. 2000. Work Roles, Gender Roles, and Asian Indian Immigrant Women in the United States . Edwin Mellen Press.
Copyright © 2003 by K.V. Rao, Eric Lai, Dennis Arguelles, AsianWeek Magazine, and the UCLA Asian American Studies Center. Reprinted in accordance with Section 107 of the U.S. Copyright Act of 1976. This article is an edited chapter on the major historical events and contemporary characteristics of the Indian community , excerpted from The New Face of Asian Pacific America: Numbers, Diversity, and Change in the 21st Century by C.N. Le on www.asian-nation.org.

JAP
AN
ES
E

60
A Legacy of Overcoming Preconceptions
The Japanese American population was established by immigration in two major historical periods before and after World War Ii. In the eight dec-ades before World War II, roughly 450,000 Japanese migrated to the Unit-ed States (including Hawaii when it was an independent country, then a U.S. territory). The greatest concentration began in 1885, with the start of the mass labor migration, and ended in 1924, when the United States for-bade immigration by "aliens ineligible to citizenship."
This first major wave of Japanese immigration established the Japanese American community. The majority of Japanese immigrant (Issei) women arrived from 1908�1924, entering as wives of men previously settled in the United States, and the resulting concentrated period of family for-mation produced the first American-born generation, the Nisei. A post-WWII baby boom generation, the Sansei, reached its peak in the early 1960s. Although the current generation of young people is sometimes re-ferred to as Yonsei (or the fourth generation), this age cohort is a much more complex mixture of ethnic, racial, and intergenerational back-grounds.
Japanese immigration is seen by many, including Japanese Americans themselves, as being small or of negligible size. But during the period from 1965 (when racial restrictions on Asian immigration were finally removed) to 2000, there were 176,000 Japanese immigrants, a number similar to Pakistanis (204,000) Thais (150,000), Cambodians (206,000), Hmong (186,000), and Laotians (198,000).
Japanese-born wives of American citizens account for perhaps half of all Japanese immigrants to the United States. From 1945 to 1985, Japan was the sixth largest source of foreign spouses (mostly female) immigrating to the U.S. During that period, the 84,000 foreign-born spouses made up well over half (55 percent) of the 154,000 immigrants from Japan. The husbands include Japanese Americans as well as Americans of other backgrounds.
Demographic Characteristics
With a median age of 36.5 years of age in 1990, the Japanese American population was older than the overall U.S. population (33.0 years), and the overall Asian American population (30.4 years). The sex ratio was slightly skewed, with females making up 54 percent of the total Japanese American population. U.S. natives were evenly divided, at 50-50. But 63 percent of foreign-born Japanese immigrants were female.
Over 60 percent of all Japanese Americans live in two states, California (34 percent) and Hawai'i (26 percent). Almost 73 percent live in the West and while there has been some dispersion in the pattern over the last 30 years, it is a matter of greater growth outside the historic core areas, rather than a loss at the core.
In the spring of 2001, rather startling Census information reported that the Japanese American population was shrinking. Census Bureau statistics re-
vealed that the Japanese American population had fallen from about 848,000 in 1990 to 797,000 in 2000. The expla-nations given for the apparent decrease included low birth rates, high rates of outmarriage and assimilation, and low levels of immigration. But a year later, the Census Bureau issued a second set of more detailed figures, showing that there are 1.15 million Americans who claimed at least partial Japanese ancestry.
The apparent discrepancies in the two population figures were due to a change in the 2000 Census that allowed indi-viduals to be classified as being of more than one race or ethnic group. Under this system almost 797,000 persons

61
were reported as Japanese only. Another 350,000 were reported as Japanese in combination with one or more other racial/ethnic ancestries. The total Japanese American population, including mixed-race and mixed-ethnic people, is thus over 1.1 million.
In spite of the perception of shrinking numbers, the historical statistics show the exact opposite. In fact, the Japanese American population has nearly doubled since 1970, and is more than triple the 1950 count. Although the rate of in-crease is mild compared with other APA groups, the number of Japanese Americans has been slowly but steadily growing for decades. Over two-thirds of all Japanese Americans were born in the United States -- the highest propor-
tion among all APAs.
The Magnitude and Meaning of Japanese Inter-
marriage
Japanese American intermarriages to non-Japanese -- which were once very few due to anti-miscegenation laws, segregation, and eth-nic preferences -- have risen very rapidly since the end of World War II: from perhaps 10 percent in the 1950s, to about 30 percent in 1980, to over 40 percent in 1990. The trend is almost certain to con-tinue; in 1990, about three-quarters of young U.S.- born Japanese American married adults were wed to non-Japanese, according to demographers Larry Shinagawa and Gin Yong Pang.
In the 1960s and 1970s, marriages between American-born Japa-nese Americans and White Americans became the dominant inter-marriage pattern. In the 1980s however, there was a shift towards marriages to other Asian Americans and by 1990, marriages with other Asians rose to become the majority of Japanese American
intermarriages. Japanese American intermarriage was once assumed to represent assimilation to the White Ameri-can majority. But this newer trend suggests the "Asian Americanization" of Japanese Americans.
Intermarriage has inevitably led to the emergence of a large and growing mixed-ancestry Japanese American popu-lation. Almost 70 percent of the total Japanese American population is identified as entirely Japanese, and over 30 percent are partially Japanese in various combinations with other Asians and other (non-Asian) races, the highest proportion of mixed-ancestry members among the dozen largest Asian groups.
Demographically, the future of the Japanese American community if not the present will increasingly depend on the inclusion of Japanese persons of mixed ancestry, and on these mixed- ancestry Japanese Americans identifying themselves as such.
62
Suggested Reading
Austin, Allan W. 2007. From Concentration Camp to Campus: Japanese American Students and World War II . Uni-versity of Illinois Press. Azuma, Eiichiro. 2005. Between Two Empires: Race, History, and Transnationalism in Japanese America . Oxford University Press. Creef, Elena. 2004. Imaging Japanese America: The Visual Construction of Citizenship, Nation, and the Body. NYU Press. Diggs, Nancy Brown. 1998. Steel Butterflies: Japanese Women and the American Experience. State University of New York Press. Fujino, Diane C. 2005. Heartbeat of Struggle: The Revolutionary Life of Yuri Kochiyama. University of Minnesota Press. Ishizuka, Karen L. 2006. Lost and Found: Reclaiming the Japanese American Incarceration. University of Illinois Press. Kurashige, Lon. 2002. Japanese American Celebration and Conflict: A History of Ethnic Identity and Festival, 1934-1990. University of California Press. Masterson, Daniel. 2003. The Japanese in Latin America. University of Illinois Press. Neiwert, David. 2005. Strawberry Days: How Internment Destroyed a Japanese American Community. Palgrave Macmillan. Spickard, Paul. 2009. Japanese Americans: The Formation and Transformations of an Ethnic Group. Rutgers Uni-versity Press.
Copyright © 2003 by Dean S. Toji, Eric Lai, Dennis Arguelles, AsianWeek Magazine, and the UCLA Asian American Studies Center. Reprinted in accordance with Section 107 of the U.S. Copyright Act of 1976.This article is an edited chapter on the major historical events and contempo-rary characteristics of the Japanese community , excerpted from The New Face of Asian Pacific America: Numbers, Diversity, and Change in the 21st Century by C.N. Le on www.asian-nation.org.

KO
RE
AN
64
History and Waves of Immigration
The history of Koreans in America began when some 7,000 Koreans were recruited and brought to Hawai'i as plan-tation laborers, from 1903-1905. They were brought in to meet the labor demand on the Hawaiian plantations after a series of laws barring Chinese labor immigration were enacted. Before the door was completely closed in 1924 due to the National Origins Act, about 1,100 Korean "picture brides" were brought in.
These brides were better educated than their male partners, and brought life and hope to the predominantly bachelor community. They actively took part in church activities and independence movements that helped free their home-land from Japanese colonial rule. Students and political exiles constituted the third group of early Korean immigrants and they provided significant leadership in the pre-World War II Korean American community. Syngman Rhee, who later became the first president of the Republic of Korea, and Ahn Chang Ho, another political activist, are well known examples.
American intervention in the Korean War (1950-53) triggered the second wave of Korean immigration. American sol-diers stationed in Korea brought home Korean brides, arranged adoption of war orphans to American homes, and sponsored students to come to the United States. Between 1951 and 1964, approximately 6,500 brides, 6,300 adopt-ed children, and 6,000 students came to this country. The number of Koreans who have immigrated to this country as adopted children, or brides of Americans, since the Korean War is more than 100,000 for each respective group.
After 1965, students-turned professionals were able to apply for permanent resi-dence visas in the United States under provisions of the Hart-Cellar Act. Since 1970, close relatives of permanent residents or citizens have comprised an over-whelming majority of the Korean immigrants coming to America. A total of 778,899 Korean immigrants were admitted to the U.S. between 1941 and 1998. Korean immigration peaked during the 1980s and annual admittance has steadily declined since 1987.
Geographic Settlement Patterns
Still, the historically steady and substantial inflow of immigration frorn Korea has accelerated the growth of the Kore-an population in the U.S. Since 1970, when it was about 70,000, the Korean population has increased more than fif-teen-fold to 1.07 million in the year 2000 (1.23 million when including Koreans who are part Asian, and mixed race).
Forty-four percent of Koreans live in the West, compared to 22 percent of the general population. Nevertheless, the geographic distribution has changed significantly since the 1960s, as Koreans have been quicker than other APAs to disperse themselves across the wider regions of the U.S. Travelers are likely to find at least one or more Korean churches with a sign written in Hangul characters in most metropolitan cities in America. Most remarkable is the in-crease in the numbers of Korean Americans in the South, which grew 46 percent between 1990 and 2000.
Nonetheless, Koreans as a whole are still concentrated in just a few large metropolises. Southern California leads the way. More than a quarter million Korean Americans live in the Los Angeles-Riverside-Orange County-San Ber-nardino-Ventura metro area. Next is the conglomerate encompassing New York City and the surrounding northern New Jersey, southwest Connecticut, and eastern Pennsylvania area. Forty percent of all Koreans in the United States are found in these two regions.
Korean churches, Korean supermarkets, and many other types of Korean firms serving mainly their own ethnic clien-teles are found in these areas. Koreans also constitute a significant minority of the resident population in several cit-ies in these areas.
A Strong Tradition of Entrepreneurship
Koreans are entrepreneurs par excellence. Surveys conducted in Los Angeles, Chicago, New York, and Atlanta con-firm that about one-third of Korean immigrant households engage in a self-owned business. In the 1970s, a typical

65
newly-arrived family would start a small business after a few years of work on assembly lines or with maintenance companies. Nowadays, many start business shortly after arrival thanks to the strong economy and liberalization of
foreign exchange laws in Korea.
The 1997 U.S. Economic Census confirmed many of the anecdotal pic-tures of Korean business patterns that have been reported in Korean newspapers. With more than 155,000 businesses, Koreans rank third among APAs, after the Chinese and Indians. But their tendency to en-ter into business is one of the highest among all minority ethnic/racial groups. For instance, the rate of Korean business ownership is 71 per-cent higher than their share of the population, highest of all the major Asian ethnic groups.
Why do Koreans concentrate in small business? Potential profitability is one obvious reason. But the more important reason is that many Kore-an immigrants face status inconsistency and the ensuing erosion of self-esteem after arriving in the U.S. A majority of Korean immigrants earned college degrees and held professional jobs before moving to America. Language difficulties and unfamiliarity with American culture prevent many from finding a satisfactory job commensurate with their
education and work experience. Their options are: 1) work in a safe but lower-status and less rewarding job, or 2) operate their own business in a risky and difficult environment. Running one's own business is difficult and risky, but gives psychological satisfaction of being one's own boss and a status of sajangnim, or "president" in Korean. Many immigrants therefore opt for entrepreneurship.
The data clearly show that within the American business structure and its clear racially-based hierarchy, Korean-owned firms occupy a "middleman" minority status sandwiched between the dominant group (non-Hispanic Whites) and less powerful classes (African Americans and Hispanics). To compete successfully, Korean small business own-ers work long hours, mobilize family labor, and ethnic resources. Husband and wife team up to operate the family business without vacations or weekends. Their children also help during the afterschool hours.
During a relatively short period in America, Korean immigrants have concentrated in building an economic base for themselves and for their children. For some, that means locating in poor urban minority-dominated ghettos; for oth-ers, it means moving into middle-class suburbs. Their lives involve mingling with both the poor and wealthy, the ma-jority and the minority. Koreans have become a visible and significant minority in this multi-ethnic and multi-cultural nation. This hardworking, highly educated, and actively organized ethnic community is increasing its stake in the American society. The impact will be tremendous very soon when the second-generation of Korean Americans reach adulthood.
66
Suggested Reading
Choi, Yearn Hong and Haeng-Ja Kim (Eds.). 2004. Surfacing Sadness: A Centennial of Korean-American Literature 1903-2003. Homa & Sekey. Chung, Angie. 2007. Legacies of Struggle: Conflict and Cooperation in Korean American Politics. Stanford University Press. Kim, Christian. 2004. Korean-American Experience in the United States: Initial Thoughts. Hermit Kingdom Press. Kim, Hugo. 2003. Korean Americans and Inter-Korean Relations. East-West Research Institute. Kim, Ilpyong J. 2007. Korean-Americans: Past, Present, and Future. Hollym International Corp. Kim, Kwang Chung, R. Stephen Warner, and Ho-Youn Kwon (Eds.). 2001. Korean Americans and Their Religions: Pilgrims and Missionaries from a Different Shore. Penn State University Press. Kim, Nadia. 2008. Imperial Citizens: Koreans and Race from Seoul to LA. Stanford University Press. Lee, Namhee. 2007. The Making of Minjung: Democracy and the Politics of Representation in South Korea. Cornell University Press. Oak, Susan and Virginia Martin. 2006. American/Korean Contrasts: Patterns and Expectations in the U.S. and Ko-rea. Hollym International Corp. Park, Kyeyoung. 1997. The Korean American Dream: Immigrants and Small Business in New York City. Cornell Uni-versity Press.
Copyright © 2003 by Edward Taechan Chang, Eric Lai, Dennis Arguelles, AsianWeek Magazine, and the UCLA Asian American Studies Cen-
ter. Reprinted in accordance with Section 107 of the U.S. Copyright Act of 1976.This article is an edited chapter on the major historical events
and contemporary characteristics of the Korean community , excerpted from The New Face of Asian Pacific America: Numbers, Diversity, and Change in the 21st Century by C.N. Le on www.asian-nation.org.

LAO
TIA
N
68
Displacement and Diversity
Laotian Americans continue to be diverse in practically every respect: they speak several different languages in the home, follow many different religions, are dispersed throughout the United States, and fill niches at every point along the socioeconomic scale. According to the 2000 Census, 198,203 Laotian Americans (not including Hmong, but including mixed-race and mixed-ethnicity Laotians) live throughout the United States.
Nearly all of them either arrived in this country as refugees or are the children of refugees, beginning in 1975 when the Communist Pathet Lao defeated the U.S.-supported government of Laos. Resettlement in the U.S. increased dramatically in the late 1970s and 1980s, after hundreds of thousands of Laotians fled across the Mekong River to Thailand seeking safety in refugee camps.
A total of 105,477 "first wave" refugees arrived in the United States from Laos between 1979 and 1981. Then from 1986 to 1989, a total of 52,864 "second wave" Laotians arrived. Currently, many non-profit organizations, such as the Southeast Asian Resources Action Center (SEARAC), Laotian American National Alliance, and the Lao American Women Association are
playing key roles in the continuous support and advocacy for Laotian Americans.
In terms of culture and language, the dominant group are the Lao Loum, or Lowland Lao, who make up seven-tenths of the population back in Laos. But there are many ethnic minority groups, including the Hmong, most of whom come from upland areas, thus earning them the broad label, Highland Lao. Other Laotian ethnic groups include the Khmu, Thaidam, and Lu-Mien (Yao).
The Importance of Education for Mobility and Support
Many Laotian arrived without a written language, little exposure to wage labor, and very little experience with formal schooling. Because of these pre-existing conditions, many lack the type of skills that today's workforce requires and instead, settle for low-skill jobs and as a result, they must work two jobs to make ends meet. One major consequence is that the children are left at home with little or no supervision.
These children consequently suffer academically, because help is unavailable to them in their home environments. While some students have the ability to succeed, unfortunately not all students have the resources available to them to achieve higher learning -- lack of financial resources remain a major challenge. Another current problem in the community is the high rate of Laotian American youth going to prison, reportedly the highest rate among all Southeast Asian youth. Many reasons can be cited for this problem, but lack of parental involvement is a major factor.
Nonetheless, despite the initial challenges of adapting to a new country, many Laotians are able to find a means of fulfilling their educational goals, managing to overcome obstacles to higher learning. Most young refugees or children of refugees attribute their success to a growing network of Laotian Student Associations at college campuses. These associations provide academic support as well as a strong network of students who share similar cultural experiences. Student and professional groups are also influential, servicing the Laotian community.

69
Maintaining Identity and Community
One concern that the community now faces is declining cultural practices -- which include traditions, values, and language -- among a newer generation of Laotian Americans dispersed throughout the country. This dispersal challenges a traditionally concentrated and inclusive community. Such Laotian American enclaves now exist, though still rare, in those states with a greater number of Laotian Americans, such as New Iberia in Louisiana, San Diego and Fresno in California, and the Washington D.C. metropolitan area.
The traditional Laotian American family extends beyond a nuclear one, with grandparents and elders serving as respected household leaders. Elders continue to pass down many folktales and stories to first generation Laotian Americans through oral tradition, an important aspect of Laotian culture. The oral culture is a significant teaching tool for the elders because many can only speak, but not write, in their own language. But language barriers between Laotian-speaking parents and their English-speaking children are making them unable to share their unique Laotian and American experiences with each other.
Most Lowland Lao practiced Theravadha Buddhism in Laos. It's a practice they have carried on in the United States, one which has been very helpful for community-building purposes. These temples provide a place for interaction among different generations of Laotian Americans and offer weekend language school and other classes like classical dance and music. Because the Lowland Lao have a long-established history of formal education through Buddhist temples, these classes are merely a continuation of the tradition of learning via temple teaching.
Ethnic division among Laotian Americans signifies the rich culture and abundant diversity. While embracing the differences, Laotian Americans must realize that one unified voice is a key to social, educational, and political advancement in the United States. Within the grassroots community, it's also important that all generations of Laotian Americans past, present, and future focus on the common issues that face the community.

70
Suggested Readings
Becker, Benjawan Poomsan. 2003. Lao-English English-Lao Dictionary for Non-Lao Speakers. Paiboon Publishing. Evans, Grant. 1998. Politics of Ritual and Remembrance: Laos Since 1975 . University of Hawaii Press. Evans, Grant. 2003. A Short History of Laos: The Land in Between. Allen and Unwin. Ireson, Carol. 1999. Fields, Forest, And Family: Women's Work And Power In Rural Laos. Westview Press. Ireson-Doolittle, Carol and Geraldine Moreno-Black. 2003. The Lao: Gender, Power, and Livelihood . Westview Pr . Outhine, Bnounyavong. 1999. Mother's Beloved: Stories from Laos. University of Washington Press. Pholsena, Vatthana. 2006. Post-war Laos: The Politics of Culture, History, and Identity. Cornell University Press. Anthology of World Music: The Music of Laos (Audio CD), Various Artists. Label: Rounder Select.
Copyright © 2003 by Toon Phapphayboun, Eric Lai, Dennis Arguelles, AsianWeek Magazine, and the UCLA Asian American Studies Center. Reprinted in accordance with Section 107 of the U.S. Copyright Act of 1976. This article is an edited chapter on the major historical events and contemporary characteristics of the Laotian community , excerpted from The New Face of Asian Pacific America: Numbers, Diversity, and Change in the 21st Century by C.N. Le on www.asian-nation.org.

71
NA
TIV
E H
AW
AIIA
N/
PA
CIF
IC IS
LAN
DE
R

72
Counting Is Not A Simple Matter The racial/ethnic classification of the Pacific Islander population always seems to be changing. "Hawaiian" remained the only Pacific Islander group listed in Census questionnaires separately until 1980, when "Guamanian" and "Samoan" were added. That year, the Census counted about 260,000 Native Hawaiian and Pacific Islanders (NHPI). In 1990, the category "Other Asian or Pacific Islander" was added to the questionnaire along with a write-in area for all unspecified groups of Polynesian, Micronesian or Melanesian cultural backgrounds. The 1990 Census counted 365,000 NHPIs, a 41% increase over 1980.
In response to calls by Native Hawaiian and Pacific Islander activists, the Census Bureau split NHPIs off from Asians to become a sixth basic racial category, along with the existing white, black, American Indian, Asian, and
Some Other Race (Latinos/Hispanics are treated as an ethnic, rather than racial, group). The 2000 Census further allowed respondents to pick more than one racial identity and as a result, divining what the exact NHPI population is became more difficult, especially since a huge proportion-more than half of all NHPIs-are of multiracial ancestry.
Examining the 2000 Census report on the NHPI population, we see an increase of 9.3%, from roughly 365,000 people in 1990 to 399,000 in 2000, using the NHPI-alone numbers. When including multiethnic and multiracial NHPIs, the increase jumps to 140%, to 874,000 total in 2000. Native Hawaiians make up about 45% of all NHPIs. Also, Pacific Islanders residing in the U.S. territories of Guam, American Samoa, Northern Mariana Islands, and the U.S. Virgin Islands are completely excluded by the Census. Seventy-three percent of NHPIs lived the thirteen-state Western region and in fact, 58% lived in just two states: Hawai'i (282,667) and California (221,458).
Native Hawaiians The Native Hawaiian population was estimated between 400,000 and 800,000 in 1778, the year that Briton Captain James Cook arrived in Hawai'i. The monarchy originally founded by King Kamehameha I in 1810 was overthrown in 1893 by U.S. naval forces and in 1898, the U.S. annexed the islands as the Republic of Hawai'i. Through diseases introduced into the islands by colonization, by 1900 the pure Native Hawaiian population declined to 29,800 with another 7,800 Hawaiians of mixed ancestry.
According to the 2000 Census, Native Hawaiians and part-Native Hawaiians number 239,655 and comprise about 20% of Hawai'i's population. Another 161,500 persons with Hawaiian ancestry live in the continental U.S. In Hawai'i, Native Hawaiians earn lower incomes, hold lower-status jobs, and have the highest unemployment rate of all the ethnic groups in the islands. Due to their low incomes that hinder access to health care, Native Hawaiians also suffer higher disease, cancer, and mortality rates and their life expectancy is shorter by eight years than other groups.
As an indigenous minority group, Native Hawaiians are recognized as having a "special trust relationship" with the U.S. government, similar to Native American Indians (along with Native Alaskans), entitling them to special programs and resources. However, in February 2000, the U.S. Supreme Court reversed established policies of the U.S. Congress and ruled that the composition of the trustees who control Native Hawaiian rights and entitlements (the Office of Hawaiian Affairs, or OHA) was unconstitutional because they were based on racial identity qualifications. This decision basically throws into question the fundamental rights of Native Hawaiians.
In light of the ruling, Hawai'i's two Senators, Daniel Akaka and Daniel Inouye introduced the "Native Hawaiian Government Reorganization Act" (aka the "Akaka Bill") before Congress in 2000. The bill would formally extend the federal policy of self-determination to Native Hawaiians and put them on the same legal status as Native American Indians. Opponents of the bill argue that it promotes racial/ethnic separatism and that similar to debates about affirmative action, non-Hawaiians should not unfairly bear the consequences of reconciling events that occurred several generations ago.
Hawaiians have a saying, Aloha mai no, aloha aku -- When love is given, love should be returned. Sovereignty supporters believe that now is the time for aloha to be acknowledged and returned to the Native Hawaiian people and their descendents. The Akaka bill would provide an avenue for both the people of Hawai'i and the U.S. Congress
73
to correct the historical injustices they have suffered collectively as a people, and enable them to exercise self-determination through self-governance, in order to heal as a people.
The House version of the bill (H.R. 505) passed on October 24, 2007 and the Senate version is still being considered.
Samoans and Guamanians There are more than 130,000 Samoans living in the U.S., with two-thirds being monoracial and another third being multiracial. That's nearly a threefold growth from the 1990 population of 49,345. Like the Native Hawaiians, they are considered Polynesians, and are theorized to have migrated from the west (the East Indies, the Malay peninsula or the Philippines) as far back ago as 1,000 B.C.E. Today, the islands are divided up into American Samoa and Samoa. The former is only 76 square miles, has a population of around 67,000, and sends a delegate to the U.S. Congress. Samoa, known as Western Samoa until 1997, is an independent nation with islands totaling 1,090 square miles, and a population of 179,058.
The economy of American Samoa remains undeveloped; nearly one-third of workers are employed in the fishing or canning industry. Tourism has not taken off. In recent years, one of American Samoa's main exports has been football players. There are more than 200 playing Division I college football, and 28 in the NFL, reported ESPN in 2002. Perhaps the most famous has been linebacker Tiaina "Junior" Seau.
After Samoans, the next-largest NHPI group are the natives of the island of Guam, also known as Chamorro. There are only about 157,000 people living on today's multicultural Guam, of whom about half are Chamorro. So like American Samoa, a larger number of Chamorro actually live abroad-in the U.S., there are nearly 93,000 people of pure or part-Chamorro descent.
Today the U.S. military maintains a large, albeit declining, presence in Guam, with 23,000 military personnel and their families living on the island. Though the government has lobbied to free Guam from its "unincorporated" U.S. territory status, the island has yet to be granted the Commonwealth recognition given Puerto Rico. And although the people are given U.S. citizenship, they do not vote in U.S. presidential elections. Economically, the growing tourist industry catering to Japanese visitors has helped offset the military downsizing.
Socioeconomic Characteristics of NHPIs Besides the cultural and ethnic differences between Asians and Pacific Islanders, one of the main motivations for NHPI activists to fight for separate racial recognition by the Census Bureau was the very real socioeconomic differences between the groups. Indeed, while some NHPIs have very high incomes and educations, a disproportionate percentage are impoverished, have lower educations, and may require or need public assistance. The model minority myth surrounding Asian Americans, which obscures problems with disadvantaged members of the group, has hurting NHPIs, too.
In terms of aggregate figures, NHPIs tend to lag behind most other groups. The per-capita income in 1999 for NHPIs was $15,054. That is 37% lower than the $23,918 per capita income for Whites and 31% lower than the $21,823 figure for Asian Americans. NHPI households had a median 1999 income of $42,717 -- higher than the overall U.S. median figure of $41,994, simply because NHPIs tend to have larger families and more workers per household.
The percentage of NHPIs enrolled in school or college as of 2000 was 35.4%, which ranked higher than both the 26.1% of Whites and 33.5% of Asians. That may be indicative of the relative youthfulness of the NHPI population more than anything else -- the median age for the general population is 35.3 years old; for Asians, it is 31.1 years old, while for NHPIs it is just 25.4 years old. However, in educational attainment for those 25 years or older, about one quarter of NHPIs has a bachelor's degree or more. This lags behind Asian Americans, with 44.1% having a bachelor's degree or more.
74
Suggested Reading
Barken, Elliot Robert. 1992. Asian and Pacific Islander Migration to the United States: A Model of New Global Patterns. Greenwood Press. Fitzpatrick, Judith M. 2000. Endangered Peoples of Oceania: Struggles to Survive and Thrive . Greenwood Press. Kauanui, J. 2008. Hawaiian Blood: Colonialism and the Politics of Sovereignty and Indigeneity. Duke University Press. Lahaye, Mary E. 2004. Letters from Samoa: Life, Love and Lore of the Manu'a Islands. Intercon Publishing. Muller, Willard C. 2002. Faces of the Islands: When Pacific Islander and American Ways Meet. Lincoln Square Publishing Company. Rogers, Robert F. 1996. Destiny's Landfall: A History of Guam. University of Hawai'i Press. Silva, Noenoe K. 2004. Aloha Betrayed: Native Hawaiian Resistance to American Colonialism. Duke University Press. Small, Cathy A. 1997. Voyages: From Tongan Villages to American Suburbs. Cornell University Press. Spickard, Paul R. 2002. Pacific Diaspora: Island Peoples in the United States and Across the Pacific. University of Hawai'i Press. Stratern, Andrew J., Pamela J. Stewart, Laurence M. Carucci, Lin Poyer, Richard Feinberg, and Cluny Macpherson. 2002. Oceania: An Introduction to the Cultures and Identities of Pacific Islanders. Carolina Academic Press.
Copyright © 2003 by Davianna McGregor, Edmund Moy, Eric Lai, Dennis Arguelles, AsianWeek Magazine, and the UCLA Asian American Studies Center. Reprinted in accordance with Section 107 of the U.S. Copyright Act of 1976. This article is an edited chapter on the major historical events and contemporary characteristics of the Native Hawaiian and Pacific Islander communities , excerpted from The New Face of Asian Pacific America: Numbers, Diversity, and Change in the 21st Century by C.N. Le on www.asian-nation.org.

TAIW
AIN
ES
E
76
A Community Formed Through Revolution
Compared to the roughly 2.7 million Chinese living in America, the Taiwanese American population is a tiny drop in the bucket. The 2000 Census counted just 144,795 Taiwanese Americans in the United States, with more than 75,000 -- or about half -- living in California (there are also Taiwanese clustered around Washington D.C., Houston, and the suburbs of New York City).
Like the Cantonese or Shanghairiese, the Taiwanese are ethnically Chinese, though, like the above groups, they speak their own dialect in addition to Mandarin, Still, there are important reasons why Taiwanese Americans maintain a distinct identity. After being defeated by the Communists, the Nationalist government -- along with a million and a half Chinese -- fled the mainland for the island of Taiwan in the late 1940s, where they established a U.S.-backed government.
But repression during the early days of the regime -- many Taiwanese opponents to the nationalists were killed or imprisoned -- as well as the quashing of local traditions bred resentment. Most native Taiwanese, unlike the newer arrivals, fiercely oppose reunification with the
mainland, Today, Taiwan is no longer ruled by a military government, but by the Democratic Progressive Party (DPP), which represents the majority native Taiwanese population. The DPP firmly opposes reunification with China.
Like most other Asian groups, the Taiwanese first started coming to the United States in large numbers during the mid-1960s under provisions in the new immigration laws that allowed in the skilled and highly-educated. As a result, the Taiwanese American population is mostly well-educated and well-off: among Taiwanese 25 years or older, 60 percent had a bachelor's degree or better in 1990, compared to a rate of 40 percent among Chinese, and 20 percent among all APAs.
Among those employed 16 years or older, 82 percent of Taiwanese Americans were either in "managerial and professional specialty occupations" or "technical, sales and administrative occupations," compared to 67 percent for all Chinese and 58 percent in the general population, in 1990. The average family income in 1990 was more than $62,000, versus $51 ,931 for all Chinese, and $43,803 for the general population. At the same time, 11 .2 percent of Taiwanese families in 1990 were below the poverty level -- higher than the overall population's figure of 10 percent.
The First Suburban Asian American Enclave
Though Taiwanese communities can be found all over the United States, the unofficial capital of Taiwanese America is the Los Angeles suburb of Monterey Park. More than 61 percent of the population in the year 2000 was Asian, with the largest slice being Taiwanese immigrants. Monterey Park's transformation into "Little Taipei" is due almost single-handedly to the late Chinese American real estate developer, Frederic Hsieh.
In 1970, two years before Hsieh bought his first property in Monterey Park, the city was about 50 percent white, 34 percent Hispanic, and 15 percent Asian, with the majority of the Asians being Japanese. Hsieh promoted Monterey Park to the new, increasingly-moneyed immigrants just then arriving from Taiwan and Hong Kong, who were seeking an alternative to settling in Chinatowns in San Francisco and New York.

77
Cleverly, Hsieh translated Monterey Park in Chinese into Mengtelu Gongyuan, meaning "Lush, Very Green Park." He promoted the city's telephone area code 818 -- as the number 8 is considered lucky by the Chinese and many other Asians -- and the suburb's good schools, always a factor for immigrant families. In 1977, Hsieh told Monterey Park's incredulous Chamber of Commerce, "You may not know it, but [Monterey Park] will serve as the mecca for Chinese business."
By the 1980s, Hsieh's vision had come true. In 1996, at least two-thirds of Monterey Park's 5,000 businesses were owned by Chinese. Monterey Park had a Chinese mayor, and a predominantly Asian city council.
The influx brought a backlash. "Will the last American to leave Monterey Park please bring the flag?" read a sign at a local gas station. The city council debated whether to make English the official language and force businesses to put up English language signs. The conflict eventually subsided, and Monterey Park and the neighboring suburbs are now a relatively shining example of a multicultural community.
By the late 1990s, immigration from Taiwan slowed. The country's standard of living had risen; there was less economic incentive to leave. In 1989, 13,974 Taiwanese immigrated to the United States; ten years later, the number was barely half of that. Also, many of the wealthier, more-established Chinese and Taiwanese had moved east to suburbs like San Marino or South Pasadena, or south to Orange County suburbs like Tustin and Anaheim Hills. But Monterey Park remains the cultural and business capital of Taiwanese in Los Angeles and, by extension, in the rest of the country.
78
Suggested Readings
Fong, Timothy. 1994. The First Suburban Chinatown: The Remaking of Monterey Park, California. Temple University Press. Horton, John. 1995. The Politics of Diversity: Immigration, Resistance, and Change in Monterey Park, California. Temple University Press. Kwong, Peter. 1996. The New Chinatown. Hill and Wang. Lin, Jan. 1998. Reconstructing Chinatown: Ethnic Enclaves, Global Change. University of Minnesota Press. Manthorpe, Jonathan. 2005. Forbidden Nation: A History of Taiwan. Palgrave-MacMillan. Martin, Fran. 2003. Situating Sexualities: Queer Representation in Taiwanese Fiction, Film and Public Culture. University of Washington Press. Ng, Franklin. 1998. The Taiwanese Americans. Greenwood Press. Saito, Leland. 1998. Race and Politics: Asian Americans, Latinos, and Whites in a Los Angeles Suburb. University of Illinois Press.
Copyright © 2003 by Eric Lai, Dennis Arguelles, AsianWeek Magazine, and the UCLA Asian American Studies Center. Reprinted in accordance with Section 107 of the U.S. Copyright Act of 1976. This article is an edited chapter on the major historical events and contemporary characteristics of the Taiwanese community , excerpted from The New Face of Asian Pacific America: Numbers, Diversity, and Change in the 21st Century by C.N. Le on www.asian-nation.org.

VIE
TN
AM
ES
E

80
From Refugees to Resettlement
From refugees to full American citizens, the Vietnamese American and Chinese Vietnamese American communities have grown to a total of 1.22 million members, making them the fifth-largest group among APAs. Community leaders maintain that the Vietnamese continued to be undercounted in 2000, primarily for two reasons: underreporting by the Vietnamese themselves; and because many Chinese Vietnamese identified themselves simply as "Chinese" rather than "Vietnamese."
There were five major waves of Vietnamese immigration to the United States. The events of April 1975 triggered the first wave, when over 100,000 sought a way to escape as South Vietnam was taken over by the Communists from the North. The second movement came during the 1978 "boat people" phenomenon. Thousands of Vietnamese fled to neighboring countries, most of them in rickety, overcrowded boats. The result was one of the most massive relief efforts in United Nations history.
As more refugees languished in camps in countries that were not always willing to provide asylum, the U.S. set up the Orderly Departure Program to alleviate the situation and allow these refugees entrance into U.S. borders. In 1987, the Amerasian Homecoming Act brought over 30,000 children (and their immediate family members) of American military and civilian personnel stationed in Vietnam during the conflict. And through its Humanitarian Operations program, the U.S. admitted thousands of Vietnamese -- mostly former South Vietnamese soldiers, political prisoners and their families -- who had suffered under Communist reeducation programs.
A Need for Solidarity and Community
A policy to scatter the Vietnamese refugees around the country with a number of sponsors was implemented in order to minimize the impact on host communities. But within a few years, many Vietnamese, especially those settled in isolated, rural locales, moved to urban areas with warmer weather and large Asian immigrant populations. This secondary internal movement of migration led to the concentration of Vietnamese in the West Coast and the South.
Like other Asian immigrants, Vietnamese immigrants tend to gravitate toward urban areas. New enclaves have changed the face of entire blocks or inner city areas. They remarkable growth surprised not only geographers and census takers, but also politicians and government officials counting on support from the APA community. For example, in Orange County alone, nearly 45,000 firms were owned by APAs in 1997 with the majority owned by Vietnamese.
While California remains the state with the largest Vietnamese population, the percentage of Vietnamese living in California decreased during the 1990s. The downward trend of the electronics industry in which many Vietnamese were employed, coupled with unaffordable housing, prompted the departures. Economic growth in places like Texas, Florida and Louisiana attracted a great number of Vietnamese.
New Orleans attracted numerous Vietnamese and has experienced population growth because of its fishing opportunities, strong Catholic community, and mild climate. New numbers warrant our attention: in the Northeast, there were 115,000 Vietnamese, while the Midwest was close behind at 107,000. The South registered 336,000 Vietnamese. The population increase in the Midwest is a major shift from the 1990s. In fact, over the past decade, the Vietnamese population doubled in cities like Wichita, to more than 7,000, and to nearly 6,000 in Grand Rapids (MI).
Initial Difficulties, Then Looking Forward
Unlike regular immigrants trying to adjust to a new environment, forced immigrants like the Vietnamese are usually less-prepared for the new society; many had little English language skills to begin their new life. They needed a number of services set up jointly by government agencies and non-profit groups. Programs ranging from English
language training to employment development were established to assist these new immigrants during their initial resettlement. Given that the U.S. slowly phased out funds and programs for Southeast Asians in the 1990s, the
Vietnamese are faring well today.
Restaurants, and small businesses such as nail salons, food stores, and import-export shops, are niches where many Vietnamese are finding economic success. In 1997, Vietnamese owned 97,764 businesses employing 79,035 people with $9.3 billion in sales. About 16 percent of the businesses were retail shops, which reaped nearly $3 billion in sales.
The United States' lowering of its trade embargo with Vietnam, along with the liberalization of the political climate in Vietnam, have greatly affected immigration trends. While there are still a small number of Vietnamese immigrants awaiting admission and resettlement in the United States, they are the last of this Southeast Asian phenomenon of the last century.
Now, issues of intergenerational differences, family changes, political involvement and empowerment, as well as the development of economic centers around the United States, are becoming more important for forward-looking Vietnamese Americans. A second- generation of Vietnamese Americans that see themselves as Americans rather than unwilling exiles is
emerging. Compared to other established APA communities, the Vietnamese and Chinese Vietnamese Americans face a unique challenge. But the future looks positive based on past achievements.
81

Suggested Reading
Andrade, Roy D. 2008. A Study of Personal and Cultural Values: American, Japanese, and Vietnamese (Culture, Mind and Society) . Palgrave Macmillan. Cargill, Mary and Jade Huynh (Eds.). 2001. Voices of Vietnamese Boat People: Nineteen Narratives of Escape and Survival . McFarland and Company. Centrie, Craig. 2004. Identity Formation of Vietnamese Immigrant Youth in an American High School. LFB Scholarly Publishing. Chan, Sucheng (Ed.). 2006. The Vietnamese American 1.5 Generation: Stories of War, Revolution, Flight and New Beginnings. Temple University Press. Hickey, Gerald Cannon. 2003. Window on a War: An Anthropologist in the Vietnam Conflict. Texas Tech University Press. Lam, Andrew. 2005. Perfume Dreams: Reflections on the Vietnamese Diaspora. Heyday Books. Long, Patrick and Laura Ricard. 1995. The Dream Shattered: Vietnamese Gangs in America . Northeastern. Saito, Lynn. 2002. Ethnic Identity and Motivation: Socio-Cultural Factors in the Educational Achievement of Vietnamese American Students . LFB Scholarly Publishing. Thai, Hung Cam. 2008. For Better or For Worse: Vietnamese International Marriages in the New Global Economy . Rutgers University Press. Zhou, Min and Carl Bankston. 1999. Growing Up American: How Vietnamese Children Adapt to Life in the United States . Russell Sage Foundation.
Copyright © 2003 by Chung Hoan Chuong, Minh Hoa Ta, Eric Lai, Dennis Arguelles, AsianWeek Magazine, and the UCLA Asian American Studies Center. Reprinted in accordance with Section 107 of the U.S. Copyright Act of 1976.This article is an edited chapter on the major historical events and contemporary characteristics of the Vietnamese community , excerpted from The New Face of Asian Pacific America: Numbers, Diversity, and Change in the 21st Century by C.N. Le on www.asian-nation.org.
82


