university of copenhagen Københavns Universitet Innovation in a multiple-stage, multiple-product food marketing chain Baker, Alister Derek; Christensen, Tove Publication date: 2008 Document Version Også kaldet Forlagets PDF Citation for published version (APA): Baker, A. D., & Christensen, T. (2008). Innovation in a multiple-stage, multiple-product food marketing chain. Fødevareøkonomisk Institut, Københavns Universitet. IFRO Working Paper, Nr. 2008/5 Download date: 30. Aug. 2018
Transcript
u n i ve r s i t y o f co pe n h ag e n
Københavns Universitet
Innovation in a multiple-stage, multiple-product food marketing chain
Baker, Alister Derek; Christensen, Tove
Publication date:2008
Document VersionOgså kaldet Forlagets PDF
Citation for published version (APA):Baker, A. D., & Christensen, T. (2008). Innovation in a multiple-stage, multiple-product food marketing chain.Fødevareøkonomisk Institut, Københavns Universitet. IFRO Working Paper, Nr. 2008/5
Download date: 30. Aug. 2018
Innovation in a multiple-stage, multiple-product food marketing chain
Institute of Food and Resource Economics (FOI)
Working Paper 2008/5
Innovation in a multiple-stage, multiple-product food mar-keting chain
Production and Technology Division, and Consumption, Health and Ethics Division (respectively), Institute for Food and Resource Economics, Faculty of Life Sciences, University of Copenhagen, Rolighedsvej 25, 1958 Frederiksberg C, Copenhagen, Denmark. Senior author’s contact details ph +45-35-28-68-14; e-mail [email protected]
Abstract
A model of a 3-stage food marketing chain is presented for the case of two products. Its extension of existing work is its capacity to examine non-competitive input and output markets in two marketing chains at once, and have them related by demand and cost interactions. The simulated impacts of market power in a single chain gen-erally reproduce those delivered by previous authors. The impacts of market power in related chains are found to depend on linkages between chains in terms of interac-tions in consumer demand. Interactions between products in costs (economies of scope) generate an interesting result in that a possible market failure is identified that may be offset by the exercise of market power. The generation of farm-level innova-tion is seen to be largely unaffected by market power, but where market power is ex-ercised the benefits are extracted from farmers and consumers. The conditions under which this occurs can also depend on demand interactions. The report identifies commercial and policy implications and future related research topics.
Innovation in a multiple-stage, multiple-product food marketing chain FOI 1
1. Introduction............................................................................................................ 8 1.1. Purpose of study ........................................................................................... 8 1.2. The food chain project.................................................................................. 8 1.3. Background................................................................................................... 9 1.4. Outline of report ......................................................................................... 11
2. Model of a multiple-stage, multiple-product food marketing chain..................... 12 2.1. Component equations ................................................................................. 12 2.2. Profit maximisation .................................................................................... 14
3. Model implementation ......................................................................................... 17 3.1. Closure and solution ................................................................................... 17 3.2. Initial values ............................................................................................... 21 3.3. Model sensitivity to demand and supply parameter assumptions............... 22 3.4. Scenarios examined and hypotheses to be tested........................................ 28
4. General results...................................................................................................... 31 4.1. Market power in the absence of product interactions ................................. 31
4.1.1. Impacts on output .......................................................................... 31 4.1.2. Impacts on total welfare ................................................................ 32 4.1.3. Impacts of market power on welfare allocation............................. 33
4.2. Market power and product interactions ...................................................... 34 4.2.1. Demand interactions ...................................................................... 34 4.2.2. Cost interactions ............................................................................ 39
4.3. A demand shock as a model application..................................................... 43
Innovation in a multiple-stage, multiple-product food marketing chain FOI 3
5. Innovation as a model application........................................................................ 45 5.1. Innovation and market power in a single chain .......................................... 45
5.2. Innovation and market power in multiple chains........................................ 53 5.2.1. Welfare generation from a farm-level innovation ......................... 53 5.2.2. Welfare distribution....................................................................... 53
6. Discussion and conclusions.................................................................................. 57 6.1. Overview .................................................................................................... 57 6.2. Principal results .......................................................................................... 57
6.3. Implications for industry ............................................................................ 59 6.4. Implications for policy makers ................................................................... 61 6.5. Strengths and weaknesses of the model, and further research.................... 62
4 FOI Innovation in a multiple-stage, multiple-product food marketing chain
Preface
This Working Paper presents an algebraic model of a multiple-product, multiple-stage food industry supply system featuring imperfect competition and product interactions. It represents an advance on existing modelling of this type. The model is applied here in tracking the role played by imperfect competition in the transmission of changes in costs and benefits throughout the food marketing chain. This research is conducted under the auspices of the project1 “Perspektiver for og Udvikling af den danske fødevarekæde (phase 2)”,2 commonly known as “The Food Chain Project”. This project is funded under Innovationsloven and administered by the Directorate for Food, Fisheries and Agribusiness (DFFE) of the Danish Ministry of Food, Agriculture and Fisheries. Thanks are due to Professor Svend Rasmussen for a review.
Mogens Lund Production and Technology Division
Institute of Food and Resource Economics Copenhagen, May 2008
1 Further information about the project are available from the author at [email protected]. 2 “Perspectives and outlook for the Danish food marketing chain”.
Innovation in a multiple-stage, multiple-product food marketing chain FOI 5
Summary
This Working Paper presents an algebraic model of the food marketing chain. It fol-lows methods developed by various authors based on work by Gardner (1975), as pre-sented in the context of market power by Sexton and Lavoie (2001) and extended to three industry stages by Sexton and Zhang (2001). The current paper provides an ad-vance on that work by introducing multiple products, amongst which the facility ex-ists for interactions in technologies (economies of scope) and demand (substitutability and complementarity). The model is sensitive to initial specifications of supply and demand parameters, which in the current work are the raw input to specification of elasticities. Other is-sues of starting values included the output values’ needing to be significantly above unity due to the form of cost functions used. The model’s results show that increasing levels of market power in the food marketing chain reduce output throughout the chain, in a relationship that is convex in market power and more extreme as the num-ber and forms of market power exercised are increased. The same is true for the im-pact of market power on total welfare, except that the relationship with market power is convex. The model quantifies the extent to which welfare shares are changed due to the exercise of market power. In particular, it allows calculation of surplus accumu-lated at the stage exercising the market power and surplus lost elsewhere in the chain, in each chain. The expropriation of surplus by one stage from another is closely asso-ciated with reductions in price transmission, which is also measured in the model. Substitution (and complementarity) in consumer demand has a substantial effect on the results generated by the model. The capacity for chain stakeholders to switch be-tween chains in response to (i) price changes in one chain and (ii) the exercise of market power in one or both chains, greatly affects the simulation results. The appar-ently large influence of demand interactions suggests that firms can benefit from promotions (and other activities) that create or accentuate these interactions. This may generate greater benefits than, for example, efforts to lobby for policy change against the exercise of market power. The model solution indicates that firms employing technologies featuring economies of scope reduce their profits. The reason is that increased volumes throughout the sys-tem raise purchase prices and so raise costs by more than revenues. This effect can be offset by the exercise of market power: restricting volume can also help to control costs. Government action on mergers and acquisition should take account of this: cost
6 FOI Innovation in a multiple-stage, multiple-product food marketing chain
savings due to mergers of large firms may be due to their exercise of market power; and firms that cannot demonstrate cost-related merger justifications may be acting as competitive firms. A farm-level innovation generates benefits throughout the food marketing chain. That benefit is greater where complementarity in consumer demand occurs with a related product, and less, where the demand interaction features substitutability. Price trans-mission within the chain, and between chains, is more pronounced under demand complementarity, and less pronounced under substitution specifications. Price trans-mission, and the transmission of cost reductions through to price reductions, is sub-stantially reduced by the exercise of market power. The exercise of market power in the same chain as that in which the innovation occurs enables firms at one stage of the marketing chain to appropriate the benefits of innovation from other stages.
Innovation in a multiple-stage, multiple-product food marketing chain FOI 7
1. Introduction
1.1. Purpose of study
This report details an economic model of the food marketing chain and presents re-sults from scenarios studied using that model. The aims of the study are to:
1. characterise market power in the food marketing chain in the practical con-text of multiple products and multiple stages;
2. examine the impact of market power on variables of economic interest, par-ticularly welfare and its allocation amongst food marketing chain stake-holders;
3. characterise the influence of interactions amongst multiple products on the impacts of market power; and
4. examine the case of innovation in the food marketing chain and influence of market conditions on the magnitude and allocation of its benefits.
1.2. The food chain project
This research is conducted under the auspices of the project3 “Perspektiver for og Udvikling af den danske fødevarekæde (phase 2)”,4 commonly known as “The Food Chain Project”. This project is funded under Innovationsloven and administered by the Directorate for Food, Fisheries and Agribusiness (DFFE) of the Danish Ministry of Food, Agriculture and Fisheries. The objectives of the project are to:
• measure changes in function, structure and commercial practice in the Danish food industry and compare and contrast these with developments in other countries;
• characterise vertical and horizontal relationships in the Danish food chain and their role in delivering optimal levels of food quality, variety and safety;
• evaluate the efficiency and competitiveness of the Danish food system at each stage of the marketing chain;
• review and evaluate instruments of Danish, EU and foreign public policy in the development of the food marketing chain; and
• communicate research results in a number of media.
3 Further information about the project are available from the author at [email protected]. 4 “Perspectives and outlook for the Danish food marketing chain”.
8 FOI Innovation in a multiple-stage, multiple-product food marketing chain
The current study advances understanding of the actual and potential impacts of mar-ket power in the Danish food marketing chain. As a theoretical piece, its main appeal is to researchers in agricultural marketing and policy. However, the work has practical implications in identifying conditions in which the impacts of market power might be exacerbated or reduced in a multi-product environment. The application to farm-level innovation is of particular interest in the context of changing power balances in the Danish food industry. These aspects of the work have broad appeal to policy makers and industry organisations.
1.3. Background
In the food marketing chain, industrial concentration is occurring simultaneously with advances in technology and changing commercial and consumer behaviour. Trends at both processing and retail stages feature increasing scale (Rogers, 2001) and range of services and products (Kinsey, 2003), as well as new practices in branding (Baker et al., 2005) and purchasing (Young and Hobbs, 2002; OECD, 1999; 2003). This paper examines the influences of market power on welfare throughout the food marketing chain. Its contribution is both methodological and applied. Methodologically, we ad-vance elasticity-based comparative static models to include multiple stages and multi-ple products. Several applications are examined, particularly farm-level innovation and its impacts throughout a multiple-product system. In both the United States and Europe, market concentration has accelerated in the past decade in food retailing (USDA, 2002; Dobson, 2003), and in food processing (Rogers, 2001; Baker, 2003; Baker et al., 2008). Increasing concentration in the food industry has been attributed, at least partly, to consolidation based on mergers that capture economies of scale and scope, and imperfectly competitive behaviour. The causes and effects of concentration may well be interacting with the policy process (Wrigley, 2001; Marsden et al., 1997). Of increasing policy interest is the impact of food industry change on each member of the marketing chain and the consumer. Pre-vious authors have identified interaction between costs and the incidence and impacts of imperfect competition. McCorriston et al. (2001) find that the impact of imperfect competition is related to the nature of firms’ technologies, particularly that cost char-acteristics may either offset or reinforce them in a multiple-product context. Millan (1999) also emphasises the significance of firms’ cost characteristics in models meas-uring market power and Bhuyen and Lopez (1997) detect the simultaneous presence of economies and scale and imperfect competition in most US food processing sec-tors. Several empirical studies have concluded that the cost characteristics of firms,
Innovation in a multiple-stage, multiple-product food marketing chain FOI 9
and not their exercise of market power, are the source of observed “excessive” profits in concentrated industries (Morrison Paul, 2001; Hedberg et al., 2000). In this paper, we examine the welfare effects of market power across a range of marketing and technological environments throughout the marketing chain. A number of simulation models based on Gardner’s (1975) have used multiple-stage equilibrium conditions to model formally the mechanisms by which external shocks are transmitted between stages for a single product. In such approaches, first order profit maximization conditions, in association with equilibrium in vertically-aligned markets, are typically used to generate simulations from assumed values of demand and supply elasticities. A more recent contribution by Sexton and Zhang (2001) fo-cuses on welfare impacts of a range of configurations of market power within a sin-gle-product food chain with three stages. Their approach assumes sets of explicit val-ues for conjectural variations in input and output markets, and presents several meth-odological and practical implications of the relative values of supply and demand elasticities. In the current paper, we extend Sexton and Zhang’s approach to a two-product specification, allowing not only relative values of elasticity to be considered, but also interactions between products in demand (substitution and complementarity) and technology (economies of scope). Empirical tests for market power in the food industries have centred on estimating conjectural variations in output or input markets at a single stage for a single product. A few authors have measured a single stage’s market power in input and output mar-kets simultaneously (Gobin and Goyumard, 2001), for a single product. Examination of multiple-stage food chains has generally examined the single-product case (Fulton and Tang, 1999). Conversely, tests across several related products (Hyde and Perloff, 1998) and across several food industries (Millan, 1999) have generally addressed a single stage. Addressing multiple products through the whole chain has been at-tempted using price transmission models (Holloway, 1991; Reed and Clarke, 2000), under the assumption that incomplete price transmission is a likely consequence of market power. In a game theoretic context, Bulow et al. (1985) have identified fea-tures of technology and demand in multiple related markets that can dictate firms’ be-haviour and the distribution of costs and benefits in each market. We incorporate these empirical findings into our model design, so that model inputs and outputs re-flect variables of policy and commercial interest.
10 FOI Innovation in a multiple-stage, multiple-product food marketing chain
1.4. Outline of report
Section 2 introduces a marketing chain comprised of price-taking farmers, processors and retailers with market power in both input and output markets, and price-taking consumers. This section specifies functional forms and the synthesis of optimisation problems at equilibrium. Section 3 describes model solution and presents a set of baseline runs regarding alternative values for elasticities. Section 4 presents and dis-cusses the results of a set of runs addressing each of market power, and cost and de-mand interactions in the chains. Section 5 is occupied with examination of the im-pacts of farm level innovation under the various scenarios offered by the model. Sec-tion 6 is a discussion of the study and a presentation of conclusions.
Innovation in a multiple-stage, multiple-product food marketing chain FOI 11
2. Model of a multiple-stage, multiple-product food mar-keting chain
2.1. Component equations
We examine a 3-stage food marketing chain (retail R, processing W and farm F) with two products (Y1 and Y2). We assume specific forms for the cost functions at all stages and for consumer demand. At the farm stage production of each product features quadratic cost functions with standard characteristics5 and no interactions between products:
21 1 1 1 1 1
22 2 2 2 2 2
1( ) ( )21( ) ( )2
F F F F
F F F F
c Y bY Y
c Y b Y Y
β
β
= +
= + (1)
where 1 , 2β β > 0. The inverse supply functions PF(·)6 for price-taking farmers are obtained from (1) and state that output price equals marginal production costs, with:
1 1 1 1
2 2 2
F F
F F
P b Y
P b Y
β
β
= +
= + 2
. (2)
In contrast to the farm stage, at each of the retail and the processing stages, firms7 may produce both products jointly. We specify technologies for Y1 and Y2 ( , respectively) that can feature economies of scope.1 1 2 2 1 2( , ), ( , )c y y c y y 8 The
5
cY∂
∂> 0 and
2
2
cY∂
∂> 0.
6 Marginal costs functions are obtained as first derivatives of (1). 7 yi is the firm’s output and Yi is industry output, i i
n
y Y ny= = i∑ for n identical firms for product
{ }1, 2i∈ .
8 Economies of scope imply 2
1
1 2
cy y∂
∂ ∂and
22
2 1
cy y∂
∂ ∂≠ 0. Costs of producing a range of products
may be lower (subadditive) or higher (superadditive) than the sum of costs of producing each prod-uct alone.
12 FOI Innovation in a multiple-stage, multiple-product food marketing chain
intensity of economies of scope in the handling, processing, distribution and retailing cost functions applied at stages R and W are represented by δR, δW ≥ 0 respectively:
21 1 2 1 2
22 1 2 2 1
( , ) ( ) ( )
( , ) ( ) ( )
R
R
R R R R R
R R R R R
c y y y y
c y y y y
δ
δ
−
−
=
= (3)
21 1 2 1 2
22 1 2 2 1
( , ) ( ) ( )
( , ) ( ) ( )
W
W
W W W W W
W W W W W
c y y y y
c y y y y
δ
δ
−
−
=
= (4)
Economies of scope take the form of cost saving arising from improved utilization of equipment, labour and capital, shared costs of quality and safety management prac-tices, and shared distribution activities. Note that in (3) and (4) the trivial case δR =δW= 0 reduces the technology to single-product quadratic cost functions. With just two products, δ must adopt the same magnitude in each of at each stage, but in general δR ≠δW.
1 ( )c 2, ( )i c i
2
R
R
Linear multi-product aggregate demand functions represent utility-maximising con-sumers:
1 1 11 1 12 2
2 2 21 1 22
R R
R R
Y a P P
Y a P P
α α
α α
= − −
= − − (5)
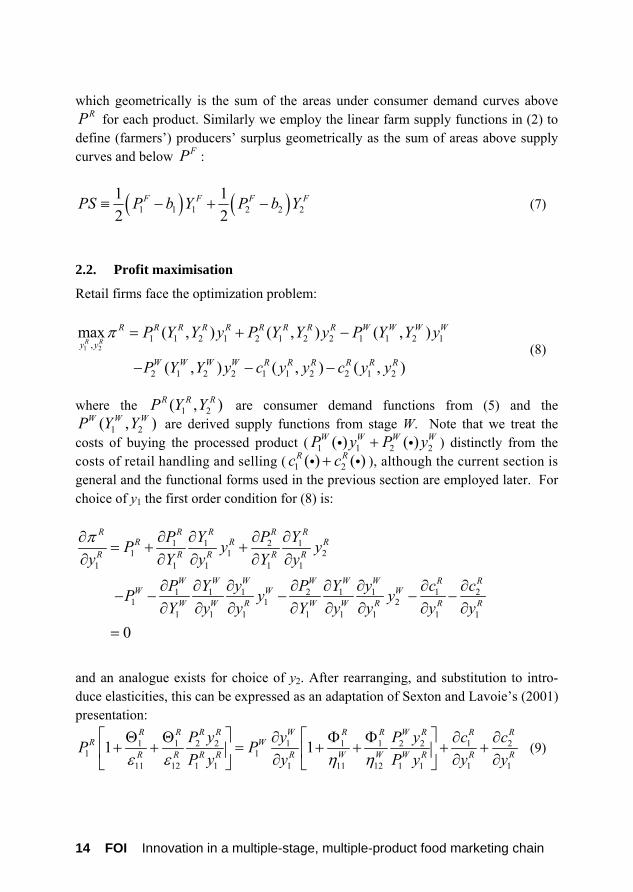
where 12 21,α α can take signs indicating either substitution or complementarity in consumption, and 1 2 11 22, ,a a α α > 0. Welfare in the model is measured (following Sexton and Zhang (2001)) as retail and processor profits (see following section) and consumers’ surplus (CS, adapted to the 2-product case) and producers’ surplus (PS) at the farm level. Consumers’ surplus is defined employing consumer demand (5) as
Innovation in a multiple-stage, multiple-product food marketing chain FOI 13
which geometrically is the sum of the areas under consumer demand curves above for each product. Similarly we employ the linear farm supply functions in RP (2) to
define (farmers’) producers’ surplus geometrically as the sum of areas above supply curves and below : FP
( ) ( )1 1 1 2 2 21 12 2
F F FPS P b Y P b Y≡ − + − F
x ( , ) ( , ) ( , )R R R R R R R R R W W W WP Y Y y P Y Y y P Y Y yπ = + −
i W
(7)
2.2. Profit maximisation
Retail firms face the optimization problem: ma
1 21 1 2 1 2 1 2 2 1 1 2 1
,
2 1 2 2 1 1 2 2 1 2( , ) ( , ) ( , )
R Ry y
W W W W R R R R R RP Y Y y c y y c y y− − −
( , )R R RP Y Y
(8) where the are consumer demand functions from 1 2
)W(5) and the
1 2 are derived supply functions from stage W. Note that we treat the costs of buying the processed product ( 2 ) distinctly from the costs of retail handling and selling ( ), although the current section is general and the functional forms used in the previous section are employed later. For choice of y1 the first order condition for
( ,W WP Y Y1 1 2( ) ( )iW W WP y P y+
1 2( ) ( )i iR Rc c+
(8) is:
1 1 2 11 1 2
1 1 1 1 1
1 1 1 2 1 1 11 1 2
1 1 1 1 1 1 1
0
R R R R RR R R
R R R R R
W W W W W W RW W W
W W R W W R R R
P Y P YP y yy Y y Y y
P Y y P Y y c cP y yY y y Y y y y y
π∂ ∂ ∂ ∂ ∂= + +
∂ ∂ ∂ ∂ ∂
∂ ∂ ∂ ∂ ∂ ∂ ∂ ∂− − − − −
∂ ∂ ∂ ∂ ∂ ∂ ∂ ∂=
2
1
R
and an analogue exists for choice of y2. After rearranging, and substitution to intro-duce elasticities, this can be expressed as an adaptation of Sexton and Lavoie’s (2001) presentation:
1 1 2 2 1 1 1 2 2 11 1
11 12 1 1 1 11 12 1 1 1 1
1 1R R R R W R R W R R
R WR R R R R W W W R R
P y y P y c cP PP y y P y y yε ε η η
⎡ ⎤ ⎡ ⎤Θ Θ ∂ Φ Φ ∂ ∂+ + = + + + +⎢ ⎥ ⎢ ⎥
2R
R∂ ∂ ∂⎣ ⎦ ⎣ ⎦ (9)
14 FOI Innovation in a multiple-stage, multiple-product food marketing chain
where 1 11
1 1
R RR
R R
Y yy Y
∂Θ ≡
∂ is the conjectural variation elasticity,9 a measure of market
power, in the retail output market for product Y1.10 The analogous measure of market
power in product 1’s input markets (i.e. for the processed product) is . 1RΦ
1 111
1 1
R RR
R R
Y PP Y
ε ∂≡∂
is consumers’ own-price elasticity of demand for product 1, . 11Rε 0≤
Processors’ own-price supply elasticity for product 1 is , and cross-price elas-ticities are denoted
11 0Wη ≥12 12,R Wε η .
The extension to Sexton and Lavoie (2001) that we offer is that of multiple products. Firstly, the term 1 2 2
12 1 1
R R R
R R R
P yP yε
Θ on the left hand (revenue) side recognizes that is 2
RP
RΘ affected by change in . The effect depends not only on the magnitudes of and 1
RY 1
12Rε , but also on the relative significance of revenues derived from the two products,
2 2
1 1R R
P yP y
R R
. An analogous input-related term, 1 2 2
12 1 1W W R
P yP yη
ΦR W R
, appears on the left hand side of (9).
The right hand side term 2
1
R
R
cy∂∂
takes account of decline (or rise) in retailers’ costs for
y2 brought about by marginal increments of y1 (i.e. economies of scope). The conse-quence of cross-price effects is a model solution that is sensitive to interactions in demand and supply between two related food marketing chains, and features sensitiv-ity to interactions between these factors and the exercise of market power. Similarly, processing firms’ optimisation problem is:
1 21 1 2 1 2 1 2 2
,
1 1 1 2 2 2 1 1 2 2 1 2
max ( , ) ( , )
( ) ( ) ( , ) ( , )
W W
W W W W W W W W W
y y
F F F F F F W W W W W W
P Y Y y P Y Y y
P Y y P Y y c y y c y y
π = +
− − − − (10)
9 For a firm, the conjectural variation elasticity is the % change in market volume associated with a
unit % change in the firm’s marketed volume. Θ andΦ∈ [0,1], where 0 is associated with per-fect competition and 1 with monopoly and monopsony respectively.
10 Assumed identical for all identical firms as maintained by Sexton and Zhang (2001).
Innovation in a multiple-stage, multiple-product food marketing chain FOI 15
which differs from its retail counterpart only in that farm level supply and
feature no cross-price effects (see
1 1( )F FP Y
2 2(F FP Y ) (1) ). First order conditions yield a proc-
essor-stage analogue of (9):11
1 1 2 2 1 1 11 1
11 12 1 1 1 11 1 1
1 1W W W W F W W
W FW W W W W F W
P y y c cP PP y y y yε ε η
⎡ ⎤ ⎡ ⎤Θ Θ ∂ Φ ∂ ∂+ + = + + +⎢ ⎥ ⎢ ⎥
2W
W∂ ∂ ∂⎣ ⎦ ⎣ ⎦ (11)
Finally, first order conditions for farmers’ profit maximization are given by
11
1
FF
F
cPy∂
=∂
, (12)
reflecting perfectly competitive behaviour. Note that in cases of 1 1 0R RΘ = Φ = (i.e. no market power in retailers’ output or input
markets, then (9) reduces to optimisation under perfect competition with economies of scope:
1 21 1
1 1
R RR W
R R
c cP Py y∂ ∂
= + +∂ ∂
,
which in the absence of economies of scope reduces further to the standard perfect
competition case:12
11 1
1
RR W
R
cP Py∂
= +∂
,
and analogous statements refer to (10) and (11).
Examination of the implications for equilibrium prices, quantities and welfare, of the presence of combinations of market power, consumer demand interactions and tech-nological cost interactions, require the use of specific functional forms and parameter values. In what follows, we investigate combinations of market power in input and output markets at retail and processing stages of the food marketing chain.
11 In (11) the elasticities 11
Wε and 12Wε refer to the retailers’ (derived) demand for the processors’
output. 12 (a simple mark-up model).
16 FOI Innovation in a multiple-stage, multiple-product food marketing chain
3. Model implementation
3.1. Closure and solution
Without loss of generality we impose the simplifying assumption (and similarly for product 2) (see Sexton and Zhang, 2001) so that units for the prod-ucts at each stage such that throughout the marketing chain
1 1R Wy y y= = 1
F
1 1
1 1
1R W
W F
y yy y∂ ∂
= =∂ ∂
.
and this derivative vanishes in (9) and (11). This implies that and , so that superscripts F, W and R are henceforth dropped from Y1 and
Y2.
1 1 1R WY Y Y= = F
2F
2
2
2
2 2R WY Y Y= =
1 1 1, , ,F W RP P P
13 Following Sexton and Zhang (2001) and McCorriston et al. (2001), we interpret the firm level cost functions c(y1, y2) as industry level cost functions c(Y1, Y2) for both products by assuming identical firms at processing and retail stages, respec-tively. For choice of Y1 and Y2, six first order conditions (2 at each of 3 stages) and 2 consumer demand equations are combined to provide 8 equations in 8 unknowns ( ). 2 2 2 1, , , andF W RP P P Y Y The first step is to formulate inverse consumer demand functions from (5) in order to express prices as quantity-dependent functions in line with statements of first order conditions:
1 1 11 1 12
2 2 21 1 22
R
R
P A A Y A Y
P A A Y A Y
= − −
= − − (13)
13 This simplification is equivalent to an assumption of no changes in stocks that differ between stages.
Innovation in a multiple-stage, multiple-product food marketing chain FOI 17
where 1 22 2 12 2 11 1 21
1 211 22 12 21 11 22 12 21
22 1111 22
11 22 12 21 11 22 12 21
12 2112 21
11 22 12 21 11 22 12 21
;
;
;
a a a aA A
A A
A A
α α αα α α α α α α α
α α
α
α α α α α α α αα α
α α α α α α α α
− −≡ ≡
− −
≡ ≡− −
− −≡ ≡
− −
(14)
Next, by using the first order conditions ((9), (11) and (12)), we derive from the spe-cific functional forms ((1)-(4)) two polynomial equations in two unknowns (Y1 and Y2), known demand parameters , ,1a 2a 11α , 22α , 12α and 21α ,14 supply parameters
1 , 2b , 1b β and 2β , intensity of economies of scope δR and δW, and market power pa-rameters 1 2 1 2 at either or both of stages R and W. Elasticities (see mathematical appendix) are also able to be expressed as functions of these same vari-ables and parameters.
, ,Θ Θ ,Φ Φ
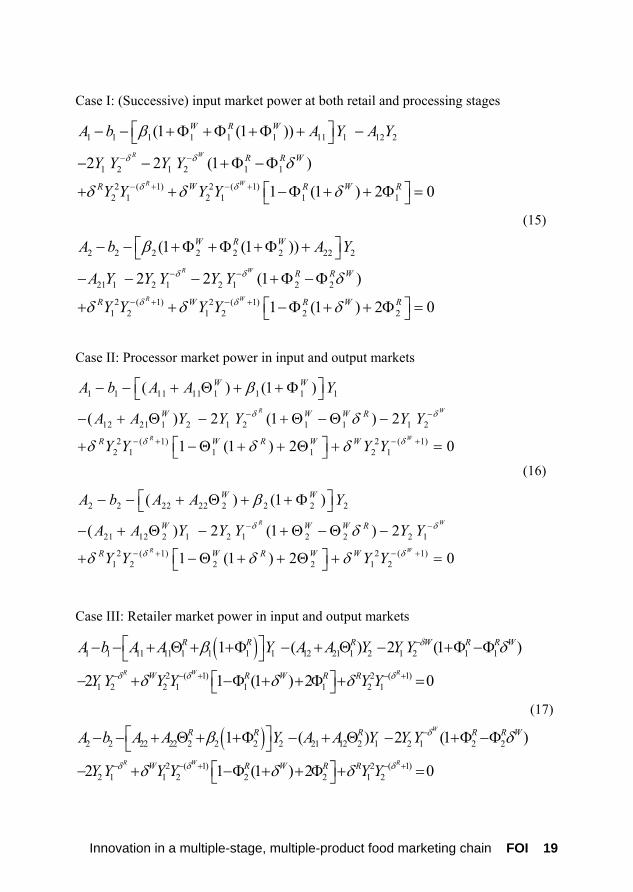
We limit ourselves to input and output market power exhibited by a single stage (e.g.
1 1 ) and sequential market power (e.g. ,R RΘ Φ ≠ 0 01 1,R WΘ Θ ≠, 0R W
): we do not investi-gate cases of interactions of market power (e.g. 1 1Φ Θ ≠ simultaneously), due to their indeterminate outcomes, usually addressed as a solution to some bargaining pro-cedure (Sexton and Zhang, 2001). The resulting pairs of equations are presented for each of four cases:
14 (packaged as A parameters in (14))
18 FOI Innovation in a multiple-stage, multiple-product food marketing chain
Case I: (Successive) input market power at both retail and processing stages
1 1 1 1 1 1 11 1 12 2
1 2 1 2 1 1
2 ( 1) 2 ( 1)2 1 2 1 1 1
2 2 2 2 2 2 22 2
21 1 2 1 2 1 2 2
(1 (1 ))
2 2 (1 )
1 (1 ) 2
(1 (1 ))
2 2 (1 )
R W
R W
R W
W R W
R R W
R W R W R
W R W
R R W
A b A Y A Y
Y Y Y Y
Y Y Y Y
A b A Y
A Y Y Y Y Y
δ δ
δ δ
δ δ
β
δ
δ δ δ
β
δ
δ
− −
− + − +
− −
⎡ ⎤− − +Φ +Φ +Φ + −⎣ ⎦
− − +Φ −Φ
⎡ ⎤+ + −Φ + + Φ⎣ ⎦
⎡ ⎤− − +Φ +Φ +Φ +⎣ ⎦
− − − +Φ −Φ
+ 2 ( 1) 2 ( 1)1 2 1 2 2 21 (1 ) 2
R WR W R W RY Y Y Yδ δδ δ− + − + ⎡ ⎤
0=
0+ −Φ + + Φ =⎣ ⎦
(15)
Case II: Processor market power in input and output markets
1 1 11 11 1 1 1 1
12 21 1 2 1 2 1 1 1 2
2 ( 1) 2 ( 1)2 1 1 1 2 1
2 2 22 22 2 2 2 2
21 12 2 1 2 1 2 2
( ) (1 )
( ) 2 (1 ) 2
1 (1 ) 2
( ) (1 )
( ) 2 (1
R W
R W
R
W W
W W W R
R W R W W
W W
W W W
A b A A Y
A A Y Y Y Y Y
Y Y Y Y
A b A A Y
A A Y Y Y
δ δ
δ δ
δ
β
δ
δ δ δ
β
− −
− + − +
−
⎡ ⎤− − + Θ + + Φ⎣ ⎦
− + Θ − + Θ − Θ −
⎡ ⎤+ − Θ + + Θ +⎣ ⎦
⎡ ⎤− − + Θ + + Φ⎣ ⎦
− + Θ − + Θ − Θ 2 1
2 ( 1) 2 ( 1)1 2 2 2 1 2
) 2
1 (1 ) 2
W
R W
R
R W R W W
Y Y
Y Y Y Y
δ
δ δ
δ
δ δ δ
−
− + − +
−
⎡ ⎤+ − Θ + + Θ +⎣ ⎦
0=
0=
(16)
C
ase III: Retailer market power in input and output markets
( )
( )
1 1 11 11 1 1 1 1 12 21 1 2 1 2 1 1
2 ( 1) 2 ( 1)1 2 2 1 1 1 2 1
2 2 22 22 2 2 2 2 21 12 2 1 2 1 2 2
2
1 ( ) 2 (1
2 1 (1 ) 2 0
1 ( ) 2 (1
2
R W R
W
R R R W R R
W R W R R
R R R R R
A b A A Y A A Y Y Y
Y Y Y Y Y Y
A b A A Y A A Y Y Y
Y Y
δ
δ δ δ
δ
β δ
δ δ δ
)
)
W
Wβ δ
−
− − + − +
−
⎡ ⎤− − + Θ + +Φ − + Θ − +Φ −Φ⎣ ⎦
⎡ ⎤− + −Φ + + Φ + =⎣ ⎦
⎡ ⎤− − + Θ + +Φ − + Θ − +Φ −Φ⎣ ⎦
− 2 ( 1) 2 ( 1)1 1 2 2 2 1 21 (1 ) 2 0
R W RW R W R RY Y Y Yδ δ δδ δ δ− − + − +⎡ ⎤+ −Φ + + Φ + =⎣ ⎦
(17)
Innovation in a multiple-stage, multiple-product food marketing chain FOI 19
Case IV: (Successive) output market power at both retail and processing stages
1 1 11 11 1 1 1 1 12 1 2 21 1 1 2
2 ( 1)1 2 1 2 1 1 1
2 ( 1)1 2 2 1
2 2 22 22 2 2 2 2 21 2 1
( )(1 ) (1 ) ( )
2 (1 (1 )) 1 ( 1) 2
2 0
( )(1 ) (1 )
R R
W W
R W W R R W
W R R W R W
W
R W W R
A b A A Y A A Y
Y Y Y Y
Y Y Y Y
A b A A Y A A
δ δ
δ δ
β
δ δ δ
δ
β
− − +
− − +
⎡ ⎤ ⎡− − + Θ +Θ + − +Θ Θ + Θ +Θ⎣ ⎦ ⎣
⎡ ⎤− +Θ − + −Θ + + Θ⎣ ⎦
− + =
⎡ ⎤− − + Θ +Θ + − +Θ Θ +⎣ ⎦ 12 2 2 1
2 ( 1)2 1 2 1 2 2 2
2 ( 1)2 1 1 2
( )
2 (1 (1 )) 1 ( 1) 2
2 0
R R
W W
R W
W R R W R W
W
Y
Y Y Y Y
Y Y Y Y
δ δ
δ δ
δ δ δ
δ
− − +
− − +
⎤⎦
⎡ ⎤Θ +Θ⎣ ⎦
⎡ ⎤− +Θ − + −Θ + + Θ⎣ ⎦
− + =
(18)
Solution of each system (15) to (18) entails finding the roots of each pair of equations, which identifies equilibrium and optimal quantities Y1 and Y2.15 Relationships be-tween prices at different stages of the food marketing chain are determined by speci-fications of cost and market power derived as mark-ups and relationships between elasticities.16 Second order conditions for profit maximization were tested for all solutions by sub-stitution into a set of Hessian matrices, for which no general functions have yet been derived. A general set of second order conditions is the subject of on-going work. Stability of the model was checked by specifying a wide range of starting values for Y1 and Y2 and varying the order of scenarios. Consistency was checked by ensuring that all four model solutions delivered the same equilibrium prices and quantities de-rived welfare measures when exogenous parameters had been set at the same levels. The special case of perfect competition was used, for each of the four models, in con-sistency tests. In addition, each pair of equations (15) to (18) can be checked against one other pair for the impact of one of the market power parameters, and this was done to ensure consistency.
15 Microsoft Excel’s “solver” facility was used for the complete set of simulations. Initial results
were checked by repeating the process using the “R” freeware. 16 See mathematical appendix .
20 FOI Innovation in a multiple-stage, multiple-product food marketing chain
3.2. Initial values
Mindful of past work demonstrating the sensitivity of multiple-stage models to abso-lute and relative magnitudes of elasticity at retail and farm stages, seven alternatives were examined.17 The approach taken here involves specification of supply and de-mand linear parameters (rather than elasticities), so that elasticity values are (i) de-rived and (ii) non-constant as adjustment occurs along linear “curves”. Table 1 presents the elasticity specifications used, listed A-G. All specifications yielded identical results under perfect competition and without product interactions. Section 3.3 reports departures from that result as simulated market conditions are changed in the model. Following previous work, the specification C (ε = η) is used from section 4 onwards. Table 1. Specification of initial values, and derived elasticities Elasticity specification A B C D E F G R
Cross-price parameters α12 and α21 are introduced at values of -0.05 or 0.05 and note that in this 2-product case α12 = α21. This value corresponds to cross-price elasticities at about 10% of the value of the own-price elasticities. Values for δW and δR lie in the range 0.06-0.15.18
17 The scenarios in Sexton and Zhang are based on { }11 11 0.5, 1.0, 2.0/R Fε η ∈ . 18 Similar to values estimated empirically by Morrison Paul (2001).
Innovation in a multiple-stage, multiple-product food marketing chain FOI 21
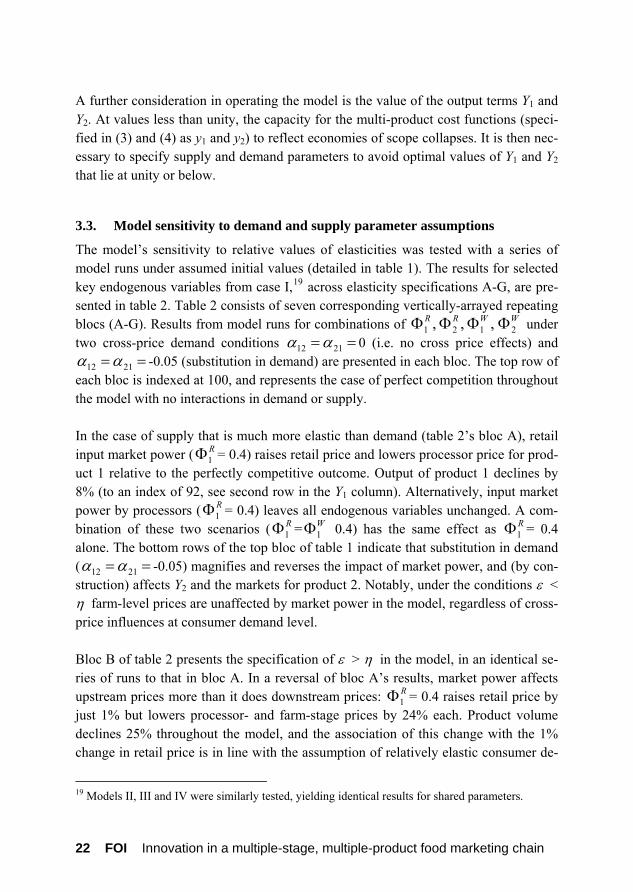
A further consideration in operating the model is the value of the output terms Y1 and Y2. At values less than unity, the capacity for the multi-product cost functions (speci-fied in (3) and (4) as y1 and y2) to reflect economies of scope collapses. It is then nec-essary to specify supply and demand parameters to avoid optimal values of Y1 and Y2 that lie at unity or below.
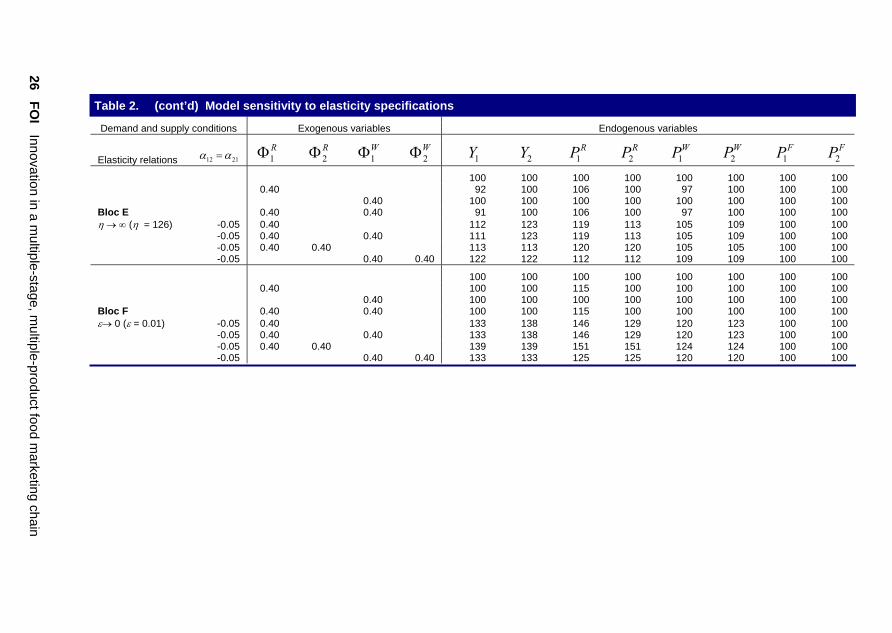
3.3. Model sensitivity to demand and supply parameter assumptions
The model’s sensitivity to relative values of elasticities was tested with a series of model runs under assumed initial values (detailed in table 1). The results for selected key endogenous variables from case I,19 across elasticity specifications A-G, are pre-sented in table 2. Table 2 consists of seven corresponding vertically-arrayed repeating blocs (A-G). Results from model runs for combinations of 1 2 1 2, , , R R W WΦ Φ Φ Φ under two cross-price demand conditions 12 21α α= = 0 (i.e. no cross price effects) and
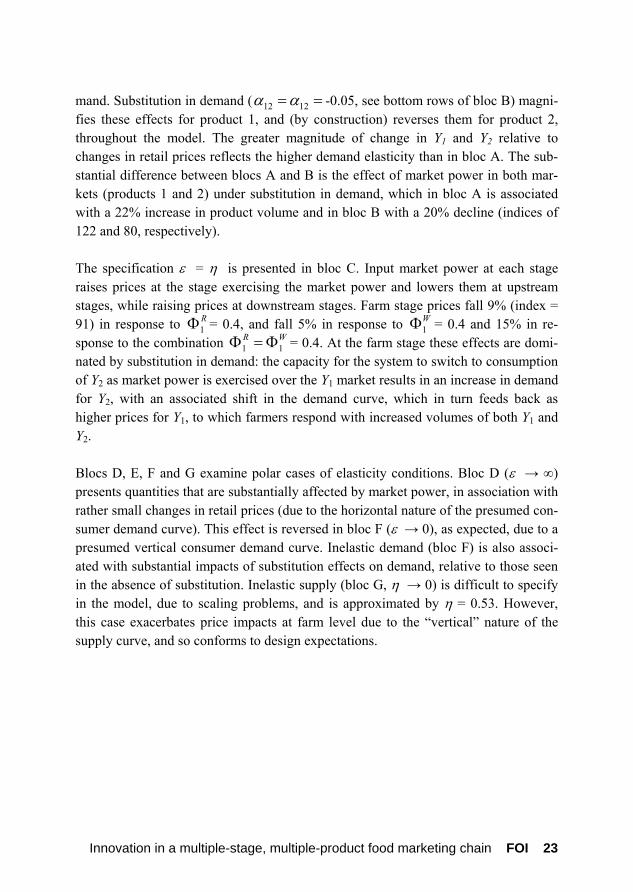
12 21α α= = -0.05 (substitution in demand) are presented in each bloc. The top row of each bloc is indexed at 100, and represents the case of perfect competition throughout the model with no interactions in demand or supply. In the case of supply that is much more elastic than demand (table 2’s bloc A), retail input market power ( 1
RΦ = 0.4) raises retail price and lowers processor price for prod-uct 1 relative to the perfectly competitive outcome. Output of product 1 declines by 8% (to an index of 92, see second row in the Y1 column). Alternatively, input market power by processors ( 1
RΦ = 0.4) leaves all endogenous variables unchanged. A com-bination of these two scenarios ( 1
RΦ = 1WΦ 0.4) has the same effect as = 0.4
alone. The bottom rows of the top bloc of table 1 indicate that substitution in demand ( 12 21
1RΦ
α α= = -0.05) magnifies and reverses the impact of market power, and (by con-struction) affects Y2 and the markets for product 2. Notably, under the conditions ε < η farm-level prices are unaffected by market power in the model, regardless of cross-price influences at consumer demand level. Bloc B of table 2 presents the specification of ε > η in the model, in an identical se-ries of runs to that in bloc A. In a reversal of bloc A’s results, market power affects upstream prices more than it does downstream prices: 1
RΦ = 0.4 raises retail price by just 1% but lowers processor- and farm-stage prices by 24% each. Product volume declines 25% throughout the model, and the association of this change with the 1% change in retail price is in line with the assumption of relatively elastic consumer de-
19 Models II, III and IV were similarly tested, yielding identical results for shared parameters.
22 FOI Innovation in a multiple-stage, multiple-product food marketing chain
mand. Substitution in demand ( 12 12α α= = -0.05, see bottom rows of bloc B) magni-fies these effects for product 1, and (by construction) reverses them for product 2, throughout the model. The greater magnitude of change in Y1 and Y2 relative to changes in retail prices reflects the higher demand elasticity than in bloc A. The sub-stantial difference between blocs A and B is the effect of market power in both mar-kets (products 1 and 2) under substitution in demand, which in bloc A is associated with a 22% increase in product volume and in bloc B with a 20% decline (indices of 122 and 80, respectively). The specification ε = η is presented in bloc C. Input market power at each stage raises prices at the stage exercising the market power and lowers them at upstream stages, while raising prices at downstream stages. Farm stage prices fall 9% (index = 91) in response to 1
RΦ = 0.4, and fall 5% in response to 1WΦ = 0.4 and 15% in re-
sponse to the combination 1 1R WΦ = Φ = 0.4. At the farm stage these effects are domi-
nated by substitution in demand: the capacity for the system to switch to consumption of Y2 as market power is exercised over the Y1 market results in an increase in demand for Y2, with an associated shift in the demand curve, which in turn feeds back as higher prices for Y1, to which farmers respond with increased volumes of both Y1 and Y2. Blocs D, E, F and G examine polar cases of elasticity conditions. Bloc D (ε → ∞) presents quantities that are substantially affected by market power, in association with rather small changes in retail prices (due to the horizontal nature of the presumed con-sumer demand curve). This effect is reversed in bloc F (ε → 0), as expected, due to a presumed vertical consumer demand curve. Inelastic demand (bloc F) is also associ-ated with substantial impacts of substitution effects on demand, relative to those seen in the absence of substitution. Inelastic supply (bloc G, η → 0) is difficult to specify in the model, due to scaling problems, and is approximated by η = 0.53. However, this case exacerbates price impacts at farm level due to the “vertical” nature of the supply curve, and so conforms to design expectations.
Innovation in a multiple-stage, multiple-product food marketing chain FOI 23
24 FOI Innovation in a m
ultiple-stage, multiple-product food m
arketing chain
Table 2. Model sensitivity to elasticity specifications Demand and supply conditions Exogenous variables Endogenous variables
28 FOI Innovation in a multiple-stage, multiple-product food marketing chain
3.4. Scenarios examined and hypotheses to be tested
3.4.1. Market power
The effects of a progression of values for market power are examined, across all four models. The extent to which these effects are offset or exacerbated by interactions in consumer demand (complementarity or substitutability) and costs (economies of scope) is also examined. Finally, scenarios will include the impacts of market power on the generation and transmission of benefits and costs from supply shocks (such as innovation) and demand shocks (income effects or changing tastes). Our expectation is that researchers’ previous results will be reproduced for the single chain scenarios: that welfare declines as the degree of market power rises. The speci-fied model is better able to track developments in the allocation of welfare under market power scenarios than are previous models because of the inclusion of addi-tional chain stages. It is expected that welfare will accumulate in the stages exercising the market power and be depleted elsewhere, particularly as consumer and producer stages’ price-taking behaviour is enforced by the model.
> 0) in demand. The impact of these two demand interactions, relative 21, to α α = 0, will be examined for all model sce-nario outcomes. This broadens the examination of the impacts of market power to ad-dress the importance of relationships between markets: for example the extent to which the effects of market power in one market can be offset throughout the chain by perfect competition in another market; and the extent to which complementarity amongst products can be exploited by market power in one, or two, markets. The expectation is that substitutability in demand will be associated with increased production, and higher prices, in both chains. The production result arises from the signs in (5), while prices reflect the fact that any price reduction in one product will be accompanied by increased demand (by way of a demand shift), and hence in-creased price, for the other product and vice versa. These effects will also apply where market power is exercised, becoming most apparent where it is applied across chains (i.e. observing change in chain 1 while market power is exercised in chain 2).
3.4.3. Product interaction in costs
Cost functions (3) and (4) feature potential for economies of scope δR > 0 and δW > 0 at retail and processing stages, respectively. Examination of the influence of econo-mies of scope includes the identification of interactions between market power and costs conditions: the ways in which firms might combine technologies that feature economies of scope with market power within the food marketing chain. We expect that economies of scope will result in increased profits at the stage where the economies of scope are applied. However, there may be offsetting factors associ-ated with volume changes throughout the chain. Profit increases may be offset to some extent, for example, by increasing product volumes which drive down retail and other prices by way of (5).
3.4.4. Supply shocks
Farm stage supply functions (2) can feature supply shocks by manipulation of b1, b2 . Although this generic approach applies across a range of supply factors (drought, en-try and exit from farm production, etc), the application pursued here is innovation. Innovation is modelled as a % reduction in b1. Its impacts are examined in terms of price and production changes, the resulting welfare allocation, and the apparent transmission of prices throughout the chain under a variety of market power specifica-tions. These measures will be examined for their sensitivity to interactions in demand. Under perfect competition, the farm-level supply shock is expected to be transmitted throughout the chain as price declines and welfare increases, largely due to increased output. This output response will be restricted by the exercise of market power, so that benefits accruing to the farm level of its adoption of an innovation will be re-stricted by market power. Because of the positive signs in (1) and (2), restricted vol-ume throughout the chains will be associated with reduced prices at farm level that will be offset to some extent by upward price pressure at retail level. However, the exercise of market power is expected to intervene between these effects and extract surplus from the farm level. Demand interactions are expected to play a significant role in the generation and allo-cation of benefits from farm-level innovation. Increases in farm production of one product will reduce its price, fuelling increased consumption which is accompanied
Innovation in a multiple-stage, multiple-product food marketing chain FOI 29
by increased consumption of a complementary product but reduced consumption of a substitute.
3.4.5. Demand shocks
Consumer demand equations (5) offer the potential for demand shocks by manipula-tion of a1, a2. This generic approach might address a range of subjects (income change, population growth, changes in tastes), and is not pursued in a specific appli-cation here. However, the welfare allocation and price transmission effects of the de-mand shock will be examined under various market power scenarios and for their sensitivity to interactions in demand and cost.
30 FOI Innovation in a multiple-stage, multiple-product food marketing chain
Innovation in a multiple-stage, multiple-product food marketing chain FOI 31
4. General results
4.1. Market power in the absence of product interactions
In the absence of economies of scope20 and cross-price effects in demand21, the model operates essentially as two independent single-product food marketing chains. This section reports impacts of combinations of market power up and down the (sin-gle) chain for product 1.
4.1.1. Impacts on output
Figure 1 presents the impacts of selected combinations of market power in food mar-keting chain 1 on output Y1. As expected, all forms and combinations of market power cause output to decline, and the declines are somewhat convex in the magnitude of market power (0 representing perfect competition and 1 representing monopoly and/or monopsony). Of the cases presented, the smallest declines in output are associ-ated with exercise of market power at just one point on the chain (lines 1-4), and the exercise of market power on output markets appears to impact output more than does its exercise on input markets (although it is notable that some of the lines cross be-tween market power values of zero and one). Owing to the specification of the model, exercise of sequential output and input market power has the same impact whether at retail or processing stage (see lines 5 and 6, respectively). The mix of retail and proc-essing monopoly is shown to reduce modelled output by up to 60% (line 8), relative to perfect competition, whereas the mix of retail and processing monopsony (line 7) reduces output by up to 40%.
20 2
1
1 2
cy y∂
∂ ∂=
22
2 1
cy y∂∂ ∂
= 0 in (3) and (4).
21 12α = 21α = 0 in (5).
32 FOI Innovation in a multiple-stage, multiple-product food marketing chain
Figure 1. Impacts of market power on output
0
20
40
60
80
100
120
0,0 0,2 0,4 0,6 0,8 1,0
Intensity of market power
(Per
fect
com
petit
ion
= 10
0)
1. PHI_1_R
2. PHI_1_W
3. THETA_1_R
4. THETA_1_W
5. THETA_1_R HI_1_R
&P
6. THETA_1_W I_1_W
&HP
7. PHI_1_R &HI_1_WP
8. THETA_1_RETA_1_W
&TH
4.1.2. Impacts on total welfare
Welfare in food marketing chain 1 (see figure 2) declines monotonically as market power rises, across the same seven forms and combinations of market power as exam-ined in the previous section. The ranking of welfare impacts of the eight forms of market power is the same as that for output (see above), but the relationships appear concave in market power rather than convex as above, and the magnitude of impacts is not as severe.
1. 2. 3. 4. 5. 6. 7. 8.
1RΦ
1WΦ
1Rθ
1Wθ
1 1,R Rθ Φ
1 1,W Wθ Φ
1 1,R WΦ Φ
1 1,R Wθ θ
Y 1
Innovation in a multiple-stage, multiple-product food marketing chain FOI 33
Figure 2. Impacts of market power on welfare
0
20
40
60
80
100
120
0,0 0,2 0,4 0,6 0,8 1,0
Intensity of market power
Tota
l Wel
fare
in c
hain
1 (P
erfe
ct C
ompe
titio
n =
100)
1. PHI_1_R
2. PHI_1_W
3. THETA_1_R
4. THETA_1_W
5. THETA_1_RHI_1_R& P
6. THETA_1_WHI_1_W& P
7.PH
PHI_1_R &I_1_W
8. THETA_1_RETA_1_W& TH
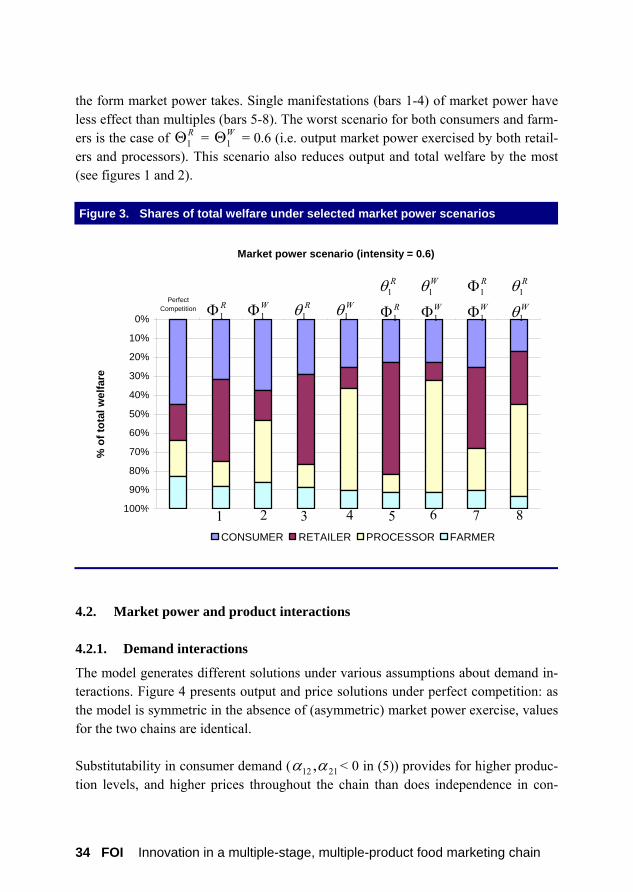
4.1.3. Impacts of market power on welfare allocation
At model solution values, perfect competition results in an allocation of welfare amongst food marketing chain participants of 45% to consumers, 19% each to retail-ers and processors, and 17% to farmers (see left hand bar in figure 3). There is no in-ference associated with those simulated values: rather, interest centres on how they change in the model runs. Figure 3 presents the same eight market power influences as above, with the magnitude of market power set at 0.6 in each case. In all cases, market power shifts welfare toward the agent exercising it, at the expense of all other agents, but particularly at the expense of the agents upon whom the market power is exercised. The agents incapable of exercising market power (consumers and farmers) are worse off under any market power scenario than under perfect competition. Figure 2 above showed that welfare declines as a consequence of the exercise of market power, and the shares of the reduced overall welfare are seen in figure 3 to be highly sensitive to
1. 2. 3. 4. 5. 6. 7. 8.
1RΦ
1WΦ
1Rθ
1Wθ
1 1,R Rθ Φ
1 1,W Wθ Φ
1 1,R WΦ Φ
1 1,R Wθ θ
34 FOI Innovation in a multiple-stage, multiple-product food marketing chain
the form market power takes. Single manifestations (bars 1-4) of market power have less effect than multiples (bars 5-8). The worst scenario for both consumers and farm-ers is the case of 1
RΘ = 1WΘ = 0.6 (i.e. output market power exercised by both retail-
ers and processors). This scenario also reduces output and total welfare by the most (see figures 1 and 2). Figure 3. Shares of total welfare under selected market power scenarios
0%
10%
20%
30%
40%
50%
60%
70%
80%
90%
100%
PerfectCompetition 2. PHI_1_W
4.THETA_1_W
6.THETA_1_W& PHI_1_W
T
T
Market power scenario (intensity = 0.6)
% o
f tot
al w
elfa
re
8.HETA_1_R
&HETA_1_W
CONSUMER RETAILER PROCESSOR FARMER
4.2. Market power and product interactions
4.2.1. Demand interactions
The model generates different solutions under various assumptions about demand in-teractions. Figure 4 presents output and price solutions under perfect competition: as the model is symmetric in the absence of (asymmetric) market power exercise, values for the two chains are identical. Substitutability in consumer demand ( 12 21,α α < 0 in (5)) provides for higher produc-tion levels, and higher prices throughout the chain than does independence in con-
1RΦ 1
WΦ 1Rθ 1
Wθ1
1
R
R
θ
Φ1
1
W
W
θ
Φ1
1
R
W
Φ
Φ1
1
R
W
θ
θ
1 2 3 5 6 7 84
Innovation in a multiple-stage, multiple-product food marketing chain FOI 35
sumer demand ( 12 21,α α = 0). The opposite is true for complementarity ( 12 21,α α > 0). This result arises because the optimal choice of Y1 generated by the model takes into account not only the prices in the chain for product 1, but also for product 2, and the converse applies to the effects of chain 2 choices on chain 1. The mechanism of this influence is shown in (13) and (14), such that demand parameters shift to ac-commodate 12 21,α α , with an effect dependent on sign (i.e. substitution or comple-mentation). The extent of the divergence between solutions also depends on market power (see figure 5), due to the impact of 21
Rε in (9) as discussed earlier. Figure 4. Baseline solutions under perfect competition
Figure 5. Impact of market power on output: various demand interactions
0
20
40
60
80
100
120
0 0.2 0.4 0.6 0.8 1
THETA_1_R
Y_1
(Per
fect
com
petit
ion
= 10
0)
Independent demand
Substitutability
Complementarity
1Rθ
Y 1
The impact of asymmetric (between the two chains) application of market power is presented in figure 6. Relative to respective perfectly competitive solutions (index = 100), both output and welfare in chain 1 rise due to the exercise of market power in chain 2 (in this case processor’s input market power), where products 1 and 2 are sub-stitutes in demand at consumer level. Where products 1 and 2 are complements in demand, these variables decline steadily with increasing levels of market power. It should be noted that the single-chain welfare and output effects are symmetric around 100 (the perfectly competitive levels). Under monopsony in chain 2, welfare in chain 1 is at index 103 where Y1 and Y2 are substitutes and 97 where they are complements. However, the total welfare (the sum of welfare in chains 1 and 2, denoted by lines with boxes in figure 6) behaves differently: the monopsony case with substitution de-livers a result of about index 101, whereas complementarity delivers index 96.5.
36 FOI Innovation in a multiple-stage, multiple-product food marketing chain
Figure 6. Demand interactions and cross-product application of market power
92
94
96
98
100
102
104
0 0,2 0,4 0,6 0,8 1
Market power in chain 2 (PHI_1_W)
Impa
ct o
n ch
ain
1 (w
elfa
re a
nd o
utpu
t) an
d to
tal w
elfa
re
Y_1_COMPL TW_1_SUBST TW_1_COMPLTW_SUBST TW_COMPL
Total Welfare, (SUBST)
Y1 (SUBST) Total Welfare, (SUBST)
Y1 COMPL
Total Welfare COMPL Total Welfare 1 COMPL
2( )WΦ
Clearly, the exercise of market power in one chain can be offset by agents in the food marketing chain switching to products traded under perfectly competitive conditions. The model results suggest that this can be done with an overall gain in welfare. Com-plementarity in consumer demand restricts such substitution and exacerbates the wel-fare losses associated with the exercise of market power. The allocation of welfare within the two chains remains independent of consumer demand cross-product specification (see table 3). Under perfect competition, both
Innovation in a multiple-stage, multiple-product food marketing chain FOI 37
chains allocate welfare identically, as seen earlier. Market power in chain 2 (the case presented here is 2
WΦ = 0.6) shifts allocation in favour of the food chain participant exercising the market power, at the expense of the others. The pattern of this alloca-tion shift is independent of the form of consumer demand interaction.
38 FOI Innovation in a multiple-stage, multiple-product food marketing chain
Innovation in a multiple-stage, multiple-product food marketing chain FOI 39
Table 3. Allocation of welfare with cross-product exercise of market power
Perfect competition 2WΦ = 0.6
Independence n demand i Substitution Complementarity Chain 1 Chain 2 Chain 1 Chain 2 Chain 1 Chain 2 S
The model generates solutions concerning the application of economies of scope by either or both of retailers (via δR) and processors (via δW). As a cost reduction (see (3) and (4)), economies of scope are associated with output increases regardless of where they occur in the food marketing chain (left-most bar of each set of bars in figure 7). Economies of scope are also unambiguously associated with welfare increases. Note that these changes occur symmetrically in both chains, so figure 7 presents only the results from chain 1. A puzzling result is the relative size of price changes associated with economies of scope. Retail price falls as a consequence of the scope economies, due to their output-increasing effect: the same principle applies to all prices downstream of the chain par-ticipant employing the economies of scope. However, this output increase is also as-sociated with higher costs at farm level, which in turn raise the purchasing prices throughout the chain. The overall result is that the food marketing chain participant that employs technology with economies of scope ends up facing reduced selling prices and increased purchasing prices.
Figure 7. Impacts of economies of scope
80
85
90
95
100
105
110
115
No scope Retail scope Processor scope Retail & processorscope
Scope specification as a cost interaction
Pric
es n
o sc
ope
= 10
0
Y_1 P_1_R P_1_W P_1_F TW_1
1RΡ 1
WΡ 1FΡ 1Y 1TW
This result raises two questions concerning (i) the model mechanism delivering it and (ii) its practical significance in the context of observed use of multi-product technolo-gies in the food industry. The result arises from the model’s use of positive supply elasticities at farm level (based on β1 and β2), and at processor level (the term η11
W and η22
W in (9)). These are unambiguously positive in sign (see mathematical appen-dix (i) for derivation from each of models I-IV), and have a magnitude that is highly sensitive to δ. The economic interpretation of the nature of these elasticities is that higher volumes are associated with higher costs and prices, and that economies of scope can act as an accelerator of that effect. This is in contrast to retail price forma-tion in the model, which depends on demand parameters and output (see (13)): al-though output is cost-dependent (via profit maximisation), retail price formation in the model may be being excessively driven by the demand parameters. Beyond the mathematical construction that leads to the result, some lessons emerge. Much conventional wisdom suggests that price formation is dominated by consumer demand issues rather than costs and technology. The extent to which the result achieved here reflects that wisdom is unclear. A second consideration is whether such
40 FOI Innovation in a multiple-stage, multiple-product food marketing chain
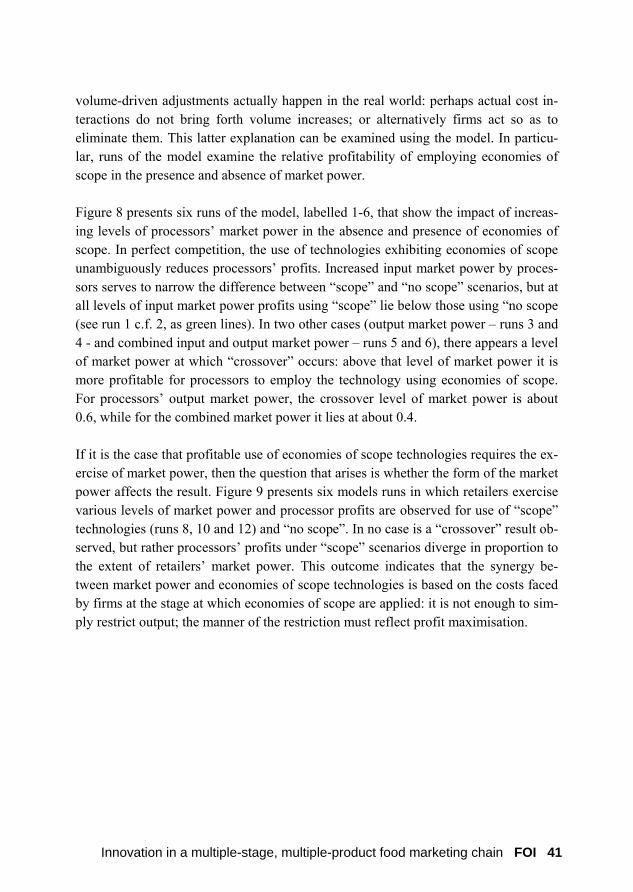
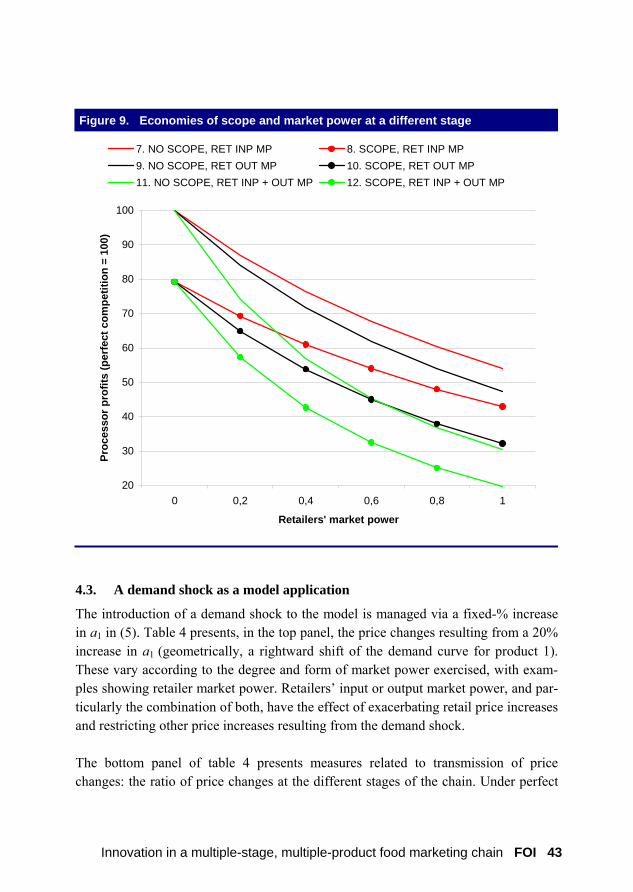
volume-driven adjustments actually happen in the real world: perhaps actual cost in-teractions do not bring forth volume increases; or alternatively firms act so as to eliminate them. This latter explanation can be examined using the model. In particu-lar, runs of the model examine the relative profitability of employing economies of scope in the presence and absence of market power. Figure 8 presents six runs of the model, labelled 1-6, that show the impact of increas-ing levels of processors’ market power in the absence and presence of economies of scope. In perfect competition, the use of technologies exhibiting economies of scope unambiguously reduces processors’ profits. Increased input market power by proces-sors serves to narrow the difference between “scope” and “no scope” scenarios, but at all levels of input market power profits using “scope” lie below those using “no scope (see run 1 c.f. 2, as green lines). In two other cases (output market power – runs 3 and 4 - and combined input and output market power – runs 5 and 6), there appears a level of market power at which “crossover” occurs: above that level of market power it is more profitable for processors to employ the technology using economies of scope. For processors’ output market power, the crossover level of market power is about 0.6, while for the combined market power it lies at about 0.4. If it is the case that profitable use of economies of scope technologies requires the ex-ercise of market power, then the question that arises is whether the form of the market power affects the result. Figure 9 presents six models runs in which retailers exercise various levels of market power and processor profits are observed for use of “scope” technologies (runs 8, 10 and 12) and “no scope”. In no case is a “crossover” result ob-served, but rather processors’ profits under “scope” scenarios diverge in proportion to the extent of retailers’ market power. This outcome indicates that the synergy be-tween market power and economies of scope technologies is based on the costs faced by firms at the stage at which economies of scope are applied: it is not enough to sim-ply restrict output; the manner of the restriction must reflect profit maximisation.
Innovation in a multiple-stage, multiple-product food marketing chain FOI 41
Figure 8. Interaction between market power and economies of scope
50
100
150
200
250
300
0 0,2 0,4 0,6 0,8 1Market power
Proc
esso
r pro
fits
(per
fect
com
petit
ion
= 10
0)
1. NO SCOPE PROC INP MP 2. SCOPE PROC INP MP3. NO SCOPE PROC OUT MP 4. SCOPE PROC OUT MP5. NO SCOPE PROC INP + OUT MP 6. SCOPE PROC INP + OUT MP
42 FOI Innovation in a multiple-stage, multiple-product food marketing chain
Figure 9. Economies of scope and market power at a different stage
20
30
40
50
60
70
80
90
100
0 0,2 0,4 0,6 0,8 1
Retailers' market power
Proc
esso
r pro
fits
(per
fect
com
petit
ion
= 10
0)
7. NO SCOPE, RET INP MP 8. SCOPE, RET INP MP9. NO SCOPE, RET OUT MP 10. SCOPE, RET OUT MP11. NO SCOPE, RET INP + OUT MP 12. SCOPE, RET INP + OUT MP
4.3. A demand shock as a model application
The introduction of a demand shock to the model is managed via a fixed-% increase in a1 in (5). Table 4 presents, in the top panel, the price changes resulting from a 20% increase in a1 (geometrically, a rightward shift of the demand curve for product 1). These vary according to the degree and form of market power exercised, with exam-ples showing retailer market power. Retailers’ input or output market power, and par-ticularly the combination of both, have the effect of exacerbating retail price increases and restricting other price increases resulting from the demand shock. The bottom panel of table 4 presents measures related to transmission of price changes: the ratio of price changes at the different stages of the chain. Under perfect
Innovation in a multiple-stage, multiple-product food marketing chain FOI 43
44 FOI Innovation in a multiple-stage, multiple-product food marketing chain
competition, 95% of a retail price change as a consequence of a demand shock is passed to the processor. In turn, 87% of that change is passed to the farmer. Overall, 83% of any retail price change is passed to the farmer. Transmission is significantly reduced by the exercise of market power. The whole-chain transmission is reduced to 73% in the case of retail power on input and output markets, with the greatest changes being in retail-to-processing transmission. Table 4. Price changes and transmission during demand shock
extent of transmission of price hanges throughout the chain c
Retail to farm 0.83 0.78 0.77 0.73 Processor to farm 0.87 0.85 0.85 0.83 Retail to processor 0.95 0.92 0.91 0.88
Innovation in a multiple-stage, multiple-product food marketing chain FOI 45
5. Innovation as a model application
Innovation is modelled as a (50%) reduction in b1 in (1) and (2), which is geometri-cally interpreted as a rightward shift in the farm supply curve for product 1. The shift is equivalent to a reduction in fixed costs, but associated volume adjustments at farm stage, and beyond, serve to impact variables costs as well. These adjustments are dis-cussed below in the context of the exercise of market power and its effect on price-quantity interactions.
5.1. Innovation and market power in a single chain
5.1.1. Perfect competition
The 50% reduction in b1 in (1) and (2) under perfect competition and without demand interactions between the two products, results in a 2.8% increase in Y1 (see first row, first column of table 5). Under those conditions, the overall decline in farm-level costs is 15.8% (third row of table 5). The welfare change associated with the farm-level innovation (see bottom row of table 5) is a 2.8% increase, and stakeholders at each stage of the food marketing capture a 5.6% increase in chain 1, which when av-eraged with the unchanged welfare in chain 2, provides a 2.8% increase. The price changes associated with the farm-level innovation are presented in table 6, in which the case of perfect competition and no product demand interactions is fea-tured in the first column. The 15.8% decline in farm level costs (see table 5) for Y1 brings about a 2.1% decline in consumer prices, a 4.3% decline in processors prices, and a 10.2% decline in farm-stage prices: note that no change occurs for Y2. The transmission of farm cost savings for Y1 through to price reductions throughout the chain is presented in the bottom panel of table 7. The 15.8% decline in farm costs is transmitted at a rate of 13% to retail level prices, 27% to processing level prices, and 65% to farm level prices.22 Table 8 presents the changes in shares of welfare accruing to each stage of the chain as a result of the farm-level innovation. The zero values in the left hand column indi-cate that under perfect competition, there is no change in those shares.
22 Cost-to-price transmission coefficients do not sum to 100% because changing volumes affect
costs so that some farm-level costs are passed on as costs at downstream changes.
46 FOI Innovation in a multiple-stage, multiple-product food marketing chain
5.1.2. Market power
The second, third and fourth columns of tables 5-8 present the results of simulations of farm-level innovation under perfect competition (discussed above) and scenarios for the exercise of market power. The cases presented all refer to processors’ market power,23 being (ceteris paribus):
• processors’ input market power in chain 1 ( 1WΦ = 0.6);
• processors output market power in chain 1 ( 1WΘ = 0.6); and
• processors input and output market power in chain 1 ( 1W
1WΘ = Φ = 0.6).
The increase in output Y1 associated with the innovation is 2.8% under all market power scenarios. It should be noted that this comparison involves only the innovation: market power applies both with and without the innovation. The cost decline at farm level is 17-21%, and is greatest when market power applies to both input and output markets. As is the case for perfect competition, cost changes reflect volume changes, and as processors increasingly restrict volumes of Y1 by exercising market power, farm costs fall due to these low volumes. Under all market power scenarios, farm-level innovation increases welfare but the magnitude of this change is slightly reduced as market power is applied more widely (a 2.6% increase under 1 1
W WΘ = Φ = 0.6, compared to a 2.8% increase under perfect competition. Under a given market power scenario, shares of aggregate welfare are unaffected by the innovation. However, the innovation delivers different welfare allocations under different market power scenar-ios (see table 8). Market power substantially affects the patterns of price change arising from farm level innovation. The reduction in processors’ prices declines as they apply market power more widely. As a consequence, retail prices (being downstream from proces-sors’) also decline less than they do under perfect competition but the effect is less pronounced than is the case for processors’ prices. Retail prices changes are influ-enced by the impacts of market power: restricted quantities drive up retail prices (see (5)) and offset other effects. Conversely, farm level prices decline by rather more when subjected to market power than they do under perfect competition. This is the consequence of several separate effects: increasingly restricted output due to input and output market power by proc-
23 Other locations, forms and intensities of market power were examined, and results correspond to
the patterns reported here. Further information on specific combinations and forms of market power are available from the authors.
essors reduce farm-level costs and hence prices according to the pricing rule (12); and the cost reduction associated with the innovation reinforces the decline in farm-level prices. The transmission of innovation-generated farm cost savings to prices throughout the chain is also influenced by market power (see table 7). Transmission to retail prices falls as low as 0.05, and to processing prices 0.09 (from 0.13 and 0.27 respectively under perfect competition). For scenarios involving market power, much of the transmission of cost savings into prices occurs at farm level, and this effect is greatest when market power is exercised elsewhere in the chain. Shares of change in aggregate welfare due to the farm-level innovation are greatly af-fected by the exercise of market power (see table 8). For the scenarios of processors’ market power shown, processors’ shares of the welfare generated by the innovation increase by up to 1.4%, while at all other stages welfare shares decline with increas-ing incidence of market power.
5.1.3. Demand interactions
Tables 5-8 feature three horizontally-arrayed panels, each referring to a state of con-sumer demand interaction: no interaction (the left hand panel used above to discuss the perfectly competitive and market power cases); substitution (seen in the middle panel of tables 5-8); and complementarity (the right hand panels). Comparison of the effects of consumer demand interactions begins with the left hand column of each of the three panels in table 5. The innovation at farm level in chain 1 generates a 2.8% increase in Y1 under perfect competition (as discussed above). Where Y1 and Y2 are substitutes in demand, the effect on Y1 is reduced (to a 2.3% in-crease) and accompanied by a decline in Y2 (of 0.3%). Equal and opposite effects are observed on Y1 and Y2 where Y1 and Y2 are complements in demand. The greatest in-crease in total welfare is available where innovation takes place in the presence of complementarity in demand (a 3.5% welfare increase from the innovation, as opposed to 2.1% with substitution and 2.8% with independent consumer demand functions). By construction, changes in Y2 and prices and welfare in the product chain for product 2 are observed only where the demand interaction parameters are non-zero. The observed opposite effects of complementarity and substitution in consumer de-mand are due to the system’s reactions to price changes. The cost reduction induced
Innovation in a multiple-stage, multiple-product food marketing chain FOI 47
48 FOI Innovation in a multiple-stage, multiple-product food marketing chain
at farm level (14.4% under substitution and 17.0% under complementarity) lie below and above, respectively, the 15.8% cost reduction associated with the farm-level in-novation under independent demand conditions. Taking substitution (the middle panel of table 6) as an example, the farm-level cost reduction provides a “rightward shift in the supply curve for Y1”, increasing volume throughout the system. At retail level, this volume increase for Y1 forces prices downwards for Y1 but “shifts the demand curve” for Y2 to the left. This reduces the volume of Y2 throughout the system, which at farm level is associated with a decline in both price and cost for Y2. An analogous set of reasoning explains the complementarity results.
5.1.4. Consumer demand interactions and market power
The combined effects of market power and interactions in consumer demand in de-termining the impact of a farm-level innovation can be observed by traversing each of the three panels in table 5 (the left panel features independence in consumer demand). Both substitutability and complementarity dampen the effects of market power on the impacts of farm level innovation. This effect is due to the impacts of the volume re-strictions associated with the exercise of market power in chain 1, and the associated adjustment to, and feedbacks from, chain 2. Taking complementarity (the right panel of table 5) as an example, more restricted volumes of Y1 (i.e. a 3.0% increase rather than 3.1% increase under perfect competition, due to the innovation) mean that Y1’s price reduction (see first row of table 6) is lower than that under perfect competition (1.3% c.f. 2.1%). The associated rightward shift of the demand curve for Y2 is there-fore smaller than under perfect competition, and all associated changes in product chain 2 reflect this result. The case where a firm exercises market power in both product chains simultaneously is presented below.
Table 5. Impacts of farm-level innovation: welfare effects Demand conditions Independent consumer demand Substitution in consumer demand Complementarity in consumer demand
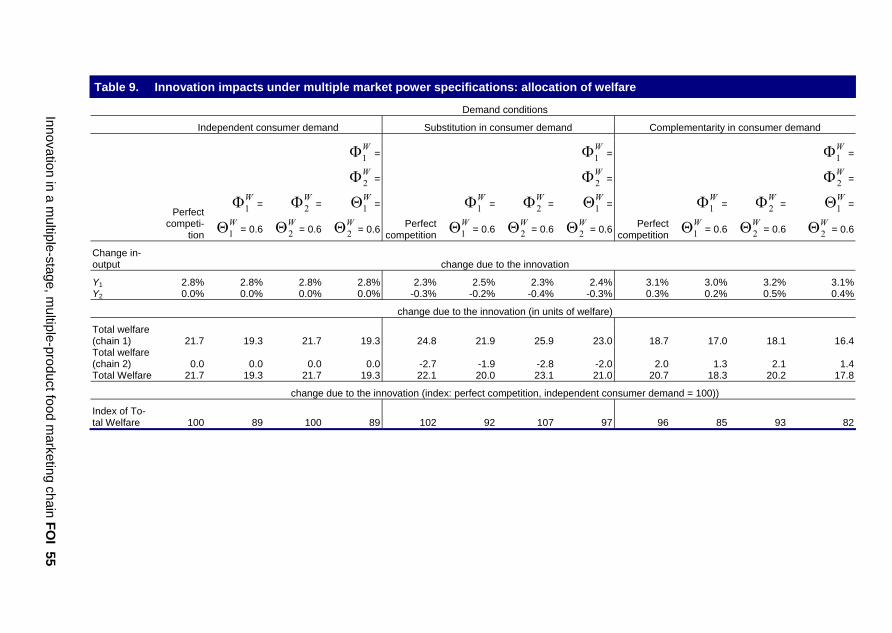
5.2. Innovation and market power in multiple chains
5.2.1. Welfare generation from a farm-level innovation
Table 9 presents the results of simulations where market power is exercised by proc-essors in chain 1 alone, chain 2 alone, and then in both chains simultaneously. The exercise is repeated for substitution (the middle panel) and complementarity (the right hand panel), as well as independence in demand (the left hand panel). The left hand panel results are trivial in the sense that the chain 1 impacts of the farm-level innova-tion in chain 1 are not transmitted to chain 2 at all. Welfare is substantially reduced by the exercise of market power in both chains si-multaneously, with larger impacts under substitution and complementarity in con-sumer demand than under independent demand. A notable result is that under substi-tution, market power in chain 2 alone can actually raise the benefits delivered by the farm-level innovation in chain 1 (welfare index of 107 relative to 102 under perfect competition). This result is due to the ability of agents in chain one to substitute into chain 1, thus exacerbating the welfare impacts of the innovation. The reductions in Y2 are due to both effects. Complementarity works in the other direction (welfare index of 93 as opposed to 96 under perfect competition), due to interaction of two effects:
• the increase in Y2 to accompany the increase in Y1 due to the innovation in chain 1; and
• the reduction in Y2 due to market power in chain 2.
5.2.2. Welfare distribution
Table 10 presents information about the shares of welfare generated in the two prod-uct chains. Under perfect competition, the processor receives around 19% of the wel-fare generated in both product chains. This share increases to around 40% when proc-essors exercise market power in one or another chain, and to about 60% when market power is exercised simultaneously in the two chains. Under perfect competition, the welfare share accruing to processors is unchanged by the innovation at farm level in chain 1. However, the exercise of market power by processors influences the allocation of the benefits of the innovation. It is notable that when market power is applied simultaneously and at the same level of intensity in
Innovation in a multiple-stage, multiple-product food marketing chain FOI 53
54 FOI Innovation in a multiple-stage, multiple-product food marketing chain
chain 1 and chain 2, shares of the benefits accruing to each chain participant are unaf-fected. This is because the symmetric application of market power removes the incen-tive for substitution and/or complementarity.
Innovation in a m
ultiple-stage, multiple-product food m
arketing chain FOI 55
Table 9. Innovation impacts under multiple market power specifications: allocation of welfare Demand conditions Independent consumer demand Substitution in consumer demand Complementarity in consumer demand
Perfect competi-
tion
1WΦ
1WΘ
2WΦ
2WΘ
1W
=
= 0.6
=
= 0.6
1WΦ
2WΦ
1WΘ
2W
=
=
=
1WΦ = Φ =
2W
2WΦ = Φ =
1W
1W
2W
1W
2W
1WΘ = Φ = Φ = Φ = Φ = Θ =
1W
2W
1W
2W
2W
2WΘΘ = 0.6 Θ = 0.6 Θ = 0.6 Θ = 0.6Θ = 0.6 Perfect
competition Θ = 0.6 Perfect competition = 0.6
Change in-output change due to the innovation Y1 2.8% 2.8% 2.8% 2.8% 2.3% 2.5% 2.3% 2.4% 3.1% 3.0% 3.2% 3.1%Y2 0.0% 0.0% 0.0% 0.0% -0.3% -0.2% -0.4% -0.3% 0.3% 0.2% 0.5% 0.4% change due to the innovation (in units of welfare) Total welfare (chain 1) 21.7 19.3 21.7 19.3 24.8 21.9 25.9 23.0 18.7 17.0 18.1 16.4Total welfare (chain 2) 0.0 0.0 0.0 0.0 -2.7 -1.9 -2.8 -2.0 2.0 1.3 2.1 1.4Total Welfare 21.7 19.3 21.7 19.3 22.1 20.0 23.1 21.0 20.7 18.3 20.2 17.8 change due to the innovation (index: perfect competition, independent consumer demand = 100)) Index of To-
l Welfare ta 100 89 100 89 102 92 107 97 96 85 93 82
56 FOI Innovation in a m
ultiple-stage, multiple-product food m
arketing chain
Table 10. Innovation impacts under multiple market power specifications Demand conditions Independent consumer demand Substitution in consumer demand Complementarity in consumer demand
Perfect competi-
tion
1WΦ
1WΘ
2WΦ
2WΘ
=
= 0.6
=
= 0.6
1WΦ =
2WΦ =
1WΘ =
2WΘ = 0.6
Perfect competi-
tion
1WΦ =
1WΘ = 0.6
2WΦ =
2WΘ = 0.6
1WΦ
2WΦ
=
=
1WΘ
2W
=
Θ = 0.6
Perfect competi-
tion
1WΦ =
1WΘ = 0.6
2WΦ =
2WΘ = 0.6
1WΦ =
2WΦ =
1WΘ =
2WΘ = 0.6
Processors’ share of chain benefits Share of total chain benefits held by processors with/without the innovation Without innovation
This paper presents the structure and content of, and selected results from, a model of the food marketing chain. It follows methods developed by various authors based on work by Gardner (1975), as presented in the context of market power by Sexton and Lavoie (2001) and extended to three industry stages by Sexton and Zhang (2001). The current paper provides an advance on that work by introducing multiple products, amongst which the facility exists for interactions in technologies (economies of scope) and demand (substitutability and complementarity). The work done includes solving the model algebraically and implementing it using simple spreadsheets, sup-plementary checking for internal consistency and against results generated in other software. A small selection of results is presented in this report. The model reproduces single-chain results delivered by previous authors, including the sensitivity of solutions to the absolute and relative magnitudes of farm supply and consumer demand elasticities. Specification and simulation of cross-chain market power scenarios are easily dealt with and provide new results to complement past au-thors’ work. The impacts of consumer demand interactions are clear, and easily expli-cable in terms both of mathematical specification and the underlying economic forces at work. The simulated impacts of cost interactions in the chain are less easily ex-plained, but they do generate useful economic information about the nature of link-ages between stages and between product chains.
6.2. Principal results
6.2.1. Starting values
The model is sensitive to initial specifications of supply and demand parameters, which in the current work are the raw input to specification of elasticities. Extreme specifications are associated with some extreme results, particularly where multiple effects (market power and demand interactions) are specified together. Following previous authors, the simulations used for actual research employed elasticity values such that (i) they lay within “normal” bounds of magnitude and (ii) were approxi-mately equal in magnitude and opposite in sign. Other issues of starting values in-cluded the output values’ needing to be significantly above unity due to the form of cost functions used.
Innovation in a multiple-stage, multiple-product food marketing chain FOI 57
6.2.2. Market power
The model’s results show that increasing levels of market power in the food market-ing chain reduce output throughout the chain, in a relationship that is convex in mar-ket power and more extreme as the number and forms of market power exercised are increased. The same is true for the impact of market power on total welfare, except that the relationship with market power is concave. The model quantifies the extent to which welfare shares are changed due to the exer-cise of market power. In particular, it allows calculation of surplus accumulated at the stage exercising the market power and surplus lost elsewhere in the chain, in each chain. Farmers and consumers are hurt most by (sequential) output market power ex-ercised by processors and retailers, although any form of sequential market power greatly reduces the share of welfare accruing to these stakeholders.
6.2.3. Demand interactions
Substitution (and complementarity) in consumer demand has a substantial effect on the results generated by the model. The capacity for chain stakeholders to switch be-tween chains in response to (i) price changes in one chain and (ii) the exercise of market power in one or both chains, greatly affects the simulation results. Under per-fect competition, for example, substitutability and complementarity alter equilibrium prices and volumes in both chains. This is due to the changed profitability relation-ships at the margin: an additional unit of output now has value in both chains rather than just one.
6.2.4. Cost interactions
Against expectations, the model solution indicates that firms employing technologies featuring economies of scope reduce their profits under perfect competition. The rea-son is that increased volumes throughout the system raise purchase prices and so raise costs by more than revenues. This effect can be offset by the exercise of market power: restricting volume can also help to control costs. Model results might be tabu-lated to identify certain critical values for market power, above which economies of scope technologies are profitable. Notably, such critical values appear only in the case where the same stage exercises market power and employs the economies of scope.
58 FOI Innovation in a multiple-stage, multiple-product food marketing chain
6.2.5. Demand shocks
The impacts of a demand shock (e.g. changes in income or tastes) occur differently, depending on the market power being exercised in the chain. As the magnitude and incidence of market power increases, the extent to which price changes are transmit-ted throughout the chain is reduced, and so the benefits of such a demand shock are able to be accumulated by the stage of the chain exercising the market power. These results are consistent with hypotheses.
6.2.6. Innovation
A farm level innovation generates benefits throughout the food marketing chain. That benefit is greater where complementarity in consumer demand occurs with a related product, and less, where the demand interaction features substitutability. Price trans-mission within the chain, and between chains, is more pronounced under demand complementarity, and less pronounced under substitution specifications. Price transmission, and the transmission of cost reductions through to price reduc-tions, is substantially reduced by the exercise of market power. The exercise of mar-ket power in the same chain as that in which the innovation occurs enables firms at one stage of the marketing chain to appropriate the benefits of innovation from other stages. This effect is more pronounced where the products in the respective chains are complements in demand, as substitutability allows the market participants to switch to the other chain. A similar effect is observed where the market power is applied in the other chain (not the one in which innovation occurs): in that case the other food chain participants can benefit fully form the innovation as well as being able to substitute away from the product being subjected to the exercise of market power.
6.3. Implications for industry
The model’s results indicate the significant potential for interactions between product chains in the development of marketing and production plans, as well as a role for the exercise of market power. First, marketing of a range of products that are comple-ments appears to be associated with higher prices and volumes throughout the chain than is the case with either substitutes, or ranges of goods that are independent in de-mand. Where market power is applied, however, output declines most rapidly where product ranges are connected by substitutability, so accelerating the impacts of market power. Exercise by a firm of market power in just one of many chains, however, can
Innovation in a multiple-stage, multiple-product food marketing chain FOI 59
offset any gains to the firm because other chain participants can simply substitute away from the market power. The opposite applies to complementarity. It is clear that benefits flowing to firms from the exercise of market power, and other food chain is-sues, depend strongly on relationships between markets. It is suggested that effort by firms (e.g. promotion) can change these relationships between products on the mar-kets: this may be an effective way of countering market power, or of increasing the benefits available from its exercise. Where firms can apply market power across a range of products (e.g. in the setting of a supermarket) they are more likely to benefit from the market power where the prod-ucts are complements. In fact this is observed in the one-stop, convenience-oriented stance of supermarkets. Similarly, food processors’ market power in one or more of a range of products is likely to pay off only where the products are complements. This may be a factor in brand management, in that market segmentation must be ap-proached with care so as to prevent substitution between the processing firm’s brands. The model’s results are strongly characterised by simultaneity: price and volume movements throughout the chain are influenced by a variety of factors (internal and external to the model) that together deliver a solution. Economies of scope are a case in point, with the surprising result that they deliver benefits elsewhere in the chain where they are applied, unless market power can be exercised to restrict adjustments of product volume. Although this result should be treated with caution, it is notable that economies of scope might be observed to be best utilised by very large firms, that also appear to exercise the most market power. It is also notable that product diversi-fication by food processing firms is often associated with their past accumulation of market power: the Danish co-operative food processors being a case in point. The ex-istence of “critical values” of market power for the profitability of scope-related tech-nologies is an interesting consideration for firms seeking to make investments in such technologies. Under the own-price farm supply and consumer demand elasticity assumptions main-tained, farm-level innovation appears to generate benefits to farmers and consumers, irrespective of the exercise of market power in the chain and the demand interactions that exist between chains. However, it is clear that the exercise of market power al-lows other stages of the chain to appropriate these benefits. The model does not iden-tify a level of market power at which farmers would fail to benefit from an innova-tion, but because innovation is costly, market power may well restrict innovation. Al-though the entire chain benefits from innovation (due to mark-up pricing) firms that
60 FOI Innovation in a multiple-stage, multiple-product food marketing chain
are capable of exercising market power may find it most profitable to appropriate the benefits of a reduced level of innovation than to share the benefits under perfect com-petition.
6.4. Implications for policy makers
Welfare generation by the food marketing chain has been shown in the model to be affected by competitiveness of markets and by cost and consumer demand interac-tions between marketing chains. Although the model’s results reflect the authors’ be-liefs about existing commercial behaviour, rather than predict it per se, several impli-cations for policy makers emerge. First, the relative changes in aggregate welfare from the exercise of market power are very much smaller than those experienced by individual stages of a single chain. This is because the exercise of market power has generally been shown to involve the ap-propriation of surplus by one agent from another, rather than an overall reduction in welfare. Input market power by processors, for example, affects aggregate welfare rather little while greatly affecting farmers’ profits. Moreover, averaging of welfare impacts over just two products in the model has the effect of halving the effect in a single chain: practical policy design involves very large numbers of products so that even extreme impacts may be diluted in the analysis. Second, the model presents economies of scope technology as a public good (the whole chain benefits in aggregate). However, no firm has the incentive to introduce it, but rather to wait for other chain members to do so. As such, a market failure is iden-tified that appears to be being avoided by the exercise of market power to prevent un-controlled product volumes upsetting market prices. This may indicate a policy choice: toleration of market power up to certain “critical values” in order to ensure that such technologies are employed where they are socially beneficial. Where firms’ merger plans are justified by cost savings within the food chain, policy analysts should consider the competitive environment in which such cost savings could be achieved. Policies that require investments that clearly predispose to econo-mies of scope (e.g. procedural change to satisfy food safety, or requirements for the provision of product information) may favour firms that exercise market power, and penalise firms operating in competitive markets.
Innovation in a multiple-stage, multiple-product food marketing chain FOI 61
Third, the model has shown that the benefits of farm-level innovation can be appro-priated by other chain participants at the expense of both farmers and consumers. Moreover, this process is more pronounced under certain sets of conditions for inter-actions between chains, and between products at retail level. Firms that exercise mar-ket power apparently face a choice between appropriating other firms’ benefits and sharing on the benefit generated for the entire chain. In the event that innovation at farm level ceases to be profitable, all chain members stand to lose. Given the substan-tial past, and current, government investment in generating and maintaining innova-tion at farm level, this development is of concern to policy makers. In particular, such investments may be flowing primarily to processors and retailers, and pressure may be exerted to increase that flow as farmers’ incentives to innovate are eroded. Fourth, the model suggests relationships between price transmission and the impacts of the exercise of market power: particularly in the context of firms with market power being able to appropriate surplus from such changes as innovation and demand shocks. Price transmission is thus an important indicator of within-chain relationships that may be used as an indicator of imperfect competition.
6.5. Strengths and weaknesses of the model, and further research
The model presented in this report features linear supply and demand functions and rudimentary cost functions and structures. There may be limitations to the extent to which these components can be synthesised into multiple-stage and multiple-product behavioural models, and for this reason we circumscribe some of our initial results. In particular, this applies to the discovery of a linkage between incentive for the use of economies of scope technologies and market power. Further work on this model is targeting bounds on responsiveness of the “complex” elasticities than apply between stages. However, the results adhere to some clear principles and so offer inference here. Extension to more than two products, and more than three stages, is an obvious exten-sion of the model. The complexity of the necessary algebra, and the challenges of in-ference from the existing model, make this a low priority for further work. The model’s treatment of volumes at each stage of the chain is rudimentary, and might be improved upon by specification of non-unitary conversion factors between stages. This would also enable a richer cost specification to address economies of scope.
62 FOI Innovation in a multiple-stage, multiple-product food marketing chain
The model does not extend to the topic of economies of scale. This is problematic as much food industry development draws contrasts between the impacts of scale (as employed by processors) and scope (as employed by retailers). Economies of scale require special treatment in terms of first and second order conditions for profit maxi-misation, primarily requiring an exogenous output choice in the model. It is suggested that the current model offers valuable inference by its endogenous output choice, and future developments would seek to maintain this. Practical applications of the model have been limited to the investigation of innova-tion, modelled as a simple supply shift. Richer specification of cost functions throughout the chain would enable a more sophisticated approach to innovation, par-ticularly in being able to specify a particular form of innovation, and by allocating costs of innovation throughout the chain as well as to government.
Innovation in a multiple-stage, multiple-product food marketing chain FOI 63
References
Baker, D., K. Baltzer and A. Møller (2006): "The Branding Behavior of Danish Food Industry Firms” Agribusiness 22(1): 31-49.
Baker, D. K. Graber-Lützhøft, P. Festerling and H. O. Hansen (2008): “Trends in
Consolidation and Concentration in the Danish food industry” Fødevareøkono-misk Institut Research Report nr. 196.
Bhuyan, S. and R.A. Lopez (1997): “Oligopoly power in the food and tobacco indus-
tries” American Journal of Agricultural Economics 79: 1035-1043. Bulow J., J. Geanakoplos and P. Kemplerer (1985): “Multimarket Oligopoly: Strate-
gic Substitutes and Complements” Journal of Political Economy 93(3):488-511. Dobson, P. (2003): “Buyer Power in Food Retailing: the European Experience” Con-
ference on Changing Dimensions of the Food Economy: Exploring the Policy Issues. The Hague, Netherlands.
Dobson, P (1999): “Buyer Power and its impact on competition in the food retail dis-
tribution sector of the European Union” study for the EU-DGIV. # IV/98/ETD/078.
Fulton, M. and Y. Tang (1999): “Testing the competitiveness of a multistage food
marketing system: the Canadian chicken industry” Canadian Journal of Agricul-tural Economics 47:225-250
. Gardner, B. (1975): “The Farm-retail Price Spread in a Competitive Food Industry”
American Journal of Agricultural Economics 57(2):399-409. Gobin, A. and H. Goyumard (2001): “Measuring Market Power for Retail Activities:
French Evidence” Journal of Agricultural Economics 57(2):181-195. Hedberg, A., M. Campos, and H. Andersson, (2000): “Cost efficiency and concentra-
tion in Swedish food processing” in The Food sector in transition - Nordic re-search. Norwegian Agricultural Economics Research Institute, NILF-Report 2001-2, Oslo.
64 FOI Innovation in a multiple-stage, multiple-product food marketing chain
Holloway, G. (1991): “The Farm-retail Price Spread in an Imperfectly Competitive Food Industry” American Journal of Agricultural Economics. 73:979-989.
Hyde, C.E. and J.M. Perloff (1998): “Multimarket market power estimation: the Aus-
tralian retail meat sector” Applied Economics 30:1169-1176. Kinsey, J. (2003): “Emerging Trends in the New Food Economy: Consumers, Firms
and Science” Conference on Changing Dimensions of the Food Economy: Ex-ploring the Policy Issues. The Hague, Netherlands.
McCorriston, S., C. Morgan and A. Rayner (2001): “Price transmission: the interac-
tion between market power and returns to scale” European Review of Agricul-tural Economics 28(2): 143-159.
Marsden, T., A. Flynn and M. Harrison (1997): “Retailing, Regulation and Food Con-
sumption: The Public Interest in a Privatised World?” Agribusiness 13(2): 211-226.
Millan J. (1999): “Short run equilibrium and market power in the Spanish food, drink
and tobacco industries” European Review of Agricultural Economics 26(2):229-243.
Morrison Paul, C. (2001): “Market and Cost Structure in the US Beef Packing Indus-
try: a plant level analysis” American Journal of Agricultural Economics 83(1):64-76.
OECD (1999): “Buying power of multi-product retailers” DAFFE/CLP(99)21. OECD (2003): Conference on Changing Dimensions of the Food Economy: Explor-
ing the Policy Issues. The Hague, Netherlands. Reed, A. and J. Clarke (2000): “Structural Change and Competition in Seven US
Food Markets” USDA ERS Technical Bulletin Nr. 1881. Rogers, R. (2001): “Structural Changes in US Food Manufacturing, 1958-1997” Ag-
ribusiness 17(1):3-32.
Innovation in a multiple-stage, multiple-product food marketing chain FOI 65
Sexton, R. and M. Zhang (2001): “An Assessment of the Impact of Food Industry Market Power on U.S. Consumers” Agribusiness 17(1):57-79.
Sexton, R. and N. LaVoie (2001): “Food Processing and Distribution: an industrial
organization approach” in Handbook of Agricultural Economics Chapter 15: 863-932. (Gardner and Rausser, eds) Elsevier.
U.K. Competition Commission (2000): “Supermarkets: A report on the supply of gro-
ceries from multiple stores in the United Kingdom” (Report to the Secretary of State for Trade and Industry).
USDA (2002): “US Food Industry Structural Data” annex to U.S. Food Marketing
System AER-811. Viaenne, J. and X. Gellynck (1995): ”Structure, Conduct and Performance in the
European Food Industries” European Review of Agricultural Economics 22(3):282-295.
Wrigley, N. (2001): “The Consolidation Wave in U.S. Food Retailing: a European
Perspective” Agribusiness 17(4):489-514. Young, L. and J. Hobbs (2002): “Vertical Linkages in Agri-food Supply Chains:
Changing roles for Producers, Commodity Groups and Government Policy” Re-view of Agricultural Economics 24(2):428-441.
66 FOI Innovation in a multiple-stage, multiple-product food marketing chain
Innovation in a multiple-stage, multiple-product food marketing chain FOI 67
Mathematical appendix
Derivation of elasticities and price relationships
Define
1 1 2 1
11 1 1 12 1 2
1 1, andW W
W W W
P Y P YY P Y Pε μ
∂ ∂≡ ≡∂ ∂
1 1
11 1 1
1 F
F F
P YY Pη
∂≡∂
and utilising such that 1 1 1 1F FP MC b Yβ= = + 1
F 11
11 1
1F F
YP
βη
=
Case I (successive input market power) 2 1
1 1 2 2 1 1 1 1 12 W WW WP Y Y Y Y b Yδ δ
1 1W Yδ β β− − −= − + + + Φ
2 11 11 2 2 1 1 1 1 1
11 1 1 1
1 12 ( 1) ( )W W
WW W W
W W W
P Y Y Y Y Y YY P P
δ δδ δ β βη
− − −∂ ⎡ ⎤= = + + + + Φ⎣ ⎦∂2 1
2 2 1 1 2 2 2 2 2 2 22 W WW W WP Y Y Y Y b Y Yδ δ
0>
δ β β− − −= − + + + Φ
2 12 12 1 1 2
21 1 2 2
1 12 2W W
WW W
W W W
P Y Y Y Y YY P P
δ δδ δη
− − −∂ ⎡ ⎤= = − −⎣ ⎦∂0<
01
1
11
1
1
1
1
11
>=∂∂
= wF
F
F PY
PY
YP β
η
68 FOI Innovation in a multiple-stage, multiple-product food marketing chain
Case II (processors market power) 2 1
1 1 11 1 12 2 1 2 2 12R RW RP A A Y A Y Y Y Y Yδ δδ− − −= − − − +
2 11 111 1 1 2 2 1
11 1 1 1
1 12 ( 1)R R
WR R
W W W
P Y A Y Y Y Y YY P P
δ δδ δε
− − −∂ ⎡ ⎤= = − − − +⎣ ⎦∂0<
2 12 2 21 1 22 2 2 1 1 22
R RW RP A A Y A Y Y Y Y Yδ δδ− − −= − − − +
2 12 121 1 2 1 1 2
21 1 2 2
1 12 2R R
WR R
W W
P Y A Y Y Y Y YY P P
δ δδ δε
− − −∂ ⎡ ⎤= = − + +⎣ ⎦∂ W
01
1
11
1
1
1
1
11
>=∂∂
= wF
F
F PY
PY
YP β
η
Case III (retailer market power)
01
1
111
1
1
1
1
11
<−=∂∂
= RR
R
R PYA
PY
YP
ε
01
2
121
2
1
1
2
21
<−=∂∂
= RR
R
R PYA
PY
YP
ε
2 11 1 2 2 1 12
W WW WP Y Y Y Y bδ δ1 1Yδ β− − −= − + +
( ) 2 12 11 1 1 2 2 1
11 1 2 1
1 12 1W W
WW W
W W W
P Y Y Y Y Y YY P P
δ δβ δ δη
− − −∂ ⎡ ⎤= = + + +⎣ ⎦∂0>
2Y
2 12 2 1 1 2 2 22
W WW WP Y Y Y Y bδ δδ β− − −= − + +
2 12 12 1 1 2
21 1 2 2
1 12 2W W
WW W
W W W
P Y Y Y Y YY P P
δ δδ δη
− − −∂ ⎡ ⎤= = − −⎣ ⎦∂0<
Innovation in a multiple-stage, multiple-product food marketing chain FOI 69
Case IV (successive output market power)
1 1 111
11 1 1 1
1 0W
R W R
P Y YAY P Pε
∂= = −
∂<
01
2
121
2
1
1
2
21
<−=∂∂
= RR
R
R PYA
PY
YP
ε
2 11 1 11 1 12 2 1 11 1 1 21 2 1 2 2 12
R RW R RRP A A Y A Y A Y A Y Y Y Y Yδ δδ− − −= − − −Θ −Θ − +
( ) 2 11 111 1 1 11 1 1 2 2 1
11 1 1 1
1 12 1R R
WR R R
W W W
P Y A Y A Y Y Y Y YY P P
δ δδ δε
− − −∂ ⎡ ⎤= = − −Θ − − +⎣ ⎦∂2 1
2 2 21 1 22 2 2 22 2 2 12 1 2 1 1 22W RW R R
RP A A Y A Y A Y A Y Y Y Y Yδ δδ
0<
− − −= − − −Θ −Θ − +
2 12 121 1 2 12 1 2 1 1 2
21 1 2 2
1 12 2R R
WR R R
W W W
P Y A Y A Y Y Y Y YY P P
δ δδ δε
− −∂ ⎡ ⎤= = − −Θ + +⎣ ⎦∂−
Working Papers Institute of Food and Resource Economics
05/08 May 2008 Derek Baker
Tove Christensen Innovation in a multiple-stage,
multiple-product food marketing chain
04/08 May 2008
Wusheng Yu Hans G. Jensen
Modeling Agricultural Domestic Support in China: recent policy reversals and two future scenarios
03/08 May 2008
Wusheng Yu Ronald Babula
Dynamic Economic Relationships among China’s Cotton Imports and the EU Market for Apparel Exports
02/08 Februar 2008 Kenneth Baltzer
Jesper Kløverpris Improving the land use specifica-
tion in the GTAP model 01/08 Februar 2008 Svend Rasmussen Risikostyring i landbruget 21/07 December 2007 Lartey G. Lawson
Jørgen Dejgaard Jensen Mogens Lund
The Costs of Food Safety – a Methodological Review
20/07 December 2007 Lartey G. Lawson
Johannes Sauer Peter V. Jensen Helen H. Jensen
The Banning of Anti-Microbial Growth Promoters and Farm Effi-ciency Effects in Danish Pig Pro-duction
19/07 December 2007 Anders Larsen
Søren Marcus Pedersen Seminar om evaluering af forsk-
ningsprogrammer 18/07 December 2007 Michael Fussing Clausen
Mogens Lund Effektmåling på handlingsplaner
og Balanced Scorecards i Kvæg-produktion 2010
17/07 December 2007 Lartey G. Lawson
Vibeke F. Jensen Jacob B. Christensen Mogens Lund
Therapeutic antibiotic use and the variable costs of broiler produc-tion in Denmark
70 FOI Innovation in a multiple-stage, multiple-product food marketing chain
16/07 December 2007 Derek Baker and Kimmie Graber-Lützhøft
Competition and transaction in the Danish food industry
15/07 December 2007 Derek Baker Policy and the modern food sup-
ply chain 14/07 November 2007 Lartey G. Lawson,
Vibeke F. Jensen Lars Otto
Tracing the impact of non-use of Antimicrobial growth Promotors on output productives in Danish broiler Production
September 2007 Le Dang Trung
Tran Ngo Minh Tam Bob Baulch Henrik Hansen
The Spatial Integration of Paddy Markets in Vietnam
13/07
12/07 August 2007 Wusheng Yu Schemes for aggregating preferen-
tial tariffs in agriculture, export volume effects and African LDCs
11/07 June 2007 Kimmie Graber-Lützhøft
Derek Baker Muligheder, trusler og forvent-
ninger i dansk fødevareindustri 10/07 June 2007 Svend Rasmussen Agricultural Sector Modelling
- A Micro-based Approach based on Mathematical Programming
09/07 June 2007 Ronald Babula
Mogens Lund Exploiting the Cointegration
Properties of US Pork related Markets: The Emergence of a U.S. Demand for Pork as an Input
08/07 May 2007 Jørgen Dejgård Jensen
Anja Skadkær Møller Vertical price transmission in the
Danish food marketing chain 07/07 May 2007 Derek Baker
Karen Hamann Innovation and the policy envi-
ronment Findings from a work-shop with meat industry firms in Skive
Innovation in a multiple-stage, multiple-product food marketing chain FOI 71
72 FOI Innovation in a multiple-stage, multiple-product food marketing chain
06/07 May 2007 Derek Baker Jens Abildtrup Anders Hedetoft René Kusier
Role of regional and rural devel-opement policy in supporting small-scale agribusiness in remote areas
05/07 Maj 2007 Jørgen Dejgård Jensen Analyse af tre forskellige scenari-
er for afgiftsændringer på fødeva-rer
04/07 March 2007 Hans Grinsted Jensen
Kenneth Baltzer Ronald A. Babula Søren E. Frandsen
The Economy-Wide Impact of Multilateral NAMA Tariff Reduc-tions: A Global and Danish Per-spective
03/07 March 2007 Svend Rasmussen Optimising Production using the
State-Contingent Approach versus the EV Approach
02/07 Februar 2007 Kenneth Baltzer
Søren E. Frandsen Hans G. Jensen
European Free Trade Areas as an alternative to Doha - Impacts of US, Russian and Chinese FTAs
01/07 Januar 2007 Lill Andersen
Ronald A. Babula Helene Hartmann Martin M. Rasmussen
A Vector Autoregression Model of Danish Markets for Pork, Chicken, and Beef