1 13 th World Conference on Earthquake Engineering Vancouver, B.C., Canada August 1-6, 2004 Paper No. 2595 DAMAGE DETECTION FROM HIGH-RESOLUTION SATELLITE IMAGES FOR THE 2003 BOUMERDES, ALGERIA EARTHQUAKE Fumio YAMAZAKI 1 , Ken’ichi KOUCHI 2 , Masashi MATSUOKA 3 , Masayuki KOHIYAMA 4 , and Nanae MURAOKA 2 SUMMARY A strong earthquake of magnitude 6.8 struck the Mediterranean coast of Algeria on May 21, 2003 and the cities of Boumerdes and Zemmouri were most heavily damaged. QuickBird satellite observed these areas before and after the earthquake. Based on these images, the present authors performed visual damage detection of buildings. Using the post-event pan-sharpened image only, totally collapsed buildings, partially collapsed buildings, and buildings surrounded by debris were identified. Some buildings were difficult to judge their damage levels, and thus, the pre-event image was also employed as a reference to judge the damage status. By this visual inspection, a total 3,446 buildings were classified in Boumerdes and 1,399 buildings in Zemmouri based on their damage grades. The locations of refugee tents in the two post-event images were also identified. These observations indicate that high-resolution satellite images can provide quite useful information to emergency management after natural disasters. INTRODUCTION Recent advancements in remote sensing and its application technologies made it possible to use remotely sensed imagery for assessing vulnerability of urban areas and for capturing damage distribution due to natural disasters [1]. Especially it is important for emergency management and recovery works to capture damage distribution immediately after an earthquake or other disasters. For example, through the experience of the 1995 Hyogoken-Nanbu (Kobe) earthquake, it was emphasized that the information about damages should be obtained at an early stage. Since remote sensing data observed by various platforms have both advantage and disadvantage in immediacy and resolution, it is necessary to consider the characteristics of each platform and sensor and the quality of data when they are used. In order to examine the applicability of remote sensing technologies to emergency management after earthquakes, Hasegawa et al. [2] performed visual damage detection using aerial images from high-definition television cameras, and Ogawa and Yamazaki [3] 1 Professor, Faculty of Engineering, Chiba University, Chiba, Japan. Email: [email protected]2 Graduate Student, Department of Civil Engineering, University of Tokyo, Tokyo, Japan. 3 Team Leader, Earthquake Disaster Mitigation Research Center (EDM), NIED, Kobe, Japan. 4 Research Associate, Institute of Industrial Science, University of Tokyo, Tokyo, Japan.
Transcript
1
13th World Conference on Earthquake Engineering Vancouver, B.C., Canada
August 1-6, 2004 Paper No. 2595
DAMAGE DETECTION FROM HIGH-RESOLUTION SATELLITE IMAGES FOR THE 2003 BOUMERDES, ALGERIA EARTHQUAKE
SUMMARY A strong earthquake of magnitude 6.8 struck the Mediterranean coast of Algeria on May 21, 2003 and the cities of Boumerdes and Zemmouri were most heavily damaged. QuickBird satellite observed these areas before and after the earthquake. Based on these images, the present authors performed visual damage detection of buildings. Using the post-event pan-sharpened image only, totally collapsed buildings, partially collapsed buildings, and buildings surrounded by debris were identified. Some buildings were difficult to judge their damage levels, and thus, the pre-event image was also employed as a reference to judge the damage status. By this visual inspection, a total 3,446 buildings were classified in Boumerdes and 1,399 buildings in Zemmouri based on their damage grades. The locations of refugee tents in the two post-event images were also identified. These observations indicate that high-resolution satellite images can provide quite useful information to emergency management after natural disasters.
INTRODUCTION Recent advancements in remote sensing and its application technologies made it possible to use remotely sensed imagery for assessing vulnerability of urban areas and for capturing damage distribution due to natural disasters [1]. Especially it is important for emergency management and recovery works to capture damage distribution immediately after an earthquake or other disasters. For example, through the experience of the 1995 Hyogoken-Nanbu (Kobe) earthquake, it was emphasized that the information about damages should be obtained at an early stage. Since remote sensing data observed by various platforms have both advantage and disadvantage in immediacy and resolution, it is necessary to consider the characteristics of each platform and sensor and the quality of data when they are used. In order to examine the applicability of remote sensing technologies to emergency management after earthquakes, Hasegawa et al. [2] performed visual damage detection using aerial images from high-definition television cameras, and Ogawa and Yamazaki [3]
1 Professor, Faculty of Engineering, Chiba University, Chiba, Japan. Email: [email protected] 2 Graduate Student, Department of Civil Engineering, University of Tokyo, Tokyo, Japan. 3 Team Leader, Earthquake Disaster Mitigation Research Center (EDM), NIED, Kobe, Japan. 4 Research Associate, Institute of Industrial Science, University of Tokyo, Tokyo, Japan.
2
performed visual detection using aerial photographs. These kinds of images can identify individual buildings but they cannot cover a large area with one acquisition time. On the other hand, satellite images have an advantage to observe a large area at one time. Capability of optical/SAR satellite imagery has been demonstrated for damage detection in large-scale natural disasters. Matsuoka et al. [4] investigated the characteristics of the pre- and post-event optical satellite images in the damaged areas due to the 1995 Kobe earthquake and Matsuoka and Yamazaki [5] investigated the changes in the characteristics of SAR intensity images due to several recent earthquakes. However, the spatial resolution of these satellite images is from 20 m to 30 m. Hence, it is difficult to identify the damage of individual buildings and bridges from these images. It is worth mentioning that QuickBird, a high-resolution commercial satellite with the maximum spatial resolution of 0.6 m, has been launched successfully on October 18, 2001 and it acquires optical images of urban areas, in which individual buildings can be identified. Hence, these images can be used to detect damages of individual buildings and infrastructures after natural disasters. Using the images obtained by QuickBird after the 21 May, 2003 Algeria earthquake, this paper presents the results of visual damage detection for the urban areas of Boumerdes and Zemmouri for the purpose of evaluating the capability of high-resolution optical satellite images.
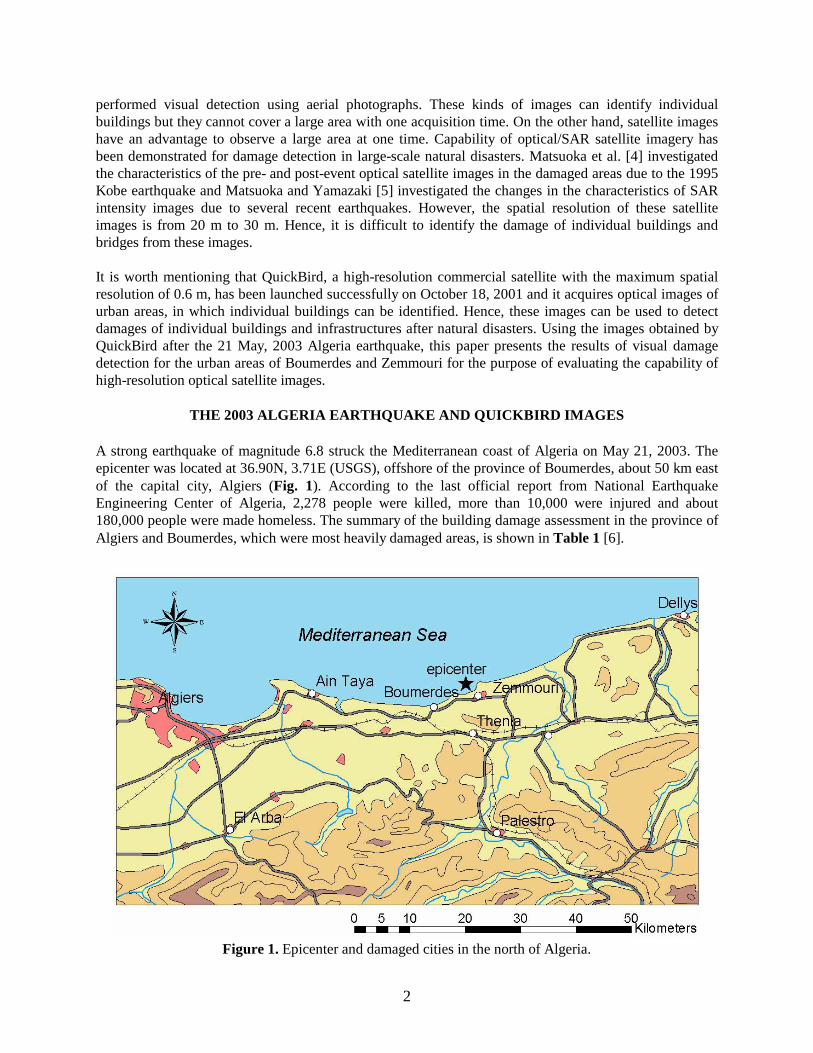
THE 2003 ALGERIA EARTHQUAKE AND QUICKBIRD IMAGES A strong earthquake of magnitude 6.8 struck the Mediterranean coast of Algeria on May 21, 2003. The epicenter was located at 36.90N, 3.71E (USGS), offshore of the province of Boumerdes, about 50 km east of the capital city, Algiers (Fig. 1). According to the last official report from National Earthquake Engineering Center of Algeria, 2,278 people were killed, more than 10,000 were injured and about 180,000 people were made homeless. The summary of the building damage assessment in the province of Algiers and Boumerdes, which were most heavily damaged areas, is shown in Table 1 [6].
Figure 1. Epicenter and damaged cities in the north of Algeria.
3
Table 1. Building damage due to the earthquake (Belazougui et al. 2003).
Figure 2. Pan-sharpened natural color QuickBird images acquired on May 23, 2003 (left: Boumerdes, right: Zemmouri).
Figure 3. Example of time series images of a heavily damaged area (circled area in Fig. 2).
First, pan-sharpened images were produced by combining panchromatic images of 0.6 m resolution and multi-spectral images of 2.4 m resolution, as shown in Fig. 2. By this image enhancement, buildings, cars and debris can clearly be seen. Three pan-sharpened images (one pre-event, and two post-event images) were produced for each city and they were used in visual inspection of building damage. Figure 3 shows a typical area in Boumerdes where many collapsed buildings are observed in the post-event images. Debris of collapsed buildings can be seen in the image of two days after the event and cleaning-up of debris in the image of 28 days after the event.
Province Algiers Boumerdes
Destroyed about 8,500 about 7,400 Heavily Damaged more than 20,000 about 7,000
April 22, 2002 June 18, 2003 May 23, 2003
4
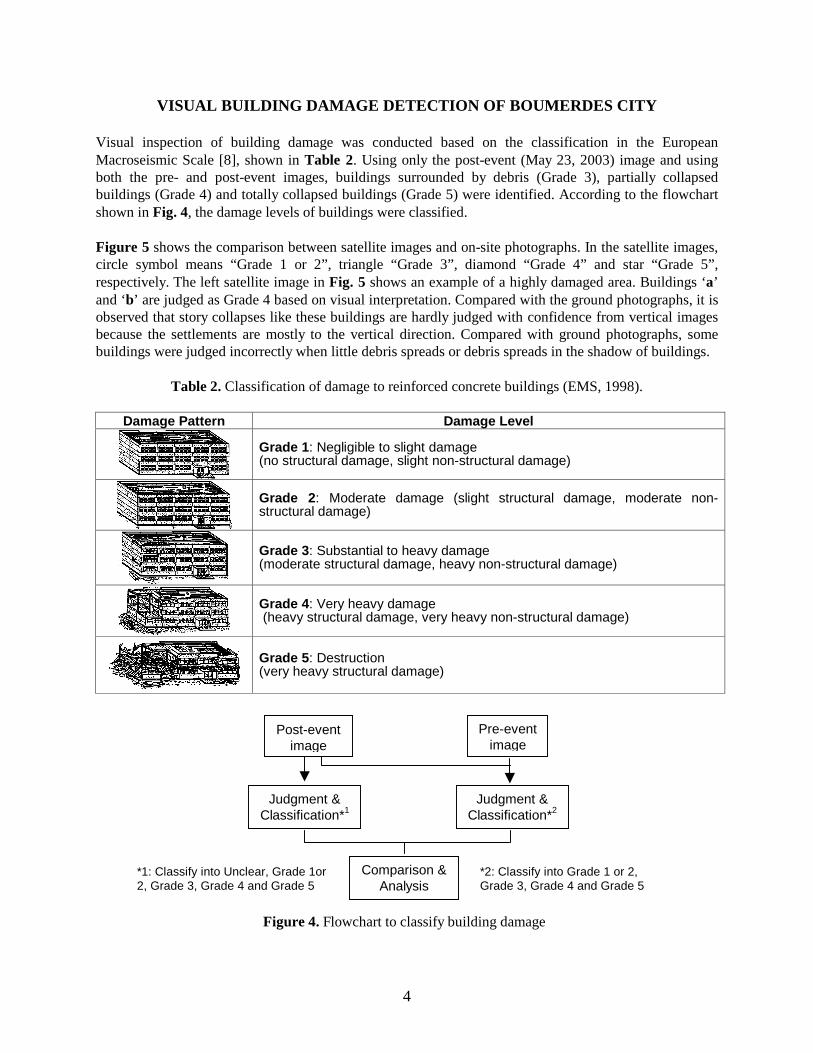
VISUAL BUILDING DAMAGE DETECTION OF BOUMERDES CITY Visual inspection of building damage was conducted based on the classification in the European Macroseismic Scale [8], shown in Table 2. Using only the post-event (May 23, 2003) image and using both the pre- and post-event images, buildings surrounded by debris (Grade 3), partially collapsed buildings (Grade 4) and totally collapsed buildings (Grade 5) were identified. According to the flowchart shown in Fig. 4, the damage levels of buildings were classified. Figure 5 shows the comparison between satellite images and on-site photographs. In the satellite images, circle symbol means “Grade 1 or 2”, triangle “Grade 3”, diamond “Grade 4” and star “Grade 5”, respectively. The left satellite image in Fig. 5 shows an example of a highly damaged area. Buildings ‘a’ and ‘b’ are judged as Grade 4 based on visual interpretation. Compared with the ground photographs, it is observed that story collapses like these buildings are hardly judged with confidence from vertical images because the settlements are mostly to the vertical direction. Compared with ground photographs, some buildings were judged incorrectly when little debris spreads or debris spreads in the shadow of buildings.
Table 2. Classification of damage to reinforced concrete buildings (EMS, 1998).
Damage Pattern Damage Level
Grade 1: Negligible to slight damage (no structural damage, slight non-structural damage)
Grade 3: Substantial to heavy damage (moderate structural damage, heavy non-structural damage)
Grade 4: Very heavy damage (heavy structural damage, very heavy non-structural damage)
Grade 5: Destruction (very heavy structural damage)
Figure 4. Flowchart to classify building damage
*1: Classify into Unclear, Grade 1or 2, Grade 3, Grade 4 and Grade 5
*2: Classify into Grade 1 or 2, Grade 3, Grade 4 and Grade 5
Pre-event image
Comparison & Analysis
Judgment & Classification*1
Judgment & Classification*2
Post-event image
5
The right photographs in Fig. 5 show the buildings in the south campus of Boumerdes University. Building ‘c’ is judged as Grade 5 and Building ‘d’ as Grade 1 or 2 based on visual interpretation. The ground photograph verifies the accuracy of the judgment for Building ‘c’ since their damages are apparent even from the vertical direction. Although Building ‘d’ was judged as no to moderate damage (Grade1 or 2), the ground photograph indicates that it suffered from some damage (Grade 2 or Grade 3), especially inside the building. The field observation revealed that the debris seen in the photographs were gathered between the buildings in the stage of clearing works. These examples show difficulty to identify damages less than Grade 3. In the area of ‘e’, refugee tents can be seen. By this visual interpretation, a total 3,446 buildings were classified based on their damage grades. The numbers of identified damaged buildings were 70, 29, 47, and 538 for Grades 3, 4, 5, and “Unclear”, respectively, based on only the post-event image of May 23. The numbers of identified damaged buildings were 261, 54 and 71 for Grades 3, 4 and 5, respectively, based on both the pre- and post-event images. The remaining buildings were identified as Grade 1 or 2. The numbers of identified damaged buildings using the pre- and post-event images are 3.7 times of that using only the post-event image for Grade 3, 1.9 times for Grade 4, and 1.5 times for Grade 5 (Fig. 6). Thus the pre-event image was found to be more important for the detection of lower damage grades in visual interpretation. Next, this result was compared with the data from a field survey, which started one week after the event by Algerian engineers. The number of damaged buildings was counted in almost the same area as that of our visual detection. The differences in the numbers of buildings and tents indicate that the area of the field survey is slightly smaller in size than that of our visual inspection. In the field survey, the damage assessment was conducted based on the classification shown in Table 3, which has 5 damage levels and is similar to EMS, 1998. Table 4 shows comparison of damaged building ratios between the field survey and the visual detection from the satellite images. The damage ratios based on the visual damage
b
c a
e
d
b a c d
Figure 5. Comparison between the satellite images and the on-site photographs (the on-site photographs are by courtesy of Prof. K. Meguro of The University of Tokyo).
6
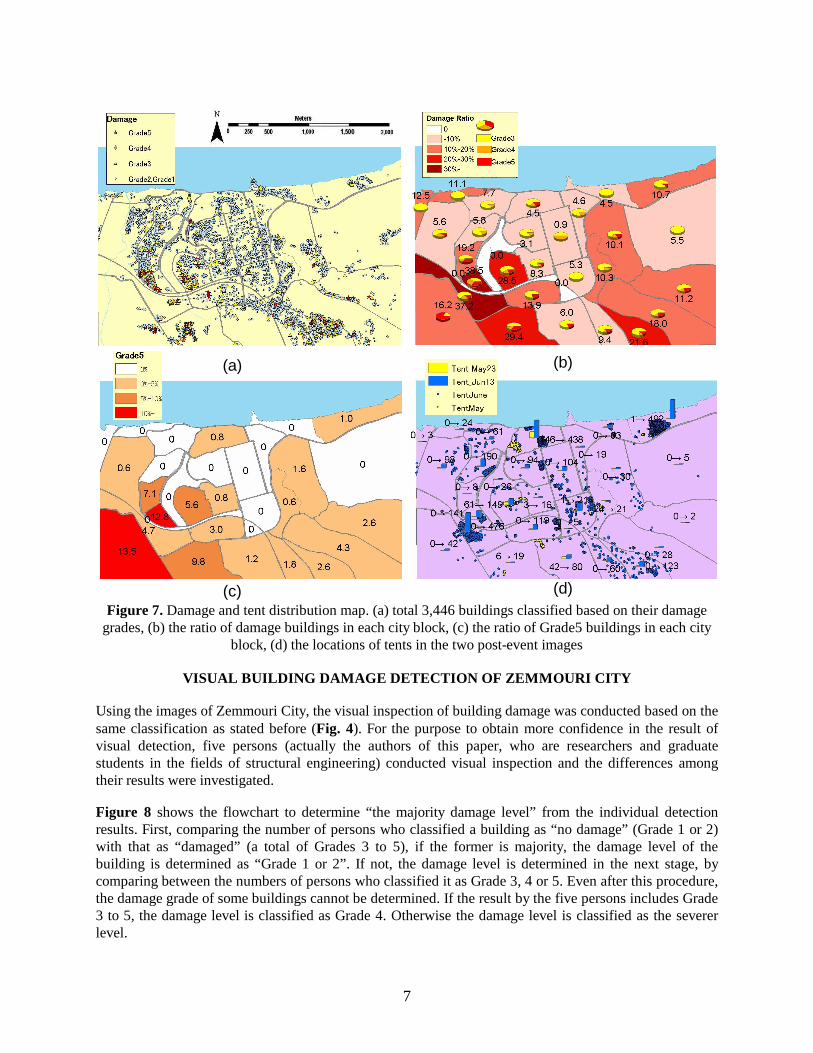
detection would be underestimated compared with those based on the field survey. In order to examine the difference between the damages identified by the visual detection and the actual damages, more detailed ground truth data are required. A total of 3,446 buildings were classified based on their damage grades as shown in Fig. 7(a). The ratio of damaged buildings to the total and that of Grade 5 buildings to the total in each city block (surrounded by major roads, total 31 blocks) were calculated and shown in Fig. 7(b) and 7(c), respectively. The blocks with high damage ratios were located along two rivers. This damage concentration may be explained by soft-soil condition and high site amplification in these areas [9]. Considering the ratios of Grades 3 to 5 in each block, the characteristics of building damage can be grasped in more detail. The locations of refugee tents in the two post-event images were identified as shown in Figure 7(d). A total of 284 tents were observed in the May 23, 2003 image and the number increased to 3,150 in the June 18, 2003 image. Many tents can be seen in the open spaces of residential areas and in athletic fields. Thus it is said to be important to allocate open spaces, e.g. parks, properly in urban planning. These observations on building damage and refugee tents indicate that high-resolution satellite images can provide quite useful information to post-event disaster management.
7029 47
261
54 71
0
100
200
300
Grade3 Grade4 Grade5
Using a post-event image
Using pre-and post-event images
Figure 6. Number of damaged buildings by visual detection of Boumerdes
Table 3. Damage levels of buildings used in the field survey by Algerian engineers
Level Damage-Level Description
1 No Only displacement of furniture and broken glasses
2 Low Cracks in inside infill and in ceilings; damage to water lines; non stuctural and isolated damage.
3 Moderate Important damage to non-structural parts and weak damage to structural parts.
4 High / Important Very important non-structural damage and very extensive structural damage. Cracks in X in shear walls; rupture or hinging of beam-column joints.
5 Very High / Very Important
Condemned or collapsed buildings
Field survey Visual detection
Grade/Level 1or2 1709 (54.9%) 3060 (88.8%)
Grade/Level 3 536 (17.2%) 261 (7.57%)
Grade/Level 4 301 (9.67%) 54 (1.57%)
Grade/Level 5 566 (18.2%) 71 (2.06%)
Total 3112 (100%) 3446 (100%)
Tents 2808 3150*
Table 4. Comparison of damaged building ratios between the field survey and the visual inspection of the satellite images
7
Figure 7. Damage and tent distribution map. (a) total 3,446 buildings classified based on their damage grades, (b) the ratio of damage buildings in each city block, (c) the ratio of Grade5 buildings in each city
block, (d) the locations of tents in the two post-event images
VISUAL BUILDING DAMAGE DETECTION OF ZEMMOURI CITY Using the images of Zemmouri City, the visual inspection of building damage was conducted based on the same classification as stated before (Fig. 4). For the purpose to obtain more confidence in the result of visual detection, five persons (actually the authors of this paper, who are researchers and graduate students in the fields of structural engineering) conducted visual inspection and the differences among their results were investigated.
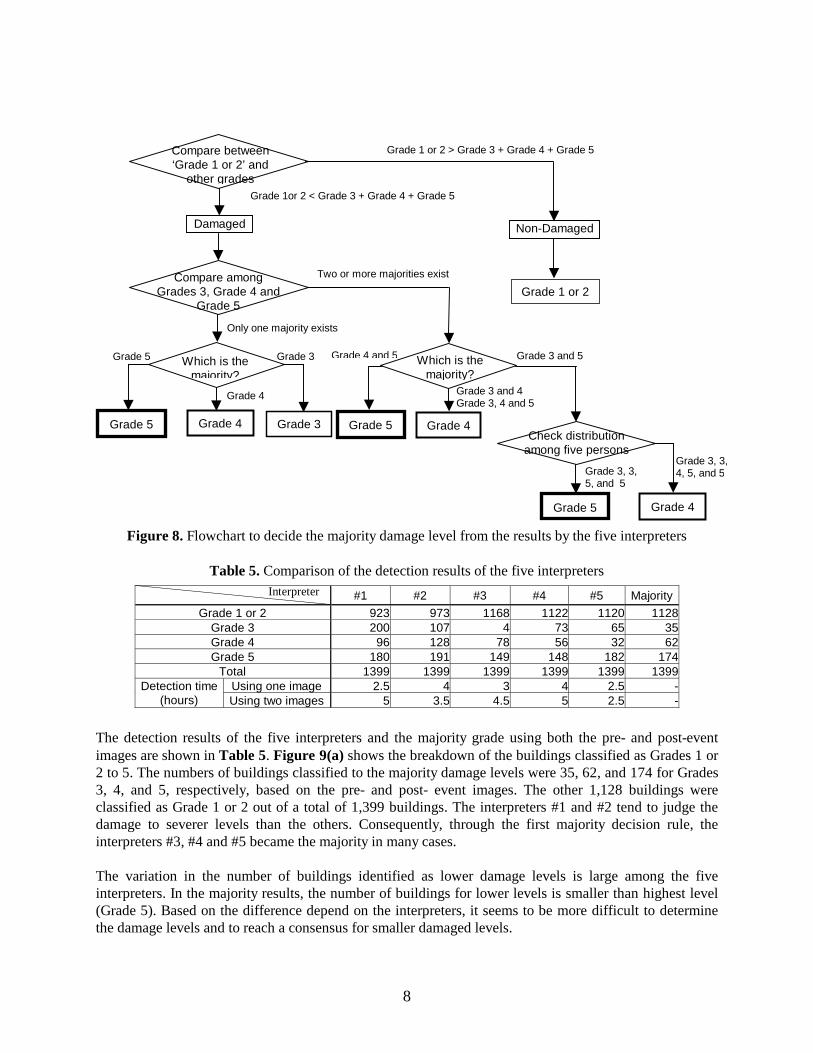
Figure 8 shows the flowchart to determine “the majority damage level” from the individual detection results. First, comparing the number of persons who classified a building as “no damage” (Grade 1 or 2) with that as “damaged” (a total of Grades 3 to 5), if the former is majority, the damage level of the building is determined as “Grade 1 or 2”. If not, the damage level is determined in the next stage, by comparing between the numbers of persons who classified it as Grade 3, 4 or 5. Even after this procedure, the damage grade of some buildings cannot be determined. If the result by the five persons includes Grade 3 to 5, the damage level is classified as Grade 4. Otherwise the damage level is classified as the severer level.
(a) (b)
(c) (d)
8
Figure 8. Flowchart to decide the majority damage level from the results by the five interpreters
Table 5. Comparison of the detection results of the five interpreters
The detection results of the five interpreters and the majority grade using both the pre- and post-event images are shown in Table 5. Figure 9(a) shows the breakdown of the buildings classified as Grades 1 or 2 to 5. The numbers of buildings classified to the majority damage levels were 35, 62, and 174 for Grades 3, 4, and 5, respectively, based on the pre- and post- event images. The other 1,128 buildings were classified as Grade 1 or 2 out of a total of 1,399 buildings. The interpreters #1 and #2 tend to judge the damage to severer levels than the others. Consequently, through the first majority decision rule, the interpreters #3, #4 and #5 became the majority in many cases. The variation in the number of buildings identified as lower damage levels is large among the five interpreters. In the majority results, the number of buildings for lower levels is smaller than highest level (Grade 5). Based on the difference depend on the interpreters, it seems to be more difficult to determine the damage levels and to reach a consensus for smaller damaged levels.
Total 1399 1399 1399 1399 1399 1399 Using one image 2.5 4 3 4 2.5 - Detection time
(hours) Using two images 5 3.5 4.5 5 2.5 -
Grade 3, 3, 4, 5, and 5
Compare between ‘Grade 1 or 2’ and
other grades
Grade 1 or 2
Grade 4
Damaged
Grade 1 or 2 > Grade 3 + Grade 4 + Grade 5
Grade 1or 2 < Grade 3 + Grade 4 + Grade 5
Only one majority exists
Grade 5 Grade 3
Grade 4
Two or more majorities exist Compare among Grades 3, Grade 4 and
Grade 5
Which is the majority?
Grade 4 and 5 Grade 3 and 5
Grade 3 and 4 Grade 3, 4 and 5
Grade 5 Grade 4
Grade 3, 3, 5, and 5
Grade 5 Grade 4
Grade 3 Grade 5
Non-Damaged
Check distribution among five persons
Which is the majority?
Interpreter
9
The differences of the numbers of classified levels between using only the post-event image and using both the pre- and post-event images are shown in Fig. 9(b). In the results for Grades 3, 4 and 5, the difference for lower levels is seen to be larger. Especially the difference of the numbers of Grade 3 buildings is about one hundred for the interpreters #1, #4 and #5. Hence it may be difficult to identify buildings as Grade 3 by using only a post-event image. The average number of interpreters who classify damage level same as the majority level is shown in Fig. 9(c). The numbers of Grade 1 or 2 and 5 are larger than those of Grade 3 and 4. The identifications of “collapse (Grade 5)” of “no or slight damage (Grade 1 or 2)” do not vary much and although it is necessary to evaluate the accuracy of the detection results based on ground truth data. On the other hand it is difficult to reach a consensus for identifications of “moderate damage (Grade 3)” or “partially collapsed (Grade 4)”. The average numbers who reached the same damage grades based on the two images inspection are larger than those based on the one image inspection. Hence the detection results based on the two images can be said more stable than those based on the one image.
112011221168973923
1128
35 4 73 65200 107
62 56 327812896
174 180 191 149 148 182
0%
20%
40%
60%
80%
100%
Majority #1 #2 #3 #4 #5
Grade5
Grade4
Grade3
Grade1 or 2
-300
-200
-100
0
100
200
300
Unclear Grade1,2 Grade3 Grade4 Grade5
#1
#2
#3
#4
#5
4.3
2.5 2.4
4.14.23.8
3.4
2.12.3
4.6
0
1
2
3
4
5
All 1 or 2 3 4 5Grade
Det
erm
inat
ion
Num
ber
Usingoneimage
Usingtwoimages
(a)
(c)
(b)
Figure 9. Comparison of the detection results of the five interpreters. (a) the number of classified levels using the pre- and post-event images, (b) difference of the numbers of classified levels
between using only the post-event image and using the pre- and post-event images, (c) Average number of interpreters who determine damage level same as the majority level (“Determination
10
Figure 10. Comparison between the satellite images and on-site video pictures (the on-site video pictures
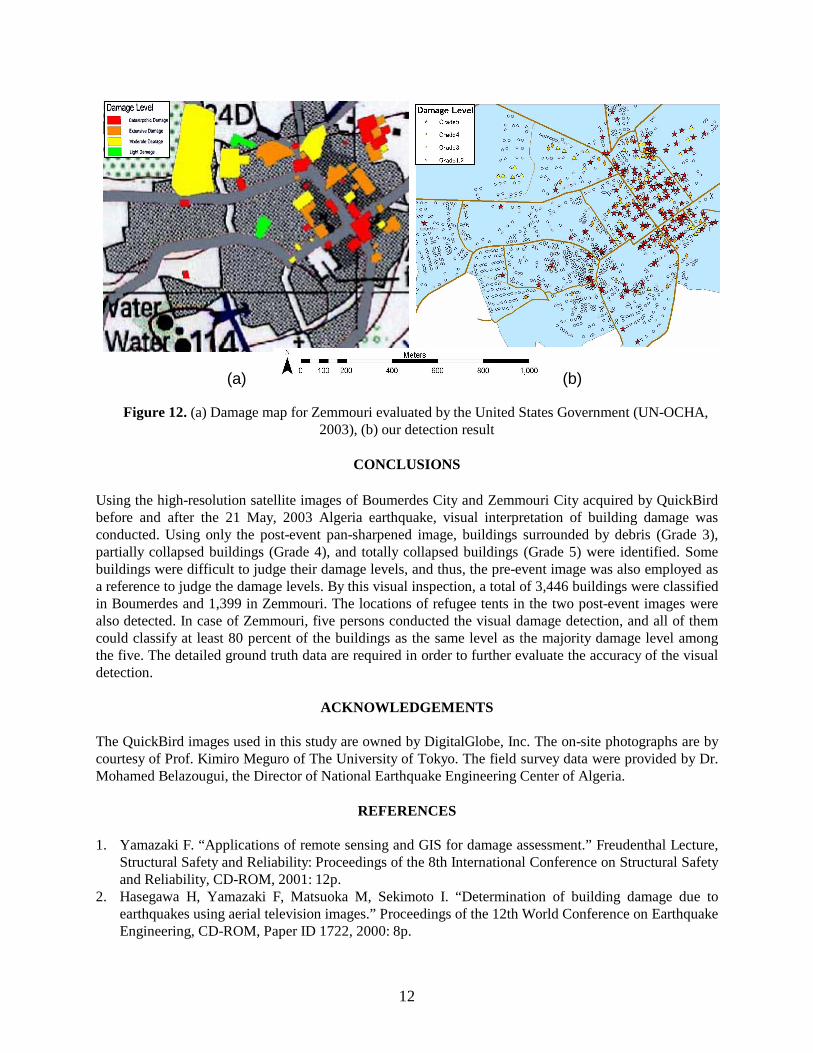
are by courtesy of National Earthquake Engineering Center of Algeria). Figure 10 shows comparison between the satellite image and the on-site video pictures. In the satellite image, a circle symbol means “Grade 1 or 2”, a triangle symbol “Grade 3”, a diamond symbol “Grade 4”, and a star symbol “Grade 5”, respectively. The right-side pictures show a damaged low-rise house (the lower picture) and damaged/collapsed tall buildings (the upper one), which are examples that the detection results using satellite images were verified by ground photographs. A total of 1,399 buildings in Zemmouri were classified based on their damage grades as shown in Figure 11(a). The damage ratios of buildings in each city block (a total 15 blocks) were calculated and shown in Figures 11(b) and 11(c). The locations of tents in the two post-event images were also identified (Figure 11(d)). The distribution of tents as well as damaged buildings can clearly be observed in QuickBird images of Zemmouri also. Figure 12(a) and (b) show the damage map in Zemmouri evaluated by the United States Government, which is available on Internet (UN-OCHA [10]), and the result of this study. We contacted UN-OCHA about the data source, but only reply we received is “It used a variety of classified and unclassified aerial and satellite remote sensing images.” Although these two interpretation results are very close, there is possibility that they also used QuickBird images as a part of data source. Among the five interpreters, the interpreter #1 conducted visual detection for both Boumerdes and Zemmouri images. It should be pointed out that the damage ratio of buildings was different by the one-image and two-image interpretations. For Boumerdes, the difference in the ratios is 17.1% (of which the
11
buildings identified as “Unclear” based on one image was 15.6%) and for Zemmouri 23.2% (of which 17.5% unclear). Hence, it is more difficult to classify damaged buildings in the post-event image of Zemmouri than that of Boumerdes. The satellite images of Zemmouri indicate that there are more low-rise buildings placed close together. This fact may explain the difference of difficulty in image interpretation. A future research is suggested on the relationship between the damage ratio and building type, the accuracy of interpretation, and the application of automated damage detection.
Figure 11. Building damage and tent distribution maps. (a) 1,399 buildings classified based on their
damage grades, (b) the ratio of damaged buildings in each city block, (c) the ratio of Grade5 buildings in each city block, (d) the location of tents in the two post-event images
(a) (b)
Damage Ratio of Grade 3, 4 and 5
Damage Ratio of Grade 5
(c) (d)
12
Figure 12. (a) Damage map for Zemmouri evaluated by the United States Government (UN-OCHA, 2003), (b) our detection result
CONCLUSIONS
Using the high-resolution satellite images of Boumerdes City and Zemmouri City acquired by QuickBird before and after the 21 May, 2003 Algeria earthquake, visual interpretation of building damage was conducted. Using only the post-event pan-sharpened image, buildings surrounded by debris (Grade 3), partially collapsed buildings (Grade 4), and totally collapsed buildings (Grade 5) were identified. Some buildings were difficult to judge their damage levels, and thus, the pre-event image was also employed as a reference to judge the damage levels. By this visual inspection, a total of 3,446 buildings were classified in Boumerdes and 1,399 in Zemmouri. The locations of refugee tents in the two post-event images were also detected. In case of Zemmouri, five persons conducted the visual damage detection, and all of them could classify at least 80 percent of the buildings as the same level as the majority damage level among the five. The detailed ground truth data are required in order to further evaluate the accuracy of the visual detection.
ACKNOWLEDGEMENTS The QuickBird images used in this study are owned by DigitalGlobe, Inc. The on-site photographs are by courtesy of Prof. Kimiro Meguro of The University of Tokyo. The field survey data were provided by Dr. Mohamed Belazougui, the Director of National Earthquake Engineering Center of Algeria.
REFERENCES 1. Yamazaki F. “Applications of remote sensing and GIS for damage assessment.” Freudenthal Lecture,
Structural Safety and Reliability: Proceedings of the 8th International Conference on Structural Safety and Reliability, CD-ROM, 2001: 12p.
2. Hasegawa H, Yamazaki F, Matsuoka M, Sekimoto I. “Determination of building damage due to earthquakes using aerial television images.” Proceedings of the 12th World Conference on Earthquake Engineering, CD-ROM, Paper ID 1722, 2000: 8p.
(a) (b)
13
3. Ogawa N, Yamazaki F. “Photo-Interpretation of building damage due to earthquakes using aerial photographs. Proceedings of the 12th World Conference on Earthquake Engineering, CD-ROM, Paper ID 1906, 2000: 8p.
4. Matsuoka M, Yamazaki F, Midorikawa S. “Characteristics of satellite optical images in areas damaged by the 1995 Hyogo-ken Nanbu Earthquake.” Journal of Structural Mechanics and Earthquake Engineering, No.668/I-54, 2001: 177-185 (in Japanese).
5. Matsuoka M, Yamazaki F. “Characteristics of satellite SAR images in areas damaged by earthquakes.” Proceedings of IEEE 2000 International Geoscience and Remote Sensing Symposium, IEEE, CD-ROM, 2000: 4p.
6. Belazougui M. “A short note on building damage.” CSEM / EMSC Newsletter, October, 2003: 7-8. 7. Mitomi H, Matsuoka M, Yamazaki F. “Application of automated damage detection of buildings due to
earthquakes by panchromatic television Images.” The 7th U.S. National Conference on Earthquake Engineering, Earthquake Engineering Research Institute, CD-ROM, 2002: 10p.
8. European Seismological Commission. “European Seismic Scale 1998.” 1998. 9. Japan Society of Civil Engineering. “The 2003 Boumerdes Earthquake, Algeria – Investigation into
Damage to Civil Engineering Structures.” 2004 (in preparation). 10. The United Nations, Office for the Coordination of Humanitarian Affairs. “Algeria: Damage from