- 603 - Damage Evolution Analysis and Pressure Prediction of Surrounding Rock of a Tunnel Based on Rock Mass Classification Ming-Jie Zhao Professor, Geotechnical section, School of River and Ocean Engineering, Chongqing Jiaotong University, Chongqing 400070,PR China e-mail: [email protected]Xiao Sun PhD student, Geotechnical section, School of River and Ocean Engineering, Chongqing Jiaotong University, Chongqing 400070,PR China e-mail: [email protected]Suo Wang PhD student, Geotechnical section, School of River and Ocean Engineering, Chongqing Jiaotong University, Chongqing 400070,PR China e-mail: [email protected]ABSTRACT Based on the relationship between each classification index for underground chambers and the elastic wave velocity of rock mass, a corresponding relationship between the classification of rocks that surround underground chambers and the initial damage variable is established by using the wave velocity definition of the initial damage variable of rock masses. The relationship between the damage variable and material parameters, such as elastic modulus, Poisson’s ratio, cohesive force, and friction angle, is obtained through an analysis of damage evolution during excavation. The analysis method of damage evolution is further established by considering degradation of surrounding rock parameters. The elastic wave velocity is combined with the empirical formula based on the empirical formula of the rock pressure prediction model. The evolution tendency and rock pressure prediction model of the road tunnel is established. However, the numerical method is combined with the characteristic curve method based on the numerical simulation of progressive failure of the surrounding rock. The prediction results from the two models are compared with the field data, which can verify the reliability of the prediction model for pressure of the surrounding rock. A prediction method for the evolution tendency of rock pressure in a road tunnel is proposed. KEYWORDS: damage evolution, rock mass classification, surrounding rock pressure, elastic wave velocity
Transcript
- 603 -
Damage Evolution Analysis and Pressure Prediction of Surrounding Rock
of a Tunnel Based on Rock Mass Classification
Ming-Jie Zhao Professor, Geotechnical section, School of River and Ocean Engineering,
Chongqing Jiaotong University, Chongqing 400070,PR China
Many domestic and international tunnel engineering cases indicate that the instability of a surrounding rock mass does not appear instantly, but occurs over time. The effects of the progression from deformation to damage of the surrounding rock of a tunnel can be categorized into two: the time effects of gradual release of the surrounding rock stress that is moved forward by the excavation face and the rheological effect of the surrounding rock media (Sun Jun, 1996). Accidents can be caused by two factors: damage to the epigenetic layer of the surrounding rock, which is caused by construction factors, and stress redistribution with variation of the near load on the excavation face after excavation. This redistribution leads to deformation of the surrounding rock, and this deformation increases gradually at some structural faces or weak parts. The discontinuity surface, which includes joints and cracks in the surrounding rock mass, constantly creeps and evolves. Macroscopic fractures and the new linking sliding surface can then induce engineering instability (Liu Yongping, 2005). The damage deformation of the surrounding rock is random, ambiguous, and unpredictable. Therefore, the issue of the stability of surrounding rock under complex working conditions, such as construction of a mountainous highway tunnel under unknown or poor engineering geological conditions, has become increasingly urgent.
The original stress balance in the rock mass is broken by tunnel excavation as the tunnel heading face moves forward. Damage to the surrounding rock gradually appears during tunnel excavation, which leads to stress redistribution of the surrounding rock and strain softening of the rock mass. Presently, theoretical research on surrounding rock lags behind the development of engineering construction. However, addressing the failure mechanism of the surrounding rock, ensuring engineering and excavation safety, and achieving smooth optimal support has received increasing attention in theory and engineering circles. The rock mass contains dimension defects at micro-, meso-, and macroscales under external load. Theoretically, these defects propagate and link, which leads to the instability of the surrounding rock. A suitable approach for stability evaluation and support for the surrounding rock of a tunnel can be developed through research on the mechanism of gradual failure and damage evolution of the surrounding rock from a theoretical point of view (Yi Shunmin and Zhu Zhende, 2005).
At present, research on the mechanism of gradual failure under stress of surrounding rock excavation and the evolution tendency of surrounding rock pressure is imperfect. Thus, current theories cannot fully reflect the degradation process, the evolution tendency of surrounding rock stability, and the change rules of surrounding rock pressure during tunnel excavation. The relationship among each classification of the surrounding rock and the elastic wave velocity of rock mass is then established. A corresponding relationship between the classification of surrounding rock and the initial damage variable is established by using the wave velocity definition of the initial damage variable of rock masses. The relationship between the damage variable and the surrounding rock material parameters is obtained by analyzing the damage evolution of surrounding rock during excavation and that of the surrounding rock of a tunnel under degradation of surrounding rock parameters. Based on the surrounding rock pressure predicted by using an empirical formula with the elastic wave velocity, the evolution tendency and rock pressure prediction model of a road tunnel is established. The numerical method is combined with the characteristic curve method based on a numerical simulation of progressive
failure of the surrounding rock. The predicted results of the two models are compared with the field data; this comparison can verify the reliability of the surrounding rock pressure prediction model. Therefore, a prediction method of the rock pressure evolution tendency on the road tunnel is proposed.
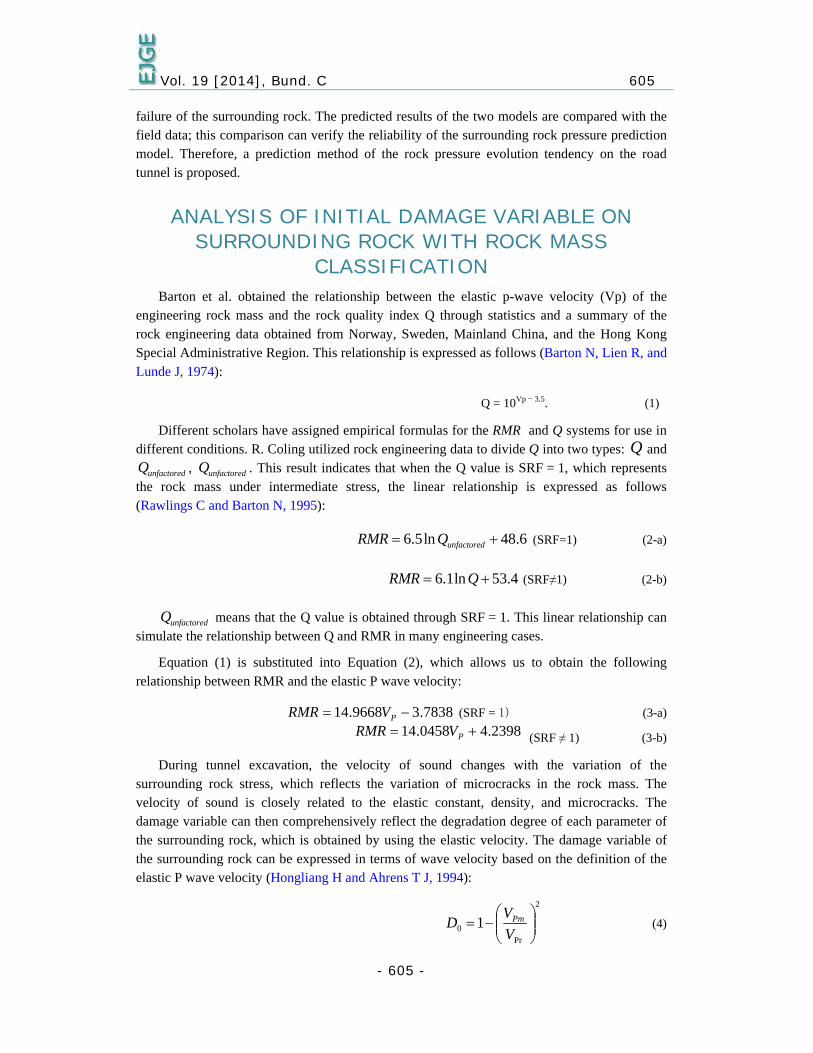
ANALYSIS OF INITIAL DAMAGE VARIABLE ON SURROUNDING ROCK WITH ROCK MASS
CLASSIFICATION Barton et al. obtained the relationship between the elastic p-wave velocity (Vp) of the
engineering rock mass and the rock quality index Q through statistics and a summary of the rock engineering data obtained from Norway, Sweden, Mainland China, and the Hong Kong Special Administrative Region. This relationship is expressed as follows (Barton N, Lien R, and Lunde J, 1974):
Q = 10Vp − 3.5. (1)
Different scholars have assigned empirical formulas for the RMR and Q systems for use in different conditions. R. Coling utilized rock engineering data to divide Q into two types: Q and
unfactoredQ , unfactoredQ . This result indicates that when the Q value is SRF = 1, which represents the rock mass under intermediate stress, the linear relationship is expressed as follows (Rawlings C and Barton N, 1995):
6.5ln 48.6unfactoredRMR Q (SRF=1) (2-a)
6.1ln 53.4RMR Q (SRF≠1) (2-b)
unfactoredQ means that the Q value is obtained through SRF = 1. This linear relationship can simulate the relationship between Q and RMR in many engineering cases.
Equation (1) is substituted into Equation (2), which allows us to obtain the following relationship between RMR and the elastic P wave velocity:
7838.39668.14 PVRMR (SRF = 1) (3-a)
2398.40458.14 PVRMR (SRF ≠ 1) (3-b)
During tunnel excavation, the velocity of sound changes with the variation of the surrounding rock stress, which reflects the variation of microcracks in the rock mass. The velocity of sound is closely related to the elastic constant, density, and microcracks. The damage variable can then comprehensively reflect the degradation degree of each parameter of the surrounding rock, which is obtained by using the elastic velocity. The damage variable of the surrounding rock can be expressed in terms of wave velocity based on the definition of the elastic P wave velocity (Hongliang H and Ahrens T J, 1994):
where Vpm and Vpr are the initial rock damage and the elastic P-wave velocity, respectively.
The relationship between the RMR index and the corresponding initial damage D0(RMR) of each rock mass in the RMR classification based on the initial damage definition and the relationship between RMR and Vp can be derived as follows:
20 1 ARMRD (5)
where 0365.00096.0 RMRA (SRF = 1) and 0435.00103.0 RMRA (SRF ≠ 1).
0366.00097.0 RMRA (SRF = 1)
0437.00103.0 RMRA (SRF ≠ 1)
When RMR is equal to 100, no macrofissures are observed in the rock mass with an elastic P-wave velocity that can be equivalent to that of the intact rock. The data in Table 1 and Definition (4) that concern initial damage show that the range of the initial damage D0(RMR) of each rock mass can be estimated by using the RMR classification.
Table 1: Initial damage range of rock mass with RMR classification (SRF=1)
Surrounding rock classification RMR PV (km/s) )1(0 SRFD )1(0 SRFD
I 81~100 >5.6 <0.34 <0.39
II 61~80 4.3~5.6 0.34~0.61 0.39~0.66
III 41~60 3.0~4.3 0.61~0.82 0.66~0.87
IV 21~40 1.6~3.0 0.82~0.95 0.87~0.98
V <20 <1.6 >0.95 >0.98
In the BQ method, the integrity index of the rock mass is one of the most important indices for evaluating rock quality by testing it with elastic waves. We can define the corresponding initial damage of each rock mass in the BQ system by combining Definition (4), which focuses on the initial damage.
The integrity index is expressed as 2( )rK V VPm PV . The initial damage is expressed as
( ) 10D BQ KV .
Therefore, the range of the corresponding initial damage of each rock mass can be estimated, as shown in Table 2.
Table 2: Initial damage range of rock mass with BQ system method
Surrounding rock classification VK BQD0 I >0.75 <0.25 II 0.55~0.75 0.25~0.45 III 0.35~0.55 0.45~0.65 IV 0.15~0.35 0.65~0.85 V <0.15 >0.85
The expression formula of initial damage 0D with the two common surrounding rock classifications is shown in Table 3, where a square relationship between 0D and RMR, and a linear relationship between 0D and VK is observed. The range of each level of the initial damage, which is estimated by using the ultrasonic classification of rock mass, is shown in Table 4. The initial damage value obtained by using the RMR method for the same amount of
surrounding rock mass is higher than that obtained by using the BQ method. In actual engineering, the different classification methods should use the corresponding initial damage variable.
Table 3: Initial damage of rock mass with two surrounding rock classification
20 1 AD
RMR classification BQ system
value of A SRF=1 0366.00097.0 RMR
VK SRF≠1 0437.00103.0 RMR
The physics-mechanical parameters of each level of the surrounding rock should be obtained through a laboratory test or a field test. These parameters can be chosen by using Table 4 in the absence of test data and initial classification.
Table 4: Physical-mechanical standard values of various surrounding rock
In the above table, the value is not include loss strata, and when we select calculation friction angle, the internal
friction and cohesive are excluded.
DAMAGE EVOLUTION ANALYSIS OF SURROUNDING ROCK DURING TUNNEL EXCAVATION
Damage variable evolution equation
During tunnel excavation, micro variations in microcracks and pore aggregation lead to the gradual material failure. The macroscopic description of the damage evolution of surrounding rock is denoted by damage variable D. If the material strength of the rock mass is consistent with Weibull distribution, the damage variable follows statistical distribution. If two parameters follow Weibull distribution, the equation for macroscopic statistic damage evolution when the deformation modulus of rock mass changes with the strain variation under load bearing is (Xu Weiya and Wei Lide, 2002)
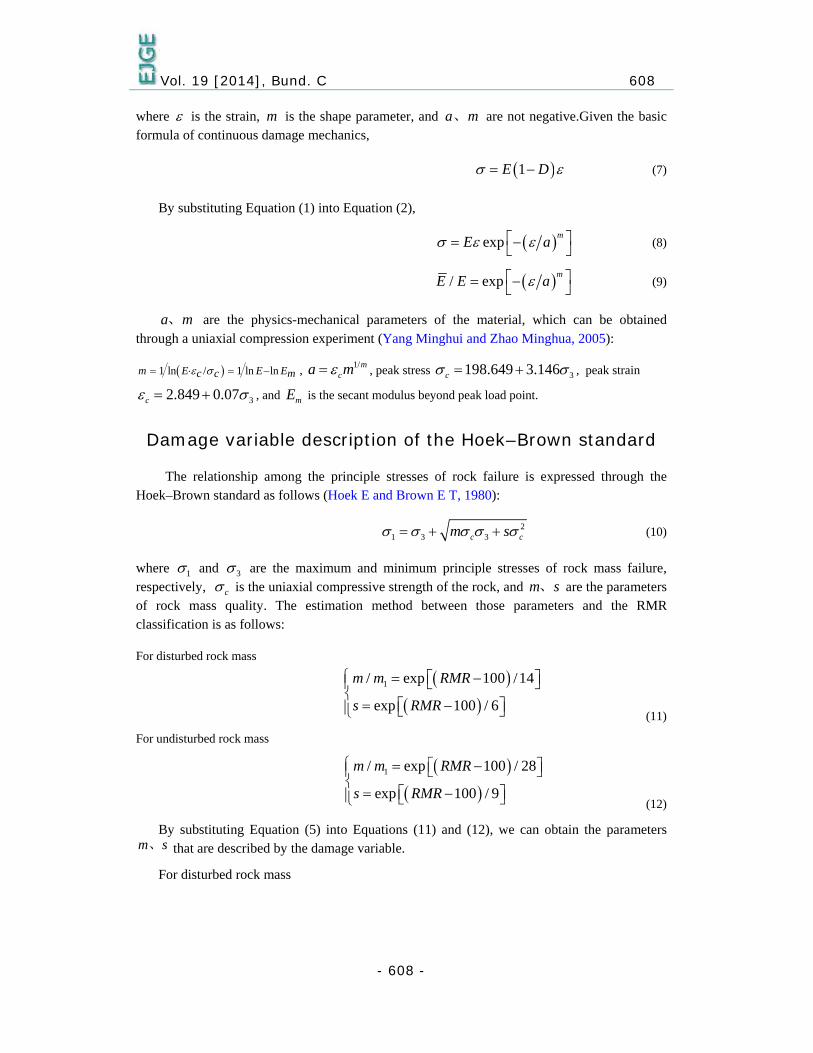
where is the strain, m is the shape parameter, and ma、 are not negative.Given the basic formula of continuous damage mechanics,
1E D (7)
By substituting Equation (1) into Equation (2),
expm
E a (8)
/ expm
E E a (9)
a m、 are the physics-mechanical parameters of the material, which can be obtained through a uniaxial compression experiment (Yang Minghui and Zhao Minghua, 2005):
1 ln / 1 ln lnm E E Ec c m , 1/mca m , peak stress 3198.649 3.146c , peak strain
32.849 0.07c , and mE is the secant modulus beyond peak load point.
Damage variable description of the Hoek–Brown standard
The relationship among the principle stresses of rock failure is expressed through the Hoek–Brown standard as follows (Hoek E and Brown E T, 1980):
21 3 3c cm s (10)
where 1 and 3 are the maximum and minimum principle stresses of rock mass failure, respectively, c is the uniaxial compressive strength of the rock, and m s、 are the parameters of rock mass quality. The estimation method between those parameters and the RMR classification is as follows:
For disturbed rock mass
1/ exp 100 /14
exp 100 / 6
m m RMR
s RMR
(11)
For undisturbed rock mass
1/ exp 100 / 28
exp 100 / 9
m m RMR
s RMR
(12)
By substituting Equation (5) into Equations (11) and (12), we can obtain the parameters sm、 that are described by the damage variable.
For disturbed rock mass
Vol. 19 [2014], Bund. C 609
- 609 -
1/ exp 7.4132 1 7.4131
1exp 17.2974 1 17.2973
m m DSRF
s D
(13a)
1/ exp 6.9570 1 6.8400
1exp 16.2330 1 15.9600
m m DSRF
s D
(13b)
For undisturbed rock mass
1/ exp 3.7066 1 3.7065
1exp 11.5316 1 11.5315
m m DSRF
s D
(14a)
1/ exp 3.4785 1 3.4200
1exp 10.8220 1 10.6400
m m DSRF
s D
(14b)
Estimation of the parameters of surrounding rock mechanics
Bieniawski and Stille conducted an in-depth study of the estimation of deformation modulus. Serafin and Pereira then added new data obtained from engineering practice and established the following new relationship formula:
10
4010RMR
E
GPa (15)
RMR can be expressed based on formula (5) as
103.7843 1 3.7838 1
97.3978 1 4.2398 1
RMR D SRF
RMR D SRF
(16)
By substituting Equation (16) into Equation (15), we can obtain the relationship between the damage and the elastic modulus of the rock mass as follows:
2.5948 1 0.3446
2.4353 1 0.1440
10 1
10 1
Dm
Dm
E SRF
E SRF
(17)
The Poisson’s ratio of surrounding rock can be determined by using the following formula (Guan Baoshu, 2003):
0.42 0.032m pV (18)
Given the definitions of formulas (4) and (5), we can obtain the following formula:
0.42 0.2219 1m ED (19)
Vol. 19 [2014], Bund. C 610
- 610 -
Internal friction angle and cohesive strength can be estimated based on the Mohr–Coulomb strength failure criterion. In the following formula, is the internal friction angle of rock mass, and c is the cohesive strength:
1 3
1 sin 2 cos
1 sin 1 sin
c
(20)
When 304
c , the stress and parameters of the jointed rock mass are estimated by using the Hoek–Brown equation (Hoek E and Brown E T, 1997). The Hoek–Brown standard is then simulated by using formula (20), which follows the rock mass. The linear expression of the Hoek–Brown standard can be obtained through regression analysis as follows:
1 3p bK q (21)
Formulas (20) and (21) are compared as follows:
1 sin
1 sin
2 cos
1 sin
p
b
K
cq
(22)
p bK q、 can be obtained through regression analysis
n
Mq
n
nK
pb
p
31
2
323
3131
(23)
The material parameters, such as cohesion and the internal friction angle, can be obtained by using formulas (22) and (23):
1arcsin
1
1 sin
2cos
p
p
b
K
K
qc
(24)
Degradation estimation of the surrounding rock parameters based on numerical simulation results during excavation The extent of material softening is directly related to the plastic strain variable. Therefore,
we can define a parameter for calculating the plastic strain to counter and simulate gradual failure. In this paper, we can use the relationship between the damage variable and the surrounding rock mechanics parameter to define the dynamic function of the material physical
Vol. 19 [2014], Bund. C 611
- 611 -
parameter from different aspects, such as elastic modulus, Poisson’s ratio, cohesion force, and internal friction angle.
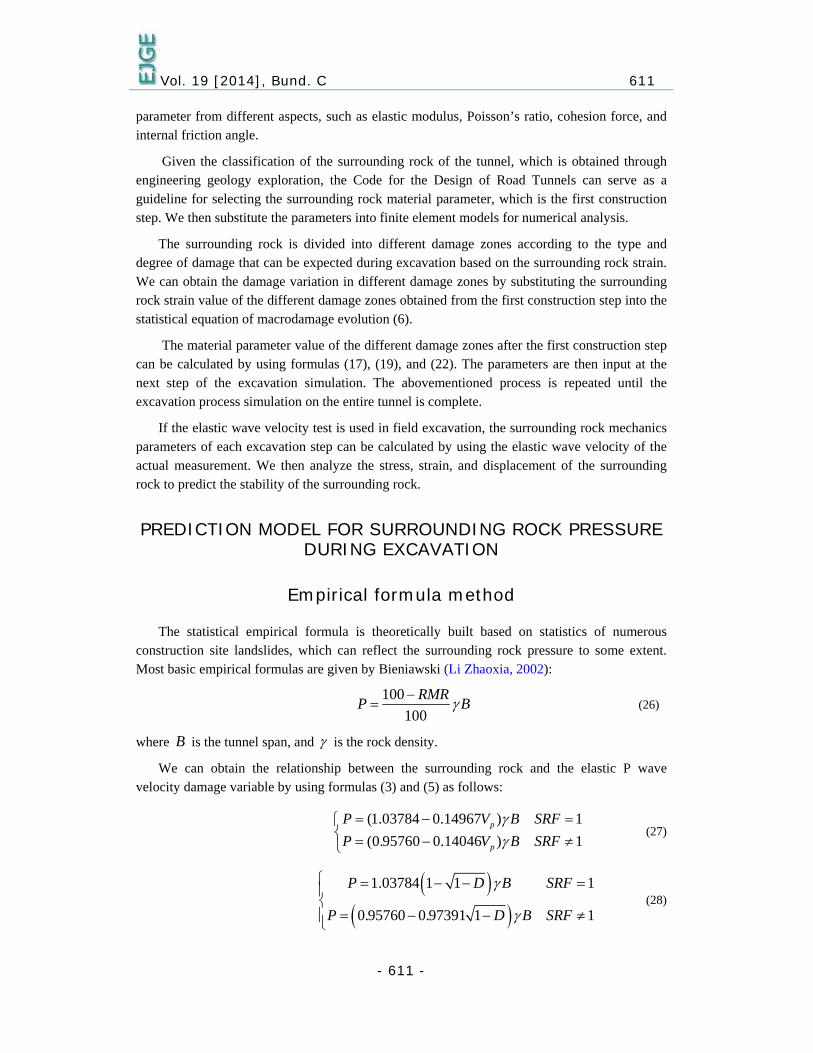
Given the classification of the surrounding rock of the tunnel, which is obtained through engineering geology exploration, the Code for the Design of Road Tunnels can serve as a guideline for selecting the surrounding rock material parameter, which is the first construction step. We then substitute the parameters into finite element models for numerical analysis.
The surrounding rock is divided into different damage zones according to the type and degree of damage that can be expected during excavation based on the surrounding rock strain. We can obtain the damage variation in different damage zones by substituting the surrounding rock strain value of the different damage zones obtained from the first construction step into the statistical equation of macrodamage evolution (6).
The material parameter value of the different damage zones after the first construction step can be calculated by using formulas (17), (19), and (22). The parameters are then input at the next step of the excavation simulation. The abovementioned process is repeated until the excavation process simulation on the entire tunnel is complete.
If the elastic wave velocity test is used in field excavation, the surrounding rock mechanics parameters of each excavation step can be calculated by using the elastic wave velocity of the actual measurement. We then analyze the stress, strain, and displacement of the surrounding rock to predict the stability of the surrounding rock.
PREDICTION MODEL FOR SURROUNDING ROCK PRESSURE DURING EXCAVATION
Empirical formula method
The statistical empirical formula is theoretically built based on statistics of numerous construction site landslides, which can reflect the surrounding rock pressure to some extent. Most basic empirical formulas are given by Bieniawski (Li Zhaoxia, 2002):
100
100
RMRP B (26)
where B is the tunnel span, and is the rock density.
We can obtain the relationship between the surrounding rock and the elastic P wave velocity damage variable by using formulas (3) and (5) as follows:
(1.03784 0.14967 ) 1
(0.95760 0.14046 ) 1p
p
P V B SRF
P V B SRF
(27)
1.03784 1 1 1
0.95760 0.97391 1 1
P D B SRF
P D B SRF
(28)
Vol. 19 [2014], Bund. C 612
- 612 -
Gradation analysis of the damage evolution of surrounding rock
For an axisymmetric problem, the deformation and stress of the surrounding rock in an elastic zone are obtained as follows:
2
000
2000
/
/
0
0
rRpp
rRpp
Re
Rer
(29)
r
R
K
KcKp
Eu
p
ppe200
1
211
(30)
The surrounding rock stress at the elastic–plastic boundary is obtained as follows:
0
0
0
0
2
1/22
R
Rppr
p
KKcp
(31)
where 1 sin 1 sinpK and 0p is the surrounding rock stress of the tunnel.
According to the numerical simulation, the relationship between the mechanic parameter and the plastic strain of the surrounding rock is approximately linear, as shown in Figure 1.
Figure 1 Analysis on the Results of Numerical Simulation
The following moduli are used in all analyses in this paper: the elastic softening modulus
EM , which is the damage value of the unit plastic strain of the elastic modulus; the cohesion softening modulus cM , which is the damage value of the unit plastic strain of the cohesion modulus; and the internal friction angle softening modulus M , which is the damage value of the unit plastic strain of the internal friction angle modulus. The three moduli are relevant to the rock mass itself but do not indicate the external force and excavation size of the tunnel. Therefore, for the particular rock mass, EM , cM , and M are certain. According to the results of the finite element numerical simulation, we can determine the variation tendency of the moduli, as shown in Figure 2, which can also be expressed as follows:
EM D et
ft
c
ccM
* *
E f et t
M
(32)
8
13
18
23
28
33
38
43
48
0 0.002 0.004 0.006 0.008 0.01
εp Ⅲ level surrounding rock
Ⅳ level surrounding rock
linear
linear
0
0.2
0.4
0.6
0.8
1
1.2
0 0.002 0.004 0.006 0.008 0.01εp
c(MPa)
Ⅲ level surrounding rock
Ⅳlevel surrounding rock
linear
linear
Vol. 19 [2014], Bund. C 614
- 614 -
a) internal friction angle softening modulus b) cohesion softening modulus Figure 2: Rock Softening Modulus
Therefore, the equivalent mechanical parameters in the softening zone at any point are as follows:
01 EDE e ; pcMcc 0 ; pM 0 (33)
The Mohr–Coulomb formula in the softening zone becomes
sin1
sin12
sin1
sin1
cr (34)
The surrounding rock stress and deformation of the softening zone are as follows:
pp
K
pipp
pp
p
K
pipp
pr
KcKcr
rKcpK
K
K
Kcr
rKcpK
K
p
p
22211
2211
1
1
0
1
0
(35)
r
R
E
M
r
R
K
KcKp
Eu
p
ppp20
200
2
1
1
211
(36)
R0 is the radius of the plastic softening zone ,
0 01 sin 1 sinp p pK M M ,
0 c pc c M , 1 0E D Ee , 0.042 0.2219 1 De , 21 201
M p K c Kp pK p
Formula 0Rr is substituted into formulas (35) and (36), and formula (31) is considered. We can
then obtain the convergence characteristic curve and the support resistance as follows:
1
1
0
12
10
pK
ipr pK
M
E
rMu
(37)
Vol. 19 [2014], Bund. C 615
- 615 -
1
2
2
1
1
1
0
0
p
p
K
prp
i K
Kc
uE
rM
K
Mp
p
(38)
Formula (38) calculates the surrounding pressure and considers the damage variation during the
excavation and the elastic modulus, Poisson’s ratio, cohesion force, and internal friction angle of the
surrounding rock.
ANALYSIS OF ENGINEERING EXAMPLE
The tunnel lies to the east of Bicheng and from east to west and across the middle of Jiyun Mountain. The selected tunnel is located in Kejialaya Ridge because the corridor of the beginning of the line is very narrow and the beginning of the line is near the tunnel entrance; these factors influence the entrance location. The tunnel entrance is small because of the restriction of the road line. The spacing between the right and left holes then expands gradually, changes, then transitions to the separated tunnel, and then reduces again towards the exit. Both ends of the tunnel are used as the cutting face. The pile number of the right hole ranges from YK0 + 715 to YK3 + 705 and is 2,990 m long. The pile number of the left hole ranges from ZK0 + 715 to ZK3 + 702 and is 2,987 m long. The tunnel has poor geological conditions. The surrounding rock mainly consists of levels III, IV, and V. The tunnel, which has a maximum depth of 313.146 m, is designed for a speed of 60 km/h, and the tunnel construction clearance is 10.25 m × 5.0 m. The arch radius is 5.40 m, the curved wall radius is 8.9 m, and the clearance area is 62.23 m2.
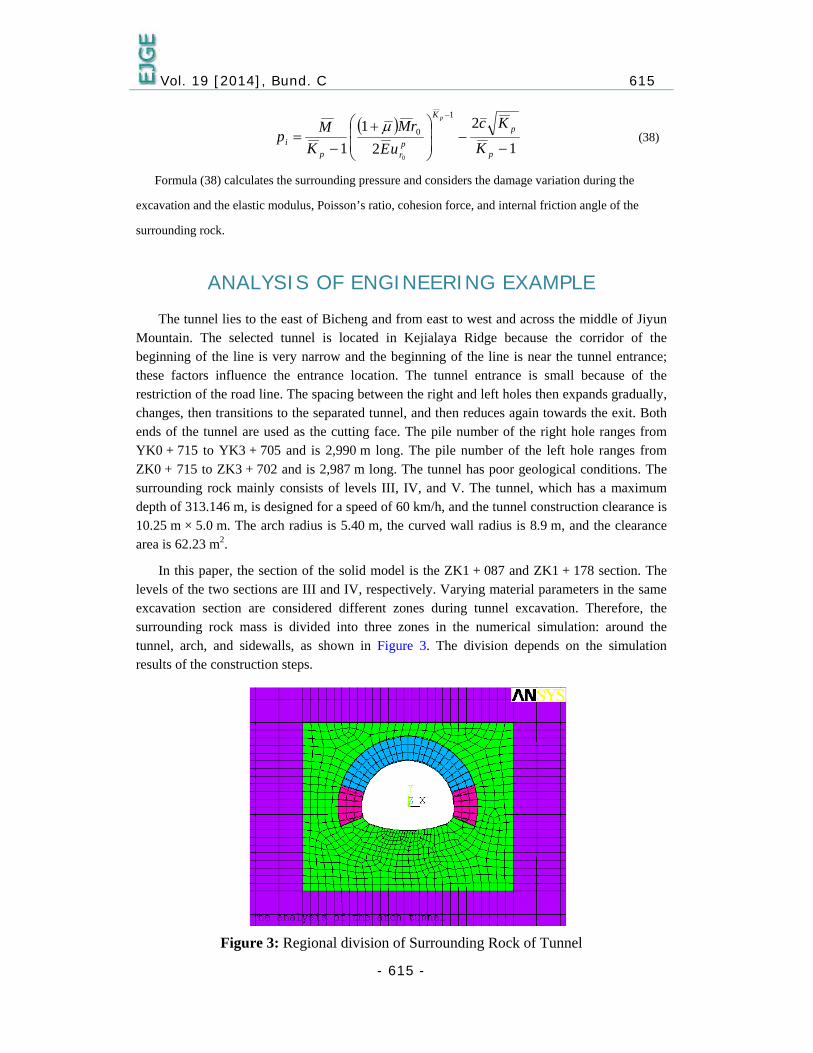
In this paper, the section of the solid model is the ZK1 + 087 and ZK1 + 178 section. The levels of the two sections are III and IV, respectively. Varying material parameters in the same excavation section are considered different zones during tunnel excavation. Therefore, the surrounding rock mass is divided into three zones in the numerical simulation: around the tunnel, arch, and sidewalls, as shown in Figure 3. The division depends on the simulation results of the construction steps.
Figure 3: Regional division of Surrounding Rock of Tunnel
Vol. 19 [2014], Bund. C 616
- 616 -
In accordance with the Code for the Design of Road Tunnels, the ZK1 + 087 section is excavated by using the benching tunneling method, and the ZK1+178 section is excavated by using the benching and middling tunneling method. The excavation step of the construction is shown in Figure 4. The characteristic of the finite element numerical calculation, which simplifies the construction step, shows that the different surrounding rock levels are excavated through different means. The specific simulation construction step is shown in Table 5.
a) section of ZK1+087 b) section of ZK1+178
Figure 4: Schematic Diagram of Tunnel Excavation
Table 5: Numerical simulation construction steps of each level Surrounding Rock
Typical section
Construction step ZK1+087 ZK1+178
step1 Calculation of initial stress field Calculation of initial stress field
step2 Excavation of upper step Excavation of upper step
Step3 Initial support of arch Initial support of arch
Step4 Excavation of down step Excavation of middle step
Step5 Initial support of side walls Initial support of side walls
Step6 Excavation of down step
Figures 5 and 6 show the comparative analysis graph of the ZK1 + 087 and the ZK1 + 178 sections, respectively, on the relationship between the settlements of the vault, the peripheral convergence displacement, and the results of the numerical simulation. The arch settlement of the rockier surrounding rock is smaller than that of the less rocky surrounding rock from level IV, and the tending towards stability of the surrounding rock from level III also requires a short time. The surrounding rock of the tunnel with a lower elastic modulus has a large displacement and slow convergence. If the surrounding rock has high elastic modulus, it has a small displacement and fast convergence.
Vol. 19 [2014], Bund. C 617
- 617 -
a) settlement of vault on section ZK1+087
b) displacement of peripheral convergence on section ZK1+087
Figure 5 Curves comparison between monitor data and predict data of section ZK1+087
-2
3
8
13
18
23
1 2 3 4 5Construction step
In-situ monitoring data
Result of numerical simulation
Settlement of vault(mm)
-1
1
3
5
7
9
11
1 2 3 4 5
Construction step
In-situ monitoring data
Result of numerical simulation
Displacement of peripheral
conver
gence(mm)
Vol. 19 [2014], Bund. C 618
- 618 -
a) settlement of vault on section ZK1+178
b) displacement of peripheral convergence on section ZK1+178
Figure 6: Curves comparison between monitors data and predict data of section ZK1+178
Figure 7 shows the damage evolution mechanism during tunnel excavation. The damage of each zone gradually increases to a certain value. Under the same conditions as the surrounding rock, damage to the surrounding rock damage of the sidewall zone with the upper levels is greater than that of the arch zone. However, damage to the surrounding rock damage of the arch zone is greater than that of the sidewall zone after tunnel excavation. The phenomenon is caused by stress concentration during excavation of the upper levels. The damage around the surrounding rock is caused by stress release during excavation. The movements are also relatively small. At higher levels of the surrounding rock, the damage of the surrounding rock has less influence.
1
6
11
16
21
26
31
36
41
1 2 3 4 5 6 7Construction step
In-situ monitoring data
Result of numerical simulation
Settlement of vault(mm)
-1
1
3
5
7
9
11
13
1 2 3 4 5 6 7
Construction step
In-situ monitoring data Result of numerical simulation
Figure 7: Damage Evolutionary Process in Tunnel Excavation
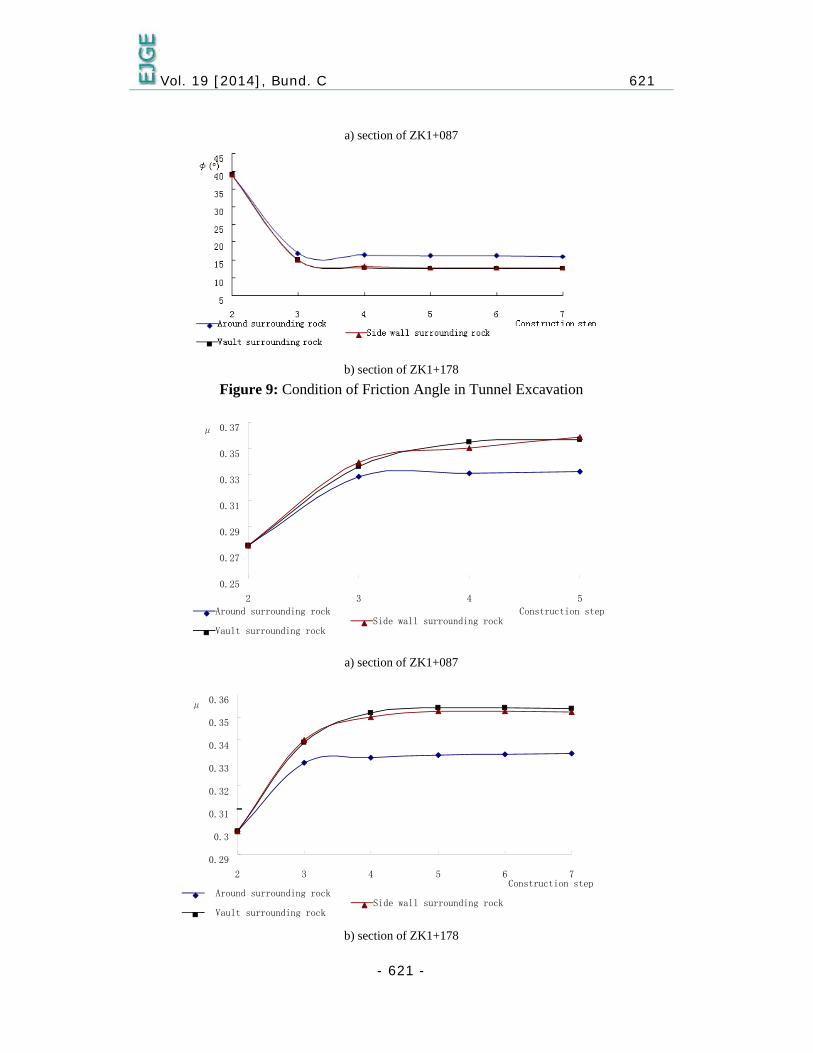
Figures 8, 9, 10, and 11 show the variation of the deformation modulus, the internal friction angle, the Poisson’s ratio, and the cohesive force during excavation, respectively. The numerical simulation results show that the cohesive force is obviously lower when the strength of each zone worsens, whereas the internal friction angle slightly decreases. The stress and deformation shape of each point differ along the depth of plastic zone. The values of the cohesive force and the internal friction angle are also different. Near the interface of the elastic and plastic zone, their values are higher, whereas their values are much lower near the sides of the cave. Increasing plastic deformation leads to the gradual decrease of the deformation modulus and the gradual increase of the transverse deformation coefficient. Therefore, the deformation modulus and the Poisson’s ratio in the plastic zone also change with the plastic zone depth.
0.5 0.55 0.6 0.65 0.7 0.75 0.8 0.85 0.9 0.95
2 3 4 5
De
Around surrounding rock
Vault surrounding rock Side wall surrounding rock
Construction step
0.8
0.82
0.84
0.86
0.88
0.9
0.92
2 3 4 5 6 7 Construction step
De
Around surrounding rock
Vault surrounding rock Side wall surrounding rock
Vol. 19 [2014], Bund. C 620
- 620 -
a) section of ZK1+087
b) section of ZK1+087
Figure 8: Condition of Elastic Modulus in Tunnel Excavation
0
2
4
6
8
10
12
14
2 3 4 5
Construction step
E(GPa)
Around surrounding rock
Vault surrounding rockSide wall surrounding rock
1
2
3
4
5
6
7
2 3 4 5 6 7 Construction step
E(GPa)
Around surrounding rock
Vault surrounding rockSide wall surrounding rock
5 10 15 20 25 30 35 40 45
50
2 3 4 5
φ(°)
Around surrounding rock
Vault surrounding rock Side wall surrounding rock Construction stp
Vol. 19 [2014], Bund. C 621
- 621 -
a) section of ZK1+087
b) section of ZK1+178
Figure 9: Condition of Friction Angle in Tunnel Excavation
a) section of ZK1+087
b) section of ZK1+178
0.25
0.27
0.29
0.31
0.33
0.35
0.37
2 3 4 5 Construction step
μ
Around surrounding rock
Vault surrounding rock Side wall surrounding rock
0.29
0.3
0.31
0.32
0.33
0.34
0.35
0.36
2 3 4 5 6 7 Construction step
μ
Around surrounding rockSide wall surrounding rock
Vault surrounding rock
Vol. 19 [2014], Bund. C 622
- 622 -
Figure 10: Condition of Poisson Ratio in Tunnel Excavation
a) section of ZK1+087
b) section of ZK1+178
Figure 11: Condition of Cohesion in Tunnel Excavation
Figure 12 shows the comparative analysis graph of the ZK1 + 178 section, which analyzes the
relationship between the surrounding rock pressure value of each point on the vault, haunch, and foot.
The value of the theoretical model is greater than that of the empirical model, but the value of the
theoretical model agrees well with the field test value at the vault area.
0
0.2
0.4
0.6
0.8
1
1.2
2 3 4 5
Construction step
c(MPa)
Around surrounding rock
Vault surrounding rock Side wall surrounding rock
0
0.1
0.2
0.3
0.4
0.5
0.6
0.7
0.8
2 3 4 5 6 7 Construction step
c(MPa)
Around surrounding rock
Vault surrounding rock Side wall surrounding rock
Vol. 19 [2014], Bund. C 623
- 623 -
a) Part of vault
b) Part of left arch haunch
0.000
0.050
0.100
0.150
0.200
0.250
0.300
0.350
0.400
1 2 3 4 5 6 7
Construction step
Measured value
Empirical model prediction value Theoretical model prediction value
surrounding rock pressure P(MPa)
0.000 0.050 0.100 0.150 0.200 0.250
0.300 0.350 0.400 0.450 0.500
1 3 5 7
Construction step
Measured value
Empirical model prediction value Theoretical model prediction value
Surrounding rock pressure P(MPa)
Surrounding rock pressure P(MPa)
Vol. 19 [2014], Bund. C 624
- 624 -
c)
Part of right arch haunch
d) Part of left arch foot
0.000
0.050
0.100
0.150
0.200
0.250
0.300
0.350
0.400
0.450
0.500
1 3 5 7Construction step
Measured value
Empirical model prediction value Theoretical model value
Surrounding rock pressure P(MPa)
0.000
0.050
0.100
0.150
0.200
0.250
0.300
0.350
0.400
0.450
1 3 5 7
Construction step
Measured value
Empirical model prediction value
Theoretical model value
-0.050 0.000 0.050 0.100 0.150 0.200
0.250 0.300 0.350 0.400 0.450
1 3 5 7
Construction step
Measured value
Empirical model prediction value Theoretical model prediction value
Surrounding rock pressure P(MPa)
Surrounding rock pressure P(MPa)
Vol. 19 [2014], Bund. C 625
- 625 -
e) Part of right arch foot
Figure 12: Curves comparison between monitors data and predict data of section ZK1+178
CONCLUSIONS
We analyze the evolution process of dynamic damage of the surrounding rock of a tunnel during excavation. The relationship between the damage variable and the surrounding rock classification is established. We then obtain the relationship between the damage variable and material parameters such as elastic modulus, Poisson’s ratio, cohesive force, and friction angle. The variations of the mechanical parameters of each level of the surrounding rock during excavation are analyzed. The damage evolution mechanism of the surrounding rock during excavation is also studied based on the gradual degradation of the surrounding rock. The surrounding rock pressure prediction model is developed. This model provides a basis for the support design of tunnels during excavation. The following conclusions were made:
(1) The damage evolution trend of levels III and IV of surrounding rock during excavation shows that the maximum damage zone is initially located on the arch shoulder of the tunnel and then moves to the tunnel vault. The maximum range of the damage zone for level IV of the surrounding rock is about two times the diameter of the hole. The damage zone of level III of the surrounding rock does not greatly affect that of level IV and is about half the diameter of the hole. The instability and failure of the surrounding rock of the tunnel are caused by the accumulated damage and gradual development of cracks. Given the initial damage and because of the unloading effect, the stress field is constantly adjusted. The surrounding rock damage also gradually accumulates and produces cracks, which leads to the instability of the surrounding rock.
(2) The plastic zone of the surrounding rock during excavation of levels III and IV is influenced by numerous factors such as rocky conditions, excavation method, support time, and excavation size. The range of each plastic zone during construction is between 1 and 1.5 times the diameter, especially when the excavation contour of tunnel is angular. The plastic zone that appears at the stress concentration point or area is obvious. The increase of the plastic strain value is influenced by continued excavation. The plastic zone also widens, which is consistent with practical engineering.
(3) When the surrounding rock is merely a plastic zone, the physical property parameters of the surrounding rock, such as elastic modulus, cohesion force, and friction angle, decrease sharply, whereas the Poisson’s ratio increases sharply. When the surrounding rock is fully plastic, the physical property parameters exhibit little variation. The value also stabilizes gradually. An analysis of the surrounding rock strain evolution indicates that the strain of the surrounding rock softens under excavation stress, which is divided into two areas. The accelerating creep of the surrounding rock is restrained because of timely support.
(4) The surrounding rock pressure prediction model has the advantage of simple calculations and objective parameters that combine the elastic wave velocity with the empirical formula. Therefore, the model can be used conveniently by engineering staff. Based on the numerical simulation of progressive failure of the surrounding rock, the numerical method is
Vol. 19 [2014], Bund. C 626
- 626 -
combined with the characteristic curve method. The dynamic construction model is developed by using the numerical method. The mechanical material parameters and the relationship between each surrounding rock parameter and plastic strain are continuously adjusted based on damage variation during construction. The radial displacement is analyzed, and the convergence characteristic curve is established. The combination of the two methods cancels out the disadvantages of the other and can objectively reflect the variation of the parameters of the surrounding rock material during tunnel excavation. The comparison and analysis of the practical monitor data indicate that the progressive surrounding rock pressure model can be adapted by the empirical formula model. Both models supplement each other and can serve as a guide for tunnel construction.
ACKNOWLEDGMENTS
The authors gratefully acknowledge the supports from the key project of Ministry in PR China under
Grant No. 200631874024.
REFERENCES 1. Sun Jun(1996)”The Design Theory and Practice of Underground Engineering,”Shanghai
Science and Technology Press,Shang Hai
2. Liu Yongping(2005)”Study on continuum damage of the tunnel brittle-quasibrittle
surrounding rocks,”Jilin University
3. Yi Shunmin, Zhu Zhende(2005)”Introduction of Fractured Rock Mass Damage
Mechanics,Science Press,Bei Jing
4. Barton N, Lien R, Lunde J.,1974.Engineering classificaiton of rock masses for the design
of tunnel support.J. Rock Mechanics, 6(4),189-236
5. Rawlings C, Barton N. ,1995.The relationship between Q and RMR classification in rock
engineering.In:Tashio Fujill ed. Proc. 8th int. Congre. Rock Mech. Akasaka: Minato-
KuTokyo, Press, 5,29-31
6. Hongliang H,Ahrens T J.,1994.Mechanical properties of shock-damaged rocks. Int J
Rock Mech Min Sci, 31(5),525-533
7. Xu Weiya, Wei Lide,2002.Study on staistical damage constitutive model of
rock.J.Chinese Journal of Geotechnical Engineering, 21(6), 787- 791
8. Yang Minghui, Zhao Minghua, Cao Wengui, 2005.Rock damage softening statistical
constitutive model parameter determination.J. Water Resources Journal,,36 (3),345 -
349
9. Hoek E, Brown E T.,1980.Underground Excavations in Rock. Hortford.Stephen Austrain
and Sons, New York
Vol. 19 [2014], Bund. C 627
- 627 -
10. Guan Baoshu,2003.Collections of Designing Points on Tunnel Engineering, China
Communications Press, Bei Jing
11. Hoek E,Brown ET.,1997.Practical estimates of rock mass strength.J.Int.J.Sci.Rock
Mech.and Min.34(8),1165-1 187
12. Li Zhaoxia,2002.Damage mechanics and its application,Science Press, Bei Jing