24
Data sheets

MTN Group Limited Interim financial results for the six months ended 30 June 2019 121Data sheets
Data sheets

MTN Group Limited Interim financial results for the six months ended 30 June 2019122
ARPU(US dollar)
Country 1Q19 2Q19 1Q18 2Q18 3Q18 4Q18
South Africa* 6,72 6,69 8,11 7,50 7,10 7,12
Nigeria 4,17 4,08 4,14 4,13 4,12 4,22
SEAGHAGhana 4,05 4,03 4,50 4,60 4,02 4,70
Uganda 2,33 2,22 2,17 2,12 2,25 2,36
Rwanda 2,15 2,24 2,32 2,13 2,35 2,54
Zambia 2,25 2,18 2,82 2,87 2,90 2,63
South Sudan 5,19 6,45 3,60 4,93 4,67 4,70
Botswana (joint venture) 6,20 6,60 7,60 7,60 7,24 7,10
eSwatini (joint venture) 7,19 7,17 7,78 7,12 7,17 8,02
WECACameroon 3,53 3,19 4,66 4,60 4,28 3,79
Ivory Coast 3,45 3,34 4,19 4,10 3,65 4,01
Benin 4,95 4,93 5,45 4,88 4,88 4,88
Guinea-Conakry 2,01 2,11 2,05 1,93 1,89 1,93
Congo-Brazzaville 6,04 6,54 5,94 5,99 6,69 6,38
Liberia 2,72 2,84 3,47 3,14 2,67 3,17
Guinea-Bissau 2,96 3,14 3,99 4,21 3,52 2,59
MENAIran (joint venture) 2,14 2,01 4,32 4,05 2,52 1,98
Syria 2,71 2,90 2,37 2,58 2,84 2,54
Sudan 1,08 1,15 1,45 1,37 1,45 1,12
Yemen 2,81 3,04 2,38 2,58 2,68 2,72
Afghanistan 1,60 1,61 1,69 1,90 1,90 1,70 * Subscribers base reallocation from core to telemetry resulting in a restatement of Q1 2018 to Q1 2019.
MTN Group Limited continued
Results for the six months ended 30 June 2019
MTN Group Limited Interim financial results for the six months ended 30 June 2019 123Data sheets
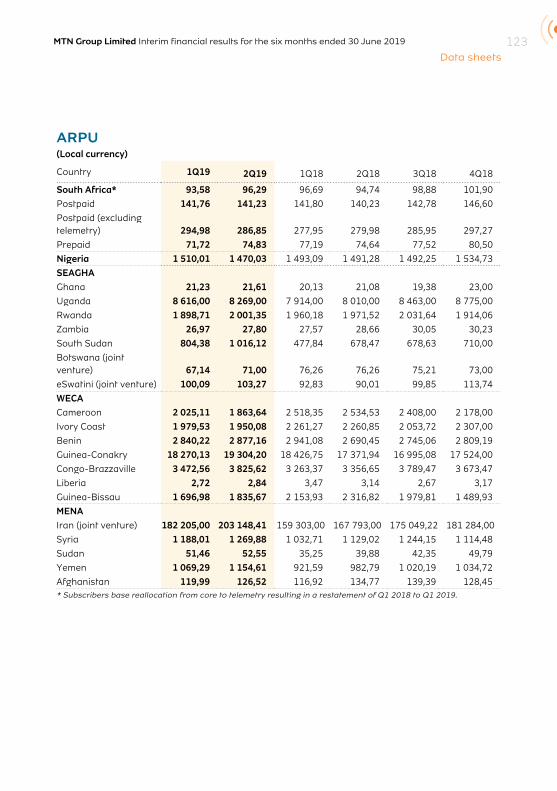
ARPU(Local currency)
Country 1Q19 2Q19 1Q18 2Q18 3Q18 4Q18
South Africa* 93,58 96,29 96,69 94,74 98,88 101,90
Postpaid 141,76 141,23 141,80 140,23 142,78 146,60
Postpaid (excluding telemetry) 294,98 286,85 277,95 279,98 285,95 297,27
Prepaid 71,72 74,83 77,19 74,64 77,52 80,50
Nigeria 1 510,01 1 470,03 1 493,09 1 491,28 1 492,25 1 534,73
SEAGHAGhana 21,23 21,61 20,13 21,08 19,38 23,00
Uganda 8 616,00 8 269,00 7 914,00 8 010,00 8 463,00 8 775,00
Rwanda 1 898,71 2 001,35 1 960,18 1 971,52 2 031,64 1 914,06
Zambia 26,97 27,80 27,57 28,66 30,05 30,23
South Sudan 804,38 1 016,12 477,84 678,47 678,63 710,00
Botswana (joint venture) 67,14 71,00 76,26 76,26 75,21 73,00
eSwatini (joint venture) 100,09 103,27 92,83 90,01 99,85 113,74
WECACameroon 2 025,11 1 863,64 2 518,35 2 534,53 2 408,00 2 178,00
Ivory Coast 1 979,53 1 950,08 2 261,27 2 260,85 2 053,72 2 307,00
Benin 2 840,22 2 877,16 2 941,08 2 690,45 2 745,06 2 809,19
Guinea-Conakry 18 270,13 19 304,20 18 426,75 17 371,94 16 995,08 17 524,00
Congo-Brazzaville 3 472,56 3 825,62 3 263,37 3 356,65 3 789,47 3 673,47
Liberia 2,72 2,84 3,47 3,14 2,67 3,17
Guinea-Bissau 1 696,98 1 835,67 2 153,93 2 316,82 1 979,81 1 489,93
MENAIran (joint venture) 182 205,00 203 148,41 159 303,00 167 793,00 175 049,22 181 284,00
Syria 1 188,01 1 269,88 1 032,71 1 129,02 1 244,15 1 114,48
Sudan 51,46 52,55 35,25 39,88 42,35 49,79
Yemen 1 069,29 1 154,61 921,59 982,79 1 020,19 1 034,72
Afghanistan 119,99 126,52 116,92 134,77 139,39 128,45 * Subscribers base reallocation from core to telemetry resulting in a restatement of Q1 2018 to Q1 2019.
MTN Group Limited Interim financial results for the six months ended 30 June 2019124
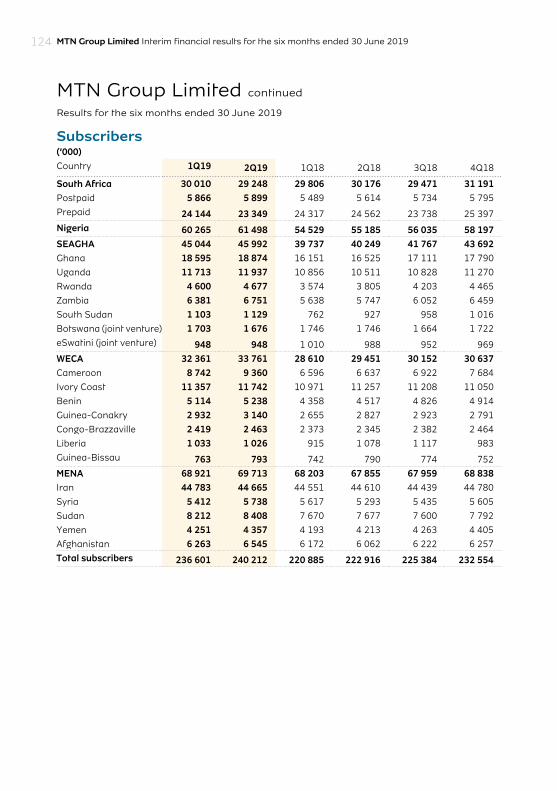
Subscribers(’000)Country 1Q19 2Q19 1Q18 2Q18 3Q18 4Q18
South Africa 30 010 29 248 29 806 30 176 29 471 31 191 Postpaid 5 866 5 899 5 489 5 614 5 734 5 795
Prepaid 24 144 23 349 24 317 24 562 23 738 25 397
Nigeria 60 265 61 498 54 529 55 185 56 035 58 197 SEAGHA 45 044 45 992 39 737 40 249 41 767 43 692 Ghana 18 595 18 874 16 151 16 525 17 111 17 790
Uganda 11 713 11 937 10 856 10 511 10 828 11 270
Rwanda 4 600 4 677 3 574 3 805 4 203 4 465
Zambia 6 381 6 751 5 638 5 747 6 052 6 459
South Sudan 1 103 1 129 762 927 958 1 016
Botswana (joint venture) 1 703 1 676 1 746 1 746 1 664 1 722
eSwatini (joint venture) 948 948 1 010 988 952 969
WECA 32 361 33 761 28 610 29 451 30 152 30 637 Cameroon 8 742 9 360 6 596 6 637 6 922 7 684
Ivory Coast 11 357 11 742 10 971 11 257 11 208 11 050
Benin 5 114 5 238 4 358 4 517 4 826 4 914
Guinea-Conakry 2 932 3 140 2 655 2 827 2 923 2 791
Congo-Brazzaville 2 419 2 463 2 373 2 345 2 382 2 464
Liberia 1 033 1 026 915 1 078 1 117 983
Guinea-Bissau 763 793 742 790 774 752
MENA 68 921 69 713 68 203 67 855 67 959 68 838 Iran 44 783 44 665 44 551 44 610 44 439 44 780
Syria 5 412 5 738 5 617 5 293 5 435 5 605
Sudan 8 212 8 408 7 670 7 677 7 600 7 792
Yemen 4 251 4 357 4 193 4 213 4 263 4 405
Afghanistan 6 263 6 545 6 172 6 062 6 222 6 257
Total subscribers 236 601 240 212 220 885 222 916 225 384 232 554
MTN Group Limited continued
Results for the six months ended 30 June 2019

MTN Group Limited Interim financial results for the six months ended 30 June 2019 125Data sheets
Active data subscribers(’000)Country 1Q19 2Q19 1Q18 2Q18 3Q18 4Q18
South Africa 12 783 12 428 12 152 12 164 12 954 13 571
Nigeria 20 364 20 731 14 841 14 923 17 171 18 672
SEAGHA 12 709 13 570 9 462 11 353 10 744 12 151
Ghana 6 746 7 401 5 150 6 894 5 770 6 435
Uganda 2 405 2 496 1 661 1 793 1 987 2 236
Rwanda 995 1 077 583 630 726 947
Zambia 1 961 2 031 1 425 1 515 1 703 1 856
South Sudan 185 150 259 149 161 175
Botswana (joint venture) – – – – – –
eSwatini (joint venture) 417 415 384 372 397 502
WECA 9 248 9 536 6 992 7 309 8 157 8 870
Cameroon 2 694 2 801 1 860 2 107 2 279 2 553
Ivory Coast 3 367 3 421 2 745 2 793 3 134 3 294
Benin 1 619 1 551 1 060 1 136 1 379 1 587
Guinea-Conakry 604 717 469 484 499 503
Congo-Brazzaville 539 601 451 443 504 546
Liberia 231 241 189 195 192 208
Guinea-Bissau 194 204 218 151 170 179
MENA 26 209 25 999 22 967 24 698 24 645 25 485
Iran 20 445 20 772 18 186 19 258 19 428 19 889
Syria 1 636 1 806 1 242 1 749 1 474 1 664
Sudan 2 276 1 403 2 194 2 211 2 219 2 259
Yemen 771 889 627 687 651 682
Afghanistan 1 080 1 129 718 793 873 991
Total subscribers 81 313 82 264 66 145 70 448 73 671 78 749

MTN Group Limited continued
Results for the six months ended 30 June 2019
MTN Group Limited Interim financial results for the six months ended 30 June 2019126
Mobile Money subscribers(’000)Country 1Q19 2Q19 1Q18 2Q18 3Q18 4Q18
South Africa – – – – – –
Nigeria 728 741 2 025 2 194 2 467 695
SEAGHA 19 075 19 609 15 676 16 446 16 885 18 730
Ghana 8 416 8 535 7 390 7 873 7 856 8 377
Uganda 6 349 6 226 5 345 5 296 5 399 6 264
Rwanda 2 212 2 726 1 570 1 730 1 863 2 107
Zambia 1 709 1 718 1 040 1 199 1 400 1 595
South Sudan – – – – – –
Botswana (joint venture) – – – – – –
eSwatini (joint venture) 389 404 331 348 367 387
WECA 8 461 9 130 5 083 5 463 6 462 7 654
Cameroon 2 422 2 724 1 136 1 192 1 489 1 949
Ivory Coast 2 917 2 878 2 309 2 501 2 854 2 983
Benin 1 599 1 729 1 185 1 212 1 311 1 476
Guinea-Conakry 226 320 52 57 104 184
Congo–Brazzaville 1 006 1 165 239 306 494 780
Liberia 245 268 143 171 181 241
Guinea-Bissau 46 46 19 24 29 41
MENA 13 6 3 4 6 8
Iran – – – – – –
Syria – – – – – –
Sudan 13 6 3 4 6 8
Yemen – – – – – –
Afghanistan – – – – – –
Total subscribers 28 277 29 486 22 787 24 107 25 820 27 087
MTN Group Limited Interim financial results for the six months ended 30 June 2019 127Data sheets
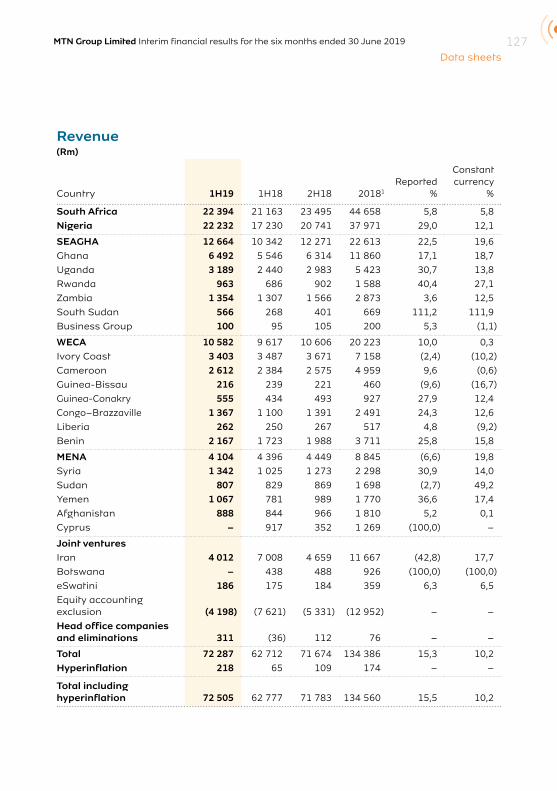
Revenue(Rm)
Country 1H19 1H18 2H18 20181
Reported%
Constantcurrency
%
South Africa 22 394 21 163 23 495 44 658 5,8 5,8
Nigeria 22 232 17 230 20 741 37 971 29,0 12,1
SEAGHA 12 664 10 342 12 271 22 613 22,5 19,6
Ghana 6 492 5 546 6 314 11 860 17,1 18,7
Uganda 3 189 2 440 2 983 5 423 30,7 13,8
Rwanda 963 686 902 1 588 40,4 27,1
Zambia 1 354 1 307 1 566 2 873 3,6 12,5
South Sudan 566 268 401 669 111,2 111,9
Business Group 100 95 105 200 5,3 (1,1)
WECA 10 582 9 617 10 606 20 223 10,0 0,3
Ivory Coast 3 403 3 487 3 671 7 158 (2,4) (10,2)
Cameroon 2 612 2 384 2 575 4 959 9,6 (0,6)
Guinea-Bissau 216 239 221 460 (9,6) (16,7)
Guinea-Conakry 555 434 493 927 27,9 12,4
Congo–Brazzaville 1 367 1 100 1 391 2 491 24,3 12,6
Liberia 262 250 267 517 4,8 (9,2)
Benin 2 167 1 723 1 988 3 711 25,8 15,8
MENA 4 104 4 396 4 449 8 845 (6,6) 19,8
Syria 1 342 1 025 1 273 2 298 30,9 14,0
Sudan 807 829 869 1 698 (2,7) 49,2
Yemen 1 067 781 989 1 770 36,6 17,4
Afghanistan 888 844 966 1 810 5,2 0,1
Cyprus – 917 352 1 269 (100,0) –
Joint venturesIran 4 012 7 008 4 659 11 667 (42,8) 17,7
Botswana – 438 488 926 (100,0) (100,0)
eSwatini 186 175 184 359 6,3 6,5
Equity accounting exclusion (4 198) (7 621) (5 331) (12 952) – –
Head office companies and eliminations 311 (36) 112 76 – –
Total 72 287 62 712 71 674 134 386 15,3 10,2
Hyperinflation 218 65 109 174 – –
Total including hyperinflation 72 505 62 777 71 783 134 560 15,5 10,2

MTN Group Limited Interim financial results for the six months ended 30 June 2019128
MTN Group Limited continued
Results for the six months ended 30 June 2019
Group service revenue by country(Rm)
Country 1H19 1H18 2H18 2018Reported
%
Constantcurrency
%
South Africa 18 061 17 491 18 778 36 269 3,3 3,3
Nigeria 22 189 17 184 20 709 37 893 29,1 12,2
SEAGHA 12 504 10 222 12 112 22 334 22,3 19,4
Ghana 6 449 5 509 6 280 11 789 17,1 18,7
Uganda 3 159 2 420 2 951 5 371 30,5 13,7
Rwanda 933 672 880 1 552 38,8 25,7
Zambia 1 297 1 259 1 495 2 754 3,0 11,9
South Sudan 566 267 401 668 112,0 112,7
Business Group 100 95 105 200 5,3 (1,1)
WECA 10 503 9 531 10 536 20 067 10,2 0,5
Ivory Coast 3 382 3 464 3 651 7 115 (2,4) (10,1)
Cameroon 2 587 2 348 2 554 4 902 10,2 0,0
Guinea-Bissau 213 232 217 449 (8,2) (15,5)
Guinea-Conakry 539 426 484 910 26,5 11,3
Congo-Brazzaville 1 357 1 095 1 381 2 476 23,9 12,3
Liberia 260 248 266 514 4,8 (8,9)
Benin 2 165 1 718 1 983 3 701 26,0 16,0
MENA 4 086 4 236 4 379 8 615 (3,5) 19,8
Syria 1 342 1 025 1 273 2 298 30,9 14,0
Sudan 805 826 866 1 692 (2,5) 49,4
Yemen 1 067 781 989 1 770 36,6 17,4
Afghanistan 872 831 951 1 782 4,9 (0,1)
Cyprus – 773 300 1 073 (100,0) –
Joint venturesIran 3 964 6 916 4 583 11 499 (42,7) 18,5
Botswana – 438 479 917 (100,0) (100,0)
eSwatini 184 172 179 351 7,0 6,8
Equity accounting exclusion (4 148) (7 526) (5 241) (12 767) – –
Head office companies and eliminations 315 (38) 115 77 – –
Total 67 658 58 626 66 622 125 255 15,4 9,7
Hyperinflation 217 64 111 175 – –
Total including hyperinflation 67 875 58 690 66 733 125 430 15,7 9,7

MTN Group Limited Interim financial results for the six months ended 30 June 2019 129Data sheets
MTN Group Limited continued
Results for the six months ended 30 June 2019
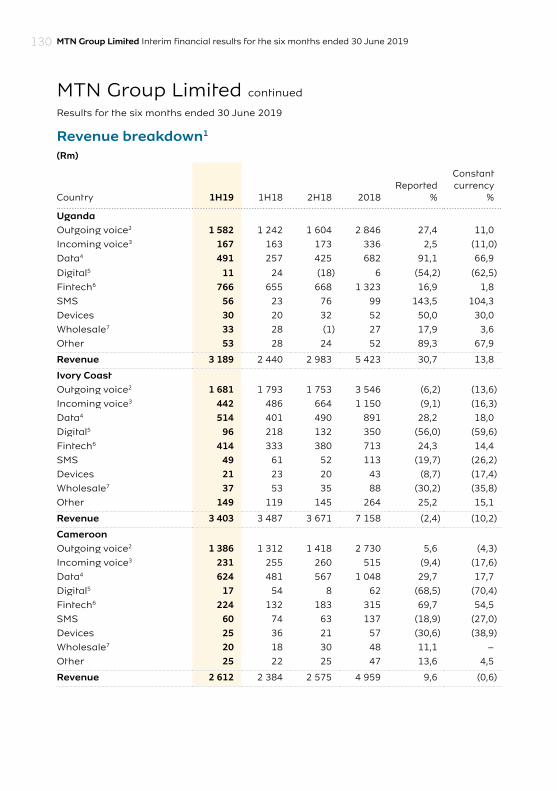
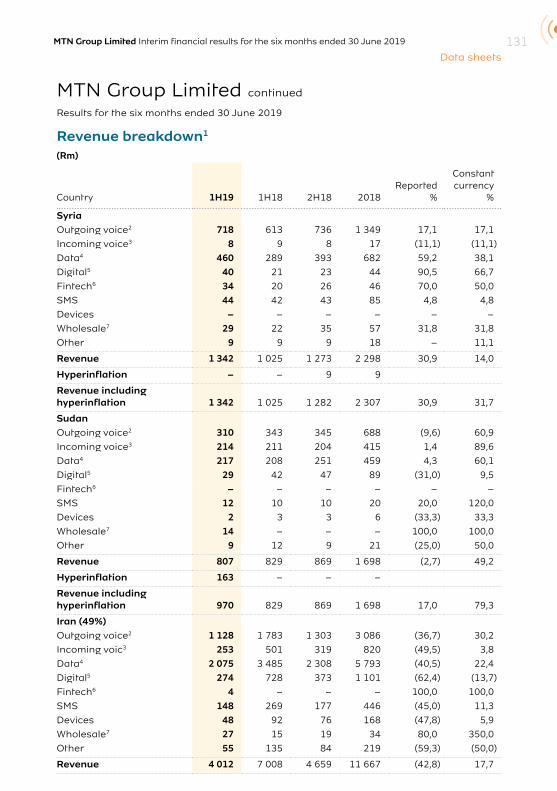
Revenue breakdown1
(Rm)
Country 1H19 1H18 2H18 2018Reported
%
Constantcurrency
%
South AfricaOutgoing voice2 6 873 7 463 7 557 15 020 (7,9) (7,9)Incoming voice3 853 808 900 1 708 5,6 5,6 Data4 6 026 5 704 6 297 12 001 5,6 5,6 Digital5 546 833 690 1 523 (34,5) (34,5)Fintech6 507 417 501 918 21,6 21,6 SMS 531 618 567 1 185 (14,1) (14,1)Devices 4 333 3 672 4 717 8 389 18,0 18,0 Wholesale7 1 998 854 1 526 2 380 134,0 134,0 Other 727 794 740 1 534 (8,4) (8,4)Revenue 22 394 21 163 23 495 44 658 5,8 5,8NigeriaOutgoing voice2 14 180 11 162 13 778 24 940 27,0 10,4 Incoming voice3 2 310 1 701 1 963 3 664 35,8 18,0 Data4 3 836 2 532 3 115 5 647 51,5 31,8 Digital5 250 611 334 945 (59,1) (64,3)Fintech6 646 463 584 1 047 39,5 21,2 SMS 704 436 622 1 058 61,5 40,1 Devices 43 46 32 78 (6,5) (19,6)Wholesale7 108 93 109 202 16,1 1,1 Other 155 186 204 390 (16,7) (28,0)Revenue 22 232 17 230 20 741 37 971 29,0 12,1GhanaOutgoing voice2 2 533 2 149 2 342 4 491 17,9 19,5 Incoming voice3 413 455 503 958 (9,2) (8,1)Data4 1 804 1 433 1 669 3 102 25,9 27,9 Digital5 259 418 243 661 (38,0) (36,8)Fintech6 1 284 849 1 434 2 283 51,2 53,4 SMS 61 41 53 94 48,8 51,2 Devices 43 37 34 71 16,2 16,2 Wholesale7 21 – – – 100,0 100,0Other 74 164 36 200 (54,9) (55,5)Revenue 6 492 5 546 6 314 11 860 17,1 18,71 Subsequent to the publication of the December 2018 full year results, the group has reviewed and aligned its
revenue streams relating to its Consumer, Enterprise and Wholesale business units with its current operating structure. The redefined segmentation has resulted in the reallocation of certain revenue streams and comparative numbers have been restated accordingly.
2 Excludes international roaming and wholesale.3 Includes local and international roaming and excludes wholesale.4 Includes mobile and fixed access data and excludes roaming and wholesale.5 Includes Rich Media services, content VAS, eCommerce and mobile advertising.6 Includes Xtratime and mobile financial services.7 Includes domestic wholesale, voice, SMS and data, leased lines and BTS rentals.
MTN Group Limited Interim financial results for the six months ended 30 June 2019130
MTN Group Limited continued
Results for the six months ended 30 June 2019
Revenue breakdown1
(Rm)
Country 1H19 1H18 2H18 2018Reported
%
Constantcurrency
%
UgandaOutgoing voice2 1 582 1 242 1 604 2 846 27,4 11,0
Incoming voice3 167 163 173 336 2,5 (11,0)
Data4 491 257 425 682 91,1 66,9
Digital5 11 24 (18) 6 (54,2) (62,5)
Fintech6 766 655 668 1 323 16,9 1,8
SMS 56 23 76 99 143,5 104,3
Devices 30 20 32 52 50,0 30,0
Wholesale7 33 28 (1) 27 17,9 3,6
Other 53 28 24 52 89,3 67,9
Revenue 3 189 2 440 2 983 5 423 30,7 13,8
Ivory CoastOutgoing voice2 1 681 1 793 1 753 3 546 (6,2) (13,6)
Incoming voice3 442 486 664 1 150 (9,1) (16,3)
Data4 514 401 490 891 28,2 18,0
Digital5 96 218 132 350 (56,0) (59,6)
Fintech6 414 333 380 713 24,3 14,4
SMS 49 61 52 113 (19,7) (26,2)
Devices 21 23 20 43 (8,7) (17,4)
Wholesale7 37 53 35 88 (30,2) (35,8)
Other 149 119 145 264 25,2 15,1
Revenue 3 403 3 487 3 671 7 158 (2,4) (10,2)
CameroonOutgoing voice2 1 386 1 312 1 418 2 730 5,6 (4,3)
Incoming voice3 231 255 260 515 (9,4) (17,6)
Data4 624 481 567 1 048 29,7 17,7
Digital5 17 54 8 62 (68,5) (70,4)
Fintech6 224 132 183 315 69,7 54,5
SMS 60 74 63 137 (18,9) (27,0)
Devices 25 36 21 57 (30,6) (38,9)
Wholesale7 20 18 30 48 11,1 –
Other 25 22 25 47 13,6 4,5
Revenue 2 612 2 384 2 575 4 959 9,6 (0,6)
MTN Group Limited Interim financial results for the six months ended 30 June 2019 131Data sheets
MTN Group Limited continued
Results for the six months ended 30 June 2019
Revenue breakdown1
(Rm)
Country 1H19 1H18 2H18 2018Reported
%
Constantcurrency
%
SyriaOutgoing voice2 718 613 736 1 349 17,1 17,1
Incoming voice3 8 9 8 17 (11,1) (11,1)
Data4 460 289 393 682 59,2 38,1
Digital5 40 21 23 44 90,5 66,7
Fintech6 34 20 26 46 70,0 50,0
SMS 44 42 43 85 4,8 4,8
Devices – – – – – –
Wholesale7 29 22 35 57 31,8 31,8
Other 9 9 9 18 – 11,1
Revenue 1 342 1 025 1 273 2 298 30,9 14,0
Hyperinflation – – 9 9
Revenue including hyperinflation 1 342 1 025 1 282 2 307 30,9 31,7
SudanOutgoing voice2 310 343 345 688 (9,6) 60,9
Incoming voice3 214 211 204 415 1,4 89,6
Data4 217 208 251 459 4,3 60,1
Digital5 29 42 47 89 (31,0) 9,5
Fintech6 – – – – – –
SMS 12 10 10 20 20,0 120,0
Devices 2 3 3 6 (33,3) 33,3
Wholesale7 14 – – – 100,0 100,0
Other 9 12 9 21 (25,0) 50,0
Revenue 807 829 869 1 698 (2,7) 49,2
Hyperinflation 163 – – –
Revenue including hyperinflation 970 829 869 1 698 17,0 79,3
Iran (49%)Outgoing voice2 1 128 1 783 1 303 3 086 (36,7) 30,2
Incoming voic3 253 501 319 820 (49,5) 3,8
Data4 2 075 3 485 2 308 5 793 (40,5) 22,4
Digital5 274 728 373 1 101 (62,4) (13,7)
Fintech6 4 – – – 100,0 100,0
SMS 148 269 177 446 (45,0) 11,3
Devices 48 92 76 168 (47,8) 5,9
Wholesale7 27 15 19 34 80,0 350,0
Other 55 135 84 219 (59,3) (50,0)
Revenue 4 012 7 008 4 659 11 667 (42,8) 17,7
MTN Group Limited Interim financial results for the six months ended 30 June 2019132
MTN Group Limited continued
Results for the six months ended 30 June 2019
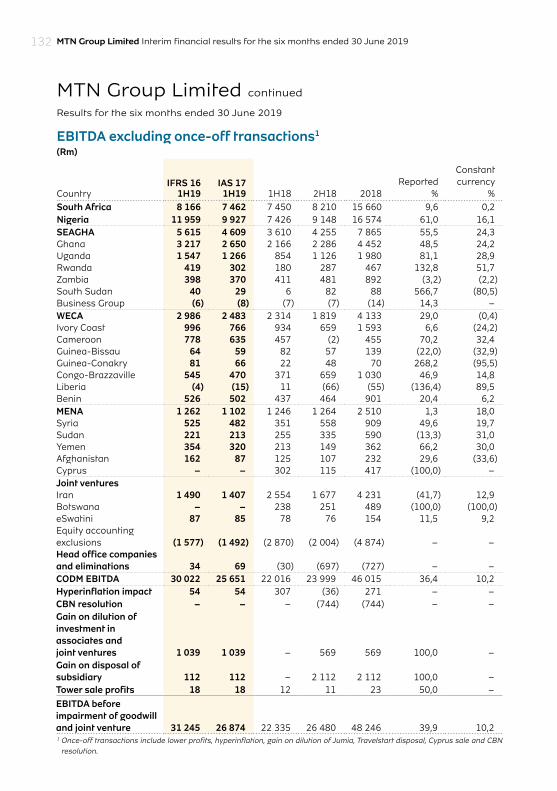
EBITDA excluding once-off transactions1
(Rm)
CountryIFRS 16
1H19IAS 17
1H19 1H18 2H18 2018Reported
%
Constantcurrency
%South Africa 8 166 7 462 7 450 8 210 15 660 9,6 0,2Nigeria 11 959 9 927 7 426 9 148 16 574 61,0 16,1 SEAGHA 5 615 4 609 3 610 4 255 7 865 55,5 24,3Ghana 3 217 2 650 2 166 2 286 4 452 48,5 24,2Uganda 1 547 1 266 854 1 126 1 980 81,1 28,9 Rwanda 419 302 180 287 467 132,8 51,7 Zambia 398 370 411 481 892 (3,2) (2,2)South Sudan 40 29 6 82 88 566,7 (80,5) Business Group (6) (8) (7) (7) (14) 14,3 – WECA 2 986 2 483 2 314 1 819 4 133 29,0 (0,4)Ivory Coast 996 766 934 659 1 593 6,6 (24,2)Cameroon 778 635 457 (2) 455 70,2 32,4 Guinea-Bissau 64 59 82 57 139 (22,0) (32,9)Guinea-Conakry 81 66 22 48 70 268,2 (95,5) Congo-Brazzaville 545 470 371 659 1 030 46,9 14,8 Liberia (4) (15) 11 (66) (55) (136,4) 89,5Benin 526 502 437 464 901 20,4 6,2 MENA 1 262 1 102 1 246 1 264 2 510 1,3 18,0 Syria 525 482 351 558 909 49,6 19,7 Sudan 221 213 255 335 590 (13,3) 31,0 Yemen 354 320 213 149 362 66,2 30,0 Afghanistan 162 87 125 107 232 29,6 (33,6)Cyprus – – 302 115 417 (100,0) –Joint venturesIran 1 490 1 407 2 554 1 677 4 231 (41,7) 12,9 Botswana – – 238 251 489 (100,0) (100,0)eSwatini 87 85 78 76 154 11,5 9,2 Equity accounting exclusions (1 577) (1 492) (2 870) (2 004) (4 874) – – Head office companies and eliminations 34 69 (30) (697) (727) – – CODM EBITDA 30 022 25 651 22 016 23 999 46 015 36,4 10,2Hyperinflation impact 54 54 307 (36) 271 – –CBN resolution – – – (744) (744) – –Gain on dilution of investment in associates and joint ventures 1 039 1 039 – 569 569 100,0 –Gain on disposal of subsidiary 112 112 – 2 112 2 112 100,0 –Tower sale profits 18 18 12 11 23 50,0 –
EBITDA before impairment of goodwill and joint venture 31 245 26 874 22 335 26 480 48 246 39,9 10,21 Once-off transactions include lower profits, hyperinflation, gain on dilution of Jumia, Travelstart disposal, Cyprus sale and CBN
resolution.

MTN Group Limited Interim financial results for the six months ended 30 June 2019 133Data sheets
MTN Group Limited continued
Results for the six months ended 30 June 2019
Income statement – IFRS 16 impact(Rm) Group SA Nigeria GhanaRevenue – – – –Operating expenses 4 371 704 2 032 567EBITDA 4 371 704 2 032 567Depreciation (2 774) (567) (1 074) (321)Amortisation – – – –Impairment of goodwill – – – –Operating profit 1 597 137 958 246Interest expense (2 640) (525) (1 310) (390)Foreign exchange gains or losses (48) 2 – (49)Share of results of associates and joint ventures (8) – – –Profit before tax (1 099) (386) (352) (193)Income tax expense 305 101 115 45Profit after tax (794) (285) (237) (148)Attributable to equity holders of parent (711) (285) (237) (148)Non-controlling interest (83) – – –
Statement of financial position – IFRS 16 impactJune 2019
IFRS 16 versus IAS 17(Rm) Group SA Nigeria GhanaNon-current assets 44 580 12 767 18 995 4 357Property, plant and equipment (162) (102)ROU asset 45 137 12 869 19 390 4 357Interest in joint ventures (8) – – –Deferred tax 8Non-current prepayments (395) – (395) –Current assets (2 331) (380) (1 632) (57)Prepayments (2 331) (380) (1 632) (57)Total assets 42 249 12 387 17 363 4 300Total equity (794) (285) (237) (148)Equity (711) (285) (237) (148)Non-controlling interest (83) – – –Non-current liabilities 41 500 11 977 18 252 4 218Lease liability – non-current 41 753 12 078 18 366 4 218Deferred tax (253) (101) (114) –Current liabilities 1 543 695 (652) 230Lease liability – current 3 427 695 1 156 307Accrued expenses (1 835) – (1 808) (30)Current tax (49) – – (47)Total equity and liabilities 42 249 12 387 17 363 4 300

MTN Group Limited Interim financial results for the six months ended 30 June 2019134
MTN Group Limited continued
Results for the six months ended 30 June 2019
Revenue and EBITDA *Local currency (m)
Revenue EBITDA*
Country 1H19 1H18
Reportedchange
%1H19
IFRS 161H19
IAS 17 1H18
Reportedchange
%
South Africa 22 394 21 163 5,8 8 166 7 462 7 450 9,6
Nigeria 566 946 505 668 12,1 304 869 253 042 217 746 40,0
SEAGHAGhana 2 426 2 043 18,7 1 202 990 800 50,3
Uganda 835 898 734 023 13,9 405 489 332 101 256 931 57,8
Rwanda 60 333 47 393 27,3 26 239 18 913 12 420 111,3
Zambia 1 183 1 051 12,6 348 323 331 5,1
South Sudan 6 241 2 947 111,8 439 321 54 713,0
Business Group 100 95 5,3 (6) (8) (7) 14,3
WECAIvory Coast 139 190 154 982 (10,2) 40 656 31 220 41 559 (2,2)
Cameroon 107 024 107 746 (0,7) 30 584 27 299 20 607 48,4
Guinea-Bissau 8 828 10 602 (16,7) 2 594 2 420 3 617 (28,3)
Guinea-Conakry 357 424 318 169 12,3 52 001 42 625 16 055 223,9
Congo-Brazzaville 55 974 49 697 12,6 22 339 19 267 16 787 33,1
Liberia 18 20 (10,0) – (1) 1 (100,0)
Benin 88 630 76 592 15,7 21 505 20 536 19 349 11,1
MENASyria 41 493 36 433 13,9 16 195 14 857 12 463 29,9
Sudan 2 650 1 789 48,1 730 706 555 31,5
Yemen 28 622 24 388 17,4 9 480 8 584 6 633 42,9
Afghanistan 4 821 4 812 0,2 875 473 710 23,2
Cyprus – 62 (100,0) – – 20 (100,0)
Joint venturesIran (49%) 26 252 616 22 296 051 17,7 9 757 145 9 185 316 8 141 765 19,8
Botswana (53.1%) – 351 (100,0) – – 190 (100,0)
eSwatini (30%) 186 175 6,3 87 85 78 11,5
* Excludes tower profits and hyperinflation.

MTN Group Limited Interim financial results for the six months ended 30 June 2019 135Data sheets
Revenue and EBITDA *Local currency (m)
Revenue EBITDA*
Country 1H19 1H18
Reportedchange
%1H19
IFRS 161H19
IAS 17 1H18
Reportedchange
%
South Africa 22 394 21 163 5,8 8 166 7 462 7 450 9,6
Nigeria 566 946 505 668 12,1 304 869 253 042 217 746 40,0
SEAGHAGhana 2 426 2 043 18,7 1 202 990 800 50,3
Uganda 835 898 734 023 13,9 405 489 332 101 256 931 57,8
Rwanda 60 333 47 393 27,3 26 239 18 913 12 420 111,3
Zambia 1 183 1 051 12,6 348 323 331 5,1
South Sudan 6 241 2 947 111,8 439 321 54 713,0
Business Group 100 95 5,3 (6) (8) (7) 14,3
WECAIvory Coast 139 190 154 982 (10,2) 40 656 31 220 41 559 (2,2)
Cameroon 107 024 107 746 (0,7) 30 584 27 299 20 607 48,4
Guinea-Bissau 8 828 10 602 (16,7) 2 594 2 420 3 617 (28,3)
Guinea-Conakry 357 424 318 169 12,3 52 001 42 625 16 055 223,9
Congo-Brazzaville 55 974 49 697 12,6 22 339 19 267 16 787 33,1
Liberia 18 20 (10,0) – (1) 1 (100,0)
Benin 88 630 76 592 15,7 21 505 20 536 19 349 11,1
MENASyria 41 493 36 433 13,9 16 195 14 857 12 463 29,9
Sudan 2 650 1 789 48,1 730 706 555 31,5
Yemen 28 622 24 388 17,4 9 480 8 584 6 633 42,9
Afghanistan 4 821 4 812 0,2 875 473 710 23,2
Cyprus – 62 (100,0) – – 20 (100,0)
Joint venturesIran (49%) 26 252 616 22 296 051 17,7 9 757 145 9 185 316 8 141 765 19,8
Botswana (53.1%) – 351 (100,0) – – 190 (100,0)
eSwatini (30%) 186 175 6,3 87 85 78 11,5
* Excludes tower profits and hyperinflation.
MTN Group Limited Interim financial results for the six months ended 30 June 2019136
MTN Group Limited continued
Results for the six months ended 30 June 2019
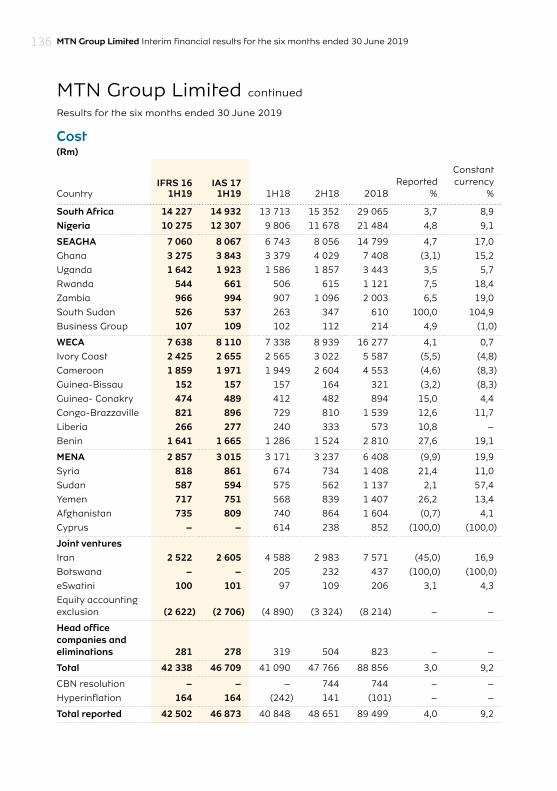
Cost(Rm)
CountryIFRS 16
1H19IAS 17
1H19 1H18 2H18 2018Reported
%
Constantcurrency
%
South Africa 14 227 14 932 13 713 15 352 29 065 3,7 8,9
Nigeria 10 275 12 307 9 806 11 678 21 484 4,8 9,1
SEAGHA 7 060 8 067 6 743 8 056 14 799 4,7 17,0
Ghana 3 275 3 843 3 379 4 029 7 408 (3,1) 15,2
Uganda 1 642 1 923 1 586 1 857 3 443 3,5 5,7
Rwanda 544 661 506 615 1 121 7,5 18,4
Zambia 966 994 907 1 096 2 003 6,5 19,0
South Sudan 526 537 263 347 610 100,0 104,9
Business Group 107 109 102 112 214 4,9 (1,0)
WECA 7 638 8 110 7 338 8 939 16 277 4,1 0,7
Ivory Coast 2 425 2 655 2 565 3 022 5 587 (5,5) (4,8)
Cameroon 1 859 1 971 1 949 2 604 4 553 (4,6) (8,3)
Guinea-Bissau 152 157 157 164 321 (3,2) (8,3)
Guinea- Conakry 474 489 412 482 894 15,0 4,4
Congo-Brazzaville 821 896 729 810 1 539 12,6 11,7
Liberia 266 277 240 333 573 10,8 –
Benin 1 641 1 665 1 286 1 524 2 810 27,6 19,1
MENA 2 857 3 015 3 171 3 237 6 408 (9,9) 19,9
Syria 818 861 674 734 1 408 21,4 11,0
Sudan 587 594 575 562 1 137 2,1 57,4
Yemen 717 751 568 839 1 407 26,2 13,4
Afghanistan 735 809 740 864 1 604 (0,7) 4,1
Cyprus – – 614 238 852 (100,0) (100,0)
Joint venturesIran 2 522 2 605 4 588 2 983 7 571 (45,0) 16,9
Botswana – – 205 232 437 (100,0) (100,0)
eSwatini 100 101 97 109 206 3,1 4,3
Equity accounting exclusion (2 622) (2 706) (4 890) (3 324) (8 214) – –
Head office companies and eliminations 281 278 319 504 823 – –
Total 42 338 46 709 41 090 47 766 88 856 3,0 9,2
CBN resolution – – – 744 744 – –
Hyperinflation 164 164 (242) 141 (101) – –
Total reported 42 502 46 873 40 848 48 651 89 499 4,0 9,2

MTN Group Limited Interim financial results for the six months ended 30 June 2019 137Data sheets
Cost breakdown
CountryIFRS 16
1H19IAS 17
1H19 1H18 2H18 20181Reported
%
Constantcurrency
%
South AfricaHandsets and other accessories 5 099 5 099 4 353 5 774 10 127 17,1 17,1
Interconnect 1 000 1 000 1 028 1 058 2 086 (2,7) (2,7)
Roaming 58 58 151 95 246 (61,6) (61,6)
Commissions 1 149 1 149 1 223 1 142 2 365 (6,1) (6,1)
Government and regulatory costs 101 101 113 111 224 (10,6) (10,6)
VAS/Digital revenue share 318 318 325 278 603 (2,2) (2,2)
Service provider discount 743 743 813 734 1 547 (8,6) (8,6)
Network 1 928 2 089 2 166 2 242 4 408 (11,0) (3,6)
Marketing 509 509 567 784 1 351 (10,2) (10,2)
Staff costs 1 337 1 337 1 235 1 267 2 502 8,3 8,3
Other OPEX 1 985 2 529 1 739 1 867 3 606 14,1 45,4
Cost 14 227 14 932 13 713 15 352 29 065 3,7 8,9
Nigeria*Handsets and other accessories 253 253 150 142 292 68,7 46,7
Interconnect 2 053 2 053 1 593 1 900 3 493 28,9 12,0
Roaming 68 68 86 63 149 (20,9) (31,4)
Commissions 1 025 1 025 811 974 1 785 26,4 9,6
Government and regulatory costs 592 592 446 591 1 037 32,7 15,2
VAS/Digital revenue share 288 288 353 342 695 (18,4) (29,2)
Service provider disc – – – – – – –
Network 4 344 6 352 4 900 5 809 10 709 (11,3) 12,7
Marketing 328 328 272 311 583 20,6 4,8
Staff costs 662 662 489 645 1 134 35,4 17,8
Other OPEX 662 686 706 901 1 607 (6,2) (15,9)
Cost 10 275 12 307 9 806 11 678 21 484 (4,8) 9,1
* Excluding CBN resolution.
MTN Group Limited Interim financial results for the six months ended 30 June 2019138
MTN Group Limited continued
Results for the six months ended 30 June 2019
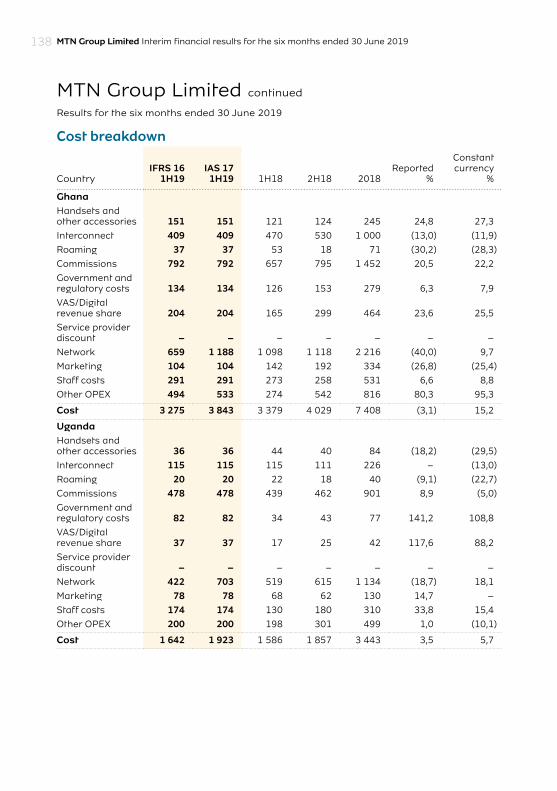
Cost breakdown
CountryIFRS 16
1H19IAS 17
1H19 1H18 2H18 2018Reported
%
Constantcurrency
%
GhanaHandsets and other accessories 151 151 121 124 245 24,8 27,3
Interconnect 409 409 470 530 1 000 (13,0) (11,9)
Roaming 37 37 53 18 71 (30,2) (28,3)
Commissions 792 792 657 795 1 452 20,5 22,2
Government and regulatory costs 134 134 126 153 279 6,3 7,9
VAS/Digital revenue share 204 204 165 299 464 23,6 25,5
Service provider discount – – – – – – –
Network 659 1 188 1 098 1 118 2 216 (40,0) 9,7
Marketing 104 104 142 192 334 (26,8) (25,4)
Staff costs 291 291 273 258 531 6,6 8,8
Other OPEX 494 533 274 542 816 80,3 95,3
Cost 3 275 3 843 3 379 4 029 7 408 (3,1) 15,2
Uganda
Handsets and other accessories 36 36 44 40 84 (18,2) (29,5)
Interconnect 115 115 115 111 226 – (13,0)
Roaming 20 20 22 18 40 (9,1) (22,7)
Commissions 478 478 439 462 901 8,9 (5,0)
Government and regulatory costs 82 82 34 43 77 141,2 108,8
VAS/Digital revenue share 37 37 17 25 42 117,6 88,2
Service provider discount – – – – – – –
Network 422 703 519 615 1 134 (18,7) 18,1
Marketing 78 78 68 62 130 14,7 –
Staff costs 174 174 130 180 310 33,8 15,4
Other OPEX 200 200 198 301 499 1,0 (10,1)
Cost 1 642 1 923 1 586 1 857 3 443 3,5 5,7

MTN Group Limited Interim financial results for the six months ended 30 June 2019 139Data sheets
Cost breakdown
CountryIFRS 16
1H19IAS 17
1H19 1H18 2H18 2018Reported
%
Constantcurrency
%
Ivory CoastHandsets and other accessories 83 83 106 57 163 (21,7) (28,3)
Interconnect 365 365 511 610 1 121 (28,6) (34,4)
Roaming 13 13 21 16 37 (38,1) (42,9)
Commissions 347 347 294 338 632 18,0 8,8
Government and regulatory costs 392 392 314 487 801 24,8 15,3
VAS/Digital revenue share 118 118 113 167 280 4,4 (5,3)
Service provider discount – – – – – – –
Network 332 549 535 442 977 (37,9) (5,4)
Marketing 96 96 108 96 204 (11,1) (18,5)
Staff costs 286 286 268 302 570 6,7 (0,7)
Other OPEX 393 406 295 507 802 33,2 25,1
Cost 2 425 2 655 2 565 3 022 5 587 (5,5) (4,8)
CameroonHandsets and other accessories 53 53 87 33 120 (39,1) (44,8)
Interconnect 179 179 269 194 463 (33,5) (39,8)
Roaming 10 10 11 15 26 (9,1) (18,2)
Commissions 269 269 208 245 453 29,3 (17,3)
Government and regulatory costs 209 209 155 365 520 34,8 22,6
VAS/Digital revenue share 72 72 31 48 79 132,3 116,1
Service provider discount 17 17 – 26 26 100,0 100,0
Network 562 665 582 711 1 293 (3,4) 3,3
Marketing 63 63 57 94 151 10,5 –
Staff costs 213 213 258 380 638 (17,4) (24,8)
Other OPEX 212 221 291 493 784 (27,1) (31,6)
Cost 1 859 1 971 1 949 2 604 4 553 (4,6) (8,3)

MTN Group Limited Interim financial results for the six months ended 30 June 2019140
MTN Group Limited continued
Results for the six months ended 30 June 2019
Cost breakdown
CountryIFRS 16
1H19IAS 17
1H19 1H18 2H18 2018Reported
%
Constantcurrency
%
Iran (49%)Handsets and other accessories 59 59 148 94 242 (60,1) (17,6)
Interconnect 226 226 413 277 690 (45,3) 12,8
Roaming 13 13 16 32 48 (18,7) 68,8
Commissions 21 21 37 22 59 (43,2) 18,9
Government and regulatory costs 1 154 1 154 2 006 1 328 3 334 (42,5) 18,4
VAS/Digital revenue share 43 43 148 69 217 (70,9) (40,5)
Service provider discount 102 102 208 135 343 (51,0) 1,4
Network 661 743 1 109 734 1 843 (40,4) 38,8
Marketing 57 57 144 84 228 (60,4) (19,4)
Staff costs 104 104 185 130 315 (43,8) 15,7
Other OPEX 82 83 174 78 252 (54,0) (6,9)
Cost 2 522 2 605 4 588 2 983 7 571 (45,0) 16,9
Hyperinflation – – – – –
Cost including hyperinflation 2 522 2 605 4 588 2 983 7 571 (45,0) 16,9
SyriaHandsets and other accessories 9 9 4 8 12 125,0 100,0
Interconnect 18 18 14 16 30 28,6 14,3
Roaming 6 6 5 6 11 20,0 –
Commissions 22 22 18 19 37 22,2 5,6
Government and regulatory costs 272 272 217 254 471 25,3 9,2
VAS/Digital revenue share 39 39 14 28 42 178,6 142,9
Service provider discount – – – – – – –
Network 230 262 221 217 438 4,1 2,3
Marketing 15 15 13 17 30 15,4 –
Staff costs 88 88 65 63 128 35,4 18,5
Other OPEX 119 130 103 106 209 15,5 9,7
Cost 818 861 674 734 1 408 21,4 11,0
Hyperinflation 8 8 (4) 7 3 –
Cost including hyperinflation 826 869 670 741 1 411 23,3 29,7

MTN Group Limited Interim financial results for the six months ended 30 June 2019 141Data sheets
Cost breakdown
CountryIFRS 16
1H19IAS 17
1H19 1H18 2H18 2018Reported
%
Constantcurrency
%
SudanHandsets and other accessories 29 29 28 39 67 3,6 53,6
Interconnect 67 67 115 77 192 (41,7) (11,3)
Roaming 5 5 6 13 19 (16,7) 16,7
Commissions 51 51 59 58 117 (13,6) 33,9
Government and regulatory costs 21 21 14 55 69 50,0 135,7
VAS/Digital revenue share 8 8 – 1 1 100,0 100,0
Service provider disc – – – – – – –
Network 232 237 178 167 345 30,3 101,1
Marketing 26 26 13 18 31 100,0 200,0
Staff costs 45 45 40 40 80 12,5 70,0
Other OPEX 103 105 122 94 216 (15,6) 34,4
Cost 587 594 575 562 1 137 2,1 57,4
Hyperinflation 117 117 (306) (90) (396) – –
Cost including hyperinflation 704 711 269 472 741 161,7 365,4

MTN Group Limited Interim financial results for the six months ended 30 June 2019142
2019 Q2
MTN share-
holding#
(%)
Popu-lation
(m)
Mobile pene-tration
(%)
Market position/
number of operators
Market- share
(%)
Outgoing MOU
(minutes)
Tele-metry
(m)
Smart-phones
(’000)
MB/active
user
YTD Rolled-
out2G sites
YTD Rolled-
out3G sites
YTD Rolled-
out4G sites
Cumu-lative
2G sites
Cumu-lative
3G sites
Cumu-lative
4G sites
SEAGHASouth Africa 100 57,7 171 2/4 26,27 62 3 190 16 108 801 246 271 385 12 269 12 531 11 374 Nigeria 79 197,0 62 1/4 50,49 134 24 136 795 472 556 2 689 14 261 15 006 6 347
Ghana 85 29,9 113 1/9 55,97 306 7 247 1 275 280 674 982 3 880 3 899 1 235 Uganda 96 45,0 48 1/8 55,13 162 2 341 728 96 230 379 1 944 1 908 660 Rwanda 80 12,4 69 1/3 54,61 183 965 1 092 16 23 n/a 767 777 n/a Zambia 98 17,1 82 1/3 48,16 80 1 885 893 3 97 213 1 246 1 079 594 South Sudan 100 13,2 14 2/3 60,64 170 179 393 22 51 n/a 219 144 n/a Botswana (joint venture) 53 2,3 141 1/3 100,00 102 n/a n/a n/a n/a n/a n/a n/a n/a eSwatini (joint venture) 30 1,2 97 1/2 84,72 211 437 266 15 9 – 403 402 149
WECACameroon 80 25,4 78 1/4 47,19 81 3 313 956 45 56 150 1 838 1 580 724 Ivory Coast 67 25,8 134 2/3 34,05 67 4 600 833 93 108 32 2 151 1 689 637 Benin 75 12,2 79 1/4 54,60 57 1 697 1 246 17 13 30 796 593 221
Guinea-Conakry 75 12,3 74 2/4 34,34 35 1 088 782 58 135 n/a 769 548 n/a Congo-Brazzaville 100 5,2 88 1/3 54,24 78 945 676 10 50 8 526 426 162 Liberia 60 4,4 68 1/3 34,41 103 299 769 – 22 12 255 186 86 Guinea-Bissau 100 1,9 69 1/3 59,78 51 232 556 4 32 13 163 109 40
MENAIran (joint venture) 49 84,0 124 2/4 42,95 108 31 609 3 494 278 890 1 059 12 546 12 485 10 897 Syria 75 19,4 81 2/2 36,40 83 4 099 581 79 113 147 2 468 2 193 953 Sudan 85 40,8 62 2/3 33,48 185 2 914 1 461 4 4 n/a 2 088 1 420 459 Yemen 85 27,7 44 1/4 36,10 154 1 944 93 12 n/a n/a 1 279 n/a n/a Afghanistan 100 34,9 42 1/5 44,43 104 1 964 1 380 19 44 n/a 1 482 1 014 65 # Effective shareholding.
MTN Group Limited continued
Results for the six months ended 30 June 2019
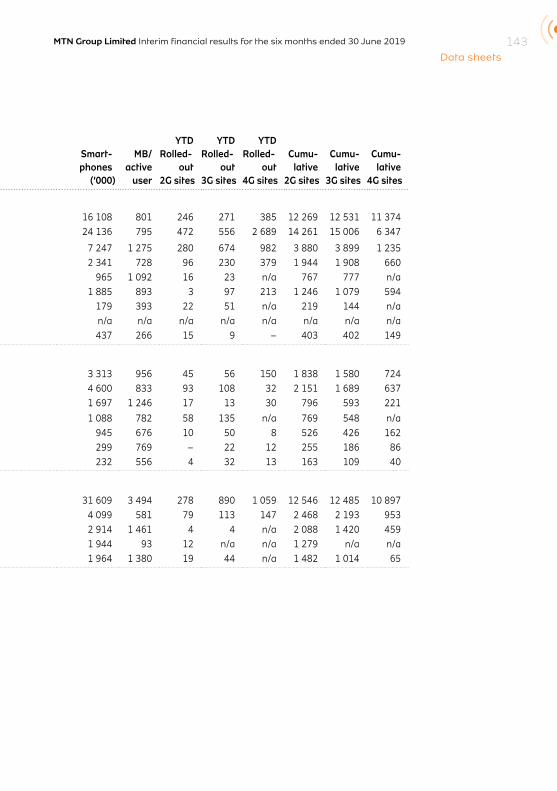
MTN Group Limited Interim financial results for the six months ended 30 June 2019 143Data sheets
2019 Q2
MTN share-
holding#
(%)
Popu-lation
(m)
Mobile pene-tration
(%)
Market position/
number of operators
Market- share
(%)
Outgoing MOU
(minutes)
Tele-metry
(m)
Smart-phones
(’000)
MB/active
user
YTD Rolled-
out2G sites
YTD Rolled-
out3G sites
YTD Rolled-
out4G sites
Cumu-lative
2G sites
Cumu-lative
3G sites
Cumu-lative
4G sites
SEAGHASouth Africa 100 57,7 171 2/4 26,27 62 3 190 16 108 801 246 271 385 12 269 12 531 11 374 Nigeria 79 197,0 62 1/4 50,49 134 24 136 795 472 556 2 689 14 261 15 006 6 347
Ghana 85 29,9 113 1/9 55,97 306 7 247 1 275 280 674 982 3 880 3 899 1 235 Uganda 96 45,0 48 1/8 55,13 162 2 341 728 96 230 379 1 944 1 908 660 Rwanda 80 12,4 69 1/3 54,61 183 965 1 092 16 23 n/a 767 777 n/a Zambia 98 17,1 82 1/3 48,16 80 1 885 893 3 97 213 1 246 1 079 594 South Sudan 100 13,2 14 2/3 60,64 170 179 393 22 51 n/a 219 144 n/a Botswana (joint venture) 53 2,3 141 1/3 100,00 102 n/a n/a n/a n/a n/a n/a n/a n/a eSwatini (joint venture) 30 1,2 97 1/2 84,72 211 437 266 15 9 – 403 402 149
WECACameroon 80 25,4 78 1/4 47,19 81 3 313 956 45 56 150 1 838 1 580 724 Ivory Coast 67 25,8 134 2/3 34,05 67 4 600 833 93 108 32 2 151 1 689 637 Benin 75 12,2 79 1/4 54,60 57 1 697 1 246 17 13 30 796 593 221
Guinea-Conakry 75 12,3 74 2/4 34,34 35 1 088 782 58 135 n/a 769 548 n/a Congo-Brazzaville 100 5,2 88 1/3 54,24 78 945 676 10 50 8 526 426 162 Liberia 60 4,4 68 1/3 34,41 103 299 769 – 22 12 255 186 86 Guinea-Bissau 100 1,9 69 1/3 59,78 51 232 556 4 32 13 163 109 40
MENAIran (joint venture) 49 84,0 124 2/4 42,95 108 31 609 3 494 278 890 1 059 12 546 12 485 10 897 Syria 75 19,4 81 2/2 36,40 83 4 099 581 79 113 147 2 468 2 193 953 Sudan 85 40,8 62 2/3 33,48 185 2 914 1 461 4 4 n/a 2 088 1 420 459 Yemen 85 27,7 44 1/4 36,10 154 1 944 93 12 n/a n/a 1 279 n/a n/a Afghanistan 100 34,9 42 1/5 44,43 104 1 964 1 380 19 44 n/a 1 482 1 014 65 # Effective shareholding.


