Declaration Navigability of the Upper and Lower Salt River Submitted To: Salt River Project PO Box 52025 Phoenix, Arizona 85072-2025 Robert A. Mussetter, PhD, PE Submitted by: 3801 Automation Way, Suite 100 Fort Collins, CO 80525 August 20, 2015
Transcript
Declaration Navigability of the Upper and Lower Salt River
Submitted To: Salt River Project PO Box 52025 Phoenix, Arizona 85072-2025
Robert A. Mussetter, PhD, PE
Submitted by: 3801 Automation Way, Suite 100 Fort Collins, CO 80525
August 20, 2015
Declaration Navigability of the Upper and Lower Salt River
i
Table of Contents Page
1 Introduction and Summary of Opinions ............................................................................... 1 1.1 Qualifications ............................................................................................................... 1 1.2 Opinions ...................................................................................................................... 4
2 Basis for Opinions ............................................................................................................... 7
2.1 General Character of Canyon-Bound and Dryland Rivers ............................................ 7 2.2 Historical (and Modern-day) Character of the Upper Salt River ...................................11
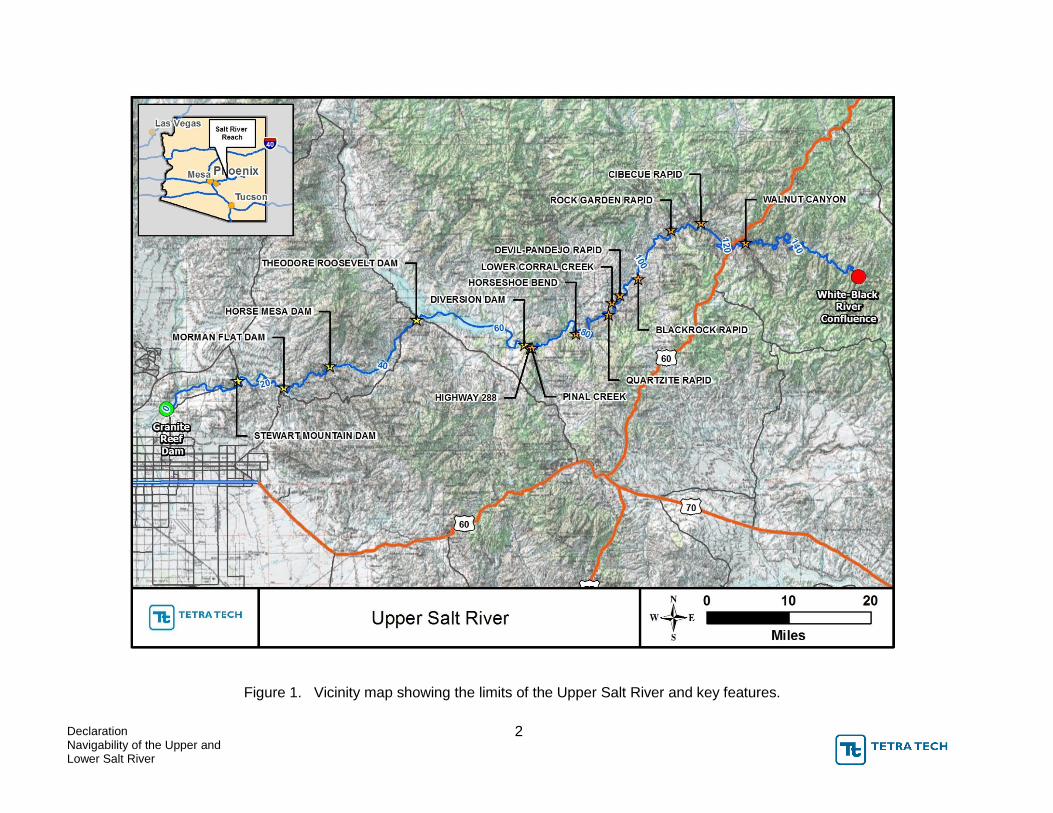
Figure 1. Vicinity map showing the limits of the Upper Salt River and key features. ........... 2
Figure 2. Vicinity map showing the limits of the Lower Salt River and key features. ........... 3
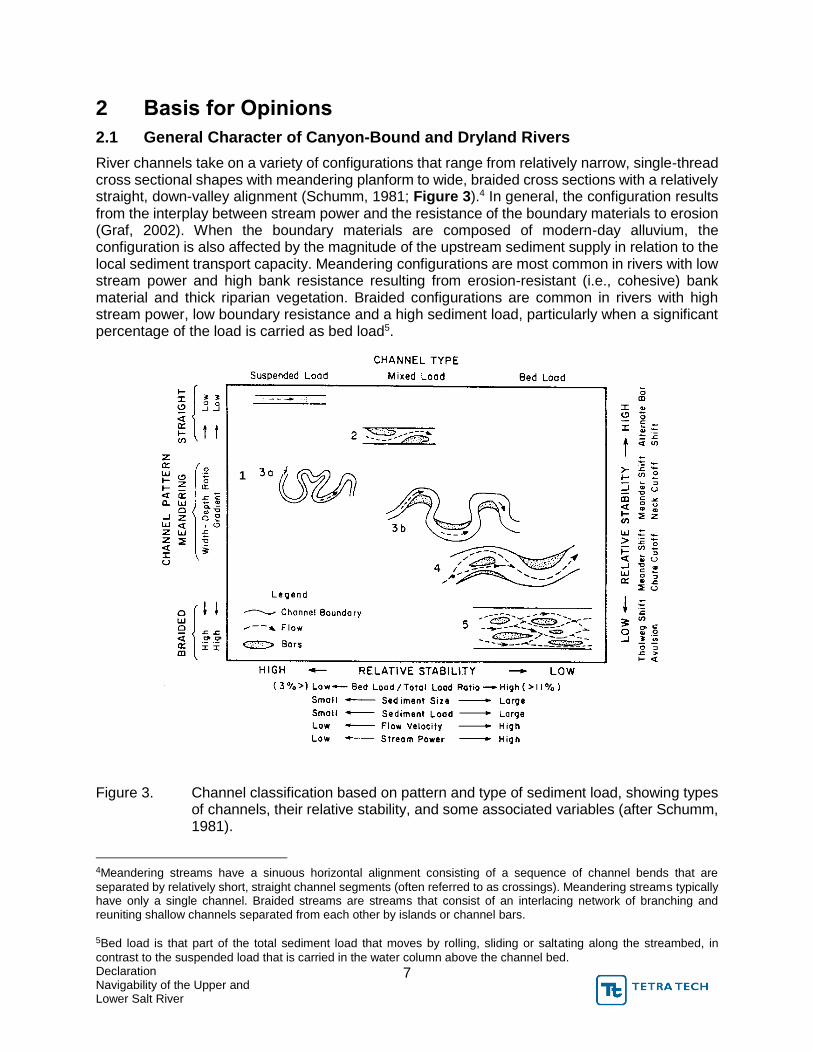
Figure 3. Channel classification based on pattern and type of sediment load, showing types of channels, their relative stability, and some associated variables (after Schumm, 1981). ................................................................................................. 7
Figure 4. Historical changes in channel area of upper Gila River (San Simon to Pima) (from Burkham, 1972). ........................................................................................ 9
Figure 5. Changes in channel width for the Middle Gila River (modified from Huckleberry, 1993). ................................................................................................................10
Figure 6. Migration of the low-flow channel margins of the Salt River near Phoenix, AZ within the floodplain from 1868 - 1982 (from Fuller, 1987, Figure 7). ..................11
Figure 7. Longitudinal profile of the Salt River. Only a sample of the rapids and features in the canyon-bound portion of the reach upstream from Roosevelt Lake are shown. (Elevation data from Natural Resources Conservation Service National Elevation Data 10-m resolution Digital Elevation model.) Arizona State Lands Commission (ASLD) proposed segment limits are also shown for reference. .....13
Figure 8. Aerial view of Corkscrew Rapid and Quartzite Falls (~RM 80) illustrating a typical location where bedrock crops out directly in the bed of the river (Photo taken June 5, 2012; Discharge ~90 cfs). ............................................................14
Declaration Navigability of the Upper and Lower Salt River
ii
Figure 9. Aerial view of Blackrock Rapid (RM 97.6) illustrating a typical location where bedrock crops out directly in the bed of the river (Photo taken June 5, 2012; Discharge ~90 cfs). ............................................................................................14
Figure 10. Aerial view of mouth of Lower Corral Creek and rapid (same name, ~RM 90.6) illustrating a typical location where sediment and debris from tributary constricts the river (Photo taken November 1, 2010; Discharge ~140 cfs). ........15
Figure 11. Aerial view of mouth of unnamed tributary and Devil-Pandejo Rapid (~RM 93.2) illustrating a typical location where sediment and debris from the unnamed tributary constricts the river. There may also be bedrock in the bed of the river at this location (Photo taken November 1, 2010; Discharge ~140 cfs). ...........................................................................................................16
Figure 12. Aerial view of apex of Horseshoe Bend Rapid (~RM 81) showing a typical backwater-formed gravel bar and shallow riffles/rapids (Photo taken November 1, 2010; Discharge ~140 cfs). ...........................................................17
Figure 13. Aerial view of apex of portion of Upper Salt River near RM 105 showing a typical backwater-formed gravel bar and shallow riffles/rapids (Photo taken November 1, 2010; Discharge ~140 cfs). ...........................................................18
Figure 14. View looking upstream of Quartzite Rapid (lower, center) (Photo by B. Mussetter, October 29, 2013).............................................................................20
Figure 15. Mean daily flow duration curves for the Salt River near Roosevelt (USGS Gage No. 9498500) and near Chrysotile (USGS Gage No. 9497500) gages for complete water years and during the primary whitewater rafting season (March 1 – May 15). ...........................................................................................21
Figure 16. View looking upstream of the middle portion of Gleason Flats and Gleason Rapid (Photo by B. Mussetter, October 29, 2013). .............................................21
Figure 17. Aerial view of ~2-mile portion of Upper Salt River beginning ~1 mile upstream from Verde River showing typical historic braiding pattern (Photo date November 1, 2010). ...........................................................................................23
Figure 18. Aerial View of ~2-mile portion of Upper Salt River beginning ~1 mile upstream from Verde River (Photo dated 1934). ................................................................23
Figure 19. View looking upstream toward Granite Reef Dam (approximate center of photo) (Photo by B. Mussetter, October 29, 2013). ............................................24
Figure 20. View looking upstream of the backwater-affected reach upstream from Granite Reef Dam (Photo by B. Mussetter, October 29, 2013). ..........................24
Figure 21. Annual peak discharge at the Salt River near Chrysotile (USGS Gage No. 9497500), near Roosevelt (USGS Gage No. 9498500), and below Stewart Mountain Dam (USGS Gage No. 9502000) gages. ............................................25
Figure 22. Annual runoff volume at the Salt River near Chrysotile (USGS Gage No. 9497500), near Roosevelt (USGS Gage No. 9498500), and below Stewart Mountain Dam (USGS Gage No. 9502000) gages. Also shown are the annual runoff volumes at the Salt River at Roosevelt gage for the period from 1880 through 1913 (data from USGS, 1954). ..............................................................26
Declaration Navigability of the Upper and Lower Salt River
iii
Figure 23. Comparison of annual peak discharge and annual runoff volume at the Upper Salt River near Roosevelt gage (USGS Gage No. 9498500). ............................27
Figure 24. Time-series plot of Gila River annual discharge (1663-1914 from reconstruction of Meko et al., 1995; 1915-2012 from recorded flows at USGS Gage No. 09448500, Gila River at Head of Safford Valley. Also shown are the periods of different typical channel widths identified by Burkham, 1972). Solid horizontal line is median, dashed lines are 10th and 90th percentiles (i.e., 10 percent of the values fall above and below these lines, respectively). ................27
Figure 25. View looking downstream from approximately 2 miles below Roosevelt Dam showing the canyon-bound character of the reach (Photo by B. Mussetter, October 29, 2013). Note that the water shown in this photo is much deeper than it would have been under ordinary and natural conditions because of the backwater effects of Horse Mesa Dam. ........................................................29
Figure 26. View looking downstream from approximately 4 miles below Horse Mesa Dam showing the canyon-bound character of the reach (Photo by B. Mussetter, October 29, 2013). Note that the water shown in this photo is much deeper than it would have been under ordinary and natural conditions because of the backwater effects of Mormon Flat Dam. .............................................................30
Figure 27. View looking upstream of Mormon Flat Dam showing the canyon-bound character of the reach (Photo by B. Mussetter, October 29, 2013). Note that the water shown in this photo downstream from the dam is much deeper than it would have been under ordinary and natural conditions because of the backwater effects of Stewart Mountain Dam. .....................................................31
Figure 28. Median and mean discharges (based on mean daily flows) for the periods of record at the Salt River below Stewart Mountain Dam (USGS Gage No. 09502000; 1925-2014) and near Roosevelt (Gage No. 09498500; 1914-2014) gages. ................................................................................................................33
Figure 29. Annual peak discharges between 1890 and 2014 at key mainstem stream gages on the Salt and Verde Rivers. ..................................................................34
Figure 30. A 1934 aerial photograph of Salt River in Section 30, T2N, R6E (Mesa Quadrangle). Maximum river width is 4,800 feet. Note islands, bars, and low-water channels (from Schumm, 2003). ...............................................................35
Figure 31. A 1934 aerial photograph of Salt River in Section 24, T1N, R2E (Phoenix Quadrangle). Note islands, bars, and low-flow channels. Channel is about one mile wide (from Schumm, 2003). .................................................................36
Figure 32. A 2002 aerial photograph of Salt River in Section 25, T2N, R5E. Much of the channel has been modified by gravel mining; however, in the south half of the channel, a large island, bars, and low-water channels remain. Original width of channel was 3,500 feet; 1,600 feet of channel remains (from Schumm, 2003). ................................................................................................................37
Figure 33. A 2002 aerial photograph of Salt River in Section 32, T1N, R1E. Channel is about one-half mile wide. Note vegetated low-water channels, discontinuous low-water channels, bars and floodplain. ...........................................................38
Figure 34. Salt River, as shown on 1903-04, 19123 USGS topographic maps of a portion of the Phoenix Quadrangle, southeast of Phoenix. ............................................40
Declaration Navigability of the Upper and Lower Salt River
iv
Figure 35. Salt River as shown on 1903-04, 1912 USGS topographic maps of a portion of the Phoenix Quadrangle southwest of Phoenix. .............................................40
Declaration Navigability of the Upper and Lower Salt River
1
1 Introduction and Summary of Opinions
At the request of the Salt River Project Agricultural Improvement and Power District and Salt River Valley Water Users’ Association (collectively, SRP), I have made an independent assessment of the navigability1 of the Upper and Lower Salt River (Figures 1 and 2)2 to aid in determining ownership of the bed and banks of the river under the equal-footing doctrine. This assessment included review of the expert report and testimony of Dr. Stanley Schumm regarding this matter (Schumm, 2003 and 2005), and independent review of additional relevant information, including various technical documents that will be cited below, the Arizona Division One Court of Appeals opinion that vacated and remanded for further proceedings the Arizona Navigable Stream Adjudication Commission (ANSAC) 2005 decision on navigability of the Lower Salt River and the U.S. Supreme Court’s ruling in the PPL Montana case. My review also included a low-elevation overflight of most of the Lower Salt River and the portion of the Upper Salt River from Granite Reef Dam to approximately White Rocks Rapid that is located about 13.5 miles downstream from the U.S. Highway 60 Bridge to gain first-hand knowledge of the present-day condition of the river and the surrounding landscape.
1.1 Qualifications
I am a registered Professional Engineer in ten states, including Arizona, with over 30 years of experience in analyzing the behavior of natural and manmade stream channels. I have a Ph.D. in Hydraulic Engineering from Colorado State University with emphasis on river mechanics, and I am currently a Program Manager and Discipline Lead for Hydraulic Engineering in the Surface Water Group of Tetra Tech, Inc. In 1989, I founded Mussetter Engineering, Inc. (MEI), and in 1994, Dr. Schumm joined me as part owner of MEI. From 1986 until his death in 2011, I collaborated with Dr. Schumm on a wide variety of projects related to stream channel processes. I was President and Principal Engineer of MEI during the time Dr. Schumm prepared his report and provided testimony to the ANSAC regarding this matter, and I was generally familiar with the work he performed in preparing the report and testimony. This familiarity was gained, in part, through discussions with Dr. Schumm about the information that he had obtained and the opinions that he was forming from that information. Over the course of my career, I have also performed significant technical work in Arizona related to stream channel processes through which I have gained first-hand knowledge of the climatic, hydrologic and geomorphic conditions in the Salt River.
“Navigable” or “navigable watercourse” means a watercourse that was in existence on February 14, 1912, and at that time was used or was susceptible to being used, in its ordinary and natural condition, as a highway for commerce, over which trade and travel were or could have been conducted in the customary modes of trade and travel on water.
In vacating and remanding for further proceedings, ANSAC’s 2005 decision that the Lower Salt River was not navigable at the date of Arizona’s Statehood (Case No CA-CV 07-0704), the Arizona Division I Court of Appeals concluded that … ANSAC was required to determine what the River would have looked like on February 14, 1912, in its ordinary (i.e., usual, absent major flooding or drought) and natural (i.e., without man-made dams, canals, or other diversions) condition.
2The Upper Salt River extends approximately 153 miles from Granite Reef Dam at the downstream end to the
confluence of the Black and White Rivers at the upstream end. The Lower Salt River extends approximately 39 miles from Granite Reef Dam downstream to the confluence with the Gila River.
Declaration Navigability of the Upper and Lower Salt River
2
Figure 1. Vicinity map showing the limits of the Upper Salt River and key features.
Declaration Navigability of the Upper and Lower Salt River
3
Figure 2. Vicinity map showing the limits of the Lower Salt River and key features.
Declaration Navigability of the Upper and Lower Salt River
4
1.2 Opinions
Based on my review of Dr. Schumm’s report and background material, independent review of other background material, my knowledge of the climatic, hydrologic and geomorphic conditions along the Salt River, and my knowledge of processes in arid stream channels, I agree with the opinions that were expressed by Dr. Schumm in his report and testimony, and offer the following clarifications and additional opinions for ANSAC’s consideration in this matter:
Upper Salt River (Granite Reef Dam to Black/White River confluence)
1. With the exception of the approximately 3-mile portion of the reach know as Gleason Flat, that is located about 100 miles upstream from Granite Reef Dam, the upstream approximately 93 miles of the Upper Salt River between the head of Roosevelt Lake and the Black and White River confluence flows through a narrow, bedrock canyon. This portion of reach is steep (~22 ft/mi in the 53-mile reach between the head of Roosevelt Lake and Highway 60, about 26 ft/mi between Highway 60 and the Black and White River confluence, including an approximately 6-mile reach between Highway 60 and Walnut Canyon having an even steeper slope of about 54 ft/mi), which alone would make navigation challenging, under the best of circumstances. Of more importance, however, this reach contains numerous rapids that would have made navigation impossible, or at the very least extremely dangerous, with the watercraft that were in customary use at and prior to the date of Arizona’s Statehood in February 1912.
2. The characteristics of the approximately 13-mile portion of the Upper Salt River between Granite Reef Dam and Stewart Mountain Dam is less confined than the upstream, bedrock-controlled reach, which allows for a wide, braided character. The historic braiding corridor occupied essentially the entire valley bottom. This portion of the reach has a single thread channel under current conditions due to the regulating effects of the upstream reservoirs.
3. Similar to the Gila River, a series of large floods occurred during the period between the late-1880s and 1912 that likely scoured away much of the riparian vegetation, caused extensive bank erosion and channel widening, and maintained a wide, braided, multi-channel planform3, a condition that would have made navigation impossible, or at the very least impractical, during significant portions of the year when flows in the river were low.
4. Granite Reef and Roosevelt Dams were completed in 1908 and 1911, respectively. These structures would have been a man-made impediment to navigation at the date of Arizona’s statehood.
5. The majority of the approximately 53-mile reach that is mostly inundated by Roosevelt, Apache, Canyon and Saguaro Lakes is canyon-bound, similar to the upstream reach. This reach would most likely have had similar geomorphic characteristics to the upstream canyon-bound reach, including rapids and shallow riffles that would have made navigation impractical with the watercraft that were in customary use at and prior to the date of Arizona’s statehood.
Lower Salt River (Gila River confluence to Granite Reef Dam)
6. The Lower Salt River was subject to periodic flooding, and this flooding produced the disturbance regime that created a braided planform. Based on the historical information, the bankfull capacity of the high-flow channel (~175,000 cfs) was exceeded about once in 40 years, on average.
7. During low-flow periods between the flood peaks, the river often consisted of one to several relatively small, shallow low-flow channels.
3Planform refers the horizontal alignment of the channel (e.g., a meandering stream has a sinuous planform alignment).
Declaration Navigability of the Upper and Lower Salt River
5
8. The bed and banks of the river in the early-1980s consisted of gravel and cobbles that were not mobilized at flows in less than 20,000 cfs, equivalent to about a 1-in-5-year flood peak.
9. The 1980s-era gravel and cobbles were exposed by downcutting of the river through a much finer-grained, sand-and-gravel surface layer that was present prior to 1965, and presumably under natural conditions, as well. This finer material would have been mobilized on a more frequent basis than the exposed gravel and cobbles, which would have made the low-flow channel much less stable, laterally, than under modern conditions.
10. Under natural conditions, the riparian corridor along the river was very sparse. Upstream flow regulation has changed the flow regime by increasing the baseflows, and this has resulted in a more robust riparian corridor that also makes the low-flow channel more stable (and less dynamic) under modern conditions than under natural conditions.
11. The available historic data shows that the low-flow channel occupied nearly every position within the high-flow channel at some point in time back to at least the mid-1800s. The physical characteristics of the river strongly suggest that the unpredictable location of the low-flow channel likely persisted prior to modern human influences.
12. Contrary to previous testimony before the ANSAC on behalf of the State of Arizona that the Gila and Verde Rivers were boatable using small, modern, shallow-draft watercraft, and the anticipated similar testimony with regard to the Lower Salt River, the highly-unpredictable hydrology, the braided nature of the high-flow channel, and small size and dynamic nature of the low-flow channel, including the tendency to shift laterally by thousands of feet during a single flood event, strongly suggest that use of the Lower Salt River as a highway for commerce in customary modes of trade and travel on water would have been impractical.
13. It is my opinion that segmentation of the Salt River is not necessary because no significant segment of the river was navigable in its ordinary and natural condition.
Declaration Navigability of the Upper and Lower Salt River
6
Page Intentionally Left Blank
Declaration Navigability of the Upper and Lower Salt River
7
2 Basis for Opinions
2.1 General Character of Canyon-Bound and Dryland Rivers
River channels take on a variety of configurations that range from relatively narrow, single-thread cross sectional shapes with meandering planform to wide, braided cross sections with a relatively straight, down-valley alignment (Schumm, 1981; Figure 3).4 In general, the configuration results from the interplay between stream power and the resistance of the boundary materials to erosion (Graf, 2002). When the boundary materials are composed of modern-day alluvium, the configuration is also affected by the magnitude of the upstream sediment supply in relation to the local sediment transport capacity. Meandering configurations are most common in rivers with low stream power and high bank resistance resulting from erosion-resistant (i.e., cohesive) bank material and thick riparian vegetation. Braided configurations are common in rivers with high stream power, low boundary resistance and a high sediment load, particularly when a significant percentage of the load is carried as bed load5.
Figure 3. Channel classification based on pattern and type of sediment load, showing types of channels, their relative stability, and some associated variables (after Schumm, 1981).
4Meandering streams have a sinuous horizontal alignment consisting of a sequence of channel bends that are
separated by relatively short, straight channel segments (often referred to as crossings). Meandering streams typically have only a single channel. Braided streams are streams that consist of an interlacing network of branching and reuniting shallow channels separated from each other by islands or channel bars. 5Bed load is that part of the total sediment load that moves by rolling, sliding or saltating along the streambed, in
contrast to the suspended load that is carried in the water column above the channel bed.
1
Declaration Navigability of the Upper and Lower Salt River
8
The Upper Salt River flows through a narrow, bedrock-confined canyon over much of its length. Canyon-bound rivers of this type are strongly controlled by the characteristics of the bedrock that provide both lateral and vertical control on the form of the river, and by coarse-grained sediment and debris that is delivered to the river by floods and debris flows from the side canyons and by colluvial processes (i.e., gravity) from the canyon walls (O’Connor et al., 2003; Howard and Dolan, 1981; Graf, 1979). These rivers are typically supply-limited, which means that they can transport considerably more sediment than is being supplied from upstream. As a result, the sediment load has little influence on the overall form of the river, at least during flows up to moderate-magnitude floods. As is the case at many locations along the Upper Salt River, the bedrock can cause sharp breaks in the longitudinal profile that create waterfalls and rapids that can make navigation very challenging and dangerous, and in some cases, impossible. Coarse-grained sediment and debris delivered from the tributaries and side canyons often creates alluvial fans and bars that constrict the river, forming rapids that also severely limit navigability (Hereford et al., 1997; Graf, 1979).
With respect to the portions of the Upper and Lower Salt River that are not bedrock-confined, Graf (1983) argued that alluvial dryland river channels are not equilibrium forms. The morphology of the channel at any point in time is inherited from the last significant, flood-driven alteration, and this controls the channel form during the subsequent recovery period (Graf, 2002). Following the channel-altering flood event, the river channel returns to its pre-disturbance condition (i.e., it recovers) relatively slowly compared to the rate of adjustment during the flood through sedimentation in low energy areas and re-establishment of riparian vegetation on the surfaces that were disturbed by the flood. As a result, it is not possible to define a dominant discharge, because the larger, more infrequent flows are more geomorphically effective than the frequently occurring flows (Graf, 2002; Baker, 1977). During floods, the flows are so powerful that they can rapidly and significantly alter the channel and adjacent overbanks. The amount of alteration depends on many factors, including the magnitude and duration of the flows, the inflowing sediment load, the characteristics of the bed and bank material and riparian vegetation, and the degree to which the channel has recovered from the last major event. During the recovery periods of low- to moderate sustained flows, the channel form tends toward a single-thread, sinuous configuration within the overall wider cross section created by the disturbance flows.
The channel behavior described in the previous paragraph has been documented in a wide variety of settings. As noted in Dr. Schumm’s expert report, for example, the Cimmaron River in southwestern Kansas was transformed from a narrow sinuous, 50-foot wide channel to a 1,200-foot wide, braided channel by a series of floods during the 1930s (Schumm and Lichty, 1963). Another notable example includes the Rio Salado, a tributary of the Rio Grande near San Acacia, New Mexico, where the channel width ranged from 12 feet to 49 feet in 1882, but widened to 330 to 550 feet by 1918 (Bryan, 1927). The Smoky Hill River originally …had alternating sandy stretches and grassy stretches with series of pools (sic). Later the former were widened and the latter were sanded up….. (Smith, 1940). The Republican River was greatly affected by the flood of 1935: Formerly a narrow stream with a practically perennial flow of clear water and with well-wooded banks, the Republican now has a broad, shallow sandy channel with intermittent flow. The trees were practically all washed out and destroyed, much valuable farmland…was sanded over, and the channel has been filled up by several feet. (Smith, 1940)
An additional example is the Red River floodplain near Burkburnett, Texas, that was the object of intensive study to resolve a boundary dispute between Oklahoma and Texas (Glenn, 1925; Sellards, 1923). The Red River was never a narrow, meandering stream in historic times; a survey in 1874 showed the river to be about 4,000 feet wide. The channel, however, has undergone some important changes. For example, comparison of a map prepared in 1920 (Sellards, 1923) with aerial photographs taken in 1953 showed enlargement of the floodplain; 5.5 mi2 of floodplain were added over a 10-mile reach of the river. In 1937, the river averaged three-quarters of a mile wide, close to the average for the 1874 survey. In 1953, the average width had decreased to half
Declaration Navigability of the Upper and Lower Salt River
9
a mile. In 1957, the river averaged two-thirds of one mile wide, indicating significant widening between 1953 and 1957, during which period three large floods occurred in the reach.
The recorded history of the Gila River and many of its larger tributaries, including the Salt and Verde Rivers, documents cyclical changes that are very consistent with those described above. In a detailed study of the impacts of phreatophytes on the Gila River in the Safford Valley, Burkham (1972 and 1981) concluded that the historical character of the Gila River channel can be grouped into three time periods: 1846-1904, 1905-1917 and 1918-1970. From 1846-1904, the channel was relatively narrow, and it meandered through a floodplain covered with willow, cottonwood, and mesquite (Figure 4). Only moderate changes occurred in the channel width and sinuosity during this period. The maximum width was about 150 feet in 1875 and about 300 feet in 1903. In response to a series of large floods in the early-1900s that completely destroyed the meander pattern and floodplain vegetation, the average width of the river had increased to about 2,000 feet by 1917. The river then narrowed and developed a more sinuous planform with a densely vegetated floodplain between 1918 and 1970; by 1964, the maximum width had decreased to only about 200 feet.
Figure 4. Historical changes in channel area of upper Gila River (San Simon to Pima) (from
Burkham, 1972). Huckleberry (1993) showed similar changes in the middle Gila River (Figure 5). In the late-1800s, the channel width averaged about 60 m (~200 feet), increasing to about 300 m (~1,000 feet) by about 1925 as a result of the large floods in the early-1900s, and then decreased back to about 40 m (~130 feet) by the 1940s. In response to large floods that occurred in the 1980s, the width increased to about 70 m (~230 feet) by the early-1990s.
Declaration Navigability of the Upper and Lower Salt River
10
Figure 5. Changes in channel width for the Middle Gila River (modified from Huckleberry,
1993). In summary, alluvial rivers in the arid southwestern U.S. experience cycles of low (or non-existent) to moderate flows punctuated by large, infrequent, monsoon-driven flood events. During the low to moderate flow periods, they tend toward a single-thread, meandering planform, and during the infrequent, large floods, they can rapidly transform into a wide, braided, multi-channel planform in which the flow depths are highly irregular, both spatially and temporally. Both conditions are ordinary and natural conditions of the river. Particularly during the floods and the subsequent recovery periods following the floods, the multiple, individual channels in the braided planform tend to be very shallow and unstable. Consistent with this behavior, Fuller (1987) evaluated the historic position of the low-flow channel using survey notes, historic photographs and maps, and concluded that the channel has shown…considerable locational instability over the past 119 years… (i.e., starting in 1868) in the approximately 8-mile reach of the Lower Salt River between Hayden Road and 16th Street (Figure 6). Where the rivers are confined by bedrock canyons, the planform and profile of the river is controlled by the bedrock and local deposits of coarse-grained material from debris flows emanating from the side canyons and from material falling directly into the river from the canyon walls. These features create rapids, shallow riffles, and in some cases, waterfalls that can make navigation extremely challenging or impossible, even for modern-day whitewater boats.
0
200
400
600
800
1000
0
50
100
150
200
250
300
350
1850 1900 1950 2000
Ch
ann
el W
idth
(fe
et)
Ch
ann
el W
idth
(m
)
Year
Mean width: dam to railroad
Mean width: railroad to Pima Butte
Declaration Navigability of the Upper and Lower Salt River
11
Figure 6. Migration of the low-flow channel margins of the Salt River near Phoenix, AZ within
the floodplain from 1868 - 1982 (from Fuller, 1987, Figure 7).
2.2 Historical (and Modern-day) Character of the Upper Salt River
Based on the topography, geology and locations of the existing dams and reservoirs, the existing Upper Salt River can be loosely divided into three reaches:
1. The approximately 93-mile, canyon-bound reach between the White and Black River confluence and the head of Roosevelt Lake,
2. The approximately 14-mile, alluvial, braided reach between Stewart Mountain Dam and Granite Reef Dam, and
3. The approximately 53-mile reach between the above two reaches that is mostly inundated by the Roosevelt, Apache, Canyon and Saguaro Lakes.
As described in the following sections, the physical characteristics of each of these reaches would have rendered them non-navigable in their ordinary and natural condition at and prior to the date of Arizona’s Statehood.
Declaration Navigability of the Upper and Lower Salt River
12
2.2.1 Canyon-bound Upstream Reach
The geologic conditions along the approximately 93-mile canyon-bound upstream reach of the Upper Salt River strongly indicate that the geomorphology has changed very little since the date of Arizona’s statehood. This reach flows through a narrow, bedrock canyon that controls the planform alignment, longitudinal profile and width of the active river channel. In this setting, significant changes in geomorphology due to the direct action of the river occur over very long (geologic) time-frames that are orders of magnitude longer than the approximate century since Arizona’s statehood. Because of the remoteness of the area, human activities that directly affect the geomorphic character of the river, including both direct physical modifications and changes in the flow regime, have been very limited. As a result, both the physical configuration of the river and the flows that occur under current conditions in this part of the reach are very similar to conditions at the time of statehood.
The overall gradient of the river in the canyon-bound reach is relatively steep (~22 ft/mi in the 53-mile reach between the head of Roosevelt Lake and Highway 60, and about 26 ft/mi between Highway 60 and the confluence of the Black and White Rivers) (Figure 7). The approximately 6-mile reach between Highway 60 and the mouth of Walnut Canyon is about twice as steep as the remainder of the reach, at about 54 ft/mi. For comparison, the average gradient of the approximately 64-mile reach between the mouth of the Verde River and Pinal Creek that is mostly inundated by the series of existing reservoirs is about 14 ft/mi.
Within the canyon-bound reach, bedrock is exposed in both the bed and banks of the river in many locations, providing direct vertical and lateral control that creates steep drops in the river bed elevation that form rapids (Figures 8 and 9). In many other locations, large caliber sediment and debris from the adjacent side canyons constrict the river (Figures 10 and 11). The large, mostly immobile debris controls the vertical profile, creating steep drops in bed elevation and rapids. In still other locations, constrictions in the valley width and bends in the valley alignment create upstream backwater6 conditions at high flows when coarse-grained sediment is being transported, causing the transported sediment to deposit and form large cobble bars. During subsequent lower flows, the river is constricted to a relatively narrow channel along the sides (or in some cases, across the middle) of the bars, forming rapids or shallow riffles (Figures 12 and 13). In many instances, large boulders that have fallen from the bedrock valley walls in the above-described areas create additional roughness and hazards to navigation. In all cases, the rapids and riffles represent significant impediments to navigation by the watercraft that were in use at and prior to the time of Arizona’s statehood.
6 Backwater is a term used in hydraulic engineering to describe the local increase in water-surface elevation and depth,
and flattening of the water-surface slope, upstream from a flow constriction.
Declaration Navigability of the Upper and Lower Salt River
13
Figure 7. Longitudinal profile of the Salt River. Only a sample of the rapids and features in the canyon-bound portion of the reach
upstream from Roosevelt Lake are shown. (Elevation data from Natural Resources Conservation Service National Elevation Data 10-m resolution Digital Elevation model.) Arizona State Lands Commission (ASLD) proposed segment limits are also shown for reference.
Gra
nit
e R
eef
Dam
V
erd
e R
iver
Gag
ing
Stat
ion
Stew
art
Mo
un
tain
Dam
Mo
rmo
n F
lat
Dam
Ho
rse
Mes
a D
am
Ro
ose
velt
Dam
Div
ersi
on
Dam
Hw
y 2
88
Pin
al C
reek
Ho
rse
sho
e B
end
Ch
err
y C
reek
Qu
artz
ite
Rap
idLo
wer
Co
rral
Cre
ekD
evil-
Pan
dej
o R
apid
Bla
ckro
ck R
apid
Gle
aso
n F
lat
Ro
ck G
ard
en R
apid
Mes
cal F
alls
C
ibec
ue
Cre
ek
Hig
hw
ay 6
0G
agin
g St
atio
n
Wal
nu
t C
anyo
n
Car
rizz
o C
reek
Bla
ck/W
hit
e R
iver
Co
nfl
uen
ce
91
st A
ven
ue
51
st A
ven
ue
Cen
tral
Ave
nu
eI-
10
Tem
pe
Bu
tte
HW
Y-1
01
Co
un
try
Clu
b
ASLD Seg 1ASLD Seg 2
ASLD Seg 3ASLD Seg 4
ASL
D S
eg 5
ASLD Seg 6
900
1,300
1,700
2,100
2,500
2,900
3,300
3,700
4,100
4,500
0 20 40 60 80 100 120 140 160 180 200
Elev
atio
n (
feet
msl
)
Distance Upstream from Granite Reef Dam (mi)
Declaration Navigability of the Upper and Lower Salt River
14
Figure 8. Aerial view of Corkscrew Rapid and Quartzite Falls (~RM 807) illustrating a typical
location where bedrock crops out directly in the bed of the river (Photo taken June 5, 2012; Discharge ~90 cfs).
Figure 9. Aerial view of Blackrock Rapid (RM 97.6) illustrating a typical location where
bedrock crops out directly in the bed of the river (Photo taken June 5, 2012; Discharge ~90 cfs).
7 RM refers to distance in river miles upstream from Granite Reef Dam.
200 ft
Quartzite Falls
Corkscrew Rapid
200 ft
Blackrock Rapid
Declaration Navigability of the Upper and Lower Salt River
15
Figure 10. Aerial view of mouth of Lower Corral Creek and rapid (same name, ~RM 90.6)
illustrating a typical location where sediment and debris from tributary constricts the river (Photo taken November 1, 2010; Discharge ~140 cfs).
Lower Corral Creek
Lower Corral Rapid
200 ft
Declaration Navigability of the Upper and Lower Salt River
16
Figure 11. Aerial view of mouth of unnamed tributary and Devil-Pandejo Rapid (~RM 93.2)
illustrating a typical location where sediment and debris from the unnamed tributary constricts the river. There may also be bedrock in the bed of the river at this location (Photo taken November 1, 2010; Discharge ~140 cfs).
Unnamed Tributary
Devil-Pandejo Rapid
200 ft
Declaration Navigability of the Upper and Lower Salt River
17
Figure 12. Aerial view of apex of Horseshoe Bend Rapid (~RM 81) showing a typical
backwater-formed gravel bar and shallow riffles/rapids (Photo taken November 1, 2010; Discharge ~140 cfs).
200 ft
Declaration Navigability of the Upper and Lower Salt River
18
Figure 13. Aerial view of apex of portion of Upper Salt River near RM 105 showing a typical
backwater-formed gravel bar and shallow riffles/rapids (Photo taken November 1, 2010; Discharge ~140 cfs).
200 ft
Declaration Navigability of the Upper and Lower Salt River
19
In this regard, it is significant to note that the portion of this reach between Highway 60 and Highway 288, just upstream from Roosevelt Lake, is popular for whitewater rafting using modern kayaks and small inflatable rafts that are designed specifically for recreational use in such environments. These types of watercraft were not available at the date of Arizona’s statehood. USDA Forest Service (USFS) information about this reach contains ample warning of the dangers:
There are several rapids which can go to a solid Class IV8 at certain water levels. This river is usually run in small rafts and in kayaks. It is not suitable for… open canoes, etc. It is also unsuitable for large rafts. (USFS, 1995, p1)
The Salt River Canyon is a very remote and potentially dangerous place. The river is a solid Class III-IV run, and is not recommended for novices and beginners. (http://www.fs.usda.gov/detail/tonto/passes-permits/?cid=fsbdev3_018757)
The USFS (1995) guide contains descriptions of at least 23 named rapids in the approximately 36-mile reach downstream from Highway 60. One of these rapids (Quartzite Falls, Figure 4; Figure 14) is notoriously dangerous, even for skilled whitewater boaters. This rapid required a difficult portage to pass prior its being surreptitiously modified by blasting in 1998, an act for which eight men were convicted for damaging government property. The individuals responsible for the blasting allegedly did so to remove the impediment to navigation out of concern for public safety, as a number of people had drowned attempting to navigate the rapid. Even after the blasting, this rapid remains one of the most challenging on the river.
The period of the year when there is sufficient water to permit even whitewater boating is very limited, generally extending only from March 1 through May 15 in normal years, and even shorter periods in dry years. The General Information section at the beginning of the modern boating guide by Whitis and Vinson (2014) contains the following statement:
Just a short two and one-half hour drive from central Phoenix is a special river that relatively few boaters get to enjoy, mainly due to its short unpredictable season.
The third paragraph of the above-referenced section also contains the following statement:
The boating season for the Salt typically begins in early March and runs through April with anything from dangerously high water to rock-scraping low water possible.
In fact, the March 9, 2014, edition of the Arizona Daily Star reported that commercial rafting companies cancelled their 2014 seasons on the Upper Salt and Verde Rivers due to the lack of water. This report contained the following quote from the owner of the Wilderness Aware Rafting Company:
We need an absolute minimum of 400 cfs to get the boats out without having to drag it over the rocks.
Based on the data from the Salt River near Roosevelt and Salt River near Chrysotile gages (USGS Gage Nos. 9498500 and 9497500, respectively) that are located near the Highway 288 and Highway 60 Bridges, respectively, the discharge in this part of the reach is less than 400 cfs
8 The American Whitewater Association defines as Class IV rapid as follows:
Intense, powerful but predictable rapids requiring precise boat handling in turbulent water. Depending on the character of the river, it may feature large, unavoidable waves and holes or constricted passages demanding fast maneuvers under pressure. A fast, reliable eddy turn may be needed to initiate maneuvers, scout rapids, or rest. Rapids may require “must make” moves above dangerous hazards. Scouting may be necessary the first time down. Risk of injury to swimmers is moderate to high, and water conditions may make self-rescue difficult. Group assistance for rescue is often essential but requires practiced skills.
Declaration Navigability of the Upper and Lower Salt River
20
about 60 percent of the time, on average, over the entire year and about 20 percent of the time during the typical rafting season (Figure 15).
An approximately 3-mile section of the canyon-bound reach between RM 99 and RM 102 known as Gleason Flats is relatively unconfined, and thus, responds to large floods by developing a braided, multi-channel planform with highly variable flow depths, as conceptually described in Section 2.1. Even this portion of the canyon-bound reach contains a named rapid (Gleason Rapid, Figure 16) that would have limited navigability.
Figure 14. View looking upstream of Quartzite Rapid (lower, center) (Photo by B. Mussetter,
October 29, 2013).
Declaration Navigability of the Upper and Lower Salt River
21
Figure 15. Mean daily flow-duration curves for the Salt River near Roosevelt (USGS Gage
No. 9498500) and near Chrysotile (USGS Gage No. 9497500) gages for complete water years and during the primary whitewater rafting season (March 1 – May 15).
Figure 16. View looking upstream of the middle portion of Gleason Flats and Gleason Rapid
(Photo by B. Mussetter, October 29, 2013).
Gleason Rapid
Declaration Navigability of the Upper and Lower Salt River
22
2.2.2 Braided Downstream Reach
The portion of the Upper Salt River between Granite Reef and Stewart Mountain Dams is generally braided, with the braiding corridor occupying much or all of the valley bottom (Figure 17). A photo of the same area taken in 1934 shows the same braiding pattern, but with considerably less vegetation (Figure 18). The 29-foot high Granite Reef Dam is located at the downstream end of this reach (Figure 19). Completed in 1908, this dam would have been a man-made barrier to navigation at the date of Arizona’s statehood. The backwater effect of the dam extends about 2 miles upstream (Figure 20). Prior to construction of the dam, the backwater-affected portion of the reach would have had wide, braided characteristics that are similar to the remainder of the reach below Stewart Mountain Dam.
The photos shown in Figures 17 and 18 were taken after completion of the four upstream dams; thus, the geomorphic and vegetation characteristics of the river reflect the significant effects of the upstream flow regulation. Based on the data from the USGS near Roosevelt gage that is located upstream from Roosevelt Lake and the below Stewart Mountain Dam gage that reflects the effects of the regulation, the upstream facilities significantly reduce the annual peak discharges that create the disturbance regime that removes vegetation and drives the braiding process, but have a less significant effect on the total amount of flow passing through the reach (Figures 21 and 22). For the common period of record from Water Year (WY) 1935 through WY2013, the annual peak discharge at the near Roosevelt gage exceeded 13,300 cfs in half the years (i.e., the median discharge) and exceeded 60,000 cfs in 13 of the 79 years (~16 percent, or about 1 in 6 years); whereas, the median annual peak discharge at the below Stewart Mountain Dam gage was only 2,340 and 60,000 cfs was exceeded only once (WY1980; peak discharge of 64,000 cfs). In comparison, the average annual runoff volume past the near Roosevelt gage during this period was about 581,000 ac-ft, and about 667,000 ac-ft at the below Stewart Mountain Dam gage9. Prior to construction of the dams, large peak flows would have occurred in the downstream portion of the reach on a regular basis, just as they do under existing conditions in the canyon-bound, upstream portion of the reach, but with typically larger peak discharge due to the larger drainage area.
9Note that the drainage area above the near Roosevelt gage is 4,306 mi2, compared to 6,232 mi2 at the below Stewart
Mountain gage, an increase of about 45 percent between the two gages.
Declaration Navigability of the Upper and Lower Salt River
23
Figure 17. Aerial view of ~2-mile portion of Upper Salt River beginning ~1 mile upstream from
Verde River showing typical historic braiding pattern (Photo date November 1, 2010).
Figure 18. Aerial View of ~2-mile portion of Upper Salt River beginning ~1 mile upstream from
Verde River (Photo dated 1934).
800 ft
Declaration Navigability of the Upper and Lower Salt River
24
Figure 19. View looking upstream toward Granite Reef Dam (approximate center of photo)
(Photo by B. Mussetter, October 29, 2013).
Figure 20. View looking upstream of the backwater-affected reach upstream from Granite
Reef Dam (Photo by B. Mussetter, October 29, 2013).
Declaration Navigability of the Upper and Lower Salt River
25
Figure 21. Annual peak discharge at the Salt River near Chrysotile (USGS Gage No.
9497500), near Roosevelt (USGS Gage No. 9498500), and below Stewart Mountain Dam (USGS Gage No. 9502000) gages.
0
20
40
60
80
100
120
140
160
1915 1925 1935 1945 1955 1965 1975 1985 1995 2005
An
nu
al P
eak
Dis
char
ge (
cfs)
Tho
usa
nd
s
Water Year
Chrysotile
Roosevelt
below Stewart Mountain Dam
Declaration Navigability of the Upper and Lower Salt River
26
Figure 22. Annual runoff volume at the Salt River near Chrysotile (USGS Gage No. 9497500),
near Roosevelt (USGS Gage No. 9498500), and below Stewart Mountain Dam (USGS Gage No. 9502000) gages. Also shown are the annual runoff volumes at the Salt River at Roosevelt gage for the period from 1880 through 1913 (data from USGS, 1954).
As is true for most dryland rivers, there is strong correlation between the annual flood peak and the annual runoff in the Salt River (Figure 23). The annual runoff volumes at the historic Salt River at Roosevelt gage that was located at the approximate site of the existing Roosevelt Dam show runoff volumes exceeding 1 million ac-ft during 6 of the 22 years for which data are available between WY1889 and WY1913 (Figure 22); indicating that large floods occurred during these years. The largest annual flows (and presumably, largest annual peaks) occurred in WY1891 and WY1905-WY1907, when there were no significant upstream diversions and prior to completion of the water storage projects that include Roosevelt Dam. Based on this information, the portion of the Upper Salt River below present-day Stewart Mountain Dam was most likely strongly braided, with little in-channel vegetation at the date of Arizona’s statehood as a result of these floods.
The hydrologic history of the Salt River is very similar to that of the Gila and Verde Rivers, and all experienced large floods in the late-19th and early-20th centuries. Meko and Graybill (1995) reconstructed the annual flows in the Gila River in the vicinity of Safford using tree ring data. Their results show that the mid- to late-1800s corresponded to an extended period of low flows, but these were punctuated by periods of unusually high flows (Figure 24). The Meko and Graybill (1995) analysis clearly shows that, while some of the floods in the early-1900s were unusually large, the Gila River experienced large annual flow volumes, and thus, large floods prior to the dry period in the mid- to late-1800s. Similar floods likely occurred on the Salt River, and they
0.0
0.5
1.0
1.5
2.0
2.5
3.0
3.5
1885 1905 1925 1945 1965 1985 2005
An
nu
al R
un
off
Vo
lum
e (
ac-f
t)
Mill
ion
s
Water Year
Chrysotile
near Roosevelt
below Stewart Mountain Dam
at Roosevelt (historic)
Declaration Navigability of the Upper and Lower Salt River
27
Figure 23. Comparison of annual peak discharge and annual runoff volume at the Upper Salt River near Roosevelt gage (USGS Gage No. 9498500).
Figure 24. Time-series plot of Gila River annual discharge (1663-1914 from reconstruction of
Meko et al., 1995; 1915-2012 from recorded flows at USGS Gage No. 09448500, Gila River at Head of Safford Valley. Also shown are the periods of different typical channel widths identified by Burkham, 1972). Solid horizontal line is median, dashed lines are 10th and 90th percentiles (i.e., 10 percent of the values fall above and below these lines, respectively).
R² = 0.60
1000
10000
100000
100,000 1,000,000
An
nu
al P
eak
Dis
char
ge (
cfs)
Annual Volume (ac-ft)
Burkham (1972) Width Periods
Stat
eh
oo
d
4.5
5
5.5
6
6.5
7
1650 1700 1750 1800 1850 1900 1950 2000
Ru
no
ff V
olu
me
(lo
g10
ac-
ft)
Year
Recorded at Safford Gage
Reconstructed (Meko and Graybill, 1972)
Declaration Navigability of the Upper and Lower Salt River
28
would have caused the river to become wide and braided, similar to the character during the early-1900s and the ensuing drier period.
Although the effects of significant upstream flow regulation, that began with completion of Roosevelt Dam in 1911, on total flow volume are less than on the flood disturbance regime, it does significantly affect the duration and timing of the flows by reducing the duration of high and low discharges and increasing the duration of flows in the intermediate range (Figure 15). This has a compounding effect on the characteristics of the river that affect navigability because it severely limits the disturbance regime that occurred prior to the dams that created the wide, braided, and unvegetated channel, provides higher flow during certain periods to sustain the vegetation that grows on the braid bars and provides longer periods of intermediate magnitude flows for which depths might be suitable for navigation. The effects of flow regulation on increasing riparian vegetation and channel narrowing are well-documented in the literature (Shafroth et al., 1998; Grams and Schmidt, 2002; Hupp and Osterkamp, 1994; Williams and Wolman, 1984). As a result of these effects, the alluvial reach of the Upper Salt River between Stewart Mountain and Granite Reef Dams in its current condition would be much more likely to sustain navigation, as defined under the Arizona Revised Statutes, than it would have under natural conditions.
The Arizona Division 1 Court of Appeals found that ordinary condition of the river means the absence of major flooding or drought and natural condition means the absence of man-made dams, canals and other diversions (See Footnote 1). While it is reasonable to exclude the limited periods when the river is actually experiencing major flooding or drought when considering navigability, the effects of these periods on the long-term character of the river cannot be discounted. The wide, braided planform that is created by major flooding persists for a significant period and influences the form of the river throughout the ensuing low- to moderate flow periods. Extended droughts can also have a long-term impact on the character of the river, especially when followed by a major flood, because they tend to diminish the amount of riparian vegetation, making the river even more susceptible to widening and braiding during flooding.
2.2.3 Reservoir Reach
Construction of Roosevelt Dam was completed in 1911; thus, the dam, itself, would have been an impediment to navigation at the date of statehood. The specific characteristics of approximately 53-mile reach through the existing reservoirs at and prior to the date of Arizona’s statehood are less certain than the upstream canyon-bound reach and the downstream braided reach because historical information is limited and inundation by the reservoir prevents direct assessment of the characteristics of the valley floor. In spite of those limitations, the available information strongly suggests that this reach would also have been non-navigable at and prior to the date of statehood. A significant part of the inundated reach between the dams is canyon-bound; thus, would have very likely had geomorphic characteristics similar to the upstream reach, including rapids created by bedrock outcrops, tributary debris fans and colluvium (Figures 25 through 27). According to Gregory (1979) (as reported by Greenwald and Gilpin, 1997), an alluvial floodplain was present in the area occupied by Roosevelt Lake and this was the first place where water from the upper Salt River would have been available for canal irrigation. This portion of the Upper Salt River that is now inundated by Roosevelt Lake may have been similar to the downstream, alluvial reach and the upstream Gleason Flats reach that had a wide, braided character that would have also made navigation impractical using the watercraft in use at and prior to the date of Arizona’s statehood.
Declaration Navigability of the Upper and Lower Salt River
29
Figure 25. View looking downstream from approximately 2 miles below Roosevelt Dam
showing the canyon-bound character of the reach (Photo by B. Mussetter, October 29, 2013). Note that the water shown in this photo is much deeper than it would have been under ordinary and natural conditions because of the backwater effects of Horse Mesa Dam.
Declaration Navigability of the Upper and Lower Salt River
30
Figure 26. View looking downstream from approximately 4 miles below Horse Mesa Dam
showing the canyon-bound character of the reach (Photo by B. Mussetter, October 29, 2013). Note that the water shown in this photo is much deeper than it would have been under ordinary and natural conditions because of the backwater effects of Mormon Flat Dam.
Declaration Navigability of the Upper and Lower Salt River
31
Figure 27. View looking upstream of Mormon Flat Dam showing the canyon-bound character
of the reach (Photo by B. Mussetter, October 29, 2013). Note that the water shown in this photo downstream from the dam is much deeper than it would have been under ordinary and natural conditions because of the backwater effects of Stewart Mountain Dam.
2.2.4 Conclusion
Based on the above information, it is my opinion that the Upper Salt River would not have been suitable for navigation under ordinary and natural conditions at and prior to the date of Arizona’s statehood. Specific aspects of this overall conclusion are described in more in Section 1.2 at the beginning of this declaration.
2.3 Historical (and Modern-day) Character of the Lower Salt River
The modern-day character of the approximately 40-mile reach of the Lower Salt River from Granite Reef Dam to the confluence with the Gila River is significantly different from the historical character in a variety of ways that are important to the question of whether it was navigable under ordinary and natural conditions at the date of Arizona’s statehood. Under natural conditions, the channel had a sand-bed, braided configuration, and human-induced hydrologic changes have converted it to a compound channel, with a slightly meandering low-flow channel nested inside a wider braided channel (Graf et al., 1994). Much of the sand that previously made up the bed has been stripped off, leaving behind a coarser bed that is dominated by gravel and cobbles. The riparian corridor along the low-flow channel is more robust than under natural conditions. These
Declaration Navigability of the Upper and Lower Salt River
32
changes result from a combination of upstream water and sediment storage that have changed the annual flow patterns and reduced the amount of sediment delivered to the reach and direct human activities including extensive sand and gravel mining, multiple highway crossings and other urbanization effects.
Under natural conditions, flows were typically elevated above baseflow during March, April and early-May due to snowmelt from the higher elevation portions of the basin. Monsoonal thunderstorms periodically increased the discharge for short periods during late-summer and early-fall. Winter, cyclonic storms that typically have a longer duration and wider geographic coverage than the monsoonal storms also caused large, but still relatively short-duration (compared to the snowmelt hydrograph) floods. This general pattern can be clearly seen in the median mean daily flow hydrograph from the long-term records at the near Roosevelt gage where flows are not significantly impacted by upstream water management10 (Figure 28). Although the drainage area at the near Roosevelt gage is considerably smaller than the total drainage area of the portion of the Lower Salt River upstream from the below Stewart Mountain Dam gage (4,306 mi2 versus 6,232 mi2), the seasonal runoff patterns prior to upstream flow regulation were similar. Under modern (i.e., post-statehood) conditions, the snowmelt hydrograph is essentially captured by the upstream reservoirs, and these flows are released at a lower rate (but higher than natural baseflows) and for a longer period of time beginning in early-March and ending in late-November (Figure 28).
As discussed above, the Salt River has been subjected to large floods that create the disturbance regime that re-sets the flood- and low-flow channels on a relatively regular basis. Under modern, regulated flow conditions, the 10-year return period peak discharge ranges from 60,000 cfs at Granite Reef Dam to 51,000 cfs at 67th Avenue (~6 miles upstream from the Gila River), and the 100-year flood peak ranges from 175,000 cfs to 164,000 cfs at those locations, respectively [Federal Emergency Management Agency (FEMA), 2013]. Although several large floods have occurred in the Lower Salt River since construction of the upstream water-storage system, the reservoirs tend to dampen the flood peak discharges compared to natural conditions. The largest recorded flood occurred in February, 1891, with a peak discharge of 300,000 cfs at the Jointhead Dam gage that was located just upstream from the present Sky Harbor Airport and Highway 143 Bridge (Figure 29). A flood peak of 200,000 cfs was recorded at this location in November 1905, and floods exceeding 100,000 cfs occurred in February 1890, April 1905, January 1916, February 1920, and on three occasions in the winters of 1978, 1979 and 1980. Based on paleoflood analysis of slackwater deposits in the historic Hohokam irrigation canals, Fuller (1987) concluded that flood peak discharges exceeding the approximate bankfull capacity of the Lower Salt River flood channel of ~175,000 cfs occurred at least 27 times over the past 1,100 years, or about once every 40 years, on average.
Graf (1983) found that the bed and bank material in the Lower Salt River, as it existed in the early-1980s, was fully-mobilized at flows greater than about 20,000 cfs. He also concluded that the Lower Salt River channel has downcut through three distinct layers of sediment, that include the layer of coarse sand that was present on the surface prior to the 1965 flood, an approximately 15-foot thick layer of cobbles with median diameters up to 1.5 feet that underlay the sand layer, and into the third layer that consists of a mixture of sands and gravels that makes up the present river bed (Graf, 1983). The downcutting occurred through a combination of sand and gravel mining and lack of sediment supply caused by trapping in the upstream reservoirs.
10Notes from 2013 Water-data Report for USGS Gage 09498500 SALT RIVER NEAR ROOSEVELT, AZ: Several
small diversions for irrigation of about 4,000 acres above station and two transbasin diversions above station, one into basin from Show Low Creek and one out of basin to Willow Creek. The imported and diverted volumes for the transbasin diversions are relatively small compared to the annual runoff volumes (Lucas Shaw, Salt River Project, personal communication, 2015).
Declaration Navigability of the Upper and Lower Salt River
33
The long-duration intermediate flow releases during the spring, summer and early-fall under post-statehood conditions have reduced the effects of periodic floods that created the disturbance regime responsible for the natural, braided character, and it also irrigates the riparian vegetation, resulting in a more robust riparian corridor that further limits braiding potential. Eyewitness accounts and historical photographs reported by Graf, et al. (1994) indicate that much of the channel had little or no vegetation, with bands of cottonwood and willow along the edges, prior to modern development. The lowest terrace, which in many cases may have acted as a flood plain, was often covered by mesquite bosques. As a result, the banks of both the low-flow and flood channels would have been more erodible, and therefore, more active and unstable, under natural conditions than under post-statehood conditions.
Figure 28. Median and mean discharges (based on mean daily flows) for the periods of record
at the Salt River below Stewart Mountain Dam (USGS Gage No. 09502000; 1925-2014) and near Roosevelt (USGS Gage No. 09498500; 1914-2014) gages.
Declaration Navigability of the Upper and Lower Salt River
34
Figure 29. Annual peak discharges between 1890 and 2014 at key mainstem stream gages
on the Salt and Verde Rivers.
The gradient of the river between Granite Reef Dam and the Gila River is considerably flatter than the upstream reach [~9.3 ft/mi, compared to the average pre-dam gradient of about 15.5 ft/mi in the 74-mile reach between Stewart Mountain Dam and Sleeper Rapid (ASLD Segments 3 and 4) and 25.1 ft/mi in the 32-mile segment between Sleeper Rapid and Highway 60 (ASLD Segment 3)] (Figure 7). At the time of the 1903-1904 mapping, the river was about one mile wide in the approximately 16-mile reach between Granite Reef Dam and the valley constriction at Tempe Butte. The wide braided character of the river in this portion of the reach strongly suggest that it was a zone of deposition for the relatively high sediment loads delivered from the Upper Salt and Verde Rivers due to flattening of the channel gradient and loss of lateral confinement as the river enters the Lower Salt River Valley. The 24-mile reach between Tempe Butte and the confluence with the Gila River had similar characteristics, with overall river width ranging from 0.5 mi to 1.25 mi in 1903/1904.
Chuang and Figueredo (1998) determined that the portion of the Lower Salt River channel between Phoenix (48th Street) and Tempe (Priest Drive) consisted of about 14 percent low-water channel, 54 percent high-water channel, and 32 percent islands and bars in 1935, typical of a braided channel (Figures 30 and 31). Based on historical aerial photographs and river characteristics shown on the earlier mapping, the relative proportions of these features was probably very similar under natural conditions throughout the unconfined portions of the Lower Salt River. Remnants of the braided pattern persist today (Figures 32 and 33).
0
50
100
150
200
250
300
350
18
90
18
95
19
00
19
05
19
10
19
15
19
20
19
25
19
30
19
35
19
40
19
45
19
50
19
55
19
60
19
65
19
70
19
75
19
80
19
85
19
90
19
95
20
00
20
05
20
10
Peak
Dis
char
ge (
cfs)
Tho
usa
nd
s
Water Year
Chyrsotile (09497500)
Roosevelt (09498500)
below Stewart Mountain (09502000)
Verde below Tangle Creek (09508500)
Jointhead Dam (9512170)
Declaration Navigability of the Upper and Lower Salt River
35
Figure 30. A 1934 aerial photograph of Salt River in Section 30, T2N, R6E (Mesa
Quadrangle). Maximum river width is 4,800 feet. Note islands, bars, and low-water channels (from Schumm, 2003).
Declaration Navigability of the Upper and Lower Salt River
36
Figure 31. A 1934 aerial photograph of Salt River in Section 24, T1N, R2E (Phoenix
Quadrangle). Note islands, bars, and low-flow channels. Channel is about one mile wide (from Schumm, 2003).
Declaration Navigability of the Upper and Lower Salt River
37
Figure 32. A 2002 aerial photograph of Salt River in Section 25, T2N, R5E. Much of the
channel has been modified by gravel mining; however, in the south half of the channel, a large island, bars, and low-water channels remain. Original width of channel was 3,500 feet; 1,600 feet of channel remains (from Schumm, 2003).
Declaration Navigability of the Upper and Lower Salt River
38
Figure 33. A 2002 aerial photograph of Salt River in Section 32, T1N, R1E. Channel is about
Declaration Navigability of the Upper and Lower Salt River
39
An indication of the nature of Salt River at the time of Arizona statehood can be obtained from the 1903-1904 topographic maps (Figures 34 and 35). On these maps, a single low-water channel is identified by the blue color, and this channel lies within a stippled pattern representing the sand- and gravel-bedded flood channel. The pattern suggests a river width often in excess of one mile, but the blue pattern indicates a much narrower low-water channel. General Land Office surveys conducted in 1870 show that the Salt River consisted of multiple channels that occupied essentially the entire width of the stippled pattern shown on the 1903-1904 maps. The low-water channels shifted within the main channel, and often more than one low-water channel was present.
Considerable testimony has been presented to ANSAC on behalf of the State of Arizona about the boatability of the Gila and Verde River using small, modern, shallow-draft watercraft, and the disclosures by the State indicate that similar testimony will be presented about the Lower Salt River. This “boatability” has been used to argue that the rivers were navigable in their ordinary and natural condition, as a highway for commerce, over which trade and travel were or could have been conducted in customary modes of trade and travel on water [A.R.S. §37-1101(5)]. While there is little doubt that modern, shallow-draft watercraft can, and are, used for recreational purposes on portions of the Lower Salt River today, the natural river was considerably less boatable than it is under modern conditions. The U.S. Supreme Court in PPL Montana, LLC v. Montana found that …evidence [of present-day, primarily recreational use] must be confined to that which shows the river could sustain the kinds of commercial use that, as a realistic matter, might have occurred at the time of statehood. While the Lower Salt River may have been boatable at certain limited times under ordinary and natural conditions, the highly-unpredictable hydrology, the braided nature of the high-flow channel, and small size and dynamic nature of the low-flow channel, including the tendency to shift laterally by thousands of feet during a single flood event, strongly suggest that its use as a highway for commerce in customary modes of trade and travel on water would have been impractical.
Declaration Navigability of the Upper and Lower Salt River
40
Figure 34. Salt River, as shown on 1903-04, 1912 USGS topographic maps of a portion of
the Phoenix Quadrangle, southeast of Phoenix.
Figure 35. Salt River as shown on 1903-04, 1912 USGS topographic maps of a portion of the Phoenix Quadrangle southwest of Phoenix.
Declaration Navigability of the Upper and Lower Salt River
41
3 References
Baker, V.R., 1977. Stream Channel Response to Floods, with Examples from Central Texas. Geologist Society of America Bulletin, v. 86, pp. 1057-1071.
Bryan, K., 1927. Channel erosion of the Rio Salado, Socorro County, New Mexico. U.S. Geological Survey Bull. 77, pp. 1-11.
Burkham, D.E., 1972. Channel changes of the Gila River in Safford Valley, Arizona. U.S. Geological Survey Prof. Paper 655-G, 24 p.
Burkham, D.E., 1981. Uncertainties resulting from changes in river form. Jour. Hydraulics Div., Amer. Soc. Civil Engrs, v. 107, pp. 593-610.
Chuang, F.C. and Figueredo, P.H., 1998. 48th Street Crossing, Upper Reach: Priest Drive to 48th Street. In Graf, W.L. et al. (eds), Recent channel changes in the Salt River, Phoenix, Arizona, pp. 54-66.
Federal Emergency Management Agency (FEMA), 2013. Flood Insurance Study, Maricopa County, Arizona and Incorporated Areas. Volume 1 of 23, October 16.
Fuller, J.E., 1987. Paleoflood hydrology of the alluvial Salt River, Tempe, Arizona. Master of Science Thesis, University of Arizona, 92 p.
Glenn, L.C., 1925. Geology and groundwater resources of Meade County, Kansas. Kansas Geological Survey Bull. 45, 152 p.
Graf, W.L., 1979. Rapids in canyon rivers, Journal of Geology, v. 87, pp. 533-551.
Graf, W.L., 1983. Flood-related Channel Change in an Arid-region River. Earth Surface Process and Landforms, v. 8, pp. 125-139.
Graf, W.L., 2002. Fluvial Processes in Dryland Rivers. The Blackburn Press, Section 5.4, pp. 196-218.
Graf, W.L., Beyer, P.J., and Wasklewicz, T.A., 1994. Geomorphic Assessment of the Lower Salt River, Central Arizona. Prepared for the U.S. Army Corps of Engineers, Los Angeles District, Phoenix, Arizona, October.
Grams, P.E. and Schmidt, J.C., 2002. Stream flow regulation and multi-level flood plain formation: Channel narrowing on the aggrading Green River in eastern Unita Mountains, Colorado and Utah, Geomorphology, v. 44, pp. 337-360.
Gregory, D.A. 1979. The Tonto-Roosevelt Area. In An Archaeological Survey of the Cholla-Saguaro Transmission Line Corridor, Lynne S. Teague and Linda Mayro (eds), Arizona State Museum Archaeological Series No. 135, v. 1, University of Arizona, pp. 175-265.
Greenwald D.M. and D. Gilpin, 1997. Archaeological Overview of the Upper Salt River Valley, in Arizona Stream Navigability Study for the Upper Salt River, Section 2, Final Report, Section 2, Arizona State Land Department, 22 p.
Hereford, R., Thompson, K.S., and Burke, K.J., 1997. Dating Prehistoric Tributary Debris Fans, Colorado River, Grand Canyon Nation Park, Arizona with Implications for Channel Evolution and River Navigability, Open-File Report 97-167, Bureau of Reclamation, Flagstaff, AZ, 20 p.
Howard and Dolan, 1981. Geomorphology of the Colorado River in the Grand Canyon, Journal of Geology, v. 89, pp. 269-298.
Declaration Navigability of the Upper and Lower Salt River
42
Huckleberry, G.A., 1993. Late-Holocene stream dynamics on the middle Gila River, Pinal County, Arizona. Unpublished dissertation, Univ. of Arizona, 135 p.
Hupp, C.R. and Osterkamp, W.R., 1994. Riparian vegetation and fluvial geomorphic processes. Geomorphology, v. 14, pp. 277-295.
Meko, D. and Graybill, D.A., 1995. Tree-ring Reconstruction of Upper Gila River Discharge, Water Resources Bulletin, v. 31, no.4, pp. 605-616.
O’Connor et al., 2003. Quaternary Geology and Geomorphology of the Lower Deschutes River Canyon, Oregon, American Geophysical Union, Water Science and Applications 7, pp. 77-98.
Schumm, S.A., 1981. Evolution and response of the fluvial system: Sedimentologic implications, Soc. Economic Paleontologists and Mineralogists Spec. Pub. 31, pp. 19-29.
Schumm, S.A., 2003. Geomorphic Character of the Lower Salt River, Mussetter Engineering, Inc., March, 16 p.
Schumm, S.A., 2005. Geomorphic Character of the Upper Salt River, Mussetter Engineering, Inc., January, 15 p.
Schumm, S.A. and Lichty, R.W., 1963. Channel widening and flood-plain construction along Cimarron River in southwestern Kansas. U.S. Geol. Survey Prof. Paper 352-D, pp. 71-88.
Sellards, E.H., 1923. Geologic and soil studies on the alluvial lands of the Red River valley. Texas Univ. Bull. 2327, pp. 27-87.
Shafroth, P.B., Auble, G.T., Stromberg, J.C., and Patten, D.T., 1998. Establishment of woody riparian vegetation in relation to annual patterns of streamflow, Bill Williams River, Arizona, Wetlands, v. 18, No. 4, pp. 577-590.
Smith, H.T.U., 1940. Notes on historic changes in stream courses of western Kansas, with a plea for additional data. Kansas Acad. Sci. Trans., v. 43, pp. 299-300.
U.S. Forest Service, 1995. Recreation Opportunity Guide, Upper Salt River, Tonto National Forest, 22 p.
U.S. Geological Survey, 1954. Compilation of records of surface waters of the United States through September 1950, Part 9, Colorado River Basin. Water Supply Paper 1313, 749 p.
Whitis, D. and Vinson, B., 2014. Guide to the Upper Salt River, Arizona. 28 pages with 7 maps, 53 miles, color photographs, and shaded topographic relief. ISBN-13:978-09913896-0-5.
Williams, G.P. and Wolman, M.G., 1984. Downstream Effects of Dams on Alluvial Rivers, U.S. Geological Survey Professional Paper 1286, 64 p.