Trey Cowan, Oil & Gas Analyst Tom Sanzillo, Director of Financial Analysis July 2021 1 Deep in the Heart of Texas, Oil and Gas Losing Economic Luster Executive Summary Texas regulators, lawmakers and opinion leaders emphasize an upbeat storyline for the state’s oil and gas industry. They point to the state’s dominant position in the national energy sector. Texas hosts 30 percent of U.S. refining capacity and 75 percent of the nation’s petrochemical production. 1 The state is responsible for 20 percent of total U.S. exports, 2 and more than one-third of Texas exports can be directly traced to the state’s energy sector. 3 Those impressive economic contributions, however, obscure the reality that oil and gas companies no longer drive the state’s economic growth. To position the state for continued success in an evolving economy, Texas policymakers must recognize that the oil and gas industry is in decline. The economic data now point to significant deterioration in the industry and its tax contributions, employment levels, and overall contribution to the state’s economy. This is not a potential risk that might unfold sometime in the distant future. It is a current economic reality, grounded in facts: • In 1981, the oil and gas industry was responsible for 21% of the Texas gross state product. Today, that portion has dropped by more than half, to just 10%. • The oil and gas industry accounted for 28% of state tax revenues in 1981. Oil and gas annual revenues hit bottom in 1999, contributing only 3%. Although the sector’s state tax contributions have rebounded from the 1999 lows, the industry has contributed 10% or less annually to state tax revenues for the last 20 years. • From 2010 to 2014, oil and gas companies contributed an average of $3.1 billion annually in property taxes to local governments. Since 2015, average annual collections have fallen to $2.3 billion, even as total statewide property tax collections have increased. • The state’s economy has produced steady employment growth at an annual rate of 2.3% over the last 30 years, while oil and gas sector employment has declined. Opinions of international energy experts, investment houses, government and industry leaders, and oil and gas shareholders have 1 Federal Reserve Bank of Dallas. Your Texas Economy. April 19, 2021. 2 Ibid. 3 United States Trade Representative. State Benefits of Trade: Texas. May 13, 2021.
Transcript
Trey Cowan, Oil & Gas Analyst Tom Sanzillo, Director of Financial Analysis July 2021
1
Deep in the Heart of Texas, Oil and Gas Losing Economic Luster
Executive Summary Texas regulators, lawmakers and opinion leaders emphasize an upbeat storyline for the state’s oil and gas industry. They point to the state’s dominant position in the national energy sector. Texas hosts 30 percent of U.S. refining capacity and 75 percent of the nation’s petrochemical production.1 The state is responsible for 20 percent of total U.S. exports,2 and more than one-third of Texas exports can be directly traced to the state’s energy sector.3 Those impressive economic contributions, however, obscure the reality that oil and gas companies no longer drive the state’s economic growth.
To position the state for continued success in an evolving economy, Texas policymakers must recognize that the oil and gas industry is in decline. The economic data now point to significant deterioration in the industry and its tax contributions, employment levels, and overall contribution to the state’s economy.
This is not a potential risk that might unfold sometime in the distant future. It is a current economic reality, grounded in facts:
• In 1981, the oil and gas industry was responsible for 21% of the Texas gross state product. Today, that portion has dropped by more than half, to just 10%.
• The oil and gas industry accounted for 28% of state tax revenues in 1981. Oil and gas annual revenues hit bottom in 1999, contributing only 3%. Although the sector’s state tax contributions have rebounded from the 1999 lows, the industry has contributed 10% or less annually to state tax revenues for the last 20 years.
• From 2010 to 2014, oil and gas companies contributed an average of $3.1 billion annually in property taxes to local governments. Since 2015, average annual collections have fallen to $2.3 billion, even as total statewide property tax collections have increased.
• The state’s economy has produced steady employment growth at an annual rate of 2.3% over the last 30 years, while oil and gas sector employment has declined. Opinions of international energy experts, investment houses, government and industry leaders, and oil and gas shareholders have
1 Federal Reserve Bank of Dallas. Your Texas Economy. April 19, 2021. 2 Ibid. 3 United States Trade Representative. State Benefits of Trade: Texas. May 13, 2021.
Deep in the Heart of Texas, Oil and Gas Losing Economic Luster
2
crystallized into a global consensus: The oil and gas sector faces decreased demand, shifts in the use of oil and gas, and lower profits.
• Just as investors reconfigure their portfolio weightings to adjust to market conditions, Texas policymakers should consider the decreasing significance of the oil and gas industry and set the state’s future course based on the latest information and most likely future scenarios.
The Texas economy is no longer as dependent on the fossil fuel industry as it was 40 years ago. It has grown and diversified over time, as disruptive technologies have transformed what previously were considered stable industries into weaker economic contributors. Those disruptions continue. The oil and gas sector now faces unprecedented competition from renewable energy in the electricity sector. At the same time, market forces and evolving policies have unleashed competitive challenges to oil and gas in both transportation and petrochemicals.
This report examines the proportionally declining contributions from the oil and gas sector to the economy and fiscal strength of Texas. These trends create challenges. Solutions to the challenges exist, but the first step is recognizing the problem.
IEEFA concludes that the state’s mission of advancing the interests of the people of Texas requires a more concerted effort to diversify its economic base, especially in the counties most vulnerable to the decline of the oil and gas industry.
Deep in the Heart of Texas, Oil and Gas Losing Economic Luster
Background: Oil and Gas Sector in Decline ................................................................... 4
II. The Oil and Gas Sector is Declining as a Driver of the Texas Economy ........ 5
III. The Oil and Gas Industry is Declining as a Driver of State and Local Property Tax and Severance Tax ....................................................................................... 6
IV. Employment in the Texas Oil and Gas Sector Is Lagging Behind Other Sectors of the State’s Economy ........................................................................................ 13
V. The Outlook for the Oil and Gas Sector .................................................................... 15
VI. Diversification Is the Most Promising Solution for the Texas Economy ... 20
Appendix I: Statistics for Counties with Current Drilling Activity ..................... 23
Appendix II: Previous IEEFA Work Regarding the Energy Industry in Texas ...................................................................................................................................... 24
About the Authors ................................................................................................................. 29
Deep in the Heart of Texas, Oil and Gas Losing Economic Luster
4
Background: Oil and Gas Sector in Decline For Texans, the past 18 months were marred by a global pandemic, a debilitating winter storm, and oil prices below zero. Now—with the pandemic potentially in retreat, warm summer temperatures and oil prices on the rise—it might seem as if there is a good reason to simply forget about 2020 and the unruly winter.
That would be a mistake.
The negative oil prices were a red flag that something was wrong in the oil and gas sector. Amid concern over cratering demand due to the global COVID pandemic, Saudi Arabia and Russia entered into a war over prices and market share that drove U.S. oil prices into negative territory. That price war revealed that the Texas energy sector was vulnerable to global economic and political forces far beyond its control.
Scott Sheffield, chief executive of Pioneer Natural Resources, forcefully argued that the industry did not have a plan to deal with this vulnerability.4 At the time, he was pressing for the Texas Railroad Commission to prevent the overproduction of oil. The commission rejected Pioneer’s plea and did not curb production. Much of the discussion that took place barely a year ago has been forgotten.
The price war was a warning, but several other factors constitute red flags for the industry and for the state:
• The oil and gas industry is in financial decline and has been for most of the last decade.5
• Competitive pressures from oil and gas producers outside of Texas, particularly state-owned foreign enterprises, have changed the landscape.6
• New technologies are proving disruptive to the oil and gas demand assumptions that drive investment—solar and wind in the electricity sector; new technology in building heating, electric vehicles and the transport sector; and recycling in the petrochemical sector.7
• Concern is rising in the financial sector that the cumulative financial and climate risks in the oil and gas sector are unsustainable.8
The continued development of exports and a perceived long-term growth trend for the petrochemical industry are somewhat plausible factors mitigating these red flags. Both of these arguments, however, depend on a long-term low oil and gas price environment. Thus, the logic for continuous growth for either exports or petrochemicals seems tenuous.
4 CNBC. Crude tanks, oil stocks rally. April 6, 2020. 5 IEEFA. New Mexico’s Risky Reliance on Oil Revenue Must Change—Industry Fundamentals Point to Long-Term Decline. October 2020. 6 CNBC. 5 charts that explain the Saudi Arabia-Russia oil price war so far. April 1, 2020. 7 Deloitte. Navigating the energy transition from disruption to growth. May 27, 2020. 8 McKinsey & Company. Banking imperatives for managing climate risk. June 2020.
Deep in the Heart of Texas, Oil and Gas Losing Economic Luster
5
These long-term risks are already at play in Texas.
II. The Oil and Gas Sector Is Declining as a Driver of the Texas Economy The Texas economy has diversified over the past 40 years, substantially reducing its dependence on the oil and gas sector. In 1981, industries directly associated with the exploration and production of crude oil, natural gas and natural gas liquids dominated the Texas economy, representing 21 percent of the state’s gross product and ranking as the top driver of its gross state product. By 2019, the most recent year for which complete data from the Bureau of Economic Analysis (BEA) are available, the oil and gas sector’s share of the state’s gross product had shrunk by more than half, to 10 percent. Rather than leading the sectors that contribute to the state’s economy, the oil and gas sector now ranks sixth among the 10 major drivers of the state’s gross product.
Figure 1: Changes in Texas Gross State Product Drivers from 1981-2019
Source: Bureau of Economic Analysis. Interactive Data Tables. May 2021.
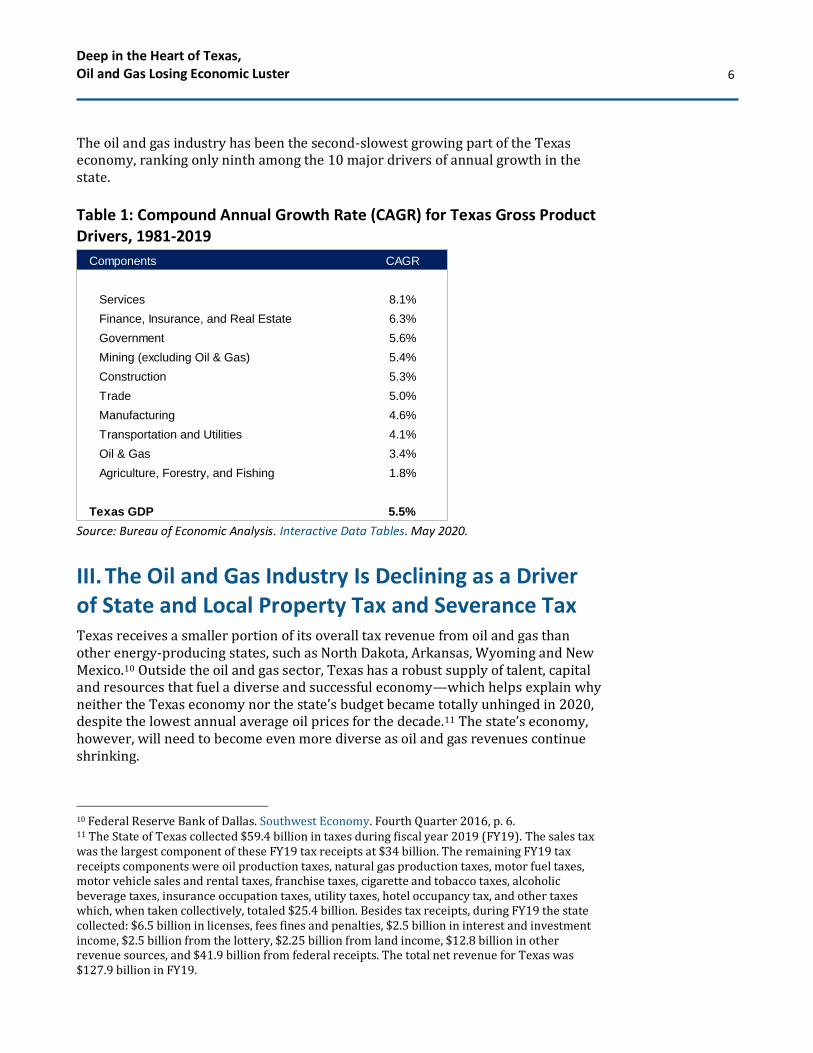
Services account for a large part of the state’s diversification from fossil fuels over the past four decades. Its share has leapt from 11 percent to 28 percent as the oil and gas industry’s economic importance waned. Sub-industries within the services component of the Texas gross product include professional and business services, management of companies and enterprises, educational services, computer systems, healthcare, food services, accommodation and entertainment.9 Collectively, these services have grown rapidly (by 8 percent compounded annually from 1981 to 2019), and this complements the strong overall employment growth in Texas.
The next largest component of the Texas economy, behind services, is the Finance, Insurance, and Real Estate (FIRE) sector, which has grown at a compounded pace of 6.3 percent since 1981 to make up 16 percent of the state’s gross product in 2019.
9 Bureau of Economic Analysis. Gross Domestic Product by State Estimation Methodology. 2017.
Deep in the Heart of Texas, Oil and Gas Losing Economic Luster
6
The oil and gas industry has been the second-slowest growing part of the Texas economy, ranking only ninth among the 10 major drivers of annual growth in the state.
Source: Bureau of Economic Analysis. Interactive Data Tables. May 2020.
III. The Oil and Gas Industry Is Declining as a Driver of State and Local Property Tax and Severance Tax Texas receives a smaller portion of its overall tax revenue from oil and gas than other energy-producing states, such as North Dakota, Arkansas, Wyoming and New Mexico.10 Outside the oil and gas sector, Texas has a robust supply of talent, capital and resources that fuel a diverse and successful economy—which helps explain why neither the Texas economy nor the state’s budget became totally unhinged in 2020, despite the lowest annual average oil prices for the decade.11 The state’s economy, however, will need to become even more diverse as oil and gas revenues continue shrinking.
10 Federal Reserve Bank of Dallas. Southwest Economy. Fourth Quarter 2016, p. 6. 11 The State of Texas collected $59.4 billion in taxes during fiscal year 2019 (FY19). The sales tax was the largest component of these FY19 tax receipts at $34 billion. The remaining FY19 tax receipts components were oil production taxes, natural gas production taxes, motor fuel taxes, motor vehicle sales and rental taxes, franchise taxes, cigarette and tobacco taxes, alcoholic beverage taxes, insurance occupation taxes, utility taxes, hotel occupancy tax, and other taxes which, when taken collectively, totaled $25.4 billion. Besides tax receipts, during FY19 the state collected: $6.5 billion in licenses, fees fines and penalties, $2.5 billion in interest and investment income, $2.5 billion from the lottery, $2.25 billion from land income, $12.8 billion in other revenue sources, and $41.9 billion from federal receipts. The total net revenue for Texas was $127.9 billion in FY19.
Deep in the Heart of Texas, Oil and Gas Losing Economic Luster
7
A. Oil and Gas Property Tax Contributions
As the Texas economy has trended toward greater diversity, the oil and gas sector has played a smaller role as a statewide resource. An examination of property tax trends highlights the risk to localities that continue to rely on oil and gas as the basis for the economy.
Property taxes in Texas generate more revenue for the state than any other tax.12 They are set by localities and are a major source of revenue for school districts, cities, counties, special districts and other taxing units whose budgets depend heavily on property tax revenues.13
Trends in the market and the taxable value of real estate are the building blocks of the property tax. The market value is a measure of the price at which a parcel of real estate can sell on the market in an arm’s-length transaction. The taxable value of real estate takes into consideration exemptions and other legally established reductions in the market value. The taxable value is then multiplied by the tax rate to determine the annual tax owed for an individual parcel of land.14
The total market value of real estate in Texas is highly responsive to overall trends in the economy. Texas has a classification category in its property tax code for oil and gas properties that allows for easy identification of market and assessed value amounts by category.
Table 2 shows that the statewide market value of Texas real estate has increased since 2010 on a modest, stable trajectory through various business cycles. The oil and gas market value is tied more closely to fluctuations in the price of oil. Consistent with the gradual move of the Texas economy away from oil and gas and the deterioration in the severance tax revenues derived from oil and gas extraction, the value of taxable oil and gas property has also become a smaller portion of overall property tax valuations in the state.
12 Texas Comptroller of Public Accounts. Biennial Property Tax Report. December 2020. 13 In FY19, over 4,200 taxing units (a figure that has grown over time) in Texas were primarily dependent on property taxes for funding. Prior to 1981, each of the taxing units in Texas appraised and imposed property taxes independently of one another. The legislature streamlined this in 1981 by creating appraisal districts that corresponded to each county’s jurisdiction with the exception of Potter and Randall Counties that share an appraisal district. 14 Texas Comptroller of Public Accounts. Texas Property Tax Basics. June 2020.
Deep in the Heart of Texas, Oil and Gas Losing Economic Luster
8
Table 2: Oil and Gas Market and Taxable Value as a Percentage of
Statewide Market and Taxable Values ($ millions)15
Source: Texas Comptroller of Public Accounts. Biennial Property Tax Report. December 2012, 2014, 2016, 2018, 2020.
Splitting the decade into halves, we see that the annual average value for taxable oil and gas properties as a percentage of the state’s total taxable properties fell from a 7% average in the first five years to just a 4% average of taxable values during the past five years ending 2019. Oil prices were significantly different over these two five-year periods. Between 2010 and 2014, oil prices averaged $92 per barrel, and fell 42% in the subsequent five years, to average of $53 per barrel. Again, this large average price discrepancy for oil explains why oil and gas property taxes declined by $3.5 billion when comparing these two five-year periods (an estimated $15.5 billion collected from oil and gas property between 2010-2014, compared with an estimated $12 billion collected between 2015-2019).
15 Texas Comptroller of Public Accounts. Biennial Property Tax Report. December 2012, 2014, 2016, 2018, 2020. Also see: EIA. Petroleum and Other Liquids Data. June 2021.
Since 2010, statewide property tax collections in Texas, like the path of the state economy, reflect a steady, modest growth. Oil and gas property tax collections, on the other hand, have fluctuated annually and deteriorated over time. During this decade, the annual collections from the oil and gas sector fluctuated between the peak of $3.9 billion in 2014 and the low of $1.6 billion in 2016, varying in conjunction with oil and gas prices. Between 2010 and 2014, the annual average oil and gas collection was $3.1 billion, but it deteriorated to an average annual collection of $2.4 billion between 2015 and 2019.
Local Reliance on the Oil and Gas Industry
Because property tax is a source of revenue for local government, the risk related to the decline in oil and gas property tax collections is that fewer funds will be available for school districts, counties, and cities that rely on the property tax as a principal source of revenue. IEEFA compared population and property tax trends across six counties whose economies relied heavily on oil and natural gas production with six counties whose economies were more diversified.
The counties with diverse industries we selected were Bexar, Harris, Lubbock, Montgomery, Travis and Walker counties.16 The counties reviewed that relied on oil and natural gas production for a meaningful part of their economies were Andrews, Brazoria, Karnes, Midland, Panola, and Wharton counties.17
16 Texas Railroad Commission. Oil & Gas Production Query Data. 2019. 17 Ibid.
Deep in the Heart of Texas, Oil and Gas Losing Economic Luster
10
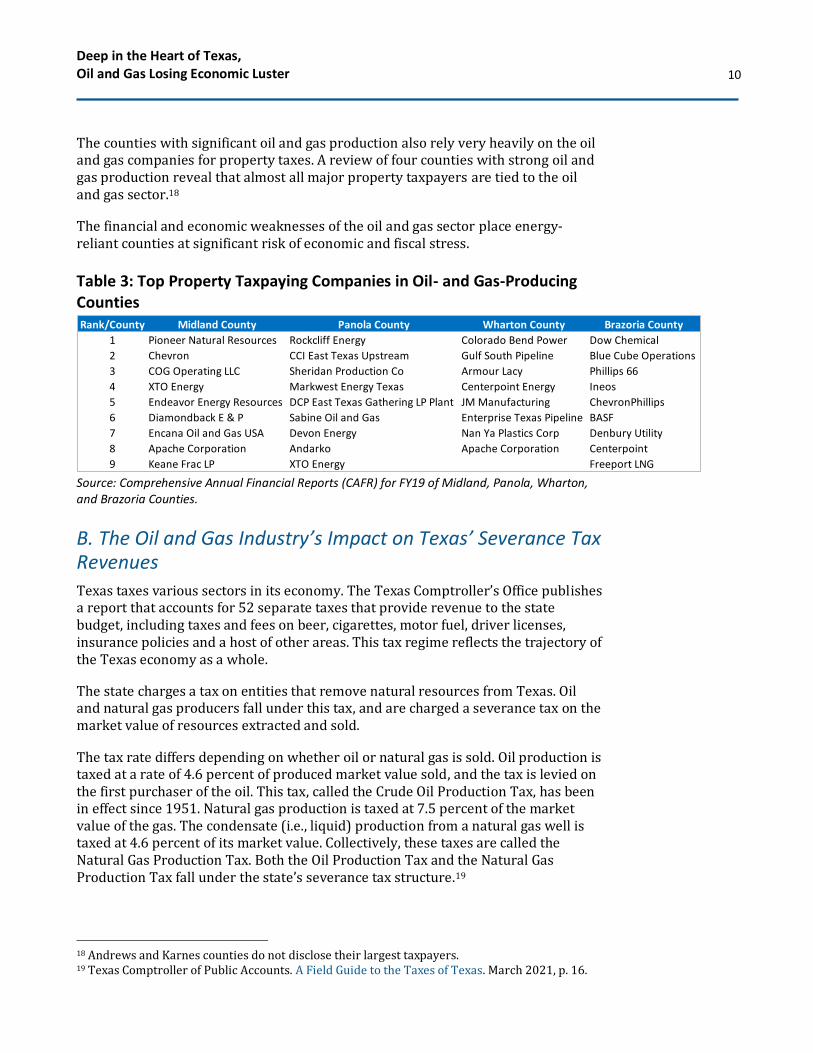
The counties with significant oil and gas production also rely very heavily on the oil and gas companies for property taxes. A review of four counties with strong oil and gas production reveal that almost all major property taxpayers are tied to the oil and gas sector.18
The financial and economic weaknesses of the oil and gas sector place energy-reliant counties at significant risk of economic and fiscal stress.
Table 3: Top Property Taxpaying Companies in Oil- and Gas-Producing Counties
Source: Comprehensive Annual Financial Reports (CAFR) for FY19 of Midland, Panola, Wharton, and Brazoria Counties.
B. The Oil and Gas Industry’s Impact on Texas’ Severance Tax Revenues
Texas taxes various sectors in its economy. The Texas Comptroller’s Office publishes a report that accounts for 52 separate taxes that provide revenue to the state budget, including taxes and fees on beer, cigarettes, motor fuel, driver licenses, insurance policies and a host of other areas. This tax regime reflects the trajectory of the Texas economy as a whole.
The state charges a tax on entities that remove natural resources from Texas. Oil and natural gas producers fall under this tax, and are charged a severance tax on the market value of resources extracted and sold.
The tax rate differs depending on whether oil or natural gas is sold. Oil production is taxed at a rate of 4.6 percent of produced market value sold, and the tax is levied on the first purchaser of the oil. This tax, called the Crude Oil Production Tax, has been in effect since 1951. Natural gas production is taxed at 7.5 percent of the market value of the gas. The condensate (i.e., liquid) production from a natural gas well is taxed at 4.6 percent of its market value. Collectively, these taxes are called the Natural Gas Production Tax. Both the Oil Production Tax and the Natural Gas Production Tax fall under the state’s severance tax structure.19
18 Andrews and Karnes counties do not disclose their largest taxpayers. 19 Texas Comptroller of Public Accounts. A Field Guide to the Taxes of Texas. March 2021, p. 16.
Rank/County Midland County Panola County Wharton County Brazoria County
1 Pioneer Natural Resources Rockcliff Energy Colorado Bend Power Dow Chemical
2 Chevron CCI East Texas Upstream Gulf South Pipeline Blue Cube Operations
3 COG Operating LLC Sheridan Production Co Armour Lacy Phillips 66
4 XTO Energy Markwest Energy Texas Centerpoint Energy Ineos
5 Endeavor Energy Resources DCP East Texas Gathering LP Plant JM Manufacturing ChevronPhillips
6 Diamondback E & P Sabine Oil and Gas Enterprise Texas Pipeline BASF
7 Encana Oil and Gas USA Devon Energy Nan Ya Plastics Corp Denbury Utility
Deep in the Heart of Texas, Oil and Gas Losing Economic Luster
11
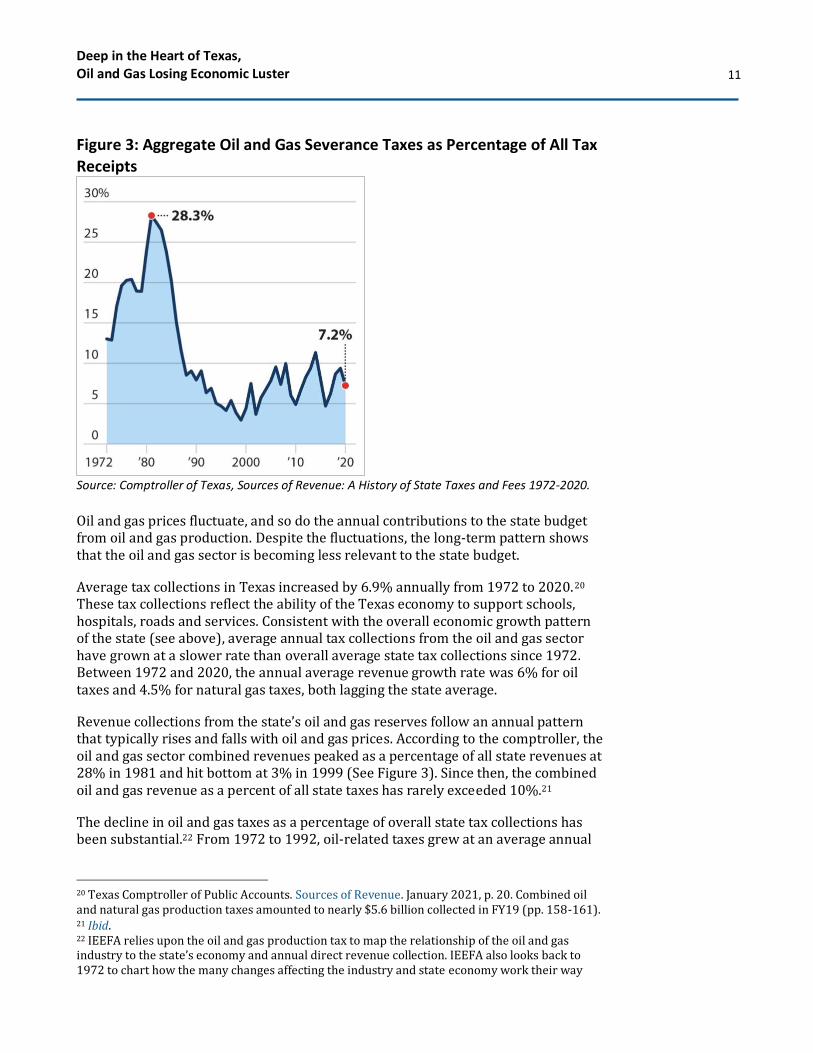
Figure 3: Aggregate Oil and Gas Severance Taxes as Percentage of All Tax
Receipts
Source: Comptroller of Texas, Sources of Revenue: A History of State Taxes and Fees 1972-2020.
Oil and gas prices fluctuate, and so do the annual contributions to the state budget from oil and gas production. Despite the fluctuations, the long-term pattern shows that the oil and gas sector is becoming less relevant to the state budget.
Average tax collections in Texas increased by 6.9% annually from 1972 to 2020.20 These tax collections reflect the ability of the Texas economy to support schools, hospitals, roads and services. Consistent with the overall economic growth pattern of the state (see above), average annual tax collections from the oil and gas sector have grown at a slower rate than overall average state tax collections since 1972. Between 1972 and 2020, the annual average revenue growth rate was 6% for oil taxes and 4.5% for natural gas taxes, both lagging the state average.
Revenue collections from the state’s oil and gas reserves follow an annual pattern that typically rises and falls with oil and gas prices. According to the comptroller, the oil and gas sector combined revenues peaked as a percentage of all state revenues at 28% in 1981 and hit bottom at 3% in 1999 (See Figure 3). Since then, the combined oil and gas revenue as a percent of all state taxes has rarely exceeded 10%.21
The decline in oil and gas taxes as a percentage of overall state tax collections has been substantial.22 From 1972 to 1992, oil-related taxes grew at an average annual
20 Texas Comptroller of Public Accounts. Sources of Revenue. January 2021, p. 20. Combined oil and natural gas production taxes amounted to nearly $5.6 billion collected in FY19 (pp. 158-161). 21 Ibid. 22 IEEFA relies upon the oil and gas production tax to map the relationship of the oil and gas industry to the state’s economy and annual direct revenue collection. IEEFA also looks back to 1972 to chart how the many changes affecting the industry and state economy work their way
Deep in the Heart of Texas, Oil and Gas Losing Economic Luster
12
rate of 9.3%, but from 2001 to 2020, this growth rate fell to 3.8%. Similarly, the average annual growth in natural gas tax revenues fell from 8.4% from 1972 to 1992, down to 3.9% annually from 2001 to 2020.
Figure 4: Separate Oil and Gas Severance Taxes as Percentage of All Tax Receipts
Source: Texas Comptroller, Sources of Revenue: A History of State Taxes and Fees 1972-2020.
Between the early 1970s and 1981, the nominal oil price increased more than tenfold, from $3.55 a barrel to a then-record peak of $37 per barrel.23 Two supply shocks were the catalysts behind this decade of rising oil prices. The first shock came in 1973-74, when OPEC created a shortage through its embargo of the U.S., Canada, U.K., the Netherlands, and Japan. The second shock occurred in 1979, when the Iranian Revolution and its subsequent war with Iraq took millions of barrels off the market for an extended period.24 The higher oil prices recorded during this period boosted Texas tax revenues. Severance taxes for oil and gas peaked as a percentage of Texas tax revenue in 1981.
Then oil prices dropped, taking production taxes and oil and gas employment down, and ultimately pulling the state into a recession in 1986. Oil prices over the next 13 years languished due to excess global spare capacity for crude.
The rebound for oil and gas prices that started in the early- to mid-2000s was supported by an economic revival in emerging markets, a weak U.S. dollar, lost production from the Iraq-U.S. war, and a growing perception that supply was
through long-term business cycles. Since 2007, the Texas Oil and Gas Association has compiled an annual tally of direct and indirect revenues from the oil and gas industry. 23 Federal Reserve Bank of Dallas. The Southwest Economy: Issue 2. 1996. 24 BP. Statistical Review of World Energy. 2020.
Deep in the Heart of Texas, Oil and Gas Losing Economic Luster
13
constrained while crude demand growth was robust.25 China’s acceptance into the World Trade Organization, followed by its rapid economic growth, was also a catalyst spurring increased crude demand and higher prices.26
Severance taxes in Texas followed the trend and reached a moderately elevated point with increased oil prices in 2014. But prices fell dramatically from 2014 through 2016, and today average about half the level experienced between 2010 to 2014. The increase in production volumes over the past several years, spurred by hydraulic fracturing technology, has kept severance tax collections fluctuating between 5% and 10% of total state revenues from 2014 through 2020.
IV. Employment in the Texas Oil and Gas Sector Is Lagging Behind Other Sectors of the State’s Economy Texas has an employment base of nearly 13 million. Overall, employment in Texas has grown at a faster pace than the national average over the past nine years. This is good news for the state, but the oil and gas sector has not been a standard-bearer in job growth.
Figure 5 compares recent employment trends for Texas with the nation. Texas employment tops the national average. Aggregate employment trends for oil and gas extraction, support activities for mining, natural gas distribution, petroleum and coal products manufacturing, pipeline transportation, and gasoline stations industries (key oil and gas industries) were stronger than both the national and Texas economy in the years immediately preceding and including 2014 but have since plummeted.
25 OPEC. World Oil Demand Just Keeps On Rising. March 2014. 26 Rice University Baker Institute for Public Policy. China’s Evolving Oil Demand. September 2016.
Deep in the Heart of Texas, Oil and Gas Losing Economic Luster
14
Figure 5: Indexed Employment Trends for Texas, Texas Oil and Gas, and
United States.27
Source: US Bureau of Labor Statistics.
A wider, longer-term lens shows oil and gas industry job growth has lagged overall employment growth in the state over the past 30 years. From 1990 to the present, the total nonfarm employment payroll in Texas grew from 7.1 million jobs to 12.3 million jobs, a steady annual increase of 2.4%.28 Over the same three decades, employment levels for key oil and gas industries fluctuated with oil prices from a low of 246,800 in 2003 to a record high of 429,300 in 2014.29 Overall industry employment in 1990 was 272,600; it had only risen to 315,500 by 2020, less than 1 percent annually.
27 U.S. Bureau of Labor Statistics. One-Screen Data Search. July 2021. Also see: U.S. Bureau of Labor Statistics. State and Area Employment. July 2021. Industry names and NAICS codes used to extract data from BLS website are: Oil and Gas Extraction (211000), Support Activities for Mining (213000), Natural Gas Distribution (221200), Petroleum and Coal Products Manufacturing (324000) and Gasoline Stations (447000). 28 Federal Reserve Bank of Dallas. Texas Nonfarm Employment. March 2021. 29 U.S. Bureau of Labor Statistics. State and Area Employment. July 2021. https://data.bls.gov/PDQWeb/ce
Deep in the Heart of Texas, Oil and Gas Losing Economic Luster
15
Table 4: Texas Oil and Gas Industry Employment as a Percentage of All
Non-farm Employment (1990-2020)
Source: Bureau of Labor Statistics
The Texas economy has continued to produce jobs over the last 30 years, but those jobs have not been in the oil and gas sector. In 1990, the oil and gas industry provided 3.8% of all Texas non-farm employment; by 2020, the portion had fallen to 2.6%.
V. The Outlook for the Oil and Gas Sector The strength of the Texas non-fossil fuel economy is apparent when it is assessed against the last 10 years of financial performance of the oil and gas industry. The state economy has continued to grow, even as its most prominent oil and gas producers experienced an extended and unprecedented period of market value loss. Opinions of international energy experts, investment houses, government and industry leaders, and oil and gas shareholders have crystallized into a global consensus: The oil and gas sector faces decreased demand, shifts in the use of oil and gas, and lower profits.
Regardless of the esteem Texans place on the role of the state in fossil fuel production, the oil and gas industry does not operate in a vacuum. We have witnessed a transformation over the past decade that has embraced renewable energy. The handwriting is on the wall—be it subpar long-term market performance, investment advisory firms and pensions shunning fossil fuel investments, or international agencies acknowledging that climate risk mitigation will lead to less demand for fossil fuels as governments, utilities and businesses seek to meet emission reduction goals.
Although the short-term crude demand continues its rebound in 2021, pulling oil prices up with its ascent, the long-term prognosis will continue to follow the trends of the past decade. Oil and gas in Texas is vulnerable to the realities gaining attention on the global stage that are already coming home to roost in the state.
Year Nonfarm Employment Oil and Gas Industry Employment Percentage
1990 7125 273 3.8%
1995 8059 260 3.2%
2000 9462 253 2.7%
2005 9772 262 2.7%
2010 10378 312 3.0%
2015 11870 393 3.3%
2020 12268 315 2.6%
(thousand employees)
Deep in the Heart of Texas, Oil and Gas Losing Economic Luster
16
Declining Market Capitalization
The market value of many of the state’s most prominent oil and gas businesses has diminished substantially over the last two decades. The values of companies have fallen considerably below the market peaks, when the price of oil was higher and the outlook more promising. The loss of market capitalization drove the industry from a market leader during the 1980s, when it peaked at 28% of the overall value of the Standard & Poor’s 500-stock index, to its current level of 2.8%.30 (The share price of Pioneer Natural Resources peaked in June 2014, is an exception. The company’s market capitalization is higher today due to two major acquisitions.)31
Table 5: Selected Texas Oil and Gas Producers Peak Market Capitalization vs. Current Market Capitalization32
Source: Yahoo Finance.
Coming out of the pandemic, oil and gas prices have increased and the industry’s market position has improved. A growing consensus, however, suggests this recent improvement does not indicate an industry turnaround, and will not return the industry to its previous prominence in the market.33
30 S&P Dow Jones Indices. S&P 500 Overview. May 31, 2021. 31 Natural Gas Intelligence. Pioneer Claims No. 1 Permian Producer Spot with DoublePoint, Parsley Acquisitions. May 6, 2021. 32 Yahoo Finance. Query of market capitalizations for tickers XOM, CVX, RDS-A, EOG, PXD, OXY, MRO, and XEC. July 7, 2021. 33 International Energy Agency. Oil 2021: Analysis and forecast to 2026. March 2021. Also see: Fortune. There is a Growing Consensus That Oil Will Not Make a Comeback. September 17, 2020.
Deep in the Heart of Texas, Oil and Gas Losing Economic Luster
17
The International Energy Agency’s Global Energy Outlook
The International Energy Agency,34 an intergovernmental energy advisor to developed nations, publishes an annual global energy outlook,35 with data and analysis reviewed by prominent industry stakeholders. This report shapes global market consensus, drives commentaries, and strongly influences policy formation. In its 2021 annual report, the agency said the world should approve no new oil and gas fields if it is to mitigate the worst effects of climate change.36
BlackRock’s Studies on Fossil Fuel Divestment for a Government Pension Fund
BlackRock is one of the world’s leading investment houses. With $9 trillion under management, the company assists most major public and private funds in the world.37 In January 2021, the company completed an engagement with the New York City pension funds.38 As part of the due diligence it conducted for the city, BlackRock produced a series of research papers.
BlackRock’s studies are important because they represent the first publicly available reports prepared under contract by one of the world’s largest investment advisors to a pension fund as it considered divestment from fossil fuels. The studies found:
• Investment funds that divested from fossil fuels did not lose money.
• The funds that divested did so because the companies in the oil and gas industry were unprepared to handle the current risk profile.
• Funds that divested did so with the proviso that they would reinvest if the companies showed improved performance.
BlackRock’s review leads to two conclusions regarding the outlook for oil and gas: 1) Investment funds can protect themselves by divesting from the stock, and 2) The return of oil and gas companies to investment portfolios will occur when the business strategies of the companies result in enhanced value and contribute to a climate solution.
34 The International Energy Agency (IEA) was formed in 1974 to coordinate a collective global response to oil shocks. Today, its work spans initiatives aimed at energy security, clean energy transition, collecting data, and providing training. 35 International Energy Agency. Global Energy Review 2021. April 2021. 36 IEEFA. IEA’s net zero emissions by 2050 maps the huge increase in global ambition. May 2021. 37 The company has been engaged in controversy regarding its policies related to fossil fuels for several years. See: IEEFA. IEEFA report: BlackRock’s fossil fuel investments wipe US$90 billion in massive investor value destruction. August 1, 2019. 38 IEEFA. Major investment advisors BlackRock and Meketa provide a fiduciary path through the energy transition. March 22, 2021.
Deep in the Heart of Texas, Oil and Gas Losing Economic Luster
18
Norway’s Transition Planning Initiative
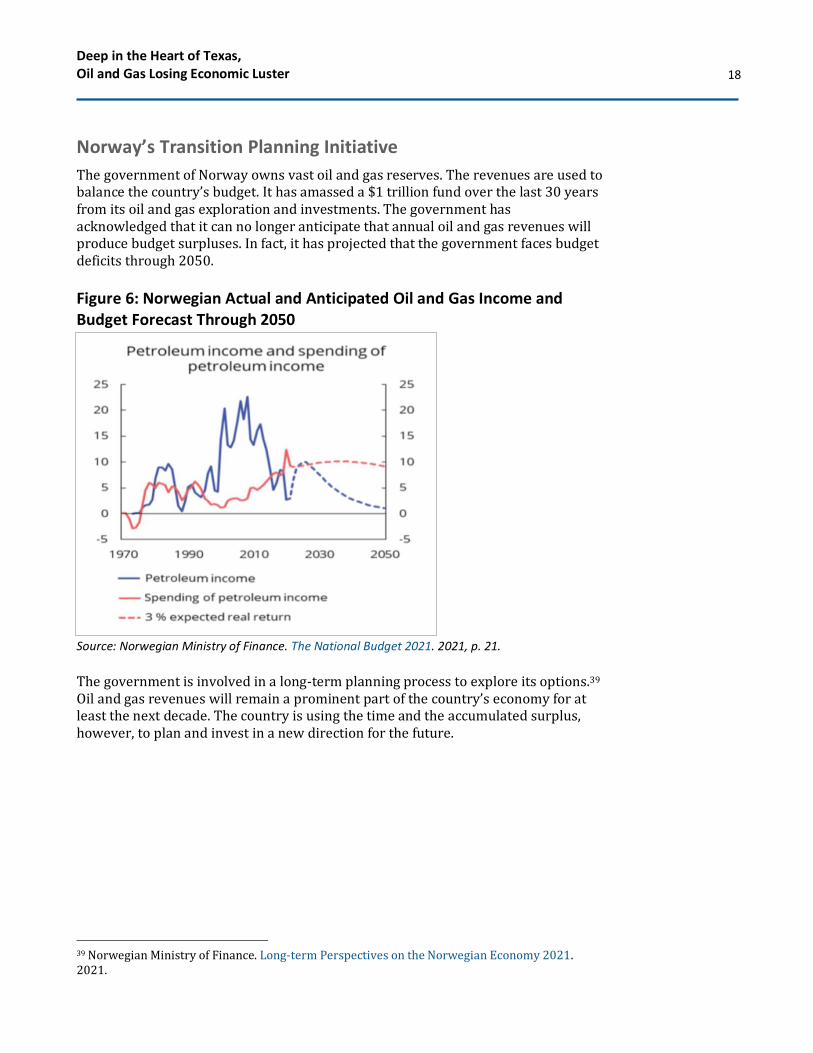
The government of Norway owns vast oil and gas reserves. The revenues are used to balance the country’s budget. It has amassed a $1 trillion fund over the last 30 years from its oil and gas exploration and investments. The government has acknowledged that it can no longer anticipate that annual oil and gas revenues will produce budget surpluses. In fact, it has projected that the government faces budget deficits through 2050.
Figure 6: Norwegian Actual and Anticipated Oil and Gas Income and Budget Forecast Through 2050
Source: Norwegian Ministry of Finance. The National Budget 2021. 2021, p. 21.
The government is involved in a long-term planning process to explore its options.39 Oil and gas revenues will remain a prominent part of the country’s economy for at least the next decade. The country is using the time and the accumulated surplus, however, to plan and invest in a new direction for the future.
39 Norwegian Ministry of Finance. Long-term Perspectives on the Norwegian Economy 2021. 2021.
Deep in the Heart of Texas, Oil and Gas Losing Economic Luster
19
Shareholder Actions
In May 2021, ExxonMobil held its annual shareholder meeting. A small hedge fund, Engine No. 1, offered alternative candidates to management’s slate. In the subsequent vote, shareholders voted against the wishes of management, approving three of Engine No. 1’s board candidates and two other proposals related to climate and company lobbying, all of which were opposed by the company.
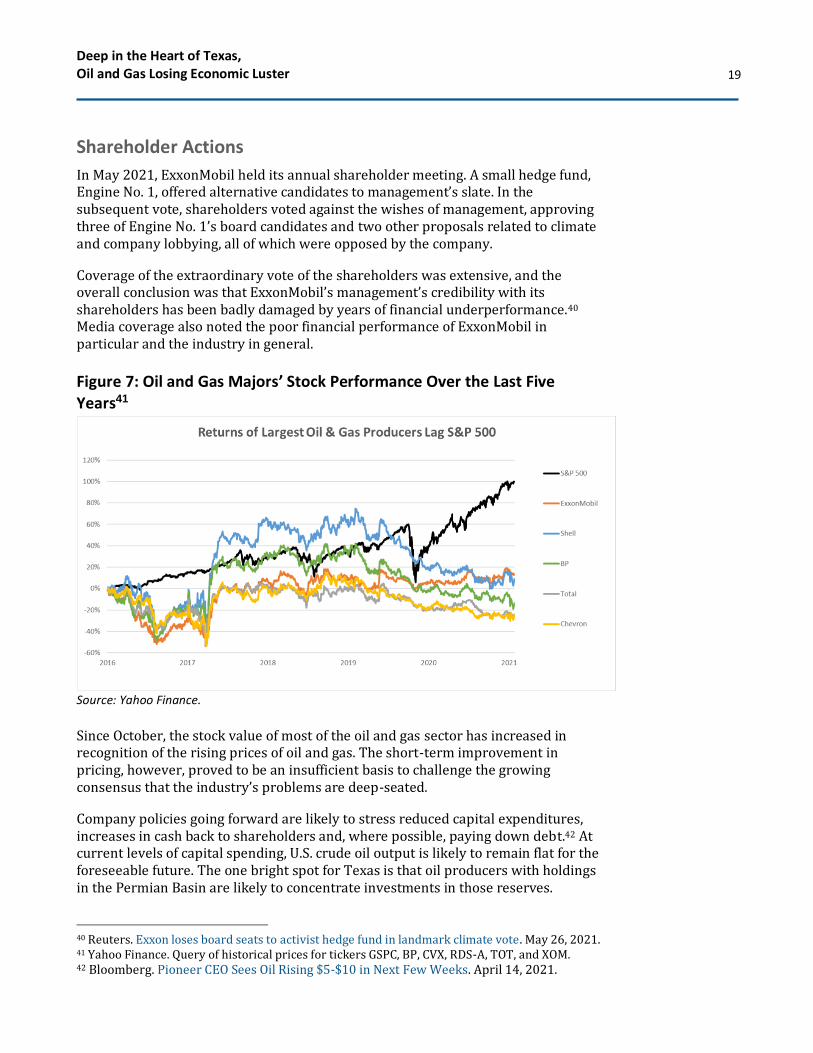
Coverage of the extraordinary vote of the shareholders was extensive, and the overall conclusion was that ExxonMobil’s management’s credibility with its shareholders has been badly damaged by years of financial underperformance.40 Media coverage also noted the poor financial performance of ExxonMobil in particular and the industry in general.
Figure 7: Oil and Gas Majors’ Stock Performance Over the Last Five Years41
Source: Yahoo Finance.
Since October, the stock value of most of the oil and gas sector has increased in recognition of the rising prices of oil and gas. The short-term improvement in pricing, however, proved to be an insufficient basis to challenge the growing consensus that the industry’s problems are deep-seated.
Company policies going forward are likely to stress reduced capital expenditures, increases in cash back to shareholders and, where possible, paying down debt.42 At current levels of capital spending, U.S. crude oil output is likely to remain flat for the foreseeable future. The one bright spot for Texas is that oil producers with holdings in the Permian Basin are likely to concentrate investments in those reserves.
40 Reuters. Exxon loses board seats to activist hedge fund in landmark climate vote. May 26, 2021. 41 Yahoo Finance. Query of historical prices for tickers GSPC, BP, CVX, RDS-A, TOT, and XOM. 42 Bloomberg. Pioneer CEO Sees Oil Rising $5-$10 in Next Few Weeks. April 14, 2021.
Deep in the Heart of Texas, Oil and Gas Losing Economic Luster
20
VI. Diversification Is the Most Promising Solution for the Texas Economy
A. The View of the Dallas Federal Reserve In 1995, the Dallas Fed wrote an article exploring the economic impact caused by large swings in oil prices.43 Using input/output analysis, economic modeling and simulations, the writers provided data that sought to end the debate regarding whether high or low oil prices were economically best for the country.
While answering this question with their research, the Dallas Fed’s economists also collected data on energy trends, energy policy and Texas, the largest energy-producing state. They observed:
• The oil and gas sector declined in both size and influence, including a drop in employment across key industries that was anticipated to continue as U.S. industries dependent on energy shrank and overall U.S. productivity improved.
• Five key energy sectors collectively experienced employment declines of 39 percent between 1982 and 1992. These sectors included coal mining, oil and gas extraction, oilfield machinery, petroleum refining and petrochemicals. Job numbers fell from 1.6 million to 1 million workers nationwide.
• While oil prices also fell 39 percent during this 10-year period,44 the link between low oil prices and economic hardship became less intense as time passed.
At the onset of this 10-year period, fluctuating energy prices were seen as a large factor in the differences among regional economic performances. Energy-producing states were reaping economic benefits during times of higher energy prices while states importing energy suffered with retarded economic growth.
Using input/output simulations, however, the authors found across almost all states that the industries dependent on energy prices as a key component of their raw materials costs were shrinking in their proportional prominence in the states’ economies. Simply put, most states’ economies were experiencing a diversification of their industries, with economies stressing less importance on manufacturing and greater importance on services as time progressed. The Dallas Fed observed that economic diversification of industries was occurring in both oil-producing and oil-importing states between 1982 and 1992, and it anticipated continued economic evolution.
43 Federal Reserve Bank of Dallas. Energy Prices and State Economic Performances. Second Quarter 1995. 44 Oil fell from a nominal annual average of $33.64 per barrel to $20.56 per barrel during this decade, indicating a direct correlation, with oil prices functioning as the independent variable. At the time of the Dallas Fed research, the oil and gas industry was in a nine-year slump, where the collapse in the mid-80s had taken a toll on both Texas and the nation.
Deep in the Heart of Texas, Oil and Gas Losing Economic Luster
21
It found that the inversely correlated economic performance between energy-producing and energy-consuming states was dissipating as well. Most states had diversified their economies. These dynamic forces had the effect of lessening the entire U.S. economy’s sensitivity to the impact of dramatic oil price swings, although oil prices had (and still have) an impact.
The inescapable conclusion was that economic diversification lessens the impact of drastic oil price shifts at both the state and national levels.
B. A Way Forward for Texas The United States has witnessed the decline of the coal industry over the last 15 years. In 2007, the country used more than 1 billion tons of coal, mostly for electricity. By 2020, U.S. coal consumption had fallen to 436 million tons.45 The decline has been costly to the industry and the communities that played host to the mines and power plants. Many coal companies went bankrupt (some more than once), coal miners lost their jobs, profits tumbled, investors lost money, and local communities experienced abandonment and fiscal stress.
At a policy level, few states have responded. New York enacted a law that provided cash to communities that suffered the loss of a coal power plant, and Colorado adopted a law that provided similar fiscal relief and offered broad support to workers. More transition support is needed.
Recently, U.S. Rep. Tom O’Halleran, D-Ariz., reintroduced a bill that would provide transition aid to communities affected by the decline of the coal industry.46 The legislation establishes resources to support new economic development, workforce development and fiscal relief to local governments. The O’Halleran bill has similarities to initiatives taken by the Department of Defense when it closed military bases. These federal, state and local cooperative efforts have been the basis of Cabinet-wide action for decades.47
The Pentagon’s Base Realignment and Closure (BRAC) plans, which have been carried out in numerous communities, typically have three components. First, economic stakeholders—business, labor, community, elected leaders—assemble and plan critical investments that are both regional- and industry-based, with particular targeting to communities affected by closure of a facility. Second, an assessment is made of the fiscal loss from the closure and from indirect tax losses attributed to any related economic disruption. A payment schedule is designed to meet the budgetary needs of the local communities. Finally, labor policies are
45 Statista. Coal energy consumption for electricity generation in the United States from 1950 to 2020. 2021. 46 Lake Powell Life. O’Halleran Reintroduces Legislation to Aid Coal Transition Communities. March 30, 2021. 47 Office of Technology Assessment. After the Cold War: Living With Lower Defense Spending. February 1992.
Deep in the Heart of Texas, Oil and Gas Losing Economic Luster
22
formulated that strive to re-employ workers and offset income losses for people who lose jobs.48
Texas leaders should examine these initiatives and learn from them.
Conclusion The overall power and strength of the Texas economy has allowed it to absorb the loss of economic activity, jobs and taxes from the oil and gas industry. Growth in other business sectors has replaced the lost tax dollars from the oil and gas sector, both in the economy as a whole and in the state budget.
The long history of the oil and gas sector’s contribution to the state and the state’s position as a holder of large oil and gas resources remain firmly in the minds of most Texans. But these factors obscure a fundamental reality: The Texas oil and gas industry is in decline. The decline has taken place for much of the past seven years. Experts across a wide spectrum see it continuing.
The oil and gas sector’s decline will require attention as it deepens. America’s coal communities stand as an example of what happens when no one pays attention. Local communities that host the oil and gas industry will feel the decline first and most. In Texas, this means that certain rural communities will experience the initial brunt of the decline.
We have seen past success stories where effective governance has led to redevelopment of communities within 10 years after military base closings. And we have seen past failures where coal plant closures come as a shock to local rural communities. The difference between these contrasting outcomes is that the former involved a detailed plan of action.
The country has seen this problem before and has come up with innovative ways to rebuild. Texas can do the same to ensure that rural communities affected by the fossil fuel industry’s continued decline are able to pivot to new business opportunities so that they can thrive and strengthen their tax base during this time of change.
48 Congressional Research Service. Military Base Closures: Socioeconomic Impacts. February 7, 2012.
Statistics for Counties with Current Drilling Activity
Production (boepd) Employment Total Employment Oil & Gas Population
Deep in the Heart of Texas, Oil and Gas Losing Economic Luster
24
Appendix II: Previous IEEFA Work Regarding the Energy Industry in Texas IEEFA. ExxonMobil: Permian Leader or Just Another Fracker? June 2021.
• IEEFA’s research found that ExxonMobil appears to be functioning in the Permian as a mid-tier company with a mixed track record rather than a leader. Its heavy investment in the Permian Basin “has yet to meet expectations,” and the report questions the quality of ExxonMobil’s disclosures to investors about its Permian operations.
• It concludes: “The findings of this analysis raise troubling questions about the quality of ExxonMobil’s Permian assets and their ability to sustain the industry-leading production that the company has been touting to investors.”
IEEFA. The Texas transition gains momentum: Wind and solar top combined cycle gas generators in ERCOT for first time. May 2021.
• The commentary observes that wind and solar power in the Electric Reliability Council of Texas (ERCOT) exceeded the output from combined cycle gas turbine units for the second month in a row, and also had generated more power for the year to date. It notes that gas and coal are now battling one another for market share, with relative prices pushing one up or down, but demand growth is being managed by renewables.
IEEFA. U.S. Power Sector Outlook 2021: Rapid Transition Continues to Reshape Country’s Electricity Generation. March 2021.
• IEEFA concluded that the sharp rise in gas-fired capacity in the 2010s reached a plateau, and the coal industry’s decline will accelerate as wind and solar technology continue to gain in cost effectiveness. It noted the transition “is now nearing exponential growth, particularly for solar,” and, “The impact in the next two to three years is going to be transformative.
• Regarding Texas, IEEFA observed the total amount of installed wind capacity in ERCOT had more than doubled between 2011 and the close of 2020. Coal-powered capacity had accounted for 39 percent of ERCOT’s electricity needs in 2011, but dropped to 17.9 percent by the end of 2020. IEEFA projects the rapid buildout of wind and solar energy across ERCOT will continue, since they are the least-cost generation options. IEEFA calculates that the new wind capacity, expected to increase by 50 percent from 2020 to the end of 2023, will cover expected demand growth. IEEFA projects that solar capacity, which currently accounts for 2.3 percent of ERCOT demand, is likely to rise to more than 9 percent by 2023.
Deep in the Heart of Texas, Oil and Gas Losing Economic Luster
25
IEEFA. As Oil and Gas Wane, Texas Wind Industry Ascends. August 2020.
• “Texas is the wind-savviest state in the nation, and its growing number of wind farms are widely and correctly perceived as good investments, job creators, tax-base solidifies, and engines of economic growth.”
• The report cited Nolan County as a prime example of how the wind industry has generated both tax revenue benefits for the public and lease payments to private landowners. It observed that wind-energy workers were being paid on par with oilfield employees. It also found that corporate demand for wind power was accelerating.
IEEFA. Petra Nova Mothballing Post-Mortem: Closure of Texas Carbon Capture Plant Is a Warning Sign. August 2020.
• The report found a lack of transparency surrounding the plant and its operations. It found the project, which reportedly was closed due to declining oil prices, fell well short of its carbon capture goal during its three full years of operation. IEEFA questioned the financial viability of the project, noting with concern that it benefited from a $190 million grant from the U.S. Department of Energy and $250 million in concessionary lending from the Japan Bank for International Cooperation and Mizuho Bank, Ltd.
IEEFA. Solar Surge Set to Drive Much of Remaining Texas Coal-Fired Fleet Offline. July 2020.
• IEEFA reported that while installed solar power capacity in the U.S. has grown by almost 4,000% over the past 10 years, its growth rate in Texas has been even faster, with installed capacity rising from just 15 megawatts (MW) in 2010 to 2,281MW at the end of 2019, a 15,107% increase.
• The report projected that ERCOT’s installed capacity could climb to 5,800MW by the end of 2020. It noted that daily solar generation in ERCOT would likely be above 80,000 MWh during the long days of early summer, putting as much as 70% of ERCOT’s daytime coal-fired generation at risk. It also found that even during the short daylight months of winter, solar could put 70% of coal’s daytime generation at risk in just two years. IEEFA projected that this pressure, combined with continued increases in wind capacity, could lead to the retirement of several coal plants by 2025.
IEEFA. Flaring Burns Texas Economy: Commission’s Failure to Stop Waste Runs Risk of Letting the State’s Financial Future Go Off the Rails. June 2020.
• On May 5, 2020, the RRC rejected a motion by Pioneer Natural Resources and Parsley Energy to curtail oil production based on economic waste without a serious discussion of flaring. IEEFA reported that in so doing, the RRC ignored the fundamental challenge it faces—managing the decline of the oil and gas sector in Texas while supporting overall growth in the Texas economy.
Deep in the Heart of Texas, Oil and Gas Losing Economic Luster
26
• The oil and gas sector had commanded 28 percent of the Standard & Poor’s 500-stock index portfolio in the 1980s, but has since dropped to just 3 percent. This is true even though the $50+ per barrel average price that existed before the 2020 downturn had been stable since 2017 [and is still true despite the recent $70+ per barrel price spike]. IEEFA urged that the RRC has an obligation to curb waste—and wasteful flaring—by the oil and gas sector.
• Also see: IEEFA. Comments submitted to the Railroad Commission of Texas on the matter of the Pioneer Natural Resources U.S.A., Inc., and Parsley Energy, Inc., request for determination of reasonable market demand. April 2020.
• Also see: IEEFA. Prices are up—but the oil industry’s return is more complicated: Rising oil prices fail to mask long-term fundamental weaknesses for oil business. July 2021.
IEEFA. The Beginning of the End: Fundamental Changes in Energy Markets Are Undermining the Financial Viability of Coal-Fired Power Plants in Texas. September 2016.
• The report found that declines in the prices of power from wind and solar resources in Texas, combined with lower natural gas costs, were creating pressure that undermined the profitability of coal-fired power plants. The report examined the circumstances of four merchant coal plants and three coal plants owned by public power utilities or agencies, finding that none of the units were financially viable and none can be expected to make economic sense for ratepayers in coming years.
• IEEFA recommended that the policy discussion in Texas should “shift now to how best to phase out these plants, what to replace them with and how to retrain employees who stand to lose their jobs.”
• (The following year, one of the plants identified in this report, the Monticello plant in North Texas, went bankrupt after having operated at a loss for years. See: IEEFA. Latest U.S. Coal Plant Shutdown Stems from a Saga in Which Investors Failed to See Change Coming. October 2017.)
• Gibbons Creek, another plant highlighted in IEEFA’s report, cut its operations in half that same year. The plant subsequently closed in 2018, and the site is now being repurposed for renewable energy, agricultural, commercial or industrial redevelopment opportunities. An IEEFA commentary on the closing noted the interesting aspect that the Gibbons announcement was spurred by the municipality customers. It noted that municipal utilities and public power agencies are increasingly willing to retire uneconomic coal plants to protect their ratepayers from changing market forces and to take advantage of the improving economics of renewable wind and solar resources. See: IEEFA. IEEFA Update: A Texas coal domino teeters. July 2017. Also see: Power Engineering. Charah Solutions
Deep in the Heart of Texas, Oil and Gas Losing Economic Luster
27
handling decommissioning of Gibbons Creek coal-fired plant, won’t be reopened. September 24, 2020.)
IEEFA. Texas’ Outsize Role in the Decline of the Powder River Basin Coal Industry. August 2016.
• IEEFA found that power plant operators in Texas cut purchases of Powder River Basin coal by 48 percent in the first five months of 2016 compared to the first five months of 2015. It found that plant-by-plant numbers in Texas were affecting specific mines in the Powder River Basin. The report highlighted four mines that were “feeling the pinch” from this—Alpha Natural Resources, Arch Coal, Peabody Energy and Cloud Peak Energy. It noted that the first three listed mines were already in bankruptcy, and that Cloud Peak Energy was showing signs of deep financial distress. (Cloud Peak Energy subsequently filed for bankruptcy in 2019.)
IEEFA. Energy Future Holdings and Mining Reclamation Bonds in Texas. October 2013.
• The report raises concern that Luminant Mining, using Luminant Generation as a third-party guarantor to the Railroad Commission of Texas for self-bonding authority, creates a misleading impression of Luminant Generation’s financial condition. In Texas, third-party self-bonding allows a financially solvent company to pledge existing assets against future reclamation claims related to mine operations for a company that may not meet financial health benchmarks.” The report found that the applications made by Luminant Mining and Luminant Generation to the RRC contained information and accounting representations that were at considerable variance with financial statements made by the companies’ parent corporation, Energy Future Holdings (EFH) Company and its subsidiary, Energy Future Competitive Holdings (EFCH). It found that EFH/EFCH’ filings to investors and the SEC portray EFH/EFCH as entities in significant financial distress.
• IEEFA urged that the RRC “conduct more than a simple, technical evaluation f the accounting presentations in the applications” and “exercise additional diligence” as it appeared that the State of Texas’s interest in ensuring that sufficient resources would be available for reclamation did not appear to be protected.
IEEFA. Why a Forward Capacity Market Won’t Solve Resource Adequacy Problem: The Case of Energy Future Holdings (prepared for Public Citizen of Texas). February 2013.
• The report cautioned that the use of “capacity payments” to electricity producers, alone, will not significantly improve company finances or induce investment in viable energy alternatives. In particular, the report expressed concern that the past performance of Energy Future Holdings (EFH) and the current alignment of interests of its board of directors suggested that
Deep in the Heart of Texas, Oil and Gas Losing Economic Luster
28
additional revenue from capacity payments likely would be used for debt payments or restructuring, not to strengthen the grid and improve reliability.
IEEFA. The Case to Retire Big Brown, Monticello and Martin Lake Coal Plants: Three Financially Mismanaged, Unprofitable, Outmoded and Worthless Coal Plants in North Texas. March 2011.
• The study reported that the three coal-fired power plants, built in the 1970s and owned by Energy Future Holding/Luminant, had suffered deep losses in market value, were uncompetitive in the energy marketplace, and were not even producing sufficient net revenue to support necessary investments in air pollution control equipment. It found that the debt on the plants dwarfed the estimated retained value by a factor of almost 10-to-1.
• Noting that a national industry consulting firm had called for retiring all merchant coal plants in Texas because revenues would be insufficient to cover expenses and upgrades, the report concluded that the three plants were priority candidates for replacement.
Deep in the Heart of Texas, Oil and Gas Losing Economic Luster
29
About IEEFA The Institute for Energy Economics and Financial Analysis (IEEFA) examines issues related to energy markets, trends and policies. The Institute’s mission is to accelerate the transition to a diverse, sustainable and profitable energy economy. www.ieefa.org
About the Authors
Trey Cowan Oil & Gas Analyst Trey Cowan is a finance professional with 30 years of experience focused primarily on providing commentary & analysis to capital markets and upstream oil & gas management teams. Prior to his current position, Mr. Cowan was an analyst with S&P Global (Platts Analytics) where he focused on U.S. upstream drilling activities and fundamental energy trends. Mr. Cowan is a Texas licensed CPA and holds an MBA in Finance from Vanderbilt University.
Tom Sanzillo Tom Sanzillo, director of financial analysis for IEEFA, is the author of numerous studies on the oil, gas, petrochemical and coal sectors in the U.S. and internationally, including company and credit analyses, facility development, oil and gas reserves, stock and commodity market analysis and public and private financial structures. Sanzillo has experience in public policy and has testified as an expert witness, taught energy industry finance and is quoted frequently in the media. He has 17 years of experience with the City and the State of New York in senior financial and policy management positions. As the first deputy comptroller for the State of New York Sanzillo oversaw the finances of 1,300 units of local government, the annual management of 44,000 government contracts, and over $200 billion in state and local municipal bond programs as well as a$156 billion global pension fund.