The nature of subsurface rupture is inferred through surface deformation and surface faulting is rarely observed in stable continental regions (SCR) (Johnston, 1996). The Kachchh rift basin in the Kachchh region, Gujarat, western India experienced an earthquake of magnitude Mw 7.7 on January 26, 2001. It is one of the largest earthquakes in the stable continental regions of
the world. Comparable earthquakes worldwide are the New Madrid earthquakes of 1811-1812 (USA), the Charleston, South Carolina (USA) earthquake of 1886, and the 1819 Kachchh (Allah Bund) earthquake (Mc Calpin and Thakkar, 2003). Before the 2001 Bhuj earthquake, the Kachchh rift basin experienced two major events, namely the 1819 Allah Bund earthquake (Mw 7.9) and the 1956 Anjar earthquake (Mw 6.0) (Chung and Gao, 1995; Johnston, 1996; Bilham, 1999; Rajendran et al., 1998,
2001) (Fig. 1a) (Tab. 1). Surface deformation due to the 26 January, 2001 Bhuj earthquake was reported by Rastogi (2001), Rajendran et al. (2001; 2008) and by Pande (2012). Based on surface geological investigation Mc Calpin and Thakkar (2003) described three major morphological features in the Bharudia Fault (BhF), later described by Mandal et al. (2004) as the North Wagad Fault (NWF) zone, namely a sinuous hanging wall collapse scarp where the northern part of the scarp is buried by
Quaternary deposits, tent structures and less sharp mole tracks. The epicentral zone lies in an area of perennially wet land at Banni, but the eastern rupture area in Wagad is accessible and yields information on the nature of the deformation.
In the present study, an attempt has been made to characterize the post 2001 Bhuj earthquake geomorphic expression along the rupture zone of the NWF with the help of ASTER satellite data, and mapping (geomorphological and geological) using a Real
Time Kinematic (RTK) GPS receiver. Ground Penetrating Radar (GPR) studies have also been performed to recognize the subsurface nature of the neotectonic geomorphological structures.
Artigo original Original article
30 G. C. Kothyari et al. / Comunicações Geológicas (2015) 102, 1, 29-37
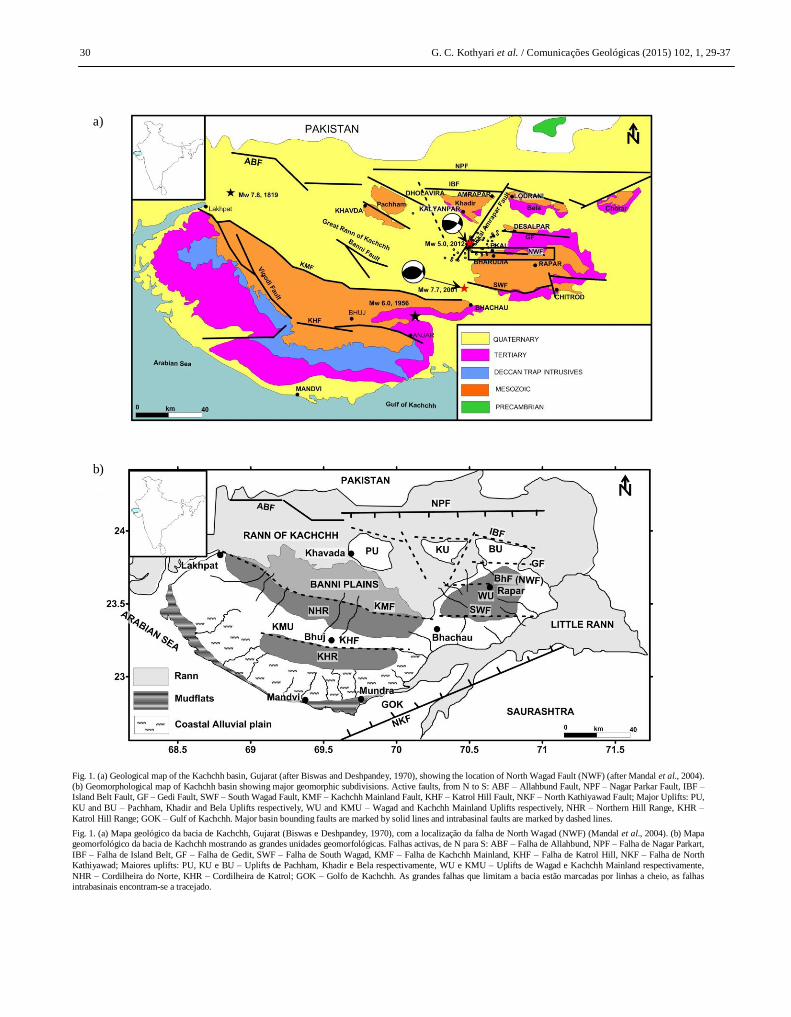
Fig. 1. (a) Geological map of the Kachchh basin, Gujarat (after Biswas and Deshpandey, 1970), showing the location of North Wagad Fault (NWF) (after Mandal et al., 2004).
(b) Geomorphological map of Kachchh basin showing major geomorphic subdivisions. Active faults, from N to S: ABF – Allahbund Fault, NPF – Nagar Parkar Fault, IBF –
Island Belt Fault, GF – Gedi Fault, SWF – South Wagad Fault, KMF – Kachchh Mainland Fault, KHF – Katrol Hill Fault, NKF – North Kathiyawad Fault; Major Uplifts: PU,
KU and BU – Pachham, Khadir and Bela Uplifts respectively, WU and KMU – Wagad and Kachchh Mainland Uplifts respectively, NHR – Northern Hill Range, KHR –
Katrol Hill Range; GOK – Gulf of Kachchh. Major basin bounding faults are marked by solid lines and intrabasinal faults are marked by dashed lines.
Fig. 1. (a) Mapa geológico da bacia de Kachchh, Gujarat (Biswas e Deshpandey, 1970), com a localização da falha de North Wagad (NWF) (Mandal et al., 2004). (b) Mapa
geomorfológico da bacia de Kachchh mostrando as grandes unidades geomorfológicas. Falhas activas, de N para S: ABF – Falha de Allahbund, NPF – Falha de Nagar Parkart,
IBF – Falha de Island Belt, GF – Falha de Gedit, SWF – Falha de South Wagad, KMF – Falha de Kachchh Mainland, KHF – Falha de Katrol Hill, NKF – Falha de North
Kathiyawad; Maiores uplifts: PU, KU e BU – Uplifts de Pachham, Khadir e Bela respectivamente, WU e KMU – Uplifts de Wagad e Kachchh Mainland respectivamente,
NHR – Cordilheira do Norte, KHR – Cordilheira de Katrol; GOK – Golfo de Kachchh. As grandes falhas que limitam a bacia estão marcadas por linhas a cheio, as falhas
intrabasinais encontram-se a tracejado.
a)
b)
Surface deformation along the Bharudia/North Wagad Fault Zone, India 31
We propose a model that considers the development of secondary surface deformation pattern in the BhF/NWF zone.
2. Neotectonics and seismotectonics of the Kachchh Rift
Basin
The Kachchh rift basin evolved during 135 Ma and is bounded by
two major extensional faults, namely the south-dipping Nagar Parkar Fault (NPF) in the north and the north dipping North Kathiawar Fault (NKF) in the south (Fig. 1b). The basin was formed due to extensional tectonics during the geological past, and is now under a compressional regime (Kayal et al., 2002a; Rastogi et al., 2014). Rifting was aborted by trailing edge uplift during Late Cretaceous pre –collision stage of the Indian plate when the leading edge of the plate was slab-pulled towards the
Tethyan trench (Biswas, 2005; Rastogi et al., 2014). The uplift caused structural inversion during rift drift transition stage when most of the uplifts with drape folding over the edge came into existence by upthrusting of the basement domino blocks along the master faults (Biswas, 2005; Rastogi et al., 2014). This created the first marginal flexures over the foothill uplifts. The lateral motion during the drift stage of the plate induced horizontal stress and the near vertical faults, which were
reactivated as reverse faults during initiation of the inversion cycle, became strike-slip faults involving divergent oblique-slip movement (Biswas, 2005; Rastogi et al., 2014). The present structural style evolved from right to left lateral slip, which shifted the uplifts progressively eastwards relative to each other from south to north. This resulted in the present en echelon positioning of the uplifts with respect to Kachchh Mainland uplift (KMU) (Fig. 1b). The strike slip related structural changes modified the linear flexure breaking it into individual folds at the
restraining and releasing bends (Biswas, 2005). Narrow deformation zones complicated by second order folds and conjugate Riedel faults formed along the master faults modifying the initial drape folds (Biswas, 2005; Rastogi et al., 2014). Inversion continued during post collision compressive stress regime of the Indian plate and the Kachchh rift basin became a shear zone with transpressional strike-slip movement (with thrust at depth) along the active sub-parallel rift faults (Biswas, 2005;
Rastogi et al., 2014). The same tectonic phase is continuing as evidenced by neotectonic movements along these faults that are responsible for the present first order geomorphic features and seismicity (Rastogi et al., 2014).
Table 1. List of major earthquakes in the Kachchh basin.
Tabela 1. Lista dos maiores sismos na bacia de Kachchh.
The compressional tectonic regime resulted in several east–
west trending master faults (Biswas 1987), which are now the major structural features of the Kachchh region. The hanging-wall blocks were uplifted along the E-W master faults and
formed the highlands, whereas the intervening half-graben formed the plain-lands (Biswas, 1987; 2005; Beloussov, 1962). Further, it has been observed that the hanging wall blocks were
tilted towards south and the master faults changed from normal to oblique reverse strike-slip (Rastogi, 2004). Three major faults of the region are, from north to south, the Island Belt Fault (IBF),
Kachchh Mainland Fault (KMF) and the Katrol Hill Fault (KHF) (Figs. 1a, b). Mandal et al. (2004) identified a North Wagad Fault (NWF) based on aftershock studies, which is south dipping. Earlier this fault was mapped as the northern left lateral Bharudia Fault (BhF) (Mc Calpin andThakkar, 2003). The rock units of the Wagad block of Kachchh comprise Mesozoic (135–65 Ma) and younger Cenozoic sediments overlying a granitic basement (Biswas, 1987; Rastogi, 2004).
The ENE-WSW trending Kachchh rift basin has been divided into four geomorphic areas namely, Rann of Kachchh, the low-lying Banni Plain, the hilly regions and the southern coastal plain (Fig. 1b). The northern boundary of the basin, marked by the Little Rann and Great Rann of Kachchh, is covered by salt rich deposits (e.g. silt and sand with salt) (Mc Calpin and Thakkar, 2003). The Great Rann of Kachchh is bounded by the NPF to the north, and includes the IBF and the Banni Plains besides the salt
plains (Fig. 1b). There are four uplifts of Mesozoic rocks along the IBF, namely the Pachchham, Khadir, Bela and Chorar from west to east, separated by transverse strike-slip faults. The northern boundaries of these uplifted hills are controlled by the IBF and marked by steep scarps towards the northern flanks. Two phases of neotectonic uplift/activity have occurred: early Quaternary tectonic activity along the E-W trending faults and a late Pleistocene phase along NNE-SSW to NNW-SSE trending
transverse faults (Maurya et al., 2003; Thakkar et al., 1999). The thrusting of miliolite limestones over colluvial deposits along the Katrol Hill Fault zone suggests early Quaternary movement of the E-W trending faults (Thakkar et al., 1999; Biswas, 1974). The tectonic movement along the KHF and KMF resulted in differential uplift of sediments in the Quaternary (Biswas, 1974, 2005). Incised cliffs and ravines and deeply entrenched meanders along various river valleys are manifestations of tectonic uplift (Maurya et al. 2003) when the sea level rose very rapidly
(Hashimi et al., 1995). The tectonically induced erosional phase was followed by middle to late Holocene aggradation (Patidar et al., 2007).
The epicenter of the 1956 Anjar earthquake (Mw 6.0) was located nearly 40 km southwest of the 2001 Bhuj earthquake (Chung and Gao, 1995) (Fig. 1a). This earthquake originated at a shallower focal depth (<10 km) and is believed to have occurred along the KHF. The 1819 earthquake (Mw 7.9), on the other
hand, occurred along the Allah Bund Fault (ABF) of the Kachchh rift, about ~120 km NW of the 2001 event. Geomorphological evidences (fault scarps, co-seismic uplift, and drainage offset) of a maximum uplift of about 4.5 m for the 1819 event show a northerly slope, which suggests that it was associated with thrust motion on a south-dipping fault (Oldham, 1926; Bilham, 1998; Rajendran and Rajendran, 1999).
Apart from the major earthquakes in the region (Tab.1), some
smaller earthquakes (M <5.0) were also recorded in the area, and these events appear to cluster along mapped active faults (Rastogi, 2004). Tectonic landforms of the area suggest that most of the Holocene activity occurred along the transverse faults. Recent seismic records from 2001 to 2011 recorded by a broadband network of the Institute of Seismological Research (ISR), Gandhinagar, India, show that most of the earthquakes/aftershocks (M 3.0- 5.7) occurred between the KMF
and the BhF/NWF. The focal depth of these earthquake ranges from 8 to 40 km (Figs. 2a, b). The rift, which was under tensional regime during the past 135 Ma, is now under contractional strain/shortening. The seismic activity is mainly by strike-slip faults, oblique to the current strain field (Rastogi, 2001, Kayal et
Year Lat (°N)
Long (°E)
Mw Location References
1819 24.00 69.00 >7.8 Allah Bund
Johnston, 1996; Bilham,1999
Chung and Gao, 1995
Rajendran and
Rajendran, 2001,
Mandal, et al., 2004; Rastogi, 2004
1956 23.34 70.20 6.0 Anjar
2001 23.41 70.23 7.7 Bhuj
32 G. C. Kothyari et al. / Comunicações Geológicas (2015) 102, 1, 29-37
al., 2002b). Global CMT (Centroid Moment Tensor) solutions of the 2001 Bhuj and 1956 Anjar earthquakes indicate N-S to NNE-SSW contraction, which is attributed to the northward movement
of the Indian plate.
3. The January 2001 Bhuj earthquake
The Mw 7.7 Bhuj earthquake struck at 8:46 IST on January 26, 2001 in the Kachchh region near Gujarat, India, identified as a high seismic hazard zone (seismic zone V). Strong ground motions accompanied the earthquake, leading to 14 000 deaths
and severe property damage totaling ~US10 billion. The USGS CMT solution suggests maximum slip of 8.5 m on an E-W trending and 45° south-dipping reverse fault with a strike-slip
motion (Mandal et al., 2004 and 2007) (Fig. 1a) at a depth of 23-25 km, leading to a high static stress drop of about 20 MPa (Mandal et al., 2004; Rastogi, 2004). The BhF/NWF is considered the causative fault.
4. Aftershock data
Several investigations reported immediate aftershock activity
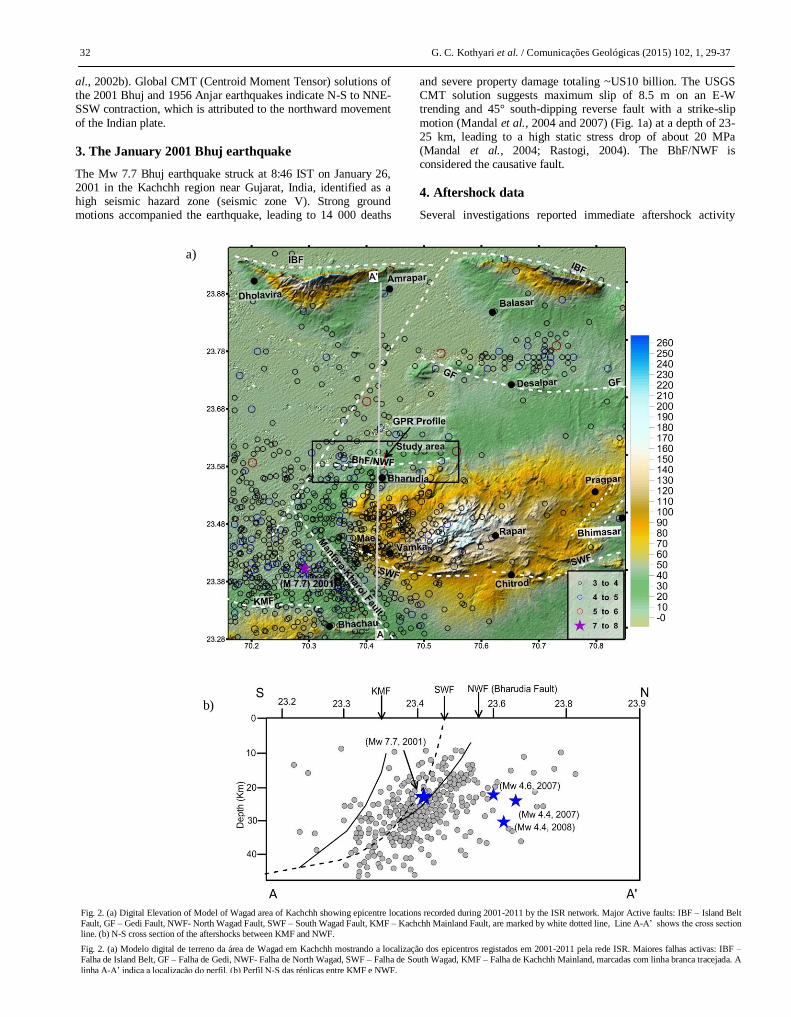
Fig. 2. (a) Digital Elevation of Model of Wagad area of Kachchh showing epicentre locations recorded during 2001-2011 by the ISR network. Major Active faults: IBF – Island Belt
Fault, GF – Gedi Fault, NWF- North Wagad Fault, SWF – South Wagad Fault, KMF – Kachchh Mainland Fault, are marked by white dotted line, Line A-A’ shows the cross section
line. (b) N-S cross section of the aftershocks between KMF and NWF.
Fig. 2. (a) Modelo digital de terreno da área de Wagad em Kachchh mostrando a localização dos epicentros registados em 2001-2011 pela rede ISR. Maiores falhas activas: IBF –
Falha de Island Belt, GF – Falha de Gedi, NWF- Falha de North Wagad, SWF – Falha de South Wagad, KMF – Falha de Kachchh Mainland, marcadas com linha branca tracejada. A
linha A-A’ indica a localização do perfil. (b) Perfil N-S das réplicas entre KMF e NWF.
a)
b)
Surface deformation along the Bharudia/North Wagad Fault Zone, India 33
following the Mw 7.7 Bhuj mainshock recorded by temporary networks (e.g. Negishi et al., 2002; Kayal et al., 2002b; Mandal et al., 2004). A 20-station permanent broadband network
installed by ISR in operation since August 2006 covering a 60x60 km2 area in the 2001 Bhuj earthquake epicenter zone, recorded a large sequence of aftershocks of over 2000 shocks/year of Mw 1.5 to 5.0 during 2006-2011. Aftershocks with both right-lateral and left-lateral reverse oblique mechanisms occurred mostly at a depth range of 8-35 km. An epicenter map and cross section of the aftershocks recorded between 2003 and 2011 is shown in figures 2a and b, and shows
a south-dipping seismic zone at a depth of 8 to 40 km. However, with time the aftershocks shifted northeastward to the GF zone and few felt aftershocks are reported (Figs. 2a, b). Based on the regional Gutenberg Richter frequency distribution of the earthquakes (for the period 2001-2006) (b value) Mandal et al. (2007) believe that the 2006 Mw 5.6 Gedi event is still an aftershock of the five years continued aftershock activity subsequent to the 2001 event.
5. GPR survey
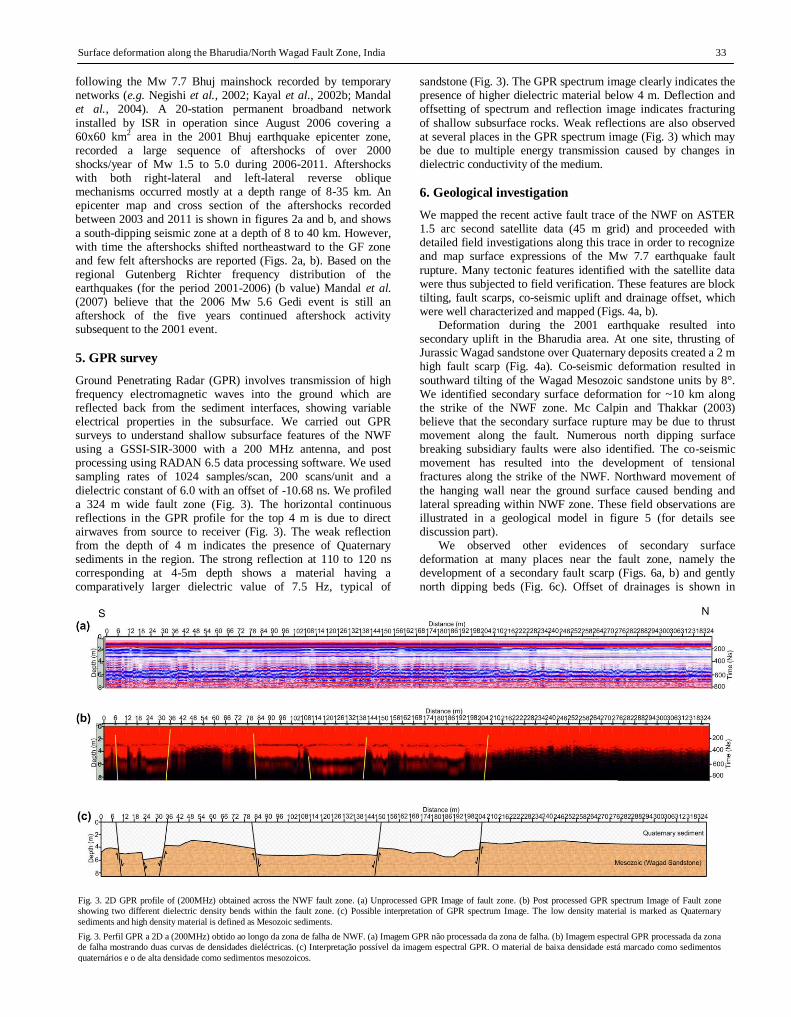
Ground Penetrating Radar (GPR) involves transmission of high frequency electromagnetic waves into the ground which are reflected back from the sediment interfaces, showing variable electrical properties in the subsurface. We carried out GPR surveys to understand shallow subsurface features of the NWF using a GSSI-SIR-3000 with a 200 MHz antenna, and post processing using RADAN 6.5 data processing software. We used sampling rates of 1024 samples/scan, 200 scans/unit and a
dielectric constant of 6.0 with an offset of -10.68 ns. We profiled a 324 m wide fault zone (Fig. 3). The horizontal continuous reflections in the GPR profile for the top 4 m is due to direct airwaves from source to receiver (Fig. 3). The weak reflection from the depth of 4 m indicates the presence of Quaternary sediments in the region. The strong reflection at 110 to 120 ns corresponding at 4-5m depth shows a material having a comparatively larger dielectric value of 7.5 Hz, typical of
sandstone (Fig. 3). The GPR spectrum image clearly indicates the presence of higher dielectric material below 4 m. Deflection and offsetting of spectrum and reflection image indicates fracturing
of shallow subsurface rocks. Weak reflections are also observed at several places in the GPR spectrum image (Fig. 3) which may be due to multiple energy transmission caused by changes in dielectric conductivity of the medium.
6. Geological investigation
We mapped the recent active fault trace of the NWF on ASTER 1.5 arc second satellite data (45 m grid) and proceeded with detailed field investigations along this trace in order to recognize and map surface expressions of the Mw 7.7 earthquake fault
rupture. Many tectonic features identified with the satellite data were thus subjected to field verification. These features are block tilting, fault scarps, co-seismic uplift and drainage offset, which were well characterized and mapped (Figs. 4a, b).
Deformation during the 2001 earthquake resulted into secondary uplift in the Bharudia area. At one site, thrusting of Jurassic Wagad sandstone over Quaternary deposits created a 2 m high fault scarp (Fig. 4a). Co-seismic deformation resulted in
southward tilting of the Wagad Mesozoic sandstone units by 8°. We identified secondary surface deformation for ~10 km along the strike of the NWF zone. Mc Calpin and Thakkar (2003) believe that the secondary surface rupture may be due to thrust movement along the fault. Numerous north dipping surface breaking subsidiary faults were also identified. The co-seismic movement has resulted into the development of tensional fractures along the strike of the NWF. Northward movement of
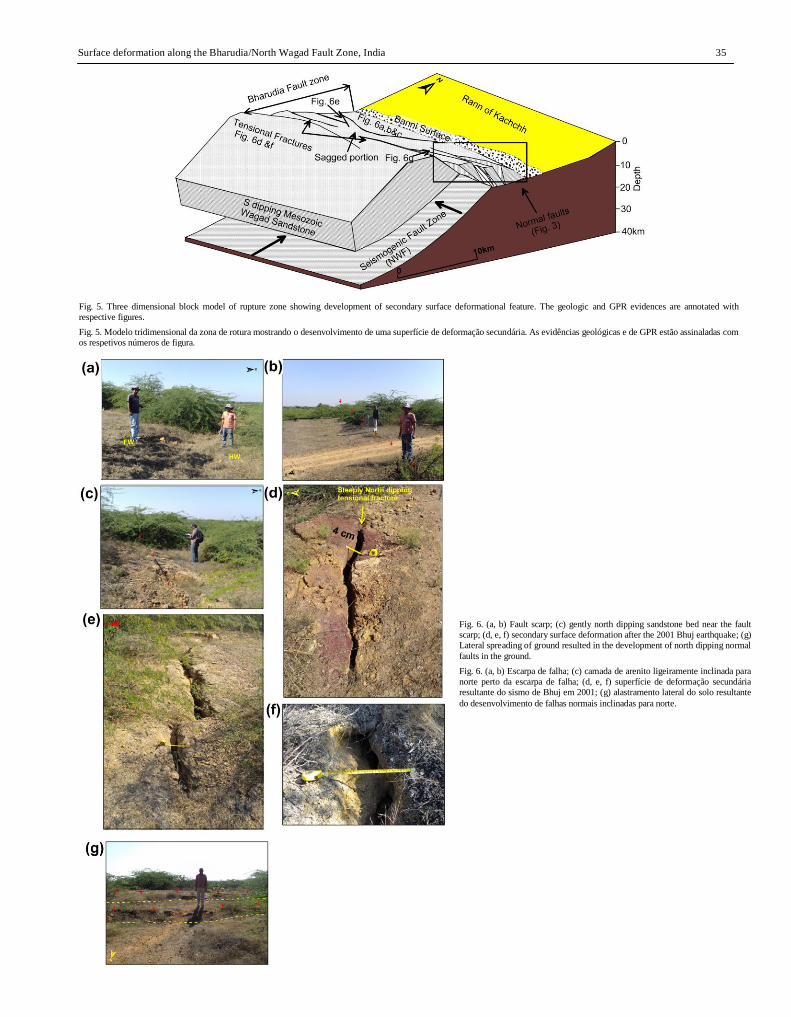
the hanging wall near the ground surface caused bending and lateral spreading within NWF zone. These field observations are illustrated in a geological model in figure 5 (for details see discussion part).
We observed other evidences of secondary surface deformation at many places near the fault zone, namely the development of a secondary fault scarp (Figs. 6a, b) and gently north dipping beds (Fig. 6c). Offset of drainages is shown in
Fig. 3. 2D GPR profile of (200MHz) obtained across the NWF fault zone. (a) Unprocessed GPR Image of fault zone. (b) Post processed GPR spectrum Image of Fault zone
showing two different dielectric density bends within the fault zone. (c) Possible interpretation of GPR spectrum Image. The low density material is marked as Quaternary
sediments and high density material is defined as Mesozoic sediments.
Fig. 3. Perfil GPR a 2D a (200MHz) obtido ao longo da zona de falha de NWF. (a) Imagem GPR não processada da zona de falha. (b) Imagem espectral GPR processada da zona
de falha mostrando duas curvas de densidades dieléctricas. (c) Interpretação possível da imagem espectral GPR. O material de baixa densidade está marcado como sedimentos
quaternários e o de alta densidade como sedimentos mesozoicos.
34 G. C. Kothyari et al. / Comunicações Geológicas (2015) 102, 1, 29-37
figure 4b. Numerous north dipping tensional fractures near the fault zone present an en echelon pattern showing step-overs with strike-slip component and probably developed during the
northward movement of the hanging wall followed by surface bending (Figs. 6d, e, f). We observed lateral spreading in many places along E-W trends (Fig. 6g).
7. Ground Deformation Modeling
We mapped ground deformation over a ~2 km2 area using a Real Time Kinematic (RTK) geodetic instrument with a 20-m grid
interval and occupied over 200 points. We processed the raw data using Leica Spider geodetic software, and created a surface map using Surfer 11 (Fig. 7). From the RTK survey we identified a
900 m long and 500 m wide deformation zone astride the NWF zone, and modeling of the RTK data shows that the area was uplifted ~ 1.5 m during the Bhuj earthquake (Fig. 7). Gahalaut and Bürgmann (2004) report similar observations using pre- and post-earthquake satellite images, and microgravity and geodetic measurements presented by Chandrasekhar and Mishra (2002) and Chandrasekhar et al. (2004) show a maximum uplift of 1.57 ± 0.5 m.
Fig. 4. (a) Digitally obtained ASTER 1.5 arc-second elevation model (DEM) of NWF showing development of north facing E-W fault scarp. A – indicates the uplifted area
(see text and figure 7). (b) Detailed map showing major tectonic features observed in the NWF zone.
Fig. 4. (a) Modelo digital de terreno (DEM) obtido de imagens ASTER, da área da falha de North Wagad (NWF) mostrando a escarpa de falha E-W virada a norte. A –
indica a área de uplift (ver texto e figura 7). (b) Mapa detalhado com as principais estruturas tectónicas observadas na zona da falha de North Wagad.
a)
b)
a)
b)
Surface deformation along the Bharudia/North Wagad Fault Zone, India 35
Fig. 6. (a, b) Fault scarp; (c) gently north dipping sandstone bed near the fault
scarp; (d, e, f) secondary surface deformation after the 2001 Bhuj earthquake; (g)
Lateral spreading of ground resulted in the development of north dipping normal
faults in the ground.
Fig. 6. (a, b) Escarpa de falha; (c) camada de arenito ligeiramente inclinada para
norte perto da escarpa de falha; (d, e, f) superfície de deformação secundária
resultante do sismo de Bhuj em 2001; (g) alastramento lateral do solo resultante
do desenvolvimento de falhas normais inclinadas para norte.
Fig. 5. Three dimensional block model of rupture zone showing development of secondary surface deformational feature. The geologic and GPR evidences are annotated with
respective figures.
Fig. 5. Modelo tridimensional da zona de rotura mostrando o desenvolvimento de uma superfície de deformação secundária. As evidências geológicas e de GPR estão assinaladas com
os respetivos números de figura.
36 G. C. Kothyari et al. / Comunicações Geológicas (2015) 102, 1, 29-37
8. Discussion and Conclusions
The major tectonic features in Wagad area indicate the presence of several E-W trending faults as the KMF, SWF, NWF and GF (Fig. 1). The seismicity is mostly confined between the KMF and GF (Fig. 2). The south dipping faults are inferred to be
seismogenic (Mukhopadhyay and Kayal, 2006; Kayal et al., 2012; Rastogi, 2001, 2004). Pande et al. (2003) reported intense land deformation in a 20x40 km2 meizoseismal area of the 2001 Bhuj earthquake including lateral spreading with tensional fractures and ground uplifts. Yagi and Kikuchi (2001) suggested that the ground deformation during the 2001 earthquake was higher in the ductile condition than in brittle condition. In the present study we have made a detailed surface geological
investigation at the BhF/NWF. We observed a secondary fault scarp, tensional fractures, left-lateral slip within the fracture zone and ground spreading in the fault zone along a stretch of 10 km (Fig. 6), which indicate brittle behavior of the fault zone.
However, seismological aftershock data show that the upper part of the crust (down to 8 km) is not seismogenic, and the earthquakes being mostly confined between 8 and 35 km depth. Brittle and ductile behavior of the BhF/NWF zone has been
modeled on the basis of geological and seismological observations (Fig. 5). The presence of the observed structures, as tensional fractures and the secondary fault scarp are illustrated in the model as observed in the field. It is however interesting to note that the seismogenic zone is south dipping at depth (8-40 km), while the surface fault/fractures on the other hand are shallow and mostly dip towards north (Fig. 5). As the slip on the reverse south dipping fault reached the ground surface it
generated bending and lateral spreading of the Wagad sandstone in the hanging wall resulting in the development of tensional cracks all along the fault zone (Fig. 5). Another interesting result was the recognition of ~1.5 m of ground uplift at site “A”, north of Bharudia (Fig. 4). The geodetic observation is illustrated in figure 7, which indicates the growth of a ridge 900 m long and 500 m wide suggesting a deeper seated fault effect.
Brittle and ductile behavior of the BhF/NWF zone has been modeled on the basis of geological and seismological
observations (Fig. 5). The presence of the observed structures, as tensional fractures and the secondary fault scarp are illustrated in
the model as observed in the field. It is however interesting to note that the seismogenic zone is south dipping at depth (8-40 km), while the surface fault/fractures on the other hand are
shallow and mostly dip towards north (Fig. 5). As the slip on the reverse south dipping fault reached the ground surface it generated bending and lateral spreading of the Wagad sandstone in the hanging wall resulting in the development of tensional cracks all along the fault zone (Fig. 5). Another interesting result was the recognition of ~1.5 m of ground uplift at site “A”, north of Bharudia (Fig. 4). The geodetic observation is illustrated in Fig. 7, which indicates the growth of a ridge 900 m long and 500
m wide suggesting a deeper seated fault effect. The model proposes that the left-lateral motion at the fault
from either side may cause such uplift of the ground. Our geological and geodetic observations of ground deformation at the 2001 Bhuj earthquake epicenter area are fairly explained with a simple geological model. This model clearly shows that a south dipping seismogenic reverse fault could cause north dipping faults resulting from tensional fracture, and uplift of the ground.
Acknowledgements
The authors are grateful to Gujarat State Disaster Management
Authority (GSDMA) for financial support. The authors would also like to acknowledge the valuable contributions made by the two reviewers Dr. João Cabral and Dr. João Carvalho in improving the manuscript.
References
Beloussov, V. V., 1962. Basic problems of Geotectonics. McGraw, Hill,
London. 816.
Biswas, S. K., 1974. Landscape of Kachchh - A morphotectonic analysis.
Indian Journal Earth Science, 1 (2), 177-190.
Biswas, S. K., 1987. Regional tectonic framework, structure and
evolution of the western marginal basins of India. Tectonophysics.
135, 302-327.
Biswas, S. K., 2005. A review of structure and tectonics of Kutch basin,
western India, with special reference to earthquakes. Current Science,
88(10), 1592-1600.
Biswas, S. K., Deshpande S. V., 1970. Geological and tectonic maps of
Kutch Bull. Oil Natural Gas Commission, 7(2), P115.
Fig. 7. RTK driven DEM of growing ridge showing ground uplift near the fault zone.
Fig. 7. Modelo digital do terreno gerado a partir de GPS RTK da cordilheira em levantamento mostrando o levantamento perto da zona de falha.
Surface deformation along the Bharudia/North Wagad Fault Zone, India 37
Bilham, R., 1998. Coastal tectonics. Geological Society of London,
Special Publication, 146, 295-319.
Bilham, R., 1999. Slip parameters for the Rann of Kachchh, India, 16
June 1819 earthquake quantified from contemporary accounts. In:
Coastal Tectonics, (Edits.) I. S. Stewart and C. Vita-Finzi, Geological
Society, London, 146, 295–318.
Chandrasekhar, D. V., Mishra, D. C., 2002. Some geodynamic aspects of
Kutch basin and seismicity: Insight from gravity studies. Current
Science, 83(4), 492-498.
Chandrasekhar, D V, Mishra, D C, Singh, B. Vijayakumar, V.,
Burgmann, R., 2004. Source parameters of the Bhuj earthquake, India
of January 26, 2001 from height and gravity changes, Geophysical
Research Letter, 31, L19608.
Chung, W. P., Gao, H., 1995. Source parameters of the Anjar earthquake
of July 21, 1956, India, and its seismotectonic implications for the
Kutch rift basin. Tectonophysics, 242, 281– 292.
Gahalaut, V. K., Burgmann, R., 2004. Constraints on the source
parameters of the 26 January, 2001 Bhuj earthquake from satellite
images. Bulletin of Seismological Society of America, 96 (6), 2407-
2413.
Hashimi, N. H., Nigam, R., Nair, R. R., Rajgopalan, G., 1995. Holocene
sea level fluctuation on western India Continental margin: An update.
Journal of Geological Society of India, 46, 157-162.
Johnston, A. C., 1996. Seismic moment assessment of earthquakes in
stable continental regions II. Historical seismicity. Geophysical
Journal of International, 125, 639-678.
Kayal, J. R., Sagina Ram, D. R., Srirama, B. V., Gaonkar, S. G., 2002a.
Aftershocks of the 26 January, 2001 Bhuj earthquake in western India
and its seismotectonic implications. Journal of Geological Society of
India, 59, 395–417.
Kayal, J. R., Zhao, D., Mishra, O. P., De, R., Singh, O. P., 2002b. The
2001 Bhuj earthquake: Tomography evidence for fluids at hypocenter
and its implications for rupture nucleation. Geophysical Research
Letter, 29 (24), 51-54.
Kayal, J. R., Das, V., Ghosh, U., 2012. An Appraisal of the 2001 Bhuj
Earthquake (Mw 7.7, India) Source Zone: Fractal Dimension and b
Value Mapping of the Aftershock Sequence. Pure and Applied
Geophysics, 169(12), 2127–2138, DOI 10.1007/s00024-012-0503-7.
Mandal, P., Rastogi, B. K., Satyanaraya, H. V. S., Kousalya, M.,
Vijayraghavan, R. Satyamurty,C., Raju, I. P., Sarma A. N. S., Kumar,
N., 2004. Characterization of the causative fault system for the 2001
Bhuj earthquake of Mw 7.7. Tectonophysics, 378, 105-121.
Mandal, P., Chadha, R. K., Raju, I. P., Kumar, N., Satyamurthy, C.,
Narsaiah R., 2007. Are the 7 March 2006 Mw 5.6 event and the 3
February 2006 Mw 4.58 event triggered by the five years continued
occurrence of aftershocks of the 2001 Mw 7.7 Bhuj event?. Current
Science, 92, 1114-1124.
Mandal, P., Satyamurty C., Raju, I. P., 2009. Iterative de-convolution of
the local waveforms: Characterization of the seismic sources in
Kachchh, India. Tectonophysics, 478, 143–157.
Maurya, D. M., Raj, R., Chamyal, L. S., 2000. History of tectonic
evolution of Gujarat alluvial plains, Western India, during Quaternary:
a review. Journal of Geological Society of India, 55, 343-366.
Maurya, D. M., Bhandari, S., Thakkar, M. G., Chamyal, L. S., 2003. Late
Quaternary fluvial sequences of Southern Mainland Kachchh, Western
India: lithostratigraphy and neotectonics implications. Current
Science, 84 (8), 1056-1064.
Mc Calpin, James P., Thakkar, M. G., 2003. 2001 Bhuj-Kachchh
earthquake: surface faulting and its relation with neotectonics and
regional structures, Gujarat Western India. Journal of applied
Geophysics, 46(5), 937-956.
Mukhopadhyay, S., Kayal, J. R., 2006. Seismotectonics of the 2001 Bhuj
earthquake (Mw 7.7) in western India: Constraints from aftershocks.
Journal of Indian Geophysical Union, 10 (1), 45–57.